Article

Heterogeneity and Spatial Governance of Synergy between Human Activities and Ecological Conservation in the Qinghai–Xizang Plateau, China

1
Department of Geography and Spatial Information Techniques, Zhejiang Collaborative Innovation Center for Land and Marine Spatial Utilization and Governance Research, Ningbo University, Ningbo 315211, China
2
Sichuan Chuanjian Investigation Designing Institute, Chengdu 610000, China
3
Institute of Geographic Sciences and Natural Resources Research, Chinese Academy of Sciences, Beijing 100101, China
4
Ningbo University Donghai Academy, Ningbo University, Ningbo 315211, China
*
Author to whom correspondence should be addressed.
Land 2023, 12(12), 2103; https://doi.org/10.3390/land12122103
Submission received: 15 October 2023 / Revised: 17 November 2023 / Accepted: 21 November 2023 / Published: 24 November 2023
(This article belongs to the Section Land Planning and Landscape Architecture)

Abstract

:
The Qinghai–Xizang Plateau is one of the important units of the major project of ecosystem protection and restoration in China’s “three zones and four belts”(2021–2035), and balancing its ecological security with rational regional development is the basis for ensuring China’s ecological stability. In this paper, the coupling mechanism between regional development intensity and ecological security is explained, and a measurement system of the relationship is designed, from which the coordination degree and type division of the coupling between regional development intensity and ecological security on the Qinghai–Xizang Plateau from 2011 to 2020 is measured. The results show the following: (1) During the study period, the regional development intensity of the Qinghai–Xizang Plateau has been increasing, with Xining and Lhasa as the “core” that drives the development and expansion of the surrounding areas. The ecological security index has been also on the rise, showing a pattern of “belt-shaped depressions in the central and western parts of the Plateau, and vertical clusters in the eastern part of the Plateau”. The depression moves toward the southern part of Xinjiang. (2) The degree of coupling and coordination between development intensity and ecological safety in each city (prefecture) on the Qinghai–Xizang Plateau has increased by different degrees, but many cities (prefectures) still show a lag in development intensity or ecological security. (3) The evolution of the pattern of coupling and coordination between regional development intensity and ecological security on the Qinghai–Xizang Plateau varies significantly, forming a pattern of “high in the east and low in the west, with multiple clusters side by side”. To some extent, this paper reveals the correlation between the spatial and temporal distributions of regional development intensity and ecological security on the Qinghai–Xizang Plateau, which can provide a basis for the regulation of human activities in the construction of ecological security barriers at the city (prefecture) level on the Qinghai–Xizang Plateau.

1. Introduction

Since the industrial revolution, the power to utilize the resources and environment has grown exponentially, causing a greater impact of human activities on the earth. Human activities have become a predominant driver of global environmental changes. As a result of human activities in the middle and upper reaches of the Tarim River flow, serious problems, including water shortage, water pollution, the death of natural vegetation, soil salinization, desertification, and dust storms have emerged, especially in the lower reaches of the basin [1]. Rapid urbanization in developing countries is characterized by higher development intensity and more frequent human–ecosystem interactions, represented by China [2]. The population concentration, industrial expansion, and traffic congestion in the urbanization process have caused a huge ecological pressure. In Europe as well, the conflict between human activity and ecological conservation is becoming increasingly evident [3]. These problems have serious negative impacts on the health of local people and on the sustainable socio-economic development of the region. In this context, issues related to global ecological security have begun to attract the attention of mankind.
The concept of ecological security was first introduced by the International Institute for Applied Systems Analysis in 1989. At present, different scholars and policymakers have different understandings of the conceptual connotation of ecological security, and the focus and methodological system of ecological security evaluation in related research and practice fields are not yet unified. However, all scholars recognize that ecological security is a condition that safeguards the survival of a certain ecosystem and the ability of human society to develop without being threatened [4,5]. With the growing profound impact of human activities expansion and regional construction on the ecological environment, a series of ecological problems such as ecosystem imbalance have been exposed, which characterizes the prevalence and severity of ecological security problems [6,7]. Therefore, countries around the world have actively engaged in ecological restoration and conservation. In 2014, the New York Declaration on Forests, signed by 32 countries, had the goal of restoring degraded land; in 2021, about 130 countries had co-signed the Glasgow Declaration, with the same goal of curbing deforestation and land degradation. The US developed the National River Restoration Science Synthesis in 2005, which summarizes more than 30,000 river restoration case studies [8].
With the rapid economic development, China’s ecological and environmental problems have become increasingly serious, showing obvious spatial and temporal heterogeneity [9]. As a whole, China is at the stage of moderate coordination and social lagging. The ecological lagging type is mainly concentrated in the developed regions in the east, and the economic lagging type is mainly concentrated in the central and western regions [10,11]. From the perspective of the spatial distribution of coupling coordination types between urbanization factors and landscape ecological risk, Western China is in a state of serious imbalance [12]. The Chinese government has implemented a number of major ecological restoration projects, such as the “Three-North Natural Forest Project” and the “Returning Cultivation to Forestry Project”, to alleviate ecological environment problems. For decades, the number of areas with serious imbalances of China is decreasing, which are distributed in the ecologically fragile areas of the Qinghai–Xizang Plateau [13].
Stretching across the central part of the Asian continent and with high elevation, the Qinghai–Xizang Plateau forms a unique “ecological megasystem”, which has a significant impact on the ecological security for China and the Asia–Pacific region [14]. However, with fragile natural background conditions and a weak ability to withstand human disturbances, the Qinghai–Xizang Plateau has a different highland mountain environment than the plains. At the same time, due to the scarcity of available land on the Qinghai–Xizang Plateau, the spatial spillover effects of human disturbance to the ecological environment are accelerated along with continued population growth and industrial restructuring. Therefore, exploring and synergizing the relationship between regional development and ecological security on the Qinghai–Xizang Plateau can help to satisfy both human and biome survival and development without threatening the security of surrounding ecosystems.
Academics have attached great importance to the research of ecological security on the Qinghai–Xizang Plateau, and different scholars hold different views on the evolutionary trend of ecological security on the Qinghai–Xizang Plateau. Firstly, based on the landscape pattern analysis of the Qinghai–Xizang Plateau, it was concluded that the overall eco-security level of its eastern region showed an increasing and then slightly decreasing trend [15]. Secondly, by constructing an ecological risk evaluation system for husbandry, it was found that the overall ecological risk of the Qinghai–Xizang Plateau had an increasing trend [16]. Thirdly, at the sub-regional scale, it was found that the overall trend of ecological security index of Xizang’s farmlands was decreasing [17], and the degree of ecological security in Qinghai was better than that in Xinjiang [18]. Meanwhile, with the implementation of the Western Development Policy, the number of results for the assessment of the relationship between human activities, regional development, and urbanization on the Qinghai–Xizang Plateau have increased, and three research areas have been formed. Firstly, by exploring the geographical differentiation pattern of human activities and urbanization on the Qinghai–Xizang Plateau, it was found that the overall population on the Qinghai–Xizang Plateau is sparse with the characteristic of “dense in the southeast and sparse in the northwest” [19]. Although the level of human development has increased year-by-year, the overall level of human development is at a moderate-to-low level, and there are spatial differences within the region in the level of human development, with a relatively high intensity of nighttime lighting and a concentrated population distribution in the southeast [20]. Yang et al. (2023) [21] analyzed the spatial and temporal changes of human activity intensity on the Qinghai–Xizang Plateau and found that the human activity intensity on the Qinghai–Xizang Plateau was generally at a low level from 1984 to 2018, which was roughly characterized by a slow decline in the early period and a rapid rise in the later period, with 2008 as the cut-off point. The population density of Xizang is roughly bounded by Borong–Gangni, showing an agglomeration in the southeast and a sparseness in the northwest [22], and the population of most counties in Qinghai increased from 2000 to 2010 except for some counties at the southern foothills of the Qilian Mountains in the north [23]. The urbanization index of the Qinghai–Xizang Plateau during the period of 2000–2015 was low but with an obvious upward momentum [24], and the distribution of towns on the Qinghai–Xizang Plateau generally showed a pattern of “dense in the southeast and sparse in the northwest” and “large dispersion and small agglomeration”, with a general tendency to agglomeration [25]. Secondly, by attempting to explain the main motivation for the changes in human activities on the Qinghai–Xizang Plateau, it was found that the degree of human activities affecting the natural environment on the Qinghai–Xizang Plateau is generally low but gradually increasing [19], with the main motivation being grazing, road construction, and tourism development [26,27]. Transportation accessibility is an important factor affecting tourism development on the Qinghai–Xizang Plateau, and better-developed tourism areas are also better-developed transportation areas [28,29]. Furthermore, road network density also positively affects the distribution of agricultural and livestock enterprises, i.e., agricultural and livestock enterprises are more concentrated in areas with dense road networks [30]. The ecological conditions of the Qinghai–Xizang Plateau limit its transportation infrastructure development [31,32], and development of transportation infrastructure by humans has caused severe landscape fragmentation [33]. The field of road ecology emerged due to the unprecedented destruction of natural ecosystems caused by road networks and traffic corridors [34,35]. The Qinghai–Xizang Railway reduced vegetation richness by 2.9% during its construction period (2001–2007), and the loss of biomass was higher, the closer the vegetation was to the transportation line [36]. The main human activities on the Qinghai–Xizang Plateau is influenced by the combination of single investment, tourists, services, and counterpart support, forming urbanization types such as low development, social inclusion, cultural inheritance, and border-keeping [37]. Educational degree, income level, medical insurance, social integration, economic development, and physical conditions of the inflowing places jointly influence the willingness of the migrants in the Qinghai–Xizang Plateau to stay in cities and towns, thus affecting the urbanization process [38]. Thirdly, by exploring the ways and spatio-temporal changes through which regional development affects the natural background of the Qinghai–Xizang Plateau, it was found that the coupled coordination degree of urbanization and ecological environment at different scales on the Qinghai–Xizang Plateau is generally on the rise, but the growth rate varies significantly among regions [24]. Industrialization has exerted a relatively low pressure on the Qinghai–Xizang Plateau ecosystem, but the negative impact of agricultural modernization on ecological space has gradually expanded [39]. Human activities on the Qinghai–Xizang Plateau have contributed to the protection of vegetation [40], but climate change and increased human activities over the past 30 years have exerted multiple pressures to the aquatic environment of lakes on the Qinghai–Xizang Plateau. Since 1960, most wildlife on the Qinghai–Xizang Plateau has declined, and many mammal species have been classified as endangered due to the expansion of livestock grazing, intensified poaching activities, and grassland degradation, resulting in reduced living space [41]. Stable ecosystems are indispensable components of the socio-ecological systems for achieving global sustainable development. Some scholars have explored the integrated relationship between environmental conditions and ecosystems using a landscape-based ecological stability assessment framework. It reveals a medium-high stability level in the Qinghai–Xizang Plateau, with minimal changes over recent years. Climate and anthropogenic factors become key determinants, as evidenced by the fact that anthropogenic factors are strong but unstable, and that climatic factors exert a consistent influence [42].
These studies focus on the current state of the ecological environment, the level of ecological security, the spatial and temporal patterns and interaction effects of human activities, regional development, and urbanization on the Qinghai–Xizang Plateau, and then discuss the natural environment and the development of human society on the Qinghai–Xizang Plateau in a more comprehensive way. However, the following issues still exist and deserve further investigation. Firstly, the research methods and indicator systems on the eco-security of the relevant regions on the Qinghai–Xizang Plateau cannot fully portray its special characteristics objectively and comprehensively, and few studies have been conducted to assess the eco-security in the whole area on the Qinghai–Xizang Plateau. Secondly, most depictions of regional development intensity are of socio-economic dimensions, lacking the exploration of direct spatio-temporal relationships with eco-security. In this paper, we tend to deepen the existing research in terms of two aspects. (1) Based on the basic development characteristics of the Qinghai–Xizang Plateau, the authors try to design an assessment model of regional development intensity and eco-security, as well as try to scientifically recognize the evolution of spatio-temporal patterns of development intensity and eco-security in the region. (2) Based on the assessment of regional development intensity and eco-security, a spatio-temporal coupling measurement model of the relationship between the two is constructed to further clarify the development types of each city (prefecture) on the Qinghai–Xizang Plateau, with the aim of providing useful references for the high-quality protection of national space and the construction of eco- security barrier on the Qinghai–Xizang Plateau.

2. Theoretical Basis and Analysis Framework Construction

2.1. Theoretical Basis of “Human–Environment Coupling”

The term “coupling” refers to the phenomenon that two or more systems interact and relate to each other. “Human–environment coupling” is derived from the theory of territorial system of human–environment interaction, which is mainly used to explain the spatial and temporal laws and evolution of the interaction between humans and natural environment [43]. Essentially, human–environment coupling is a process of interaction, interdependence, and mutual adaptation between surface natural and human systems to form a unity [44], which mainly occurs in complex regions where natural and human activities interact. The evolution of human–environment coupling is an interactive process between human activities and ecological environment represented by urbanization and regional development, and the non-linear interaction between them has objective master factors (such as the natural elements of ecology, water, land, energy, and the human elements of population, economy and society) and multiple coupling modes (“one-to-one”, “one-to-many”, and “many-to-many”) [45], especially in mountainous areas, where it is more intuitive and prevalent [44]. The unique process of conservation and development on the Qinghai–Xizang Plateau has resulted in the difference, variability, and uncertainty in the process of “human–environment coupling”. Therefore, based on the uniqueness of the Qinghai–Xizang Plateau, the authors attempt to construct an assessment system for regional development and ecological security that is consistent with its characteristics, and analyze the level of coupled development, spatio-temporal patterns, and evolutionary paths of both.

2.2. Analysis Framework Review and Selection

Under the guidance of “human–environment coupling theory”, many frameworks of coupling analysis with different emphases have been proposed by academia. (1) The PSR framework, DPSIR framework, Sustainable Livelihoods framework, and STIRPAT framework integrate phenomena, processes, and outcomes of human activities and feedback from the natural environment into systematic empowerment and assessment. (2) Research frameworks such as social-ecological systems, resilience, and vulnerability divide the issue of human–environment relations into subsystems and analyze the vulnerability and adaptive capacity of the researched subjects. (3) Research frameworks such as regional coupling coordination, energy value analysis, regional input–output model, and urban ecological network model are proposed to analyze the near- and long-range coupling relationship as the flow volume and flow speed of various elements increases in the human–environment relationship [46]. The level, structure, and function of the “human–environment coupling” research on the Qinghai–Xizang Plateau are different from those of the typical “human–environment coupling” unit, which shows that the Qinghai–Xizang Plateau is dominated by mountainous geospatial areas, with a high proportion of ecological space, presenting a high functional compound between ecological security barrier (biodiversity, water containment, soil conservation, and carbon sink) [14,47] and primary urbanization, rural settlement, and agro-pastoral production.
Due to special geographical environment, huge volume, and geopolitical relations, the Qinghai–Xizang Plateau has a different ecological security value from other regions. Referring to existing studies and the second Qinghai–Xizang Plateau scientific research project [48], it was found that the Qinghai–Xizang Plateau affects its own and regional eco-security mainly in the following aspects. (1) Biodiversity protection: The special hydrothermal environment of the Qinghai–Xizang Plateau provides a specific space for the intersection and integration of different species, making the Qinghai–Xizang Plateau the center of differentiation for many modern species [49], and biodiversity is the basis for maintaining ecological security and sustainable development of the Qinghai–Xizang Plateau [50,51]. (2) Water resources conservation: With approximately 20.23% of China’s total water resources, the Qinghai–Xizang Plateau is the region with the most developed rivers in the world [52], and plays an important role in ensuring China’s water and energy security [53]. (3) Soil conservation: The Qinghai–Xizang Plateau has alpine meadow, alpine steppe, and various types of forests as important covers to curb land sanding and soil erosion, which play an important ecological barrier role for the plateau itself and the surrounding areas [54]. (4) Carbon sink: alpine meadow soil on the Qinghai–Xizang Plateau stores huge root biomass and organic carbon, which are globally important carbon reservoirs and have an important impact on climate change, water regulation, and carbon balance in China and even Asia [47]. Therefore, biodiversity, water conservation, soil and water conservation, and carbon sink are central to the measurement of ecological assessment and ecological security on the Qinghai–Xizang Plateau.
The urbanization of Qinghai–Xizang Plateau has a different four-dimensional process driven by natural, economic, socio-cultural, and policy than that of the mainland, and it is characterized by a slow process, few numbers, small scale, and highly uneven spatial distribution. Therefore, human activities on the Qinghai–Xizang Plateau include not only the process of urbanization and industrialization but also the process of regional territorial spatial development such as the use of valley agriculture and grazing. In this process, “human–environment coupling” on the Qinghai–Xizang Plateau is mainly concentrated in the social transition zones (urban–rural transition zone and town–village transition zone) and industrial transition zones (agro-pastoral interlacing zone, agro-forestry interlacing zone, and forest-pastoral interlacing zone), presenting non-homogeneous territorial spatial development patterns with different structures, functions, and characteristics. Obviously, the expansion of population and the intensity of economic development and land development are the best indicators to measure the intensity of human activities, industrial succession, and soil development in the process of “human–environment coupling” on the Qinghai–Xizang Plateau.

2.3. Analysis Framework Construction

By integrating the above theoretical basis of “human–environment coupling”, the differences in the focus of the analytical framework, and the unique attributes of ecological security and human activities in the geographic system on the Qinghai–Xizang Plateau, the regional coupling coordination model was selected to further clarify the spatial and temporal heterogeneity of the coupling between regional development intensity and ecological security after measuring the assessment of ecological security and the intensity of regional development on the Qinghai–Xizang Plateau, respectively, in order to achieve a comprehensive analysis from comprehensive evaluation to the identification of interactive coupling types (Figure 1).

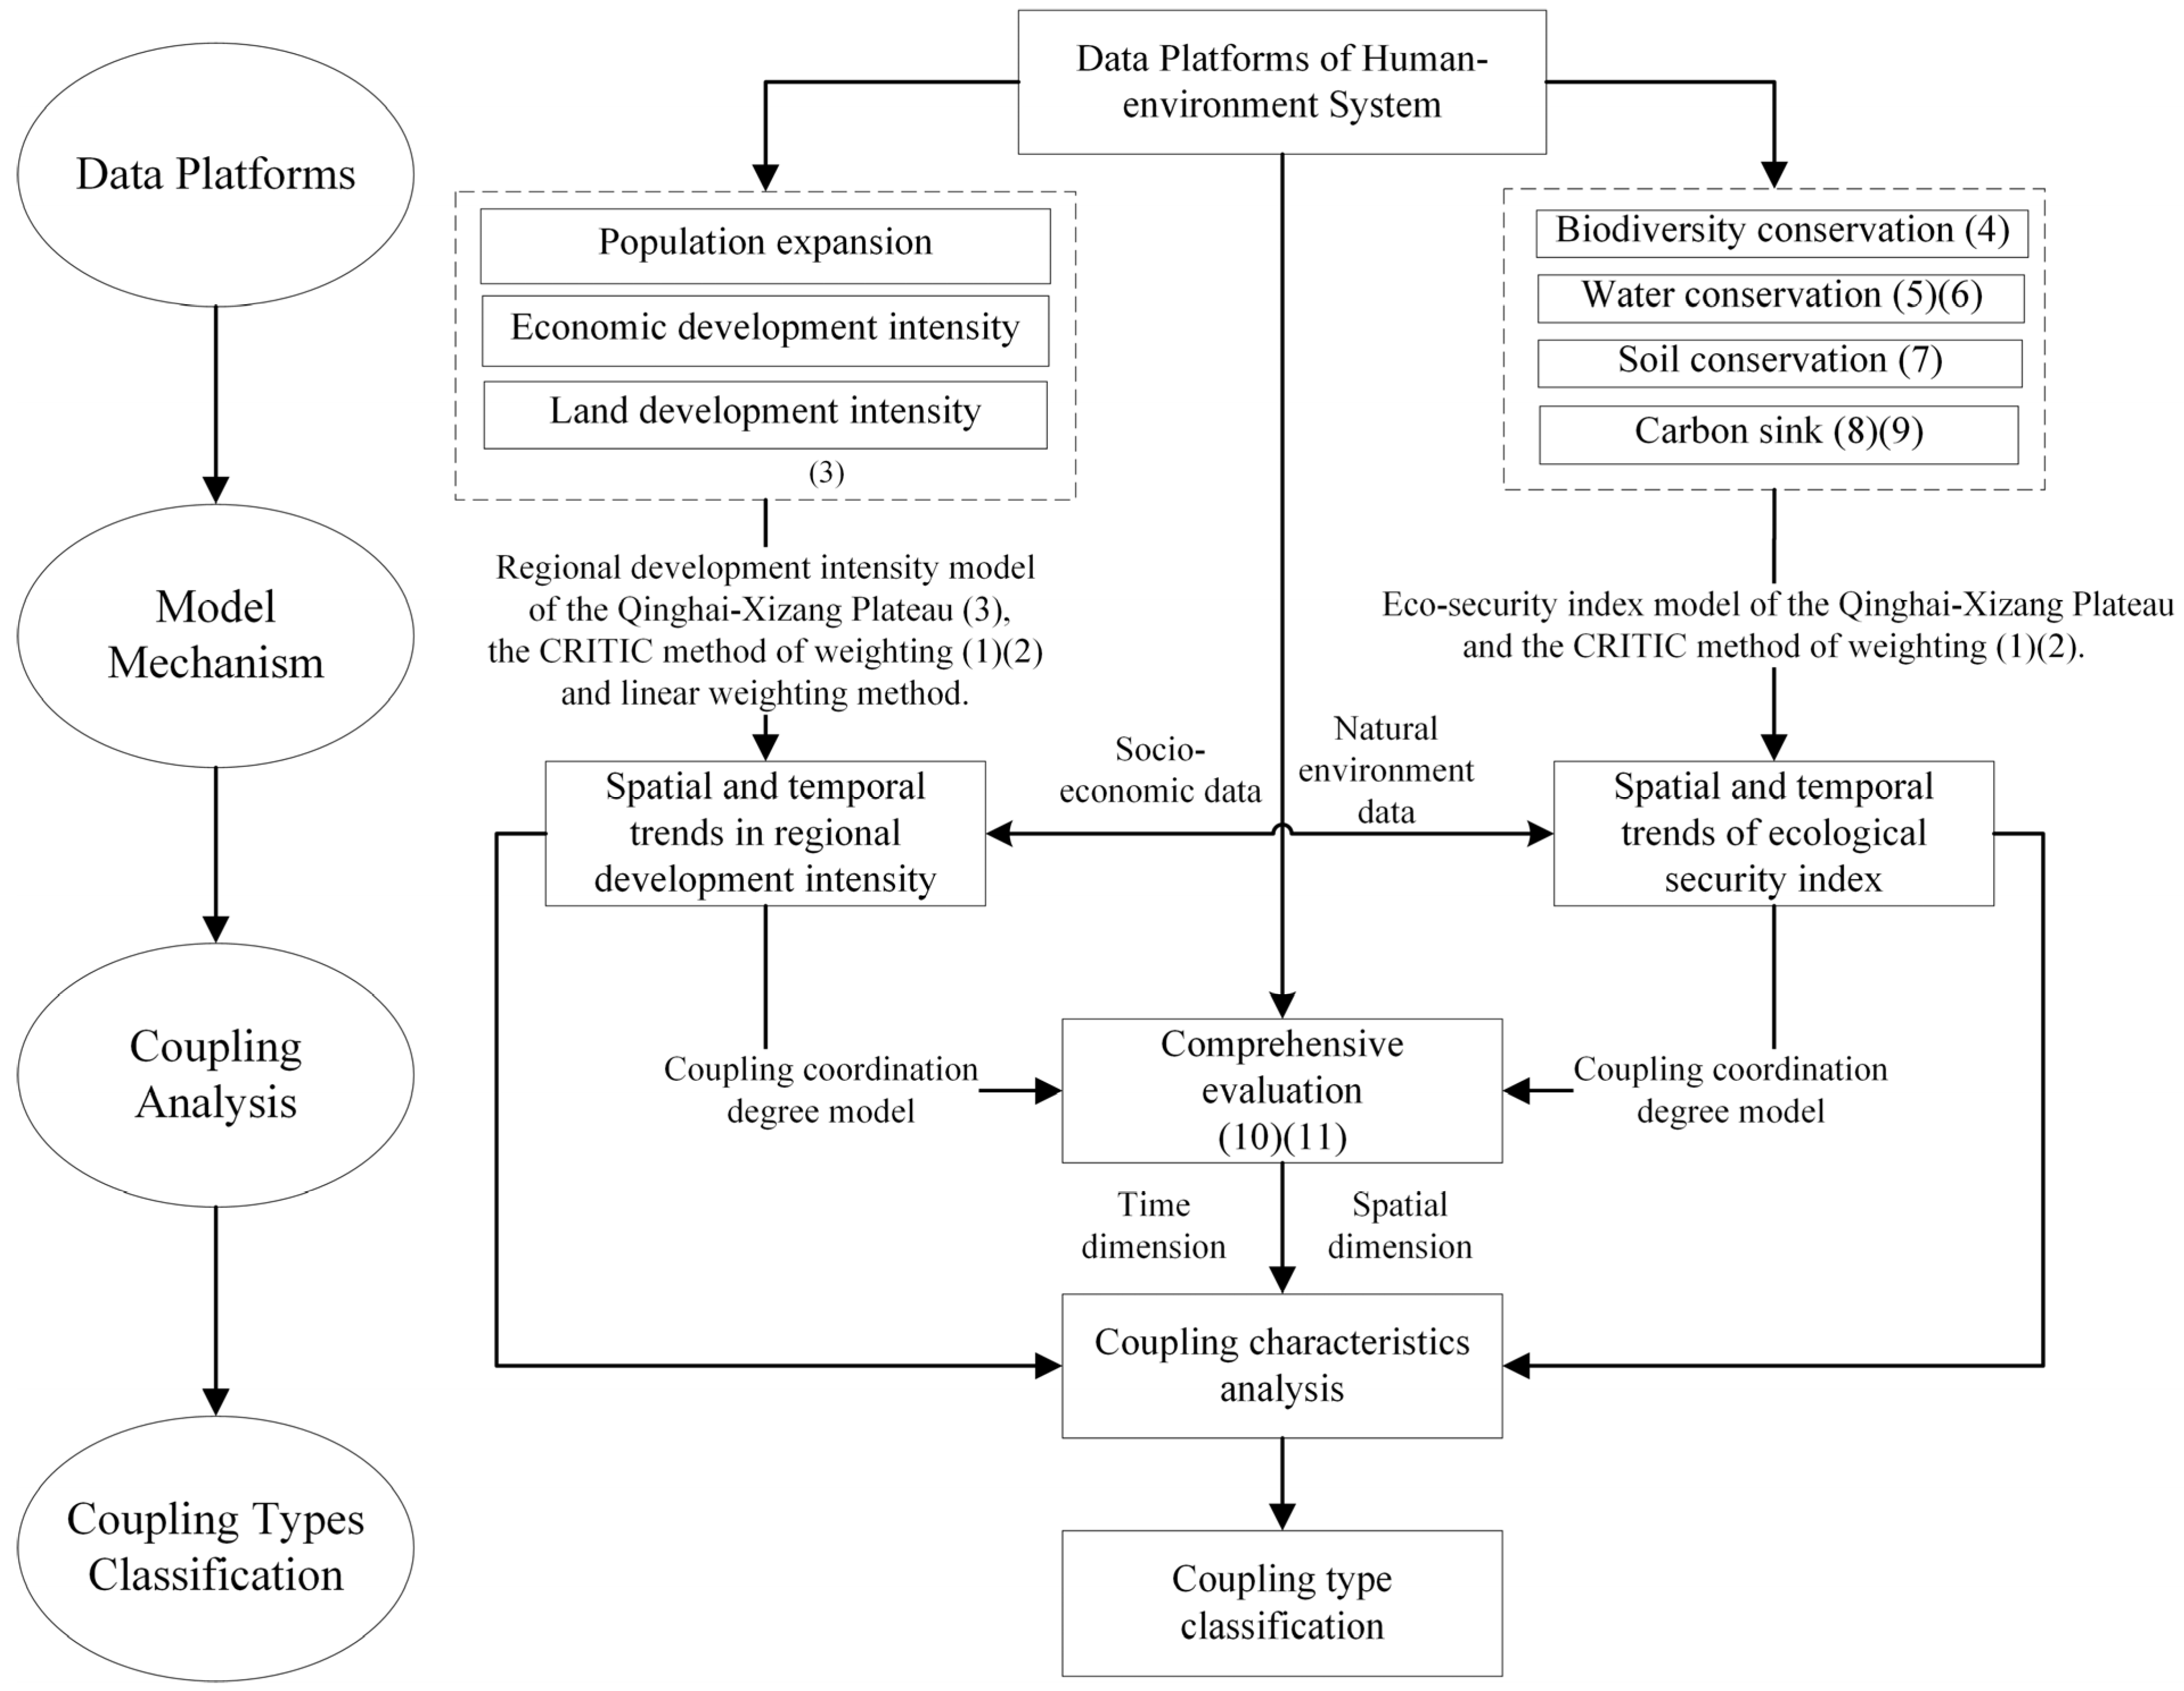
3. Research Methodology

3.1. Research Area

The research area of this paper is mainly in accordance with the scope delineated by Y.L. Zhang (2002), and the Construction Plan of Major Projects for Ecological Protection and Restoration of the Ecological Barrier Area of the Qinghai–Xizang Plateau (2021–2035) is used as a reference. Here, the Qinghai–Xizang Plateau consists of 28 administrative units at prefectural and municipal levels, namely, seven cities (regions) in Xizang, eight cities (autonomous prefectures) in Qinghai, four regions (autonomous prefectures) in Xinjiang, three autonomous prefectures in Sichuan, three cities (autonomous prefectures) in Yunnan, and three cities (autonomous prefectures) in Gansu (Figure 2).

3.2. Data Sources

The research involves spatio-temporal panel data of 28 administrative units of prefecture-level cities on the Qinghai–Xizang Plateau from 2011 to 2020. Socio-economic data were obtained from China City Statistical Yearbook (2012–2021), Xizang Statistical Yearbook (2012–2021), Qinghai Statistical Yearbook (2012–2021), Xinjiang Statistical Yearbook (2012–2021), Gansu Statistical Yearbook (2012–2021). (2012–2021), Sichuan Statistical Yearbook (2012–2021), and Yunnan Statistical Yearbook (2012–2021). Data on administrative district boundaries were obtained from the National Standard Map Service (http://bzdt.ch.mnr.gov.cn/, accessed on 1 July 2023). The rest of the data sources are shown in Table 1.

3.3. Methodology

3.3.1. Empowerment Using CRITIC Method

CRITIC (Criteria Importance Though Intercriteria Correlation) is a method of assigning weights based on the contrasting intensity and conflict of evaluation indicators [55]. The contrast intensity refers to the gap between the values of the evaluation schemes on the same indicator, which is expressed as the standard deviation, and the larger standard deviation indicates the greater volatility as well as the higher weights. Conflict is the strength of correlation between indicators, which is expressed as the correlation coefficient, and a larger correlation coefficient indicates less conflict and a lower weight. The steps of the CRITIC calculation method are as follows:
C j = σ j j = 1 n ( 1 r i j ) , j = 1 , 2 , n
where Cj denotes the influence degree of the j-th evaluation index on the system; σj denotes the standard deviation of the j-thevaluation index; and rij denotes the correlation coefficient between the i-th evaluation index and the j-thevaluation index. A higher value of Cj means that the j-thevaluation index has a greater influence on the system, and the relative importance of that index is greater. Therefore, the objective weight ωj of the j-th evaluation index is calculated by the formula:
ϖ j = C j j = 1 n C j , j = 1 , 2 , n

3.3.2. Regional Development Intensity Model of the Qinghai–Xizang Plateau

With reference to related scholars’ studies [56,57], the three dimensions of population expansion, the intensity of economic development, and the intensity of land development were selected to measure the regional development intensity of the Qinghai–Xizang Plateau. In which, population expansion includes regional population density and urbanization rate; economic development intensity includes regional economic density and the ratio of non-agricultural industries; land development intensity includes night light index and human activity intensity (Table 2). Through a zoning statistics tool of ArcGIS, 28 cities (prefectures) of Qinghai–Xizang Plateau were used as the research area to count the mean value of each index in each research area, and after normalization, the CRITIC method of weighting and linear weighting method were used to measure the regional development intensity with the following formula:
R D = i = 1 n R D i λ i       i = 1 , 2 , 3 n
where RD is the ecological security index; RDi is the standardized value of indicator i; and λi is the indicator weight value.

3.3.3. Eco-Security Index Model of the Qinghai–Xizang Plateau

(1)
Biodiversity conservation
In the model for calculating the biological abundance index, the former State Environmental Protection Administration issued the standard of Technical Specification for the Evaluation of Ecological Environment Status (for Trial Implementation) HJ/T192-2006, [58] that is as follows:
Biological Abundance Index = Abio × (0.35 × Forestland + 0.21 × Grassland + 0.28 × Water Wetland + 0.11 × Arable Land + 0.04 × Construction Land + 0.01 × Unutilized Land)/Region Area
where Abio denotes the normalized index of biological abundance.
(2)
Water conservation
Based on the water balance equation, the formula for measuring the water content index of a study area is as follows:
Y j = ( 1 A j P j ) P j
Q j = Y j R j
where Yj is the average annual water yield of the j-th research unit (mm); Pj is the average annual precipitation of the j-th research unit (mm); and Aj is the actual average annual evapotranspiration dispersion of the j-th research unit (mm).
Furthermore, Qj is the average annual water content of the j-th study unit (mm); Rj is the average annual surface runoff of the j-th study unit (mm), and the detailed measurement method is described in the literature [59].
(3)
Soil conservation
The assessment model for soil conservation services based on the RUSLE equation is depicted by the following equation:
A c = A p A r = R × K × L × S × 1 C
where Ac is the amount of soil conservation (t hm−2 a−1); Ap is the amount of potential soil erosion; Ar is the amount of actual soil erosion; R is the factor of rainfall erosion (MJ mm hm−2 h−1 a−1); and K is the factor of soil erodibility (t hm2 h hm−2 MJ−1·mm−1). L and S are topographic factors, where L represents the slope length factor, and S represents the factor of slope. However, in order to better reflect the overall shape of the terrain, the factor of topography can also be replaced by undulation. C is the factor of vegetation. The calculation method of each factor is described in the reference [60].
(4)
Carbon sink
In this paper, we estimate carbon sinks based on NPP with the following equation [61].
NPP = NPP 0.5 × 1.62
where NPP’ is the amount of carbon sink, NPP is the net primary productivity of vegetation, and the amount of dry matter is about 45–55% of the total amount of NPP, and the mean value of 50% was selected in this study. Each gram of dry matter can fix 1.62 g of CO2.
The quality and function of the Qinghai–Xizang Plateau ecosystem directly affects the ecological security of China, South Asia, and Southeast Asia, and the roles of biodiversity protection, water conservation, soil conservation, and carbon neutrality are the core tasks to ensure the ecological security and ecological sustainability on the Qinghai–Xizang Plateau. Based on the research outcomes of related scholars and combined with the unique connotation of ecological security on the Qinghai–Xizang Plateau, the biological abundance index was selected to assess the biodiversity conservation role; the water conservation index was selected to assess the water conservation role; the soil conservation index was selected to assess the soil conservation role; and the amount of carbon sink was selected to assess the capacity of carbon sink on the Qinghai–Xizang Plateau (Table 3). Using a zoning statistical tool of ArcGIS, the mean value of each index in each district of 28 cities (prefectures) on the Qinghai–Xizang Plateau is counted, normalized, and then assigned with the CRITIC method, and the ecological security index is measured using the linear weighting method, with the following formula:
E S = i = 1 m E S i λ i       i = 1 , 2 , 3 m
where ES is the ecological security index; ESi is the standardized value of index i; and λi is the weight value of index.

3.3.4. Coupling Coordination Degree Model

The model of coupling evaluation can describe the degree of interaction and coordination between ecological security and development intensity on the Qinghai–Xizang Plateau. The higher value indicates a stronger interaction between the systems; otherwise, it indicates that there are mutual constraints between them. The calculation steps of the model to evaluate the coupling coordination are as follows:
D = C × T
T = a U 1 + b U 2
where U1 and U2 are the evaluation indexes of regional development intensity, ecological security, and their subsystems, respectively. D is the degree of coupling coordination between ecological security and regional development intensity. T is the comprehensive coordination index between systems. a and b are undetermined coefficients, usually defaulting to 0.5. The coupling mechanism of ecological security and regional development intensity is divided into 5 major categories and 15 subcategories after referencing existing research results (Table 4).

4. Results

4.1. Spatial and Temporal Trends in Regional Development Intensity

The regional development intensity of all 28 cities (prefectures) on the Qinghai–Xizang Plateau from 2011 to 2020 showed an upward trend (Figure 3, and the specific information is provided in Table S1 of the Supplementary Material). According to the growth rate of regional development intensity during the research period, the cities (prefectures) are divided into three categories: (1) High-speed rising type (increase > 30%) that includes 14 cities (prefectures) of Yushu, Changdu, Naqu, Ngari, Huangnan, Zhangye, Lhasa, Liangshan, Kashgar, Nujiang, Ganzi, Rikaze, Gannan, and Hotan, accounting for 50%. Among them, the growth rate of Yushu and Changdu exceeded 100%, mainly because Yushu Prefecture was supported by many parties to achieve rapid development after the earthquake, and the level of economy and society has exceeded that before the earthquake. Changdu has been hindered by its deep mountain and canyon terrain. With the completion of the Sichuan–Xizang Railway (the section from Ya’an to Nyingchi), the high-grade highway (the section from Changdu to Gaka), and renovation and expansion of the second phase of the Bonda Airport, the speed of regional construction has been accelerating. (2) Medium-speed rising type (10% < increase ≤ 30%) that includes nine cities (prefectures) of Diqing, Jiuquan, Guoluo, Shannan, Lijiang, Aba, Haidong, Xining, and Nyingchi, accounting for 32.14%. These cities (prefectures) have a good economic foundation of their own, and their economic and social development is more stable due to the support of anti-poverty and rural revitalization policies. (3) Low-speed rising type (0 < increase ≤ 10%) that includes five cities (prefectures) of Haixi, Haibei, Hainan, Kizilsu Kirgiz, and Bayingol, accounting for 17.86%. Except for Haixi and Bayingol that are resource-based cities with weak transformation, and the remaining three cities (prefectures) are limited in terms of human activities and regional development, mainly due to their poor ecological environment.
The regional development intensity of the Qinghai–Xizang Plateau from 2011 to 2020 gradually shows a multi-group pattern (Figure 4). As provincial capitals, Lhasa and Xining have a high regional development intensity and drive the economic development of surrounding cities (prefectures). With traditional resource development and new energy project construction occurring in parallel, Haixi and Bayingol are the regions on the Qinghai–Xizang Plateau with higher industrial development and development intensity except for the provincial capitals. In summary, urbanization and modernization are steadily progressing in each city (prefecture) on the Qinghai–Xizang Plateau, and the intensity of regional development on the Qinghai–Xizang Plateau has been increasing, forming a spatial pattern with Xining and Lhasa as the core and multiple groups on the periphery.

4.2. Spatial and Temporal Trends of Ecological Security Index

Most of the ecological security indexes of 28 cities (prefectures) on the Qinghai–Xizang Plateau from 2011 to 2020 showed an increasing trend, but some regions had a decreasing trend (Figure 5, and the specific information is provided in Table S2 of the Supplementary Material). According to the growth rate of the ecological security index of the Qinghai–Xizang Plateau during the research period, the cities (prefectures) were classified into four categories (Figure 6): (1) High-speed rising type (increase > 30%) that includes nine cities (prefectures) of Zhangye, Jiuquan, Rikaze, Yushu, Shannan, Xining, Guoluo Tibetan Autonomous Prefecture, Haixi, and Hotan, accounting for 32.14%. (2) Medium-speed rising type (10% < increase ≤ 30%) that includes nine cities (prefectures) of Huangnan, Liangshan, Naqu, Ali, Lijiang, Ganzi Tibetan Autonomous Prefecture, Haibei Tibetan Autonomous Prefecture, Hainan, and Lhasa, accounting for 32.14%. (3) Low-speed rising type (0 < increase ≤ 10%) that includes seven cities (prefectures) of Haidong, Aba, Gannan, Nyingchi, Kashgar, Kizilsu Kirgiz, and Nujiang, accounting for 25%. (4) Decline or stagnation type (increase ≤ 0) that includes three cities of Changdu, Diqing, and Bayinggol, accounting for 10.71%. Meanwhile, as presented in Figure 7, the ecological security index of the Qinghai–Xizang Plateau gradually shows a pattern of “belt-shaped depressions in the central and western part, vertical groups distribution in the east”. Eco-security depressions are formed from the western part of Xizang to the western part of Qinghai Province, and the eco-security status is good in the east from the eastern part of Qinghai Province to the Yarlung Tsangpo River valley at the eastern edge of the Qinghai–Xizang Plateau. The depression of the eco-security index moved toward the southern edge of Xinjiang during the research period, and the main trend direction was from northwest to southeast (northwest–southeast).
Further analyzing the elemental dimensions of ecological security, the elements of the ecological security index of each city (prefecture) on the Qinghai–Xizang Plateau were relatively stable from 2011 to 2020. Except for the index of biological abundance, the overall spatial distribution of water content during the research period showed a trend from northwest to southeast and from high to low. According to the method of natural breaks classification, the elements of the ecological security index of the Qinghai–Xizang Plateau are classified into five levels: (1) Based on the evaluation of biodiversity security, it is found that 89.29% of the cities (prefectures) have achieved growth. In the northern part of the Qinghai–Xizang Plateau, except for Kashgar and Bayingol, which are less affected by the northern desert and Kunlun Mountains, the biodiversity level of the remaining areas is low, and the level of ecological diversity in the southwestern part of the Qinghai–Xizang Plateau is low except for Ngari. (2) Based on the evaluation of water security, it is found that 25% of the cities (prefectures) have achieved growth. The high value area is mainly distributed in the basin of Yarlung Zangbo River, and Nujiang River (in the southeast of Qinghai–Xizang Plateau), involving Nujiang, Shannan, Nyingchi, etc., and the water content of cities (prefectures) reaches more than 1000 mm per year. The low value area is mainly the plateau and desert in the western part of the Qinghai–Xizang Plateau, and the rivers within the region are mostly seasonal rivers with a water content of less than 500 mm per year. The range of spatial variation in the high and low value areas of water content on the Qinghai–Xizang Plateau over the 10 years was small, but slightly reduced overall. (3) Based on the soil security evaluation, it is found that 89.29% of the cities (prefectures) have achieved an increase in soil retention. The area with a high value is smaller, mainly including Nujiang, Diqing, Liangshan, and other neighboring cities (prefectures), while the absolute difference in soil retention between high and low value areas has expanded from 8232.6 t/km2 to 17,236 t/km2 within 10 years. (4) Based on the capacity evaluation of carbon sink, it is found that 67.86% of the cities (prefectures) have achieved an increase in soil retention. The high value areas include Nujiang, Diqing Tibetan Autonomous Prefecture, Liangshan, and the surrounding cities (prefectures), and the low value areas are mainly located in the area of deserts and plateaus with a low vegetation cover within the Qinghai–Xizang Plateau.
It can be seen that the ecological security index of each city (prefecture) on the Qinghai–Xizang Plateau increased significantly during 2011 to 2020. Among them, in more than 60% of the cities (prefectures), it increased by over 10% and showed a pattern of “belt-shaped depression in the central and western part of the plateau, and vertical groups distribution in the east”. Except for water security, more than 60% of the cities (prefectures) have increased in each index for all elemental dimensions. In addition, except for the ecological diversity security that shows a cluster pattern, the rest show a spatial distribution from northwest to southeast and from high to low, which is consistent with the distribution of natural substrates such as elevation and vegetation cover.

4.3. Analysis of the Spatial and Temporal Characteristics and Types of Coupling between Regional Development Intensity and Ecological Security

4.3.1. Spatial and Temporal Characteristics of the Coupling Coordination Degree between Regional Development Intensity and Ecological Security

As shown in Figure 8 (the specific information is provided in Table S3 of the Supplementary Material), the coupling degree between regional development intensity and ecological security in the whole 28 cities (prefectures) of the Qinghai–Xizang Plateau from 2011 to 2020 showed an increasing trend except for Bayingol. During the research period, the coupling degree of Yushu and Zhangye increased greatly, over 30%; the increase for Rikaze, Jiuquan, Nagqu, Ali, Huangnan, Changdu, Shannan, Xining, Liangshan, Hotan, Guoluo, Haixi, Ganzi, Lhasa, Lijiang, Gannan, Haidong, Kashgar and Nujiang was between 10% and 30%; the remaining seven cities (prefectures), including Aba, Diqing, Hainan, Haibei, Nyingchi, Kizilsu Kirgiz Autonomous Prefecture, and Bayingoleng, showed an increase of less than 10%.
The following analysis was carried out in time dimension. In 2011, the coupling degree between regional development intensity and ecological security of cities (prefectures) on the Qinghai–Xizang Plateau was between 0.29 and 0.62 [0.29, 0.62], mostly at the stage of “mild coupling”, while Yushu, Zhangye, Rikaze, Hotan, and Jiuquan were at the stage of “mild imbalance”. In 2014, the coupling degree at the city (prefecture) level was between 0.38 and 0.69 [0.38, 0.69]. Most areas were at the stage of “mild coupling” or “good coupling”, and only Yushu was at the stage of “mild imbalance”. From 2017 to 2020, the coupling degree at the city (prefecture) level has reached the stage of “mild coupling” or “good coupling”. Analyzing from the spatial dimension, as shown in Figure 9, the coupling of regional development intensity and ecological security on the Qinghai–Xizang Plateau from 2011 to 2020 gradually forms a group consisting of Xining, Bayingol, and the western part of Yunnan (Lijiang, Diqing Tibetan Autonomous Prefecture, and Nujiang), and gradually expands to geographically adjacent areas, forming a spatial pattern of “high in the east and low in the west”.

4.3.2. Coupling Type Classification of Regional Development Intensity and Ecological Security

As shown in Figure 10, most cities (prefectures) on the Qinghai–Xizang Plateau have achieved a greater optimization in the period of 2011–2020. As the central cities of Qinghai–Xizang Plateau, Lhasa and Xining belong to the category of high coupling level in the region, but the relative concentration of population and industry increases the pressure on ecological environment, presenting the coupling coordination type of “good coupling-ecology lagging”. (1) The northern part of the Qinghai–Xizang Plateau has been constrained in terms of regional development and urbanization by the severe natural environment and the weak ecological security, among which Hotan and Jiuquan showed the types of “mild imbalance” and “mild imbalance-ecology lagging behind” in 2011. However, with the implementation of ecological conservation measures and poverty alleviation in the Qinghai–Xizang Plateau, the coupling degree of the region has improved. (2) The eastern part of the Qinghai–Xizang Plateau includes the western part of Sichuan and the northwestern part of Yunnan. Aba in the western part of Sichuan has shifted from the type of “mild coupling” to the “good coupling”, while Ganzi and Liangshan have been in the type of “mild coupling”. The southeastern edge of the Qinghai–Xizang Plateau, the northern part of the Hengduan Mountains, and the northwestern edge of the Sichuan Basin are the three prefectures that belong to the type with lagging regional development. Although the ecological security is better, the level of economic and social development is lower due to the inconvenient transportation in the plateau and mountains, which is not conducive to the development of agricultural economy but is suitable for the development of husbandry economy. Located in the connection zone between Qinghai–Xizang Plateau and Yunnan–Guizhou Plateau, Lijiang, Diqing, and Nujiang, which are in the northwestern part of Yunnan, are dominated by high mountain valleys with obvious vertical zonality and a high level of ecological security. However, regional development cannot be concentrated due to geomorphological constraints, and only river valley agriculture can be developed. Finally, all of them have changed from “mild coupling-regional development lagging” to “good coupling-regional development lagging”. (3) Xizang is located in the central and southern part of the Qinghai–Xizang Plateau. After taking measures (the relocation project of villages above 4500 m and the ecological restoration project of pastureland), the Ngari prefecture has overcome the factors of high altitude, fragile ecological environment, and poor living conditions and has changed from “mild coupling-regional development lagging” to “mild coupling”. Located close to Sichuan and Yunnan, Shannan and Nyingchi are rich in biological resources and have a strong water-conserving capacity, and their industries are mainly farming, tourism, and river valley agriculture. Overall, the regional development is slow and belongs to the type of “mild coupling-regional development lagging”. The reason why the city of Rikaze has been upgraded from “mild imbalance” to “mild coupling” within 10 years is that Rikaze is rich in tourism resources. However, there is severe climate, frequent natural disasters, sandy land, and degraded grassland in Rikaze. With the construction of ecological migration and ecological security barrier, the degree of coupling and coordination in the region has been improved.
Above all, the coupling type of regional development intensity and ecological security in each city (prefecture) on the Qinghai–Xizang Plateau has been basically optimized in different degrees during the research period, and more than half of the cities (prefecture) have reached the type of “mild coupling”. However, no city (prefecture) in the region has reached the type of “excellent coupling”, and a considerable number of cities (prefectures) show a lagging regional development or a lagging ecological security. The degree of coupling coordination between regional development intensity and ecological security in the cities (prefectures) of the Qinghai–Xizang Plateau is relatively low, and the evolutionary process has taken a long time. In the future, it is still necessary for each city (prefecture) to coordinate economic and social development based on ecological protection, and further achieve a higher degree of coordination between regional development and ecological security.

5. Discussion

In the competition between the importance of ecological security barrier protection and the necessity of economic and social development, the Qinghai–Xizang Plateau is characterized by strong differentiation, variability, and uncertainty in the process of “human–environment coupling”. At the same time, the mechanism of “human–environment coupling” is not similar in different regions and different cities within the same region. Therefore, this paper proposes a model for measuring the relationship between regional development intensity and ecological security based on the traditional “human–environment coupling” relationship and research perspectives in combination with the regional characteristics of the Qinghai–Xizang Plateau, and finds the spatial and temporal heterogeneity of the coupling coordination degree among different regions and different ranks and cities with different resource endowments. The results of this research are directionally consistent with existing research results [62], and they further confirm that the relationship of “human–environment coupling” on the Qinghai–Xizang Plateau is improving. In addition, in this paper, different index systems have been constructed to optimize the stages and levels of coupling coordination compared with existing scholars.
Given the small population base and the few increments in lagging urbanization of the Qinghai–Xizang Plateau compared with the eastern region, this study assigns less weight to regional urbanization compared with human activities and the development of farming and animal husbandry in the selection process of regional development intensity indexes. However, located in the periphery of China’s new urbanization strategy pattern called “two horizontal, three vertical and nineteen clusters”, the Qinghai–Xizang Plateau plays an important role in defending the national security barrier and guarding the national ecological security barrier; thus, the country has promoted urbanization in the region through direct investment and transfer payments [63]. Meanwhile, the ecological restoration of the Qinghai–Xizang Plateau is becoming effective along with the emphasis on ecological and environmental protection in the process of urban development [64]. Therefore, scholars can further explore the negative externalities of the urbanization process and the corresponding mechanisms of each industry in future studies [65,66]. The Qinghai–Xizang Plateau plays the role of national ecological security, ecological diversity, water security, soil security, and carbon sink, and is also the core indicator for evaluating its ecological security. Restricted by data availability and data precision, the study is conducted at the spatial scale of cities (prefectures) and the time scale of 10 years. Most of the relevant indexes in the paper are indirectly measured, but the construction of ecological security barriers on the Qinghai–Xizang Plateau can be further explored at the microscopic scale and as a long-term series in the future.
In general, the coupling coordination between regional development intensity and ecological security on the Qinghai–Xizang Plateau is steadily improving, but the direction of coupling optimization differs in different regions and in different cities (prefectures) within the same region. (1) The central metropolitan areas of Xining and Lhasa have the highest development intensity and the greatest coercive impact on ecological security, but at the same time, these areas have a better green economic development and stronger ecological protection and restoration capacity, which can provide a large number of non-agricultural employment opportunities and relieve ecological pressure in the surrounding areas. Therefore, good coupling coordination can be achieved in such areas. (2) Cities (prefectures) such as Jiuquan, Rikaze, and Kizilsu Kirgiz have low ecological endowment and ecological carrying capacity of their own, which will be further disordered if regional development is not restricted. Therefore, the level and speed of urbanization in the plateau should be controlled to a reasonable level according to the requirements of safeguarding national security and ecological security barrier. (3) Cities such as Lijiang, Diqing, and Nujiang have a better ecological resource endowment and a higher ecological security index, but they are limited by the high mountains and deep valleys of the Hengduan Mountains, resulting in a weak regional development and limiting the local socio-economic development. Therefore, on the Qinghai–Xizang Plateau, the key to achieving coordination between regional development and ecological security is to follow a new sustainable model of mountainous areas in accordance with local conditions, as well as to balance regional development and ecological security to achieve internal sustainable development.

6. Conclusions

In this paper, a comprehensive measure of regional development intensity and ecological security was designed, and the CRITIC method’s weighting and coupling coordination model was used to measure the regional development intensity and ecological security indexes of each city (prefecture) on the Qinghai–Xizang Plateau, and thus, the coupling degree of the relationship between the two and the spatial and temporal differentiation characteristics of each city (prefecture) were researched. The main conclusions are as follows.
(1) The regional development intensity of the Qinghai–Xizang Plateau has been increasing from 2011 to 2020, and more than 90% of the municipalities (prefectures) have increased by more than 10%, forming a multi-cluster pattern with Xining and Lhasa as the core. Haixi Prefecture is the region with a greater intensity of industrial development and exploitation on the Qinghai–Xizang Plateau, except for the provincial capitals. The ecological security index of each city (prefecture) on the Qinghai–Xizang Plateau increased significantly from 2011 to 2020. More than 60% of the cities (prefectures) showed an over 10% increase in the ecological security index and showed a pattern of “belt-shaped depression in the central and western part of the plateau, and vertical groups distribution in the east”. Except for water security, more than 60% of cities (prefectures) exhibited an increase in each index. Except for biodiversity security, which shows a grouped spatial pattern, all other elements show a spatial distribution from northwest to southeast and from high to low.
(2) The coupling degree of regional development intensity and ecological security of each city (prefecture) on the Qinghai–Xizang Plateau was improved at different degrees from 2011 to 2020, and more than half of the cities (prefectures) reached the “mild coupling” type, but no city (prefecture) in the region reached the “excellent coupling” type. Furthermore, a considerable number of cities (prefectures) showed a lag in regional development intensity or a lag in ecological security. The level of coupling and coordination between regional development intensity and ecological security in each city (prefecture) is relatively low and has taken a long time. In the future, it is still necessary for each city (prefecture) to further coordinate social and economic development based on ecological protection to achieve a higher degree of coordination between regional development and ecological security.
(3) The coupling coordination of development intensity and ecological security on the Qinghai–Xizang Plateau has an obvious spatial and temporal heterogeneity. The three clusters of Xining, Bayingol, and Lhasa, the western part of Yunnan (Lijiang, Diqing Tibetan Autonomous Prefecture, and Nujiang), have gradually expanded to adjacent geographical areas, forming a pattern of “high in the east and low in the west, with multiple clusters in parallel”. The problem of imbalance and incoordination in development intensity and ecological security within the region still exists.

Supplementary Materials

The following supporting information can be downloaded at: https://www.mdpi.com/article/10.3390/land12122103/s1, Table S1. Qinghai–Xizang Plateau regional development intensity index. Table S2. Ecological security index of Qinghai–Xizang plateau. Table S3. Variation in coupling degree between regional development intensity and ecological security on the Qinghai–Xizang Plateau.

Author Contributions

Conceptualization, L.W. and J.L.; methodology, R.M. and L.Z.; software, L.W. and J.L.; validation, L.W. and R.M.; formal analysis, L.W. and J.L.; investigation, L.W. and L.Z.; resources, J.L.; visualization, L.W. and L.Z.; supervision, R.M.; funding acquisition, J.L. All authors have read and agreed to the published version of the manuscript.

Funding

This research was funded by The Second Tibetan Plateau Scientific Expedition and Research, Ministry of Science and Technology of P.R. China (grant number: 2019QZKK0406) and the Open Funding of Zhejiang Collaborative Innovation Center for Land and Marine Spatial Utilization and Governance Research (grant number: LHGTXT-2023-003).

Data Availability Statement

Not applicable.

Acknowledgments

The authors thank Jiarui Chen for his help and support during the paper data analysis process.

Conflicts of Interest

The authors declare no conflict of interest.

References

  1. Liu, Y.; Chen, Y. Impact of population growth and land-use change on water resources and ecosystems of the arid Tarim River Basin in Western China. Int. J. Sustain. Dev. World Ecol. 2006, 13, 295–305. [Google Scholar] [CrossRef]
  2. Zeng, P.; Wei, X.; Duan, Z. Coupling and coordination analysis in urban agglomerations of China: Urbanization and ecological security perspectives. J. Clean. Prod. 2022, 365, 132730. [Google Scholar] [CrossRef]
  3. Young, J.; Watt, A.; Nowicki, P.; Alard, D.; Clitherow, J.; Henle, K.; Johnson, R.; Laczko, E.; McCracken, D.; Matouch, S.; et al. Towards sustainable land use: Identifying and managing the conflicts between human activities and biodiversity conservation in europe. Biodivers. Conserv. 2005, 14, 1641–1661. [Google Scholar] [CrossRef]
  4. Rogers, K.S. Ecological security and multinational corporations. Environ. Chang. Secur. Proj. Rep. 1997, 3, 29–36. [Google Scholar]
  5. Peng, J.; Zhao, H.; Liu, Y.; Wu, J. Research progress and prospect on regional ecological security pattern construction. Geogr. Res. 2019, 36, 407–419. [Google Scholar]
  6. Yang, A.; Zhang, X.; Li, Z.; Li, Y.; Nan, F. Quantitative analysis of the impacts of climate change and human activities on vegetation NPP in the Qilian Mountain National Park. Acta Ecol. Sin. 2023, 43, 202–221. [Google Scholar]
  7. Huang, J.; Yu, H.; Han, D.; Zhang, G.; Wei, Y.; Huang, J.; An, L.; Liu, X.; Ren, Y. Declines in global ecological security under climate change. Ecol. Indic. 2020, 117, 106651. [Google Scholar] [CrossRef]
  8. Cui, W.; Liu, J.; Jia, J.; Wang, P. Terrestrial ecological restoration in China: Identifying advances and gaps. Environ. Sci. Eur. 2021, 33, 123. [Google Scholar] [CrossRef]
  9. Wang, Y.; Liao, J.; He, Y.; Chen, P. Evolution and Ecological Implications of Land Development and Conservation Patterns on the Qinghai-Tibet Plateau. Land 2022, 11, 1797. [Google Scholar] [CrossRef]
  10. Shi, T.; Yang, S.; Zhang, W.; Zhou, Q. Coupling coordination degree measurement and spatiotemporal heterogeneity between economic development and ecological environment—Empirical evidence from tropical and subtropical regions of China. J. Clean. Prod. 2020, 244, 118739. [Google Scholar] [CrossRef]
  11. Han, D.; Yu, D.; Qiu, J. Assessing coupling interactions in a safe and just operating space for regional sustainability. Nat. Commun. 2023, 14, 1369. [Google Scholar] [CrossRef]
  12. Shi, Y.; Feng, C.-C.; Yu, Q.; Han, R.; Guo, L. Contradiction or coordination? The spatiotemporal relationship between landscape ecological risks and urbanization from coupling perspectives in China. J. Clean. Prod. 2022, 363, 132557. [Google Scholar] [CrossRef]
  13. Fang, C.; Fan, Y.; Bao, C.; Li, G.; Wang, Z.; Sun, S.; Ma, H. China’s improving total environmental quality and environment-economy coordination since 2000: Progress towards sustainable development goals. J. Clean. Prod. 2023, 387, 135915. [Google Scholar] [CrossRef]
  14. Fu, B.; Ouyang, Z.; Shi, P.; Fan, J.; Wang, X.; Zheng, H.; Zhao, W.; Wu, F. Current Condition and Protection Strategies of Qinghai-Tibet Plateau Ecological Security Barrier. Bull. Chin. Acad. Sci. 2021, 36, 1298–1306. [Google Scholar]
  15. Feng, Z.; Li, X.; Hu, J.; Wang, L. Analysis on the ecological security of the typical area in the eastern Qinghai-Tibet Plateau based on landscape pattern. Chin. J. Ecol. 2022, 41, 1188–1196. [Google Scholar]
  16. Nie, Q.; He, L.; Yin, C.; Tian, P.; Lu, H. Spatio-temporal variation of ecological risk of agriculture and animal husbandry on the Tibetan Plateau and its regional prevention and control. J. Nat. Resour. 2022, 37, 250–262. [Google Scholar] [CrossRef]
  17. Ma, N.; Zhi, X.; Song, Y. Evaluation and prediction of the cultivated land ecological security in Tibet based on PSR and GM (1,1) model. J. Arid. Land Resour. Environ. 2018, 32, 81–86. [Google Scholar]
  18. Lu, Y.; Zhao, Y.; Dong, J. Ecological security evaluation and driving force analysis of three-dimensional ecological footprint in Northwestern China. Acta Ecol. Sin. 2022, 42, 1354–1367. [Google Scholar]
  19. Qi, W.; Liu, S.; Zhou, L. Reginal differentiation of population in Tibetan Plateau: Insight from the “Hu Line”. Acta Geogr. Sin. 2020, 75, 255–267. [Google Scholar]
  20. Huang, Z.; Wang, X.; Zhang, W. Human Development Assessment and Evolution Analysis on the Qinghai-Tibet Plateau. Sci. Geogr. Sin. 2021, 41, 1088–1095. [Google Scholar]
  21. Yang, H.; Xu, Y.; Wang, L.; Xu, L. Spatio-temporal variation of human activity intensity and its driving factors on the Qinghai-Tibet Plateau. Acta Ecol. Sin. 2023, 43, 3995–4009. [Google Scholar]
  22. Wang, C.; Kan, A.; Zeng, Y.; Li, G.; Wang, M.; Ci, R. Population distribution pattern and influencing factors in Tibet based on random forest model. Acta Geogr. Sin. 2019, 74, 664–680. [Google Scholar]
  23. Zhang, H. Spatio-temporal variations of population and population distribution with data at county level in Northwest China in 1990–2010. J. Arid. Land Resour. Environ. 2013, 27, 33–39. [Google Scholar]
  24. Feng, Y.; Li, G. Interaction between urbanization and eco-environment in Tibetan Plateau. Acta Geogr. Sin. 2020, 75, 1386–1405. [Google Scholar] [CrossRef]
  25. Bao, C.; Liu, R. Spatiotemporal Evolution of the Urban System in the Tibetan Plateau. J. Geo-Inf. Sci. 2019, 21, 1330–1340. [Google Scholar]
  26. Li, S.; Wu, J.; Gong, J.; Li, S. Human footprint in Tibet: Assessing the spatial layout and effectiveness of nature reserves. Sci. Total Environ. 2018, 621, 18–29. [Google Scholar] [CrossRef]
  27. Xu, J.; Xu, Y.; Hu, L.; Wang, Z. Discovering spatio-temporal patterns of human activity on the Qinghai-Tibet Plateau based on crowdsourcing positioning data. Acta Geogr. Sin. 2020, 75, 1406–1417. [Google Scholar]
  28. Luo, M.; Li, J.; Wu, L.; Wang, W.; Danzeng, Z.; Mima, L.; Ma, R. The Spatial Mismatch between Tourism Resources and Economic Development in Mountainous Cities Impacted by Limited Highway Accessibility: A Typical Case Study of Lhasa City, Tibet Autonomous Region, China. Land 2023, 12, 1015. [Google Scholar] [CrossRef]
  29. Gong, Q.; Li, J.; Wu, L.; Zhu, M.; Luo, M.; Sun, J.; Fu, W.; Ma, R.; Liang, X. Exploring Accessibility and Its Impact in the Mountain City: A Typical Case Study of Nyingchi City, Tibet Autonomous Region, China. Land 2023, 12, 361. [Google Scholar] [CrossRef]
  30. Ma, R.; Liu, L.; Wu, L.; Li, J.; Zhang, W.; Luo, M.; Yuan, J. Spatio-temporal Evolution and Influencing Factors of Agricultural and Animal Husbandry Enterprises in Qinghai-Tibet Region. Econ. Geogr. 2022, 12, 133–141. [Google Scholar] [CrossRef]
  31. Gao, X.; Li, T.; Cao, X. Spatial fairness and changes in transport infrastructure in the Qinghai-Tibet Plateau area from 1976 to 2016. Sustainability 2019, 11, 589. [Google Scholar] [CrossRef]
  32. Miao, Y.; Dai, T.; Song, J.; Ding, T.; Lu, W. Concept expansion, method improvement of transport superiority degree and its empirical application in Tibet. Acta Geogr. Sin. 2023, 78, 1515–1529. [Google Scholar]
  33. Miao, Y.; Dai, T.; Yang, X.; Song, J. Landscape fragmentation associated with the Qingzang Highway and its influencing factors—A comparison study on road sections and buffers. Geogr. Sustain. 2021, 2, 59–67. [Google Scholar] [CrossRef]
  34. Andrews, A. Fragmentation of habitat by roads and utility corridors: A review. Aust. Zool. 1990, 26, 130–141. [Google Scholar] [CrossRef]
  35. Forman, R.; Alexander, L. Roads and their major ecological effects. Annu. Rev. Ecol. Syst. 1998, 29, 207–231. [Google Scholar] [CrossRef]
  36. Wang, G.; Gillespie, A.; Liang, S.; Mushkin, A.; Wu, Q. Effect of the Qinghai-Tibet Railway on vegetation abundance. Int. J. Remote Sens. 2015, 36, 5222–5238. [Google Scholar] [CrossRef]
  37. Fang, C. Special thinking and green development path of urbanization in Qinghai-Tibet Plateau. Acta Geogr. Sin. 2022, 77, 1907–1919. [Google Scholar]
  38. Liu, Z.; Liu, S.; Qi, W.; Jin, H. The settlement intention of floating population and the factors in Qinghai-Tibet Plateau: An analysis from the perspective of short-distance and long-distance migrants. Acta Geogr. Sin. 2021, 76, 2142–2156. [Google Scholar]
  39. Tian, Y.; Jiang, G.; Zhou, D.; Li, G. Systematically addressing the heterogeneity in the response of ecosystem services to agricultural modernization, industrialization and urbanization in the Qinghai-Tibetan Plateau from 2000 to 2018. J. Clean. Prod. 2021, 285, 125323. [Google Scholar] [CrossRef]
  40. Chai, L.; Tian, L.; Ao, Y.; Wang, X. Influence of Human Disturbance on the Change of Vegetation Cover in the Tibetan Plateau. Res. Soil Water Conserv. 2021, 28, 382–388. [Google Scholar]
  41. Zhang, Y.; Zhao, R.; Liu, Y.; Huang, K.; Zhu, J. Sustainable wildlife protection on the Qingzang plateau. Geogr. Sustain. 2021, 2, 40–47. [Google Scholar] [CrossRef]
  42. Lv, D.; Lv, Y.; Gao, G.; Sun, S.; Wang, Y.; Fu, B. A landscape persistence-based methodological framework for assessing ecological stability. Environ. Sci. Ecotechnology 2023, 17, 100300. [Google Scholar] [CrossRef]
  43. Wu, C. The Core of Geographical Study—Territorial System of Human-environment Interaction. Econ. Geogr. 1991, 11, 1–6. [Google Scholar]
  44. Deng, W.; Zhang, S.; Zhang, H.; Peng, L.; Liu, Y. Transitional geospace from the perspective of human-nature coupling: Concept, connotations, attributes, and the research framework. Geogr. Res. 2020, 39, 761–771. [Google Scholar]
  45. Fang, C.; Cui, X.; Liang, L. Theoretical analysis of urbanization and eco-environment coupling coil and coupler control. Acta Geogr. Sin. 2019, 74, 2529–2546. [Google Scholar]
  46. Ren, Y.; Fang, C.; Sun, S.; Bao, C.; Liu, R. Progress in local and tele-coupling relationship between urbanization and eco-environment. Acta Geogr. Sin. 2020, 75, 589–606. [Google Scholar]
  47. Sun, H.; Zheng, D.; Yao, T.; Zhang, Y. Protection and Construction of the National Ecological Security Shelter Zone on Tibetan Plateau. Acta Geogr. Sin. 2012, 67, 3–12. [Google Scholar]
  48. Yao, T.; Wang, W.; An, B.; Piao, S.; Chen, F. The scientific expedition and research activities on the Tibetan Plateau in 1949–2017. Acta Geogr. Sin. 2022, 77, 1586–1602. [Google Scholar]
  49. Yu, H.; Zhang, Y.; Liu, L.; Chen, C.; Qi, W. Floristic characteristics and diversity patterns of seed plants endemic to the Tibetan Plateau. Biodivers. Sci. 2018, 26, 130–137. [Google Scholar] [CrossRef]
  50. Liu, J.-Q.; Duan, Y.-W.; Hao, G.; Ge, X.-J.; Sun, H. Evolutionary history and underlying adaptation of alpine plants on the Qinghai-Tibet Plateau: Editorial. J. Syst. Evol. 2014, 52, 241–249. [Google Scholar] [CrossRef]
  51. Dong, S.; Tang, L.; Zhang, X.; Liu, S.; Liu, Q.; Su, X.; Zhang, Y.; Wu, X.; Zhao, Z.; Li, Y.; et al. Relationship between plant species diversity and functional diversity in alpine grasslands. Acta Ecol. Sin. 2017, 37, 1472–1483. [Google Scholar]
  52. Di, Y.; Zhang, Y.; Zeng, H.; Tang, Z. Effects of Changed Asian Water Tower on Tibetan Plateau Ecosystem; A Review. Bull. Chin. Acad. Sci. 2019, 34, 1322–1331. [Google Scholar]
  53. Lan, X.; Ye, C.; Wang, Y.; Zeng, T.; Sun, J. Spatiotemporal Variation Characteristics and Its Driving Forces of Water Conservation Function on the Tibetan Plateau from 1995 to 2014. Acta Agrestia Sin. 2021, 29, 80–92. [Google Scholar]
  54. Xiao, Y.; Xie, G.; An, K. The function and economic value of soil conservation of ecosystems in Qinghai-Tibet Plateau. Acta Ecol. Sin. 2003, 23, 2367–2378. [Google Scholar]
  55. Diakoulaki, D.; Mavrotas, G.; Papayannakis, L. Determining objective weights in multiple criteria problems: The critic method. Comput. Oper. Res. 1995, 22, 763–770. [Google Scholar] [CrossRef]
  56. Sun, Y.; Tong, L. Spatio-temporal Coupling Relationship Between Development Strength and Eco-environment in the Restricted Development Zone of Northeast China. Sci. Geogr. Sin. 2021, 41, 684–694. [Google Scholar]
  57. Technical Specifications for the Evaluation of Ecological Environmental Conditions [For Trial Implementation] Issued by the State Envi-ronmental Protection Administration [HJ/T192-2006]; China Environmental Press: Beijing, China, 2006.
  58. Khan, I.; Hou, F.; Zakari, A.; Irfan, M.; Ahmad, M. Links among energy intensity, non-linear financial development, and environmental sustainability: New evidence from Asia Pacific Economic Cooperation countries. J. Clean. Prod. 2022, 330, 129747. [Google Scholar] [CrossRef]
  59. Gong, S.; Xiao, Y.; Zheng, H.; Xiao, Y.; Ouyang, Z. Spatial patterns of ecosystem water conservation in China and its impact factors analysis. Acta Ecol. Sin. 2017, 37, 2455–2462. [Google Scholar]
  60. Wu, C.; Cao, G.; Chen, K.; Ba, D.; Liu, B.; Wang, R.; Shi, Y.E.C. Spatio-temporal Variation in Soil Conservation Service and Its Influencing Factors in the upper Reaches of the Yellow River. J. Soil Water Conserv. 2022, 36, 143–150. [Google Scholar] [CrossRef]
  61. Gao, F.; Lv, K.; Qiao, Z.; Ma, F.; Jiang, O. Assessment and prediction of carbon neutrality in the eastern margin ecotone of Qinghai-Tibet Plateau. Acta Ecol. Sin. 2022, 42, 9442–9455. [Google Scholar]
  62. Wang, L.; Wang, X.; Fang, H.; Liang, T.; Pei, Z. Coupling relationship between resource environment and social economy development in typical regions of Qinghai-Tibet Plateau. Acta Sci. Circumstantiae 2021, 41, 2510–2518. [Google Scholar]
  63. Chen, J.; Ma, R.; Li, J.; Zhang, W. Study on Spatial Agglomeration and Industrial Correlation of Productive Service Industries in Plateau Areas—A Case Study of the Tibet Autonomous Region. Sci. Technol. Dev. 2022, 18, 589–596. [Google Scholar]
  64. Wang, H.; Yang, Q.; Guo, S.; Dan, Z.; Ciren, D. Monitoring on spatial-temporal vegetation dynamics based on Landsat time series. Bull. Surv. Mapp. 2020, 11, 7–12, 38. [Google Scholar]
  65. Chen, J.; Zhang, W.; Ma, R.; Liu, L.; Sheng, Y.; Wang, W.; Li, J.; Xu, L. Dataset of spatio-temporal Changes of Enterprises in Tibet Autonomous Region (2010–2020). Digit. J. Glob. Chang. Data Repos. 2022. [Google Scholar] [CrossRef]
  66. Liu, L.; Zhang, W.; Ma, R.; Li, J. Spatial-temporal Distribution Dataset of Qinghai-Tibet Agriculture and Animal Husbandry Enterprises (2011–2021). Digit. J. Glob. Chang. Data Repos. 2022, 6, 590–596. [Google Scholar] [CrossRef]
Figure 1. Analytical framework. Note: in Figure 1, (1)–(11) are the serial numbers of formulas in the paper in Section 3.
Land 12 02103 g001
Figure 2. Scope of the research area. Note: all maps in this paper are based on standard map GS (2022) 4312 from the standard map service website of the Ministry of Natural Resources, with no modifications made to the base map boundaries.
Land 12 02103 g002
Figure 3. Qinghai–Xizang Plateau regional development intensity index. 1. Aba Tibetan and Qiang Autonomous Prefecture; 2. Bayingol Mongolian Autonomous Prefecture; 3. Changdu City; 4. Diqing Tibetan Autonomous Prefecture; 5. Gannan Tibetan Autonomous Prefecture; 6. Ganzi Tibetan Autonomous Prefecture; 7. Guoluo Tibetan Autonomous Prefecture; 8. Haibei Tibetan Autonomous Prefecture; 9. Haidong City; 10. Hainan Tibetan Autonomous Prefecture; 11. Haixi Mongolian and Tibetan Autonomous Prefecture; 12. Hotan Prefecture; 13. Huangnan Tibetan Autonomous Prefecture; 14. Jiuquan City; 15. Kashgar Prefecture; 16. Kizilsu Kirgiz Autonomous Prefecture; 17. Lhasa City; 18. Liangshan Yi Autonomous Prefecture; 19. Lijiang City; 20. Naqu City; 21. Ngari Prefecture; 22. Nujiang Lisu Autonomous Prefecture; 23. Nyingchi City; 24. Rikaze City; 25. Shannan City; 26. Xining City; 27. Yushu Tibetan Autonomous Prefecture; and 28. Zhangye City.
Land 12 02103 g003
Figure 4. Spatial differentiation of regional development intensity on the Qinghai–Xizang Plateau.
Land 12 02103 g004
Figure 5. Ecological security index of Qinghai–Xizang plateau. 1. Aba Tibetan and Qiang Autonomous Prefecture; 2. Bayingol Mongolian Autonomous Prefecture; 3. Changdu City; 4. Diqing Tibetan Autonomous Prefecture; 5. Gannan Tibetan Autonomous Prefecture; 6. Ganzi Tibetan Autono-mous Prefecture; 7. Guoluo Tibetan Autonomous Prefecture; 8. Haibei Tibetan Autonomous Prefecture; 9.Haidong City; 10. Hainan Tibetan Autonomous Prefecture; 11. Haixi Mongolian and Tibetan Autonomous Prefecture; 12. Hotan Prefecture; 13. Huangnan Tibetan Autonomous Prefecture; 14. Jiuquan City; 15. Kashgar Prefecture; 16. Ki-zilsu Kirgiz Autonomous Prefecture; 17. Lhasa City; 18. Liangshan Yi Autonomous Prefecture; 19. Lijiang City; 20. Naqu City; 21. Ngari Prefecture; 22. Nujiang Lisu Autonomous Prefecture; 23. Nyingchi City; 24. Rikaze City; 25. Shannan City; 26. Xining City; 27. Yushu Tibetan Autonomous Prefecture; and 28. Zhangye City.
Land 12 02103 g005
Figure 6. Growth types of ecological security index on the Qinghai–Xizang Plateau.
Land 12 02103 g006
Figure 7. Spatial variation in ecological security index on the Qinghai–Xizang Plateau.
Land 12 02103 g007
Figure 8. Variation in coupling degree between regional development intensity and ecological security on the Qinghai–Xizang Plateau. 1. Aba Tibetan and Qiang Autonomous Prefecture; 2. Bayingol Mongolian Autonomous Prefecture; 3. Changdu City; 4. Diqing Tibetan Autonomous Prefecture; 5. Gannan Tibetan Autonomous Prefecture; 6. Ganzi Tibetan Autono-mous Prefecture; 7. Guoluo Tibetan Autonomous Prefecture; 8. Haibei Tibetan Autonomous Prefecture; 9.Haidong City; 10. Hainan Tibetan Autonomous Prefecture; 11. Haixi Mongolian and Tibetan Autonomous Prefecture; 12. Hotan Prefecture; 13. Huangnan Tibetan Autonomous Prefecture; 14. Jiuquan City; 15. Kashgar Prefecture; 16. Ki-zilsu Kirgiz Autonomous Prefecture; 17. Lhasa City; 18. Liangshan Yi Autonomous Prefecture; 19. Lijiang City; 20. Naqu City; 21. Ngari Prefecture; 22. Nujiang Lisu Autonomous Prefecture; 23. Nyingchi City; 24. Rikaze City; 25. Shannan City; 26. Xining City; 27. Yushu Tibetan Autonomous Prefecture; and 28. Zhangye City.
Land 12 02103 g008
Figure 9. Spatio-temporal pattern of coupling degree between regional development intensity and ecological security on the Qinghai–Xizang Plateau.
Land 12 02103 g009
Figure 10. Classification of coupling degree between regional development intensity and ecological security on the Qinghai–Xizang Plateau.
Land 12 02103 g010
Table 1. Data sources.
DataResolutionSource
LUCC30 mCLCD of Wuhan University (80% overall accuracy)
Average annual precipitation1 kmNational Earth System Science Data Center (http://www.geodata.cn/, accessed on 1 July 2023)
Potential evaporationValueBased on data from existing studies in the literature
Depth of root restriction layer1 kmBased on data from existing studies in the literature
Soil effective water content1 kmBased on the ISRIC global dataset to measure
NDVI1 kmNational Aeronautics and Space Administration (https://modis.gsfc.nasa.gov/data/dataprod/mod13.php, accessed on 1 July 2023)
DEM250 mGeospatial Data Cloud (http://www.gscloud.cn/, accessed on 1 July 2023)
Soil texture1 kmNational Cryosphere Desert Data Center (http://www.ncdc.ac.cn/portal/, accessed on 1 July 2023)
NPP500 mNational Aeronautics and Space Administration (https://modis.gsfc.nasa.gov/data/dataprod/mod17.php, accessed on 1 July 2023)
Night light index1 kmNational Oceanic and Atmospheric Administration (https://www.ngdc.noaa.gov, accessed on 1 July 2023)
Note: LUCC: land-use and land-cover; NDVI: normalized difference vegetation index; DEM: digital elevation model; and NPP: net primary productivity.
Table 2. Regional development intensity index system of Qinghai–Xizang Plateau.
Target LayerElement LayerIndicator LayerWeights
Regional development intensity of the Qinghai–Xizang PlateauPopulation expansionRegional population density0.11819
Urbanization rate0.20263
Economic development intensityRegional economic density0.20761
The ratio of non-agricultural industries0.15882
Land development intensityNight light index0.15362
Human activity intensity0.15362
Table 3. Ecological security assessment index system of Qinghai–Xizang Plateau.
Target LayerElement LayerIndicator LayerWeights
Ecological Security Assessment of the Qinghai–Xizang PlateauBiodiversityBiological abundance index0.38312
Water conservationWater conservation index0.16718
Soil conservationSoil conservation index0.19159
Carbon sinkAmount of carbon sink0.25811
Table 4. Type division of coupling degree between regional development intensity and ecological security.
TypeCoupling
Coordination (D)
SubtypeRelative Size of U1 and U2
Severe imbalance0.0 ≤ D ≤ 0.2U2− U1 > 0.1Severe imbalance, regional development lagging behind
U1− U2 > 0.1Severe imbalance, ecological security lagging behind
0 ≤ |U1 − U2| ≤ 0.1Severe imbalance
Mild imbalance0.2 < D ≤ 0.4U2− U1 > 0.1Mild imbalance, regional development lagging behind
U1− U2 > 0.1Mild imbalance, ecological security lagging behind
0 ≤ |U1 − U2| ≤ 0.1Mild imbalance
Mild coupling coordination0.4 < D ≤ 0.6U2− U1 > 0.1Mild coupling, regional development lagging behind
U1− U2 > 0.1Mild coupling, ecological security lagging behind
0 ≤ |U1 − U2| ≤ 0.1Mild coupling
Good coupling coordination0.6 < D ≤ 0.8U2− U1 > 0.1Mild coupling, regional development lagging behind
U1− U2 > 0.1Mild coupling, ecological security lagging behind
0 ≤ |U1−U2| ≤ 0.1Mild coupling
Excellent coupling coordinationD > 0.8U2− U1 > 0.1Excellent coupling, regional development lagging
U1− U2 > 0.1Excellent coupling, ecological security lagging behind
0 ≤ |U1 − U2| ≤ 0.1Excellent coupling
Disclaimer/Publisher’s Note: The statements, opinions and data contained in all publications are solely those of the individual author(s) and contributor(s) and not of MDPI and/or the editor(s). MDPI and/or the editor(s) disclaim responsibility for any injury to people or property resulting from any ideas, methods, instructions or products referred to in the content.

