Article

Response of Permafrost Thermal State to Global Climatic Change in Urbanised Landscapes, Yakutsk, Russia

by
Viktor V. Kunitsky
,
Igor I. Syromyatnikov
* and
Andrey V. Litovko
Melnikov Permafrost Institute of SB RAS, 677010 Yakutsk, Russia
*
Author to whom correspondence should be addressed.
Land 2022, 11(9), 1513; https://doi.org/10.3390/land11091513
Submission received: 25 April 2022 / Revised: 12 August 2022 / Accepted: 5 September 2022 / Published: 8 September 2022
(This article belongs to the Special Issue Permafrost Landscape Response to Global Change)

Abstract

:
A study was undertaken to investigate the structure and condition of urban permafrost in the city of Yakutsk. The response of permafrost to recent climate change was assessed for a Shergin Shaft site in a cryogenic landscape. The results indicate that the thickness of the active layer which consists of anthropogenic soils experienced no change during the second half of the 20th century and the early 21st century. However, the thermal state of the underlying alluvial sediments has changed significantly in response to the warming of the climate. The permafrost temperatures at a depth of 10 m increased by about 3 °C between 1934 and 2015.

1. Introduction

The thermal state of permafrost is determined by measuring ground temperatures in the layer of annual temperature fluctuations and characterizing their spatio-temporal variations in natural and developed environments.
In 2009, a group from the Melnikov Permafrost Institute, including the present authors, initiated long-term research to assess the response of urban permafrost soils to global climate change. The primary study area was selected as the downtown area of the Municipality of Yakutsk, which dates back to the 18th century. Meteorological records for Yakutsk show an increase in mean annual air temperature by 3 °C between 1966 and 2009 [1,2]. Recent changes in the climate are indicated by other parameters as well. In particular, minimum air temperature in the winter 2009–2010 was about 8° higher than in the winter 1966–1967, and in the winter 2008–2009, the minimum was about −47 °C [3]. Earlier dates of daily temperature above 0 °C, a trend attributed to global warming, have resulted in the lengthening of the thawing season in Yakutsk from 155 days in 1953 to 170 days in 2012 [4].
Changes in the physical and thermal condition of the active layer and upper permafrost in response to global warming are a matter of concern for urban areas. In recent years, several studies have been published on the issue [5,6,7,8,9,10,11,12,13]. They have focused primarily on the thermal regime of frozen ground and the bearing capacity of foundations under global climate warming.
The purpose of this paper is to examine the permafrost response in a representative urban landscape in the city of Yakutsk by incorporating the historical data that were re-evaluated from the Russian literature, in addition to present-day observations.

2. Materials and Methods

According to the Permafrost-Landscape Map of Yakutia [14], Yakutsk lies within the Lena–Amga Alas Province of Central Siberia, which is characterized by the widespread occurrence of alases. However, the city itself is situated in the Lena River valley with the landscape consisting of a floodplain and low fluvial terraces. The Yakutsk area borders the Pre-Lena Plateau which consists of three landscape units: flat summits, hillslopes and small valleys [15]. The water-divide area between the Kenkeme and Lena Rivers contains alas and inter-alas landscapes. The diversity of the landscapes determines the strong variability of permafrost conditions in the vicinity of Yakutsk.
The extremely continental climate, low mean annual air temperatures and low annual precipitation determine the current state of permafrost in the region. The Late Pleistocene and Holocene paleoenvironments were also inherently related with permafrost, subjected to repeated cycles of warming and cooling. For example, climate warming during the Holocene thermal maximum (8–5 kyr BP) triggered intensive thermokarst activity, forming most of the alases seen in the Lena–Amga Province today. This warm interval was followed by a significantly colder period analogous to the present-day climate of the northern woodland zone. Such alternations of cold and warm periods accompanied the development of landscapes in the past and occur in the modern epoch.
Permafrost is closely related to the history of landscape evolution and is a good representation of the current landscape conditions. While permafrost in the Pre-Lena Plateau is generally 400 m or more thick, permafrost thicknesses vary in the river terraces where Yakutsk is located, from 100–250 m in the southern part of the Tuymaada Valley to 250–400 m in the north [16]. The thickness of permafrost is 50–100 m in the high floodplain and islands and less than 25 m in the low floodplain.
Permafrost is encountered nearly everywhere in Yakutsk, occupying over 80% of its total area [16]. The greatest thickness of permafrost is 400 m, where the typical plateau conditions are present. The permafrost bottom gradually rises from southwest to northeast as one moves from the Uordakh Farm to the town of Kangalassy, where it lies at about 200 m near an open talik beneath the Lena River channel [17]. Drilling data indicate that the permafrost bottom does not extend below Mesozoic rocks. Permafrost thicknesses and temperatures for selected sites in the study area are presented in Table 1.
According to Soloviev’s map [16], the active-layer thickness (ALT) in frozen sands of the Lena River floodplain and fill terraces within the Yakutsk area is 4 m (Table 2).
The active-layer thickness is defined as the maximum depth of thaw by the end of summer (late August–September). ALT at any given site varies interannually depending on meteorological conditions.
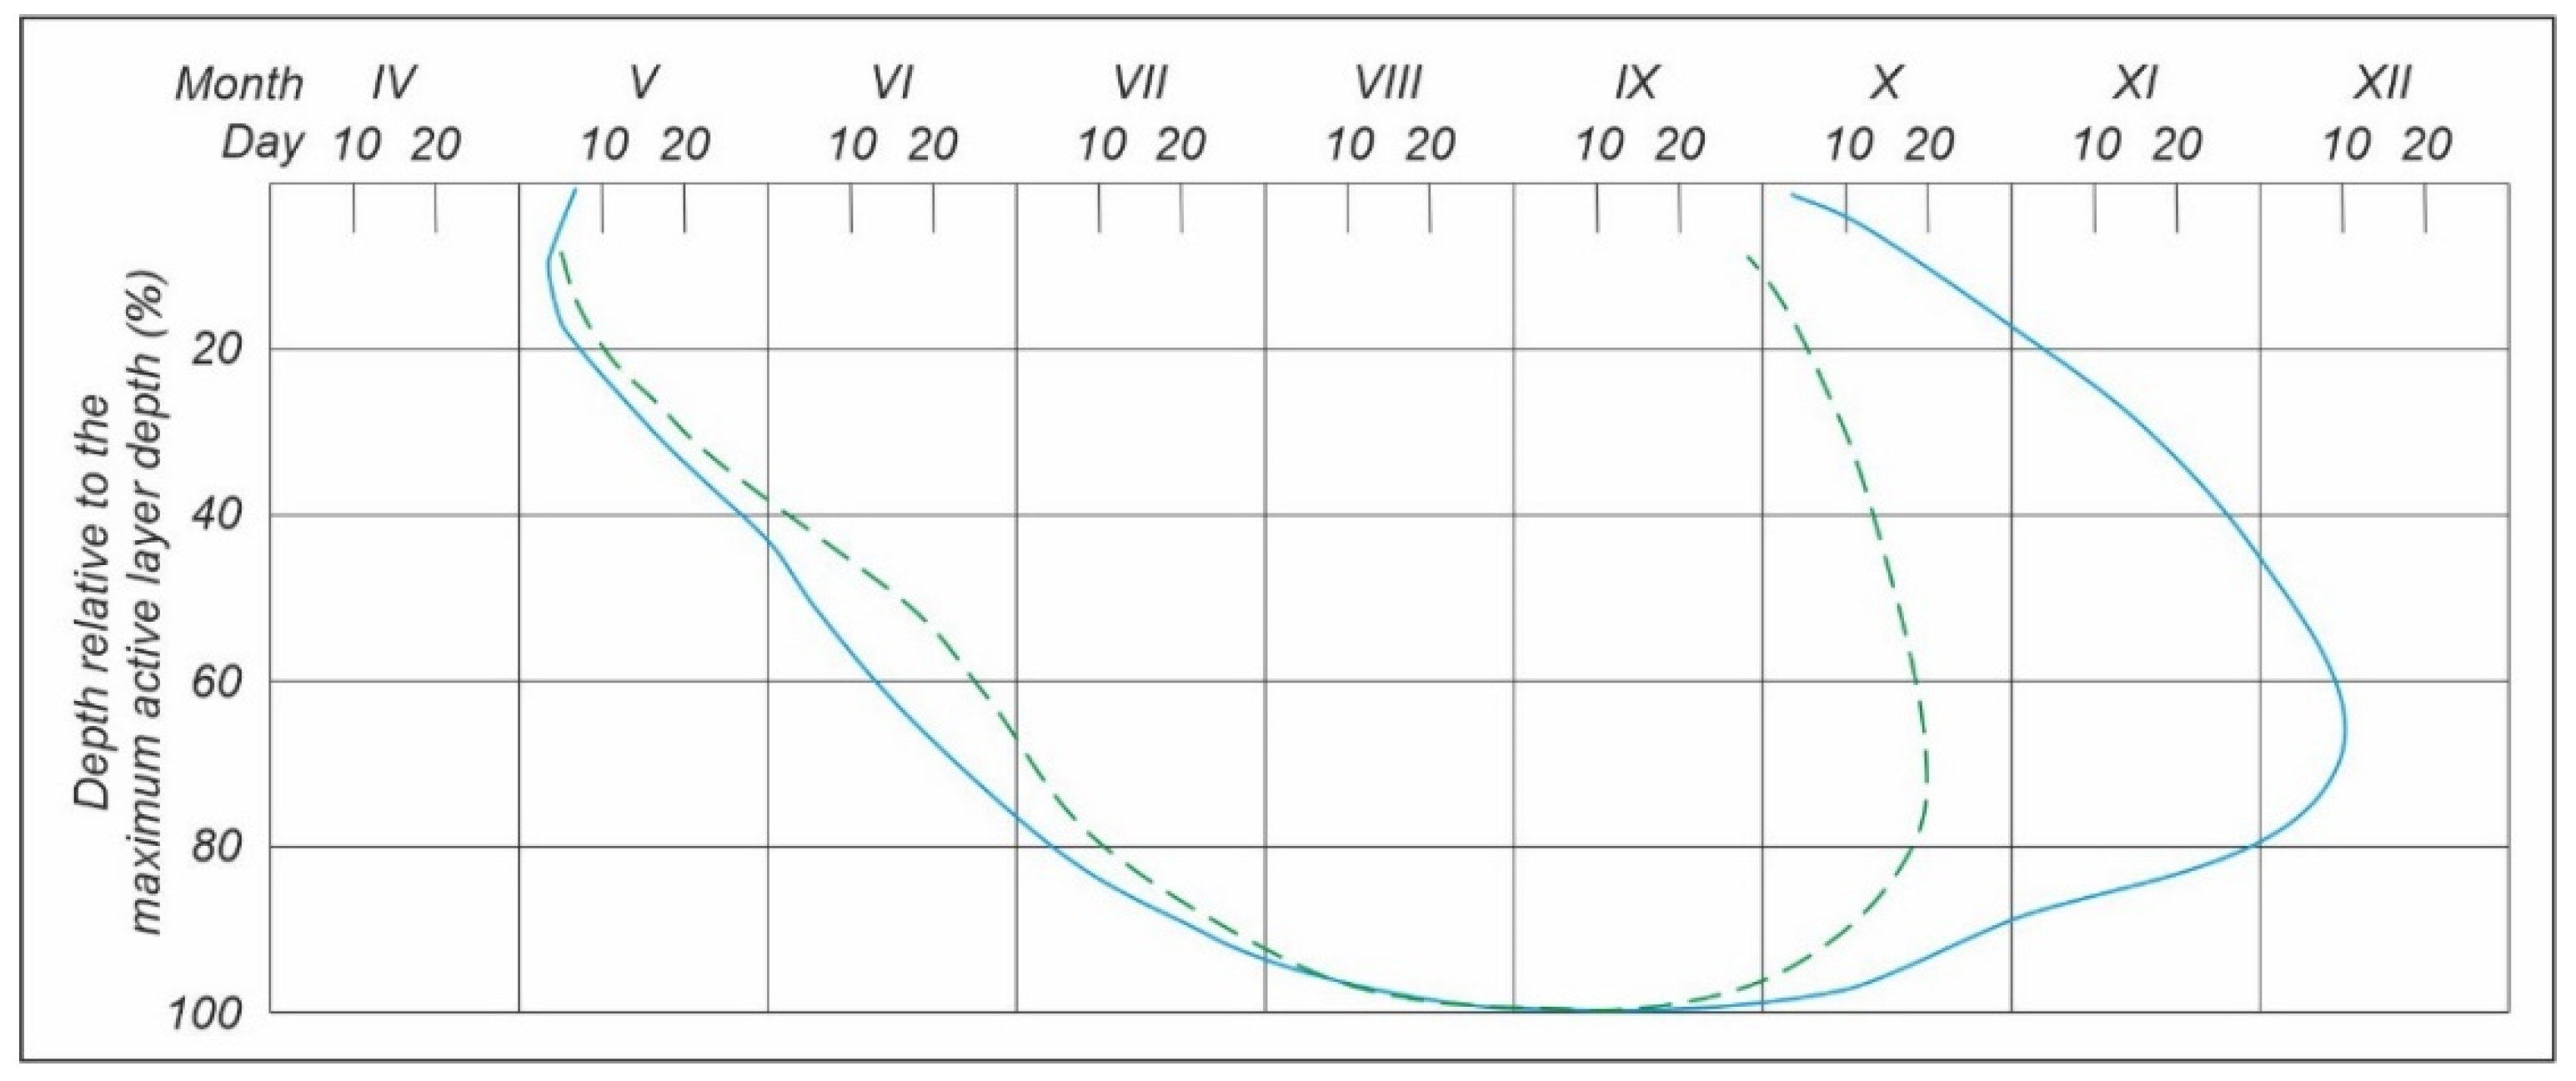
Soil freezing-thawing curves provide insight into thaw depth progression, defined as the percentage of maximum end-of-season thickness, as well as the course of soil refreezing in open areas (outside buildings). Such curves, averaged for some soil types characteristic of the study area, are shown in Figure 1.
The active layer and upper permafrost experience annual temperature cycles. The depth of annual wave penetration varies considerably from site to site, depending on sedimentary facies. Lukin’s data [21] indicate that the depth of zero annual amplitude at the Shergin Shaft site occurs at 19 m, below which the permafrost temperature does not change during the year.
The history of Yakutsk spans more than three and a half centuries. Most of the city occupies the first and second low terraces of the Lena River, with elevations ranging from 95 to 100 m. Surficial materials consist of ice-rich lacustrine and alluvial sands and silts, up 20–22 m in thickness, which present difficult ground conditions for foundation engineering. For most of its history, Yakutsk was built using wood as a primary construction material. Intensive masonry construction began only in the mid-20th century. Foundation designs for multi-story masonry buildings have been based on the principle of preserving the underlying permafrost. Practice has proven the overall feasibility of this approach.
Large-scale ground temperature measurements in Yakutsk were initiated in the mid-20th century, i.e., when the city mainly consisted of wooden buildings [22,23,24]. The data showed lower permafrost temperatures in the urban area compared to the surrounding areas.
In the late 16th–early 17th century, the climate of Central Yakutia was essentially similar to todays in its main parameters, such as air temperature, precipitation and snow cover [25,26]. It can therefore be assumed that natural ground temperatures during the early period of Yakutsk were in the range of −3 to −4 °C.
Permafrost temperatures in Yakutsk were first measured in the 1840s, along the shaft of a 116.4 m well dug by F. Shergin. At a 10 m depth, the measured temperature was about −9 °C, significantly colder than in undeveloped areas. Later measurements in the Shergin Shaft conducted by the Yakutsk permafrost station of the Obruchev Permafrost Institute showed a temperature of −8.1 °C at this depth, suggesting some natural cooling of its walls after digging due to convective transfer of the cold air into the well shaft during the winter. Subsequent investigations of the temperature field in downtown Yakutsk definitively demonstrated that the mean annual ground temperature could never have been colder than −8 °C at this site [19,21].
In the 1930s–1950s, extensive programs of borehole temperature measurements were undertaken. The developed areas were found to have significantly colder permafrost compared to the surrounding undisturbed areas. Ground temperatures were between −6 and −8.1 °C in the old neighbourhood, while in the suburbs they ranged from −2 °C in open sites to −3 °C in forest stands. Based on these data, Soloviev [18] concluded that wooden housing and the past lifestyle contributed to the significant cooling of the upper permafrost. He also shared Melnikov’s opinion [27] that future building densification and municipal infrastructure development would lead to warmer ground temperatures in the city.
The transition from detached wooden houses to multi-apartment masonry buildings had a number of important implications, which were primarily associated with the introduction of district heating and water-supply systems and the construction of municipal sewer mains. Heating pipes were generally elevated or laid on the ground surface, while other utilities, including communication and electric power cables, were buried in the ground. The sewage mains placed beneath the major streets had a design capacity which was exceeded as the city grew. The inadequate capacity, along with the presence of ice-rich permafrost and the absence of ground slope, resulted in frequent sewer failures.
Underground leaks from poor joints and pipe cracks in the deteriorating sewer system led to contamination of the soils with aggressive chemicals. Sewer overflows into the ground surface result in the build-up of icings beneath the buildings, which modify the thermal regime of the supporting frozen foundation.
The central part of Yakutsk is now a heavily urbanised area with a dense network of underground utilities lying relatively deep (up to 8–10 m). Frequent failures of the heat and water utilities are the main cause for disturbance of the physical and chemical properties of the foundation soils.
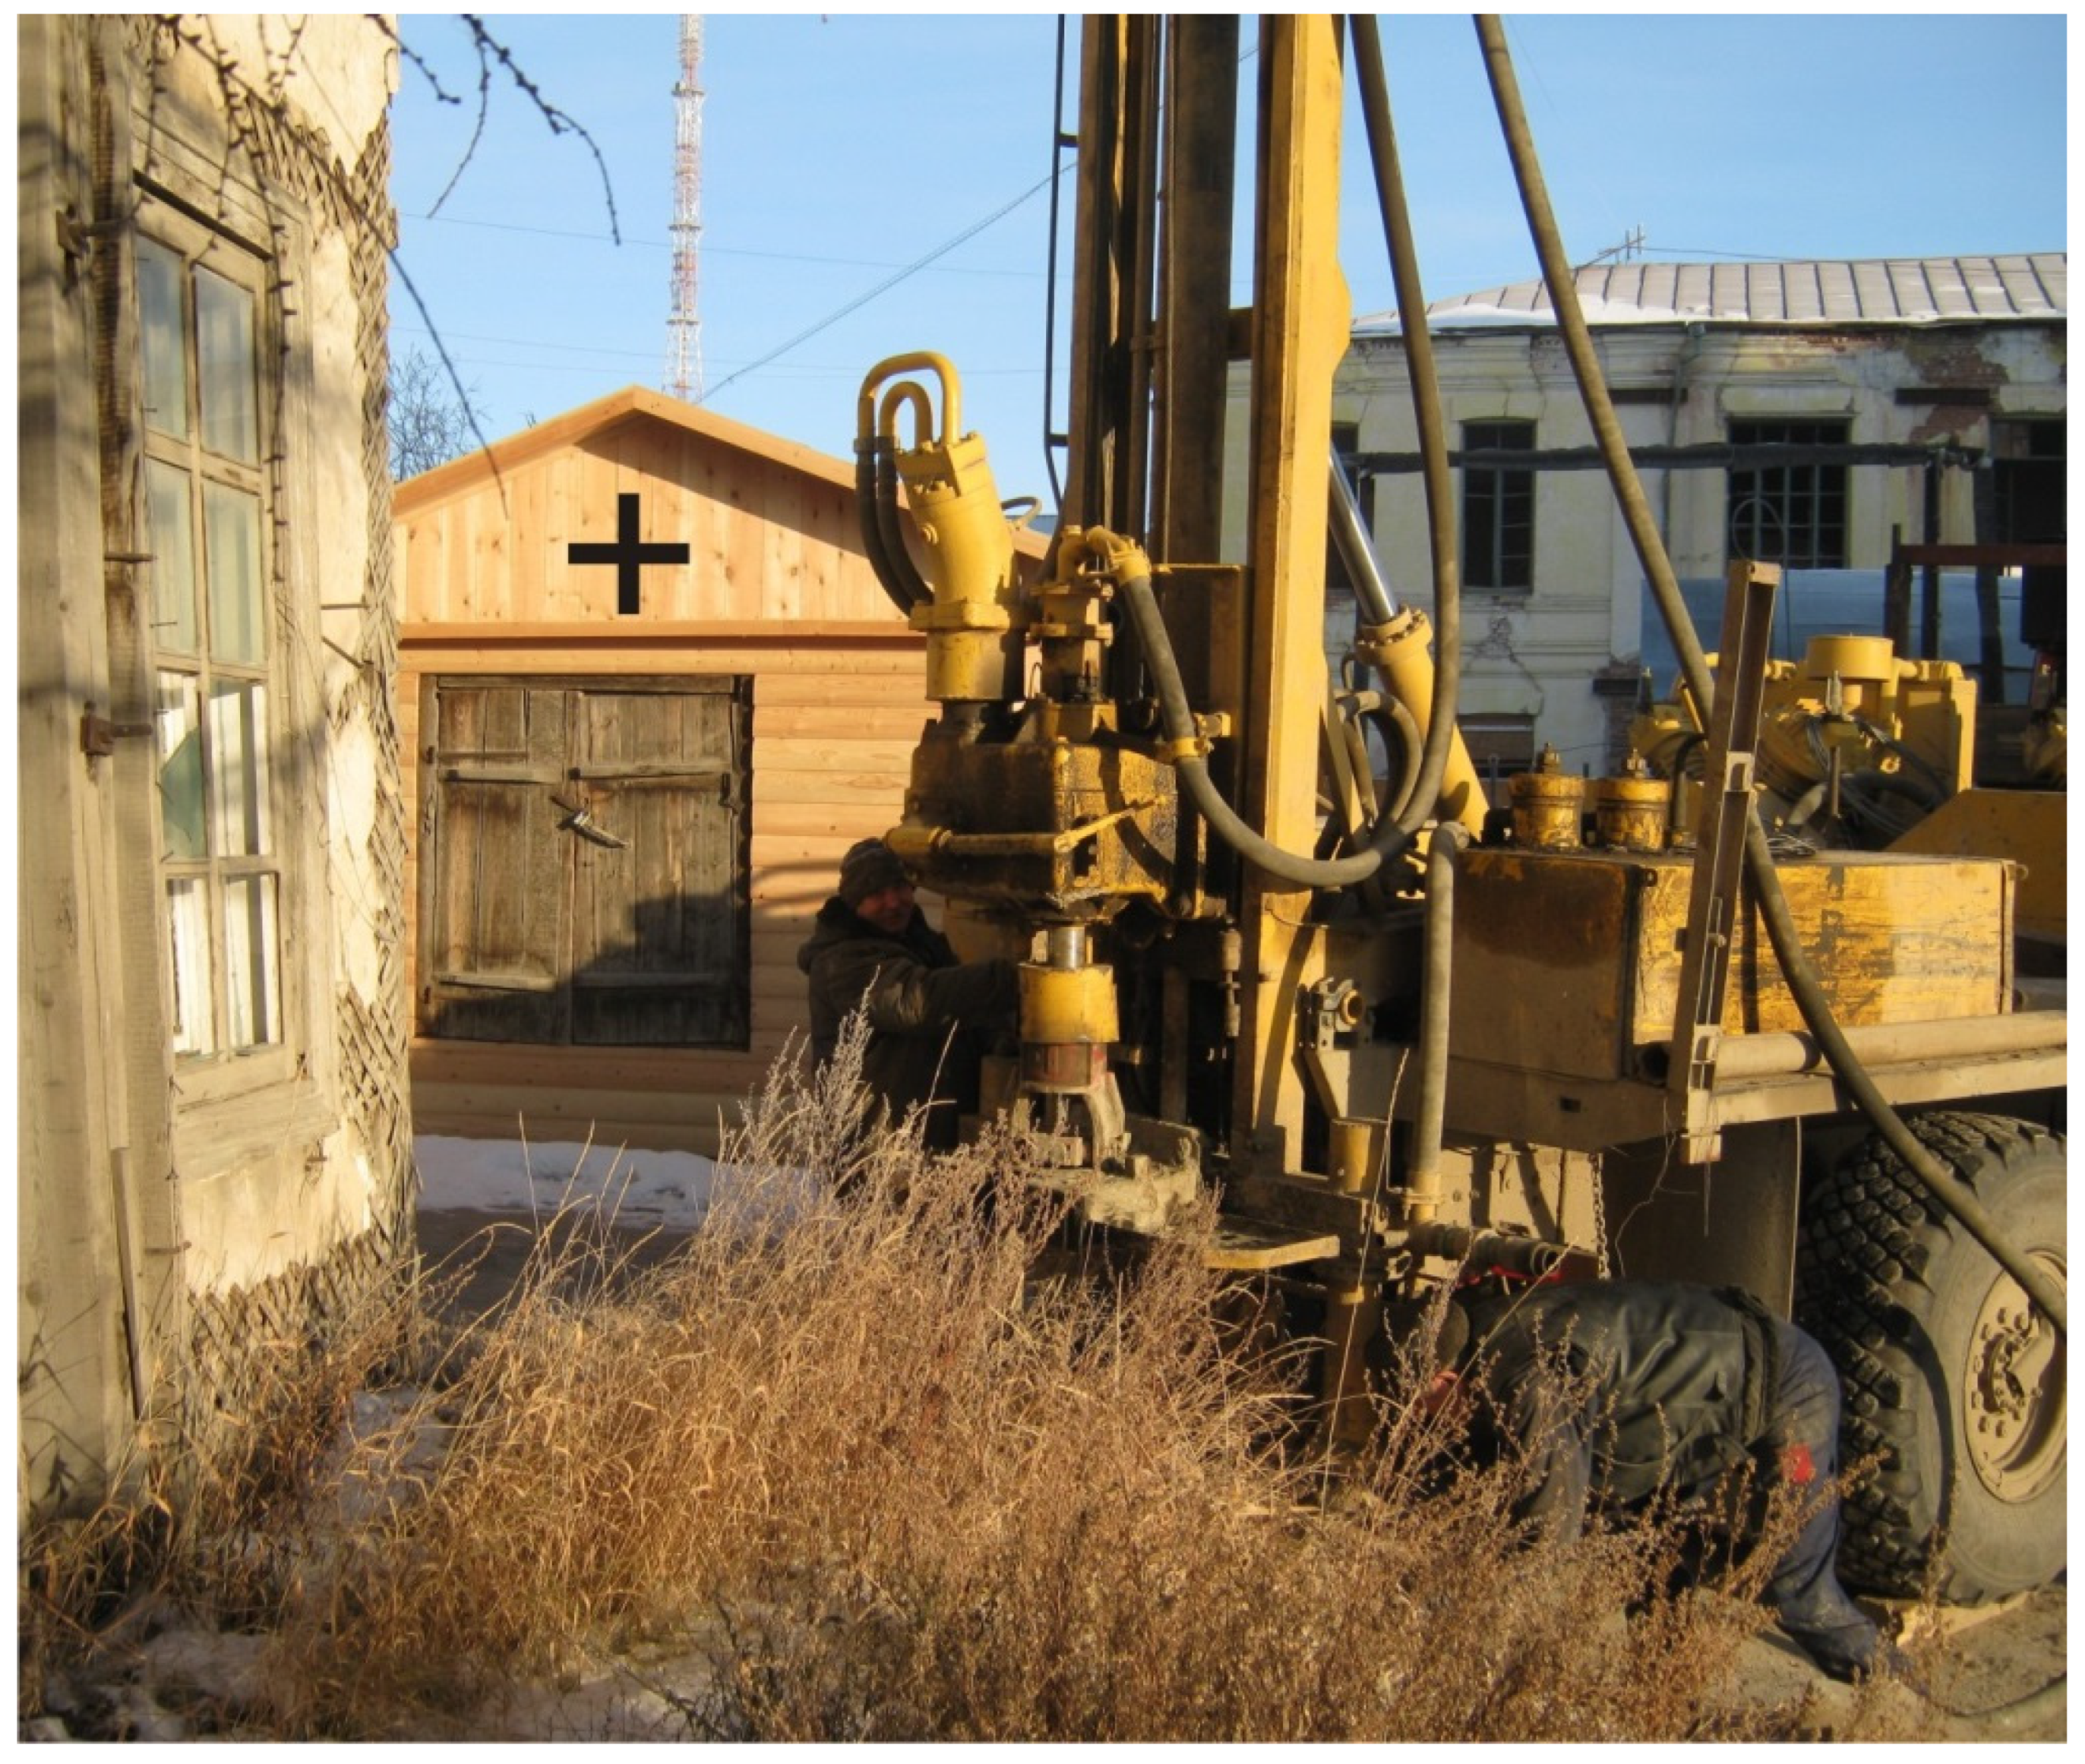
Conventional methods of geocryology were used to study the structure and condition of permafrost soils in the Municipality of Yakutsk. The main method was geocryological monitoring. The monitoring network established in Yakutsk consisted of 65 sites with a borehole drilled at each site. The drilling was performed during different seasons in 2009–2011 using the “dry” method and coaxial casing. In addition to the outer casing with a steel pipe, a plastic tube was placed in the borehole. The lower end of the plastic tube was sealed, and the upper part protruded 0.4–0.6 m above the ground surface. The plastic tube had an inner diameter of about 4 cm and housed thermistors, temperature data loggers and other measuring instruments.
Most boreholes of the monitoring network were 10–11 m deep, although some were 30 m in depth.
Information on stratigraphy was collected during drilling at each site and core samples were obtained at selected intervals for laboratory determinations. All analyses were conducted in the laboratories of the Melnikov Permafrost Institute using standard methods of soil engineering, engineering geology and lithology.
Repeated temperature measurements in the boreholes were conducted with different frequencies during the monitoring period. In 2009–2013, the frequency of measurements was once monthly. In 2014–2015, measurements were made once every three months at some sites and once monthly at others.
The landscape setting of each monitoring site was determined during drilling. Detailed surveys were conducted during site visits to collect information on permafrost-related surface features and to document natural and anthropogenic changes in topography and drainage conditions. In addition, snow depth and seasonal soil thaw/freeze depths were measured.
The monitoring observations conducted in 2009–2015 provided new information on the permafrost of Yakutsk. The monitoring data were compared with the results of earlier investigations, both published [21,22,23,28,29,30] and unpublished. The primary source of information used in the comparison was a two-volume geocryological database compiled under the guidance of Petr A. Soloviev. This database titled “The Inventory of Pre-1965 Boreholes and Test Pits in Yakutsk” [31] is held in the Melnikov Permafrost Institute’s collection of unpublished materials.
Active layer thicknesses, i.e., the maximum depths of seasonal thaw, were estimated based on the percentage thaw and freeze progression curves obtained at a test site in Yakutsk [18], with consideration for soil genesis.

3. Results

The site under discussion is located in District B, the old downtown area of Yakutsk. In landscape terms, it represents an urbanised permafrost landscape on the first fill terrace of the middle Lena River. The ground surface is nearly level, with an elevation of about 12 m above low water. The first buildings in this part of the city were constructed more than three centuries ago [24,28]. Today, District B is a residential and commercial area, with wooden and masonry buildings occupying 40% of its surface.
On Melnikov’s geocryological map of Yakutsk [22], District B is shown to lie within geothermal zone I, with the permafrost temperature at 10 m of −6 °C and the active-layer thickness of 1.6 to 1.8 m.
The site is of special interest because of the well-known Shergin Shaft located here. In 1827–1837, merchant Fedor Shergin undertook an attempt to dig a well for water near an oxbow lake (Figure 2). This endeavour attracted widespread attention, not only for its depth (116 m), but because it provided solid evidence for the existence of perennially frozen ground in interior Siberia. This irrefutable evidence came from multi-year measurements showing that the alluvial sediments (predominantly sand cemented by pore ice) and underlying Jurassic sandstone penetrated by the well had subzero temperatures.
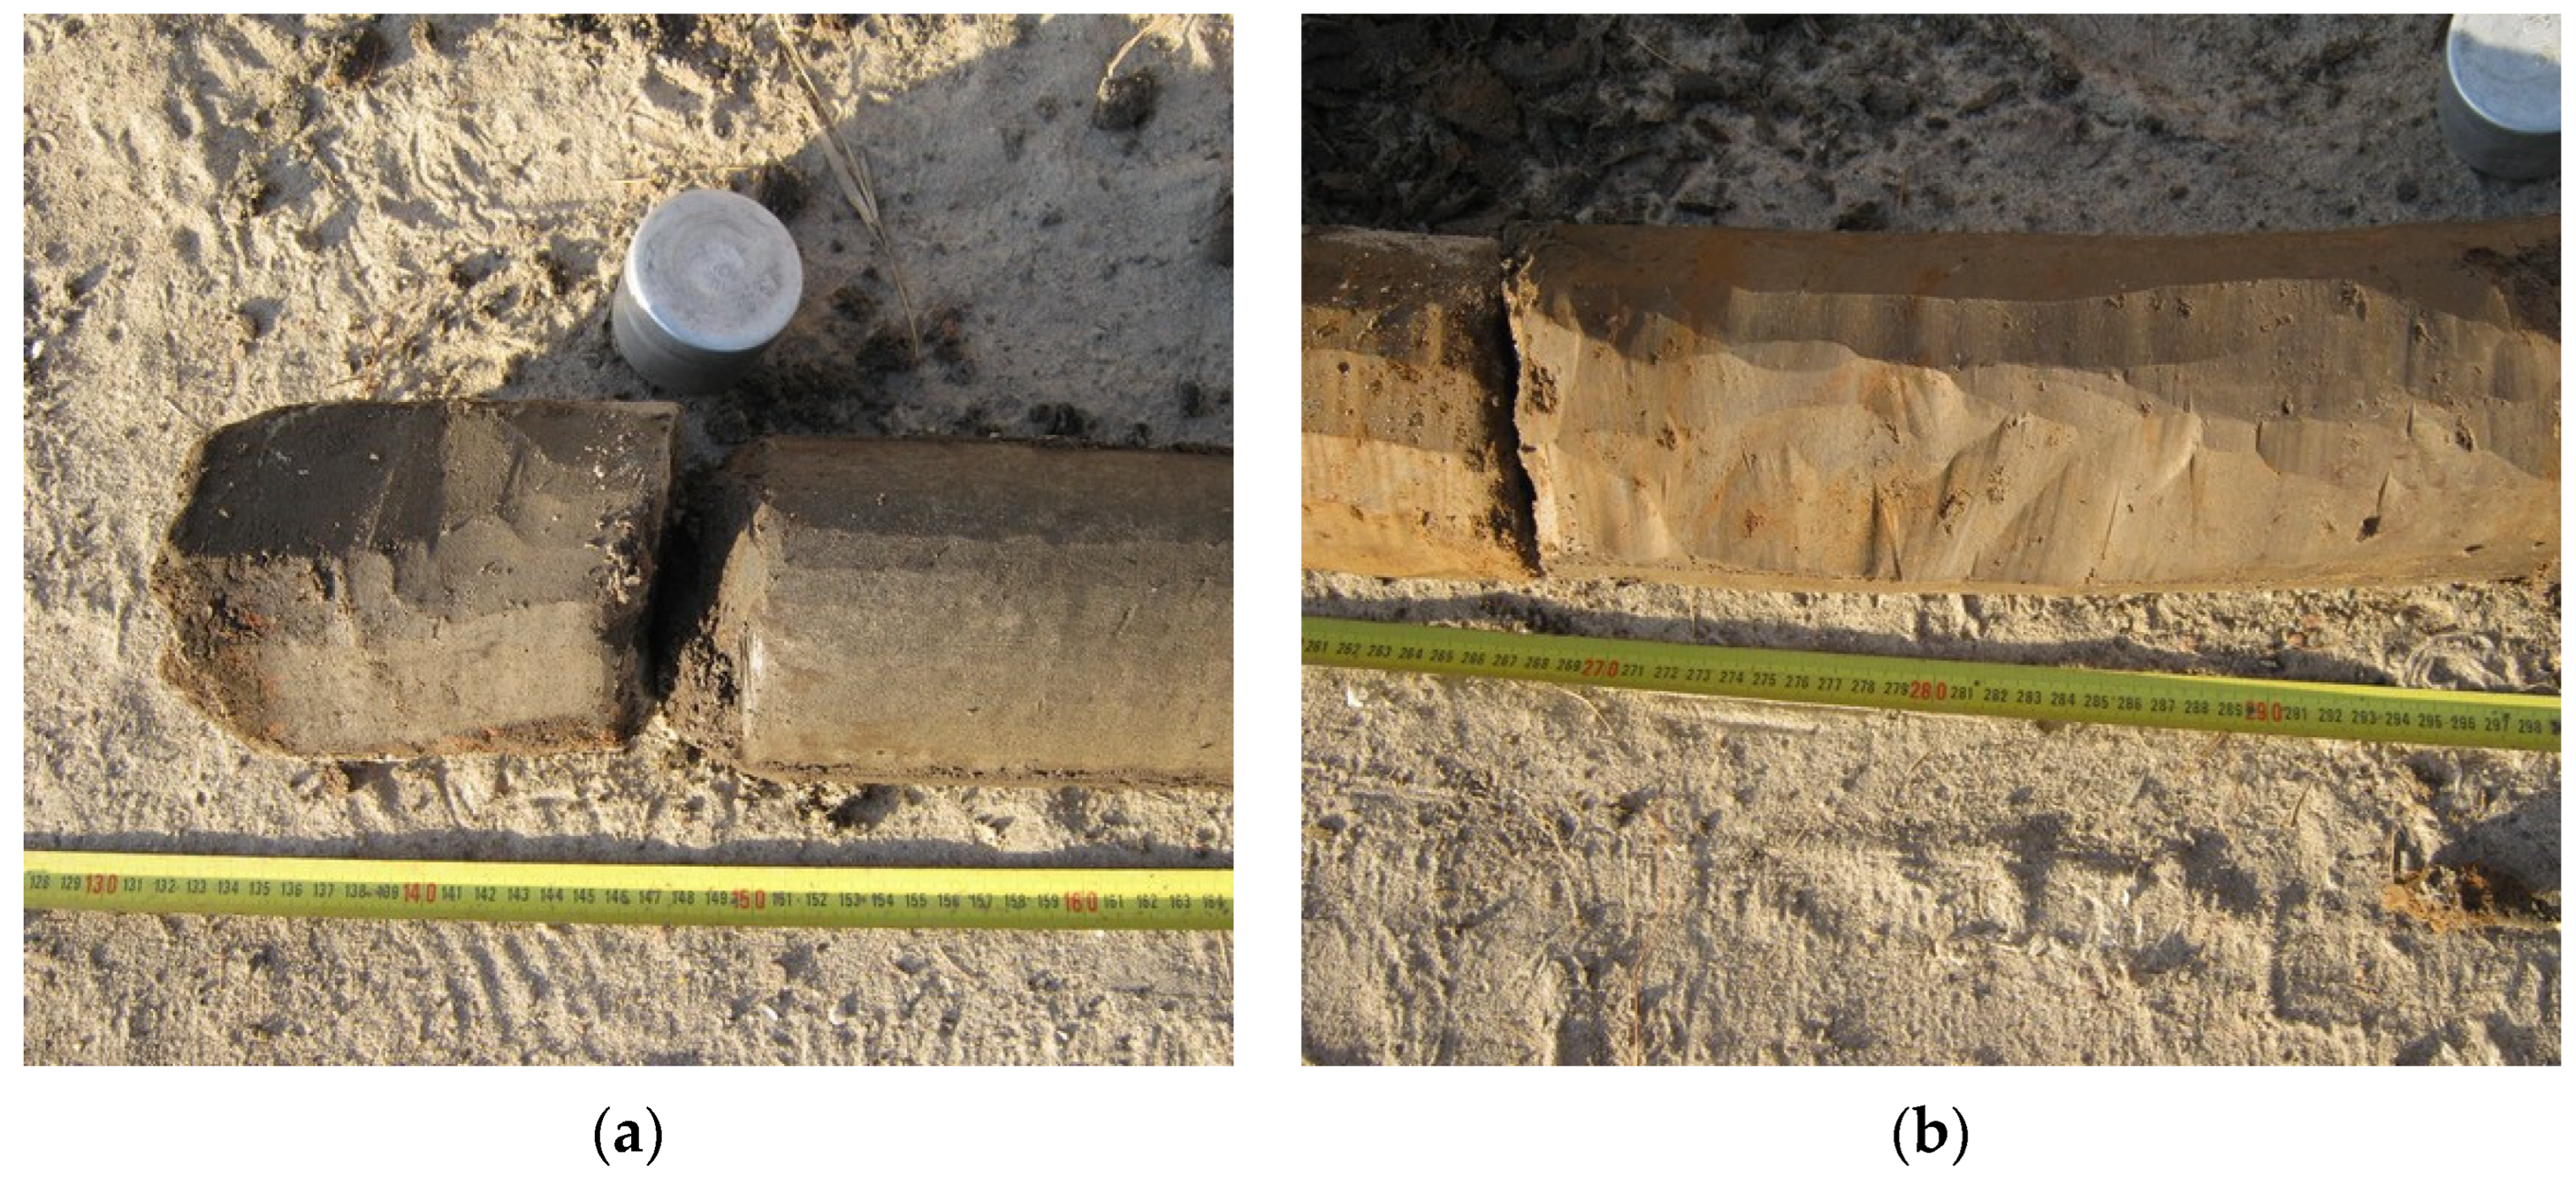
A somewhat different stratigraphy was obtained by the present authors based on the core from borehole #60 (Figure 3). The borehole was drilled by the Melnikov Permafrost Institute in October 2010 in the immediate vicinity of the Shergin Shaft. The subsurface conditions determined from the borehole core are presented in Table 3.
Geothermal observations in borehole # 60 were conducted every three months in 2011–2013 and in 2015. The results of borehole temperature measurements are given in Table 4.
Geothermal observations indicate the extreme complexity of the temperature field in the heavily urbanised areas of Yakutsk. Cryopegs, i.e., layers of unfrozen ground that is perennially cryotic (t < 0 °C), are known to exist at relatively shallow depths due to soil salinization [32]. Some sites show an increase in mean annual ground temperature relative the 1930–1950 values, while others show a decrease. Gryopeg temperatures in the old downtown are, on average, −3.9 °C (Table 5), which is generally within the accepted limit of design temperatures for the foundation engineering approach adopted for Yakutsk.
As is seen from Table 5, the highest ground temperatures at a 10 m depth were recorded in boreholes #3, 17 and 30. Boreholes #3 and 30 were located near buildings where the walls of ventilation crawl spaces were kept completely closed, thus providing no protection of the underlying ground against heat from the buildings. The high permafrost temperatures in borehole #17 were due to the warming effect of the sewer main located nearby. If we discard the temperature data from these boreholes with evident anthropogenic impacts, we can conclude that the mean annual permafrost temperature at a 10 m depth in the older part of Yakutsk varies between −3.0 and −5.7 °C.

4. Discussion

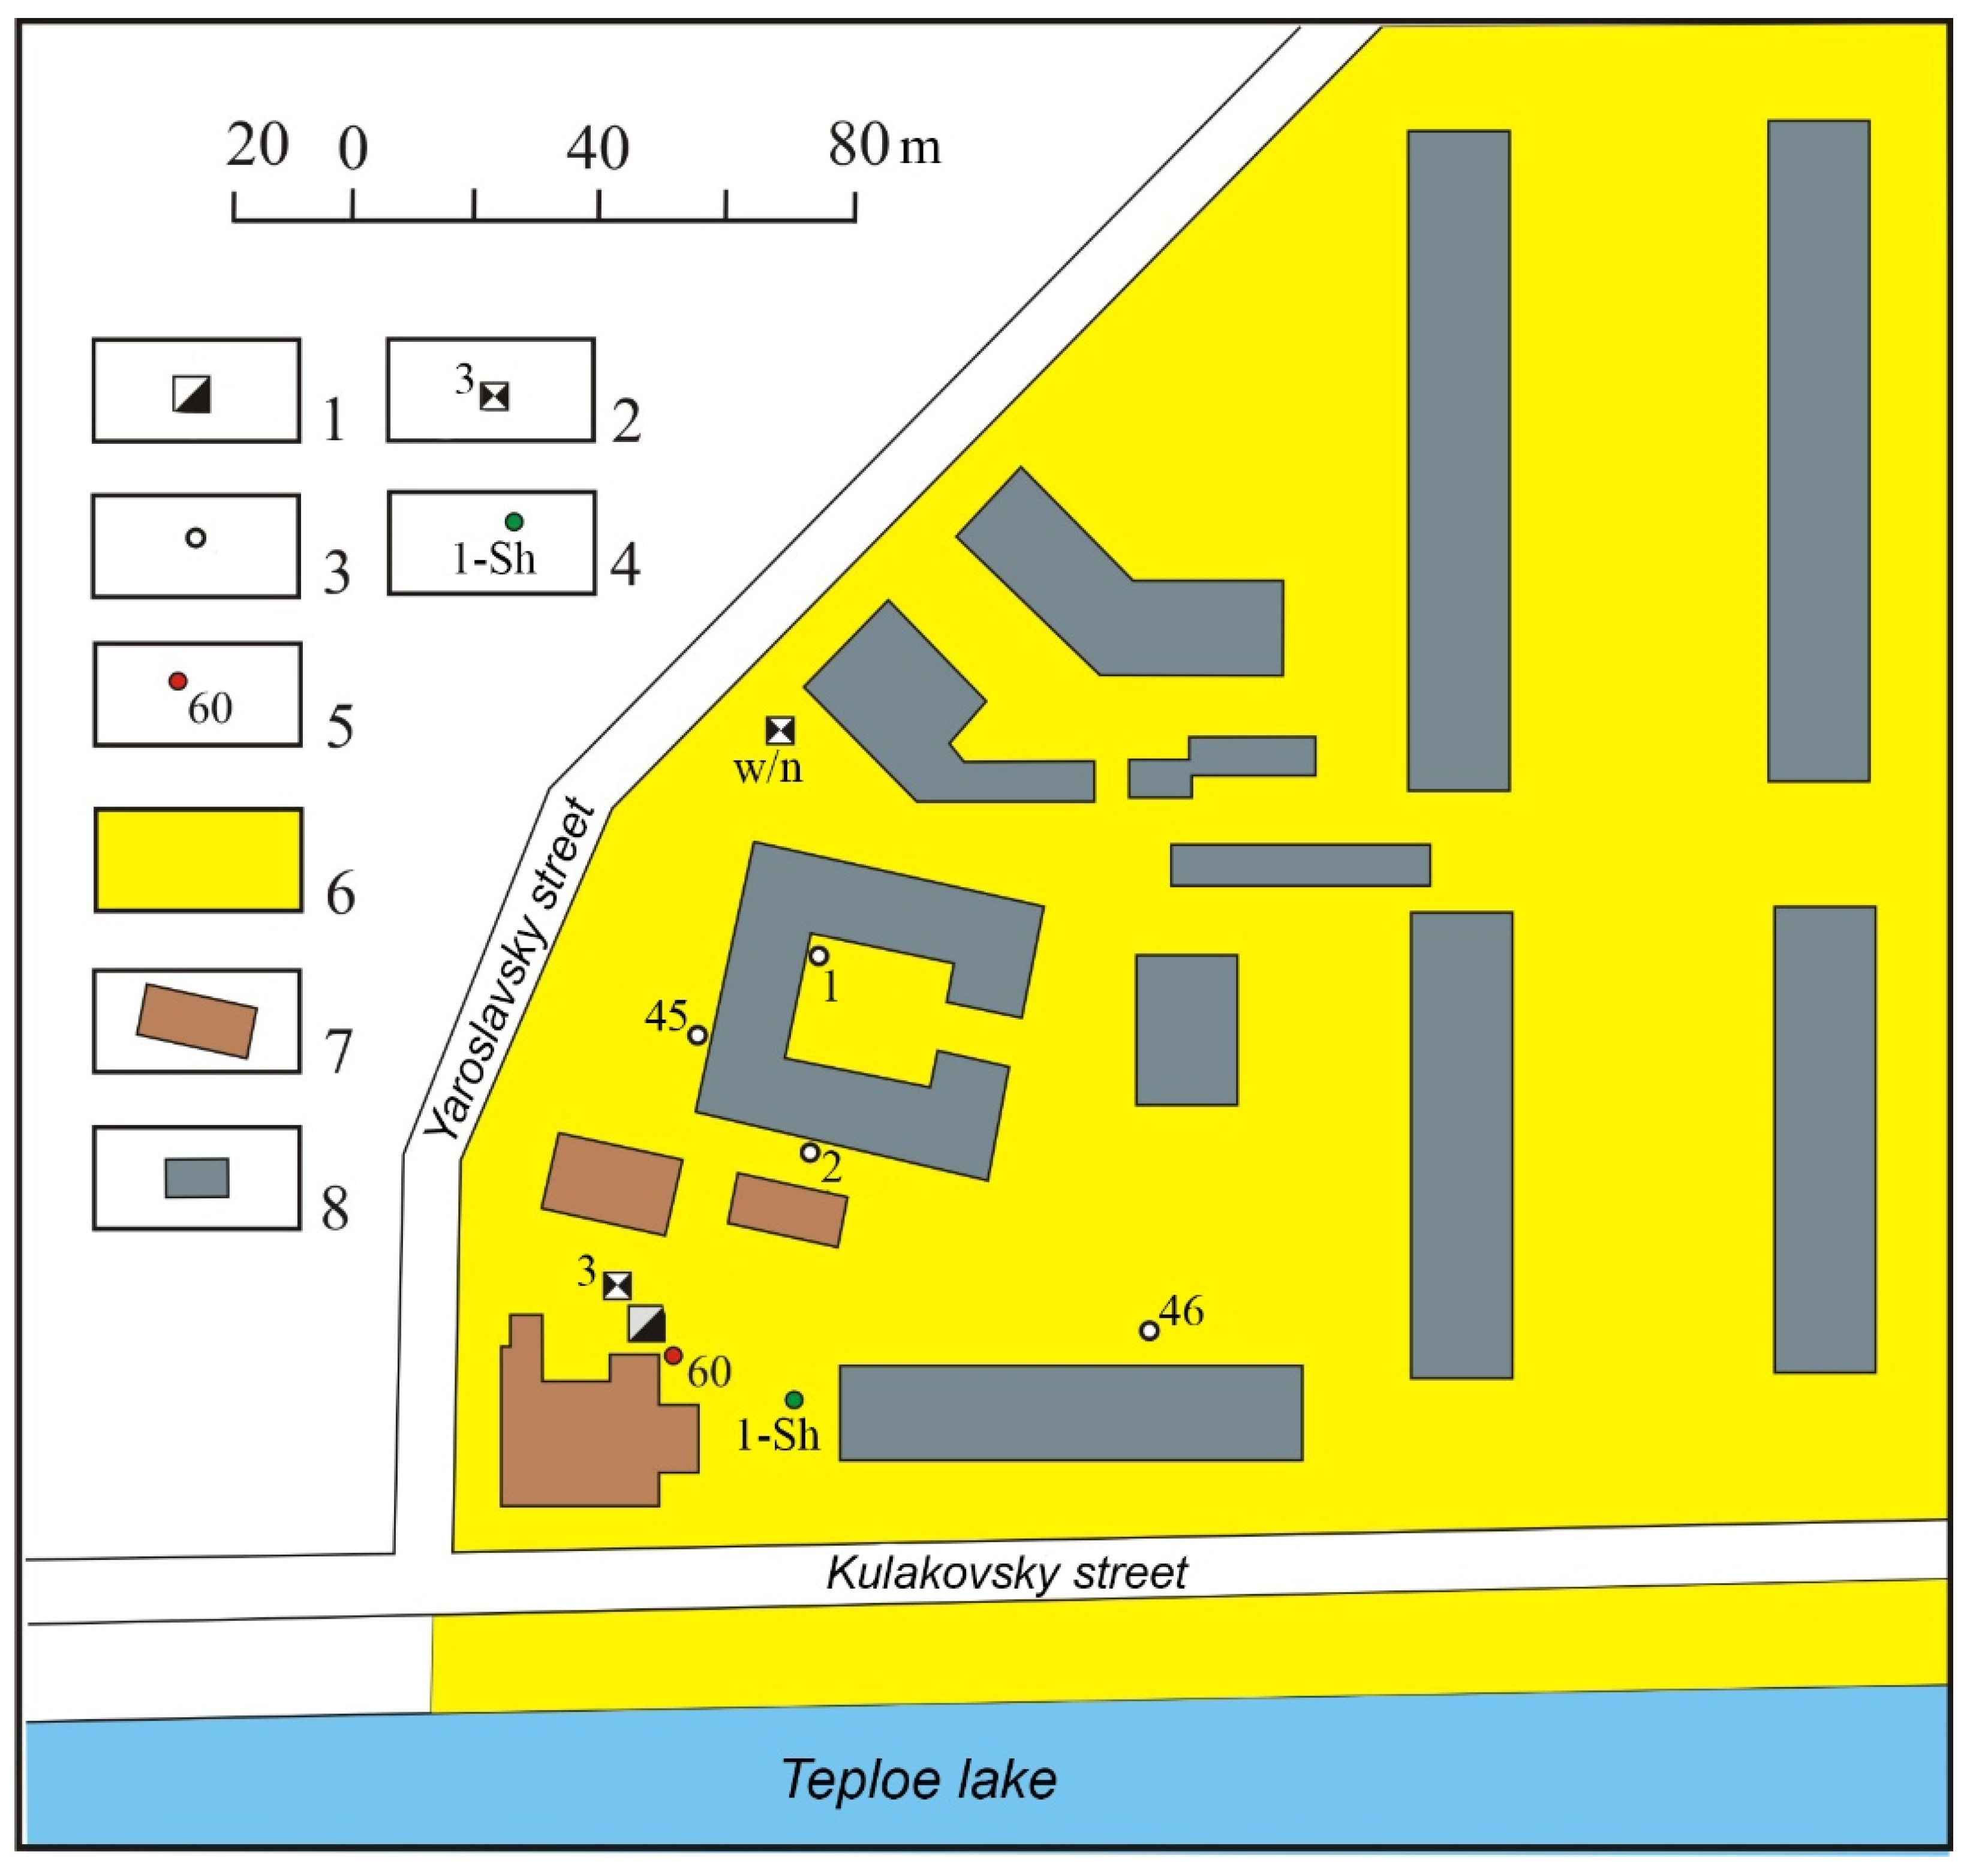
The walls of the Shergin Shaft were partially lined with wood to prevent collapse during digging. The remaining lining near the top makes a description of the soil section difficult down to the depth of 52 m. Therefore, the soil profile in the Shergin Shaft is generally based on subsurface information from borings and excavations made nearby within the same geomorphological setting. These include borehole #60 of the geocryological monitoring network, borehole 1-Sh, test pit #3, borehole 2 and others (Figure 4).
The borings and pits shown in Figure 3 were made at different times for different purposes. For example, test pit #3 near the Shergin Shaft was sunk on 20–29 August 1933 as part of a groundwater investigation program [33]. Soil stratigraphy description from this pit is given in Table 6.
Detailed logging of the site was obtained from borehole 1-Sh. It was drilled on 2–31 August 1958 to a depth of 25 m using the dry drilling method. As Lukin [21] described, it encountered soft, grey sandstone at 23.6 m (Table 7).
Based on the drilling data, the alluvium encountered at the study site can be divided into four geocryological facies. The lowermost portion is interpreted as a channel facies, which includes sand with coarse gravel and coarse-grained sand with fine gravel (borehole 1-Sh, depth interval 18.0–23.6 m). Due to the presence of pore ice, the sands have low moisture contents, ranging between 13.2 and 23.8%.
The channel facies is overlain by frozen sediments of the channel margin (point bars and marginal bars) facies. These sediments mainly consist of fine-grained sands, which, like the underlying material, are cemented by pore ice. The gravimetric moisture content of this alluvium may be as high as 31–32% at some depths (borehole 1-Sh, depth 12 m; borehole #60, depth 9 m). Most samples of the channel margin facies have moisture contents in the range of 17 to 27%. Upon thawing, such sediments liquefy into quicksand.
The backswamp facies and related crack facies comprise the upper portion of the alluvium. The crack facies is a narrow ice vein encountered in test pit #3. The backswamp facies consists of sandy silt interbedded with layers of sand, clay and clay silt. In test pit #3, these sediments were found within the depth interval from 0.9 to 3.9 m. In borehole 1-Sh, they occur from 1.4 to 2.75 m, and in borehole #60 from 1.37 to 4.0 m.
The uppermost unit is anthropogenic ground, which is also referred to as the cultural layer. In the borehole #60 core, it comprises seasonally thawing and frozen layers of silty sand containing fragments of red brick and other construction materials, plant detritus and rootlets. In the borehole 1-Sh log, the cultural layer is described as fill consisting of domestic and construction waste mixed with dark-brown silt. In the test pit #3 description, the cultural layer consists of fill in frozen and thawed states.
Some previous drill records indicated a greater thickness of the cultural layer compared to those above. For example, a test boring (borehole #2) near the Shergin Shaft drilled on 9–10 November 1935 revealed a cultural layer 2.5 m in thickness [31]. Its top consisted of construction waste to a depth of 0.4 m, underlain by sandy silt mixed with construction waste and bricks, plant remains, charcoal, bones and gravel. Below 1.4 m, this material appears to have recently become perennially frozen.
On 10 January 1939, D.D. Kargin documented the section of the Shergin Shaft [21]. According to his description, the cultural layer was as thick as 4.2 m [31].
The anthropogenic sediments in the old part of Yakutsk are characterized by inhomogeneous distribution of pore water. Perched water is sometimes formed near the bottom of the active layer.
The active layer in the anthropogenic material was penetrated in several borings and excavations made within the study site in different years. The end-of season thaw depth (active layer thickness) can be estimated for individual years using the measured values (Table 8).
The above data indicate little ALT variation in the anthropogenic sediments over the period from 1933 to 2010. The ALT values were consistently below the maximum of 1.8 m which, according to Melnikov [22], characterizes the coldest geocryological zone of Yakutsk comprising District B. Hence, recent climate warming has not caused any significant changes in ALT in the studied landscape. Apparently, the thickness and volume of the active layer are mainly controlled by the amount of seasonal ground ice forming in this layer.
The active layer in the urban landscapes of older Yakutsk is composed of anthropogenically modified sediments with high moisture capacity. In winter, they have high ice contents, while in summer, the energy of the heat from the ground surface is used for the phase changes of the ice.
Thus, similar to the natural landscapes [34,35], the active layer thickness in the urban area of Yakutsk experienced no significant variation in the late 20th–early 21st centuries.
In the 19th century, permafrost temperature measurements in the Shergin Shaft were conducted by A. Erman (1829), F. Shergin (1830), M. Zlobin and N. Shchukin (1831), R. Kruse (1832), A. von Middendorf (1844) and others. Later, measurements in short vertical holes in the shaft walls were made by G.M. Zatsepin, N.M. Zatsepin, A.K. Mozolevskaya and S.D. Skopysova in 1934–1937, I.D. Belokrylov in 1938–1939, and S.V. Shimanovsky in 1940–1942 [17].
In 2008, F.V. Mitin, V.N. Panin and A.V. Litovko from the Melnikov Permafrost Institute measured temperatures at 20–107 m depths using a thermistor freely hanging down the shaft [30]. However, comparing these data with the earlier measurements in the vertical holes is not feasible.
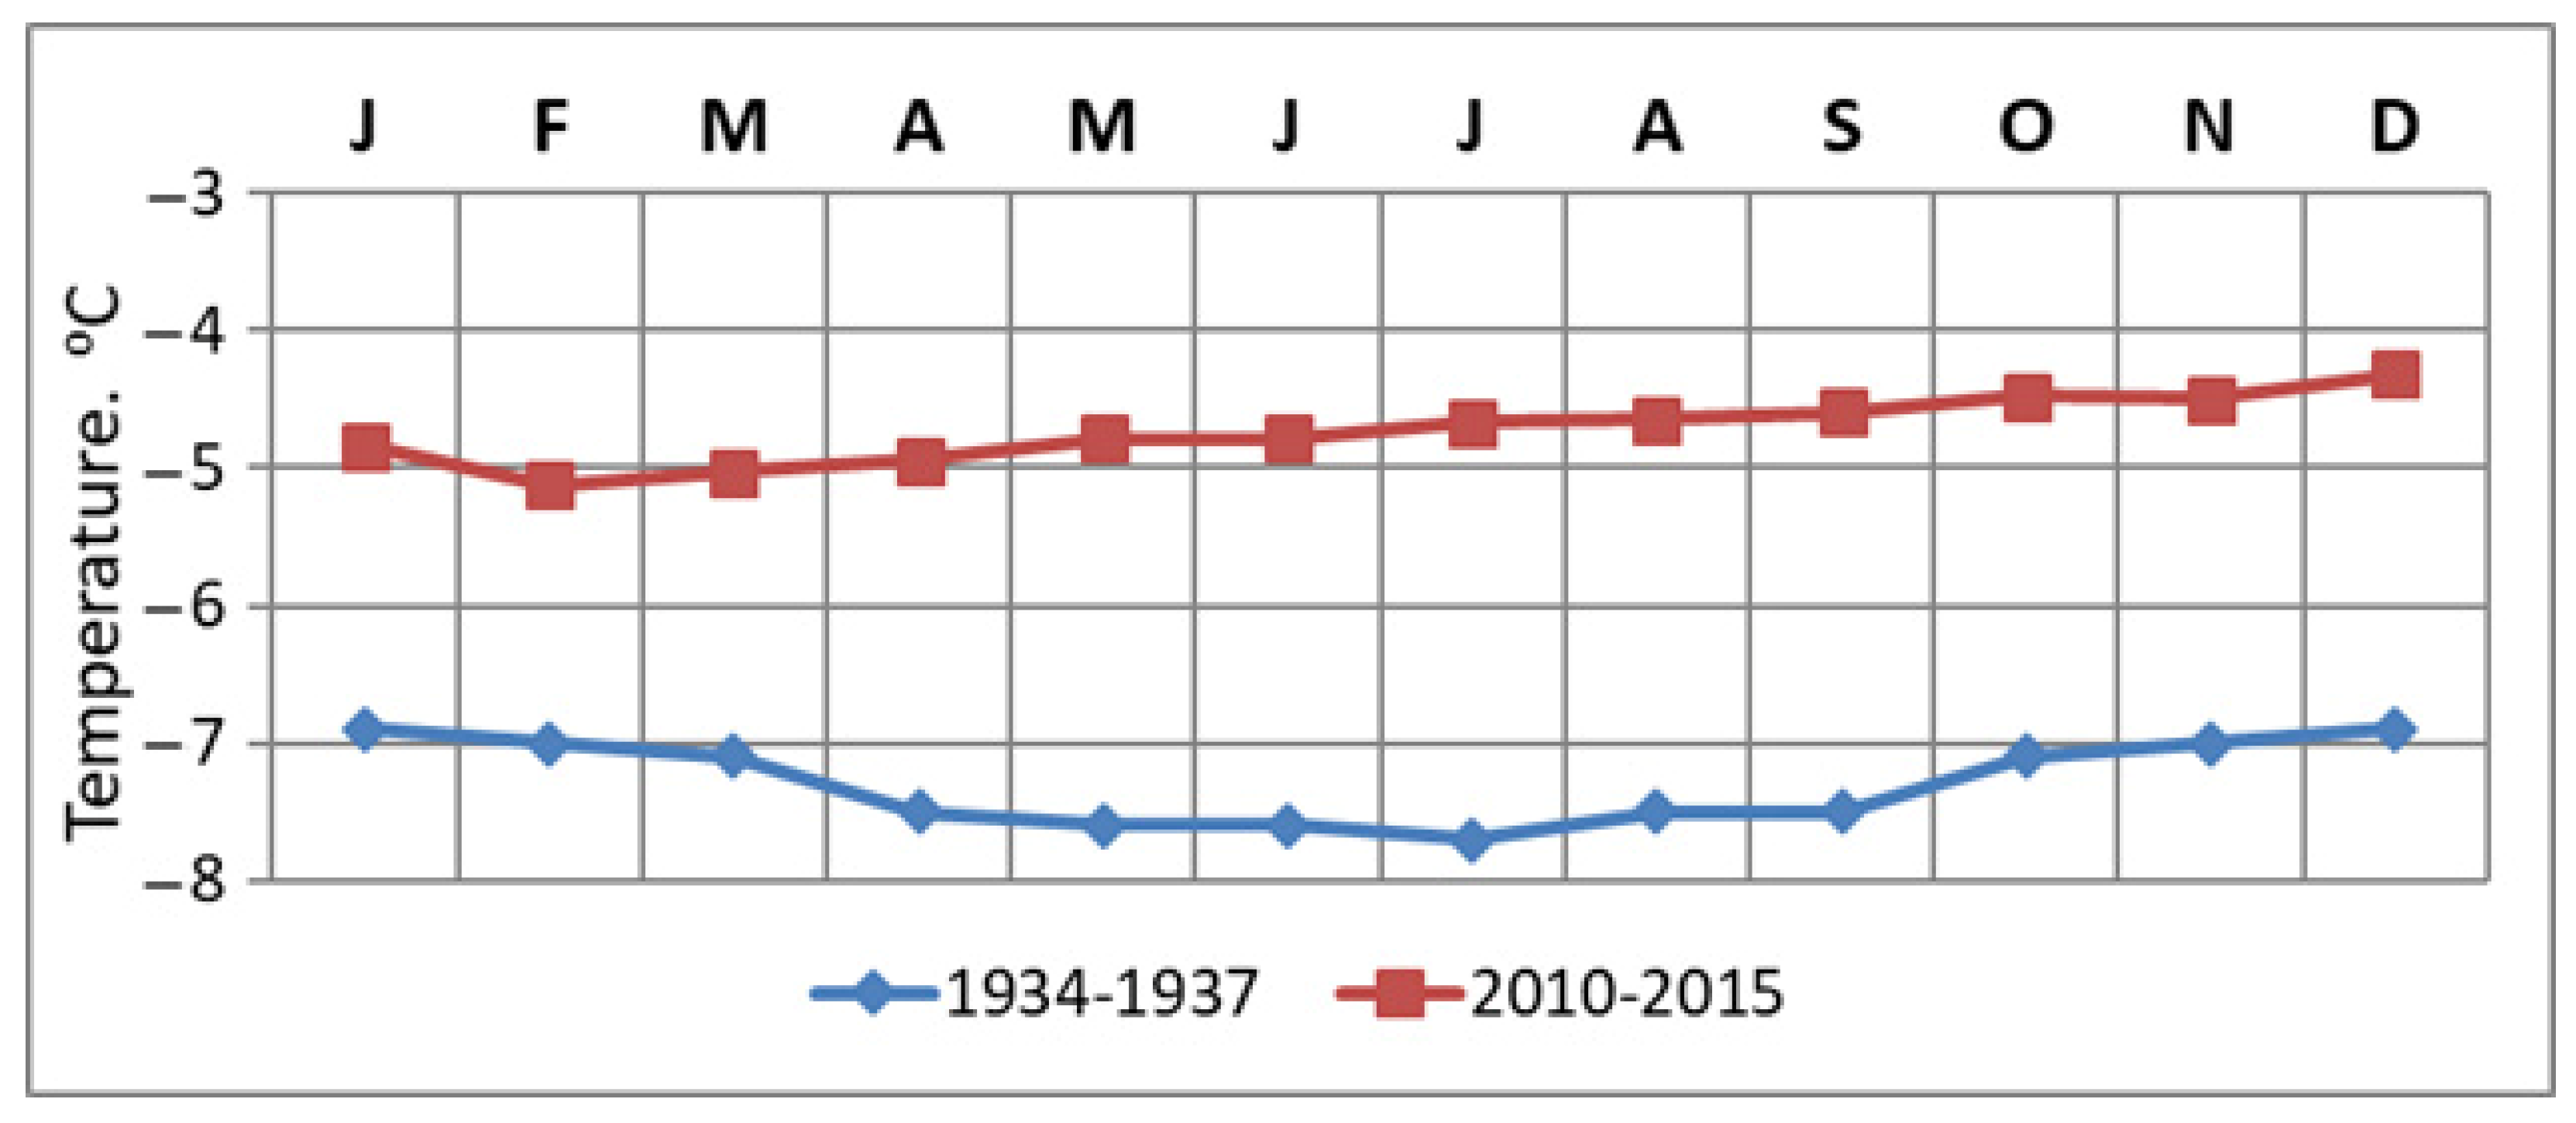
A large volume of permafrost temperature data are available for District B from temperature measurements conducted between 1934 and 2015, including those in the Shergin Shaft and borehole #60 nearby. Figure 5 shows the temperature graphs for 10 m depth compiled from monthly measurements in the early 20th and early 21st centuries.
The available data indicate a significant change in the energy state of the permafrost soils and rocks in response to global warming of the late-20th–early 21st century, resulting in notably higher temperatures within the layer of annual temperature fluctuations.
Permafrost temperature at a 10 m depth in Borehole #60 measured in the early 21st century has increased by about 3 °C compared to that measured in the Shergin Shaft in the early 20th century.
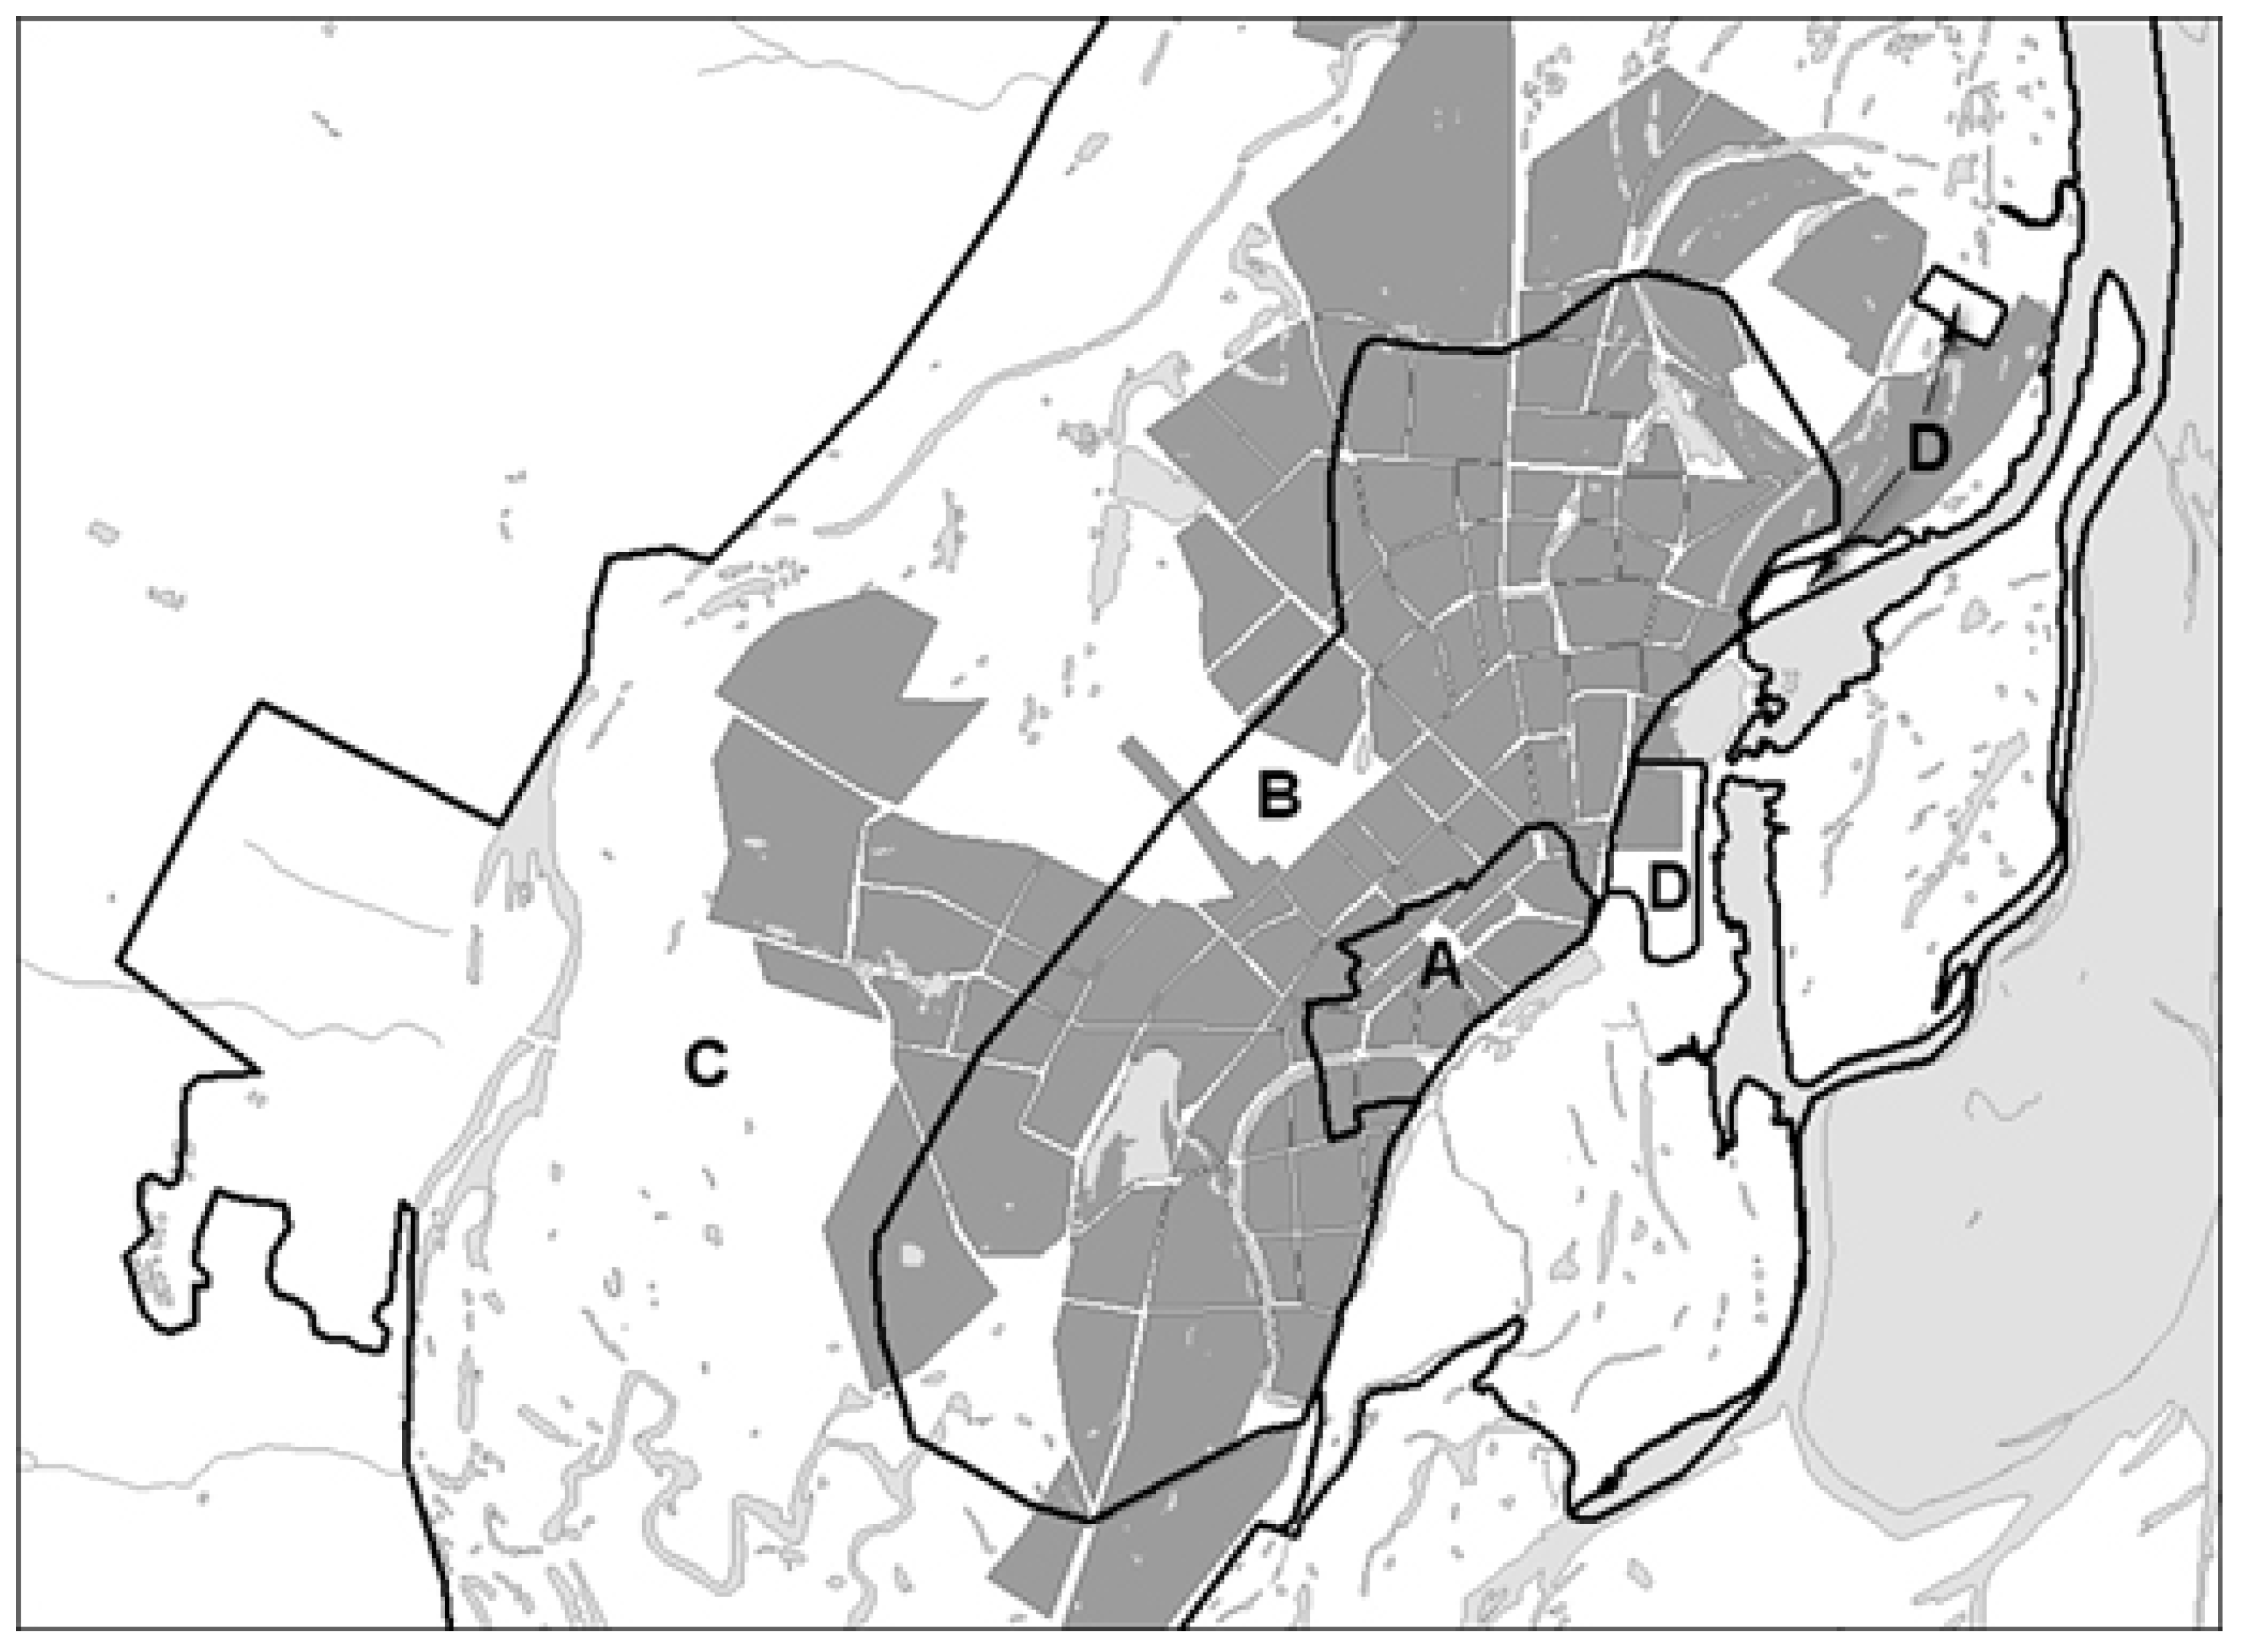
The ground temperature data tend to support Soloviev’s suggestion [24] that there is a certain relationship between permafrost temperature and the age of urban development. We have therefore compiled an age zonation map of Yakutsk (Figure 6).
Comparison of the permafrost monitoring data with the earlier measurements has shown that the age zones identified differ in the magnitude of change in ground temperature at a 10 m depth (Table 9).
During the last 40–50 years, permafrost temperatures in the old part of Yakutsk have increased significantly, as opposed to the undisturbed surrounding areas where warming has been relatively small.
Over the past 50 years, a noticeable increase in permafrost temperatures has occurred in the oldest part of Yakutsk. At the same time, little, if any, change in permafrost temperatures has been observed in the areas developed less than 70 years. Here, the ground temperatures at a depth of 10 m are very close to permafrost temperatures in the undisturbed natural landscapes near Yakutsk.
In the areas developed over the last 70–160 years, permafrost temperatures at the depth of zero annual amplitude have decreased. This can be explained by the cooling effects of snow removal, ventilated crawl spaces under the buildings on pile foundations and shading of the ground surface by high-rise buildings in the more urbanised areas of Yakutsk.
A non-uniform, generally slight change in temperature has occurred in areas of recent development within the reclaimed floodplain of the Lena River with permafrost and talik soils.

5. Conclusions

Recent climate warming has impacted the structure and thermal condition of the upper permafrost in the urbanised area of Yakutsk. However, this warming has not caused any significant deepening of the active layer in the city, as well as in undeveloped terrain in its surroundings. The thickness of the active layer in the old district has remained virtually unchanged during the period between 1933 and 2010 due to the annually restoring moisture regime of anthropogenic soils comprising this layer. It has generally been less than the maximum values observed in other parts of the first Lena River terrace within the Yakutsk urban area. On the other hand, the thermal state of the upper permafrost in Yakutsk has changed considerably. Ground temperature measurements in District B have shown that it has increased by about 3 °C at a 10 m depth in response to recent warming.

Author Contributions

Conceptualization, V.V.K. and I.I.S.; methodology, V.V.K. and I.I.S.; investigation, V.V.K., I.I.S. and A.V.L.; writing—original draft preparation, V.V.K., I.I.S. and A.V.L.; writing—review and editing, V.V.K., I.I.S. and A.V.L. All authors have read and agreed to the published version of the manuscript.

Funding

This research was funded by project AAAA-A20-120111690012-6 (Siberian Branch Russian Academy of Sciences).

Institutional Review Board Statement

Not applicable.

Informed Consent Statement

Not applicable.

Data Availability Statement

The data presented in this study are available on request from the corresponding author.

Acknowledgments

We are grateful to the researchers of Melnikov Permafrost Institute of SB RAS, Yakutsk, Russia, for providing long-term investigation data on Siberian Permafrost. We thank editors and anonymous reviewers for their helpful comments that improved the manuscript.

Conflicts of Interest

The authors declare no conflict of interest.

References

  1. Balobaev, V.T.; Skachkov, Y.B.; Shender, N.I. Predicted changes in climate and permafrost thickness for central Yakutia to the year 2200. Geogr. Prir. Resur. 2009, 2, 50–56. (In Russian) [Google Scholar]
  2. Skachkov, Y.B. Part 6—Climate variability in Yakutia at the turn of the 20th–21st centuries. In Proceedings of the Fourth Conference of Russian Geocryologists, Moscow, Russia, 7–9 June 2011; Moscow State University Press: Moscow, Russia, 2011; Volume 2, pp. 312–318. (In Russian). [Google Scholar]
  3. Skachkov, Y.B. Trends in extreme air temperature changes in Yakutsk. Nauka Obraz. 2012, 2, 39–41. (In Russian) [Google Scholar]
  4. Skachkov, Y.B. Has the thaw season length in Yakutsk changed due to global warming? In Proceedings of the Tenth Siberian Workshop on Climatic and Environmental Monitoring, Tomsk, Russia, 14–17 October 2013; pp. 209–216. (In Russian). [Google Scholar]
  5. Melvin, A.; Larsen, P.; Boehlertc, B.; Neumannc, J.; Chinowskye, P.; Espinete, X.; Martinichf, J.; Baumannc, M.; Rennelsc, L.; Bothnerc, A.; et al. Climate change damages to Alaska public infrastructure and the economics of proactive adaptation. Proc. Natl. Acad. Sci. USA 2017, 114, E122–E131. [Google Scholar] [CrossRef]
  6. Shiklomanov, N.I.; Streletskiy, D.A.; Swales, T.B.; Kokorev, V.A. Climate change and stability of urban infrastructure in Russian permafrost regions: Prognostic assessment based on GCM climate projections. Geogr. Rev. 2017, 107, 125–142. [Google Scholar] [CrossRef]
  7. Shiklomanov, N.I.; Streletskiy, D.A.; Grebenets, V.I.; Suter, L. Conquering the permafrost: Urban infrastructure development in Norilsk, Russia. Polar Geogr. 2017, 40, 273–290. [Google Scholar] [CrossRef]
  8. Streletskiy, D.A.; Shiklomanov, N.I. Russian Arctic Cities through the Prism of Permafrost. In Sustaining Russia’s Arctic Cities: Resource Politics, Migration, and Climate Change; Berghahn Books: New York, NY, USA, 2016. [Google Scholar] [CrossRef]
  9. Hjort, J.; Karjalainen, O.; Aalto, J.; Westermann, S.; Romanovsky, V.E.; Nelson, F.E.; Etzelmüller, B.; Luoto, M. Degrading permafrost puts Arctic infrastructure at risk by mid-century. Nat. Commun. 2018, 9, 5147. [Google Scholar] [CrossRef] [PubMed]
  10. Karjalainen, O.; Aalto, J.; Luoto, M.; Westermann, S.; Romanovsky, V.E.; Nelson, F.; Etzelmüller, B.; Hjort, J. Circumpolar permafrost maps and geohazard indices for near-future infrastructure risk assessments. Sci. Data 2019, 6, 190037. [Google Scholar] [CrossRef] [PubMed]
  11. Gromadsky, A.N.; Arefiev, S.V.; Volkov, N.G.; Kamnev, Y.K.; Sinitsky, A.I. Remote monitoring of the temperature regime of permafrost soils under the buildings of Salekhard. Sci. Bull. Yamalo-Nenets Auton. Okrug 2019, 3, 17–21. [Google Scholar] [CrossRef]
  12. Kamnev, Y.K.; Filimonov, M.Y.; Shein, A.N.; Vaganova, N.A. Automated Monitoring the Temperature under Buildings with Pile Foundations in Salekhard (Preliminary Results). Geogr. Environ. Sustain. 2021, 14, 75–82. [Google Scholar] [CrossRef]
  13. Kotov, P.I.; Khilimonyuk, V.Z. Building Stability on Permafrost in Vorkuta, Russia. Geogr. Environ. Sustain. 2021, 14, 67–74. [Google Scholar] [CrossRef]
  14. Melnikov, P.I. (Ed.) Permafrost-Landscape Map of the Yakutian ASSR, Scale 1:2,500,000; 2 Sheets; GUGK: Moscow, Russia, 1991. (In Russian) [Google Scholar]
  15. Fedorov, A.N.; Vasilyev, N.F.; Torgovkin, Y.I.; Shestakova, A.A.; Varlamov, S.P.; Zheleznyak, M.N.; Shepelev, V.V.; Konstantinov, P.Y.; Kalinicheva, S.S.; Basharin, N.I.; et al. Permafrost Landscapes of Yakutia (Explanatory Note to the Permafrost-Landscape Map of the Yakutian ASSR, Scale 1:2,500,000); GUGK: Novosibirsk, Russia, 1989; 170p. (In Russian) [Google Scholar]
  16. Soloviev, P.A. Cryolithozone (Permafrost). In Yakutsk, Geographic Atlas; GUGK: Novosibirsk, Russia, 1992; p. 16. (In Russian) [Google Scholar]
  17. Ivanov, M.S. Cryogenic Structure of the Quaternary Deposits in the Lena-Aldan Depression; Nauka: Novosibirsk, Russia, 1984; 116p. (In Russian) [Google Scholar]
  18. Soloviev, P.A. Permafrost in the Northern Lena-Amga Interfluve; USSR Academy of Sciences: Moscow, Russia, 1959; 144p. (In Russian) [Google Scholar]
  19. Melnikov, P.A. Permafrost in the Yakutsk area. In Permafrost Investigations in the Yakutian Republic; USSR Academy of Sciences: Moscow, Russia, 1950; pp. 53–70. (In Russian) [Google Scholar]
  20. Balobaev, V.T. Geothermy of the Frozen Zone of the Lithosphere in Northern Asia; Nauka: Novosibirsk, Russia, 1991; 193p. (In Russian) [Google Scholar]
  21. Lukin, G.O. The Shergin Shaft and the geothermal regime of surrounding soils and rocks. In Modern Issues of Regional and Engineering Geocryology (Permafrost Science); Nauka: Moscow, Russia, 1964; pp. 84–96. (In Russian) [Google Scholar]
  22. Melnikov, P.I. Permafrost and Geological Conditions for Construction of Civil and Industrial Buildings in Central Yakutia and Case Histories; USSR Academy of Sciences: Moscow, Russia, 1951; 136p. (In Russian) [Google Scholar]
  23. Melnikov, P.I. On changes in ground temperature in the Shergin Shaft, Yakutsk over the century and in length of thermal processes during recovery of disturbed permafrost temperatures. In Permafrost and Related Phenomena in the Yakut ASSR; USSR Academy of Sciences: Moscow, Russia, 1962; pp. 54–67. (In Russian) [Google Scholar]
  24. Soloviev, P.A. On the influence of development on permafrost temperatures in the city of Yakutsk. In Proceedings of the North-Eastern Department of the Permafrost Institute; Yakutia Republican Press: Yakutsk, Russia, 1958; Volume 1, pp. 179–191. (In Russian). [Google Scholar]
  25. Budyko, M.I. Climate Change; Gidrometeoizdat: Leningrad, Russia, 1974; 280p. (In Russian) [Google Scholar]
  26. Gavrilova, M.K. Climates of Cold Regions of the Earth; Permafrost Institute SB RAS: Yakutsk, Russia, 2003; 208p. (In Russian) [Google Scholar]
  27. Melnikov, P.I. Dynamics of permafrost under buildings and foundation designs for cold permafrost in the city of Yakutsk. In Permafrost Investigations in the Yakutian Republic; USSR Academy of Sciences: Moscow, Russia, 1952; pp. 259–278. (In Russian) [Google Scholar]
  28. Lukin, G.O. The history of foundation engineering in Yakutia. In Building Foundations on Frozen Ground in Yakutia; Nauka: Moscow, Russia, 1968; pp. 71–79. (In Russian) [Google Scholar]
  29. Soloviev, P.A. Experience in characterizing the Yakutsk area by depth of seasonal thawing and frost-susceptibility for practical purposes. In Permafrost Investigations of the Developed Regions of the USSR; Nauka: Novosibirsk, Russia, 1980; pp. 60–63. (In Russian) [Google Scholar]
  30. Soloviev, P.A. Shergin Shaft, 5th ed.; Permafrost Institute SB RAS: Yakutsk, Russia, 2008; 14p. (In Russian) [Google Scholar]
  31. Grave, N.A.; Kunitsky, V.V.; Soloviev, P.A.; Misharina, N.K. The Inventory of Pre-1965 Boreholes and Test Pits in Yakutsk; Two Volumes, Four Books. Book 2. Boreholes and Test Pits #420–895. Book 3. Boreholes and Test Pits #896–1402; Melnikov Permafrost Institute: Yakutsk, Russia, 2003; (Unpublished work). (In Russian) [Google Scholar]
  32. Pavlova, N.A. Dynamics of permafrost hydrogeochemistry in areas of cryopeg distribution in Yakutsk. Nauka Obraz. 2010, 3, 15–19. (In Russian) [Google Scholar]
  33. Svetozarov, I.M. Permafrost hydrogeology based on research data from Yakutsk. Probl. Sov. Geol. 1934, 10, 119–131. (In Russian) [Google Scholar]
  34. Pavlov, A.V. Thermal Physics of Landscapes; Nauka: Novosibirsk, Russia, 1979; 284p. (In Russian) [Google Scholar]
  35. Varlamov, S.P.; Skachkov, Y.B.; Skryabin, P.N. Monitoring of Ground Thermal Regime in Central Yakutia; Melnikov Permafrost Institute Press: Yakutsk, Russia, 2021; 156p. (In Russian) [Google Scholar]
Figure 1. Seasonal freezing and thawing curves in 1938–1958; solid line—averaged curve for well-drained soils in the suburban landscapes with natural vegetation (meadows and sparse forest); dashed line—averaged curve for soils within the historical urban development limits (compiled based on [18]).
Land 11 01513 g001
Figure 2. View of the Shergin Shaft’s superstructure (cross) and drilling of borehole #60.
Land 11 01513 g002
Figure 3. Fragments of the core sample from borehole # 60 (a–depth interval 1.3–1.7 m, b–depth interval 2.6–3.0 m).
Land 11 01513 g003
Figure 4. Location of boreholes and test pits: 1—Shergin Shaft and its number in the Inventory of Pre-1965 Boreholes and Test Pits in Yakutsk (compiled based on [31]); 2—test pit and its Inventory number (compiled based on [31]); 3—borehole and its Inventory number (compiled based on [31]); 4—borehole 1-Sh (compiled based on [21]); 5—geocryological monitoring borehole; 6—District B; 7—wooden building; 8—concrete building.
Land 11 01513 g004
Figure 5. Past (1934–1937) and recent (2010–2015) permafrost temperature graphs for 10 m depth in an urbanised permafrost landscape: 1—based on G.M. Zatsepin and N.M. Zatsepin’s data from Shergin Shaft (compiled based on [23]); 2—based on data from borehole #60.
Land 11 01513 g005
Figure 6. Zonation of Yakutsk by development age: A—old (>160 years); B—middle (70–160 years); C—young (<70 years); D—recent development on reclaimed floodplain (<40 years).
Land 11 01513 g006
Table 1. Permafrost thickness and temperature for selected sites (based on materials from 1950–1960).
BoreholeLocationPermafrost Thickness, mMean Annual Ground Temperature, °CReference
Shergin ShaftOktyabrsky District, Yakutsk204−6.6[18]
Borehole # 2Central District, Yakutsk250−4.2[19]
Borehole # 5Saisary District, Yakutsk>140−2.0[18]
Borehole with no IDKenkeme site
(62°05′ N, 129°00′ E)
390−3.4[20]
Borehole with no IDUnnamed site in Yakutsk
(61°55′ N, 129°40′ E)
360−3.5[20]
Table 2. Active-layer thicknesses (H, m).
Soil TypeH, m PlateauH, m Lena Floodplain and Low Terraces
sands3.04.0
silts2.02.5
peat1.01.7
Table 3. Subsurface conditions derived from borehole #60.
LayerDepth, mBrief Soil Description
10.00–1.30Thawed silty sand with inclusions of red brick fragments, plant detritus and rootlets.
21.30–1.37Frozen silty sand with inclusions of plant detritus, rootlets and ref brick fragments.
31.37–2.25Frozen light-brown, in places rust-coloured, sand with inclusions of organics. Massive cryostructure (i.e., ice occurs as pore ice). Gravimetric moisture content is 59.7% at 1.5 m and 34.0% at 2.0 m.
42.25–4.00Solidly frozen sandy silt, greyish-brown in colour, with some organics and sand. Interbeds and pockets of medium-grained light-brown sand occur at depth intervals 3.5–3.56 and 3.75–3.99 m. Massive cryostructure. Moisture content is 48.2% at 2.5 m, 49,7% at 3.0 m and 40.8% at 3.5 m.
54.00–4.33Solidly frozen medium-grained sand, light-brown in colour. Massive cryostructure. Moisture content at 4.0 m depth is 46.7%.
64.33–5.17Solidly frozen medium-grained sand, grey, in places rust, in colour. Massive cryostructure. Moisture content is 28.7% at 4.5 m and 28.3% at 5.0 m.
75.17–7.80Solidly frozen medium-grained sand. alternately grey and light-brown in colour. Thin (<4 mm) layers of organic material and inclusions of undecomposed wood remains. Massive cryostructure. Moisture content is 28.3% at 5.5 m, 29.3% at 6.0 m, 23.7% at 6.5 m, 27.1% at 7.0 m and 28.2% at 7.5 m.
87.80–11.50Solidly frozen medium-grained sand, grey in colour, with interlayers and inclusions of plant remains. Massive cryostructure. Moisture content is 26.6% at 8.0 m, 24.8% at 8.5 m, 31.2% at 9.0 m, 25.6% at 9.5 m, 24.4% at 10.0 m, 28.6% at 10.5 m, 29.6% at 11.0 m and 27.6% at 11.5 m.
Table 4. Ground temperatures in borehole # 60, °C.
DataDepth, m
12345678910
22 December 2010−15.7−4.4−2.4−3.1−3.7−4.0−4.1−4.2−4.3−4.4
24 January 2011−14.2−7.7−3.9−3.6−3.8−4.0−4.1−4.2−4.3−4.3
23 May 2011−3.1−5.4−6.5−6.4−6.0−5.6−5.3−5.0−4.8−4.6
23 September 20110.1−2.3−4.0−4.6−4.7−4.8−4.8−4.8−4.8−4.7
22 December 2011−7.1−2.5−2.9−3.2−3.7−4.0−4.1−4.2−4.3−4.4
26 January 2012−11.0−6.1−3.3−3.4−3.6−3.8−3.9−4.0−4.1−4.2
31 May 2012−1.5−4.8−5.8−5.8−5.6−5.2−4.9−4.7−4.6−4.5
27 September 20120.6−2.1−3.7−4.3−4.5−4.6−4.7−4.6−4.6−4.5
3 December 2012−1.4−2.5−3.5−4.0−4.2−4.3−4.4−4.4−4.5−4.5
24 January 2013−18.0−10.2−4.8−3.4−3.7−3.9−4.0−4.2−4.3−4.3
29 May 2013−2.8−5.6−7.1−7.3−6.9−6.6−6.0−5.7−5.3−4.9
29 September 20130.2−2.0−3.9−4.6−4.9−5.0−5.1−5.1−5.1−4.9
23 December 2013−6.0−2.4−3.4−3.9−4.0−4.2−4.4−4.5−4.5−4.5
28 January 2015−11.0−5.9−3.7−3.7−3.9−4.0−4.2−4.4−4.3−4.4
22 May 2015−5.3−6.5−6.6−6.1−5.7−5.2−5.1−4.8−4.6−4.5
24 September 20150.6−2.2−3.8−4.6−4.8−4.9−5.0−4.9−4.8−4.8
16 December 2015−5.2−2.0−3.1−3.9−4.1−4.2−4.4−4.6−4.5−4.6
Table 5. Permafrost temperatures at thermal monitoring network sites within the older part of Yakutsk, 2009–2011.
Borehole IDLocationGround Temperature at 10 m, °C
3Petrovsky St., 2−2.4
7Khabarov St., 1−4.9
8Yaroslavsky St., 2−5.0
9Khabarov St., 5−3.8
10Chiryaev St., 4−4.2
11Chiryaev St., 8−3.5
12Chiryaev St., 8−4.1
13Yaroslavsky St., 4−5.7
17Kalandarashvili St., 1−2.5
26Lenin Ave., 11−4.2
27Ordzhonikidze St., 3/1−4.0
28Lenin Ave., 35−4.2
29Lenin Ave., 37−3.0
30Lenin Ave., 46−2.2
31Oktyabrskaya St., 21−3.8
32Ordzhonikidze St., 45−4.8
48Chernyshevsky St., 22/2−4.1
60Kulakovsky St., 16−4.5
Table 6. Test pit #3.
LayerDepth, mSoil Description
10.00–0.90Fill, unfrozen from the top to 0.8 m, frozen below
20.90–1.54Clayey silt with an 0.15-m-thick ice vein crossing the pit wall between 0.9 and 2.1 m depth
31.54–2.80Clay, frozen
42.80–3.25Clayey silt, frozen
53.25–3.90Sandy silt, frozen
63.90–4.10Fine-grained sand, frozen
Table 7. Subsurface conditions derived from borehole 1-Sh.
LayerDepth, mBrief Soil Description
10.00–1.40Fill consisting of domestic and construction waste mixed with dark-brown silt. Unfrozen from the surface down to 1.2 m. Gravimetric moisture content is 43,6% at 0.5 m depth and 19.7% at 1 m depth.
21.40–2.75Dark-grey clay silt, thinly bedded, frozen with thin ice layers. Gravimetric moisture content at 1.5 m is 65.4%. At 2.0 m depth, clay silt is underlain by sandy silt with ice layers and crystals about 40% by volume. Sandy silt at 2.0 m depth has a gravimetric moisture content of 77.3%. Sandy silt with plant detritus at 2.5 m depth has a gravimetric moisture content of 165.3%.
32.75–20.00Light bluish-grey fine-grained micaceous and quartz-feldspar sand cemented by ice crystals. Between 18.0 and 20.0 m, coarse-grained quartz sand with some gravel. Gravimetric moisture content is 23.6% at 3.0 m, 25.5% at 5.0 m, and 28.6% at 10.0 m depth. Moisture content is 24.6% for medium-grained sand at 15.0 m and 23.8% for coarse-grained sand with some gravel at 20.0 m.
420.00–23.60Gravelly sand, with >50% fine to coarse gravel by volume. It has higher moisture content compared to the underlying material. At 23.0 m, gravimetric moisture content of sand is 20.0%.
Table 8. Active layer thickness in anthropogenic sediments based on drilling data.
Borehole/Test pitMeasurement DateMeasured Thaw Depth, mEstimated ALT, m
Borehole #4529.07.19331.01.17
Borehole #4616.08.19331.01.11
Borehole #209.11.19351.41.55
Unnumbered test pit17.08.19371.11.17
Borehole #121.08.19441.41.47
Borehole 1-Sh02.08.19581.21.41
Borehole #6015.10.20101.31.36
Table 9. Ground temperatures and magnitude of their change in different age zones, Yakutsk.
Map SymbolAge ZoneGround Temperature (1950–1960), °CGround Temperature (2010–2015), °C
AOld (>160 years)−4.0 to −8.0−2.2 to −5.7
BMiddle (70–160 years)−1.1 to −3.5−2.5 to −6.5
CYoung (<70 years)−1.8 to −3.2−1.0 to −4.0
DRecent (<40)No data2.0 to −0.1
Publisher’s Note: MDPI stays neutral with regard to jurisdictional claims in published maps and institutional affiliations.

