


Assessment on the Spatial Distribution Suitability of Ethnic Minority Villages in Fujian Province Based on GeoDetector and AHP Method


Abstract
:1. Introduction
2. Literature Review
2.1. Suitability Evaluation Object
2.2. Suitability Evaluation Indicator
2.3. Suitability Evaluation Method
3. Research Materials and Methods
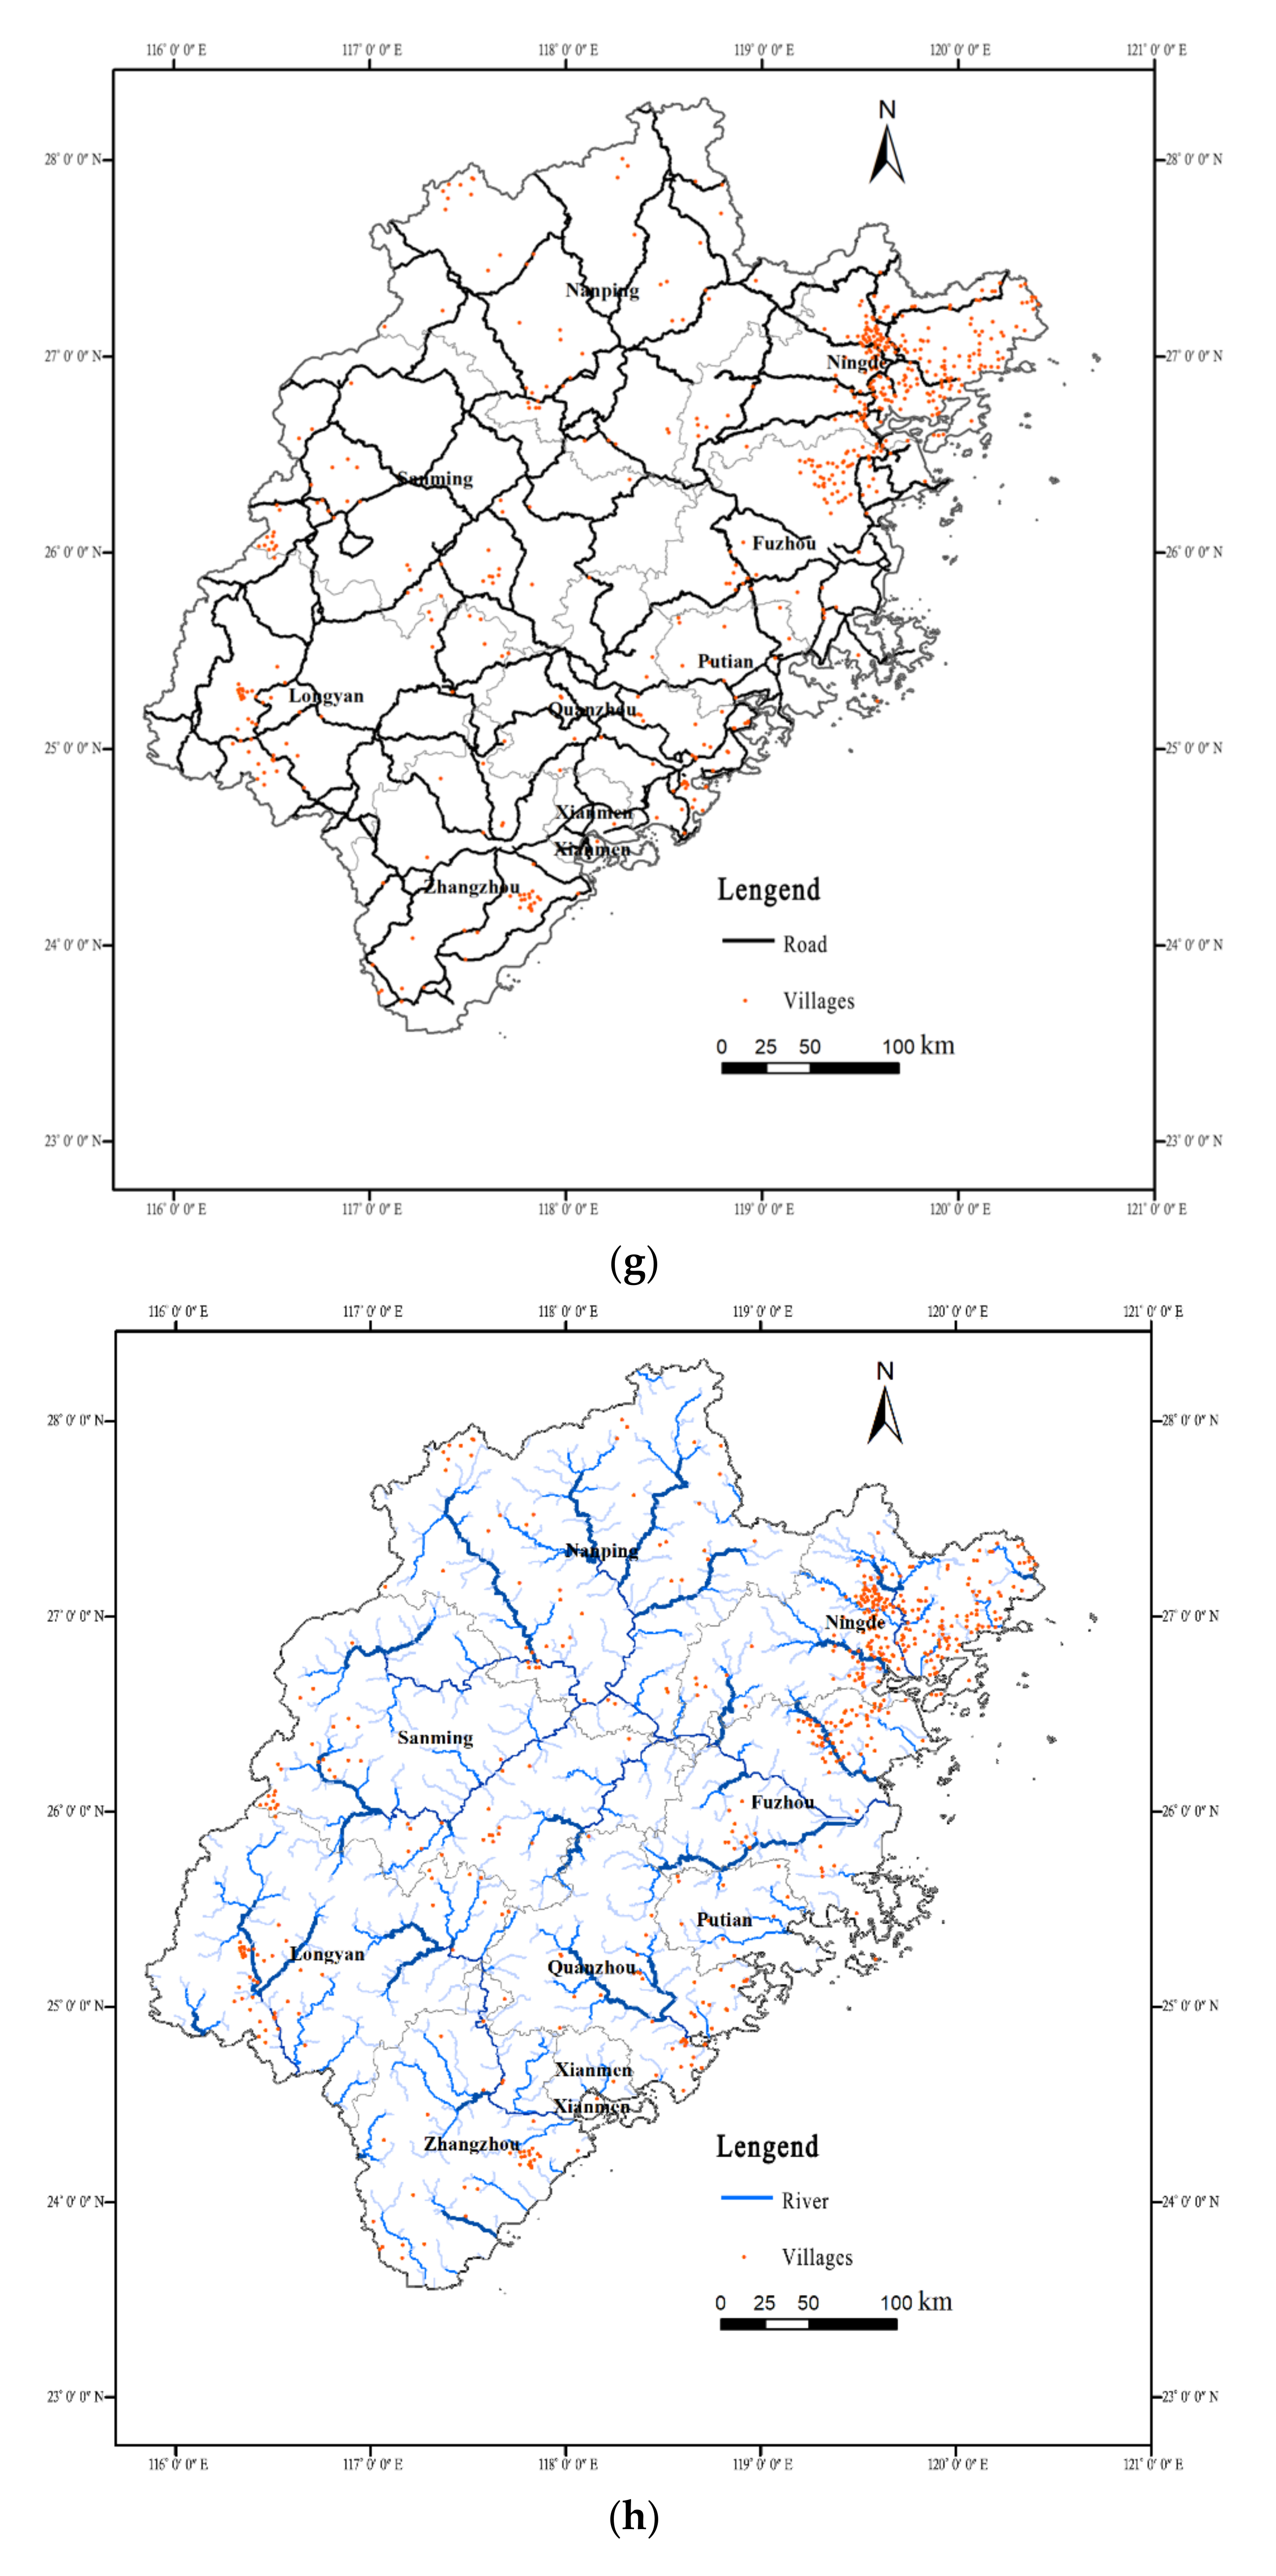
3.1. Study Area
3.2. Data Sources
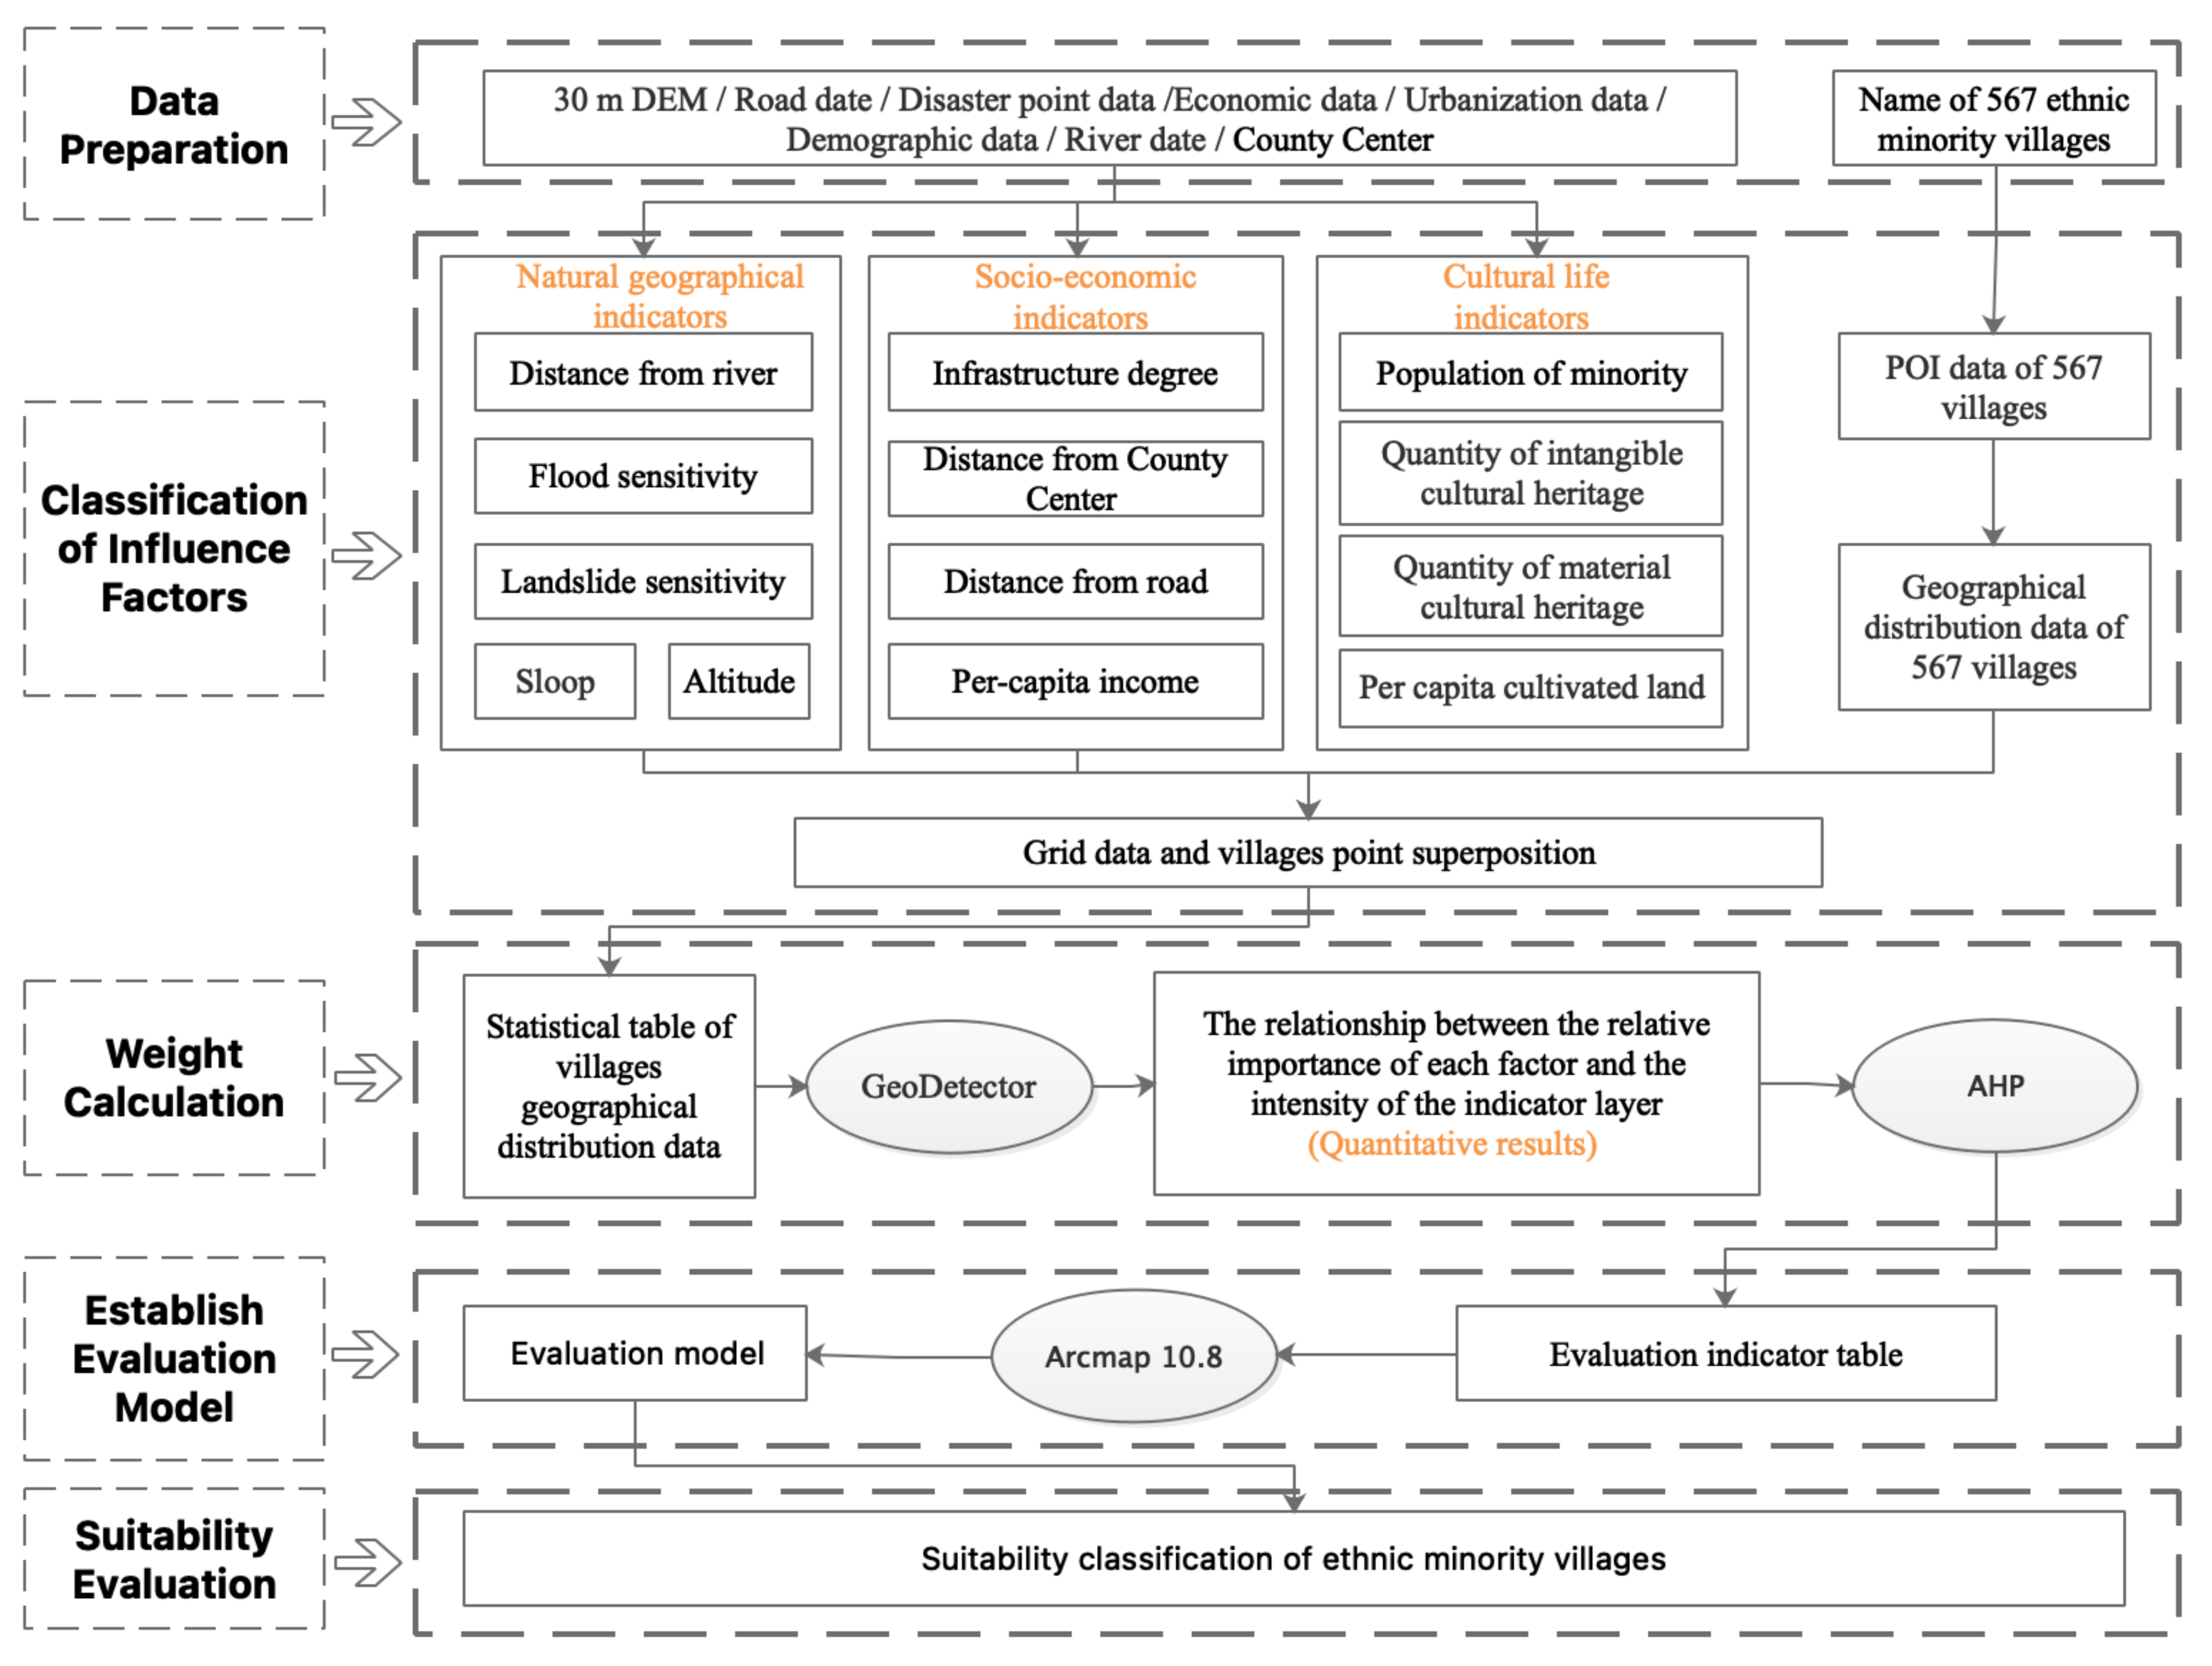
3.3. Research Method
3.3.1. GeoDetector
3.3.2. Suitability Evaluation Model Based on Geodetector and AHP
3.4. Evaluation Model Establishment
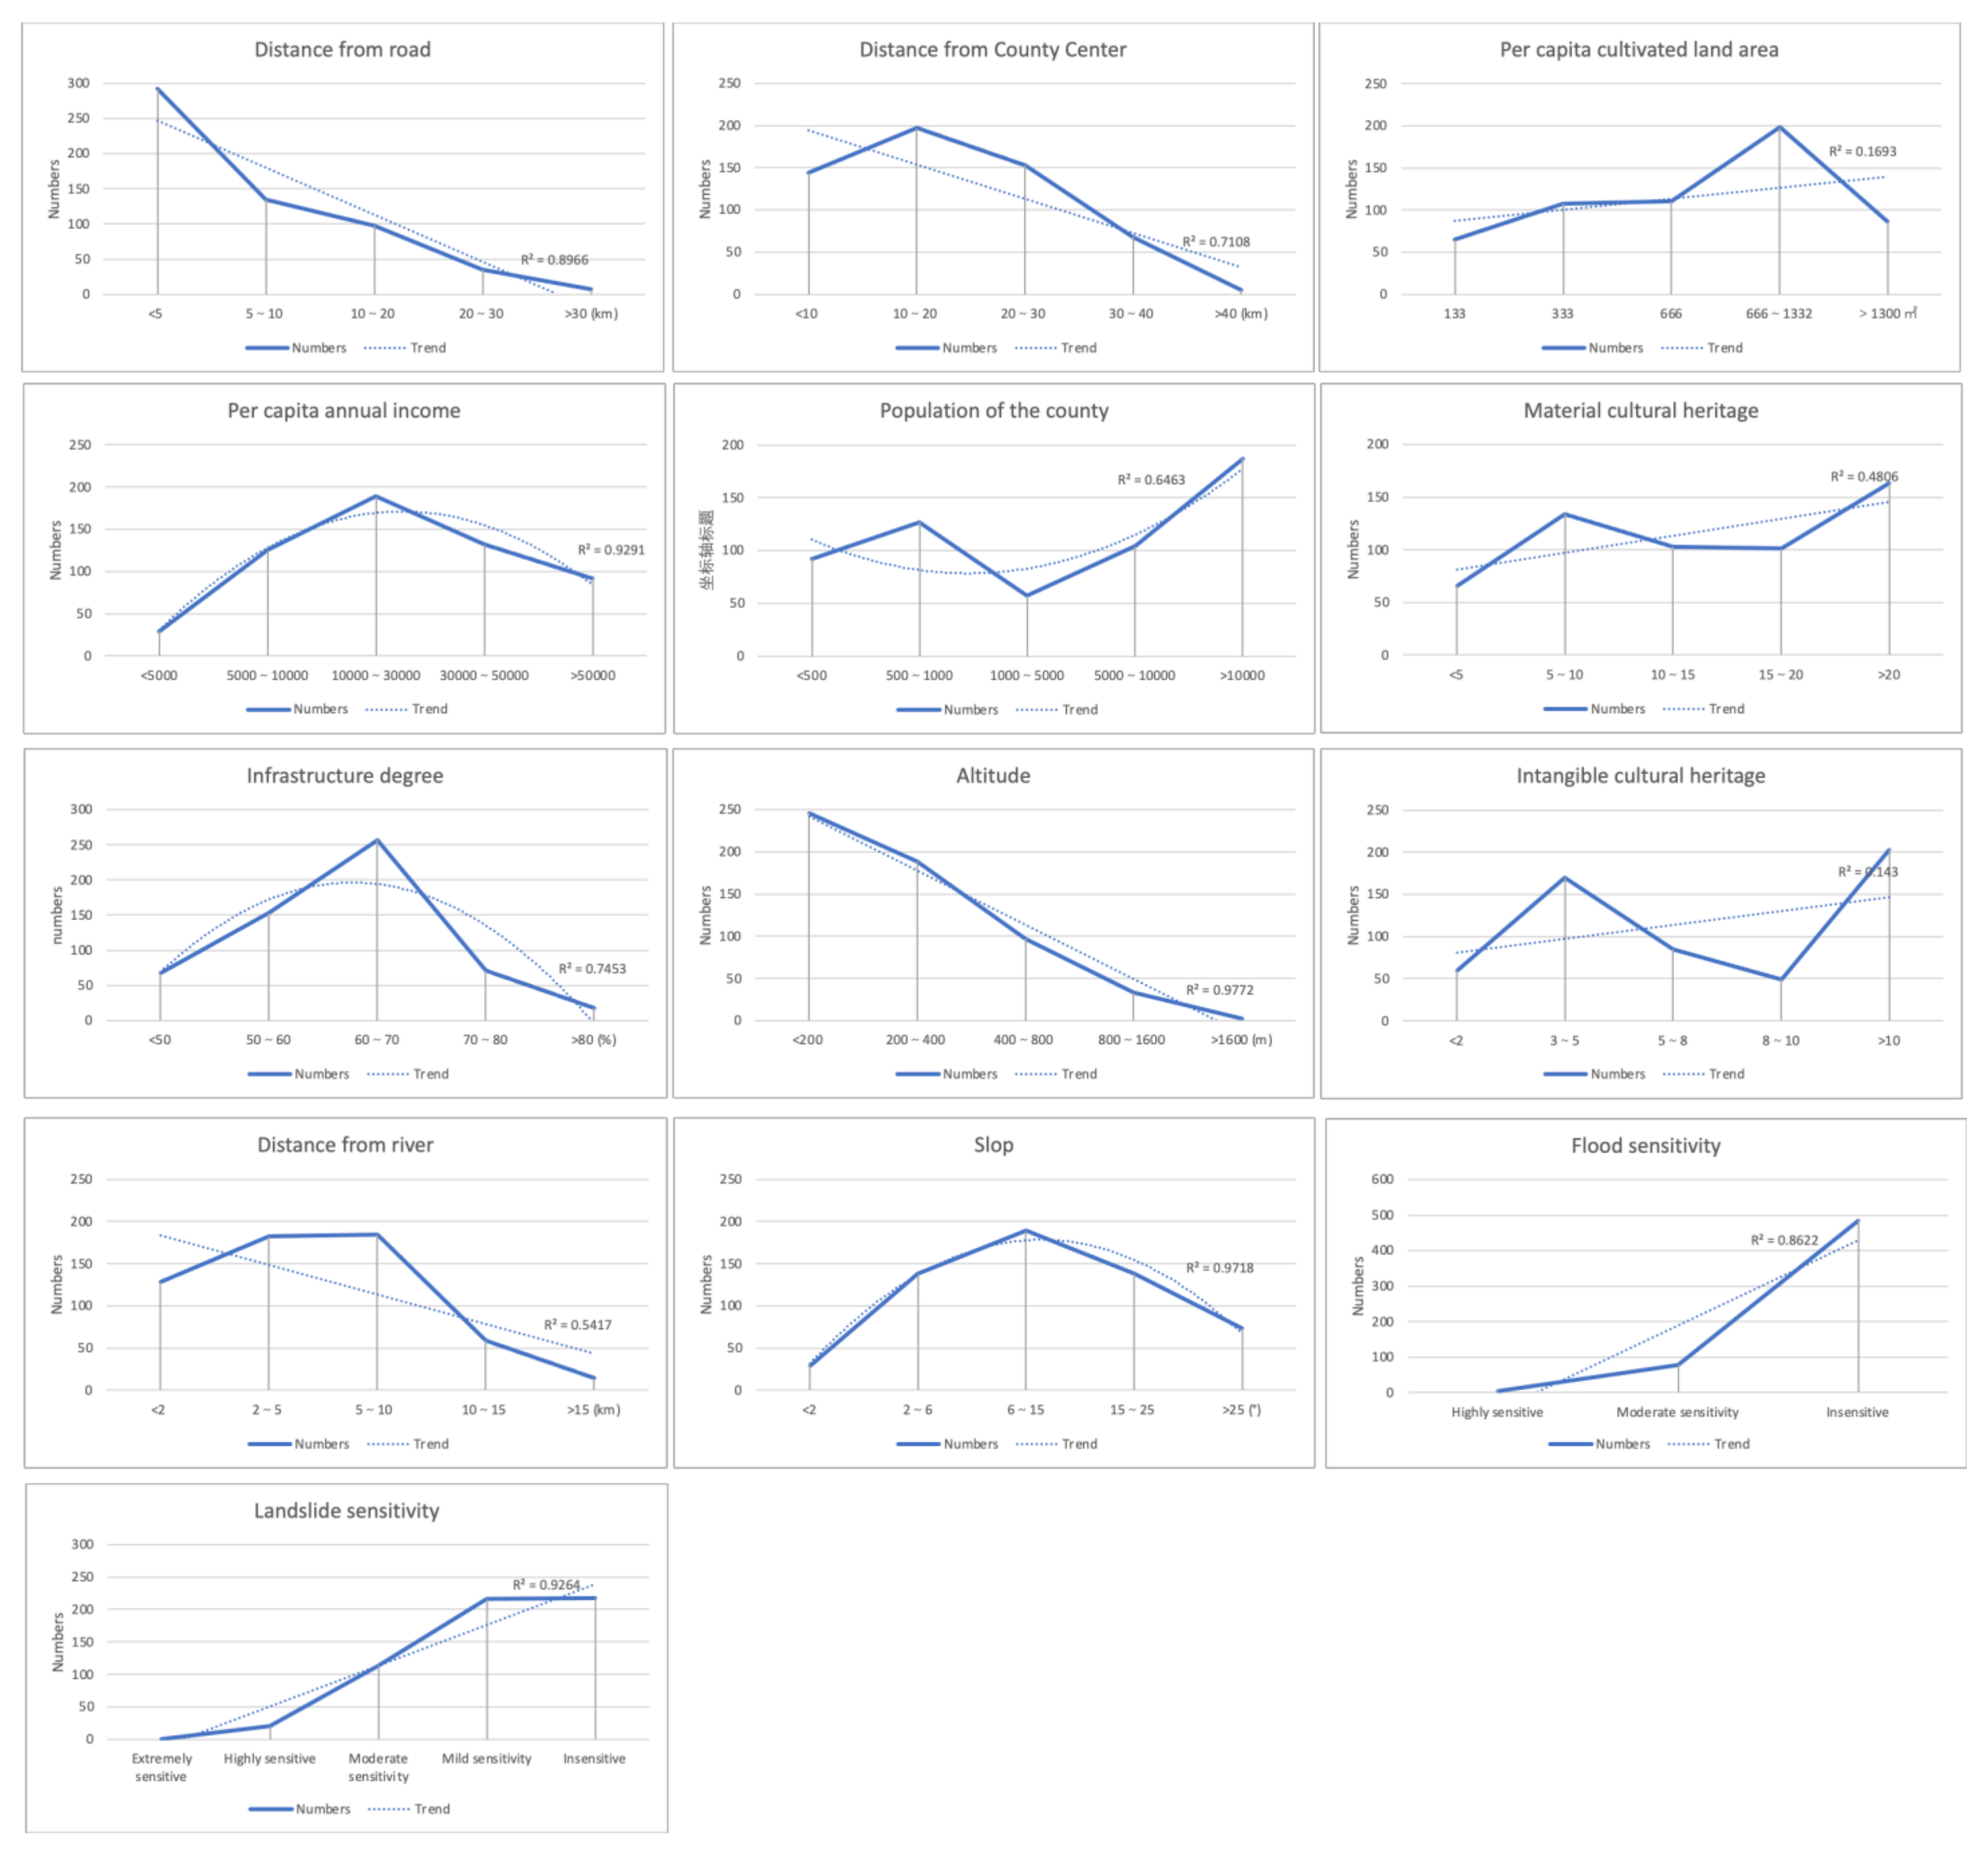
3.4.1. Factor Classification Statistics
3.4.2. Weight of Indicator Layer
3.4.3. Suitability Evaluation Indicator Table
4. Suitability Evaluation Results
4.1. Suitability Evaluation and Calculation
4.2. Determination of Partition Threshold
4.3. Suitability Classification Results
5. Discussion
5.1. Advantages of Spatial Distribution Suitability Evaluation Model Based on Geodetector and AHP
- (1)
- The spatial distribution suitability of ethnic minority villages is affected by many factors. The suitability analysis factors of villages in different regions are different, especially in Fujian, where there are many mountains and hills, the natural conditions are complex and changeable, and disasters occur relatively frequently. The selection of factors should be more targeted. In the past, due to the limitations of various conditions, the evaluation indicators usually selected terrain, roads, towns, rivers, etc., with less consideration of disasters and economy [14]. According to the topographic characteristics of Fujian Province, this paper constructs an evaluation indicator system by integrating 13 factors such as landslide sensitivity, flood sensitivity, and cultural heritage, which improves the scientific and rationality of the evaluation results to a certain extent.
- (2)
- Compared with only using the AHP method to establish the suitability evaluation model, the evaluation model of Village Spatial Suitability through geographical detectors and the AHP method is more scientific. In the study, the relative importance of each factor is ranked numerically, that is, the relative importance of the distance from the road (A), the distance from the County Center (B), the per capita income of the village (C), the urbanization rate of the county where the village is located (D), the slope (E), the altitude (F), the landslide sensitivity (G), the distance from the river (H), the flood sensitivity (I), the number of ethnic minorities in the village (J), the number of intangible cultural heritage (K), the number of material cultural heritage (L), and the per capita cultivated land area (M) are sorted, The results were C > D > J > K > L > M > H > F > E > I > G > B > A, which is inconsistent with the ranking results of the relative importance of factors given based on the experience of researchers [52]. The intensity relationship of the intermediate index layer is calculated by factor interaction. The intensity relationship of social economy, natural geography, and cultural life is 9:7:10; this is not consistent with the result of the indicator layer strength relationship given based on the experience of researchers [14,15]. Therefore, it makes up for the deficiency in the evaluation model of AHP, that is, relying on the experience of researchers or experts to determine the relationship between factors, to obtain the weight assignment, which will cause deviation in the results.
5.2. Ethnic Minority Villages in Each City Should Be Planned According to the Suitability Difference of Spatial Distribution
- Ethnic minority villages in the most suitable areas have a better location, economic and traffic conditions, fewer natural disasters, complete infrastructure, relatively complete functions, and the fastest urbanization process. For example, Fuzhou and Quanzhou should avoid the excessive urbanization of ethnic minority villages, which leads to the disappearance of the cultural characteristics of ethnic minority villages. They should not adopt the development strategy of emphasizing economy over culture. They should promote industrial integration and take a green and high-quality development path. There are many ethnic minority villages in Ningde City. In the process of developing the village economy, we should strengthen the protection of build-style and form a regional development model for ethnic minorities.
- The economic, transportation, urbanization, population, and other conditions of ethnic minority villages in general suitable areas are all driven by the radiation of the most suitable areas. The terrain is relatively flat, and there are few natural disasters. Governments at all levels should do a good job in resource allocation between the most suitable and general suitable areas. They should take the villages in this area as the key development object, strengthen the protection of their ecological environment, and highlight the characteristics of ecology and livability.
- The economic conditions of ethnic minority villages in the basically suitable area are relatively backward, lack development momentum, and it is difficult to maintain long-term development. Moreover, the average altitude is high, and the infrastructure construction is difficult, which is limited by natural disasters. More than half of the ethnic minority villages in Longyan city are distributed in this area. It is necessary to strengthen the emergency management of ethnic minority villages for natural disasters and improve the infrastructure construction of villages in this area as much as possible.
- The minority villages in the unsuitable area are surrounded by mountains, poor location conditions, poor traffic conditions, and low economic level, which lead to the serious loss of the village population and accelerates the decline of villages. More than half of the ethnic minority villages in Nanping City are in this area. The provincial and municipal governments should strengthen intervention in this area and reasonably promote the village merger and population migration.
6. Conclusions and Future Work
- Thirteen factors of socio-economy, natural geographical, and culture life are selected for superposition analysis with the spatial distribution points of ethnic minority villages. Through the quantification of underground detectors, it is concluded that the per capita income factor has the greatest impact on the spatial distribution suitability of Fujian minority villages. The urbanization rate, the number of ethnic minorities, and the amount of intangible cultural heritage of the county where the village is located also have a great influence. Through comprehensive evaluation, the impact of cultural life indicators on the suitability of the spatial distribution of the village is greater than that of socio-economic indicators and natural geographical indicators. The intensity relationship is 9:7:10.
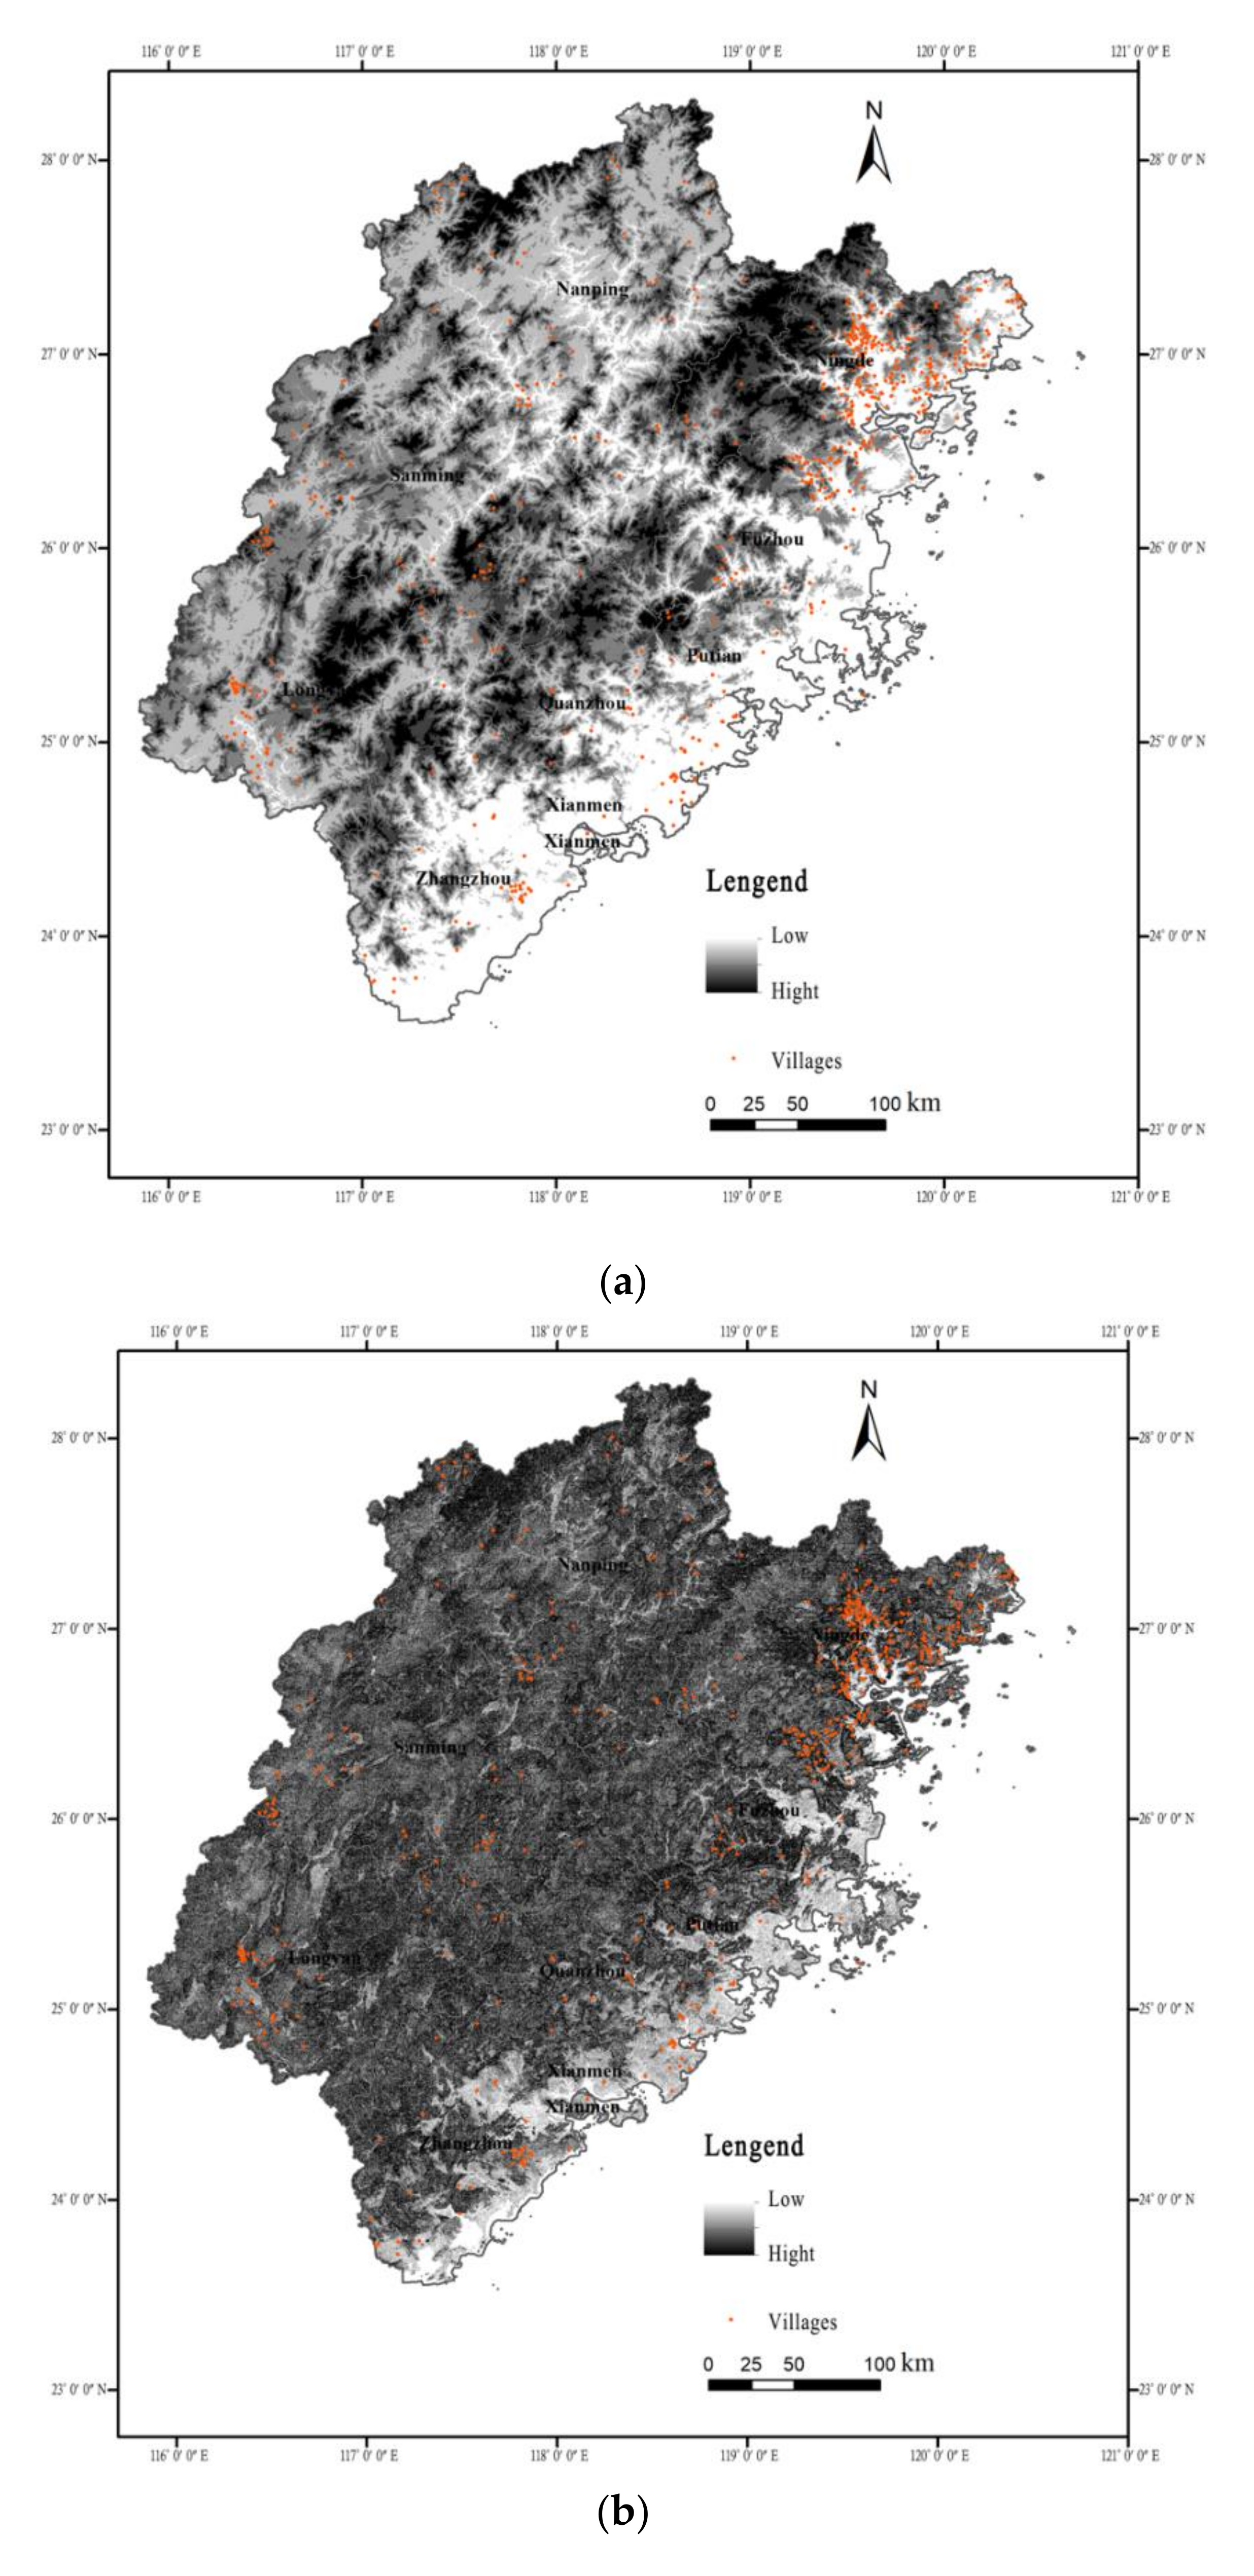
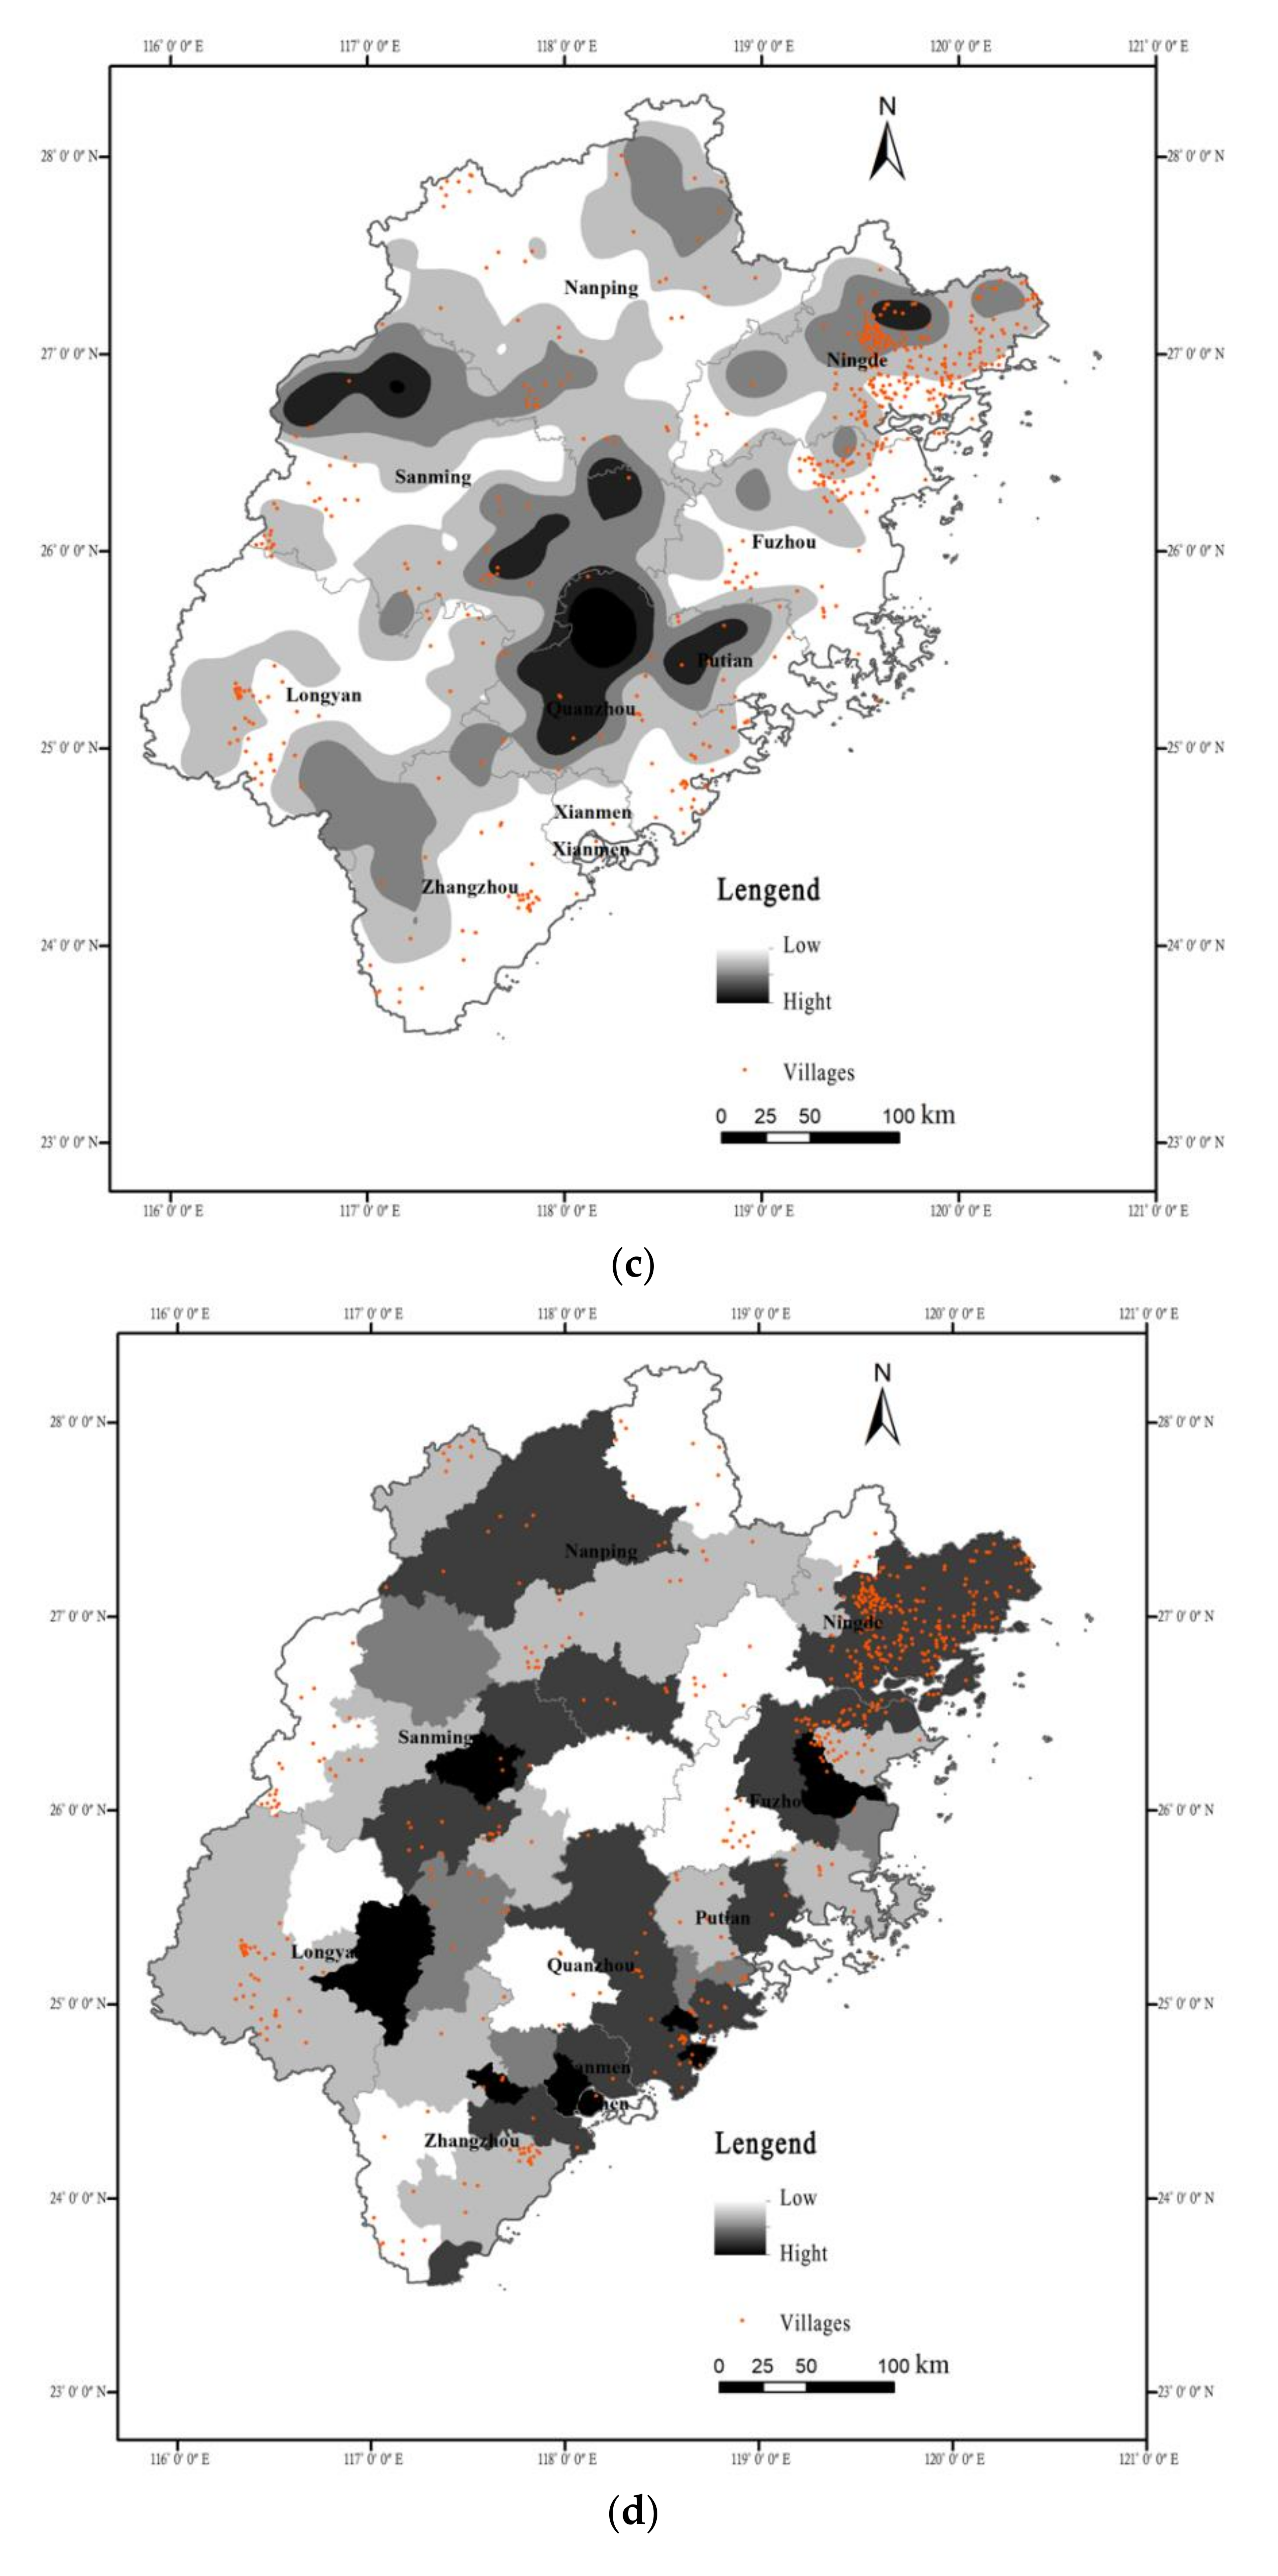
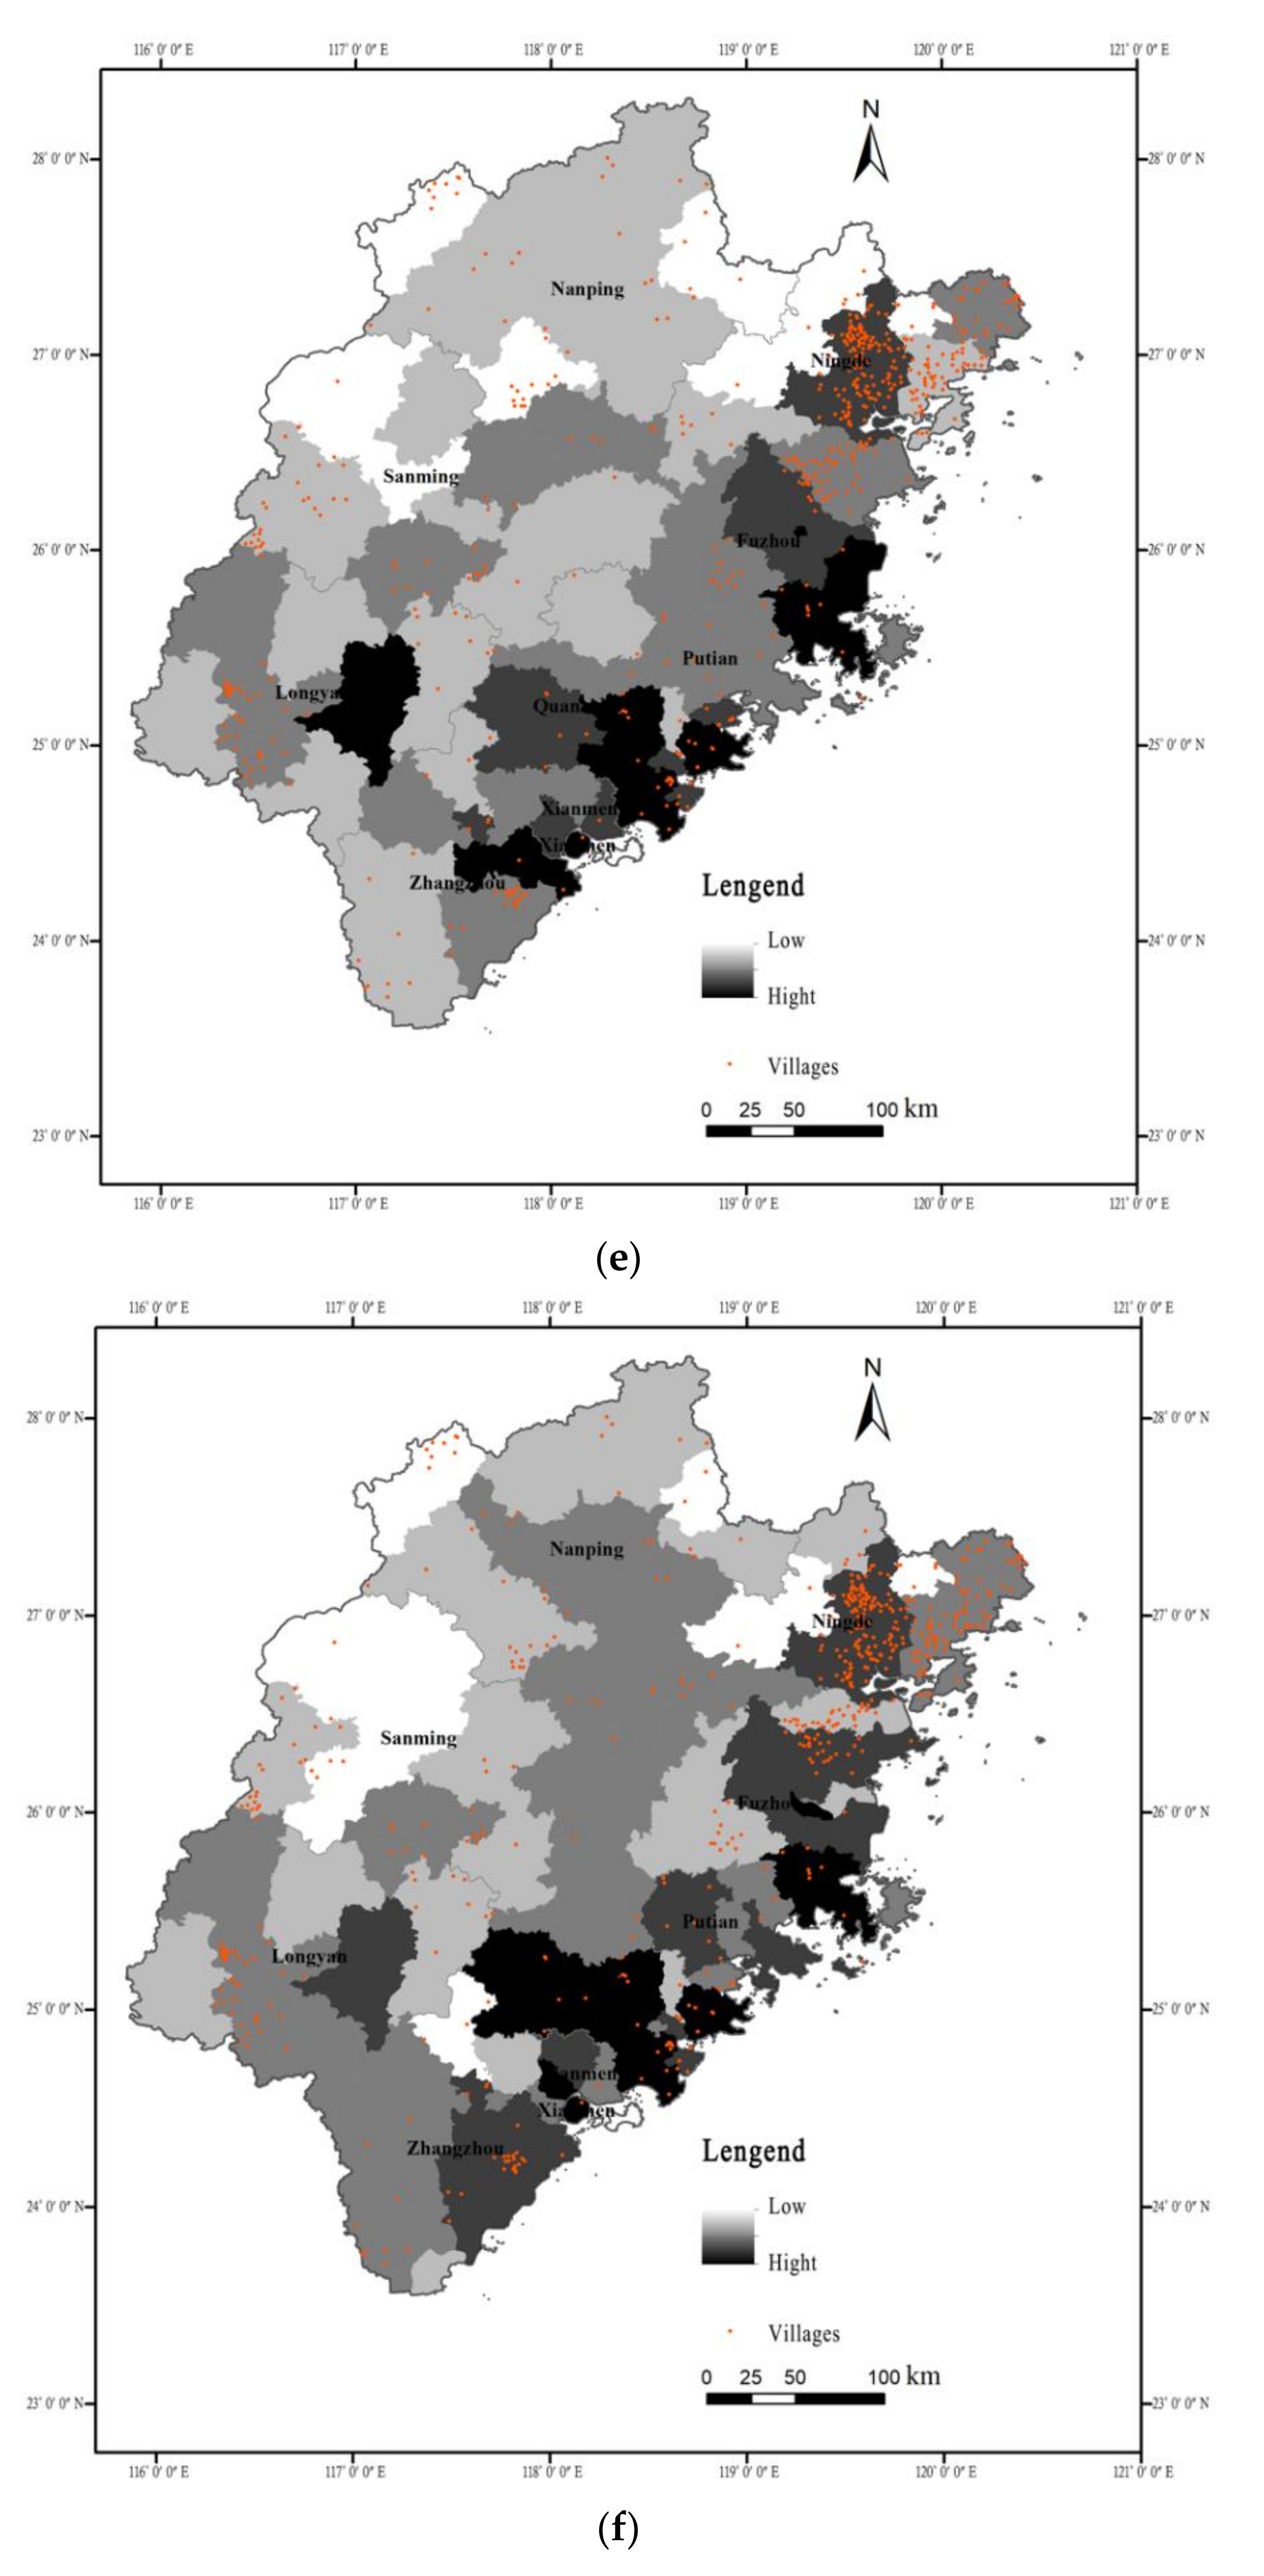
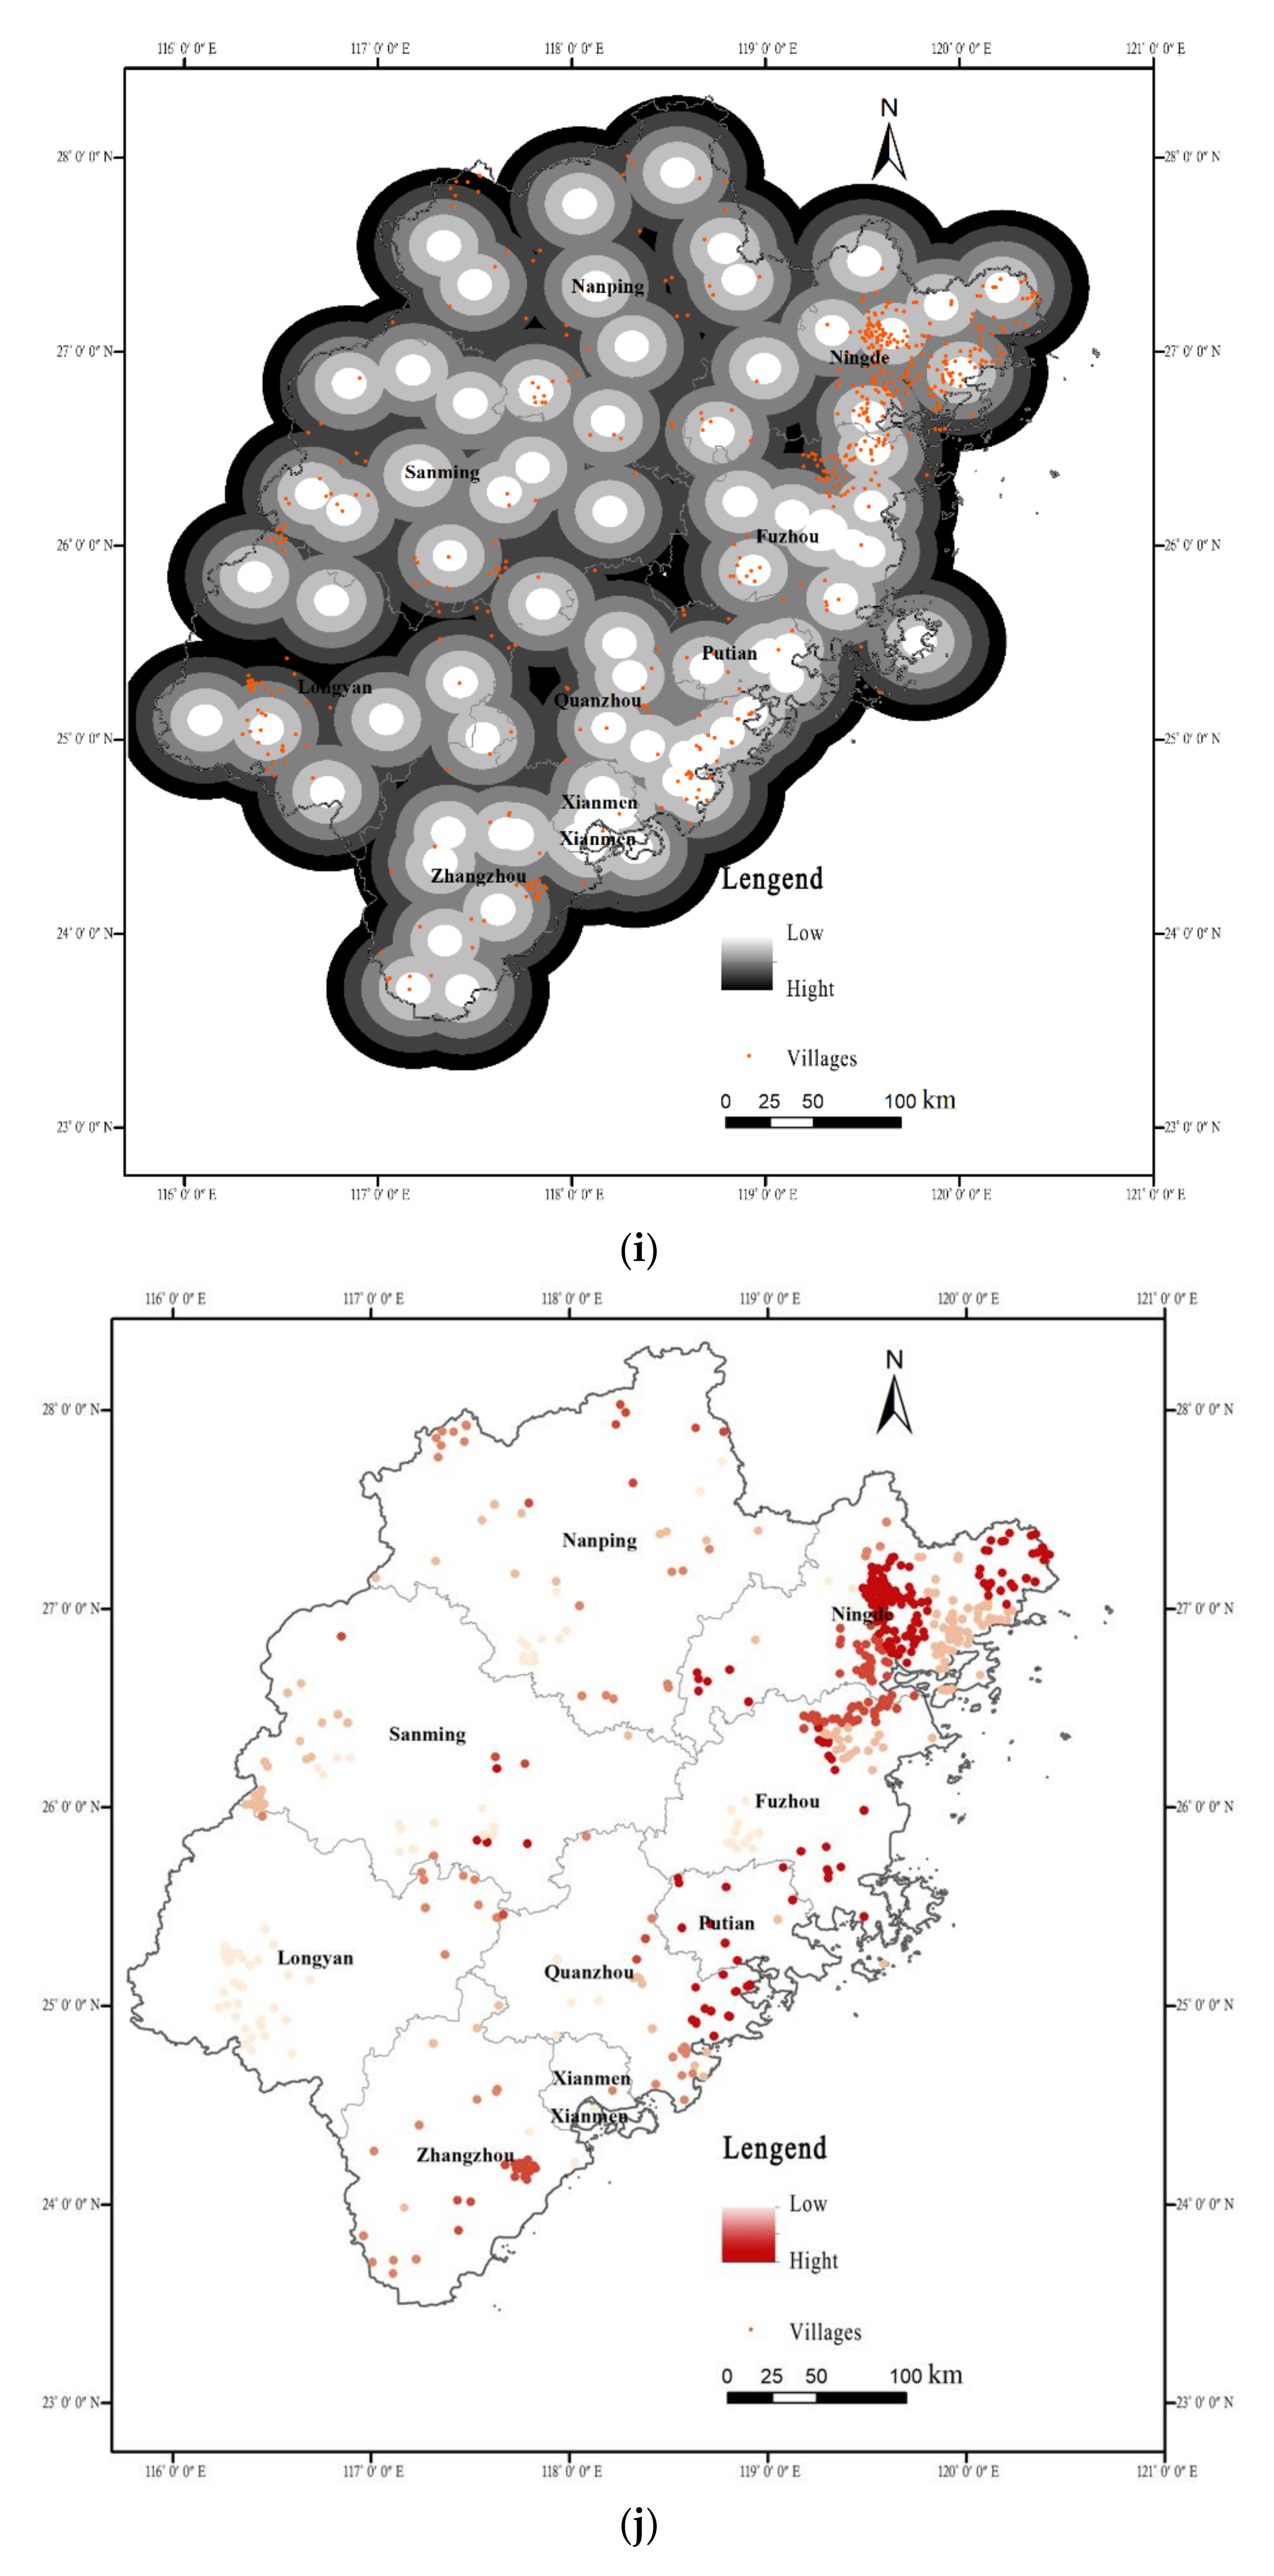
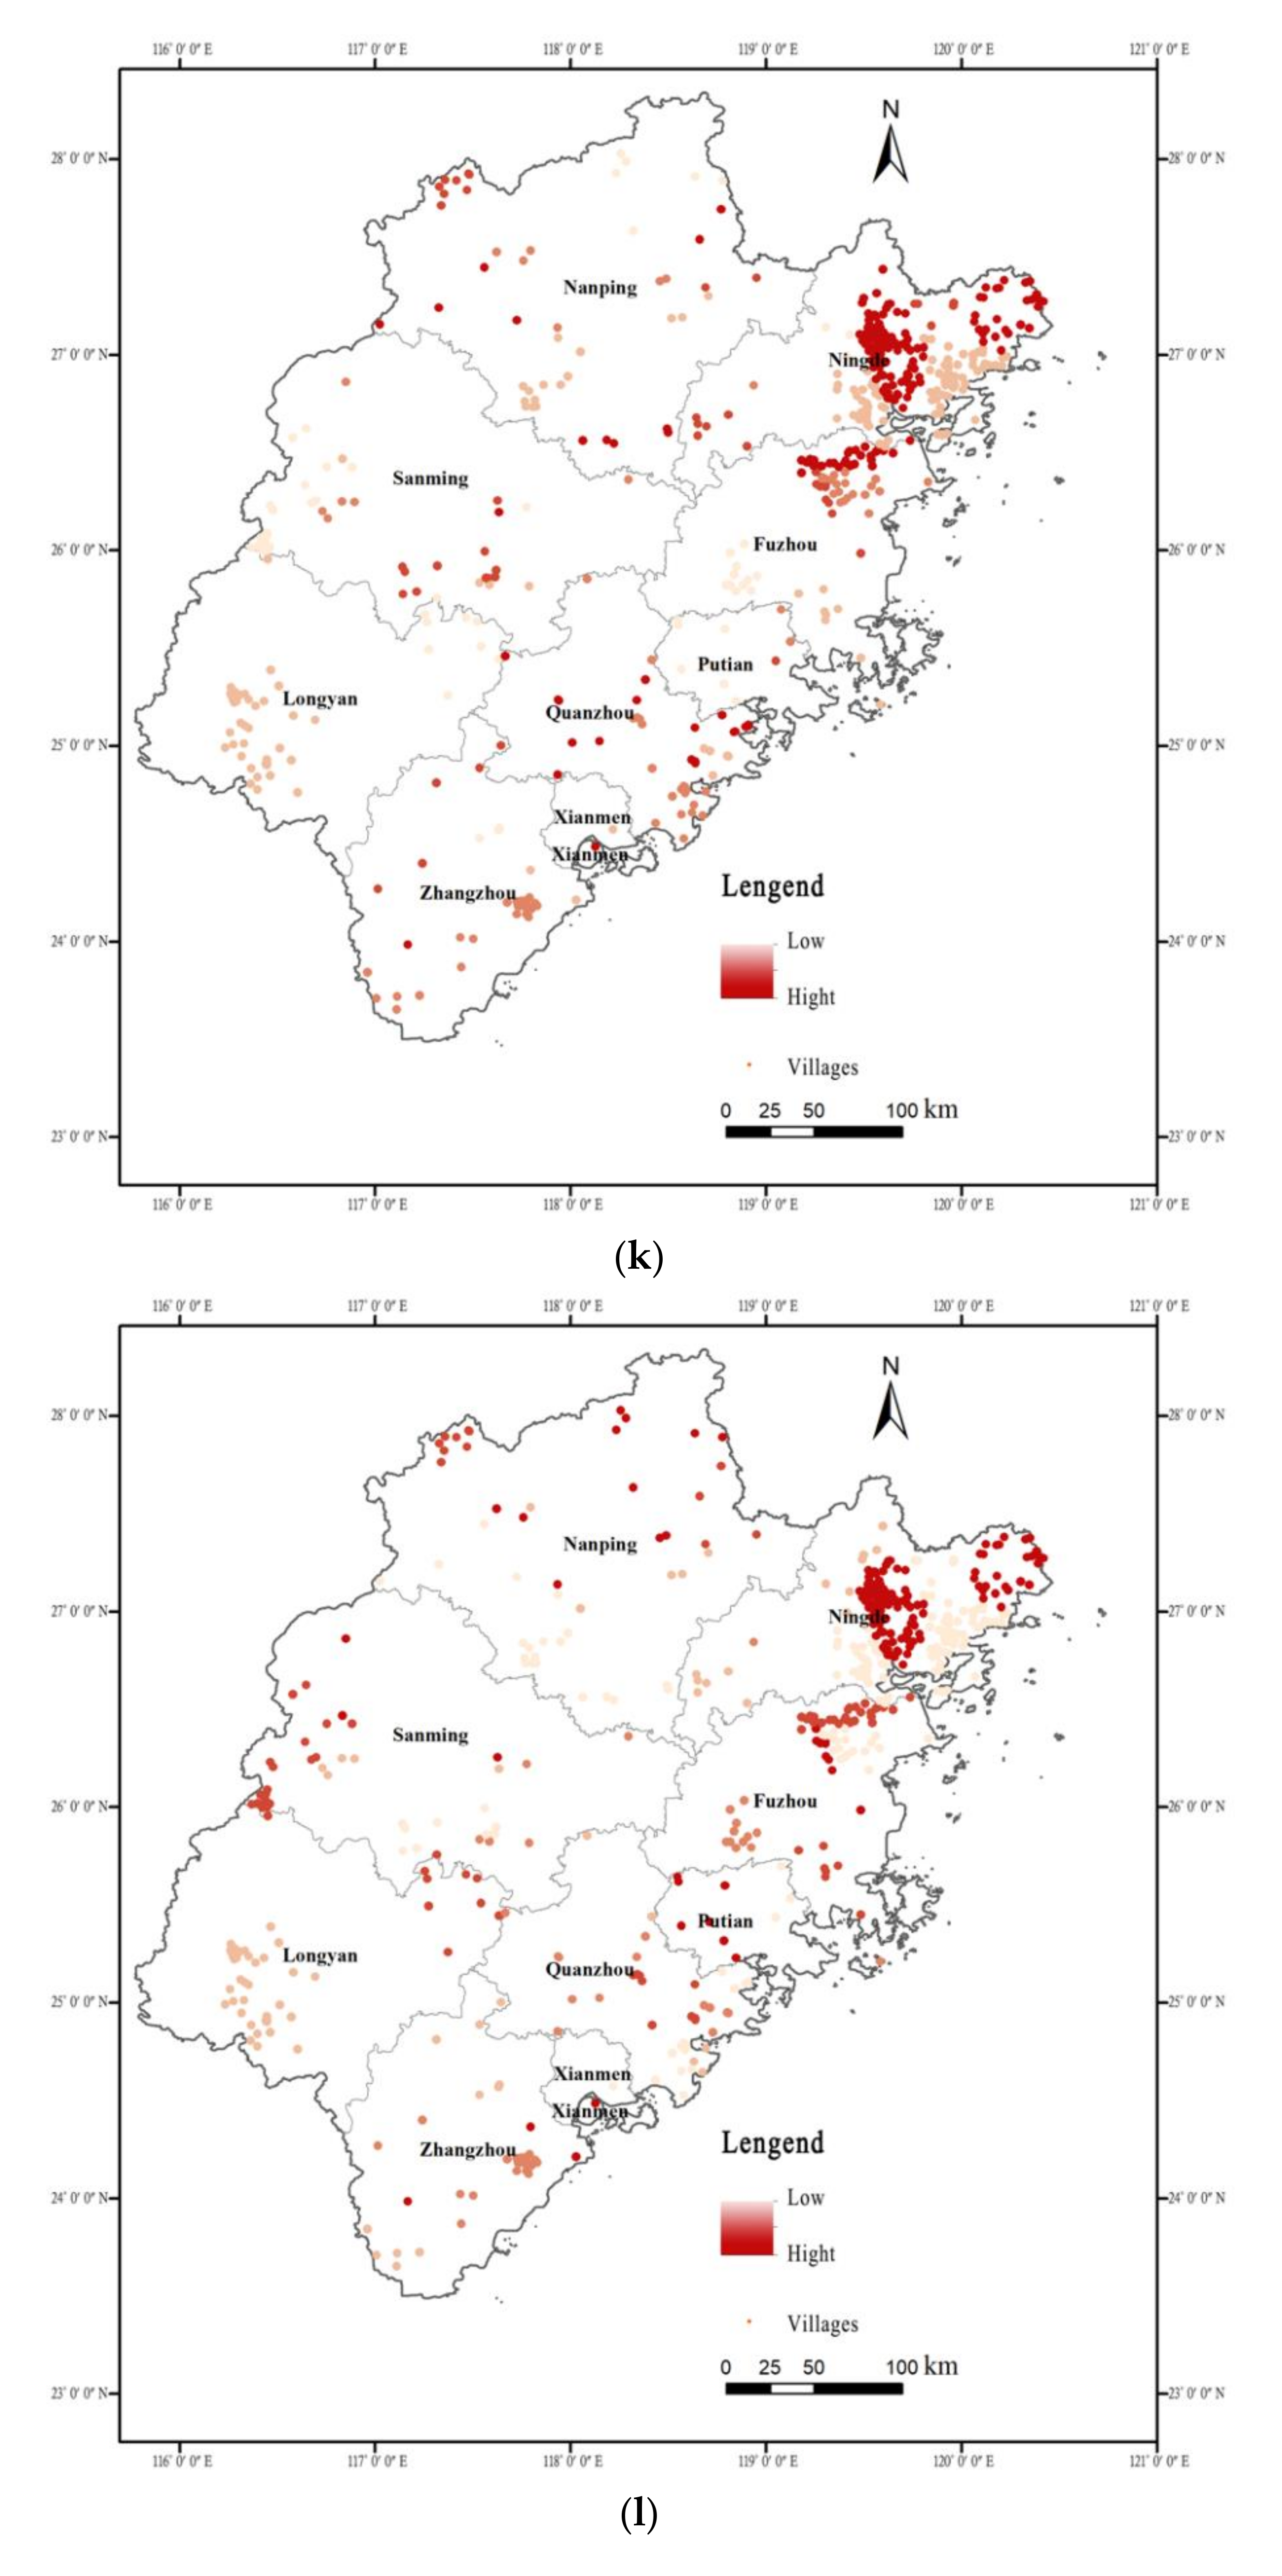
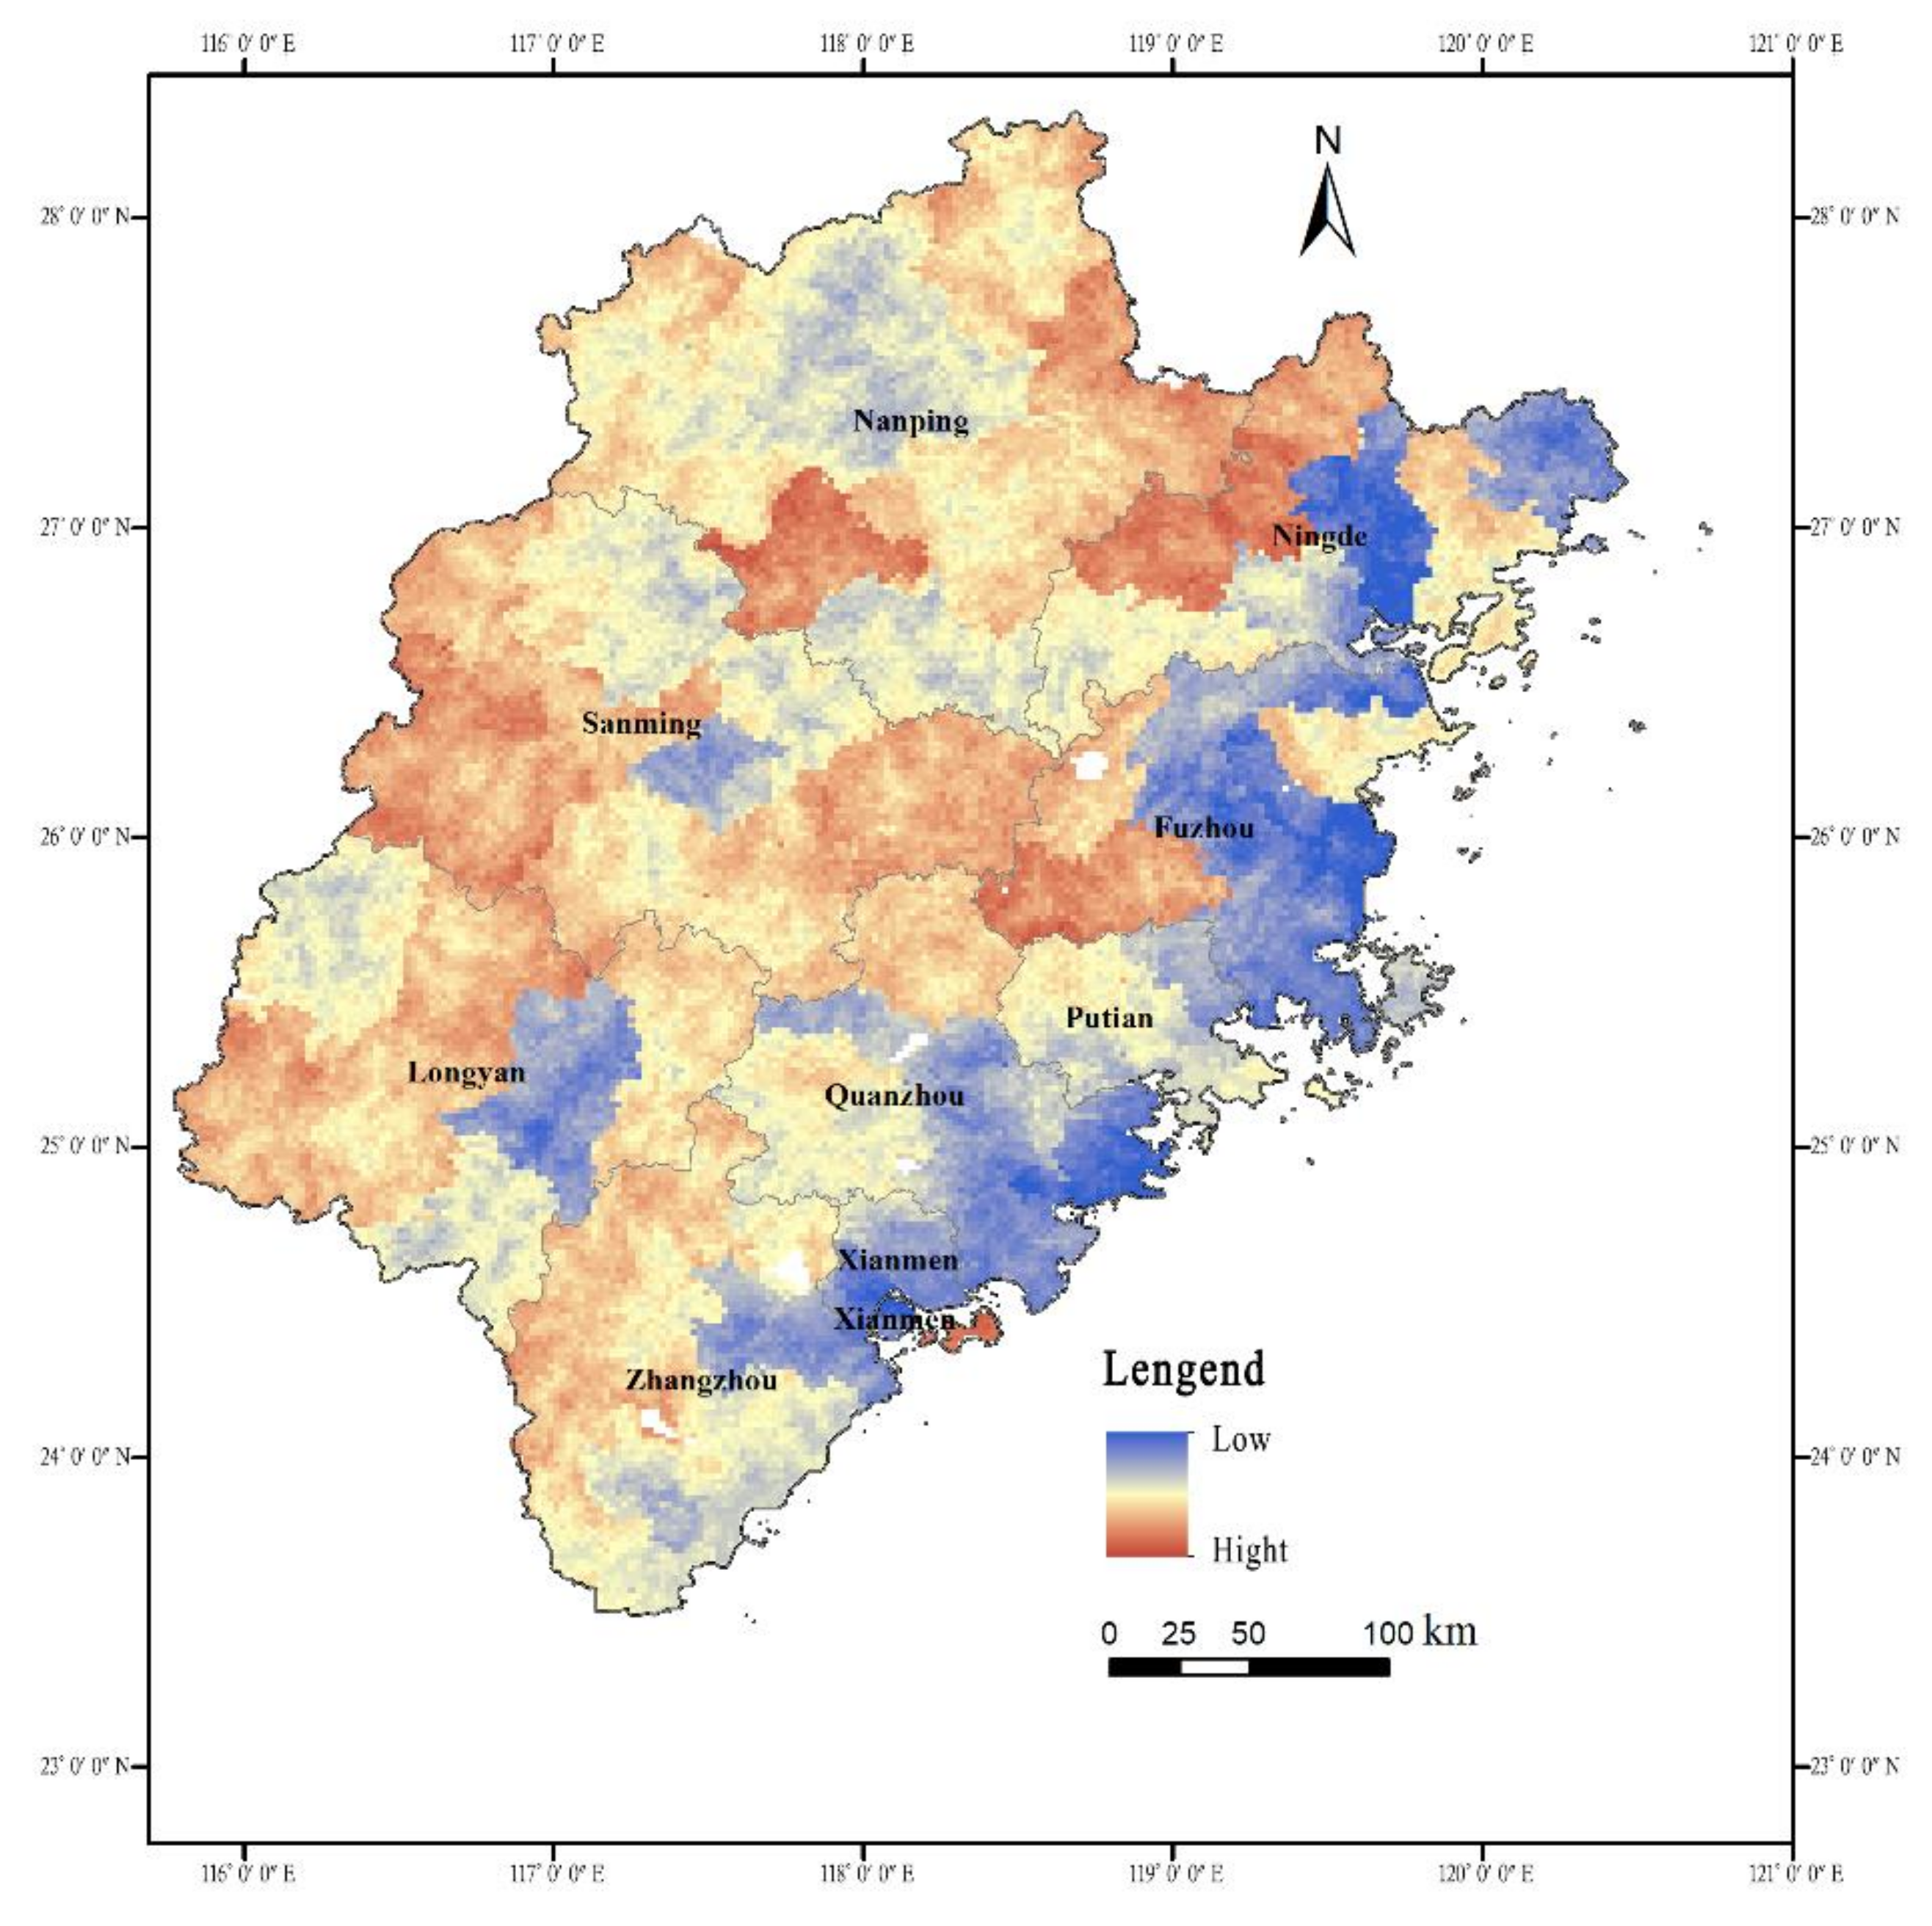
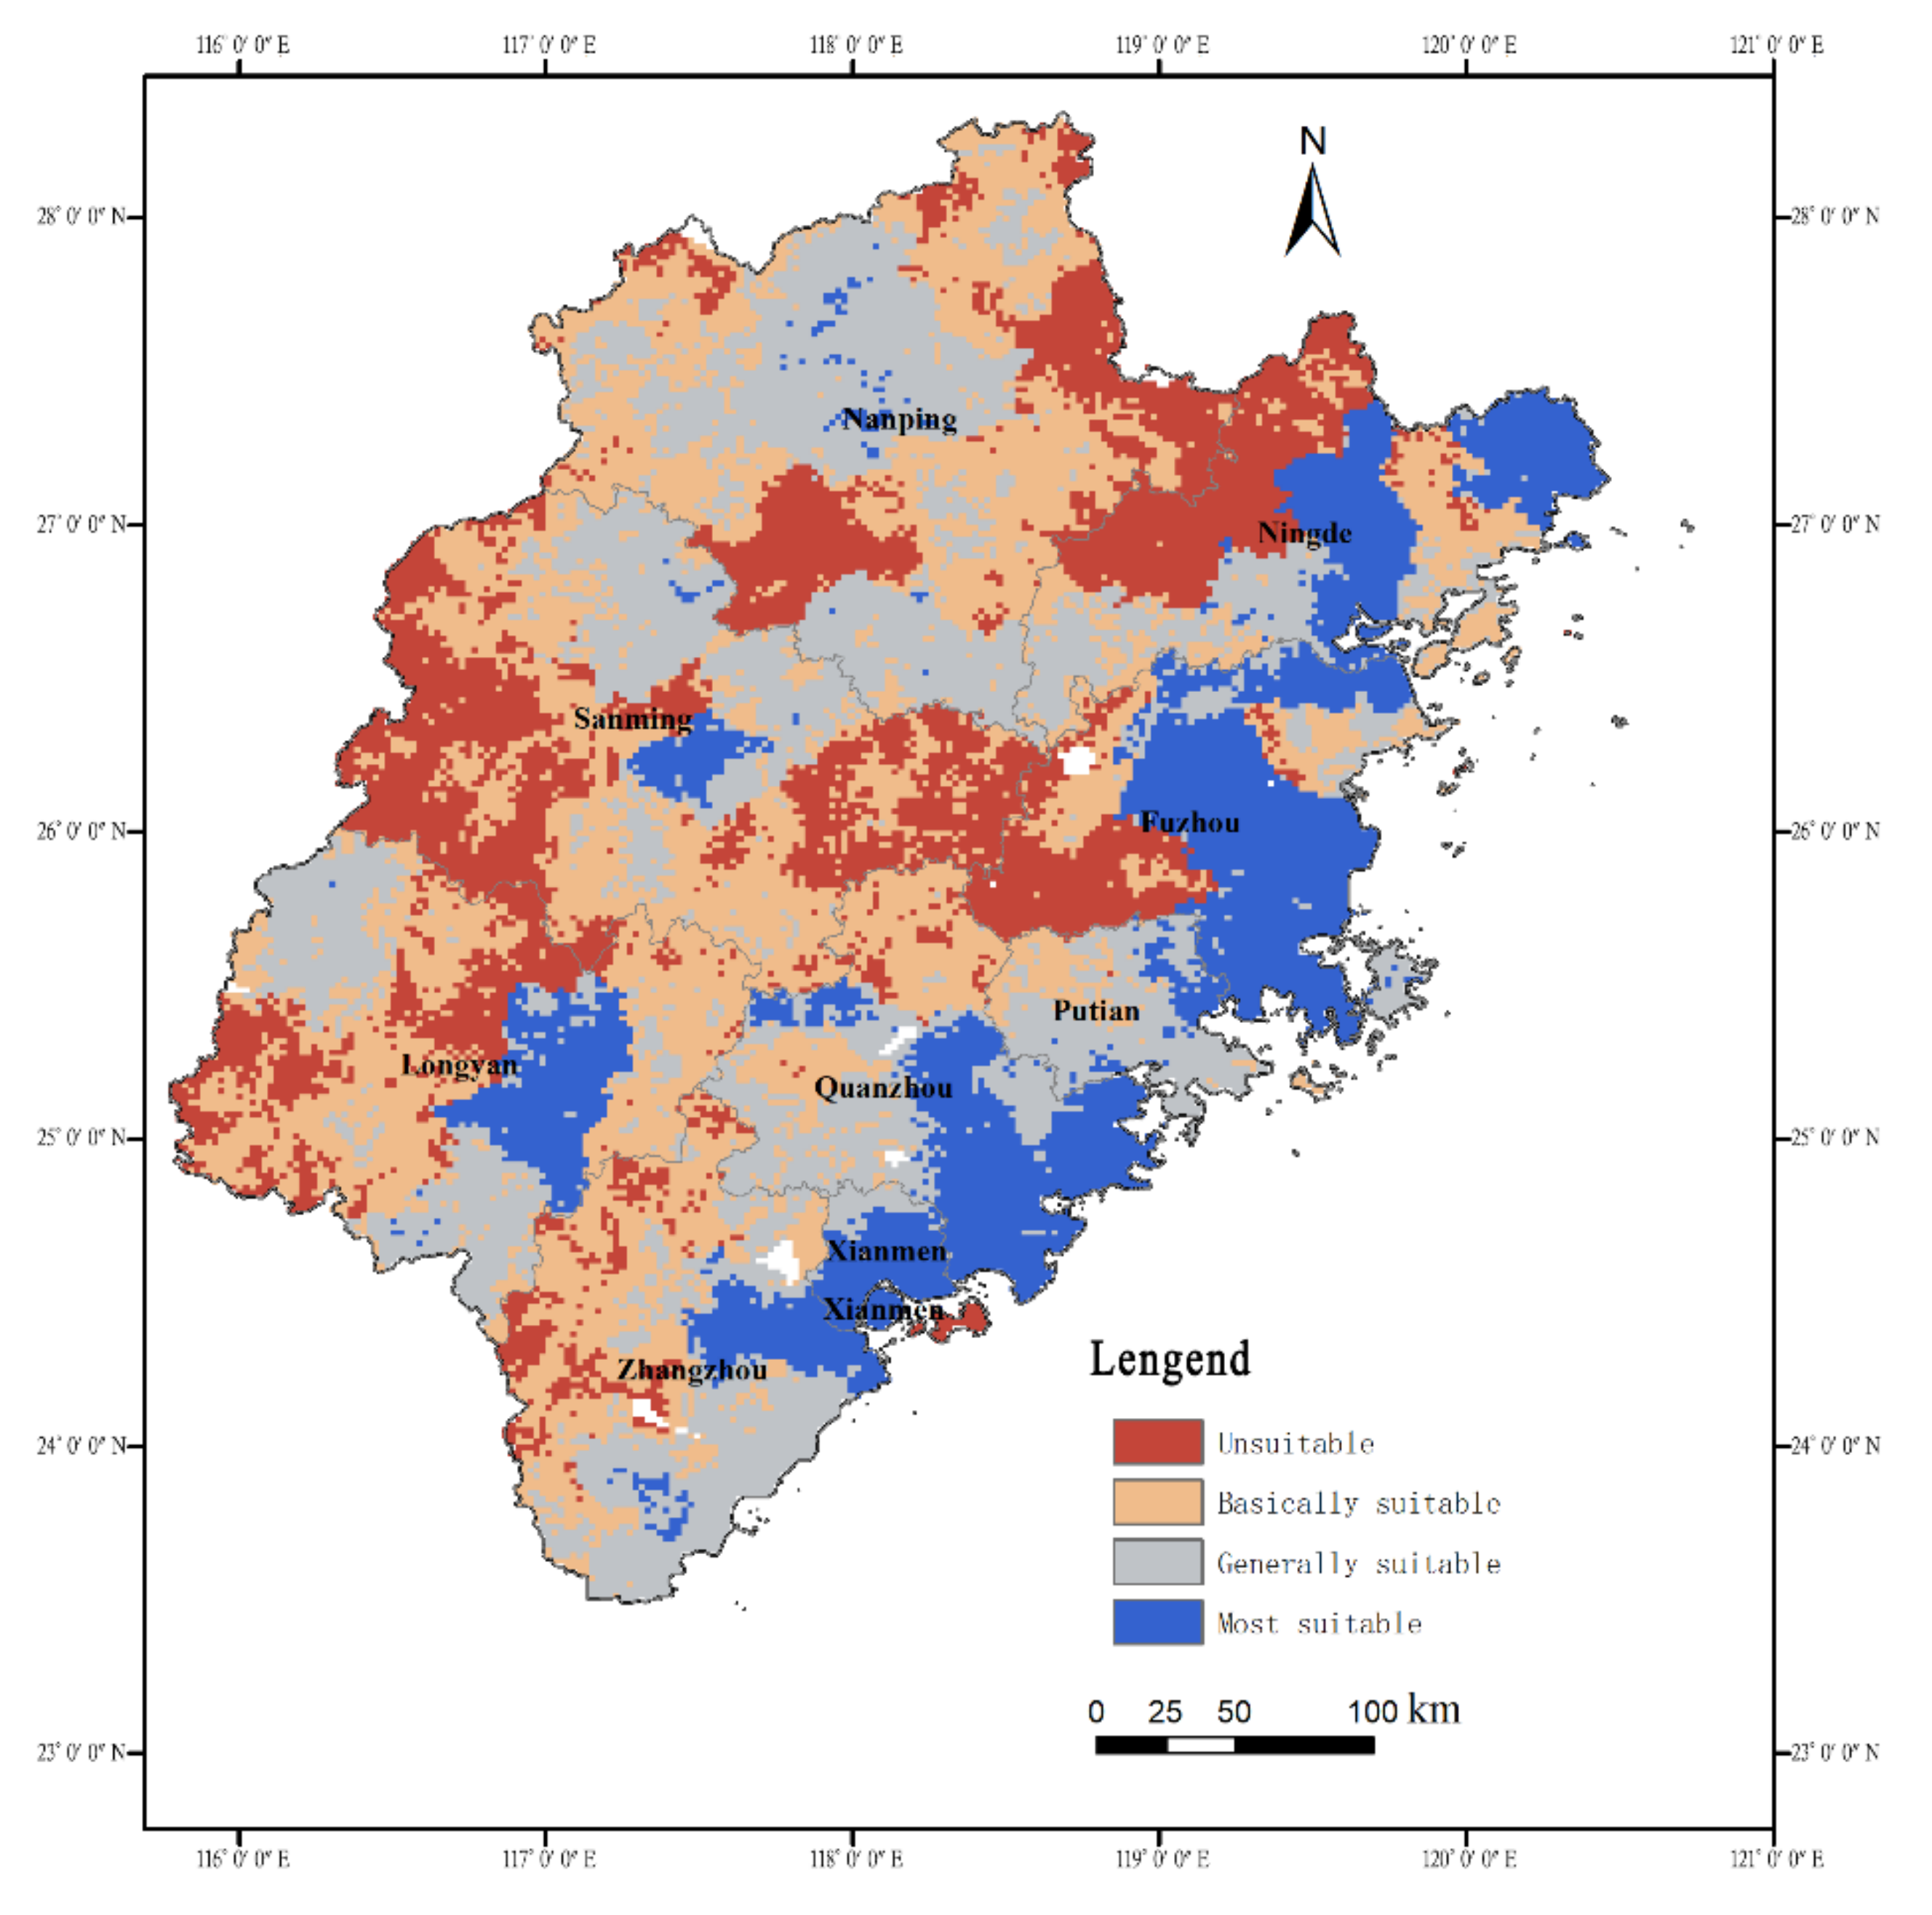
- The high suitability value is distributed in the southeast coastal and central areas of Fujian Province, and gradually decreases from east to west. The southeast coastal area of Fujian Province is flat, with a small impact of natural disasters and a dense population. Driven by the strong social economy, it is the most suitable area for ethnic minority villages to live. The regional area accounts for 21.05%, and 24% of ethnic minority villages are distributed in this area; the central and western, northwest, and southwest regions of Fujian Province have low average altitude, convenient transportation, and suitable environment, which are generally suitable for the development of ethnic minority villages. The regional area accounts for 33.59%, and 51% of ethnic minority villages are distributed in this region; the central and northern, central, and southern regions of Fujian Province have high average altitude and high sensitivity to natural disasters, which limit the economic development and construction of villages. They are basically suitable for the development of ethnic minority villages. The regional area accounts for 28.20%, and 14% of ethnic minority villages are distributed in this area; the northern and western regions of Fujian Province are surrounded by mountains and hills, far away from the southeast coastal areas with strong economic strength and low sensitivity to natural disasters. However, they are far from the County Center, with a sparse road network and inconvenient traffic. They are not suitable for village development. The regional area accounts for 17.16%, and 11% of ethnic minority villages are distributed in this region. In general, 82.84% of the area in Fujian Province is suitable for the development of minority villages, and the number of minority villages distributed in suitable areas accounts for 89%.
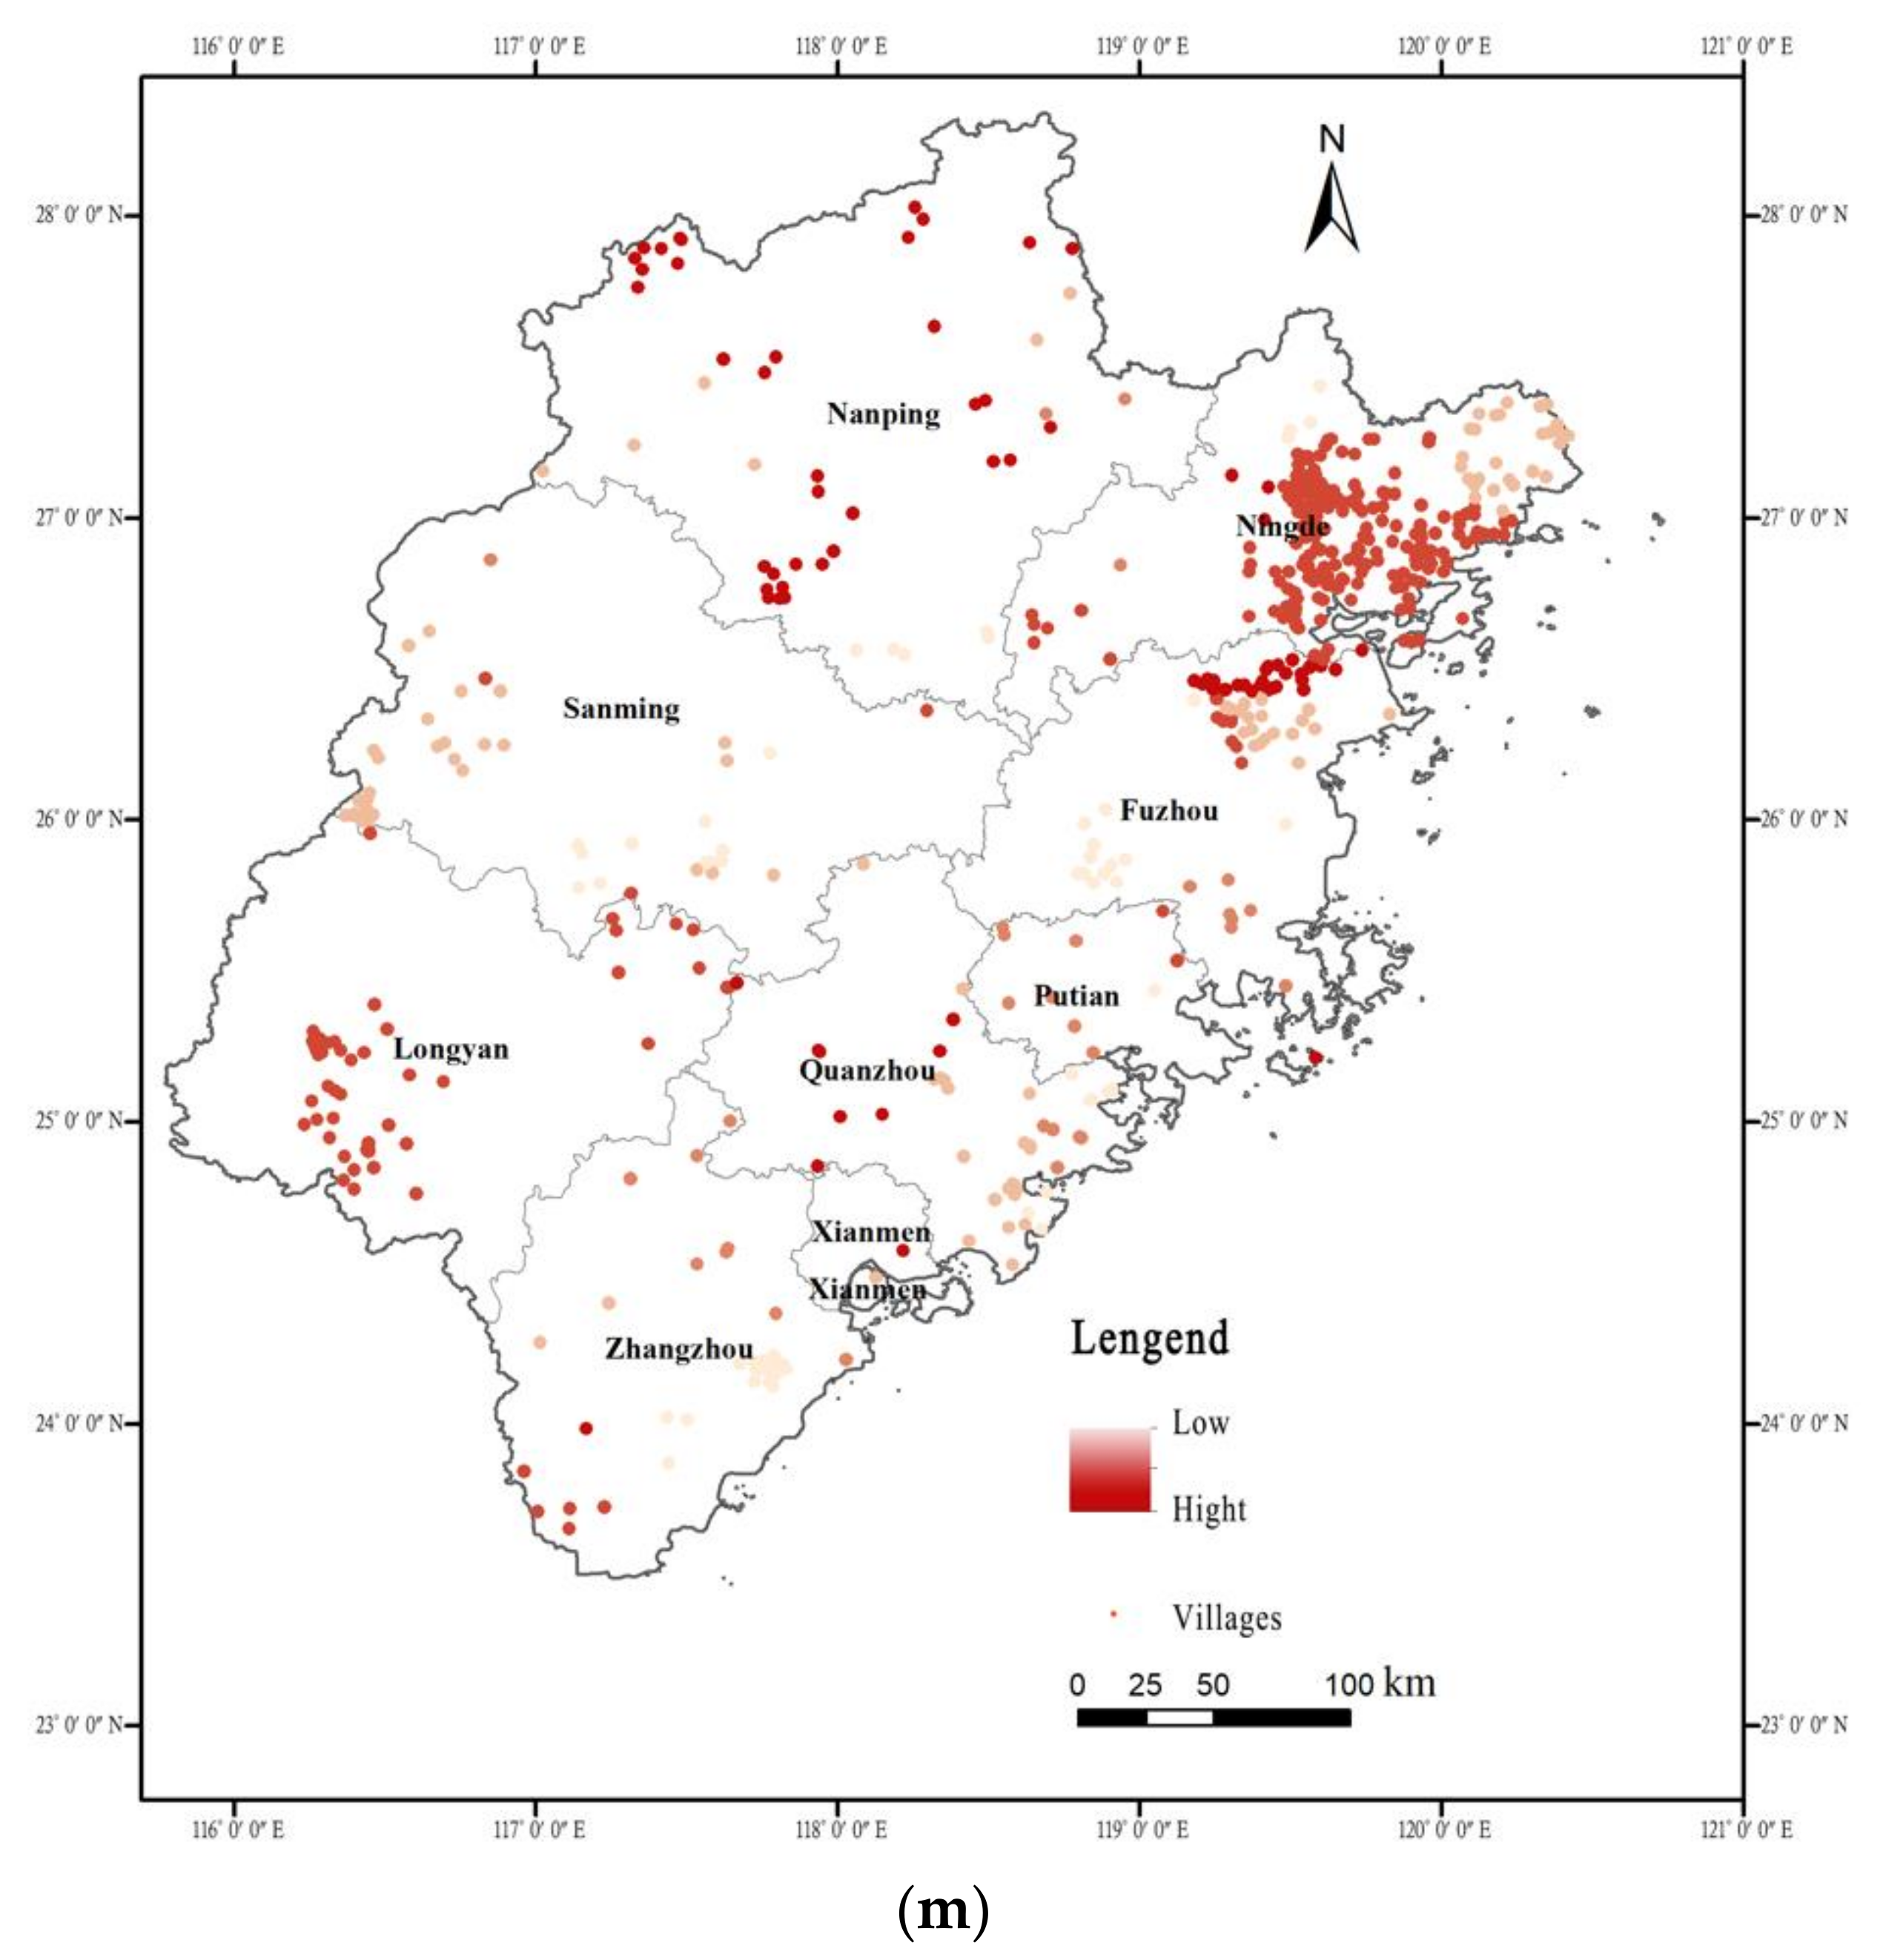
- Ningde City and Quanzhou City are the most suitable cities for the number of ethnic minority villages because the ethnic minority villages in these two cities are mostly distributed in areas relatively close to the central urban area, with good economic conditions, flat terrain, and convenient transportation. Among many cities, Nanping City is the most unsuitable city for the development of ethnic minority villages, followed by Sanming City. Restricted by the terrain, Nanping City has a backward economy, sparse road network, inconvenient transportation, and does not have good development conditions, resulting in serious village population loss.
Author Contributions
Funding
Institutional Review Board Statement
Informed Consent Statement
Data Availability Statement
Acknowledgments
Conflicts of Interest
Appendix A

| No. | Name | Y | A | B | C | D | E | F | G | H | I | J | K | L | M |
|---|---|---|---|---|---|---|---|---|---|---|---|---|---|---|---|
| 1 | Huanghuagang | Y3 | A3 | B5 | C4 | D5 | E3 | F3 | G2 | H5 | I3 | J5 | K4 | L5 | M4 |
| 2 | Emei | Y3 | A3 | B5 | C4 | D5 | E2 | F4 | G2 | H4 | I3 | J5 | K4 | L5 | M3 |
| 3 | furong | Y3 | A3 | B4 | C4 | D5 | E3 | F3 | G2 | H4 | I3 | J5 | K4 | L5 | M3 |
| 4 | Dangyang | Y4 | A2 | B4 | C4 | D5 | E2 | F3 | G1 | H2 | I3 | J5 | K4 | L5 | M3 |
| 5 | Rixi | Y4 | A2 | B4 | C4 | D5 | E3 | F5 | G1 | H2 | I3 | J5 | K4 | L5 | M3 |
| 6 | Dongping | Y4 | A3 | B4 | C4 | D5 | E5 | F3 | G1 | H3 | I3 | J5 | K4 | L5 | M3 |
| 7 | Nanfeng | Y4 | A3 | B4 | C4 | D5 | E3 | F3 | G1 | H3 | I3 | J5 | K4 | L5 | M3 |
| 8 | Shanxiuyuan | Y4 | A3 | B2 | C4 | D5 | E4 | F4 | G1 | H3 | I3 | J5 | K4 | L5 | M4 |
| 9 | Liujin | Y3 | A2 | B2 | C4 | D3 | E3 | F4 | G1 | H3 | I3 | J4 | K5 | L4 | M1 |
| 5 | Tianzhu | Y3 | A5 | B5 | C5 | D2 | E3 | F5 | G1 | H3 | I2 | J2 | K3 | L1 | M2 |
| 11 | Houguan | Y3 | A5 | B3 | C5 | D2 | E3 | F5 | G1 | H3 | I2 | J2 | K3 | L1 | M2 |
| 12 | Hongfeng | Y4 | A4 | B5 | C5 | D2 | E2 | F4 | G1 | H2 | I2 | J2 | K3 | L1 | M2 |
| 13 | Qiuci | Y3 | A4 | B5 | C5 | D2 | E3 | F4 | G1 | H3 | I2 | J2 | K3 | L1 | M2 |
| 14 | Zhenru | Y4 | A5 | B5 | C5 | D2 | E3 | F4 | G1 | H2 | I2 | J2 | K3 | L1 | M2 |
| 15 | Xili | Y4 | A4 | B5 | C5 | D2 | E3 | F5 | G1 | H3 | I2 | J2 | K3 | L2 | M2 |
| 16 | Dongyan | Y4 | A3 | B5 | C5 | D2 | E2 | F5 | G2 | H4 | I3 | J2 | K3 | L2 | M2 |
| 17 | Tangban | Y4 | A3 | B4 | C5 | D2 | E3 | F5 | G2 | H4 | I3 | J2 | K3 | L2 | M2 |
| 18 | Gaoyue | Y4 | A3 | B4 | C5 | D2 | E3 | F5 | G1 | H3 | I3 | J2 | K3 | L2 | M2 |
| 19 | Lanshan | Y4 | A4 | B5 | C5 | D2 | E2 | F3 | G1 | H3 | I3 | J2 | K3 | L2 | M2 |
| 20 | Zhouxi | Y4 | A5 | B5 | C5 | D2 | E2 | F5 | G1 | H2 | I3 | J2 | K3 | L1 | M2 |
| 21 | Xianping | Y4 | A4 | B4 | C5 | D2 | E3 | F5 | G1 | H1 | I3 | J2 | K3 | L1 | M2 |
| 22 | Linchang | Y4 | A3 | B4 | C5 | D2 | E3 | F3 | G2 | H2 | I3 | J2 | K3 | L1 | M2 |
| 23 | Chishi | Y4 | A3 | B4 | C5 | D2 | E3 | F4 | G1 | H3 | I2 | J2 | K3 | L1 | M2 |
| 24 | Huangjia | Y3 | A5 | B3 | C5 | D2 | E3 | F5 | G1 | H3 | I3 | J2 | K3 | L5 | M2 |
| 25 | Zhen’an | Y2 | A5 | B2 | C5 | D2 | E3 | F5 | G1 | H2 | I3 | J2 | K3 | L5 | M2 |
| 26 | Dongfeng | Y4 | A3 | B4 | C5 | D2 | E4 | F4 | G2 | H3 | I2 | J2 | K3 | L5 | M2 |
| 27 | Qili | Y4 | A3 | B2 | C5 | D2 | E4 | F5 | G1 | H3 | I3 | J2 | K3 | L1 | M2 |
| 28 | Liyang | Y4 | A3 | B2 | C5 | D2 | E3 | F5 | G1 | H3 | I3 | J2 | K3 | L1 | M2 |
| 29 | Shangtugang | Y4 | A5 | B5 | C5 | D4 | E3 | F4 | G1 | H2 | I2 | J4 | K5 | L4 | M5 |
| 30 | Qianfang | Y4 | A5 | B3 | C5 | D4 | E3 | F5 | G2 | H3 | I3 | J4 | K5 | L4 | M5 |
| 31 | Zhuli | Y4 | A5 | B3 | C5 | D4 | E2 | F5 | G2 | H3 | I3 | J4 | K5 | L4 | M5 |
| 32 | Bajing | Y4 | A5 | B3 | C5 | D4 | E3 | F5 | G2 | H3 | I3 | J4 | K5 | L4 | M5 |
| 33 | Baishui | Y4 | A5 | B3 | C5 | D4 | E2 | F5 | G2 | H3 | I3 | J4 | K5 | L4 | M5 |
| 34 | Tingyangban | Y4 | A5 | B3 | C5 | D4 | E2 | F3 | G1 | H3 | I2 | J4 | K5 | L4 | M5 |
| 35 | Cao long | Y4 | A5 | B3 | C5 | D4 | E2 | F5 | G2 | H3 | I2 | J4 | K5 | L4 | M5 |
| 36 | Huangjiawan | Y4 | A5 | B3 | C5 | D4 | E2 | F5 | G2 | H3 | I3 | J4 | K5 | L4 | M5 |
| 37 | Tanaka | Y4 | A5 | B3 | C5 | D4 | E1 | F5 | G2 | H3 | I3 | J4 | K5 | L4 | M5 |
| 38 | Yangye | Y4 | A5 | B3 | C5 | D4 | E3 | F3 | G2 | H2 | I3 | J4 | K5 | L4 | M5 |
| 39 | Shuikouyang | Y4 | A4 | B3 | C5 | D4 | E2 | F5 | G2 | H3 | I3 | J4 | K5 | L4 | M5 |
| 40 | Toad stone | Y4 | A3 | B4 | C5 | D4 | E4 | F4 | G2 | H1 | I3 | J4 | K5 | L4 | M5 |
| 41 | Feizhu | Y4 | A5 | B3 | C5 | D4 | E2 | F5 | G2 | H3 | I3 | J4 | K5 | L4 | M5 |
| 42 | Guanluxia | Y4 | A3 | B4 | C5 | D4 | E1 | F4 | G2 | H2 | I3 | J4 | K5 | L4 | M5 |
| 43 | WangYan | Y4 | A4 | B5 | C5 | D4 | E3 | F4 | G2 | H1 | I3 | J4 | K5 | L4 | M5 |
| 44 | Yuanding | Y3 | A5 | B4 | C5 | D4 | E5 | F3 | G1 | H2 | I2 | J4 | K5 | L4 | M5 |
| 45 | Zhongxia | Y4 | A5 | B5 | C5 | D4 | E5 | F4 | G2 | H1 | I3 | J4 | K5 | L4 | M5 |
| 46 | Meiyang | Y4 | A4 | B5 | C5 | D4 | E3 | F5 | G2 | H1 | I3 | J2 | K3 | L1 | M2 |
| 47 | Daxiang | Y4 | A5 | B5 | C5 | D4 | E3 | F4 | G2 | H2 | I3 | J4 | K5 | L4 | M5 |
| 48 | Nanyang | Y4 | A5 | B3 | C5 | D4 | E3 | F4 | G2 | H2 | I3 | J4 | K5 | L4 | M5 |
| 49 | Ethnic | Y4 | A4 | B5 | C5 | D4 | E3 | F4 | G3 | H2 | I3 | J4 | K5 | L4 | M5 |
| 50 | Guan | Y4 | A4 | B5 | C5 | D4 | E3 | F5 | G3 | H2 | I3 | J4 | K5 | L4 | M5 |
| 51 | Chexi | Y4 | A4 | B5 | C5 | D4 | E3 | F4 | G3 | H2 | I3 | J4 | K5 | L4 | M5 |
| 52 | Shibiexia | Y4 | A3 | B4 | C5 | D4 | E2 | F4 | G2 | H3 | I3 | J4 | K5 | L4 | M5 |
| 53 | Xilan | Y4 | A4 | B5 | C5 | D4 | E2 | F4 | G2 | H2 | I3 | J4 | K5 | L4 | M5 |
| 54 | Xu Yang | Y4 | A4 | B5 | C5 | D4 | E3 | F4 | G2 | H1 | I3 | J4 | K5 | L4 | M5 |
| 55 | Gangwei | Y3 | A2 | B2 | C5 | D4 | E3 | F4 | G1 | H4 | I3 | J4 | K5 | L4 | M5 |
| 56 | Chuanbian | Y3 | A2 | B2 | C5 | D4 | E3 | F3 | G1 | H4 | I3 | J4 | K5 | L4 | M5 |
| 57 | Fuhu | Y4 | A2 | B2 | C5 | D4 | E2 | F5 | G2 | H4 | I3 | J4 | K5 | L4 | M5 |
| 58 | Dongyuanting | Y4 | A2 | B2 | C5 | D4 | E3 | F3 | G1 | H4 | I3 | J5 | K4 | L5 | M4 |
| 59 | Dawangli | Y3 | A2 | B2 | C5 | D4 | E3 | F5 | G1 | H5 | I3 | J4 | K5 | L4 | M5 |
| 60 | Wang TingYang | Y4 | A2 | B2 | C5 | D4 | E3 | F5 | G1 | H4 | I2 | J4 | K5 | L4 | M5 |
| 61 | Xiqian | Y4 | A2 | B4 | C5 | D4 | E2 | F5 | G2 | H3 | I3 | J4 | K5 | L4 | M5 |
| 62 | Shanlongwan | Y3 | A2 | B2 | C5 | D4 | E3 | F5 | G1 | H4 | I3 | J4 | K5 | L4 | M5 |
| 63 | Lisheng | Y2 | A5 | B3 | C5 | D1 | E4 | F5 | G1 | H2 | I2 | J1 | K1 | L3 | M1 |
| 64 | Yamada | Y2 | A5 | B5 | C5 | D1 | E2 | F3 | G1 | H3 | I3 | J1 | K1 | L3 | M1 |
| 65 | Xin | Y2 | A5 | B3 | C5 | D1 | E2 | F5 | G1 | H2 | I2 | J1 | K1 | L3 | M1 |
| 66 | Qingfeng | Y2 | A4 | B3 | C5 | D1 | E2 | F3 | G1 | H2 | I3 | J1 | K1 | L3 | M1 |
| 67 | Taro pit | Y2 | A5 | B3 | C5 | D1 | E5 | F3 | G1 | H2 | I3 | J1 | K1 | L3 | M1 |
| 68 | Xiexing | Y2 | A5 | B5 | C5 | D1 | E3 | F4 | G1 | H3 | I2 | J1 | K1 | L3 | M1 |
| 69 | Bajiao | Y2 | A5 | B5 | C5 | D1 | E5 | F4 | G1 | H2 | I3 | J1 | K1 | L3 | M1 |
| 70 | Tanhou | Y2 | A5 | B3 | C5 | D1 | E4 | F5 | G1 | H1 | I2 | J1 | K1 | L3 | M1 |
| 71 | Hexi | Y2 | A5 | B3 | C5 | D1 | E2 | F5 | G1 | H2 | I3 | J1 | K1 | L3 | M1 |
| 72 | Yanmen | Y2 | A5 | B5 | C5 | D1 | E3 | F3 | G1 | H2 | I2 | J1 | K1 | L3 | M1 |
| 73 | Dongxi | Y2 | A4 | B4 | C5 | D1 | E3 | F3 | G1 | H2 | I3 | J1 | K1 | L3 | M1 |
| 74 | Ruiying | Y2 | A4 | B5 | C5 | D1 | E3 | F3 | G1 | H2 | I3 | J1 | K1 | L3 | M1 |
| 75 | Tai Po | Y2 | A5 | B3 | C1 | D2 | E1 | F5 | G1 | H4 | I3 | J5 | K2 | L4 | M3 |
| 76 | Qishan | Y2 | A5 | B3 | C1 | D2 | E3 | F5 | G1 | H4 | I3 | J5 | K2 | L4 | M3 |
| 77 | Zhongcuo | Y1 | A4 | B2 | C1 | D2 | E2 | F5 | G1 | H1 | I2 | J5 | K2 | L4 | M3 |
| 78 | Dongsheng | Y2 | A5 | B5 | C1 | D2 | E3 | F5 | G1 | H3 | I2 | J5 | K2 | L4 | M3 |
| 79 | Dongshan | Y2 | A4 | B4 | C1 | D2 | E1 | F5 | G2 | H1 | I3 | J5 | K2 | L4 | M3 |
| 80 | Zhenbian | Y2 | A5 | B5 | C1 | D2 | E3 | F5 | G1 | H3 | I3 | J5 | K2 | L4 | M3 |
| 81 | Xincang | Y2 | A5 | B3 | C1 | D2 | E3 | F5 | G1 | H4 | I3 | J5 | K2 | L4 | M3 |
| 82 | Qinjiang | Y1 | A5 | B3 | C1 | D2 | E2 | F5 | G1 | H1 | I2 | J5 | K4 | L5 | M1 |
| 83 | Zhongzhai | Y1 | A4 | B3 | C1 | D5 | E2 | F5 | G1 | H1 | I3 | J1 | K5 | L5 | M2 |
| 84 | Chentang | Y1 | A5 | B3 | C4 | D3 | E2 | F5 | G1 | H2 | I3 | J3 | K2 | L1 | M5 |
| 85 | Hongdao | Y1 | A4 | B5 | C4 | D5 | E3 | F5 | G1 | H4 | I3 | J3 | K1 | L2 | M3 |
| 86 | Songzhou | Y1 | A4 | B5 | C4 | D5 | E3 | F5 | G1 | H5 | I3 | J3 | K1 | L2 | M3 |
| 87 | ChaPu | Y1 | A5 | B5 | C4 | D5 | E1 | F5 | G1 | H4 | I2 | J3 | K1 | L2 | M3 |
| 88 | Podou | Y1 | A4 | B5 | C3 | D2 | E2 | F5 | G2 | H3 | I2 | J2 | K5 | L5 | M5 |
| 89 | Jingnomura | Y3 | A4 | B2 | C5 | D2 | E3 | F5 | G1 | H3 | I2 | J4 | K3 | L3 | M1 |
| 90 | Fengqing | Y3 | A4 | B4 | C5 | D2 | E2 | F5 | G1 | H1 | I2 | J4 | K3 | L3 | M1 |
| 91 | Shanhou | Y3 | A4 | B4 | C5 | D2 | E3 | F5 | G1 | H1 | I2 | J4 | K3 | L3 | M1 |
| 92 | Suxi | Y3 | A4 | B4 | C5 | D2 | E3 | F5 | G1 | H1 | I2 | J4 | K3 | L3 | M1 |
| 93 | Dingtan | Y3 | A4 | B4 | C5 | D2 | E2 | F5 | G1 | H1 | I2 | J4 | K3 | L3 | M1 |
| 94 | Houdong | Y3 | A3 | B5 | C5 | D2 | E2 | F5 | G1 | H3 | I2 | J4 | K3 | L3 | M1 |
| 95 | Yang Mei | Y3 | A4 | B2 | C5 | D2 | E3 | F5 | G1 | H3 | I2 | J4 | K3 | L3 | M1 |
| 96 | Youkeng | Y3 | A3 | B4 | C5 | D2 | E3 | F5 | G1 | H3 | I3 | J4 | K3 | L3 | M1 |
| 97 | Qianyuan | Y3 | A3 | B4 | C5 | D2 | E3 | F5 | G1 | H3 | I3 | J4 | K3 | L3 | M1 |
| 98 | TUTA | Y3 | A3 | B4 | C5 | D2 | E2 | F5 | G1 | H2 | I3 | J4 | K3 | L3 | M1 |
| 99 | Dahang | Y3 | A3 | B4 | C5 | D2 | E2 | F5 | G1 | H2 | I3 | J4 | K3 | L3 | M1 |
| 50 | Shikeng | Y3 | A4 | B5 | C5 | D2 | E2 | F5 | G1 | H4 | I2 | J4 | K3 | L3 | M1 |
| 51 | Chiling | Y3 | A3 | B4 | C5 | D2 | E3 | F5 | G1 | H2 | I3 | J4 | K3 | L3 | M1 |
| 52 | Shiyi | Y3 | A3 | B4 | C5 | D2 | E2 | F5 | G1 | H3 | I2 | J4 | K3 | L3 | M1 |
| 53 | Shanping | Y3 | A4 | B4 | C5 | D2 | E3 | F5 | G1 | H3 | I3 | J4 | K3 | L3 | M1 |
| 54 | Xiapu | Y1 | A5 | B5 | C5 | D2 | E2 | F5 | G1 | H1 | I3 | J4 | K3 | L3 | M1 |
| 55 | Lancuo | Y2 | A5 | B5 | C5 | D2 | E3 | F5 | G1 | H5 | I2 | J4 | K3 | L3 | M1 |
| 56 | Hekeng | Y1 | A5 | B5 | C5 | D2 | E1 | F5 | G1 | H5 | I2 | J4 | K3 | L3 | M1 |
| 57 | Shibuxi | Y3 | A4 | B4 | C5 | D2 | E1 | F5 | G1 | H2 | I3 | J4 | K3 | L3 | M1 |
| 58 | Sidu | Y1 | A5 | B5 | C3 | D1 | E2 | F5 | G1 | H2 | I2 | J3 | K3 | L2 | M4 |
| 59 | Gangtou | Y2 | A5 | B3 | C3 | D1 | E2 | F5 | G1 | H2 | I2 | J3 | K3 | L2 | M4 |
| 15 | Taiping | Y1 | A5 | B4 | C3 | D1 | E3 | F5 | G1 | H1 | I3 | J3 | K3 | L2 | M4 |
| 111 | Meiying | Y2 | A5 | B3 | C3 | D1 | E2 | F5 | G1 | H1 | I2 | J3 | K3 | L2 | M4 |
| 112 | TingYang | Y2 | A4 | B5 | C3 | D1 | E2 | F5 | G1 | H1 | I3 | J3 | K3 | L2 | M4 |
| 113 | Shenhu | Y2 | A4 | B5 | C3 | D1 | E3 | F5 | G1 | H1 | I3 | J2 | K3 | L5 | M5 |
| 114 | Hexi | Y1 | A5 | B4 | C3 | D1 | E3 | F4 | G3 | H1 | I3 | J3 | K4 | L3 | M2 |
| 115 | Tutian | Y1 | A4 | B5 | C3 | D1 | E3 | F5 | G2 | H1 | I2 | J3 | K4 | L3 | M2 |
| 116 | Guanshe | Y1 | A5 | B5 | C3 | D2 | E3 | F3 | G3 | H2 | I3 | J2 | K4 | L2 | M3 |
| 117 | Pingshui | Y1 | A4 | B4 | C3 | D2 | E2 | F2 | G2 | H4 | I3 | J2 | K4 | L2 | M3 |
| 118 | Yushang | Y2 | A5 | B5 | C1 | D3 | E1 | F5 | G1 | H1 | I2 | J1 | K2 | L5 | M3 |
| 119 | Xincuo | Y1 | A5 | B5 | C3 | D2 | E2 | F4 | G3 | H3 | I2 | J2 | K4 | L2 | M3 |
| 120 | Hongxing | Y2 | A5 | B4 | C1 | D3 | E2 | F5 | G1 | H1 | I2 | J1 | K2 | L5 | M3 |
| 121 | Daping | Y1 | A4 | B4 | C4 | D1 | E3 | F2 | G2 | H1 | I2 | J1 | K5 | L3 | M5 |
| 122 | Xingzhai | Y3 | A5 | B3 | C3 | D2 | E2 | F5 | G2 | H3 | I2 | J5 | K5 | L4 | M2 |
| 123 | Guantou | Y3 | A5 | B3 | C3 | D2 | E3 | F5 | G2 | H3 | I3 | J5 | K5 | L4 | M2 |
| 124 | Tangxi | Y3 | A5 | B3 | C3 | D2 | E3 | F5 | G2 | H3 | I2 | J5 | K5 | L4 | M2 |
| 125 | Cuodou | Y2 | A3 | B5 | C3 | D2 | E2 | F4 | G2 | H2 | I3 | J5 | K5 | L4 | M2 |
| 126 | Yuanfeng | Y3 | A5 | B3 | C4 | D2 | E2 | F5 | G2 | H2 | I2 | J5 | K5 | L2 | M1 |
| 127 | Zhongcuo | Y2 | A5 | B3 | C4 | D2 | E2 | F5 | G2 | H1 | I3 | J5 | K5 | L2 | M1 |
| 128 | Longshan | Y2 | A5 | B3 | C4 | D2 | E1 | F5 | G1 | H2 | I3 | J5 | K5 | L2 | M1 |
| 129 | Liuting | Y2 | A5 | B3 | C4 | D2 | E1 | F5 | G1 | H1 | I3 | J5 | K5 | L2 | M1 |
| 130 | Guocuo | Y2 | A5 | B3 | C4 | D2 | E1 | F5 | G1 | H1 | I3 | J5 | K5 | L2 | M1 |
| 131 | Xiaoba | Y2 | A5 | B5 | C4 | D2 | E3 | F5 | G2 | H1 | I2 | J5 | K5 | L1 | M1 |
| 132 | Tuzhai | Y3 | A4 | B3 | C1 | D4 | E2 | F5 | G2 | H1 | I3 | J5 | K2 | L3 | M3 |
| 133 | Qianguo | Y3 | A4 | B3 | C1 | D4 | E2 | F5 | G2 | H4 | I3 | J5 | K2 | L3 | M3 |
| 134 | Xinting | Y3 | A5 | B3 | C1 | D4 | E2 | F5 | G2 | H1 | I2 | J5 | K2 | L3 | M3 |
| 135 | Reception | Y3 | A5 | B3 | C1 | D4 | E1 | F5 | G2 | H3 | I3 | J5 | K2 | L3 | M3 |
| 136 | Shantan | Y1 | A5 | B5 | C4 | D1 | E2 | F3 | G4 | H3 | I2 | J1 | K5 | L3 | M5 |
| 137 | Hengping | Y1 | A5 | B2 | C4 | D1 | E4 | F3 | G4 | H4 | I2 | J1 | K5 | L3 | M5 |
| 138 | Shengfu | Y1 | A5 | B2 | C4 | D1 | E5 | F3 | G4 | H5 | I2 | J1 | K5 | L3 | M5 |
| 139 | Jincheng | Y2 | A5 | B3 | C4 | D1 | E2 | F5 | G3 | H4 | I2 | J1 | K5 | L3 | M5 |
| 140 | Nanmei | Y2 | A5 | B3 | C4 | D1 | E2 | F5 | G3 | H4 | I2 | J1 | K5 | L3 | M5 |
| 141 | Jincheng | Y2 | A5 | B5 | C5 | D3 | E3 | F4 | G2 | H3 | I2 | J4 | K5 | L3 | M5 |
| 142 | Nanmei | Y2 | A4 | B5 | C5 | D3 | E2 | F4 | G2 | H3 | I2 | J4 | K5 | L3 | M5 |
| 143 | Daxi | Y1 | A3 | B4 | C3 | D4 | E2 | F4 | G3 | H4 | I2 | J3 | K3 | L2 | M2 |
| 144 | Longta | Y1 | A5 | B2 | C3 | D4 | E3 | F4 | G4 | H3 | I3 | J3 | K3 | L2 | M2 |
| 145 | Liandai | Y3 | A5 | B5 | C1 | D4 | E2 | F5 | G1 | H2 | I3 | J5 | K2 | L3 | M3 |
| 146 | Lichun | Y3 | A5 | B5 | C1 | D4 | E2 | F5 | G1 | H2 | I3 | J5 | K2 | L3 | M3 |
| 147 | Baiqi | Y3 | A5 | B5 | C1 | D4 | E2 | F5 | G1 | H2 | I3 | J5 | K2 | L3 | M3 |
| 148 | Houhai | Y3 | A5 | B5 | C1 | D4 | E2 | F5 | G1 | H2 | I3 | J5 | K2 | L3 | M3 |
| 149 | Xiadai | Y3 | A5 | B5 | C1 | D4 | E2 | F5 | G1 | H2 | I3 | J5 | K2 | L3 | M3 |
| 150 | Qiankeng | Y3 | A5 | B3 | C4 | D5 | E2 | F5 | G1 | H3 | I3 | J2 | K3 | L2 | M1 |
| 151 | shinong | Y3 | A4 | B5 | C4 | D5 | E2 | F5 | G1 | H1 | I3 | J2 | K3 | L5 | M5 |
| 152 | Guokeng | Y3 | A4 | B3 | C4 | D5 | E2 | F5 | G1 | H1 | I3 | J2 | K3 | L2 | M1 |
| 153 | Shiyu | Y3 | A4 | B5 | C4 | D5 | E2 | F5 | G1 | H1 | I3 | J2 | K3 | L2 | M1 |
| 154 | Huatingkou | Y3 | A5 | B3 | C1 | D3 | E3 | F5 | G1 | H3 | I3 | J3 | K3 | L1 | M2 |
| 155 | Xibian | Y3 | A5 | B3 | C1 | D3 | E2 | F5 | G1 | H2 | I3 | J3 | K3 | L3 | M2 |
| 156 | Jiangtou | Y3 | A5 | B3 | C1 | D3 | E1 | F5 | G1 | H2 | I3 | J3 | K3 | L3 | M2 |
| 157 | Guo Cen | Y2 | A5 | B4 | C1 | D3 | E1 | F5 | G1 | H2 | I3 | J3 | K3 | L3 | M2 |
| 158 | Chaodai | Y2 | A5 | B4 | C1 | D3 | E1 | F5 | G1 | H2 | I3 | J3 | K3 | L3 | M2 |
| 159 | Xiamei | Y3 | A5 | B3 | C1 | D3 | E1 | F5 | G1 | H2 | I3 | J3 | K3 | L3 | M2 |
| 160 | Houxi | Y3 | A5 | B3 | C1 | D3 | E2 | F5 | G1 | H2 | I3 | J3 | K3 | L1 | M2 |
| 161 | AndAu | Y3 | A5 | B3 | C1 | D3 | E2 | F5 | G1 | H2 | I3 | J3 | K3 | L1 | M2 |
| 162 | Fulin | Y3 | A5 | B3 | C1 | D3 | E2 | F5 | G1 | H3 | I3 | J3 | K3 | L2 | M2 |
| 163 | Nishibaka | Y3 | A5 | B3 | C1 | D3 | E3 | F5 | G1 | H3 | I3 | J3 | K3 | L1 | M2 |
| 164 | Pengtou | Y3 | A5 | B3 | C1 | D3 | E2 | F5 | G1 | H2 | I3 | J3 | K3 | L2 | M2 |
| 165 | Sijing | Y3 | A5 | B3 | C1 | D3 | E2 | F5 | G1 | H2 | I3 | J3 | K3 | L1 | M2 |
| 166 | Kennei | Y2 | A4 | B5 | C1 | D3 | E1 | F5 | G2 | H2 | I3 | J2 | K3 | L4 | M2 |
| 167 | Fengmei | Y2 | A4 | B5 | C1 | D3 | E2 | F5 | G2 | H1 | I3 | J2 | K3 | L4 | M2 |
| 168 | Fenglian | Y2 | A4 | B4 | C1 | D3 | E3 | F5 | G2 | H1 | I3 | J2 | K3 | L4 | M2 |
| 169 | Puqian | Y2 | A5 | B4 | C1 | D3 | E3 | F5 | G2 | H1 | I3 | J2 | K3 | L4 | M2 |
| 170 | Wukeng | Y2 | A5 | B3 | C1 | D3 | E3 | F5 | G1 | H2 | I3 | J2 | K3 | L4 | M2 |
| 171 | Shuangfu | Y1 | A5 | B3 | C5 | D4 | E3 | F5 | G1 | H3 | I3 | J2 | K4 | L1 | M1 |
| 172 | Nanxia | Y2 | A4 | B5 | C5 | D4 | E3 | F5 | G1 | H2 | I3 | J5 | K3 | L1 | M4 |
| 173 | Batou | Y2 | A3 | B4 | C5 | D4 | E1 | F4 | G2 | H3 | I3 | J5 | K3 | L1 | M4 |
| 174 | Compass | Y2 | A2 | B2 | C5 | D1 | E3 | F5 | G1 | H2 | I2 | J2 | K2 | L3 | M5 |
| 175 | Qinshan | Y2 | A3 | B3 | C5 | D2 | E2 | F5 | G4 | H4 | I3 | J5 | K1 | L5 | M3 |
| 176 | Cangxi | Y2 | A5 | B5 | C5 | D2 | E2 | F5 | G1 | H1 | I3 | J5 | K1 | L5 | M3 |
| 177 | Lishan | Y2 | A4 | B5 | C5 | D2 | E2 | F5 | G4 | H2 | I3 | J5 | K1 | L5 | M3 |
| 178 | Xinyao | Y2 | A5 | B5 | C5 | D2 | E2 | F5 | G2 | H2 | I3 | J5 | K1 | L5 | M3 |
| 179 | Youyang | Y2 | A3 | B2 | C5 | D2 | E3 | F3 | G4 | H1 | I3 | J5 | K1 | L5 | M3 |
| 180 | Liuyuan | Y1 | A3 | B2 | C5 | D2 | E4 | F1 | G2 | H3 | I3 | J5 | K1 | L5 | M3 |
| 181 | Qianxi | Y1 | A3 | B2 | C5 | D2 | E4 | F1 | G2 | H2 | I3 | J5 | K1 | L5 | M3 |
| 182 | Baishui | Y1 | A5 | B3 | C3 | D5 | E4 | F2 | G3 | H4 | I3 | J5 | K5 | L2 | M2 |
| 183 | Yangshan | Y1 | A5 | B3 | C5 | D5 | E5 | F3 | G3 | H4 | I3 | J4 | K4 | L5 | M2 |
| 184 | Songxi | Y2 | A5 | B5 | C3 | D2 | E3 | F4 | G1 | H2 | I3 | J1 | K3 | L2 | M2 |
| 185 | Qingxi | Y2 | A5 | B5 | C3 | D2 | E3 | F4 | G1 | H3 | I3 | J1 | K3 | L2 | M2 |
| 186 | Jitou | Y2 | A5 | B3 | C3 | D2 | E3 | F4 | G1 | H1 | I3 | J1 | K3 | L2 | M2 |
| 187 | Taishan | Y2 | A5 | B3 | C3 | D2 | E5 | F4 | G1 | H2 | I3 | J1 | K3 | L2 | M2 |
| 188 | Quanyong | Y2 | A3 | B2 | C3 | D1 | E3 | F4 | G1 | H3 | I3 | J2 | K1 | L4 | M2 |
| 189 | Xibei | Y2 | A5 | B5 | C3 | D1 | E3 | F4 | G2 | H1 | I3 | J2 | K1 | L4 | M2 |
| 190 | Jiudun | Y2 | A5 | B5 | C3 | D1 | E2 | F4 | G1 | H1 | I3 | J2 | K1 | L4 | M2 |
| 191 | Xikeng | Y2 | A5 | B3 | C3 | D1 | E3 | F4 | G1 | H2 | I3 | J2 | K1 | L4 | M2 |
| 192 | Sikeng | Y2 | A5 | B5 | C3 | D1 | E2 | F3 | G2 | H2 | I3 | J2 | K1 | L4 | M2 |
| 193 | Sixi | Y2 | A3 | B4 | C3 | D1 | E3 | F3 | G2 | H2 | I3 | J2 | K1 | L4 | M2 |
| 194 | Xiasha | Y2 | A5 | B5 | C3 | D1 | E3 | F4 | G1 | H3 | I3 | J2 | K1 | L4 | M2 |
| 195 | Miaoqian | Y2 | A3 | B4 | C3 | D1 | E3 | F4 | G1 | H2 | I3 | J2 | K1 | L4 | M2 |
| 196 | Nifang | Y1 | A5 | B2 | C3 | D1 | E3 | F3 | G3 | H1 | I3 | J2 | K1 | L4 | M2 |
| 197 | Dongqiao | Y1 | A5 | B2 | C3 | D1 | E5 | F3 | G3 | H3 | I3 | J2 | K1 | L4 | M2 |
| 198 | Pingpu | Y2 | A3 | B2 | C3 | D1 | E4 | F3 | G2 | H2 | I3 | J2 | K1 | L4 | M2 |
| 199 | Guangming | Y2 | A3 | B4 | C3 | D1 | E3 | F2 | G1 | H2 | I3 | J2 | K1 | L4 | M2 |
| 200 | Shefu | Y2 | A4 | B4 | C3 | D1 | E3 | F3 | G2 | H2 | I3 | J2 | K1 | L4 | M2 |
| 201 | Mud pit | Y2 | A3 | B4 | C3 | D1 | E3 | F2 | G2 | H3 | I3 | J2 | K1 | L4 | M2 |
| 202 | Zhiping | Y2 | A4 | B4 | C3 | D1 | E4 | F3 | G2 | H3 | I3 | J2 | K1 | L4 | M2 |
| 203 | Hubeijiao | Y2 | A4 | B4 | C3 | D1 | E4 | F3 | G2 | H3 | I3 | J2 | K1 | L4 | M2 |
| 204 | Xiaping | Y2 | A3 | B4 | C3 | D1 | E5 | F2 | G1 | H1 | I3 | J2 | K1 | L4 | M2 |
| 205 | Gaofeng | Y2 | A3 | B4 | C3 | D1 | E5 | F2 | G1 | H2 | I3 | J2 | K1 | L4 | M2 |
| 206 | Highland | Y2 | A3 | B2 | C3 | D1 | E5 | F2 | G2 | H2 | I3 | J2 | K1 | L4 | M2 |
| 207 | Dongban | Y2 | A4 | B4 | C3 | D2 | E3 | F2 | G3 | H2 | I3 | J5 | K2 | L3 | M2 |
| 208 | Shanchuan | Y1 | A4 | B5 | C3 | D2 | E2 | F2 | G3 | H2 | I3 | J5 | K2 | L3 | M2 |
| 209 | Houping | Y1 | A5 | B4 | C3 | D1 | E4 | F4 | G4 | H3 | I3 | J2 | K3 | L3 | M4 |
| 25 | Changrong | Y1 | A5 | B5 | C5 | D4 | E2 | F3 | G3 | H1 | I3 | J4 | K1 | L3 | M1 |
| 211 | Guanfang | Y2 | A3 | B2 | C2 | D2 | E2 | F2 | G2 | H2 | I3 | J2 | K2 | L5 | M4 |
| 212 | Qi | Y1 | A5 | B3 | C2 | D1 | E4 | F4 | G4 | H2 | I3 | J4 | K3 | L5 | M3 |
| 213 | Cai Di | Y2 | A4 | B4 | C5 | D4 | E4 | F3 | G2 | H3 | I3 | J1 | K4 | L1 | M1 |
| 214 | Dake | Y2 | A5 | B4 | C5 | D4 | E4 | F3 | G2 | H3 | I3 | J1 | K4 | L1 | M1 |
| 215 | Linshan | Y2 | A4 | B5 | C5 | D4 | E4 | F3 | G2 | H3 | I3 | J1 | K4 | L1 | M1 |
| 216 | Qingshui | Y2 | A3 | B4 | C5 | D4 | E3 | F2 | G3 | H2 | I3 | J1 | K4 | L1 | M1 |
| 217 | Tinghai | Y2 | A4 | B2 | C5 | D4 | E5 | F2 | G3 | H1 | I3 | J5 | K2 | L3 | M2 |
| 218 | Canghai | Y2 | A5 | B3 | C5 | D4 | E4 | F5 | G2 | H2 | I3 | J1 | K4 | L1 | M1 |
| 219 | Jitou | Y2 | A5 | B4 | C5 | D4 | E4 | F4 | G2 | H2 | I3 | J1 | K4 | L1 | M1 |
| 220 | Baiqiqiu | Y2 | A5 | B3 | C5 | D4 | E4 | F5 | G2 | H2 | I3 | J1 | K4 | L2 | M1 |
| 221 | Sanfang | Y2 | A4 | B2 | C5 | D4 | E3 | F2 | G4 | H2 | I3 | J1 | K4 | L2 | M1 |
| 222 | Luoxi | Y2 | A4 | B2 | C5 | D4 | E3 | F2 | G4 | H2 | I3 | J1 | K4 | L2 | M1 |
| 223 | Huangjingshan | Y2 | A3 | B4 | C5 | D4 | E4 | F2 | G3 | H3 | I3 | J1 | K4 | L2 | M1 |
| 224 | Keshan | Y2 | A3 | B4 | C5 | D4 | E5 | F2 | G3 | H2 | I3 | J1 | K4 | L2 | M1 |
| 225 | Bingling | Y1 | A5 | B3 | C5 | D4 | E4 | F4 | G3 | H3 | I3 | J3 | K5 | L2 | M1 |
| 226 | Shuijingke | Y1 | A5 | B5 | C5 | D4 | E3 | F5 | G3 | H3 | I3 | J3 | K5 | L2 | M1 |
| 227 | Jiyang | Y1 | A5 | B5 | C5 | D4 | E4 | F5 | G2 | H4 | I3 | J3 | K5 | L2 | M1 |
| 228 | Yanghou | Y2 | A2 | B4 | C5 | D4 | E3 | F4 | G2 | H2 | I3 | J3 | K5 | L2 | M1 |
| 229 | Kengmen | Y2 | A3 | B4 | C5 | D4 | E4 | F4 | G2 | H1 | I3 | J3 | K5 | L1 | M1 |
| 230 | Xilan | Y2 | A4 | B3 | C2 | D2 | E4 | F4 | G3 | H3 | I3 | J1 | K2 | L3 | M5 |
| 231 | Yudun | Y2 | A5 | B3 | C2 | D2 | E5 | F4 | G3 | H2 | I3 | J1 | K2 | L3 | M5 |
| 232 | Jinglong | Y2 | A5 | B3 | C2 | D2 | E3 | F4 | G3 | H3 | I3 | J1 | K2 | L3 | M5 |
| 233 | Xiasha | Y2 | A5 | B3 | C2 | D2 | E3 | F5 | G3 | H3 | I3 | J1 | K2 | L3 | M5 |
| 234 | Xiefang | Y2 | A5 | B3 | C2 | D2 | E5 | F4 | G3 | H3 | I3 | J1 | K2 | L2 | M5 |
| 235 | Xiakeng | Y2 | A5 | B5 | C2 | D2 | E4 | F4 | G3 | H1 | I3 | J1 | K2 | L3 | M5 |
| 236 | Tianping | Y2 | A5 | B3 | C2 | D2 | E4 | F4 | G3 | H2 | I3 | J1 | K2 | L3 | M5 |
| 237 | Jihui | Y2 | A4 | B5 | C2 | D2 | E3 | F5 | G3 | H1 | I3 | J1 | K2 | L3 | M5 |
| 238 | Shangfeng | Y2 | A5 | B3 | C2 | D2 | E3 | F5 | G3 | H3 | I3 | J1 | K2 | L1 | M5 |
| 239 | Xiuwu | Y2 | A5 | B4 | C2 | D2 | E4 | F4 | G3 | H1 | I3 | J1 | K2 | L2 | M5 |
| 240 | Jiangdun | Y2 | A2 | B2 | C2 | D2 | E4 | F3 | G2 | H3 | I3 | J1 | K2 | L1 | M5 |
| 241 | xi | Y1 | A5 | B5 | C3 | D1 | E2 | F4 | G2 | H1 | I3 | J4 | K1 | L5 | M5 |
| 242 | Jiangyuan | Y2 | A5 | B4 | C3 | D2 | E3 | F4 | G2 | H3 | I3 | J3 | K4 | L4 | M5 |
| 243 | Guanqiao | Y2 | A4 | B2 | C3 | D2 | E3 | F4 | G2 | H2 | I3 | J3 | K4 | L4 | M5 |
| 244 | LEIYU | Y1 | A2 | B2 | C3 | D1 | E4 | F2 | G2 | H3 | I3 | J1 | K5 | L4 | M2 |
| 245 | Zhaoshajia | Y1 | A2 | B4 | C3 | D1 | E3 | F4 | G3 | H3 | I3 | J1 | K5 | L4 | M2 |
| 246 | Yuanshan | Y1 | A2 | B2 | C3 | D2 | E5 | F3 | G2 | H4 | I3 | J2 | K4 | L4 | M3 |
| 247 | Xijin | Y2 | A1 | B2 | C2 | D2 | E4 | F3 | G1 | H3 | I3 | J2 | K4 | L4 | M3 |
| 248 | Chixia | Y1 | A1 | B1 | C2 | D4 | E3 | F2 | G1 | H4 | I3 | J2 | K5 | L1 | M2 |
| 249 | Erdu | Y1 | A1 | B1 | C2 | D4 | E5 | F3 | G1 | H1 | I3 | J2 | K5 | L1 | M2 |
| 250 | Geying | Y1 | A2 | B4 | C2 | D4 | E3 | F4 | G1 | H2 | I3 | J2 | K5 | L2 | M2 |
| 251 | Gaizhu | Y1 | A1 | B1 | C2 | D4 | E4 | F3 | G1 | H3 | I3 | J2 | K5 | L1 | M2 |
| 252 | Liqian | Y1 | A1 | B2 | C2 | D3 | E3 | F3 | G1 | H3 | I3 | J4 | K3 | L2 | M5 |
| 253 | Jiyuan | Y1 | A1 | B2 | C2 | D2 | E5 | F3 | G1 | H2 | I3 | J3 | K2 | L2 | M5 |
| 254 | Wu Dayuan | Y1 | A1 | B1 | C2 | D2 | E2 | F4 | G1 | H1 | I3 | J3 | K2 | L2 | M5 |
| 255 | Waiyang | Y1 | A3 | B4 | C2 | D2 | E4 | F3 | G3 | H2 | I3 | J3 | K2 | L2 | M5 |
| 256 | Anguosi | Y1 | A5 | B5 | C2 | D2 | E4 | F4 | G3 | H4 | I3 | J3 | K2 | L2 | M5 |
| 257 | Maodian | Y1 | A4 | B5 | C2 | D3 | E4 | F3 | G2 | H4 | I3 | J2 | K3 | L5 | M5 |
| 258 | Three Gorges | Y1 | A5 | B5 | C2 | D3 | E3 | F5 | G2 | H2 | I3 | J2 | K3 | L5 | M5 |
| 259 | Chen Yuan | Y1 | A3 | B2 | C3 | D3 | E4 | F4 | G2 | H3 | I3 | J2 | K3 | L5 | M5 |
| 260 | Nancha | Y1 | A3 | B5 | C3 | D3 | E3 | F4 | G1 | H1 | I3 | J2 | K3 | L5 | M5 |
| 261 | Duihou | Y1 | A4 | B5 | C3 | D3 | E5 | F3 | G2 | H3 | I3 | J2 | K3 | L5 | M5 |
| 262 | Huanghu | Y2 | A2 | B2 | C3 | D2 | E5 | F3 | G2 | H3 | I3 | J3 | K2 | L4 | M4 |
| 263 | Southeast | Y2 | A5 | B2 | C3 | D2 | E3 | F4 | G2 | H1 | I3 | J1 | K2 | L2 | M4 |
| 264 | Shangdeng | Y3 | A4 | B2 | C3 | D2 | E4 | F5 | G1 | H1 | I3 | J1 | K2 | L2 | M4 |
| 265 | Sujiapo | Y1 | A4 | B4 | C3 | D2 | E5 | F4 | G2 | H3 | I3 | J1 | K2 | L2 | M4 |
| 266 | Shuangxi | Y3 | A5 | B5 | C3 | D2 | E3 | F4 | G2 | H3 | I3 | J1 | K2 | L2 | M4 |
| 267 | Xibei | Y3 | A5 | B2 | C3 | D2 | E2 | F4 | G1 | H3 | I3 | J1 | K2 | L2 | M4 |
| 268 | Chen He | Y3 | A5 | B2 | C3 | D2 | E4 | F4 | G1 | H1 | I3 | J1 | K2 | L2 | M4 |
| 269 | Bitian | Y3 | A3 | B4 | C3 | D2 | E5 | F4 | G1 | H3 | I3 | J1 | K2 | L2 | M4 |
| 270 | Gukeng | Y3 | A3 | B2 | C3 | D2 | E3 | F3 | G2 | H2 | I3 | J1 | K2 | L2 | M4 |
| 271 | shiche | Y3 | A2 | B2 | C3 | D2 | E5 | F4 | G2 | H2 | I3 | J1 | K2 | L2 | M3 |
| 272 | Wenguang | Y3 | A3 | B2 | C3 | D2 | E3 | F3 | G2 | H2 | I3 | J1 | K2 | L2 | M4 |
| 273 | Tukeng | Y2 | A4 | B4 | C5 | D2 | E5 | F2 | G1 | H2 | I3 | J1 | K2 | L2 | M4 |
| 274 | Dagui | Y3 | A5 | B5 | C3 | D2 | E4 | F3 | G3 | H2 | I3 | J1 | K2 | L2 | M3 |
| 275 | Ruixiang | Y2 | A4 | B3 | C5 | D2 | E4 | F4 | G1 | H3 | I3 | J1 | K2 | L2 | M4 |
| 276 | Xinfang | Y3 | A5 | B2 | C5 | D2 | E3 | F3 | G1 | H1 | I3 | J1 | K2 | L3 | M4 |
| 277 | Southwest | Y3 | A5 | B4 | C5 | D2 | E2 | F4 | G1 | H2 | I3 | J1 | K2 | L3 | M4 |
| 278 | Jiutai | Y3 | A5 | B4 | C5 | D2 | E3 | F4 | G2 | H3 | I3 | J1 | K2 | L3 | M4 |
| 279 | Nanling | Y2 | A4 | B5 | C5 | D2 | E3 | F4 | G1 | H3 | I3 | J1 | K2 | L3 | M3 |
| 280 | Caimin | Y3 | A4 | B5 | C5 | D2 | E4 | F4 | G2 | H2 | I3 | J1 | K2 | L3 | M4 |
| 281 | Gufang | Y3 | A5 | B5 | C5 | D2 | E3 | F4 | G2 | H1 | I3 | J1 | K2 | L3 | M3 |
| 282 | Jiazhuang | Y3 | A5 | B3 | C5 | D2 | E2 | F4 | G2 | H1 | I3 | J1 | K2 | L3 | M3 |
| 283 | Ji’an | Y2 | A5 | B3 | C5 | D2 | E2 | F4 | G2 | H2 | I3 | J1 | K2 | L3 | M3 |
| 284 | Chongxia | Y2 | A5 | B2 | C5 | D2 | E4 | F3 | G1 | H3 | I3 | J1 | K2 | L3 | M3 |
| 285 | Huajia | Y2 | A5 | B4 | C5 | D2 | E3 | F4 | G1 | H3 | I3 | J1 | K2 | L2 | M3 |
| 286 | Qiu Hui | Y2 | A4 | B4 | C5 | D2 | E3 | F3 | G1 | H3 | I3 | J1 | K2 | L2 | M3 |
| 287 | Huazhu | Y3 | A5 | B5 | C5 | D2 | E4 | F4 | G2 | H2 | I3 | J1 | K2 | L2 | M3 |
| 288 | Guihe | Y3 | A5 | B3 | C5 | D2 | E2 | F5 | G1 | H2 | I3 | J1 | K2 | L2 | M3 |
| 289 | Xinmin | Y3 | A4 | B5 | C5 | D2 | E3 | F4 | G1 | H2 | I3 | J1 | K2 | L2 | M3 |
| 290 | Xinfeng | Y3 | A3 | B1 | C5 | D2 | E4 | F2 | G1 | H1 | I3 | J1 | K2 | L2 | M4 |
| 291 | Zeng Si | Y3 | A5 | B4 | C5 | D2 | E3 | F3 | G2 | H3 | I3 | J1 | K2 | L2 | M4 |
| 292 | Dekang | Y3 | A4 | B4 | C5 | D2 | E4 | F4 | G1 | H4 | I3 | J1 | K2 | L2 | M4 |
| 293 | Fengle | Y3 | A4 | B5 | C5 | D2 | E4 | F4 | G2 | H1 | I3 | J1 | K2 | L2 | M4 |
| 294 | Liying | Y3 | A3 | B4 | C5 | D2 | E4 | F4 | G1 | H3 | I3 | J1 | K2 | L2 | M3 |
| 295 | Fengji | Y3 | A5 | B5 | C3 | D2 | E4 | F3 | G3 | H2 | I3 | J1 | K2 | L2 | M4 |
| 296 | Fengkang | Y3 | A5 | B4 | C5 | D2 | E2 | F2 | G1 | H1 | I3 | J1 | K2 | L2 | M4 |
| 297 | Fuyang | Y3 | A4 | B4 | C5 | D2 | E4 | F4 | G2 | H1 | I3 | J1 | K2 | L2 | M4 |
| 298 | Shuren | Y3 | A4 | B4 | C5 | D2 | E4 | F4 | G2 | H4 | I3 | J1 | K2 | L2 | M3 |
| 299 | Qili | Y3 | A3 | B2 | C5 | D2 | E1 | F4 | G2 | H3 | I3 | J1 | K2 | L2 | M4 |
| 300 | Huangtou | Y3 | A4 | B4 | C5 | D2 | E5 | F4 | G2 | H3 | I3 | J1 | K2 | L2 | M4 |
| 301 | Fuquan | Y3 | A4 | B2 | C5 | D2 | E2 | F4 | G2 | H3 | I3 | J1 | K2 | L2 | M3 |
| 302 | Zhubao | Y3 | A4 | B4 | C5 | D2 | E3 | F4 | G2 | H4 | I3 | J1 | K2 | L2 | M4 |
| 303 | Goat | Y1 | A4 | B2 | C5 | D2 | E3 | F4 | G2 | H3 | I3 | J3 | K1 | L4 | M4 |
| 304 | Shima | Y2 | A5 | B5 | C5 | D2 | E1 | F4 | G1 | H3 | I3 | J3 | K1 | L4 | M4 |
| 305 | Kengyuan | Y2 | A5 | B5 | C5 | D2 | E3 | F4 | G1 | H3 | I3 | J3 | K1 | L4 | M3 |
| 306 | Longmen | Y1 | A5 | B5 | C5 | D2 | E2 | F4 | G1 | H3 | I3 | J3 | K1 | L4 | M3 |
| 307 | Lingdou | Y2 | A5 | B5 | C5 | D2 | E3 | F4 | G1 | H3 | I3 | J3 | K1 | L4 | M3 |
| 308 | Chengkou | Y2 | A4 | B4 | C5 | D2 | E5 | F4 | G1 | H3 | I3 | J3 | K1 | L4 | M3 |
| 309 | zhongcun | Y1 | A4 | B2 | C5 | D2 | E3 | F4 | G2 | H3 | I3 | J3 | K1 | L4 | M3 |
| 310 | Keshan | Y1 | A4 | B4 | C5 | D2 | E3 | F4 | G2 | H4 | I3 | J4 | K5 | L3 | M5 |
| 311 | Xiangliao | Y2 | A4 | B4 | C5 | D2 | E3 | F4 | G2 | H4 | I3 | J3 | K1 | L4 | M4 |
| 312 | Changlong | Y2 | A3 | B2 | C5 | D2 | E3 | F4 | G2 | H3 | I3 | J3 | K1 | L4 | M4 |
| 313 | Youjiatang | Y4 | A3 | B2 | C5 | D3 | E3 | F4 | G2 | H2 | I3 | J4 | K2 | L1 | M4 |
| 314 | Jitou | Y4 | A5 | B3 | C3 | D3 | E2 | F5 | G2 | H2 | I3 | J4 | K2 | L3 | M3 |
| 315 | Jinchui | Y5 | A3 | B2 | C3 | D3 | E4 | F3 | G2 | H2 | I3 | J4 | K2 | L3 | M4 |
| 316 | Xinlou | Y5 | A4 | B4 | C3 | D3 | E3 | F3 | G2 | H1 | I3 | J4 | K2 | L3 | M3 |
| 317 | Dongling | Y4 | A5 | B2 | C3 | D3 | E5 | F4 | G3 | H3 | I3 | J4 | K2 | L3 | M4 |
| 318 | Nanshan | Y4 | A4 | B2 | C3 | D3 | E4 | F3 | G2 | H4 | I3 | J4 | K2 | L3 | M3 |
| 319 | Houshan | Y4 | A4 | B2 | C3 | D3 | E3 | F4 | G1 | H1 | I3 | J4 | K2 | L3 | M4 |
| 320 | Jiuxian | Y4 | A5 | B4 | C3 | D3 | E5 | F4 | G1 | H1 | I3 | J4 | K2 | L3 | M3 |
| 321 | Xipang | Y4 | A4 | B2 | C3 | D3 | E4 | F3 | G3 | H2 | I3 | J4 | K2 | L3 | M3 |
| 322 | Songling | Y4 | A3 | B2 | C3 | D3 | E2 | F3 | G2 | H3 | I3 | J4 | K2 | L3 | M4 |
| 323 | Tingping | Y4 | A3 | B2 | C3 | D3 | E3 | F4 | G2 | H2 | I3 | J4 | K2 | L3 | M3 |
| 324 | YuanHou | Y4 | A5 | B3 | C4 | D3 | E1 | F5 | G2 | H1 | I2 | J4 | K2 | L3 | M3 |
| 325 | Leidong | Y5 | A5 | B5 | C4 | D3 | E2 | F3 | G2 | H3 | I3 | J4 | K2 | L3 | M4 |
| 326 | kitayama | Y4 | A5 | B5 | C4 | D3 | E2 | F5 | G1 | H1 | I3 | J4 | K2 | L3 | M4 |
| 327 | Xinfeng | Y5 | A5 | B4 | C4 | D3 | E3 | F5 | G1 | H2 | I3 | J4 | K2 | L1 | M4 |
| 328 | Han Dan | Y5 | A5 | B4 | C4 | D3 | E5 | F4 | G2 | H5 | I3 | J5 | K5 | L5 | M3 |
| 329 | Badou | Y3 | A5 | B3 | C4 | D3 | E3 | F5 | G1 | H2 | I3 | J4 | K2 | L1 | M4 |
| 330 | Xiangyangli | Y4 | A5 | B3 | C4 | D3 | E2 | F5 | G2 | H2 | I3 | J4 | K2 | L1 | M3 |
| 331 | Pingta | Y4 | A5 | B4 | C4 | D3 | E3 | F5 | G2 | H4 | I3 | J4 | K2 | L1 | M3 |
| 332 | Wukeng | Y4 | A5 | B3 | C4 | D3 | E3 | F5 | G2 | H3 | I3 | J4 | K2 | L2 | M3 |
| 333 | Shangjinbei | Y4 | A5 | B3 | C4 | D3 | E3 | F5 | G2 | H3 | I3 | J4 | K2 | L2 | M4 |
| 334 | Banzhu | Y5 | A5 | B3 | C4 | D3 | E2 | F5 | G2 | H3 | I3 | J4 | K2 | L2 | M4 |
| 335 | Qiongtang | Y4 | A5 | B3 | C4 | D3 | E3 | F4 | G2 | H3 | I3 | J4 | K2 | L2 | M4 |
| 336 | Zhongqian | Y4 | A5 | B5 | C4 | D3 | E4 | F5 | G2 | H1 | I3 | J4 | K2 | L2 | M4 |
| 337 | Shangtang | Y5 | A5 | B3 | C4 | D3 | E4 | F5 | G2 | H2 | I3 | J4 | K2 | L2 | M4 |
| 338 | Xilin | Y5 | A5 | B5 | C4 | D3 | E5 | F5 | G1 | H1 | I3 | J4 | K2 | L2 | M3 |
| 339 | Nangang | Y4 | A5 | B4 | C4 | D3 | E5 | F4 | G1 | H2 | I3 | J4 | K2 | L2 | M4 |
| 340 | Minkeng | Y5 | A5 | B4 | C4 | D3 | E4 | F3 | G2 | H5 | I3 | J4 | K2 | L2 | M3 |
| 341 | Jinfeng | Y4 | A5 | B3 | C4 | D3 | E4 | F5 | G2 | H1 | I3 | J4 | K2 | L2 | M4 |
| 342 | Puling | Y4 | A5 | B3 | C4 | D3 | E2 | F5 | G2 | H3 | I3 | J4 | K2 | L2 | M3 |
| 343 | Xinyan | Y4 | A5 | B5 | C4 | D3 | E3 | F4 | G2 | H4 | I3 | J4 | K2 | L2 | M3 |
| 344 | Chaikeng | Y5 | A5 | B3 | C4 | D3 | E2 | F4 | G2 | H3 | I3 | J4 | K2 | L1 | M4 |
| 345 | Waiyang | Y4 | A5 | B4 | C4 | D3 | E4 | F3 | G2 | H5 | I3 | J4 | K2 | L1 | M3 |
| 346 | Banshan | Y5 | A5 | B3 | C4 | D3 | E3 | F5 | G2 | H3 | I3 | J4 | K2 | L1 | M3 |
| 347 | Jinhan | Y4 | A5 | B3 | C4 | D3 | E5 | F3 | G2 | H4 | I3 | J4 | K2 | L2 | M4 |
| 348 | MABAN | Y4 | A5 | B5 | C4 | D3 | E1 | F5 | G1 | H1 | I3 | J4 | K2 | L2 | M3 |
| 349 | Houdun | Y5 | A5 | B3 | C4 | D3 | E1 | F5 | G2 | H2 | I3 | J4 | K2 | L1 | M4 |
| 350 | Daping | Y5 | A5 | B3 | C4 | D3 | E3 | F5 | G2 | H3 | I3 | J5 | K5 | L5 | M3 |
| 351 | Mayang | Y4 | A5 | B4 | C4 | D3 | E4 | F5 | G1 | H3 | I3 | J2 | K2 | L1 | M4 |
| 352 | Qingfu | Y4 | A5 | B3 | C4 | D3 | E3 | F2 | G2 | H4 | I3 | J2 | K2 | L1 | M3 |
| 353 | Qibaoyang | Y4 | A5 | B3 | C4 | D3 | E4 | F5 | G1 | H2 | I3 | J2 | K2 | L1 | M4 |
| 354 | Tomb bucket | Y4 | A5 | B5 | C4 | D3 | E3 | F4 | G1 | H2 | I3 | J2 | K2 | L1 | M3 |
| 355 | Badouwu | Y4 | A5 | B5 | C4 | D3 | E5 | F5 | G2 | H3 | I3 | J2 | K2 | L1 | M3 |
| 356 | Dasha | Y4 | A5 | B5 | C4 | D3 | E5 | F5 | G2 | H3 | I3 | J2 | K2 | L2 | M3 |
| 357 | Lingtou | Y4 | A5 | B4 | C4 | D3 | E4 | F5 | G1 | H3 | I3 | J2 | K2 | L2 | M3 |
| 358 | Dongshan | Y4 | A5 | B3 | C4 | D3 | E2 | F5 | G2 | H3 | I3 | J2 | K2 | L2 | M4 |
| 359 | Chakeng | Y4 | A5 | B5 | C4 | D3 | E2 | F4 | G2 | H2 | I3 | J2 | K2 | L2 | M4 |
| 360 | Houmu | Y4 | A5 | B4 | C4 | D3 | E4 | F5 | G1 | H3 | I3 | J2 | K2 | L2 | M4 |
| 361 | Nanmenshan | Y4 | A5 | B4 | C4 | D3 | E5 | F3 | G1 | H3 | I3 | J2 | K2 | L2 | M4 |
| 362 | Daping | Y4 | A4 | B3 | C3 | D3 | E4 | F3 | G1 | H2 | I3 | J2 | K2 | L2 | M4 |
| 363 | Sidou | Y3 | A5 | B3 | C3 | D3 | E2 | F5 | G2 | H3 | I3 | J2 | K2 | L1 | M4 |
| 364 | Fahua | Y3 | A5 | B3 | C3 | D3 | E4 | F4 | G2 | H3 | I3 | J2 | K2 | L1 | M4 |
| 365 | Dan Dou | Y3 | A5 | B3 | C3 | D3 | E3 | F5 | G1 | H3 | I3 | J2 | K2 | L1 | M3 |
| 366 | Doumen | Y3 | A5 | B3 | C3 | D3 | E2 | F5 | G2 | H3 | I1 | J2 | K2 | L1 | M4 |
| 367 | Nanban | Y4 | A4 | B3 | C3 | D3 | E2 | F5 | G1 | H2 | I1 | J4 | K3 | L5 | M5 |
| 368 | Longwan | Y4 | A4 | B3 | C3 | D3 | E4 | F3 | G2 | H3 | I3 | J2 | K2 | L1 | M4 |
| 369 | Xiaoma | Y4 | A3 | B5 | C3 | D3 | E2 | F5 | G2 | H1 | I3 | J2 | K2 | L3 | M4 |
| 370 | Sanping | Y4 | A2 | B4 | C3 | D3 | E5 | F5 | G2 | H2 | I3 | J2 | K2 | L3 | M4 |
| 371 | yiceng | Y3 | A3 | B4 | C3 | D3 | E2 | F5 | G1 | H1 | I3 | J2 | K2 | L3 | M4 |
| 372 | Bailukeng | Y4 | A3 | B4 | C3 | D3 | E3 | F4 | G1 | H2 | I3 | J2 | K2 | L2 | M4 |
| 373 | Damuli | Y4 | A4 | B5 | C3 | D3 | E4 | F5 | G1 | H2 | I3 | J2 | K2 | L3 | M4 |
| 374 | Lukeng | Y4 | A2 | B2 | C3 | D3 | E5 | F4 | G1 | H1 | I3 | J2 | K2 | L3 | M4 |
| 375 | Erkeng | Y3 | A2 | B4 | C3 | D3 | E4 | F4 | G1 | H2 | I3 | J2 | K2 | L2 | M4 |
| 376 | Fengjiang | Y3 | A3 | B5 | C3 | D3 | E4 | F4 | G2 | H2 | I3 | J2 | K2 | L2 | M4 |
| 377 | Banyueli | Y4 | A2 | B4 | C3 | D3 | E4 | F5 | G2 | H1 | I3 | J2 | K2 | L2 | M4 |
| 378 | Xikeng | Y4 | A3 | B4 | C3 | D3 | E2 | F5 | G1 | H1 | I3 | J2 | K2 | L2 | M4 |
| 379 | Daling | Y4 | A4 | B4 | C3 | D3 | E4 | F5 | G1 | H2 | I3 | J2 | K2 | L2 | M4 |
| 380 | RuanYang | Y4 | A4 | B5 | C3 | D3 | E2 | F5 | G1 | H1 | I2 | J2 | K2 | L2 | M4 |
| 381 | Xizhai | Y4 | A3 | B5 | C3 | D3 | E4 | F4 | G2 | H2 | I3 | J2 | K2 | L3 | M4 |
| 382 | Panqian | Y3 | A2 | B4 | C3 | D3 | E4 | F4 | G1 | H1 | I3 | J2 | K2 | L3 | M4 |
| 383 | Wuyan | Y3 | A3 | B4 | C3 | D3 | E4 | F5 | G1 | H2 | I3 | J2 | K2 | L3 | M4 |
| 384 | Erpu | Y4 | A4 | B3 | C3 | D3 | E3 | F5 | G1 | H2 | I3 | J2 | K2 | L2 | M4 |
| 385 | Nantang | Y4 | A3 | B4 | C3 | D3 | E4 | F5 | G1 | H1 | I3 | J2 | K2 | L3 | M3 |
| 386 | Yao’ao | Y4 | A2 | B4 | C3 | D3 | E4 | F3 | G1 | H1 | I3 | J2 | K2 | L3 | M4 |
| 387 | Wayaotou | Y4 | A2 | B5 | C3 | D3 | E4 | F5 | G1 | H1 | I3 | J2 | K2 | L3 | M4 |
| 388 | Yangbian | Y4 | A5 | B5 | C3 | D3 | E3 | F4 | G2 | H3 | I3 | J2 | K2 | L1 | M4 |
| 389 | Xisheng | Y5 | A3 | B4 | C3 | D3 | E3 | F4 | G3 | H2 | I3 | J2 | K2 | L1 | M3 |
| 390 | Wanggaodian | Y4 | A3 | B5 | C3 | D3 | E4 | F4 | G3 | H1 | I3 | J2 | K2 | L2 | M3 |
| 391 | Chagang | Y4 | A3 | B5 | C3 | D3 | E4 | F5 | G3 | H1 | I3 | J2 | K2 | L2 | M3 |
| 392 | Qing’ao | Y4 | A3 | B4 | C3 | D3 | E2 | F3 | G2 | H3 | I3 | J2 | K2 | L1 | M3 |
| 393 | Banling | Y4 | A3 | B2 | C3 | D3 | E4 | F4 | G1 | H1 | I3 | J2 | K2 | L2 | M3 |
| 394 | Qidoucha | Y4 | A3 | B2 | C3 | D3 | E4 | F4 | G1 | H2 | I3 | J2 | K2 | L1 | M4 |
| 395 | Huli | Y4 | A5 | B5 | C3 | D3 | E4 | F4 | G2 | H3 | I3 | J2 | K2 | L2 | M4 |
| 396 | Dam | Y4 | A4 | B4 | C3 | D3 | E2 | F5 | G1 | H1 | I3 | J2 | K2 | L1 | M4 |
| 397 | Changhu | Y4 | A4 | B4 | C3 | D3 | E3 | F5 | G1 | H1 | I3 | J2 | K2 | L2 | M4 |
| 398 | Xin | Y4 | A5 | B5 | C3 | D3 | E4 | F5 | G1 | H2 | I3 | J2 | K2 | L2 | M3 |
| 399 | Shangshui | Y4 | A5 | B5 | C3 | D3 | E2 | F4 | G1 | H3 | I3 | J2 | K2 | L1 | M4 |
| 400 | Xiaping | Y4 | A5 | B5 | C3 | D3 | E4 | F4 | G2 | H2 | I3 | J2 | K2 | L1 | M3 |
| 401 | Xiping | Y4 | A4 | B5 | C3 | D3 | E5 | F5 | G2 | H1 | I3 | J2 | K2 | L2 | M4 |
| 402 | Jianxia | Y5 | A3 | B3 | C3 | D3 | E2 | F4 | G2 | H3 | I3 | J2 | K2 | L2 | M3 |
| 403 | Banlu Zhang | Y4 | A3 | B3 | C3 | D3 | E4 | F4 | G2 | H2 | I3 | J2 | K2 | L2 | M4 |
| 404 | Lanxia | Y4 | A3 | B5 | C3 | D3 | E3 | F4 | G2 | H3 | I3 | J2 | K2 | L2 | M3 |
| 405 | Shiban | Y2 | A3 | B5 | C3 | D1 | E2 | F4 | G2 | H3 | I3 | J5 | K4 | L2 | M4 |
| 406 | Shifeng | Y2 | A3 | B5 | C3 | D1 | E4 | F4 | G2 | H3 | I3 | J5 | K4 | L2 | M3 |
| 407 | Fuda | Y2 | A3 | B5 | C3 | D1 | E3 | F4 | G2 | H3 | I3 | J5 | K4 | L2 | M4 |
| 408 | Meiping | Y1 | A3 | B5 | C3 | D1 | E2 | F3 | G2 | H4 | I3 | J5 | K4 | L2 | M3 |
| 409 | Xiyuanli | Y2 | A4 | B5 | C3 | D1 | E3 | F5 | G2 | H3 | I3 | J5 | K4 | L2 | M4 |
| 45 | Xinjian | Y2 | A4 | B5 | C3 | D1 | E3 | F4 | G2 | H2 | I3 | J5 | K4 | L2 | M4 |
| 411 | Bati | Y1 | A4 | B5 | C3 | D1 | E5 | F5 | G2 | H2 | I3 | J2 | K3 | L3 | M3 |
| 412 | Waiyang | Y4 | A5 | B3 | C3 | D1 | E4 | F3 | G2 | H3 | I3 | J3 | K5 | L2 | M1 |
| 413 | Li Jiayang | Y3 | A4 | B4 | C3 | D1 | E3 | F3 | G2 | H2 | I3 | J3 | K5 | L2 | M1 |
| 414 | Li Jiayang | Y3 | A5 | B3 | C3 | D1 | E4 | F4 | G2 | H3 | I3 | J3 | K5 | L2 | M1 |
| 415 | beishan | Y4 | A3 | B5 | C3 | D1 | E3 | F4 | G2 | H2 | I3 | J3 | K5 | L2 | M1 |
| 416 | Batou | Y2 | A4 | B3 | C3 | D1 | E2 | F4 | G1 | H1 | I3 | J3 | K5 | L2 | M1 |
| 417 | Xingfu | Y3 | A3 | B5 | C3 | D2 | E3 | F2 | G1 | H2 | I3 | J1 | K1 | L2 | M5 |
| 418 | Yunmen | Y4 | A4 | B5 | C3 | D3 | E2 | F3 | G1 | H3 | I3 | J4 | K2 | L1 | M4 |
| 419 | Lingfengshan | Y4 | A4 | B5 | C3 | D2 | E5 | F2 | G2 | H2 | I3 | J1 | K1 | L2 | M5 |
| 420 | Dongxi | Y4 | A4 | B3 | C3 | D3 | E4 | F2 | G1 | H1 | I3 | J2 | K4 | L1 | M4 |
| 421 | Baojianzhai | Y3 | A3 | B5 | C3 | D3 | E3 | F3 | G1 | H2 | I3 | J2 | K4 | L1 | M4 |
| 422 | Ke Ling | Y3 | A5 | B3 | C2 | D3 | E4 | F2 | G3 | H3 | I3 | J2 | K4 | L1 | M4 |
| 423 | Chawan | Y3 | A5 | B4 | C2 | D3 | E4 | F4 | G3 | H2 | I3 | J2 | K4 | L1 | M3 |
| 424 | Wanli | Y4 | A5 | B4 | C2 | D3 | E3 | F3 | G3 | H2 | I3 | J2 | K4 | L1 | M4 |
| 425 | Chunleiyun | Y5 | A5 | B4 | C2 | D3 | E3 | F3 | G3 | H2 | I3 | J5 | K5 | L5 | M3 |
| 426 | Lingwei | Y5 | A4 | B4 | C2 | D3 | E4 | F3 | G3 | H1 | I3 | J5 | K5 | L5 | M4 |
| 427 | Shantouzhuang | Y5 | A5 | B5 | C2 | D3 | E3 | F2 | G2 | H2 | I3 | J5 | K5 | L5 | M4 |
| 428 | Guoyang | Y5 | A5 | B3 | C2 | D3 | E3 | F2 | G3 | H1 | I3 | J5 | K5 | L5 | M4 |
| 429 | Xiaoling | Y5 | A5 | B4 | C4 | D3 | E5 | F5 | G2 | H4 | I3 | J5 | K5 | L5 | M3 |
| 430 | Hecuo | Y5 | A4 | B5 | C2 | D3 | E3 | F2 | G3 | H3 | I3 | J5 | K5 | L5 | M4 |
| 431 | Tongkengli | Y5 | A3 | B5 | C2 | D3 | E4 | F3 | G3 | H2 | I3 | J5 | K5 | L5 | M4 |
| 432 | Xiachi | Y5 | A5 | B3 | C2 | D3 | E3 | F2 | G2 | H4 | I3 | J5 | K5 | L5 | M4 |
| 433 | Kengmen | Y5 | A5 | B3 | C2 | D3 | E4 | F2 | G2 | H4 | I3 | J5 | K5 | L5 | M4 |
| 434 | Zhangwo | Y5 | A5 | B5 | C2 | D3 | E4 | F3 | G4 | H3 | I3 | J5 | K5 | L5 | M4 |
| 435 | Zhangling | Y5 | A5 | B5 | C2 | D3 | E5 | F3 | G4 | H3 | I3 | J5 | K5 | L5 | M3 |
| 436 | Wangkeng | Y5 | A5 | B4 | C4 | D3 | E3 | F5 | G1 | H3 | I2 | J5 | K5 | L5 | M4 |
| 437 | Golden belt | Y5 | A5 | B4 | C4 | D3 | E4 | F5 | G2 | H3 | I3 | J5 | K5 | L5 | M4 |
| 438 | Tongwanyang | Y5 | A5 | B4 | C4 | D3 | E3 | F4 | G2 | H5 | I3 | J5 | K5 | L5 | M4 |
| 439 | Henri | Y5 | A5 | B4 | C4 | D3 | E5 | F5 | G2 | H4 | I3 | J5 | K5 | L5 | M4 |
| 440 | Zhangkeng | Y5 | A5 | B4 | C4 | D3 | E4 | F4 | G2 | H4 | I3 | J5 | K5 | L5 | M4 |
| 441 | Changyang | Y5 | A5 | B4 | C4 | D3 | E4 | F5 | G2 | H4 | I3 | J5 | K5 | L5 | M4 |
| 442 | Longtan Mian | Y5 | A5 | B4 | C4 | D3 | E5 | F3 | G2 | H5 | I3 | J5 | K5 | L5 | M4 |
| 443 | Nanshantou | Y4 | A4 | B5 | C4 | D3 | E4 | F5 | G1 | H1 | I3 | J5 | K5 | L5 | M4 |
| 444 | Licha | Y5 | A4 | B5 | C4 | D3 | E5 | F5 | G1 | H1 | I3 | J5 | K5 | L5 | M3 |
| 445 | Shangshan | Y5 | A5 | B3 | C4 | D3 | E2 | F5 | G3 | H3 | I3 | J5 | K5 | L5 | M3 |
| 446 | Eshan | Y4 | A5 | B4 | C4 | D3 | E1 | F3 | G1 | H2 | I3 | J5 | K5 | L5 | M3 |
| 447 | LinYang | Y5 | A5 | B4 | C4 | D3 | E2 | F5 | G1 | H2 | I2 | J5 | K5 | L5 | M3 |
| 448 | Mashan | Y5 | A5 | B4 | C4 | D3 | E4 | F5 | G1 | H1 | I3 | J5 | K5 | L5 | M3 |
| 449 | Lantian | Y5 | A5 | B4 | C4 | D3 | E2 | F4 | G1 | H1 | I3 | J5 | K5 | L5 | M4 |
| 450 | Baisha | Y5 | A5 | B4 | C4 | D3 | E2 | F5 | G1 | H1 | I3 | J5 | K5 | L5 | M4 |
| 451 | Qishan | Y5 | A4 | B5 | C4 | D3 | E5 | F4 | G1 | H2 | I3 | J5 | K5 | L5 | M4 |
| 452 | CHANGKENG | Y5 | A5 | B5 | C4 | D3 | E3 | F5 | G2 | H2 | I3 | J5 | K5 | L5 | M3 |
| 453 | Kenglikeng | Y4 | A5 | B4 | C4 | D3 | E4 | F4 | G2 | H2 | I3 | J5 | K5 | L5 | M4 |
| 454 | Qinkan | Y4 | A5 | B5 | C4 | D3 | E4 | F4 | G4 | H3 | I3 | J5 | K5 | L5 | M4 |
| 455 | Yuxiyang | Y4 | A5 | B5 | C4 | D3 | E5 | F4 | G3 | H2 | I3 | J5 | K5 | L5 | M3 |
| 456 | Kanxia | Y5 | A5 | B5 | C4 | D3 | E5 | F4 | G3 | H1 | I3 | J5 | K5 | L5 | M4 |
| 457 | Yue Xiu | Y5 | A4 | B4 | C4 | D3 | E2 | F4 | G4 | H4 | I3 | J5 | K5 | L5 | M4 |
| 458 | Xiazhuang | Y5 | A4 | B3 | C4 | D3 | E3 | F3 | G3 | H1 | I3 | J5 | K5 | L5 | M4 |
| 459 | Dongping | Y5 | A5 | B3 | C4 | D3 | E4 | F5 | G3 | H4 | I3 | J5 | K5 | L5 | M4 |
| 460 | Hengkeng | Y5 | A5 | B5 | C4 | D3 | E2 | F5 | G3 | H4 | I3 | J5 | K5 | L5 | M4 |
| 461 | Ronglingtou | Y4 | A5 | B3 | C4 | D3 | E2 | F5 | G3 | H3 | I3 | J5 | K5 | L5 | M3 |
| 462 | Pan Yang | Y5 | A5 | B5 | C4 | D3 | E2 | F5 | G3 | H4 | I3 | J5 | K5 | L5 | M4 |
| 463 | Daping | Y5 | A4 | B5 | C4 | D3 | E3 | F5 | G1 | H1 | I2 | J5 | K5 | L5 | M4 |
| 464 | Xie Lingxia | Y5 | A5 | B5 | C4 | D3 | E4 | F4 | G3 | H1 | I3 | J5 | K5 | L5 | M4 |
| 465 | Shihe | Y5 | A3 | B4 | C4 | D3 | E4 | F5 | G1 | H1 | I3 | J5 | K5 | L5 | M4 |
| 466 | Xianshi | Y5 | A5 | B5 | C4 | D3 | E4 | F4 | G4 | H3 | I3 | J5 | K5 | L5 | M4 |
| 467 | GUAXI | Y5 | A5 | B4 | C4 | D3 | E3 | F5 | G1 | H1 | I3 | J5 | K5 | L5 | M4 |
| 468 | Caihuaqiao | Y5 | A5 | B5 | C4 | D3 | E3 | F5 | G3 | H5 | I3 | J5 | K5 | L5 | M4 |
| 469 | Zhuzhoushan | Y4 | A4 | B5 | C4 | D2 | E2 | F5 | G3 | H5 | I3 | J1 | K1 | L2 | M5 |
| 470 | Xita | Y5 | A5 | B4 | C4 | D3 | E4 | F4 | G2 | H2 | I3 | J5 | K5 | L5 | M4 |
| 471 | Shanli | Y5 | A4 | B5 | C4 | D3 | E4 | F4 | G2 | H1 | I2 | J5 | K5 | L5 | M4 |
| 472 | Yangmian | Y5 | A4 | B5 | C4 | D3 | E4 | F4 | G4 | H3 | I3 | J5 | K5 | L5 | M4 |
| 473 | Banyu | Y5 | A5 | B5 | C4 | D3 | E5 | F4 | G3 | H2 | I3 | J5 | K5 | L5 | M4 |
| 474 | Chi tou | Y5 | A5 | B5 | C4 | D3 | E4 | F4 | G4 | H3 | I3 | J5 | K5 | L5 | M4 |
| 475 | Xibei | Y5 | A5 | B3 | C4 | D3 | E3 | F4 | G3 | H2 | I3 | J5 | K5 | L5 | M4 |
| 476 | Zhangjiashan | Y5 | A5 | B4 | C4 | D3 | E4 | F4 | G1 | H2 | I3 | J5 | K5 | L5 | M4 |
| 477 | Niushanwan | Y5 | A5 | B5 | C4 | D3 | E2 | F5 | G3 | H4 | I3 | J5 | K5 | L5 | M4 |
| 478 | Zhuwo | Y5 | A4 | B5 | C4 | D3 | E5 | F4 | G2 | H5 | I3 | J5 | K5 | L5 | M4 |
| 479 | Litan | Y5 | A4 | B5 | C4 | D3 | E5 | F5 | G2 | H1 | I2 | J5 | K5 | L5 | M4 |
| 480 | Kehou | Y5 | A5 | B5 | C2 | D3 | E4 | F4 | G3 | H2 | I3 | J5 | K5 | L5 | M4 |
| 481 | Yanke | Y5 | A5 | B5 | C4 | D3 | E4 | F5 | G3 | H3 | I2 | J5 | K5 | L5 | M4 |
| 482 | Chayang | Y5 | A5 | B5 | C4 | D3 | E4 | F3 | G3 | H2 | I3 | J5 | K5 | L5 | M4 |
| 483 | Kengyuan | Y5 | A4 | B3 | C4 | D3 | E5 | F3 | G3 | H1 | I3 | J5 | K5 | L5 | M4 |
| 484 | Banling | Y5 | A4 | B4 | C4 | D3 | E2 | F5 | G1 | H1 | I2 | J5 | K5 | L5 | M4 |
| 485 | Houyang | Y4 | A4 | B4 | C4 | D3 | E2 | F3 | G2 | H1 | I3 | J5 | K5 | L5 | M4 |
| 486 | Lianling | Y5 | A5 | B3 | C4 | D3 | E2 | F5 | G3 | H4 | I3 | J5 | K5 | L5 | M4 |
| 487 | Yankeng | Y5 | A5 | B5 | C4 | D3 | E4 | F4 | G2 | H4 | I2 | J5 | K5 | L5 | M4 |
| 488 | Huang Ru | Y5 | A4 | B5 | C4 | D3 | E1 | F5 | G1 | H1 | I3 | J5 | K5 | L5 | M4 |
| 489 | Hutou | Y5 | A5 | B3 | C4 | D3 | E2 | F5 | G3 | H3 | I3 | J5 | K5 | L5 | M4 |
| 490 | Yangping | Y5 | A5 | B5 | C4 | D3 | E2 | F5 | G3 | H2 | I3 | J5 | K5 | L5 | M4 |
| 491 | Banshan | Y5 | A5 | B3 | C4 | D3 | E4 | F4 | G3 | H3 | I3 | J5 | K5 | L5 | M4 |
| 492 | Changtan | Y5 | A5 | B5 | C4 | D3 | E2 | F5 | G3 | H3 | I3 | J5 | K5 | L5 | M4 |
| 493 | Tingdou | Y5 | A5 | B5 | C4 | D3 | E5 | F5 | G2 | H1 | I3 | J5 | K5 | L5 | M4 |
| 494 | Jiangjiadu | Y5 | A4 | B4 | C4 | D3 | E3 | F5 | G1 | H2 | I3 | J5 | K5 | L4 | M4 |
| 495 | Rizhai | Y5 | A4 | B4 | C4 | D3 | E5 | F5 | G1 | H1 | I3 | J5 | K5 | L5 | M4 |
| 496 | He’an | Y5 | A4 | B5 | C4 | D3 | E4 | F4 | G4 | H4 | I3 | J5 | K5 | L5 | M4 |
| 497 | Pengjiayang | Y5 | A5 | B3 | C4 | D3 | E2 | F5 | G3 | H3 | I3 | J5 | K5 | L5 | M4 |
| 498 | Wellhead | Y5 | A4 | B5 | C4 | D3 | E5 | F4 | G3 | H1 | I3 | J5 | K5 | L4 | M4 |
| 499 | Houmen Ping | Y5 | A5 | B5 | C4 | D3 | E5 | F4 | G3 | H2 | I3 | J5 | K5 | L5 | M4 |
| 500 | Xu Yang | Y5 | A5 | B5 | C4 | D3 | E1 | F5 | G3 | H3 | I3 | J5 | K5 | L5 | M4 |
| 501 | Dalin | Y5 | A5 | B5 | C4 | D3 | E2 | F5 | G3 | H3 | I3 | J5 | K5 | L5 | M4 |
| 502 | Xianyan | Y5 | A5 | B5 | C4 | D3 | E4 | F5 | G3 | H3 | I3 | J5 | K5 | L4 | M4 |
| 503 | Tiehu | Y5 | A5 | B3 | C4 | D3 | E2 | F5 | G3 | H3 | I3 | J5 | K5 | L5 | M4 |
| 504 | Meiyang | Y5 | A5 | B3 | C4 | D3 | E4 | F5 | G3 | H4 | I3 | J5 | K5 | L5 | M4 |
| 505 | Hanyang | Y5 | A5 | B3 | C4 | D3 | E3 | F5 | G3 | H3 | I3 | J5 | K5 | L5 | M4 |
| 506 | Chayang | Y5 | A5 | B3 | C4 | D3 | E4 | F3 | G3 | H3 | I3 | J5 | K5 | L5 | M4 |
| 507 | Fengyang | Y5 | A5 | B3 | C4 | D3 | E4 | F4 | G3 | H3 | I3 | J5 | K5 | L5 | M4 |
| 508 | Lingkeng | Y5 | A5 | B3 | C4 | D3 | E5 | F3 | G3 | H3 | I3 | J5 | K5 | L5 | M4 |
| 509 | Gaoling | Y5 | A5 | B3 | C4 | D3 | E4 | F4 | G3 | H2 | I3 | J5 | K5 | L5 | M4 |
| 55 | Zhongao | Y5 | A4 | B3 | C4 | D3 | E4 | F4 | G3 | H2 | I3 | J5 | K5 | L5 | M4 |
| 511 | Waicuo | Y5 | A5 | B3 | C4 | D3 | E3 | F4 | G3 | H2 | I3 | J5 | K5 | L5 | M4 |
| 512 | Hongping | Y5 | A5 | B3 | C4 | D3 | E3 | F4 | G3 | H3 | I3 | J5 | K5 | L5 | M4 |
| 513 | Jindouyang | Y5 | A5 | B3 | C4 | D3 | E4 | F5 | G3 | H3 | I3 | J5 | K5 | L5 | M4 |
| 514 | Baikeng | Y5 | A5 | B3 | C4 | D3 | E3 | F5 | G3 | H3 | I2 | J5 | K5 | L5 | M4 |
| 515 | Baolin | Y5 | A4 | B2 | C4 | D3 | E5 | F5 | G1 | H2 | I3 | J5 | K5 | L5 | M4 |
| 516 | Yanxia | Y5 | A4 | B2 | C4 | D3 | E5 | F4 | G1 | H2 | I2 | J5 | K5 | L5 | M4 |
| 517 | WangLichun | Y5 | A5 | B5 | C4 | D3 | E5 | F5 | G2 | H1 | I2 | J5 | K5 | L5 | M4 |
| 518 | DaPingLi | Y5 | A5 | B5 | C4 | D3 | E3 | F4 | G3 | H3 | I3 | J5 | K5 | L5 | M4 |
| 519 | Wanglou | Y5 | A4 | B5 | C4 | D3 | E4 | F5 | G3 | H1 | I3 | J5 | K5 | L5 | M4 |
| 520 | Shangyang | Y5 | A5 | B5 | C4 | D3 | E4 | F5 | G3 | H3 | I3 | J5 | K5 | L5 | M4 |
| 521 | Nanshan | Y5 | A5 | B3 | C4 | D3 | E3 | F4 | G3 | H3 | I3 | J5 | K5 | L5 | M4 |
| 522 | Wenyan | Y5 | A4 | B5 | C4 | D3 | E5 | F3 | G3 | H2 | I3 | J5 | K5 | L5 | M4 |
| 523 | Dongshan | Y5 | A5 | B5 | C4 | D3 | E3 | F4 | G3 | H4 | I2 | J5 | K5 | L5 | M4 |
| 524 | Qiuling | Y5 | A5 | B3 | C4 | D3 | E3 | F4 | G3 | H3 | I3 | J5 | K5 | L5 | M4 |
| 525 | Zhiping | Y5 | A5 | B3 | C4 | D3 | E4 | F4 | G3 | H2 | I3 | J5 | K5 | L5 | M4 |
| 526 | Lushan | Y5 | A4 | B4 | C4 | D3 | E3 | F4 | G1 | H2 | I2 | J5 | K5 | L5 | M4 |
| 527 | Fuling | Y5 | A5 | B5 | C4 | D3 | E1 | F5 | G4 | H2 | I3 | J5 | K5 | L5 | M4 |
| 528 | Chamen | Y3 | A5 | B3 | C4 | D3 | E2 | F5 | G3 | H3 | I3 | J5 | K5 | L5 | M2 |
| 529 | Ke Ling | Y3 | A5 | B4 | C4 | D3 | E4 | F3 | G2 | H2 | I3 | J5 | K5 | L5 | M2 |
| 530 | Yangli | Y3 | A5 | B5 | C4 | D3 | E5 | F4 | G3 | H2 | I3 | J5 | K5 | L5 | M2 |
| 531 | Qiaoting | Y3 | A4 | B5 | C4 | D3 | E5 | F3 | G3 | H2 | I2 | J5 | K5 | L4 | M2 |
| 532 | Kangshan | Y3 | A5 | B5 | C4 | D3 | E5 | F2 | G3 | H3 | I3 | J5 | K5 | L5 | M2 |
| 533 | Fuyao | Y3 | A4 | B5 | C4 | D3 | E5 | F3 | G3 | H2 | I3 | J5 | K5 | L5 | M2 |
| 534 | Chixi | Y4 | A5 | B5 | C4 | D3 | E5 | F4 | G3 | H4 | I3 | J5 | K5 | L4 | M2 |
| 535 | Zhuyang | Y3 | A5 | B5 | C4 | D3 | E4 | F4 | G3 | H4 | I3 | J5 | K5 | L4 | M2 |
| 536 | Tangyang | Y3 | A5 | B5 | C4 | D3 | E5 | F5 | G2 | H1 | I3 | J5 | K5 | L5 | M2 |
| 537 | Xiangyang | Y3 | A5 | B4 | C4 | D3 | E1 | F5 | G1 | H1 | I3 | J5 | K5 | L5 | M2 |
| 538 | Longtouwan | Y3 | A4 | B4 | C4 | D3 | E5 | F4 | G2 | H1 | I3 | J5 | K5 | L4 | M2 |
| 539 | Ruiyun | Y3 | A5 | B5 | C5 | D3 | E5 | F3 | G3 | H2 | I3 | J5 | K5 | L5 | M2 |
| 540 | Fuliu | Y3 | A5 | B3 | C5 | D3 | E2 | F5 | G3 | H2 | I3 | J5 | K5 | L5 | M2 |
| 541 | CaiBao | Y3 | A2 | B4 | C5 | D3 | E2 | F5 | G2 | H2 | I3 | J5 | K5 | L5 | M2 |
| 542 | Jingtou | Y1 | A3 | B5 | C5 | D4 | E4 | F5 | G2 | H1 | I3 | J5 | K5 | L5 | M2 |
| 543 | Niuchengxia | Y3 | A3 | B5 | C5 | D3 | E4 | F5 | G2 | H2 | I3 | J5 | K5 | L5 | M2 |
| 544 | ZiBei | Y3 | A2 | B4 | C5 | D3 | E4 | F5 | G2 | H3 | I3 | J5 | K5 | L4 | M2 |
| 545 | Chaoyang | Y3 | A2 | B4 | C5 | D3 | E5 | F5 | G2 | H1 | I3 | J5 | K5 | L5 | M2 |
| 546 | Tingbian | Y3 | A5 | B3 | C5 | D3 | E4 | F5 | G3 | H3 | I1 | J5 | K5 | L5 | M2 |
| 547 | Jiayang | Y3 | A5 | B5 | C5 | D3 | E2 | F4 | G3 | H1 | I3 | J5 | K5 | L5 | M2 |
| 548 | Luochun | Y3 | A3 | B5 | C5 | D3 | E5 | F5 | G3 | H1 | I3 | J5 | K5 | L5 | M2 |
| 549 | Shangan | Y3 | A3 | B5 | C5 | D3 | E3 | F4 | G2 | H3 | I3 | J4 | K3 | L4 | M5 |
| 550 | Fangjiashan | Y3 | A2 | B4 | C5 | D3 | E3 | F4 | G2 | H1 | I2 | J5 | K5 | L5 | M2 |
| 551 | Shuanghua | Y3 | A5 | B3 | C5 | D3 | E3 | F4 | G3 | H2 | I3 | J5 | K5 | L5 | M2 |
| 552 | gaoshan | Y3 | A2 | B4 | C5 | D3 | E2 | F5 | G2 | H2 | I3 | J5 | K5 | L5 | M2 |
| 553 | Jiashan | Y3 | A3 | B5 | C5 | D3 | E3 | F3 | G2 | H2 | I2 | J5 | K5 | L5 | M2 |
| 554 | Paiyang | Y3 | A4 | B5 | C5 | D3 | E3 | F4 | G2 | H3 | I2 | J5 | K5 | L5 | M2 |
| 555 | Houao | Y3 | A2 | B4 | C5 | D3 | E4 | F5 | G2 | H2 | I3 | J5 | K5 | L5 | M2 |
| 556 | Youkeng | Y3 | A3 | B4 | C5 | D3 | E2 | F5 | G2 | H1 | I2 | J5 | K5 | L4 | M2 |
| 557 | Yutang | Y1 | A5 | B5 | C5 | D1 | E4 | F3 | G3 | H1 | I3 | J4 | K1 | L5 | M5 |
| 558 | Zhenbian | Y1 | A3 | B5 | C5 | D1 | E3 | F4 | G2 | H2 | I2 | J4 | K1 | L4 | M5 |
| 559 | Xiaojia | Y1 | A3 | B4 | C5 | D1 | E4 | F5 | G2 | H1 | I3 | J4 | K1 | L5 | M5 |
| 560 | Ocean | Y1 | A3 | B5 | C5 | D1 | E5 | F4 | G2 | H3 | I3 | J4 | K1 | L5 | M5 |
| 561 | Kengkou | Y1 | A2 | B2 | C5 | D1 | E1 | F3 | G2 | H1 | I3 | J4 | K1 | L4 | M5 |
| 562 | Qiaowan | Y2 | A2 | B4 | C5 | D2 | E3 | F5 | G2 | H2 | I2 | J3 | K4 | L4 | M5 |
| 563 | Taiyin | Y2 | A3 | B5 | C5 | D2 | E4 | F3 | G2 | H3 | I3 | J3 | K4 | L4 | M5 |
| 564 | Siqian | Y2 | A3 | B5 | C5 | D2 | E3 | F4 | G2 | H2 | I3 | J3 | K4 | L4 | M5 |
| 565 | Dunshang | Y2 | A3 | B4 | C5 | D2 | E3 | F4 | G2 | H1 | I3 | J3 | K4 | L5 | M5 |
| 566 | Dongshan | Y2 | A5 | B3 | C5 | D2 | E4 | F5 | G3 | H3 | I1 | J3 | K4 | L4 | M5 |
| 567 | Wanchang | Y2 | A3 | B4 | C5 | D2 | E3 | F4 | G2 | H2 | I3 | J3 | K4 | L4 | M5 |
References
- State Ethnic Affairs Commission Planning Outline for the Protection and Development of Ethnic Minority Villages (2011–2015). Available online: https://www.neac.gov.cn/seac/xwzx/201212/1003273.shtml (accessed on 27 May 2022).
- Guiding Opinions of the State Ethnic Affairs Commission on Further Strengthening and Standardizing the Protection and Development of Ethnic Minority Villages and Towns in the New Period. Available online: https://http://smmz.sm.gov.cn/xxgk/ghjh/201910/t20191011_1340524.htm (accessed on 22 August 2022).
- Xu, X.; Genovese, P.V.; Zhao, Y.; Liu, Y.; Woldesemayat, E.M.; Zoure, A.N. Geographical Distribution Characteristics of Ethnic-Minority Villages in Fujian and Their Relationship with Topographic Factors. Sustainability 2022, 14, 7727. [Google Scholar] [CrossRef]
- The 12th Five Year Plan for Minority Undertakings. Available online: http://politics.people.com.cn/n/2012/0720/c70731-18565316-3.html (accessed on 12 May 2022).
- Action Plan on Promoting National Villages to Win the Battle Against Poverty. Available online: http://mzzjt.fujian.gov.cn/zfxxgkzl/zfxxgkml/ghjh_27731/201907/t20190705_4913796.htm (accessed on 14 May 2022).
- Gregerson, M.J. Learning to read in Ratanakiri: A case study from northeastern Cambodia. Int. J. Biling. Educ. Biling. 2009, 12, 429–447. [Google Scholar] [CrossRef]
- Semple, W. Mountain Research and Development. Int. Mt. Soc. 2005, 25, 15–19. [Google Scholar]
- Afshar, F. Balancing global city with global village. Habitat Int. 1998, 22, 375–387. [Google Scholar] [CrossRef]
- Long, Y.P.; He, Y.X.; Yu, C.H.; Chen, M.X. The Development Status and Protection of Traditional Qiang Ethnic Minority Villages. In Proceedings of the Advances in Energy Science and Environment Engineering II (AESEE), Zhuhai, China, 2–4 February 2018. [Google Scholar]
- Chen, Y.M.; Zhu, M.L. An Optimal Cost-Sharing Incentive Model of Main Manufacturer-Suppliers for Complex Equipment under Grey Information. J. Grey Syst. 2011, 23, 155–160. [Google Scholar]
- Gustafsson, B.; Sai, D. Wage growth and inequality in urban China: 1988–2013. China Econ. Rev. 2009, 20, 193–207. [Google Scholar] [CrossRef]
- Fujian Provincial Department of Finance. Action Plan on Promoting National Villages to Win Poverty Alleviation. Available online: https://http://www.mzb.com.cn/html/report/190732419-1.htm (accessed on 22 August 2022).
- The 14th Five-Year Plan for the National Economic and Social Development of the People’s Republic of China and the Outline of Long-Term Goals for 2035. Available online: https://www.ndrc.gov.cn/xxgk/zcfb/ghwb/202103/t20210323_1270124.html?code=&state=123 (accessed on 19 May 2022).
- Liu, L.W.; Duan, Y.H.; Li, L.L.; Xu, L.S.; Zhang, Y.; Nie, W.Y. Spatial distribution characteristics and suitability evaluation of rural residential areas in Shanxi Province. Agric. Resour. Reg. China 2022, 43, 100–109. [Google Scholar]
- Li, Y.; Xia, Y.L.; Cui, X.P.; Lei, Z.D. Evaluation of the suitability of spatial distribution of affordable housing in Xi’an from the perspective of low carbon. Huazhong Archit. 2021, 39, 80–84. [Google Scholar]
- Ma, C.X.; Yang, J.K.; Wei, D.Y. Evaluation of the suitability of the spatial layout of elderly care facilities in Xingning District of Nanning City. J. Nanning Teach. Educ. Univ. 2020, 37, 128–133. [Google Scholar]
- Li, S.; Shi, M.C.; Liu, X.Y.; Zhao, H.; Sun, L.S.; Ke, Z.F. Zhou Huan Spatial distribution of precise suitability of Pinus massoniana in Hubei Province. Acta Ecologica Sinica 2019, 39, 1960–1968. [Google Scholar]
- Millar, A.B.; Gruenewald, P.J. Use of spatial models for community program evaluation of changes in alcohol outlet distribution. Addiction 1997, 92, S273–S283. [Google Scholar] [CrossRef] [PubMed]
- Beck, J.; Boller, M.; Erhardt, A.; Schwanghart, W. Spatial bias in the GBIF database and its effect on modeling species’ geographic distributions. Ecol. Inform. 2014, 19, 10–15. [Google Scholar] [CrossRef]
- Peng, R.W.; Zhou, Z.F.; Huang, D.H.; Li, Q.X.; Hu, L.W. Suitability Evaluation of Pitaya Planting in Plateau Mountainous Areas Based on Multi-Factor Analysis. Available online: http://kns.cnki.net/kcms/detail/11.3513.S.20211130.1810.041.html (accessed on 23 May 2022).
- Abou-Elnour, A.; Pallathucheril, V.; Abou-Elnour, A. Site Suitability Evaluation for Ecotourism Potential Areas Using RS and GIS: A Case Study of Wadi Wurayah, Fujairah, UAE. In Proceedings of the Conference on Remote Sensing and Modeling of Ecosystems for Sustainability XII, San Diego, CA, USA, 11–12 August 2015. [Google Scholar]
- Lu, Z.W.; Xu, L.H.; Wu, Y.Q. Construction land layout in the central urban area based on Suitability Evaluation—Take Hangzhou as an example. Resour. Environ. Yangtze River Basin 2016, 25, 904–912. [Google Scholar]
- Yu, Z.L.; Zhuang, L.; Sun, P.L.; Liang, J.S.; Zhang, W.X. Suitability evaluation and application of construction land from the perspective of sustainability. J. Geo-Inf. Sci. 2016, 18, 1360–1373. [Google Scholar]
- Kara, C.; Doratli, N. Application of GIS/AHP in siting sanitary landfill: A case study in Northern Cyprus. Waste Manag. Res. 2012, 30, 966–980. [Google Scholar] [CrossRef]
- Rabbani, G.; Madanian, S.; Daneshvar, M.R.M. Multi-criteria modeling for land suitability evaluation of the urban greenbelts in Iran. Model. Earth Syst. Environ. 2021, 7, 1291–1307. [Google Scholar]
- Liao, Y.M. Study on Spatial Pattern Characteristics and Layout Optimization of Rural Residential Areas in Karst Mountainous Areas. Ph.D. Thesis, Guizhou Normal University, Guizhou, China, 2021. [Google Scholar]
- Zhou, L.B. Post Evaluation (POE) on the Use of Relocation Villages for Poverty Alleviation in Liupanshui Yi Villages. Master Thesis, Guizhou University, Guizhou, China, 2021. [Google Scholar]
- Tzampoglou, P.; Loupasakis, C. Evaluating geological and geotechnical data for the study of land subsidence phenomena at the perimeter of the Amyntaio coalmine, Greece. Int. J. Min. Sci. Technol. 2018, 28, 601–612. [Google Scholar] [CrossRef]
- Yuan, Y.J.; Zou, X.; Shi, F.; Gao, X.; Hu, L.; Zhang, Z.Y. Study on the distribution of bird habitat suitability in Dongting Lake Basin under climate change scenarios. J. Water Ecol. 2022, 43, 56–62. [Google Scholar] [CrossRef]
- Gao, H.J.; Zhang, C.Q.; Cai, G.P.; Luo, X.Q. Land suitability evaluation of rural settlements in karst mountains based on GIS. Res. Soil Water Conserv. 2015, 22, 200–203. [Google Scholar]
- Saaty, T.L. There is no mathematical validity for using fuzzy number crunching in the analytic hierarchy process. J. Syst. Sci. Syst. Eng. 2006, 15, 457–464. [Google Scholar] [CrossRef]
- Chen, R. Ecological Suitability Evaluation of Expanded Land in Suiyang County. Ph.D. Thesis, Central South University of Forestry and Technology, Hunan, China, 2016. [Google Scholar]
- Stockman, A.K.; Beamer, D.A.; Bond, J.E. An evaluation of a GARP model as an approach to predicting the spatial distribution of non-vagile invertebrate species. Divers. Distrib. 2006, 12, 81–89. [Google Scholar]
- Liu, C.Y.; Zhang, J.F. Suitability evaluation of rural settlement land in typical counties in the upper reaches of Minjiang River Based on niche model. J. Agric. Eng. 2021, 37, 266–273. [Google Scholar]
- Steven, J.P.; Robert, P.A.; Robert, E.S. Maximum entropy modeling of species geographic distributions. Ecol. Model. 2006, 190, 231–259. [Google Scholar]
- Gao, B.; Wei, H.Y.; Guo, Y.L.; Gu, W. Applying GIS and maximum entropy model to analyze the potential geographical distribution of Abies in Qinling Mountains. Chinese. J. Ecol. 2015, 34, 843–852. [Google Scholar]
- Diaz-Rodriguez, M.; Fabregas-Valcarce, R. Evaluating the effectiveness of three spatial cluster analysis methods on Palaeolithic site location distributions in Galicia, NW Iberian Peninsula. J. Archaeol. Sci.-Rep. 2022, 41, 103323. [Google Scholar] [CrossRef]
- Li, W.M.; Li, T.S.; Wu, P. Optimization of rural settlements layout based on gravity model and weighted Voronoi map—A case study of Xiangqiao Street in Xi’an City. Agric. Resour. Zoning China 2018, 39, 77–82. [Google Scholar]
- Rinner, C.; Heppleston, A. The spatial dimensions of multi-criteria evaluation-Case study of a home buyer’s spatial decision support system. Geogr. Inf. Sci. Proc. 2006, 4197, 338–352. [Google Scholar]
- Singh, L.; Saravanan, S.; Jennifer, J.J. Application of multi-influence factor (MIF) technique for the identification of suitable sites for urban settlement in Tiruchirappalli City, Tamil Nadu, India. Asia-Pac. J. Reg. Sci. 2021, 5, 797–823. [Google Scholar] [CrossRef]
- Aburas, M.M.; Abdullah, S.H.; Ramli, M.F.; Asha’ari, Z.H. Land suitability analysis of urban growth in Seremban Malaysia, using GIS based analytical hierarchy process. Procedia Eng. 2017, 198, 1128–1136. [Google Scholar] [CrossRef]
- Wang, J.F.; Xu, C.D. Geographical detectors: Principles and prospects. Acta Geogr. Sinica 2017, 72, 116–134. [Google Scholar]
- The Central People’s Government of the People’s Republic of China, Fujian. Available online: http://www.gov.cn/guoqing/2016-11/21/content_5135519.htm (accessed on 9 April 2022).
- He, Q.; Chen, N. Morphological classification of mountains in Fujian Province Based on joint frequency domain information. Remote Sens. Inf. 2016, 31, 136–141. [Google Scholar]
- Geographic Remote Sensing Ecological Network Platform. Available online: http://www.gisrs.cn/index.html (accessed on 11 April 2022).
- China Engineering Science and Technology Knowledge Center. Available online: https://www.ckcest.cn/default/es3/detail/4004/dw_dataset/C9AB1797FF8000012C7B19ACAAD05070 (accessed on 12 April 2022).
- National Basic Geographic Information Center. Available online: https://www.webmap.cn/store.do?method=storeCgsj&storeId=2&id=120 (accessed on 17 April 2022).
- Resource and Environmental Science and Data Center. Available online: https://www.resdc.cn/ (accessed on 22 April 2022).
- Statistical Almanac of Fujian Province. Available online: https://tjj.fujian.gov.cn/tongjinianjian/dz2021/indicator.htm (accessed on 22 April 2022).
- Liu, R.Y.; Liu, N. A disaster assessment method of inundated area based on digital elevation model DEM. J. Image Graph. 2001, 6, 118–122. [Google Scholar]
- Li, C.; Wu, Y.M.; Gao, B.B.; Wu, Y.; Zheng, K.J.; Li, C. Spatial differentiation and driving force detection of rural settlements in plateau lakes—Taking the area around Erhai Lake as an example. Econ. Geogr. 2022, 42, 220–229. [Google Scholar]
- Jiao, H.; Zhou, Q.G.; Li, H.; Guo, H.L.; Ma, P.J. Study on suitability evaluation and regulation planning zoning of rural residential areas in typical low mountain and hilly areas in Southwest China. Res. Soil Water Conserv. 2015, 22, 204–209. [Google Scholar]


| A | B | C | D | E | F | G | H | I | J | K | L | M | |
|---|---|---|---|---|---|---|---|---|---|---|---|---|---|
| q value | 0.06 | 0.07 | 0.51 | 0.38 | 0.13 | 0.15 | 0.08 | 0.16 | 0.11 | 0.36 | 0.31 | 0.25 | 0.23 |
| Interaction | A | B | C | D | E | F | G | H | I | J | K | L | M |
|---|---|---|---|---|---|---|---|---|---|---|---|---|---|
| A | 0.06 | 0.13 | 0.54 | 0.47 | 0.12 | 0.10 | 0.15 | 0.12 | 0.08 | 0.40 | 0.42 | 0.36 | 0.33 |
| B | 0.13 | 0.07 | 0.55 | 0.44 | 0.14 | 0.14 | 0.23 | 0.13 | 0.09 | 0.37 | 0.39 | 0.32 | 0.34 |
| C | 0.54 | 0.55 | 0.51 | 0.72 | 0.54 | 0.55 | 0.58 | 0.52 | 0.53 | 0.67 | 0.63 | 0.67 | 0.73 |
| D | 0.47 | 0.44 | 0.72 | 0.38 | 0.41 | 0.42 | 0.46 | 0.42 | 0.39 | 0.61 | 0.59 | 0.56 | 0.56 |
| E | 0.12 | 0.14 | 0.54 | 0.41 | 0.03 | 0.13 | 0.13 | 0.09 | 0.05 | 0.36 | 0.33 | 0.27 | 0.26 |
| F | 0.10 | 0.14 | 0.55 | 0.42 | 0.13 | 0.05 | 0.17 | 0.11 | 0.08 | 0.39 | 0.37 | 0.33 | 0.31 |
| G | 0.15 | 0.23 | 0.58 | 0.46 | 0.13 | 0.17 | 0.08 | 0.13 | 0.09 | 0.40 | 0.38 | 0.36 | 0.33 |
| H | 0.12 | 0.13 | 0.52 | 0.42 | 0.09 | 0.11 | 0.13 | 0.01 | 0.04 | 0.34 | 0.33 | 0.29 | 0.26 |
| I | 0.08 | 0.09 | 0.53 | 0.39 | 0.05 | 0.08 | 0.09 | 0.04 | 0.01 | 0.33 | 0.33 | 0.26 | 0.24 |
| J | 0.40 | 0.37 | 0.67 | 0.61 | 0.36 | 0.39 | 0.40 | 0.34 | 0.33 | 0.31 | 0.57 | 0.53 | 0.54 |
| K | 0.42 | 0.39 | 0.63 | 0.59 | 0.33 | 0.37 | 0.38 | 0.33 | 0.33 | 0.57 | 0.31 | 0.54 | 0.56 |
| L | 0.36 | 0.32 | 0.67 | 0.56 | 0.27 | 0.33 | 0.36 | 0.29 | 0.26 | 0.53 | 0.54 | 0.25 | 0.51 |
| M | 0.33 | 0.34 | 0.73 | 0.56 | 0.26 | 0.31 | 0.33 | 0.26 | 0.24 | 0.54 | 0.56 | 0.51 | 0.23 |
| Middle Layers | Weight | Indicators | Weight | Standard for Grading | Value |
|---|---|---|---|---|---|
| Natural geographical indicators | 0.3391 | Flood sensitivity | 0.0262 | Highly sensitive | 3 |
| ☐ | ☐ | ☐ | Moderate sensitivity | 6 | |
| ☐ | ☐ | ☐ | Insensitive | 9 | |
| ☐ | Slop (°) | 0.0440 | <2 | 9 | |
| ☐ | ☐ | ☐ | 2~6 | 7 | |
| ☐ | ☐ | ☐ | 6~15 | 5 | |
| ☐ | ☐ | ☐ | 15~25 | 3 | |
| ☐ | ☐ | ☐ | >25 | 1 | |
| ☐ | Altitude (m) | 0.0490 | −12~194 | 9 | |
| ☐ | ☐ | ☐ | 194~431 | 7 | |
| ☐ | ☐ | ☐ | 431~665 | 5 | |
| ☐ | ☐ | ☐ | 665~950 | 3 | |
| ☐ | ☐ | ☐ | 950~2191 | 1 | |
| ☐ | Distance from river (km) | 0.0490 | <2 | 9 | |
| ☐ | ☐ | ☐ | 2~5 | 7 | |
| ☐ | ☐ | ☐ | 5~10 | 5 | |
| ☐ | ☐ | ☐ | 10~15 | 3 | |
| ☐ | ☐ | ☐ | >15 | 1 | |
| ☐ | Landslide sensitivity | 0.0294 | Extremely sensitive | 0 | |
| ☐ | ☐ | ☐ | Highly sensitive | 2 | |
| ☐ | ☐ | ☐ | Moderate sensitivity | 5 | |
| ☐ | ☐ | ☐ | Mild sensitivity | 7 | |
| ☐ | ☐ | ☐ | Insensitive | 9 | |
| Socio-economic indicators | 0.3722 | Per capita income of villages | 0.1524 | <5000 | 1 |
| ☐ | ☐ | ☐ | 5000~10,000 | 3 | |
| ☐ | ☐ | ☐ | 10,000~30,000 | 5 | |
| ☐ | ☐ | ☐ | 30,000~50,000 | 7 | |
| ☐ | ☐ | ☐ | >50,000 | 9 | |
| ☐ | Infrastructure degree (%) | 0.0912 | <50 | 1 | |
| ☐ | ☐ | ☐ | 50~60 | 3 | |
| ☐ | ☐ | ☐ | 60~70 | 5 | |
| ☐ | ☐ | ☐ | 70~80 | 7 | |
| ☐ | ☐ | ☐ | >80 | 9 | |
| ☐ | Distance from County Center (km) | 0.0332 | <10 | 9 | |
| ☐ | ☐ | ☐ | 10~20 | 7 | |
| ☐ | ☐ | ☐ | 20~30 | 5 | |
| ☐ | ☐ | ☐ | 30~40 | 3 | |
| ☐ | ☐ | ☐ | >40 | 1 | |
| ☐ | Distance from road (km) | 0.0351 | <5 | 9 | |
| ☐ | ☐ | ☐ | 5~10 | 7 | |
| ☐ | ☐ | ☐ | 10~20 | 5 | |
| ☐ | ☐ | ☐ | 20~30 | 3 | |
| ☐ | ☐ | ☐ | >30 | 1 | |
| cultural life | 0.2887 | Minority population | 0.1658 | <500 | 1 |
| ☐ | ☐ | ☐ | 500~1000 | 3 | |
| ☐ | ☐ | ☐ | 1000~5000 | 5 | |
| ☐ | ☐ | ☐ | 5000~10,000 | 7 | |
| ☐ | ☐ | ☐ | >10,000 | 9 | |
| ☐ | Intangible cultural heritage | 0.1413 | <2 | 1 | |
| ☐ | ☐ | ☐ | 3~5 | 3 | |
| ☐ | ☐ | ☐ | 5~8 | 5 | |
| ☐ | ☐ | ☐ | 8~10 | 7 | |
| ☐ | ☐ | ☐ | >10 | 9 | |
| ☐ | Material cultural heritage | 0.0829 | <5 | 1 | |
| ☐ | ☐ | ☐ | 5~10 | 3 | |
| ☐ | ☐ | ☐ | 10~15 | 5 | |
| ☐ | ☐ | ☐ | 15~20 | 7 | |
| ☐ | ☐ | ☐ | >20 | 9 | |
| ☐ | Per capita cultivated land area (m2) | 0.1004 | 133 | 1 | |
| ☐ | ☐ | ☐ | 333 | 3 | |
| ☐ | ☐ | ☐ | 666 | 5 | |
| ☐ | ☐ | ☐ | 666~1332 | 7 | |
| ☐ | ☐ | ☐ | >1300 m2 | 9 |
| Grade | Threshold Division | Suitability Classification |
|---|---|---|
| I | 6.8392–8.3835 | Most suitable |
| II | 5.0695–6.8392 | Generally suitable |
| III | 3.4753–5.0695 | Basically suitable |
| IV | 2.2846–3.4753 | Unsuitable |
| Grade | Area Percentage | Number of Villages | Percentage of Quantity |
|---|---|---|---|
| I | 21.05% | 134 | 24% |
| II | 33.59% | 292 | 51% |
| III | 28.20% | 77 | 14% |
| IV | 17.16% | 64 | 11% |
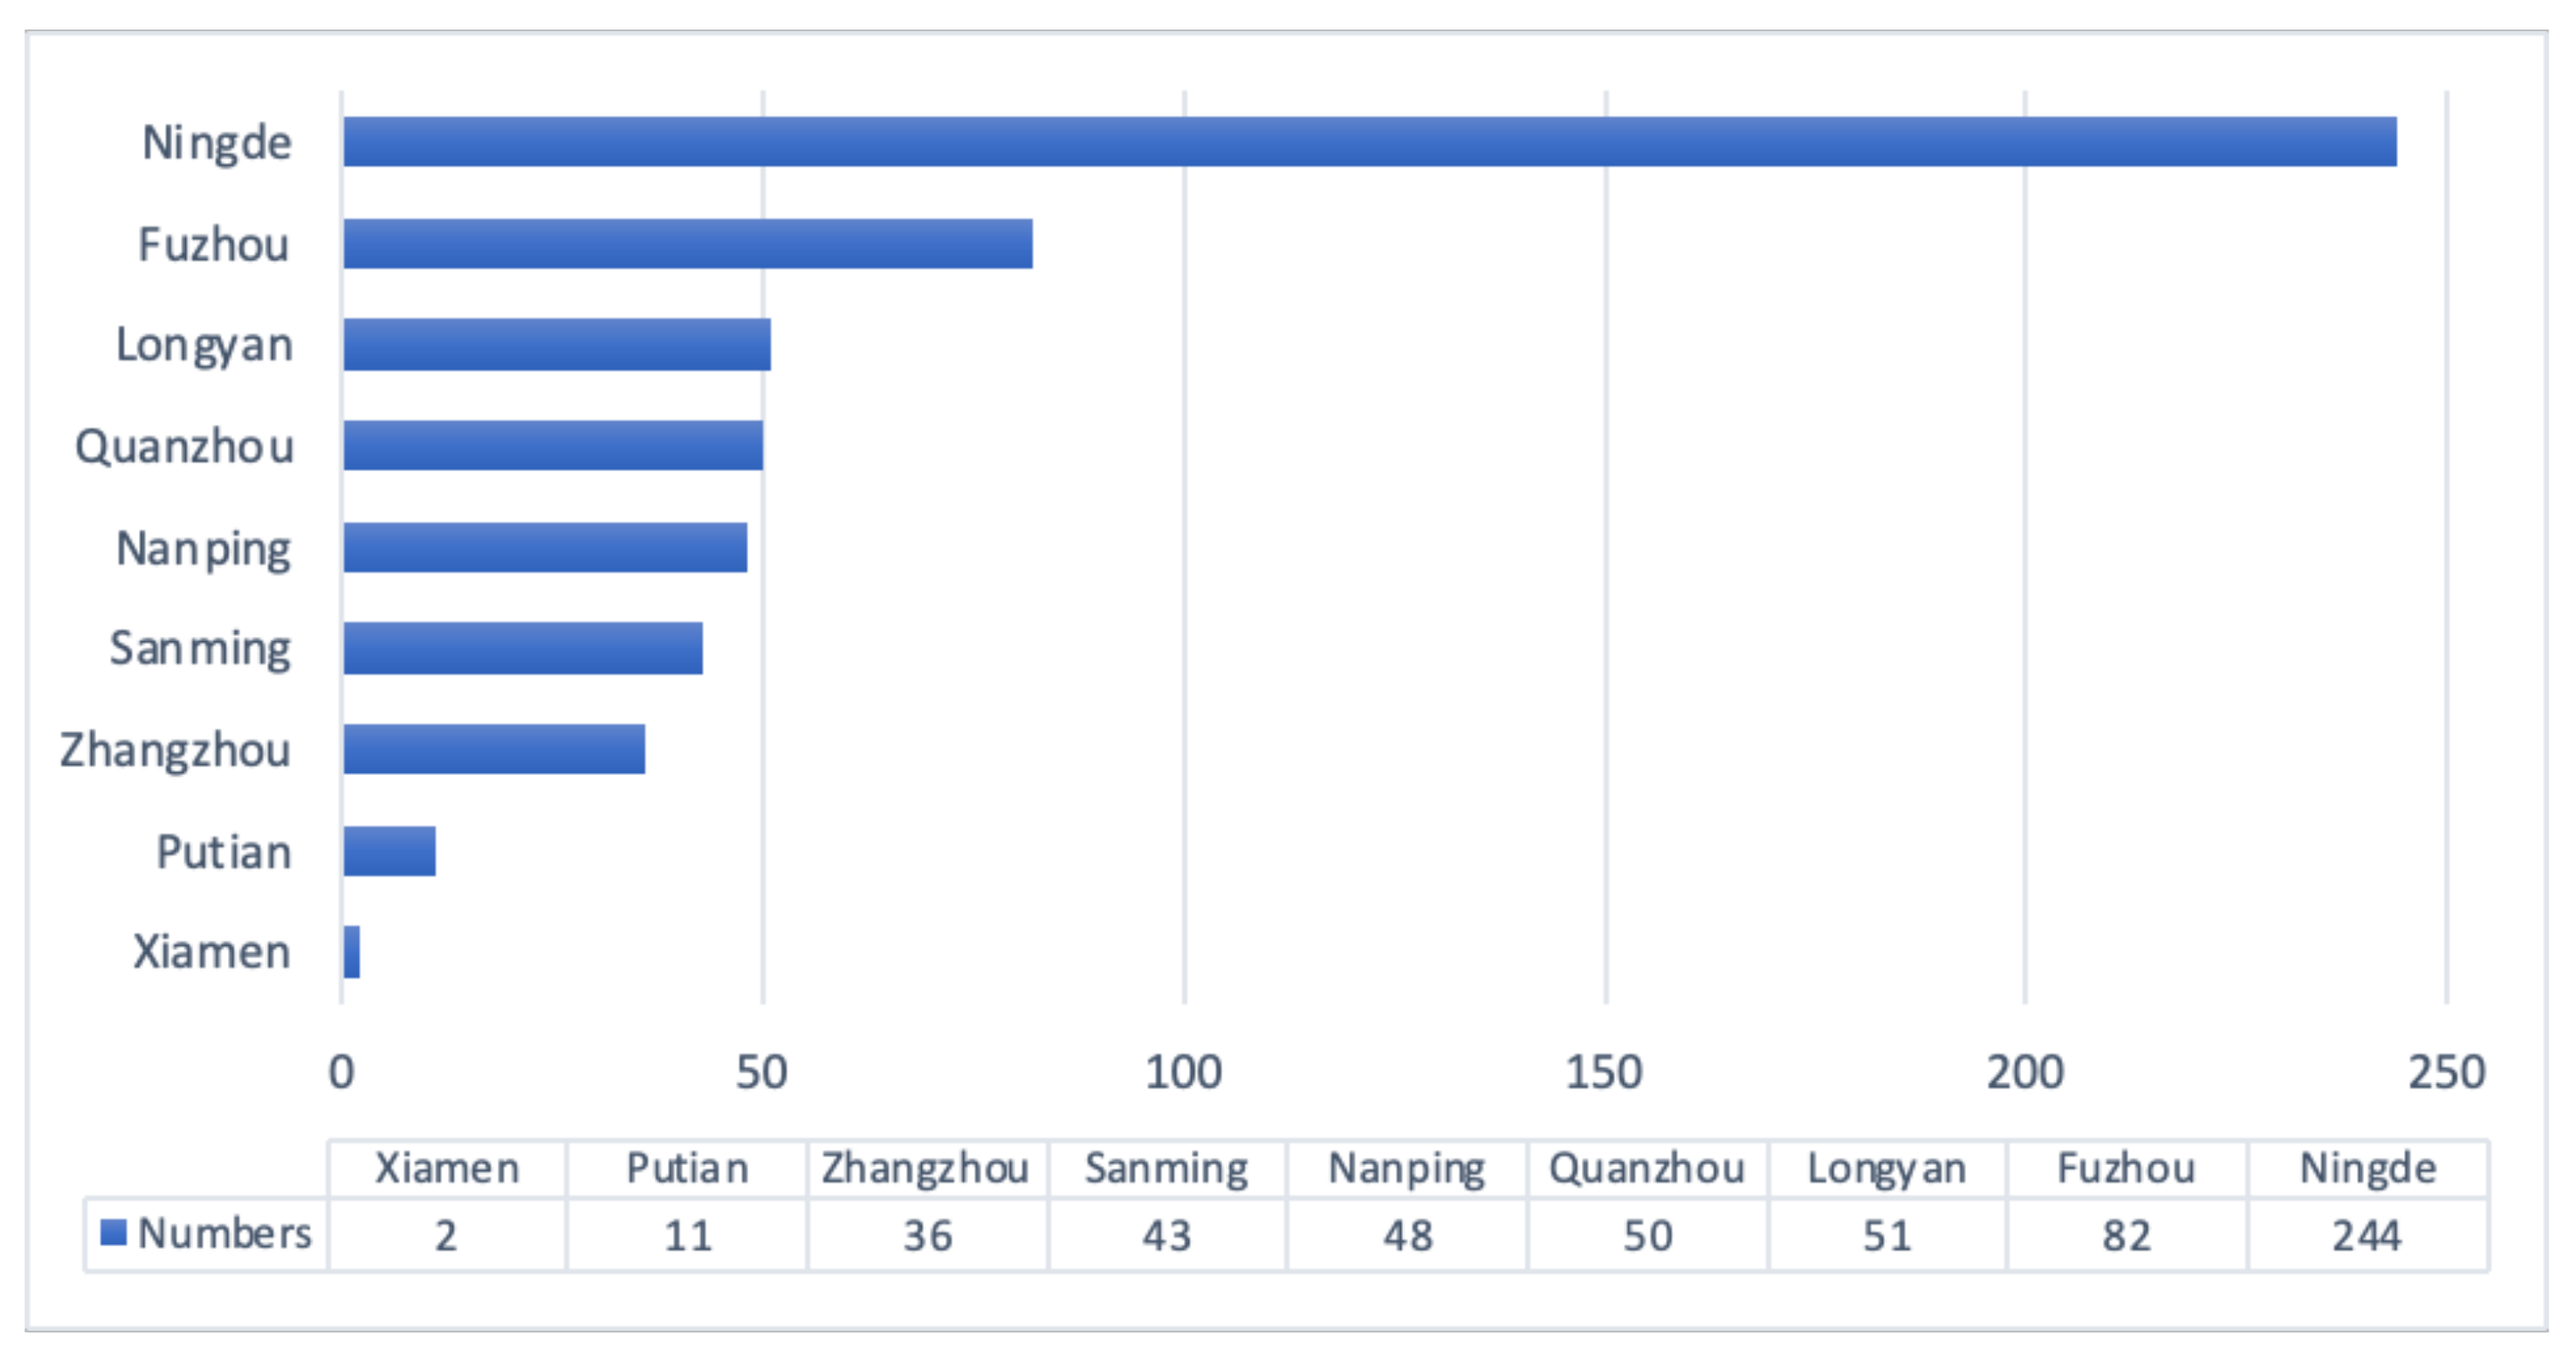
| City | Number of Ethnic Minority Villages | Percentage | Percentage | |||
|---|---|---|---|---|---|---|
| Grade I | Grade II | Grade III | Grade IV | |||
| Fuzhou | 82 | 14.46% | 3.20% | 9.42% | 1.84% | 0.00% |
| Longyan | 51 | 8.99% | 0.00% | 4.05% | 4.94% | 0.00% |
| Nanping | 48 | 8.47% | 0.00% | 1.85% | 2.49% | 4.13% |
| Ningde | 244 | 43.03% | 18.25% | 20.87% | 1.67% | 2.24% |
| Putian | 11 | 1.94% | 0.00% | 1.75% | 0.19% | 0.00% |
| Quanzhou | 50 | 8.82% | 6.56% | 1.94% | 0.33% | 0.00% |
| Sanming | 43 | 7.58% | 0.00% | 2.11% | 2.95% | 2.51% |
| Xiamen | 2 | 0.35% | 0.35% | 0.00% | 0.00% | 0.00% |
| Zhangzhou | 36 | 6.35% | 0.92% | 4.23% | 0.62% | 0.58% |
Publisher’s Note: MDPI stays neutral with regard to jurisdictional claims in published maps and institutional affiliations. |
© 2022 by the authors. Licensee MDPI, Basel, Switzerland. This article is an open access article distributed under the terms and conditions of the Creative Commons Attribution (CC BY) license (https://creativecommons.org/licenses/by/4.0/).
Share and Cite
Xu, X.; Genovese, P.V. Assessment on the Spatial Distribution Suitability of Ethnic Minority Villages in Fujian Province Based on GeoDetector and AHP Method. Land 2022, 11, 1486. https://doi.org/10.3390/land11091486
Xu X, Genovese PV. Assessment on the Spatial Distribution Suitability of Ethnic Minority Villages in Fujian Province Based on GeoDetector and AHP Method. Land. 2022; 11(9):1486. https://doi.org/10.3390/land11091486
Chicago/Turabian StyleXu, Xiang, and Paolo Vincenzo Genovese. 2022. "Assessment on the Spatial Distribution Suitability of Ethnic Minority Villages in Fujian Province Based on GeoDetector and AHP Method" Land 11, no. 9: 1486. https://doi.org/10.3390/land11091486
APA StyleXu, X., & Genovese, P. V. (2022). Assessment on the Spatial Distribution Suitability of Ethnic Minority Villages in Fujian Province Based on GeoDetector and AHP Method. Land, 11(9), 1486. https://doi.org/10.3390/land11091486