Article

Reducing Nitrogen Fertilization in Olive Growing by the Use of Natural Chabazite-Zeolitite as Soil Improver

1
Department of Physics and Earth Science, University of Ferrara, Via Giuseppe Saragat 1, 44122 Ferrara, Italy
2
Department of Chemical, Pharmaceutical and Agricultural Sciences, Via Luigi Borsari 46, 44121 Ferrara, Italy
3
Institute of Bioeconomy, National Research Council, Via Piero Gobetti 101, 40129 Bologna, Italy
*
Author to whom correspondence should be addressed.
Land 2022, 11(9), 1471; https://doi.org/10.3390/land11091471
Submission received: 21 July 2022 / Revised: 30 August 2022 / Accepted: 31 August 2022 / Published: 3 September 2022
(This article belongs to the Special Issue Soil Management for Sustainable Agriculture and Ecosystem Services)

Abstract

:
In order to improve the sustainability and productivity of modern agriculture, it is mandatory to enhance the efficiency of Nitrogen (N) fertilizers with low-impact and natural strategies, without impairing crop yield and plant health. To achieve these goals, the ZeOliva project conducted an experiment using a zeolite-rich tuff as a soil amendment to improve the efficiency of the N fertilizers and allow a reduction of their inputs. The results of three years of experimentation performed in three different fields in the Emilia-Romagna region (Italy) are presented. In each field, young olive trees grown on zeolite-amended soil (−50% of N-input) were compared to trees grown on unamended soil (100% N-input). Soils and leaves were collected three times every year in each area and analyzed to monitor the efficiency of the zeolite treatment compared to the control. Vegetative measurements were performed along with analysis of pH, Soil Organic Matter and soluble anions in soil samples, whereas total C and N, C discrimination factor and N isotopic signature were investigated for both soils and leaves. Besides some fluctuations of nitrogen species due to the sampling time (Pre-Fert, Post-Fertilization and Harvest), the Total Nitrogen of leaves did not highlight any difference between treatments, which suggest that plant N uptake was not affected by lower N input in the zeolite treatment. Results, including vegetative measurements, showed no significant differences between the two treatments in all the observed variables, although the control received twice the N-input from fertilization. Based on these results, it is proposed that zeolite minerals increased the N retention time in the soil, allowing a better exploitation by plants which led to the same N uptake of the control notwithstanding the reduction in the N inputs. The use of zeolite-rich tuff in olive growing thus allows a reduction in the amount of fertilizer by up to 50% and improves the N use efficiency with many environmental and economic benefits.

1. Introduction

The low Fertilizer Use Efficiency (FUE) is one of the main causes of the altered equilibrium of agro-ecosystems [1] and it is responsible for relevant economic losses for farmers [2,3]. The role of N-based fertilizers is to provide an adequate amount of N to the plants and grant a good yield. However, after the addition of fertilizers to the soil, N is generally not efficiently uptaken by the plant, but it is lost in the surrounding environment through several pathways, causing the degradation of the soil, water and atmospheric compartments [4,5]. As pointed out by Drechsel et al. (2015) and Chien et al. (2016) [2,6], the apparent recovery efficiency (RE) of N by crops is lower than 55%. For this reason, to guarantee a crop yield able to sustain the future demands in terms of food for the population, there is an urgent need to: (1) improve the efficiency of agricultural practices, (2) reduce the N losses in the environment as harmful greenhouse gasses or leacheates, and (3) reduce the use of N based fertilizers [7,8,9,10]. Moreover, reducing the amount of fertilizers, especially those produced by synthetic processes such as urea [11], represents a great saving in terms of energy and exploitation of non-renewable resources. Improving FUE would also have great value for organic farming, which is known to have a limited set of products with low-N content available for fertilization purposes. The reduction of chemical fertilizers and pesticides is one of the biggest issues on which the EU council (Green Deal plan) is working. New strategies are being studied to decrease, by 2030, the amount of soil for crops, increase the biodiversity, grow up organic farming by +25% and preserve soil, water and human health. Bremmer et al. (2021) [12] reported that if the Green Deal objectives are not reached, the future scenario will be characterized by lower production, price increases, fewer European exports and more imports of agricultural products from outside Europe.
Thereby, the development of eco-friendly practices to reduce the use of fertilizers while improving their efficiency is necessary to increase the production in terms of quality and quantity and to guarantee human and environmental health, accordingly to the UE directions (Water Framework Directive 2000/60/CE, Directive 2009/128/CE for the pesticide use and Nitrates Directive 91/676/EEC). To reduce the leaching losses and increase the efficient use of the N-fertilizers, the N retention in the soil represents the key to limit the amount of N lost in the environment by giving “more time” to the plants to exploit the N reservoir.
Zeolite minerals are aluminosilicate with an open 3D structure formed by linked tetrahedra of [SiO4]4− and [AlO4]5− (the framework) and open cavities in the form of channels and cages, which are generally occupied by weakly bounded exchangeable cations and H2O molecules. These highly reactive minerals have unique properties such as high cation exchange capacity (CEC), reversible dehydration and molecular sieve, which makes them very useful for many purposes, including agriculture [10,13,14,15,16]. Natural zeolites can be constituents of volcanic tuffs [17], and, from a geological point of view, a rock can be defined as “zeolitite” when it is constituted by more than 50% of zeolite minerals. When used as a soil amendment, zeolitites are useful for improving the capacity of the soil to retain nutrients and water, improving plant growth [18,19,20,21,22,23,24]. With this method, plants can uptake nitrogen more efficiently and the nitrogen losses in the surrounding environment can be significantly reduced [25,26,27,28]. In this context, their use as an inorganic amendment is becoming popular in many crops, such as maize, apple trees, sorghum, bean, aloe vera, corn and soy to cite some examples [26,29,30,31,32,33,34,35,36,37].
Many works have been conducted about nitrogen management in olive growing and its effects on plant growth [38,39,40,41,42], although only a few of them deal with zeolitite application [19,43]. Excessive dosing of mineral fertilizers is often observed as claimed by Fernández-Escobar (2011) [42] who reported that up to 200 kg-N/ha can be applied to adult olive trees. This quantity can satisfy their N demand for years, thus N fertilizers reduction in olive growing is an issue that needs to be deeply investigated.
This work aims at testing the use of zeolitite in olive-growing as a soil amendment for granting lower inputs of N-based fertilizers. It is expected that the zeolite minerals may influence the N dynamics in the soil, promoting a prolonged permanence of this nutrient and reducing the losses in the surrounding environment. This should be reflected in a more efficient uptake by plants and therefore in the possibility to significantly reduce the N inputs while maintaining crop quality and yield.
In this framework, the results of three years of experimentation in three different experimental sites are presented. An Italian chabazite-rich zeolitite was used as a soil amendment in olive growing to reduce the fertilizer N input by 50% with respect to common practices. During the experimentation, vegetative measurements were performed, and samples of soil and leaves were collected three times every year in order to measure a series of chemical parameters (including soil basic parameters, inorganic anions, nitrogen speciation and N-C stable isotopes), to account for differences between treatments and to evaluate the efficiency of this practice.

2. Materials and Methods

2.1. Zeolitite

The zeolitite (NZ) used in this experiment is a volcanic tuff quarried in Sorano (42°41′20.65″ N; 11°44′26.29″ E, Grosseto, Italy). This specific zeolitite has been widely studied in open-field and laboratory tests [26,31,44,45,46]. The NZ was composed of nearly 70% of zeolite minerals, mainly K-rich chabazite, which gives this NZ a very high CEC (Table 1). The NZ was employed in a granular form, with a particle size ranging between 3 and 6 mm. The main characteristics of the NZ are reported in Table 1.

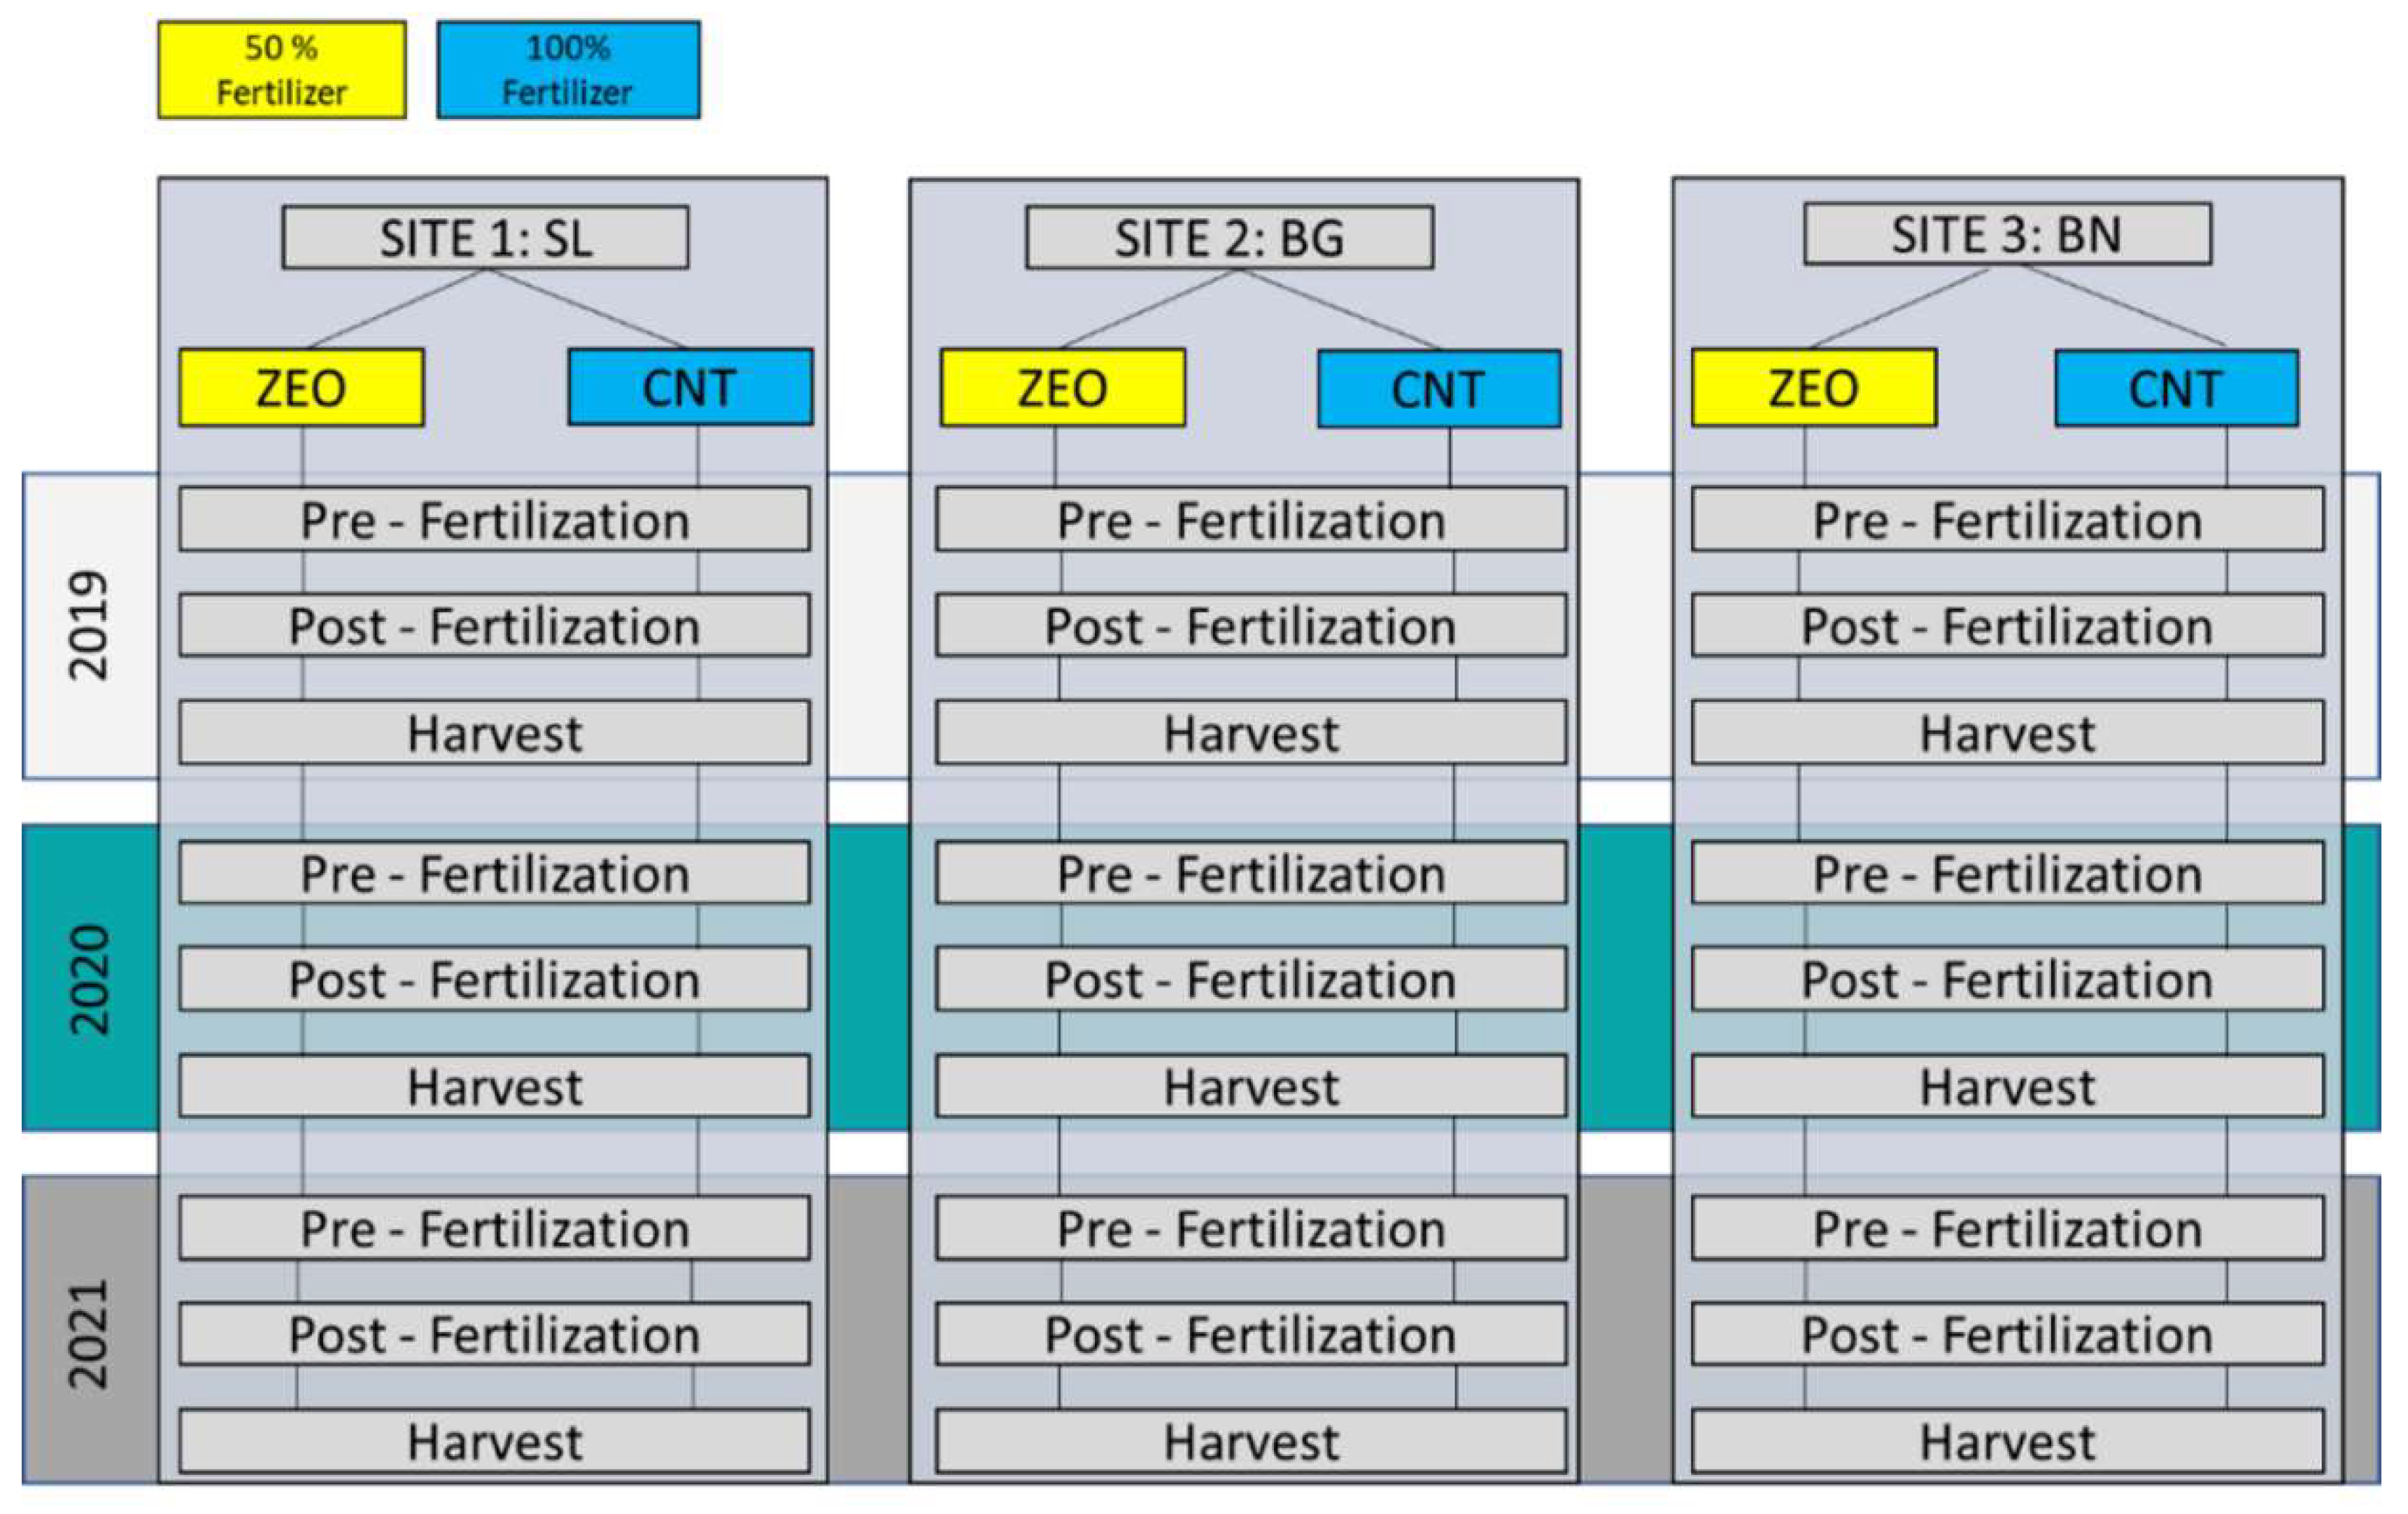
2.2. Experimental Set-Up

To evaluate the effects of the NZ in increasing the efficiency of fertilizers and allowing a reduction in fertilizer input, two treatments were compared in 5-year old olive trees:
(1)
CNT: 100% fertilizer N input and unamended soil (common practice);
(2)
ZEO: 50% fertilizer N input and addition of natural zeolitite as soil amendment (500 g added to each plant at planting phase in 2016–2017 at a depth of 30–40 cm).
The fertilization reduction was performed according to the fertilization plan adopted at each field by the owner company. Different fertilizers were used in each field as well as slightly different amounts (see detailed description for each site). The experimentation started in February 2019. The monitoring lasted three years and was replicated in three different experimental fields located in various provinces of the Emilia-Romagna region, suited to olive growing (Figure 1).
At each site, three olive trees were selected randomly per each treatment (ZEO and CNT) to serve as replicates. Soil and leaf samples were collected three times each year (2019, 2020 and 2021): 1st before the fertilization (Pre-Fert) during the vegetative rest, 2nd after the fertilization (Post-Fert) during the vegetative recovery and 3rd at the olive harvest (Harvest) at each site (Figure 2). Soil samples were collected from the 0–30 cm soil layer and about 10 cm from the plant stem with an Eijkelkamp (Ø 30 mm × 500 mm) auger. Three subsamples were collected for each tree and mixed to form a single representative composite sample. For each tree, more than 20 leaves were randomly collected at each sampling. The total number of samples processed every year was 108 (considering 2 treatments, 3 experimental sites, 3 time points, resulting in 54 soil and 54 leaf samples); over the 3 years, a total of 324 samples was processed.

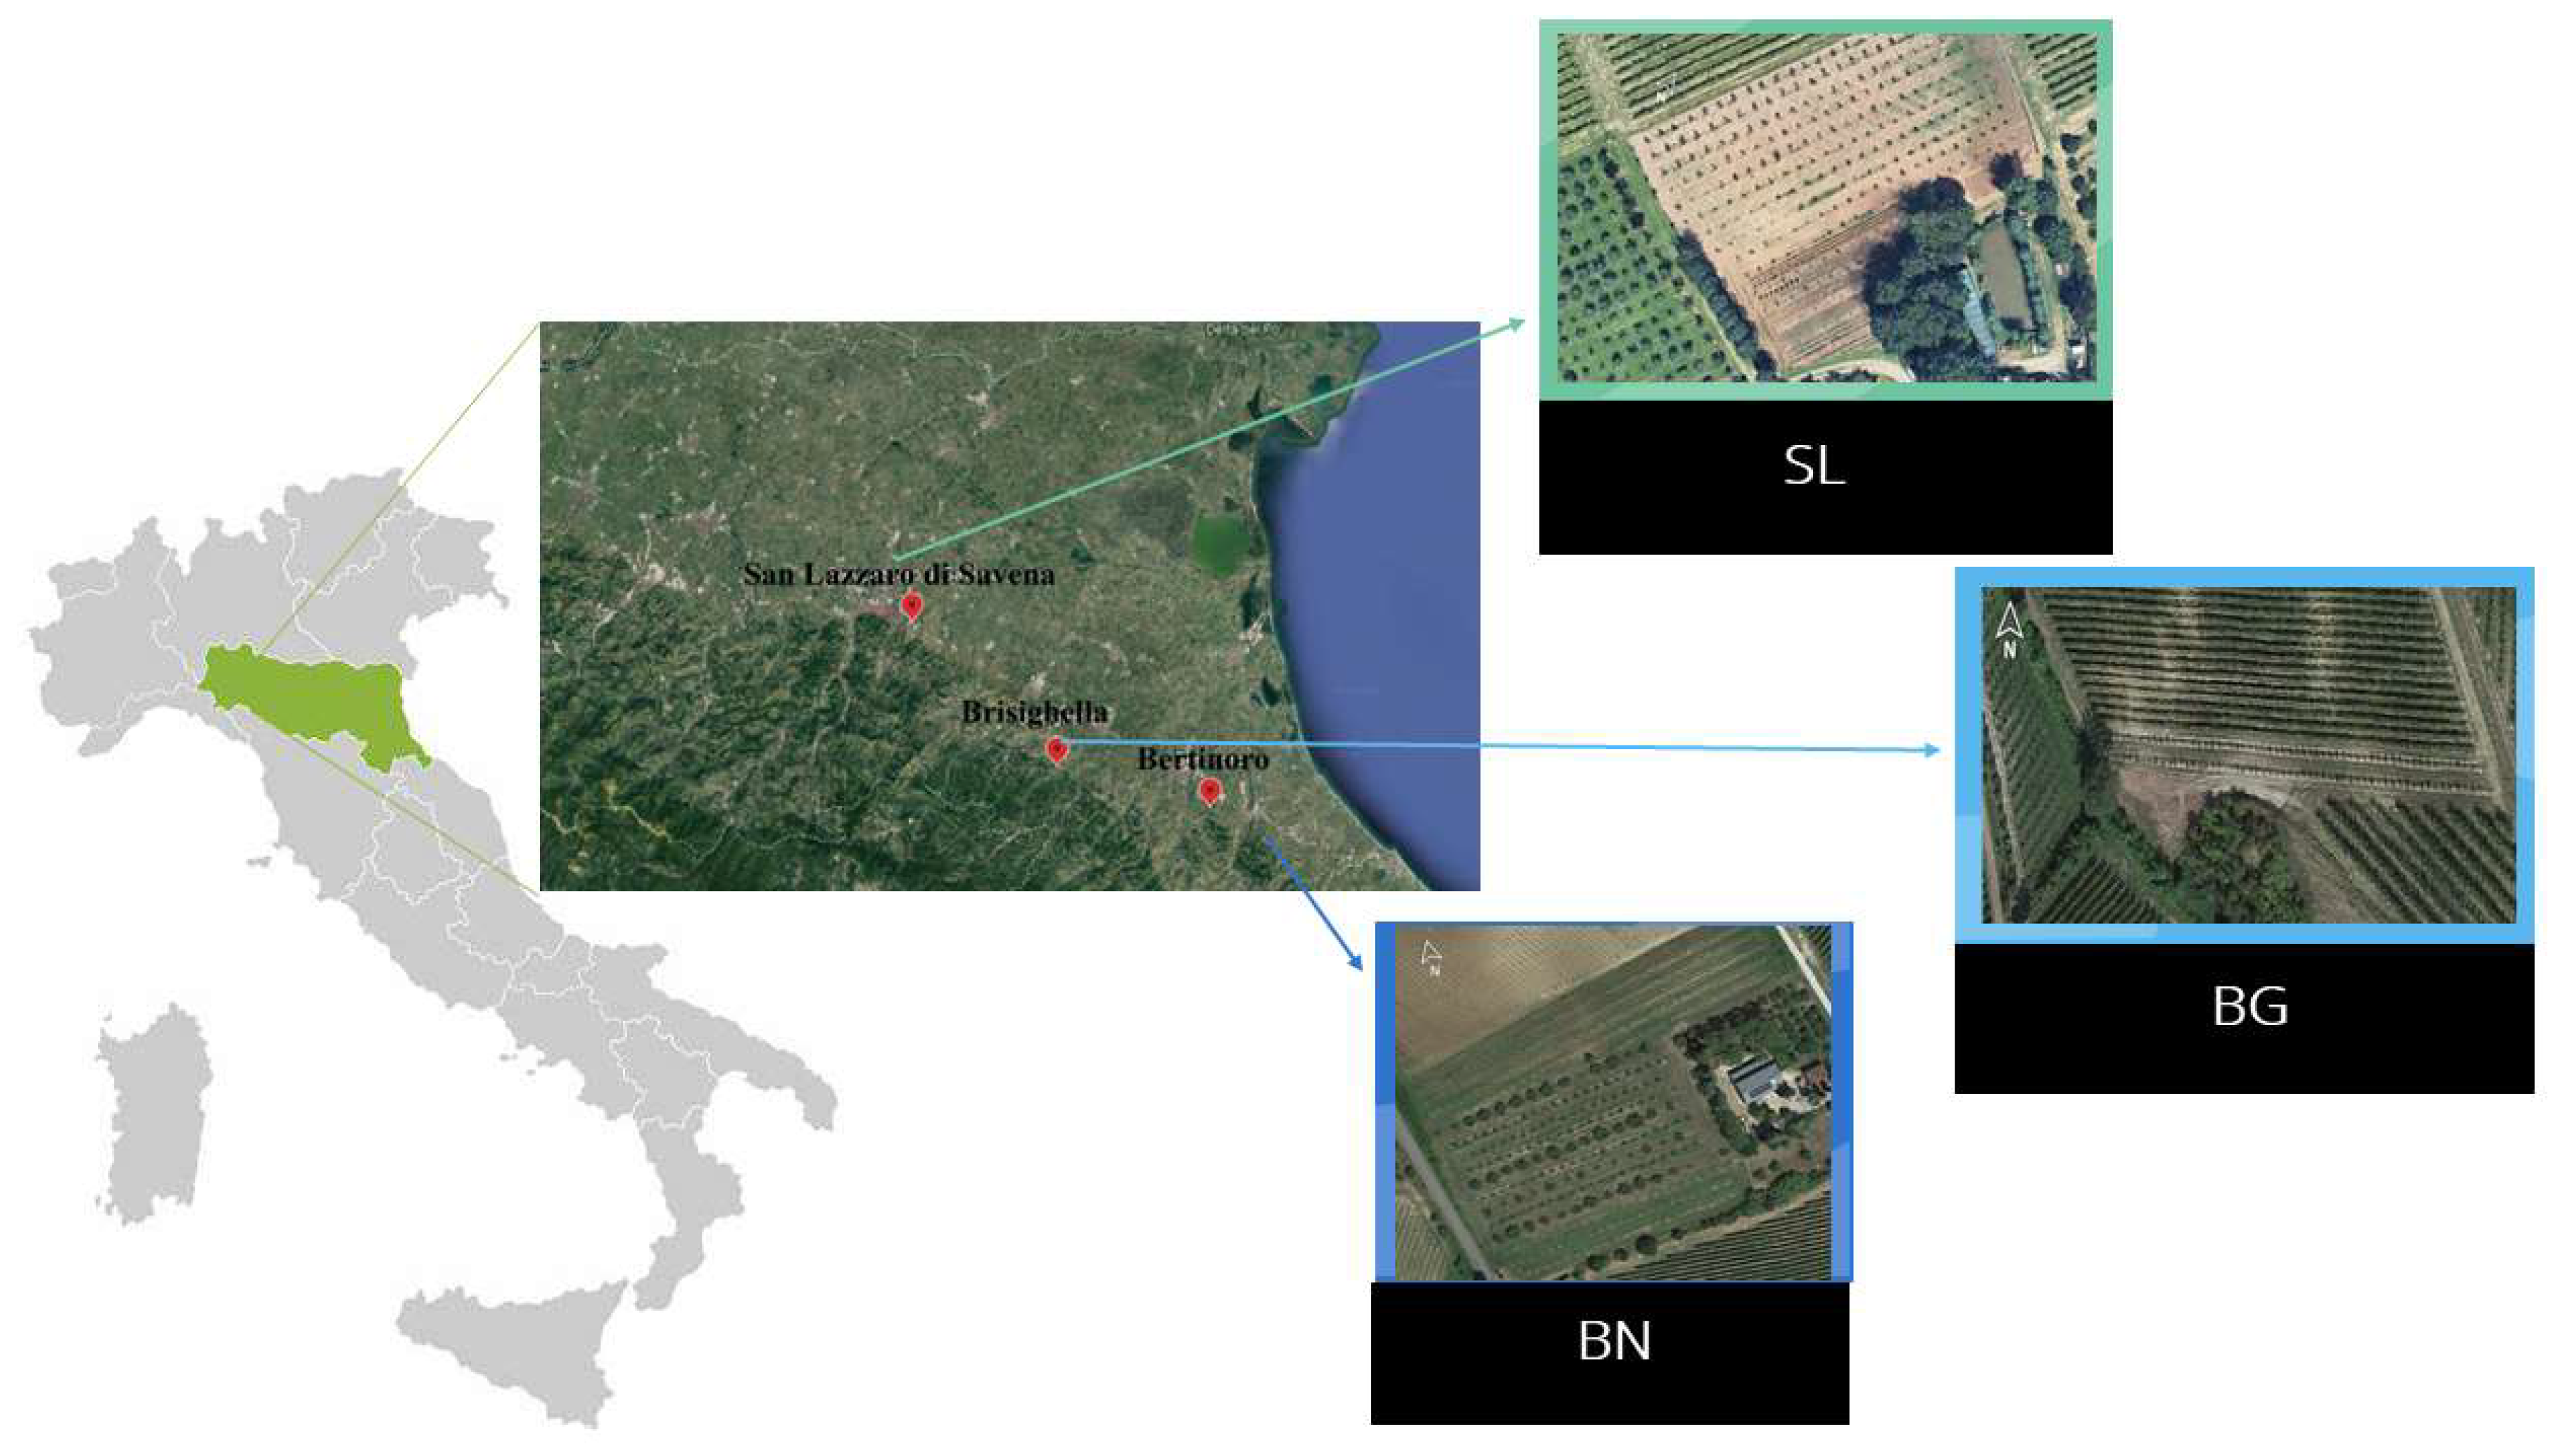
2.2.1. Site 1: San Lazzaro di Savena (SL)

The “SL” experimental field is located within the Bologna province and belongs to the “Azienda Agricola Bonazza” (organic regime). According to the soil map of the Emilia Romagna Region (GeoViewer—Geoportale) [48], the soil belongs to the unit CDV1 that is mainly represented by Hypocalcic Vertic Calcisol soils according to the World Reference Base for Soil Resources (2022) [49,50]. The orchard consists of 6 rows of olive trees: 3 rows of Cv Montecapra, Montebudello and Farneto whose soil was treated with zeolitite before planting (ZEO) and 3 rows of the same Cv whose soil was left untreated (CNT). Then, 500 g of NZ were added to the ZEO treatment at transplanting (in March 2017) assuring contact with plant roots. Since 2019, organic fertilization has been halved (50% of fertilizer/year) only in the zeolite thesis (ZEO), whereas 100% of fertilizer was applied in the CNT.
In 2019, the fertilization was completed with an NP organic fertilizer (Phoenix NP, N 6%, C 2%) followed by a manure application in June for a global input of approximately 40 kg N/ha which corresponds to 118 g of N per tree in the CNT. Half of these dosages were used in the ZEO treatment.
In May 2020, Biouniversal fertilizer (N 11% and C 40%) was applied at a dosage of 37 kg N/ha in the CNT, corresponding to 55 g of N per tree, whereas half of the dosage was applied in the ZEO treatment.
In March 2021, Agriazoto11 (N 11% and C 39%) was applied in the same quantity as 2020. The olive grove was rainfed. The mean temperature for the overall period (2019–2021) was 15.3 °C and precipitation was approximately 635 mm, with the maximum rainfall recorded in 2019 (866 mm) and 570 mm and 468 mm for 2020 and 2021, respectively [51,52,53]. Three plants per treatment were randomly selected for soil and leaf sampling.

2.2.2. Site 2: Brisighella (BG)

The “BG” experimental field is located within the Ravenna province and belongs to “Azienda Agricola Giorgia”. BG soil belongs to the cartographic unit BAN3/SOG according to the Emilia Romagna Region soil map that is mainly represented by Haplic Regosols (World Reference Base for Soil Resources (2022)) [49,50]. The olive grove consists of two olive rows of Cv Nostrana di Brisighella and three plants of both CNT and three ZEO treatments were selected for the sampling of soils and leaves. As in the SL area, 500 g of zeolitite per olive tree were added to the soil of the northern row (in May 2016) to create the ZEO treatment. Since the transplant, chemical fertilization has been halved (50% of fertilizer/year) in the ZEO treatment, whereas CNT received 100% of fertilizer.
In March 2019, the fertilization was performed using an organic-mineral fertilizer (Cosmo N 13%) using 100 kg N/ha in the CNT which corresponds to 185 g of N per tree and half of the dosage in the ZEO treatment. In June 2020, 50 kg N/ha of NH4NO3 (N, 34%) were applied to the CNT corresponding to 93 g of N per tree while half of the dosage was applied in the ZEO treatment. In March 2021, 37 kg N/ha of Urea (N, 46%) per tree were used in the CNT (corresponding to 69 g of N per tree) while half of the dosage was applied in the ZEO treatment. The orchard was irrigated with no differences between CNT and ZEO. The BG site showed the highest precipitation in 2019 (1072 mm), whereas during 2020 and 2021, precipitations were between 600 and 650 mm. The average temperature was 13.7 °C (2019–2021) but in July 2020 and August 2021, peaks of 40 °C were reached, surpassing the average temperature for that period in the last decade [51,52,53].

2.2.3. Site 3: Bertinoro (BN)

The “BN” experimental field is located within the Forlì-Cesena province and belongs to the “Azienda Agricola Tenute Unite”. The soil belongs to the cartographic unit DEM/BAN3/DOG0 that is mainly represented by Haplic Cambisol according to the World Reference Base for Soil Resources (2022) [49,50]. The orchard is made up of different olive cultivars among which Colombina, Correggiolo Pennita and Capolga di Romagna were chosen to conduct the experiment. The set-up was similar to SL and BG sites: three plants were selected for CNT and three for ZEO treatments for soil and leaf sampling; in November 2016 the soil was amended with 500 g of zeolitite (ZEO treatment).
The BN site was managed with a considerably lower N input with respect to the other 2 sites. In 2019, Dermazoto (N 11% o, C 80%) was applied in March. The second fertilization was completed in June 2019 under the same conditions for a total of 7.5 kg N/ha (corresponding to 11 g per tree) while half of the dosage was used in the ZEO treatment.
The same fertilizer was applied also in May 2020 and March 2021, respectively at dosages of 5.6 and 6.7 kg N/ha, corresponding to 16.5 g and 19.8 g of N per tree, whereas half of the dosage was used in the ZEO treatment. The orchard was rainfed. BN recorded a mean temperature of 14.6 °C, aligned with the average temperature of the previous years. The mean precipitation for 2019–2021 was 595 mm, with the highest values recorded in 2019 (823 mm) and slightly lower than 500 mm in 2020 and 2021 [51,52,53].

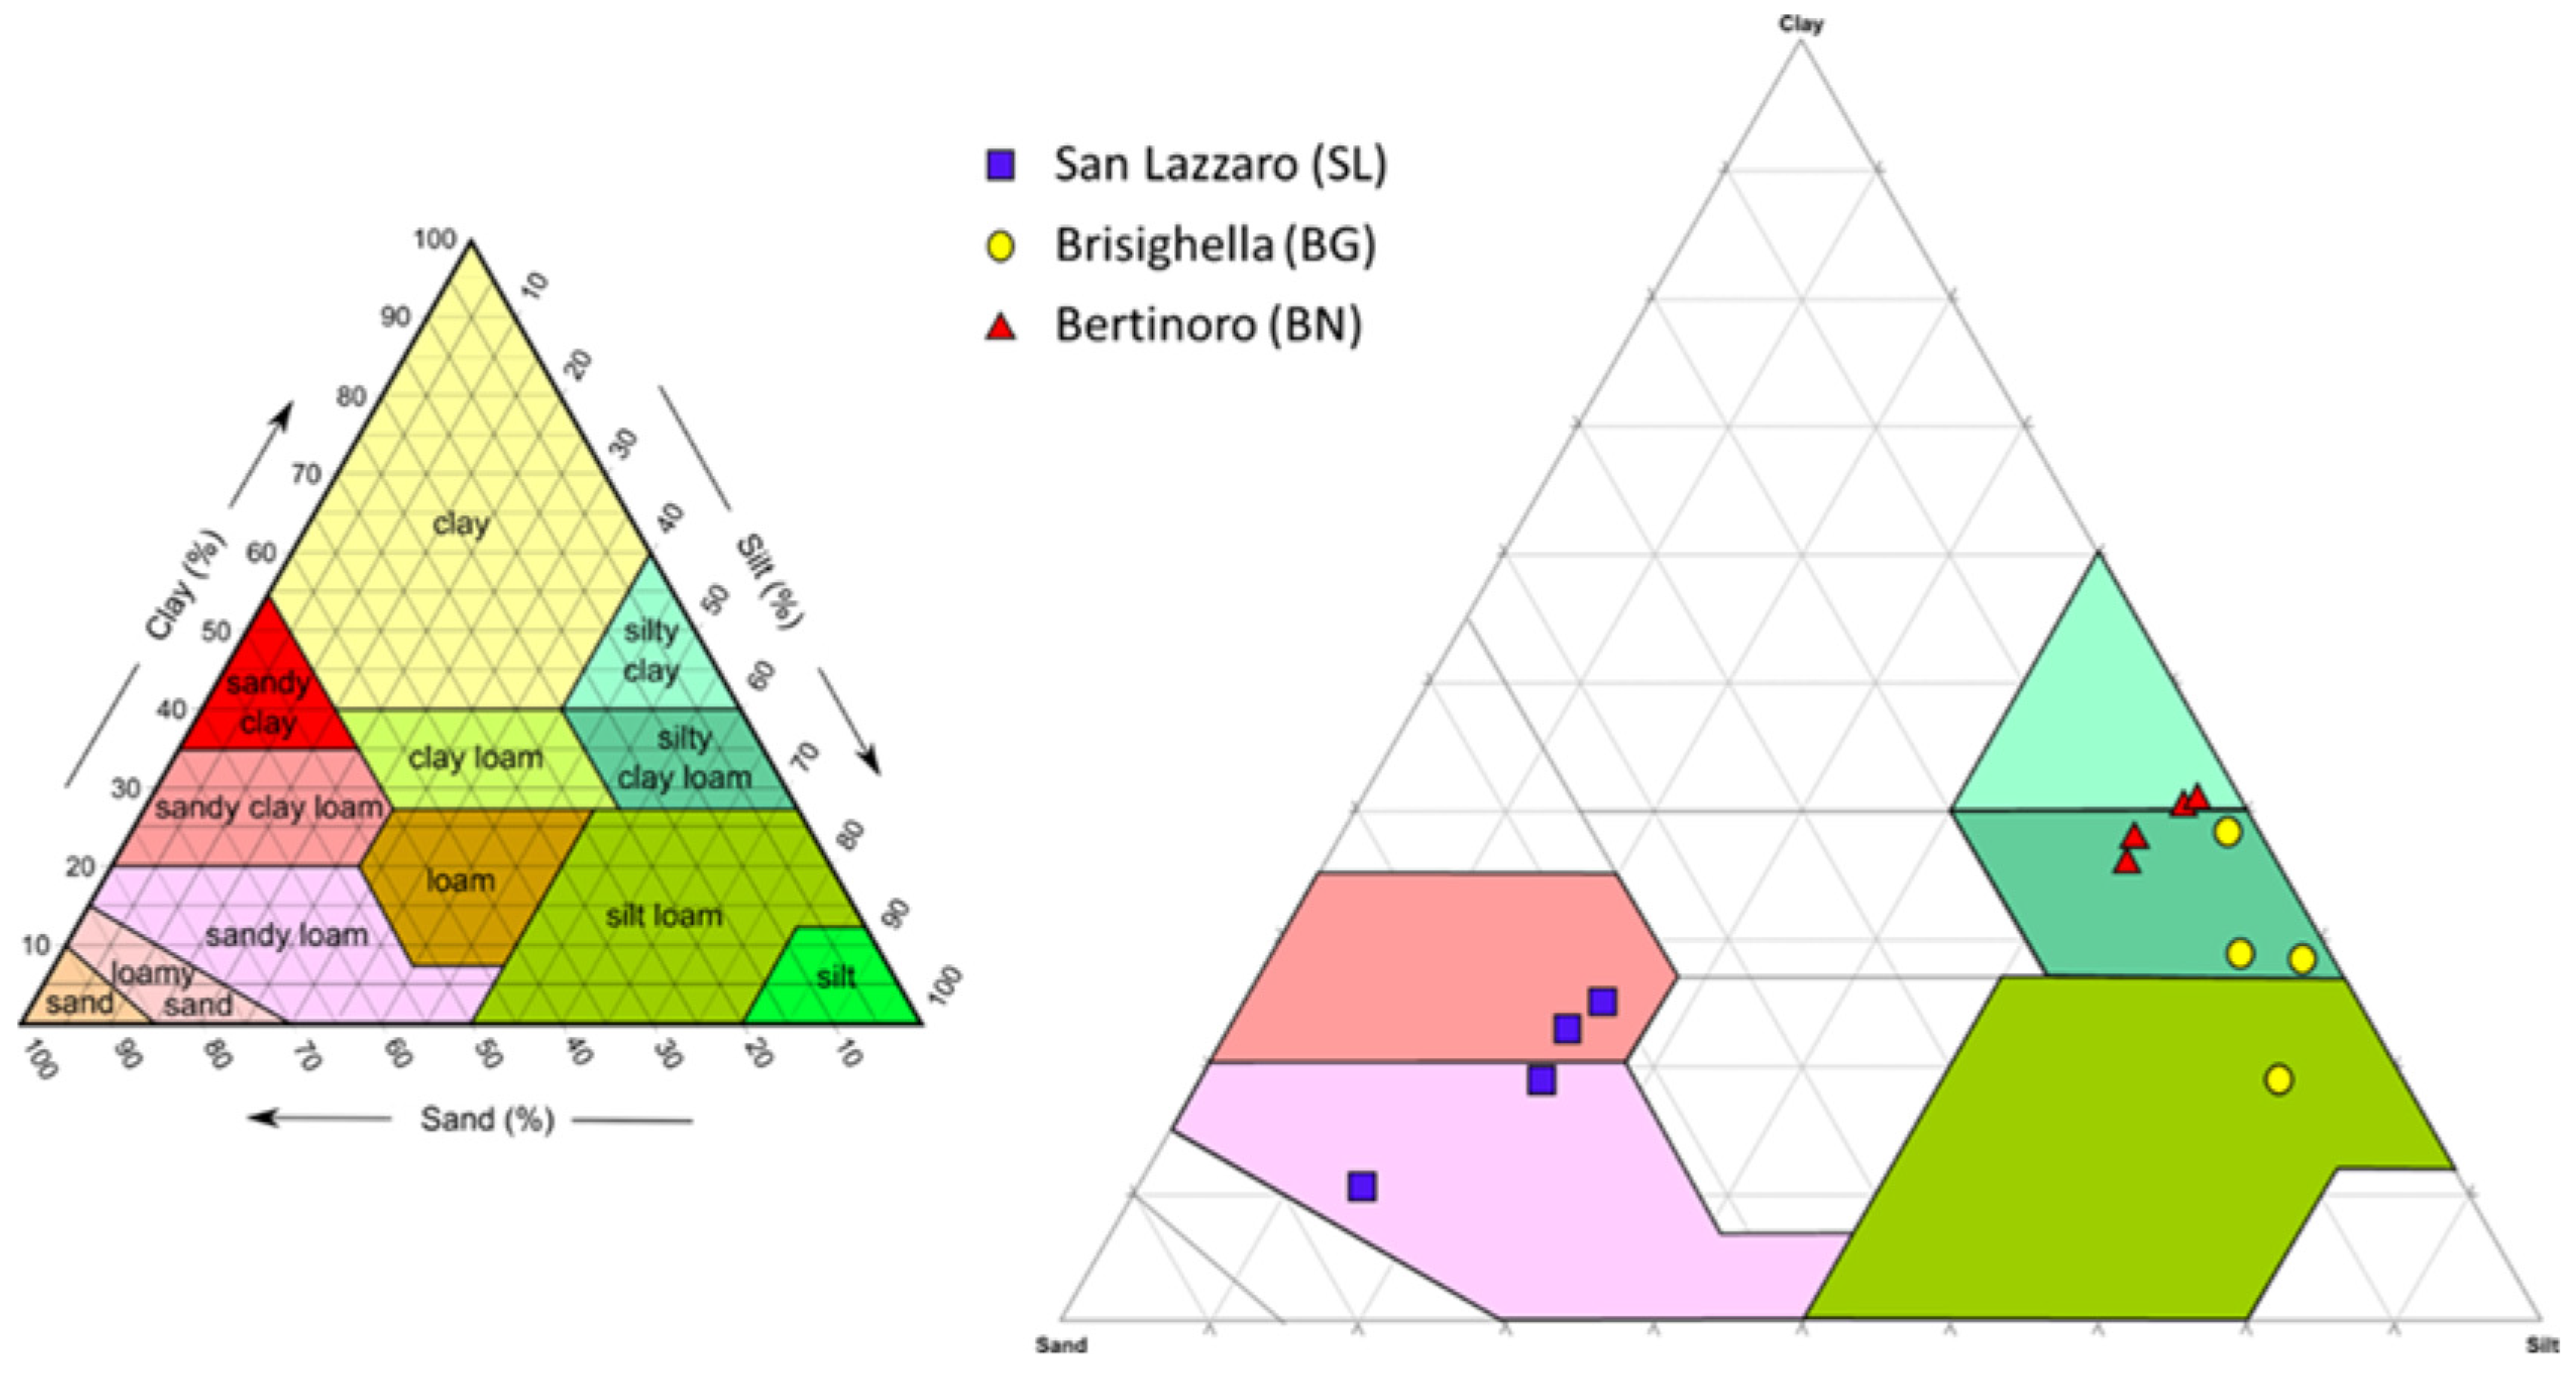
2.3. Textural Analysis

Particle size analyses of four samples per area were conducted to characterize the soil texture. Samples were manually divided into quarters and opposite quarters were chosen for the analyses. To remove the organic matter, soils were treated with H2O2 and left to settle for 24 h. The sandy fraction was separated from the silty-loam fraction by a 63 µm sieving. The coarser fraction was dried at 105 °C for 24 h and weighted while the finest fraction was quantified with an X-ray sedigraph (Micromeritics 5100) at standard conditions, a dimensional range from 0.0884 mm to 0.00049 mm. A standard density value of 2.7 g/cm3. 0.5 L of Sodium Esamexaphosphate with a low concentration (0.5%) was added to the finest fractions to simplify the grain scatter. All data obtained from the textural analyses were used for the USDA classification by Sedimcol software.

2.4. Chemical Analyses

Soil samples were air-dried and sieved at 5 mm before further analysis. Leaf samples were dried at 60 °C for 72 h and grounded with an electric grinder until obtaining a fine powder.
Soil samples were extracted with H2O Milli-Q (high purity) at 1:10 ratio (weight/volume), to measure soluble anions and pH. After shaking for 1 h at 150 rpm in closed plastic tubes, the supernatant was separated by centrifugation at 4000 rpm for 4 min and filtered with 0.45 µm Cellulose Acetate Abluo syringe filters (GVS Filter Technology). The pH was measured with a pH electrode connected to an automatic titrator unit 877 Titrino-Plus (Methrom, Italy). Soil H2O extracts were analyzed by Ion Chromatography (IC) with an ICS-1000 Dionex equipped with AS9-HC 4 × 250 mm anion column, AG9-HC 4 × 50 mm guard column, ADRS600 suppressor and AS-40 autosampler for the determination F, Cl, NO2, Br, NO3, PO43−, and SO42−. Calibration was performed with certified Thermo Fisher Scientific standards. Concerning anions, only the most significant results are shown in this paper, whereas all additional data are reported in Supplementary Material Table S1.
The Soil Organic Matter (SOM) was estimated by calculating the weight loss after heating 0.5 g of oven-dried soil at 550 °C according to [54].
The Total Nitrogen and Carbon (respectively, TN and TC) and the respective isotopic signature (δ15N and δ13C) of soil and leaf samples were acquired with a Vario Micro Cube Elemental Analyser (EA) (Elementar, Langenselbold, Germany) connected to an Isoprime 100 Isotope Ratio Mass spectrometer (IRMS) (Isoprime, Cheadle, UK) operating in a continuous-flow mode. The EA-IRMS was calibrated with synthetic Sulfanilamide (provided by Isoprime Ltd.) and Carrara Marble (cross-calibrated at the Institute of Geoscience and Georesources of the National Council of Researches of Pisa) standards.

2.5. Vegetative Measurements

At all sites, one-year-old olive plants were provided by IBE nursery thus ensuring their growth uniformity, genetic correspondence and health status. The choice to study seven different cultivars is motivated by their different growth response (vigor). Vegetative growth parameters (plant height, number and length of branches including one-year shoots) were measured on 15 plants for each treatment and for each cultivar one year after the transplant. The sum of branch lengths for each plant was calculated. It is important to conduct these measurements during the first years of planting when the plant is left to grow without applying pruning techniques.

2.6. Statistical Analysis

All data were elaborated with R Studio 4.1.1 version. To address significant differences between the treatments due to the zeolite application, parametric and non-parametric tests were applied. Normality and homoscedasticity were tested through Shapiro–Wilk and Barlett tests (p = 0.05) for each variable. Data following normal distribution and with homogeneous variance were tested with a 1-way ANOVA and multiple comparison tests (Tukey HSD) at p = 0.05 in order to evaluate statistical differences for a whole three years. If normality or homoscedasticity were not reached (even after log or ln transformation), a non-parametric test (Kruskal–Wallis) was applied instead of ANOVA. Furthermore, Principal Component Analysis (PCA) was applied to discriminate groups of samples depending on the treatment variable (ZEO or CNT). “Ggplot2”, Agricolae”, “Ggally”, “ggbiplot” and “ggfortify” [55,56,57,58,59] R-packages have been used for data analyses and figures in this paper.

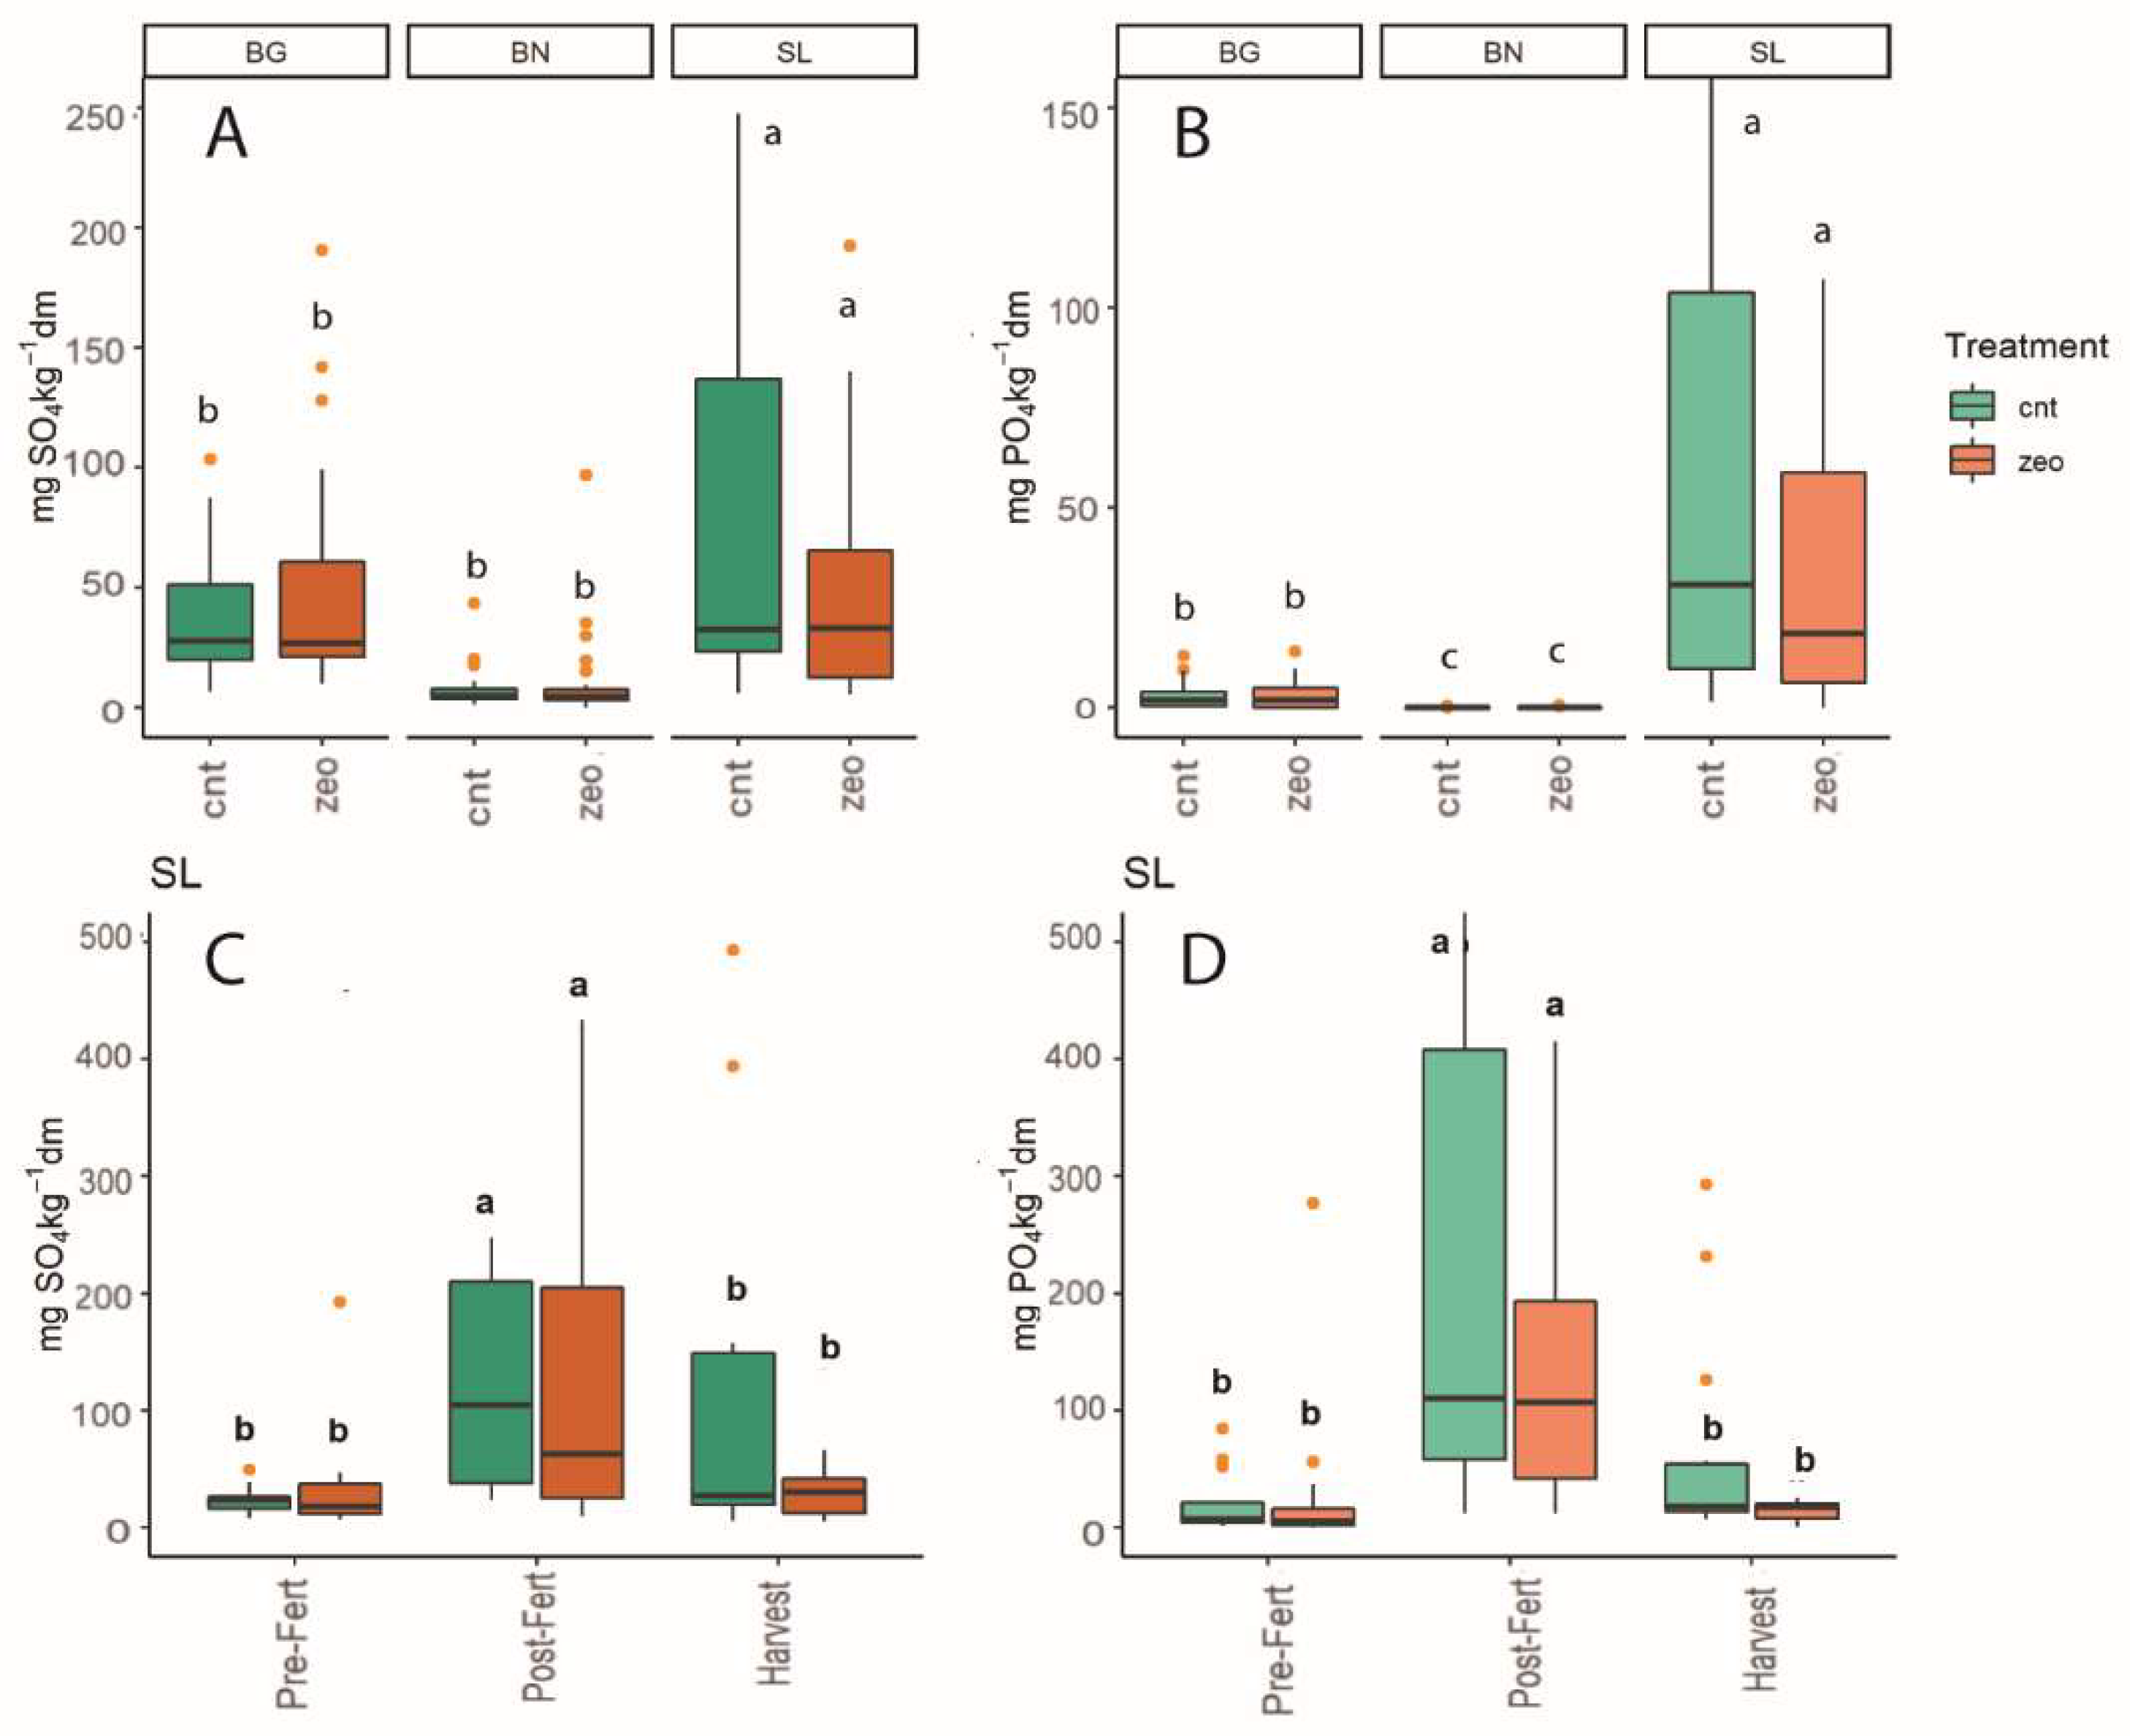
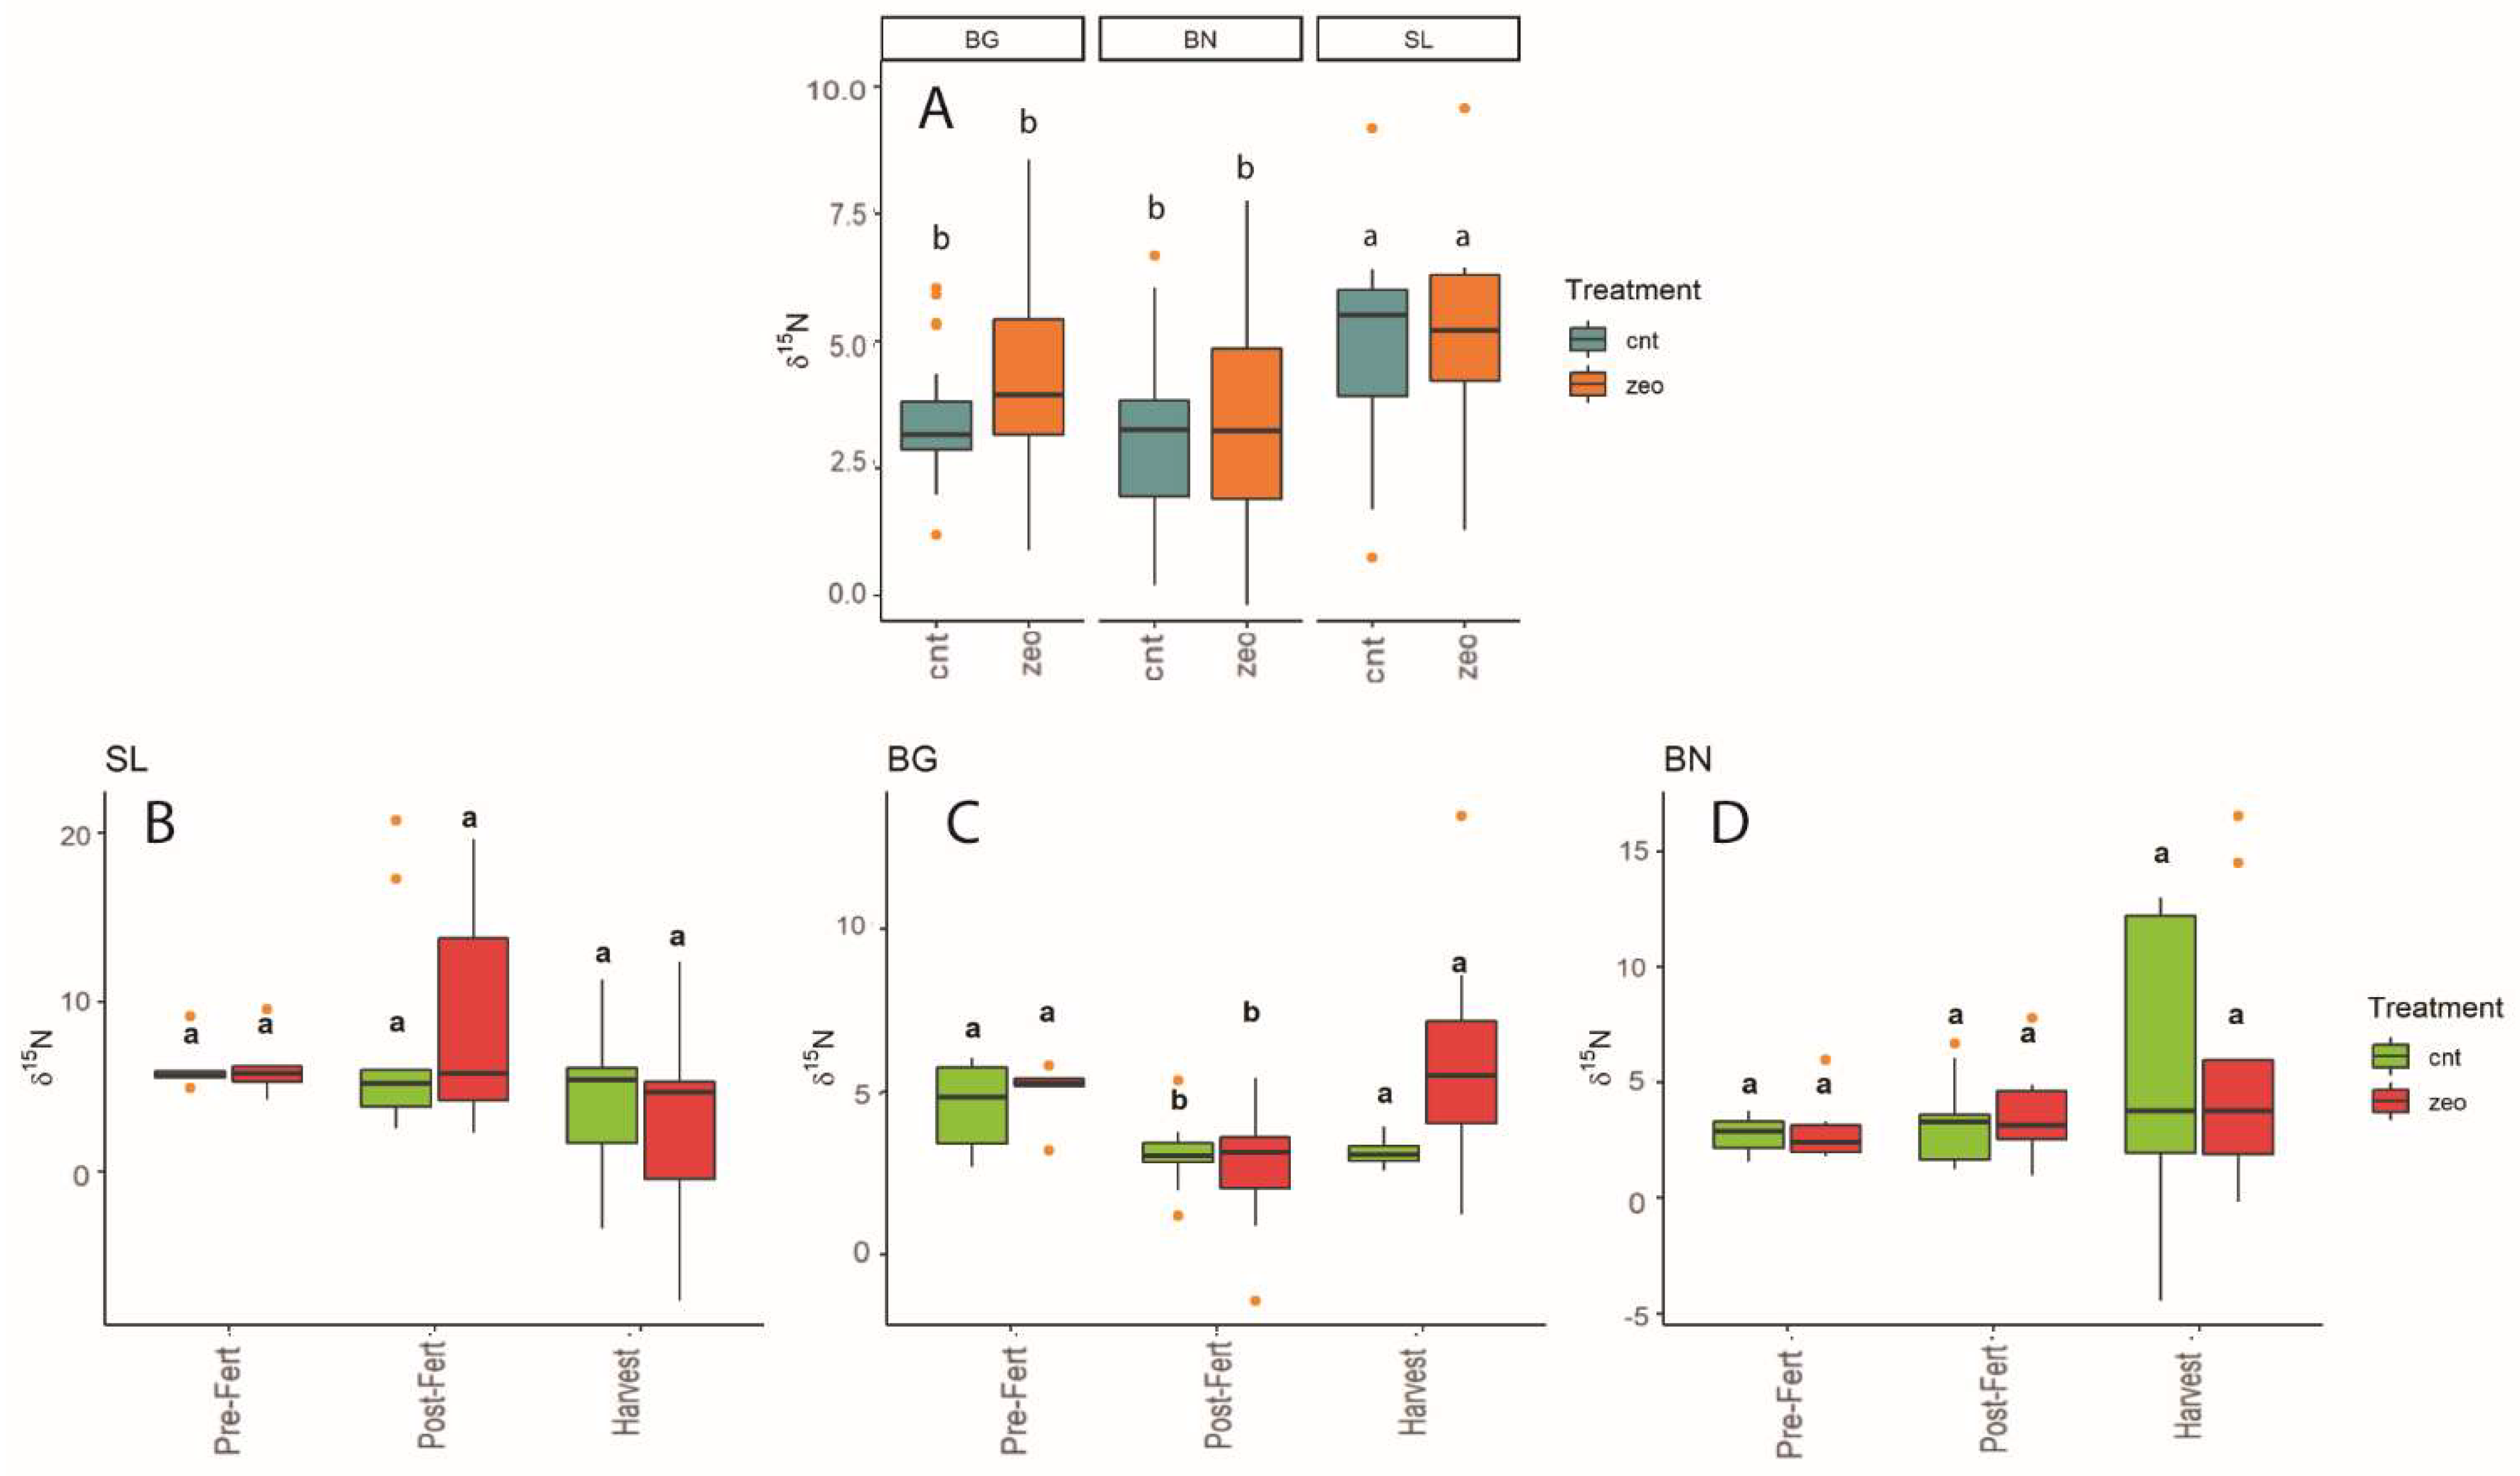
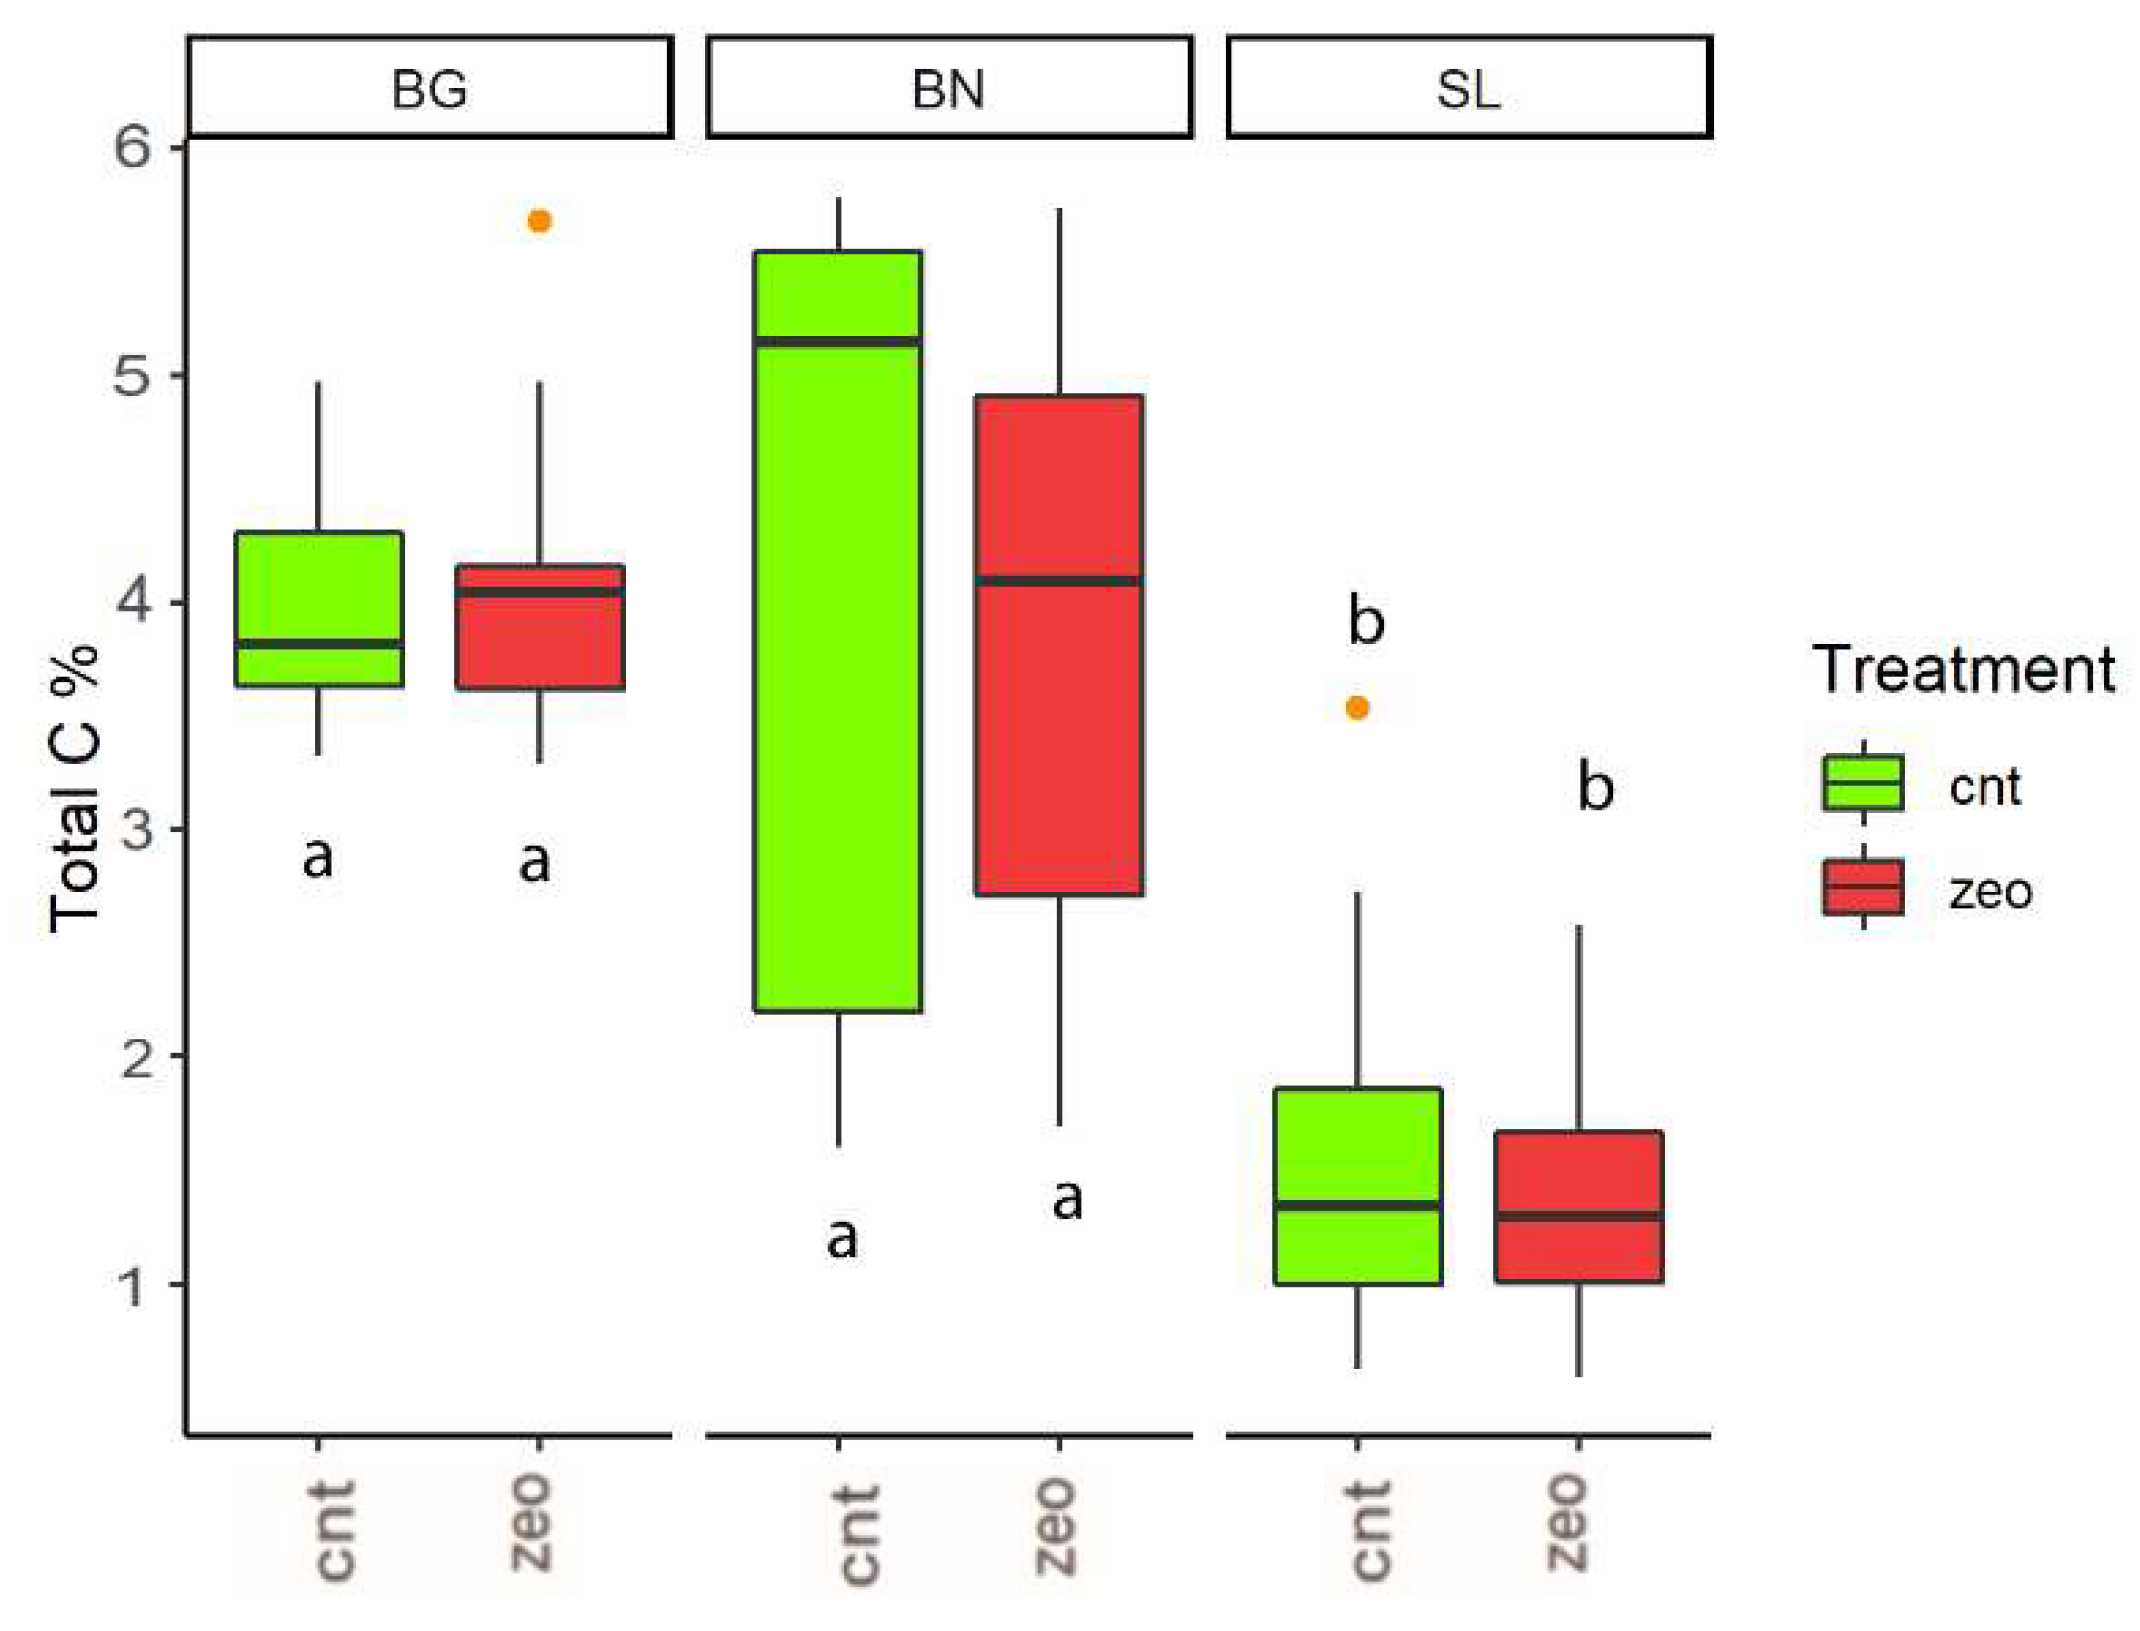
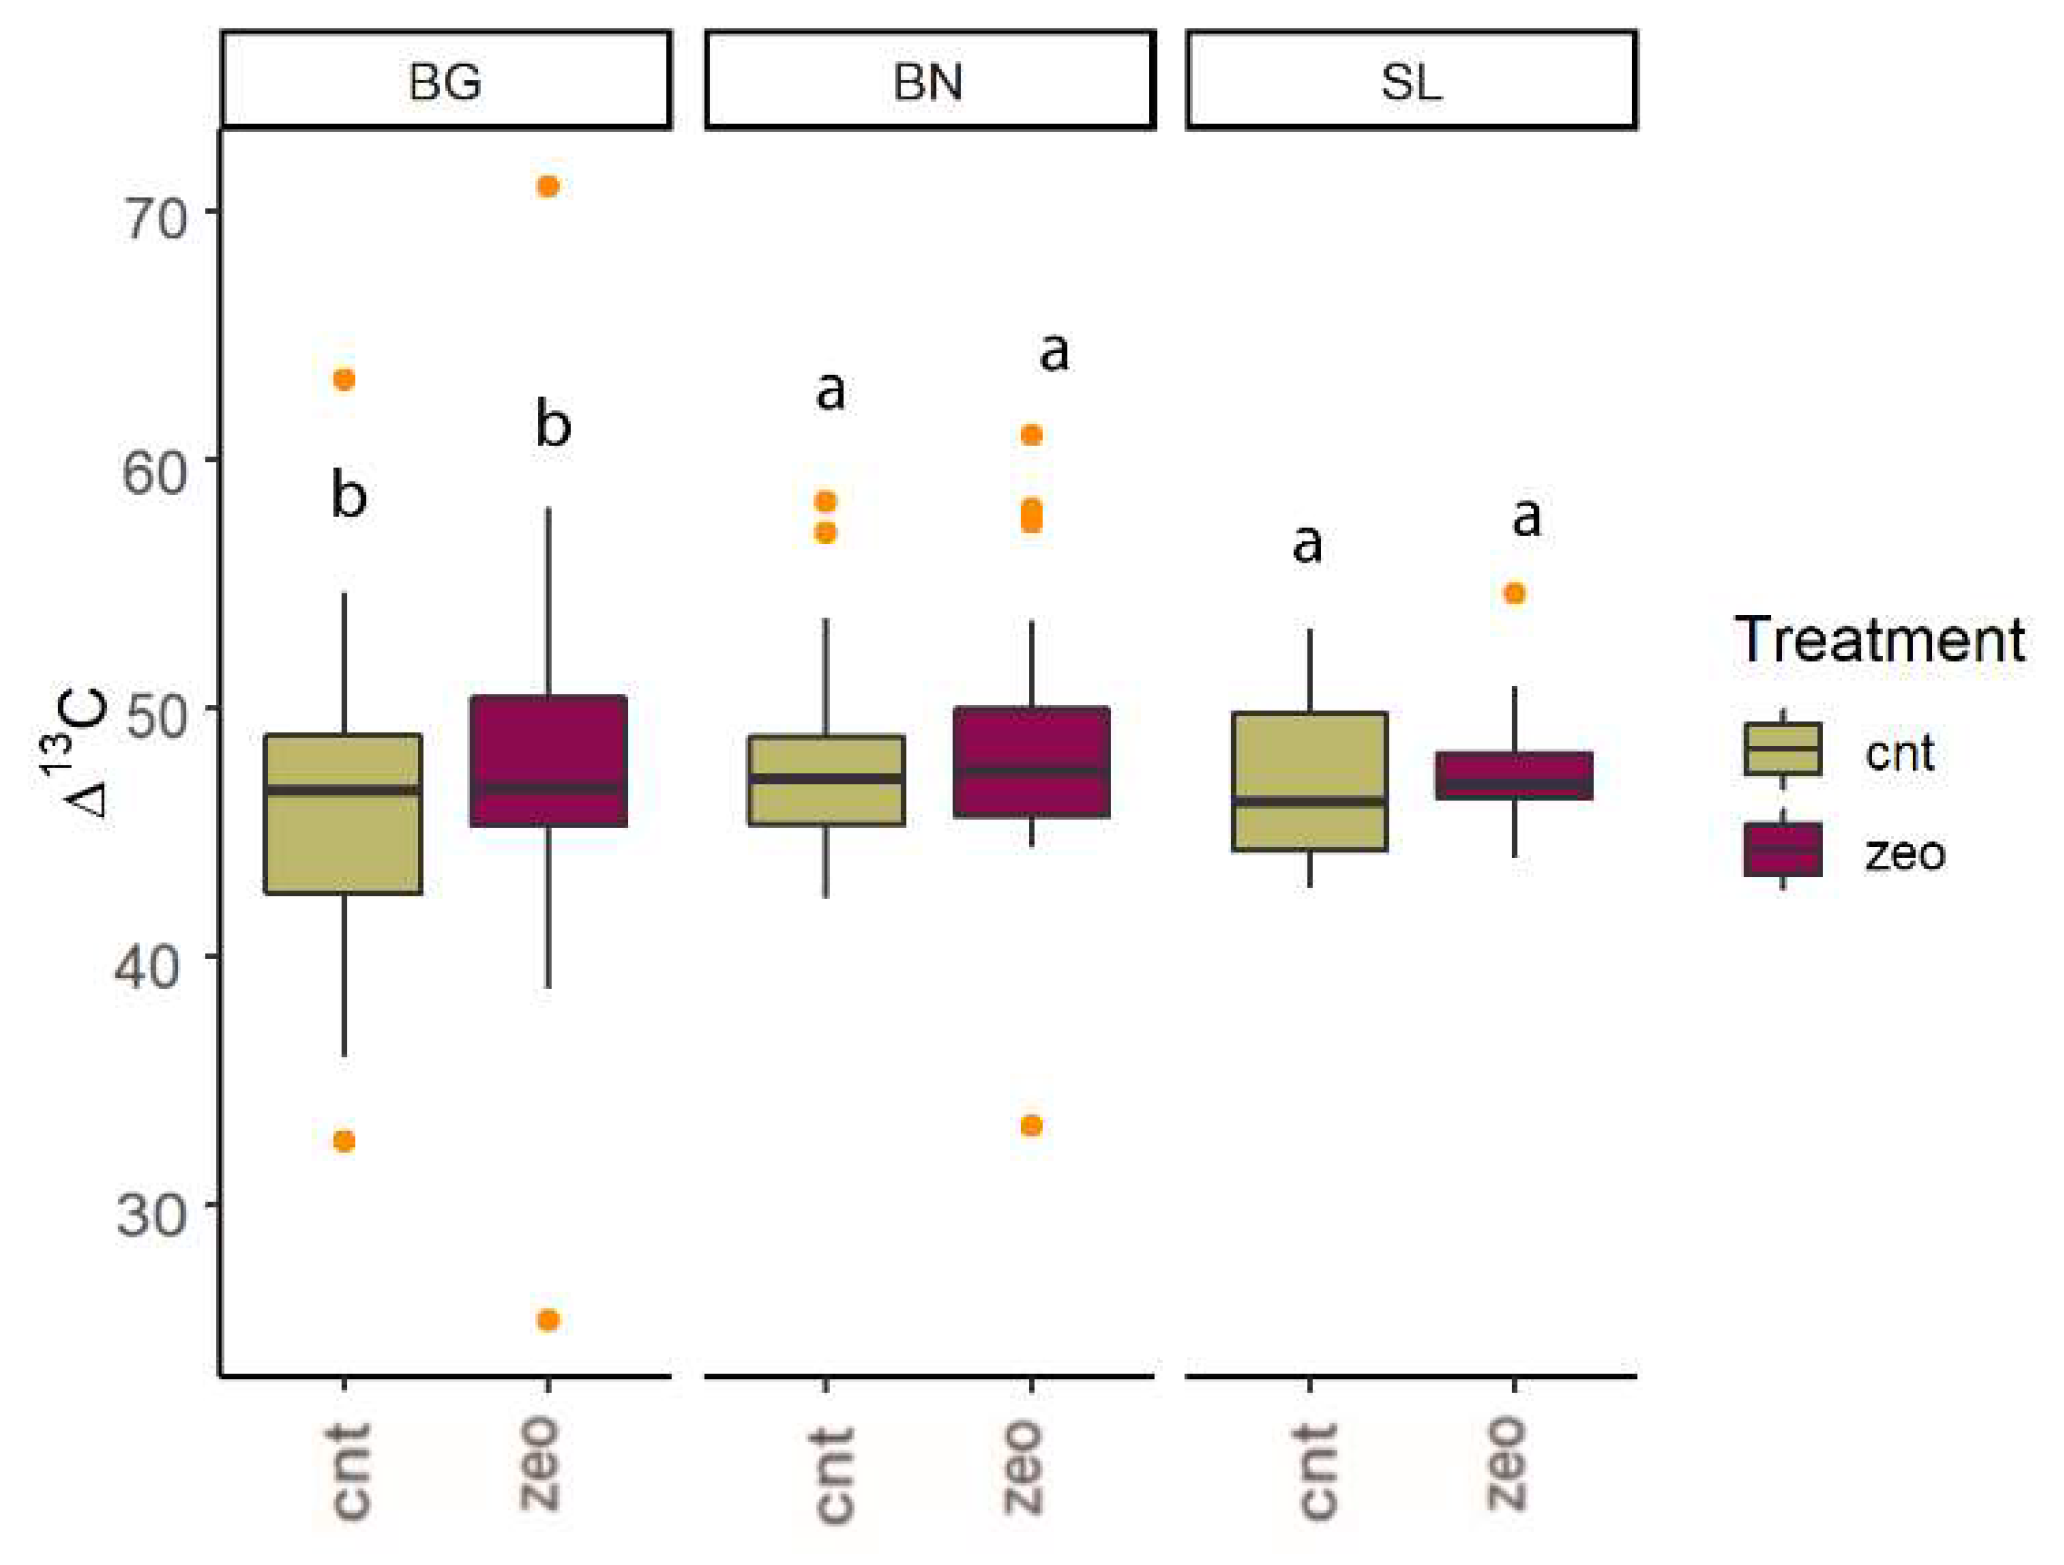
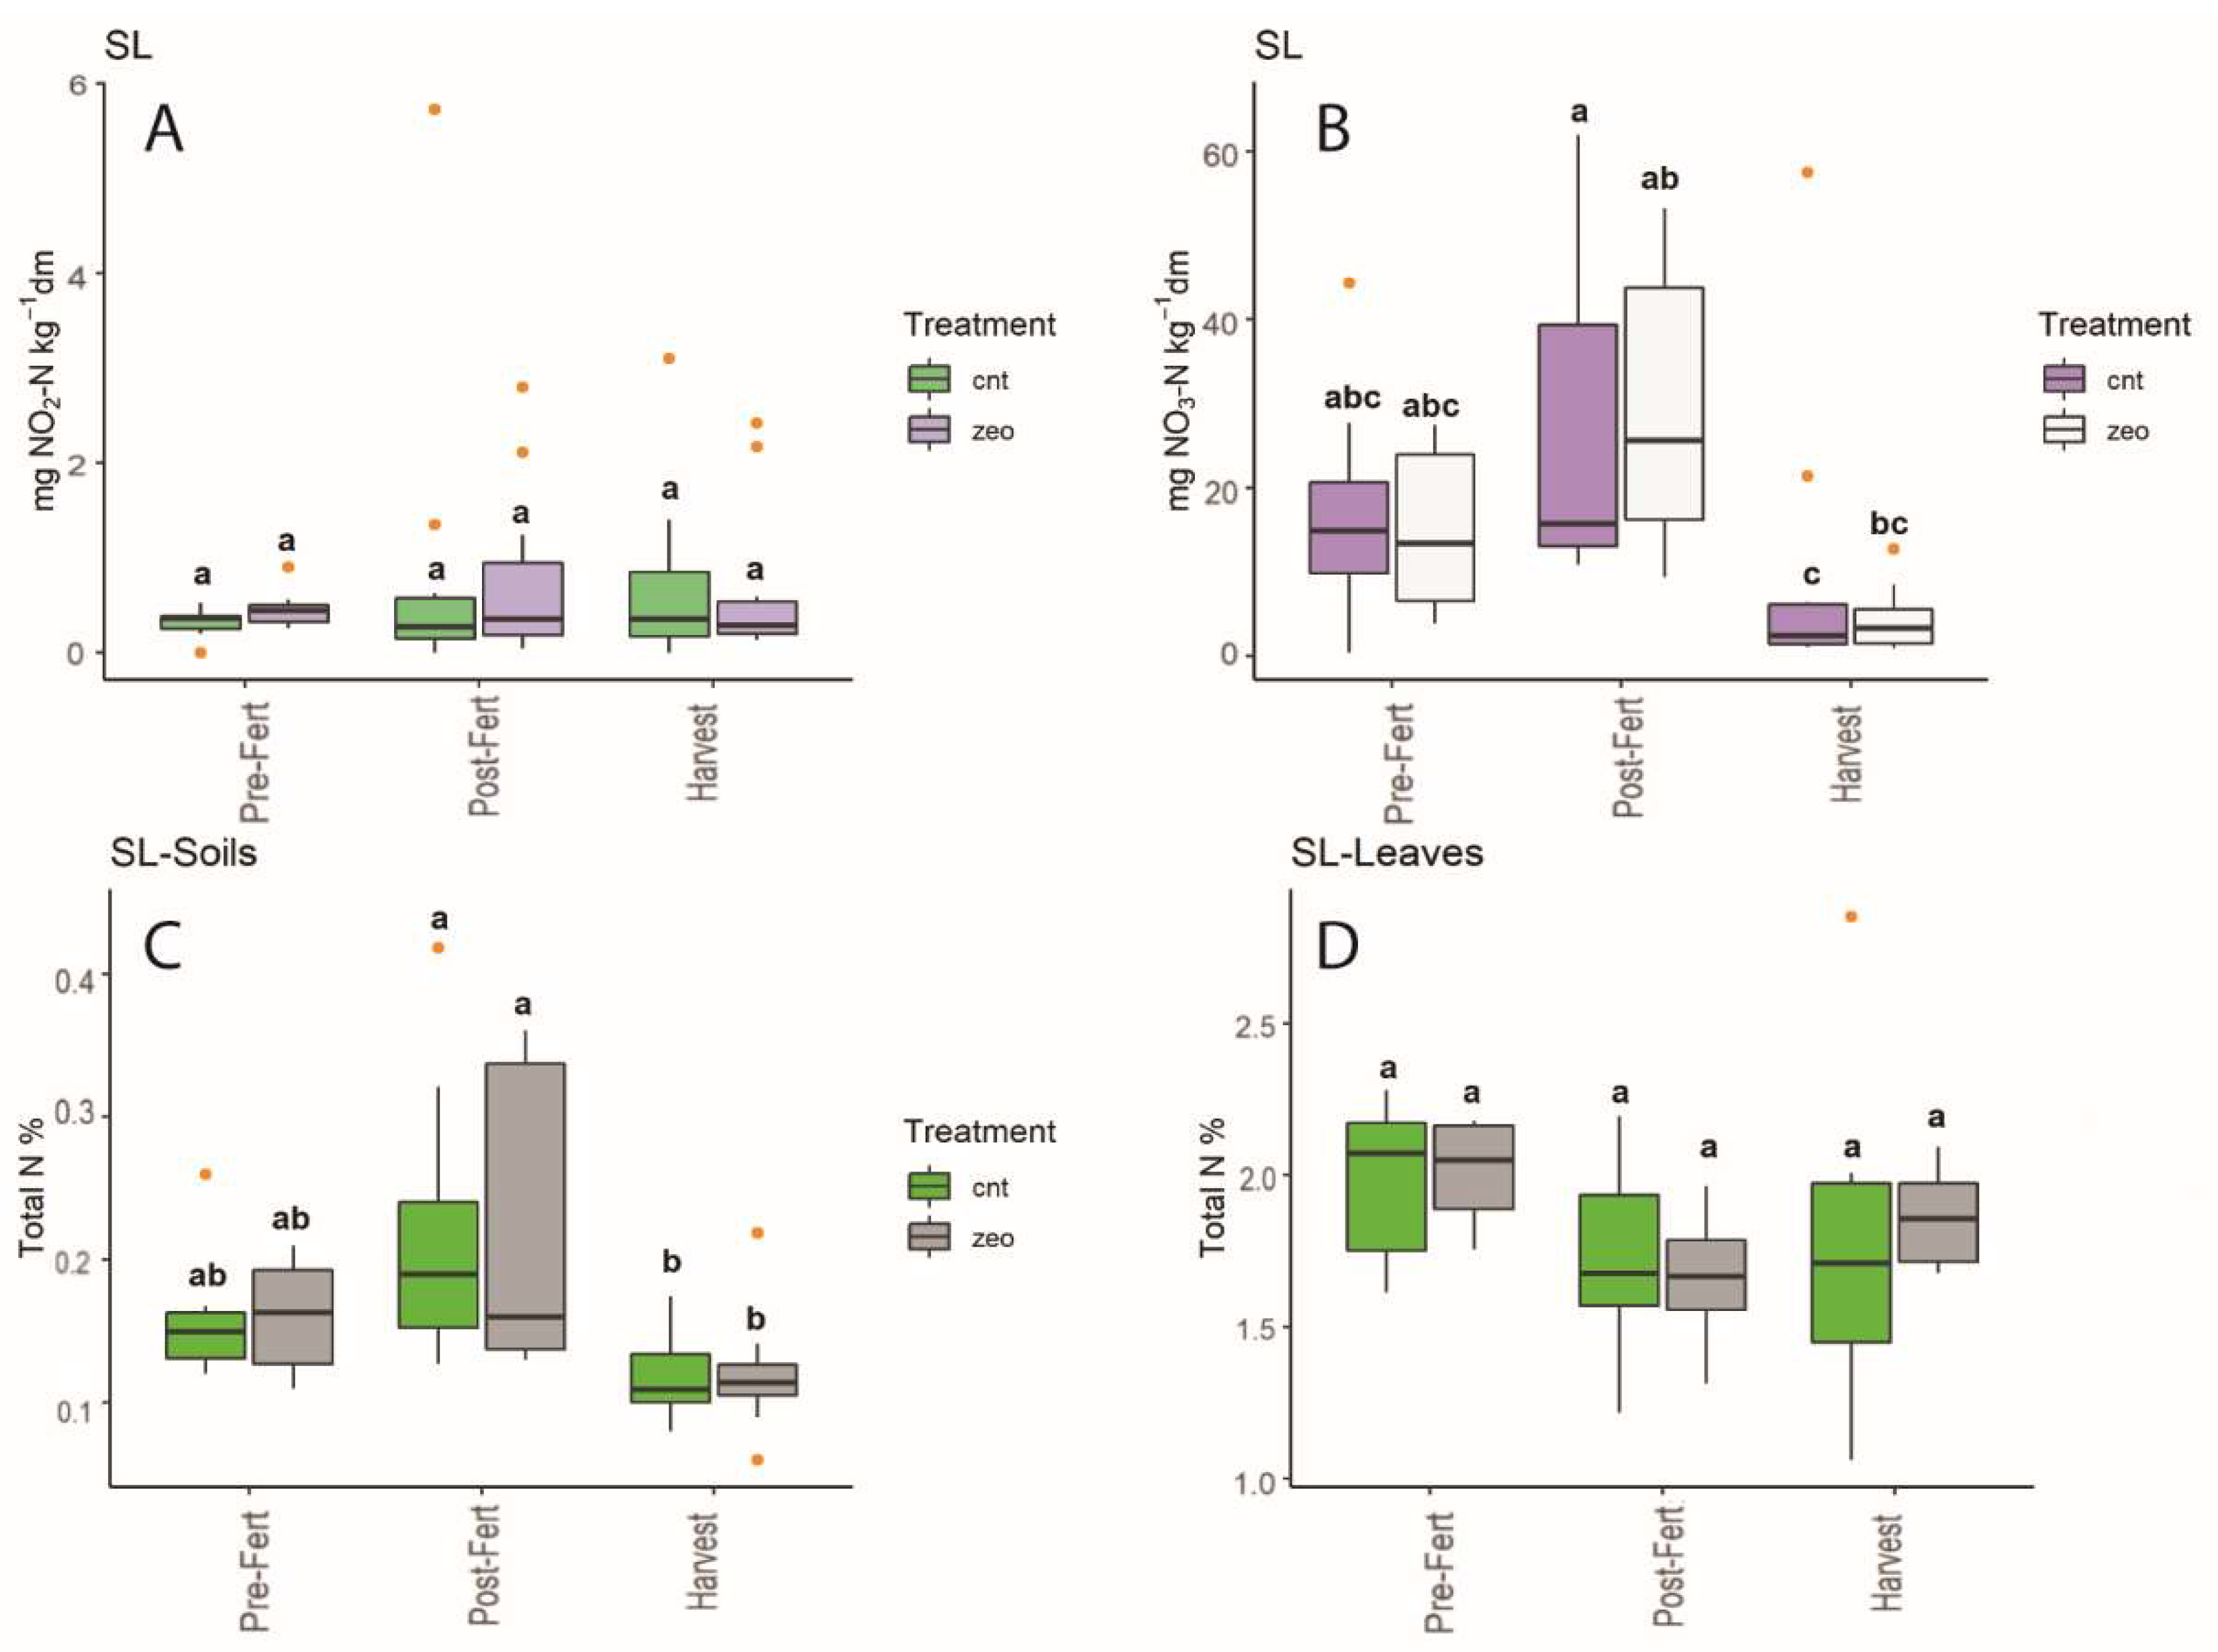
3. Results and Discussion

Soils from BN and BG experimental sites are mainly characterized by silty-clay-loam textures, with a slightly higher silty fraction in BG (Figure 3). SL soils are characterized by an important sand fraction and were classified as sandy-loam and sandy-clay loam (Figure 3).

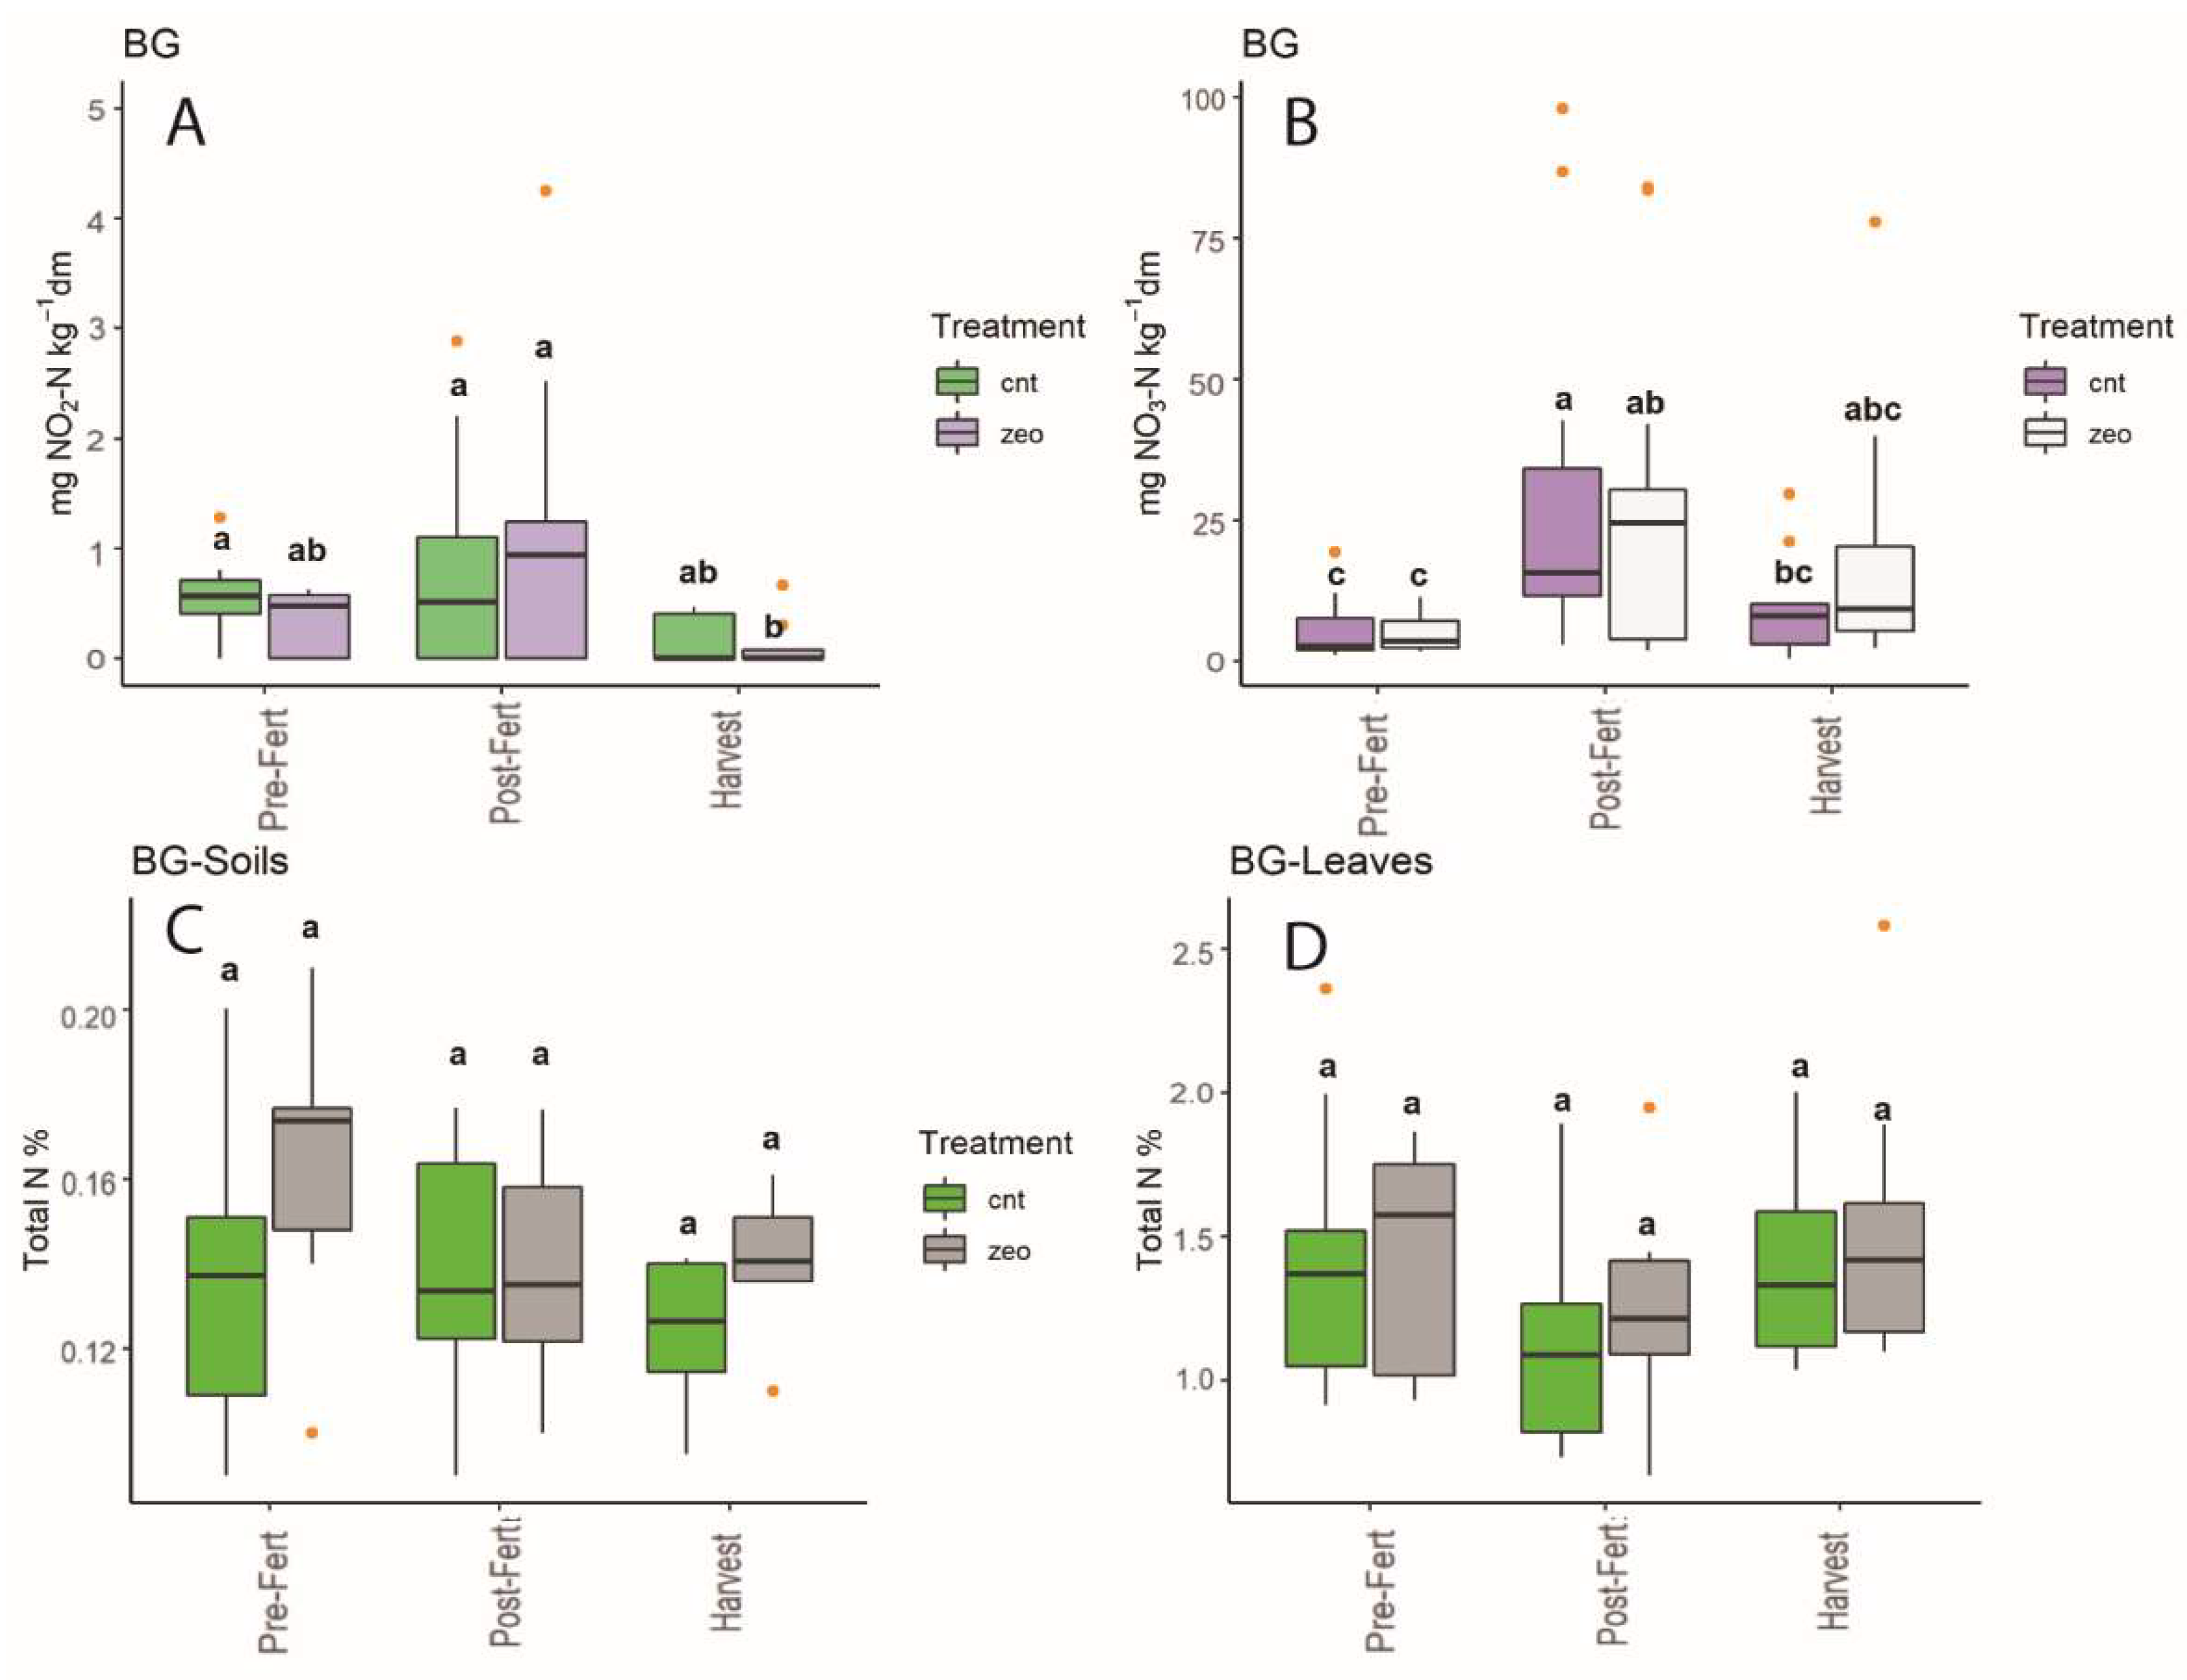
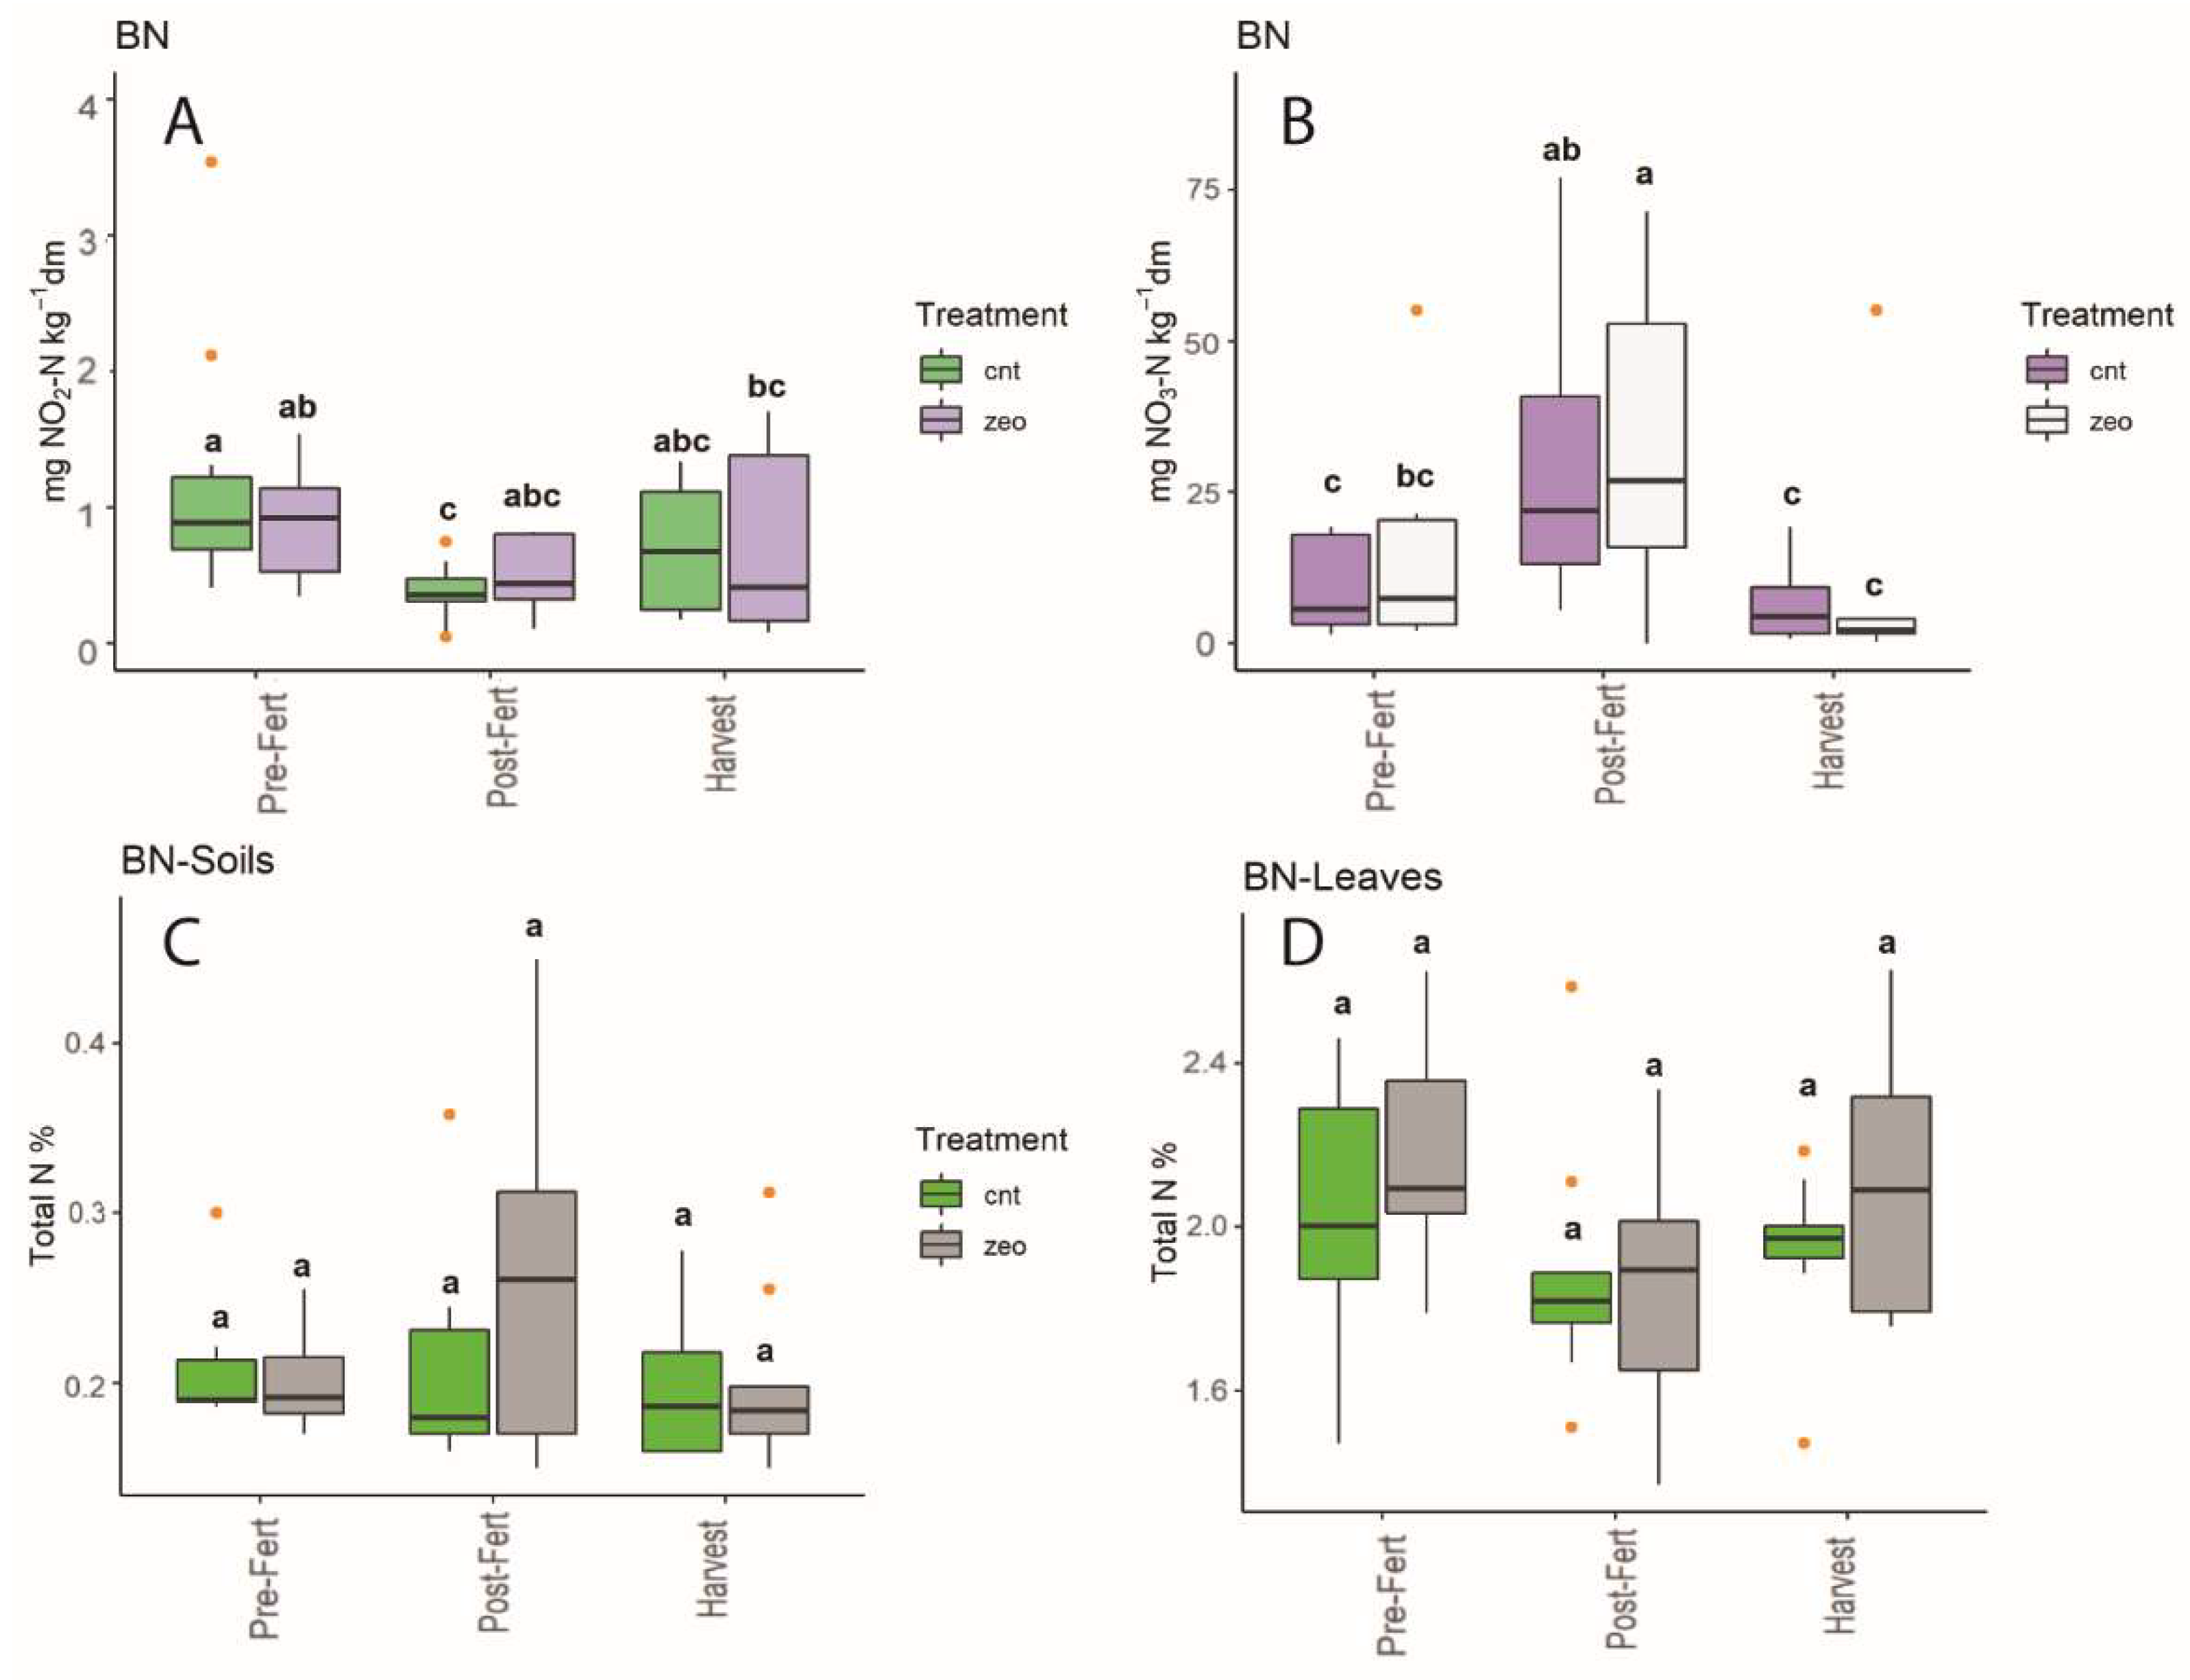
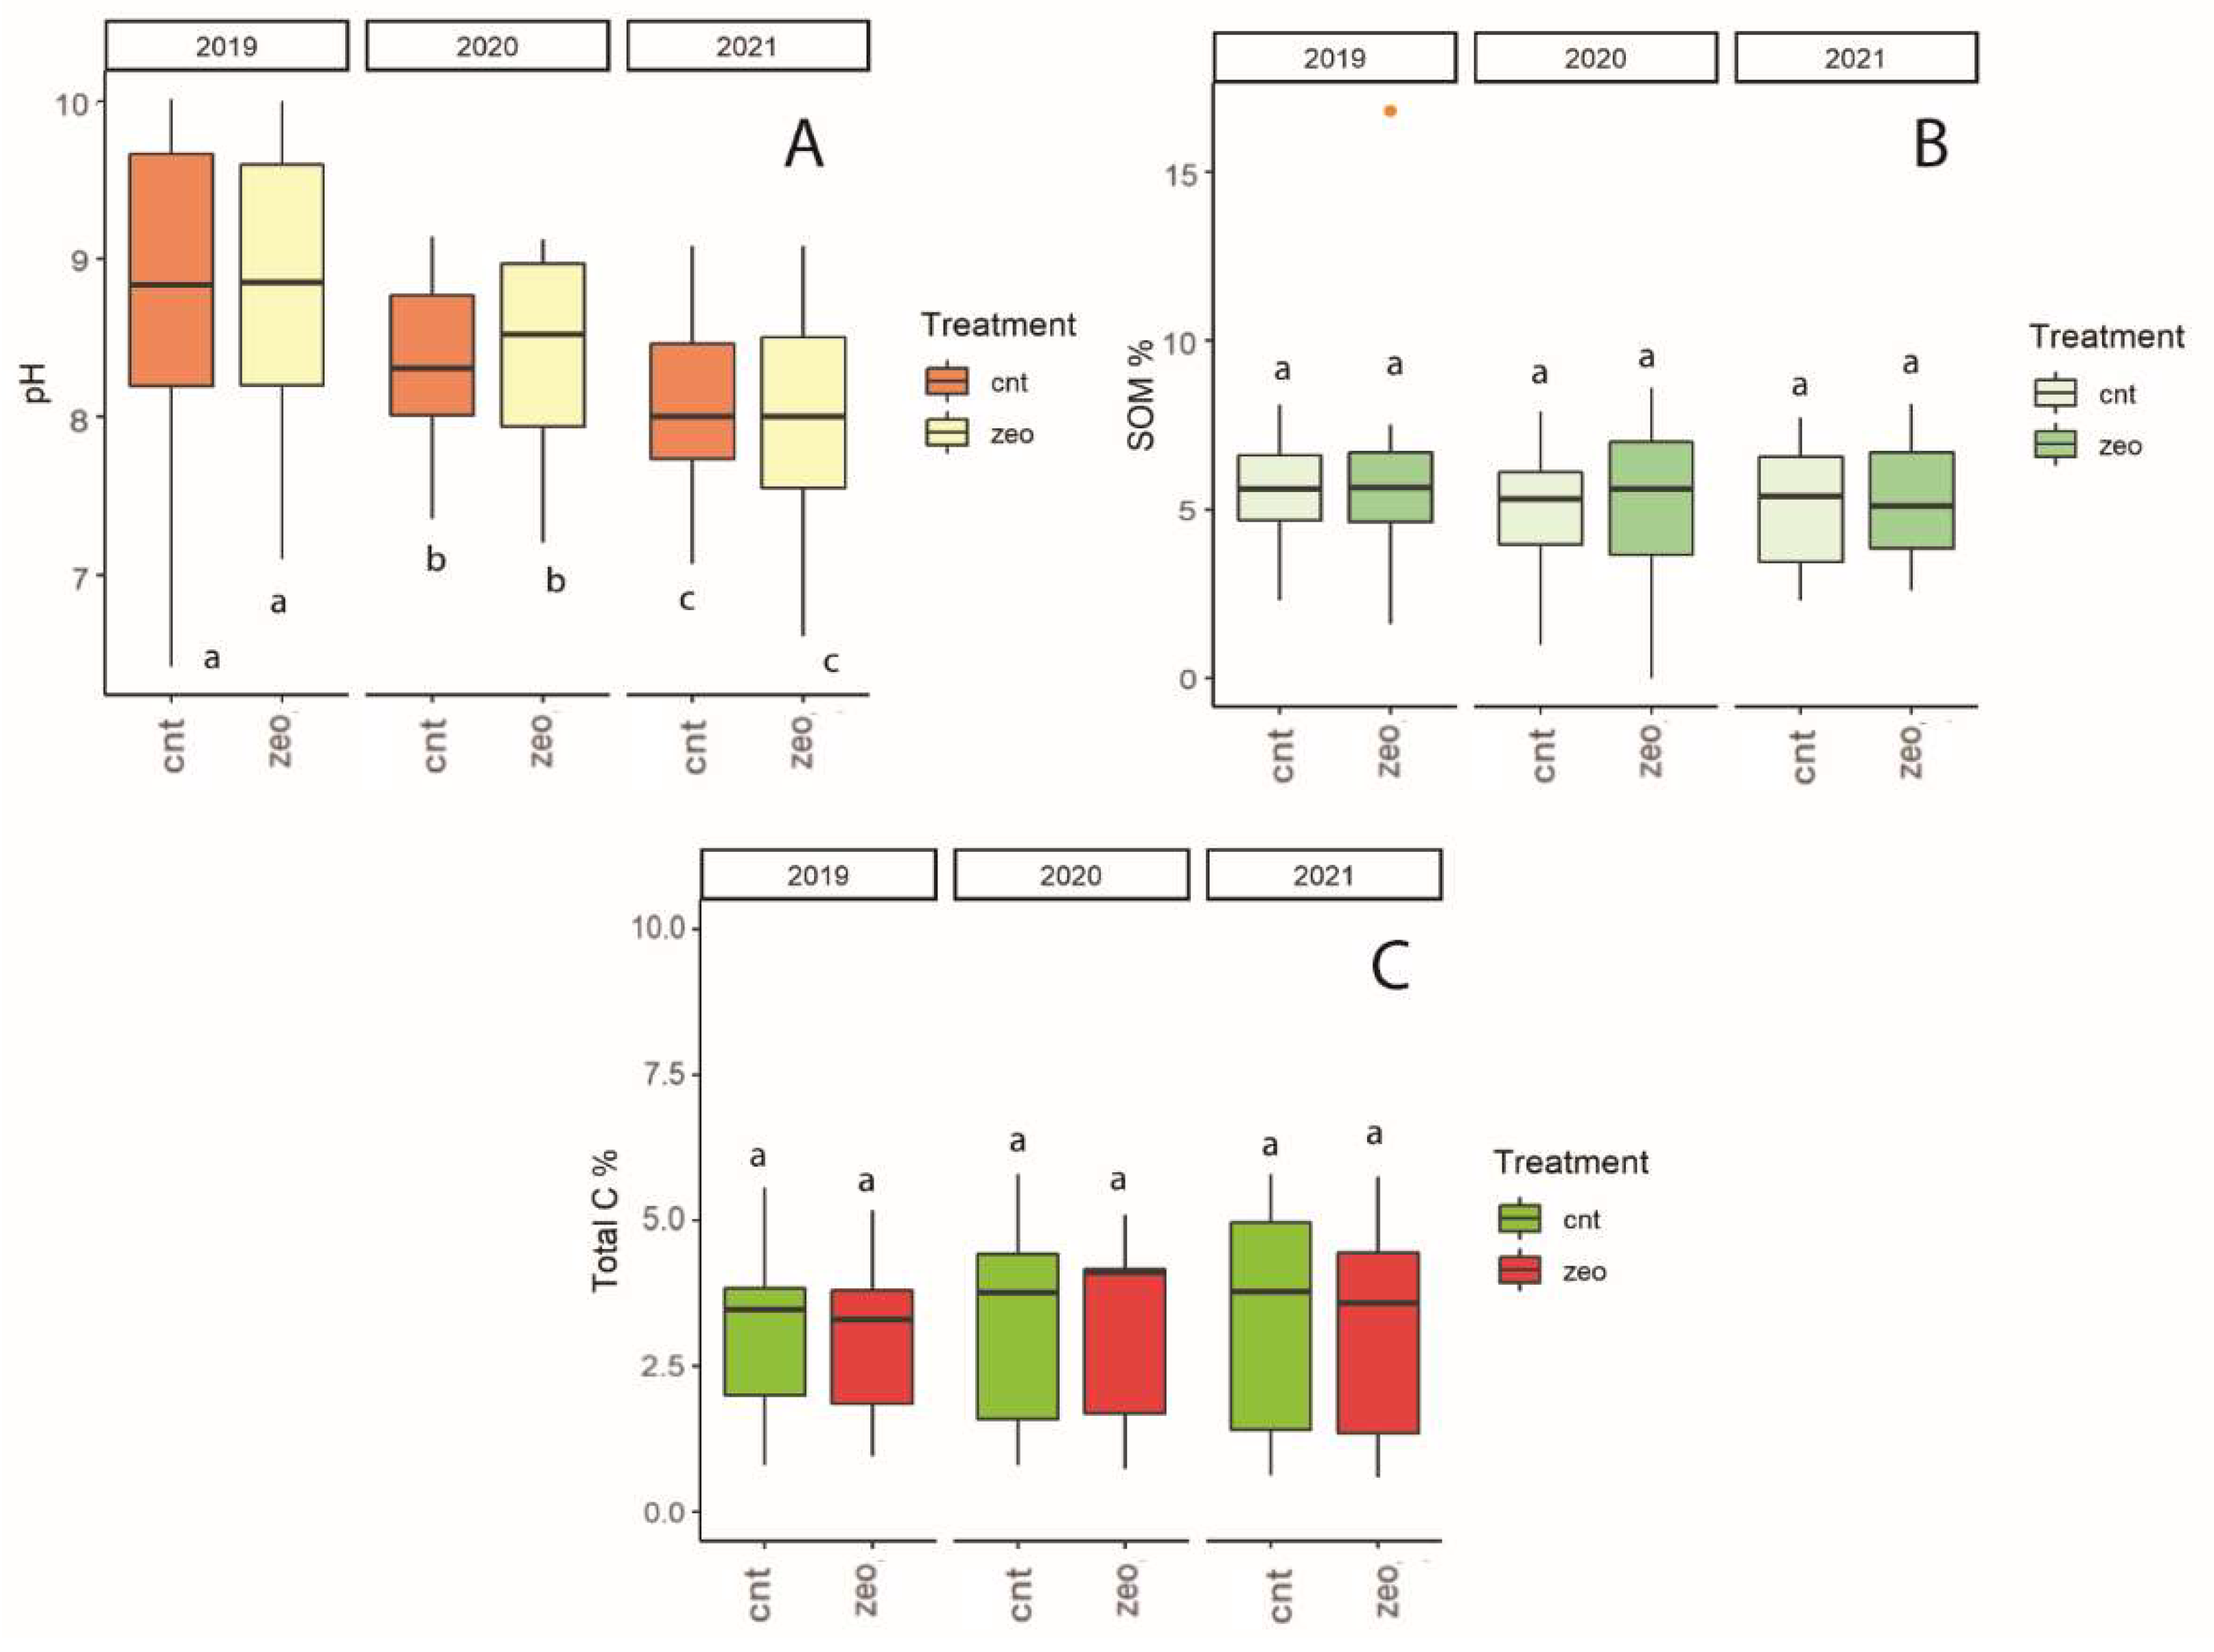
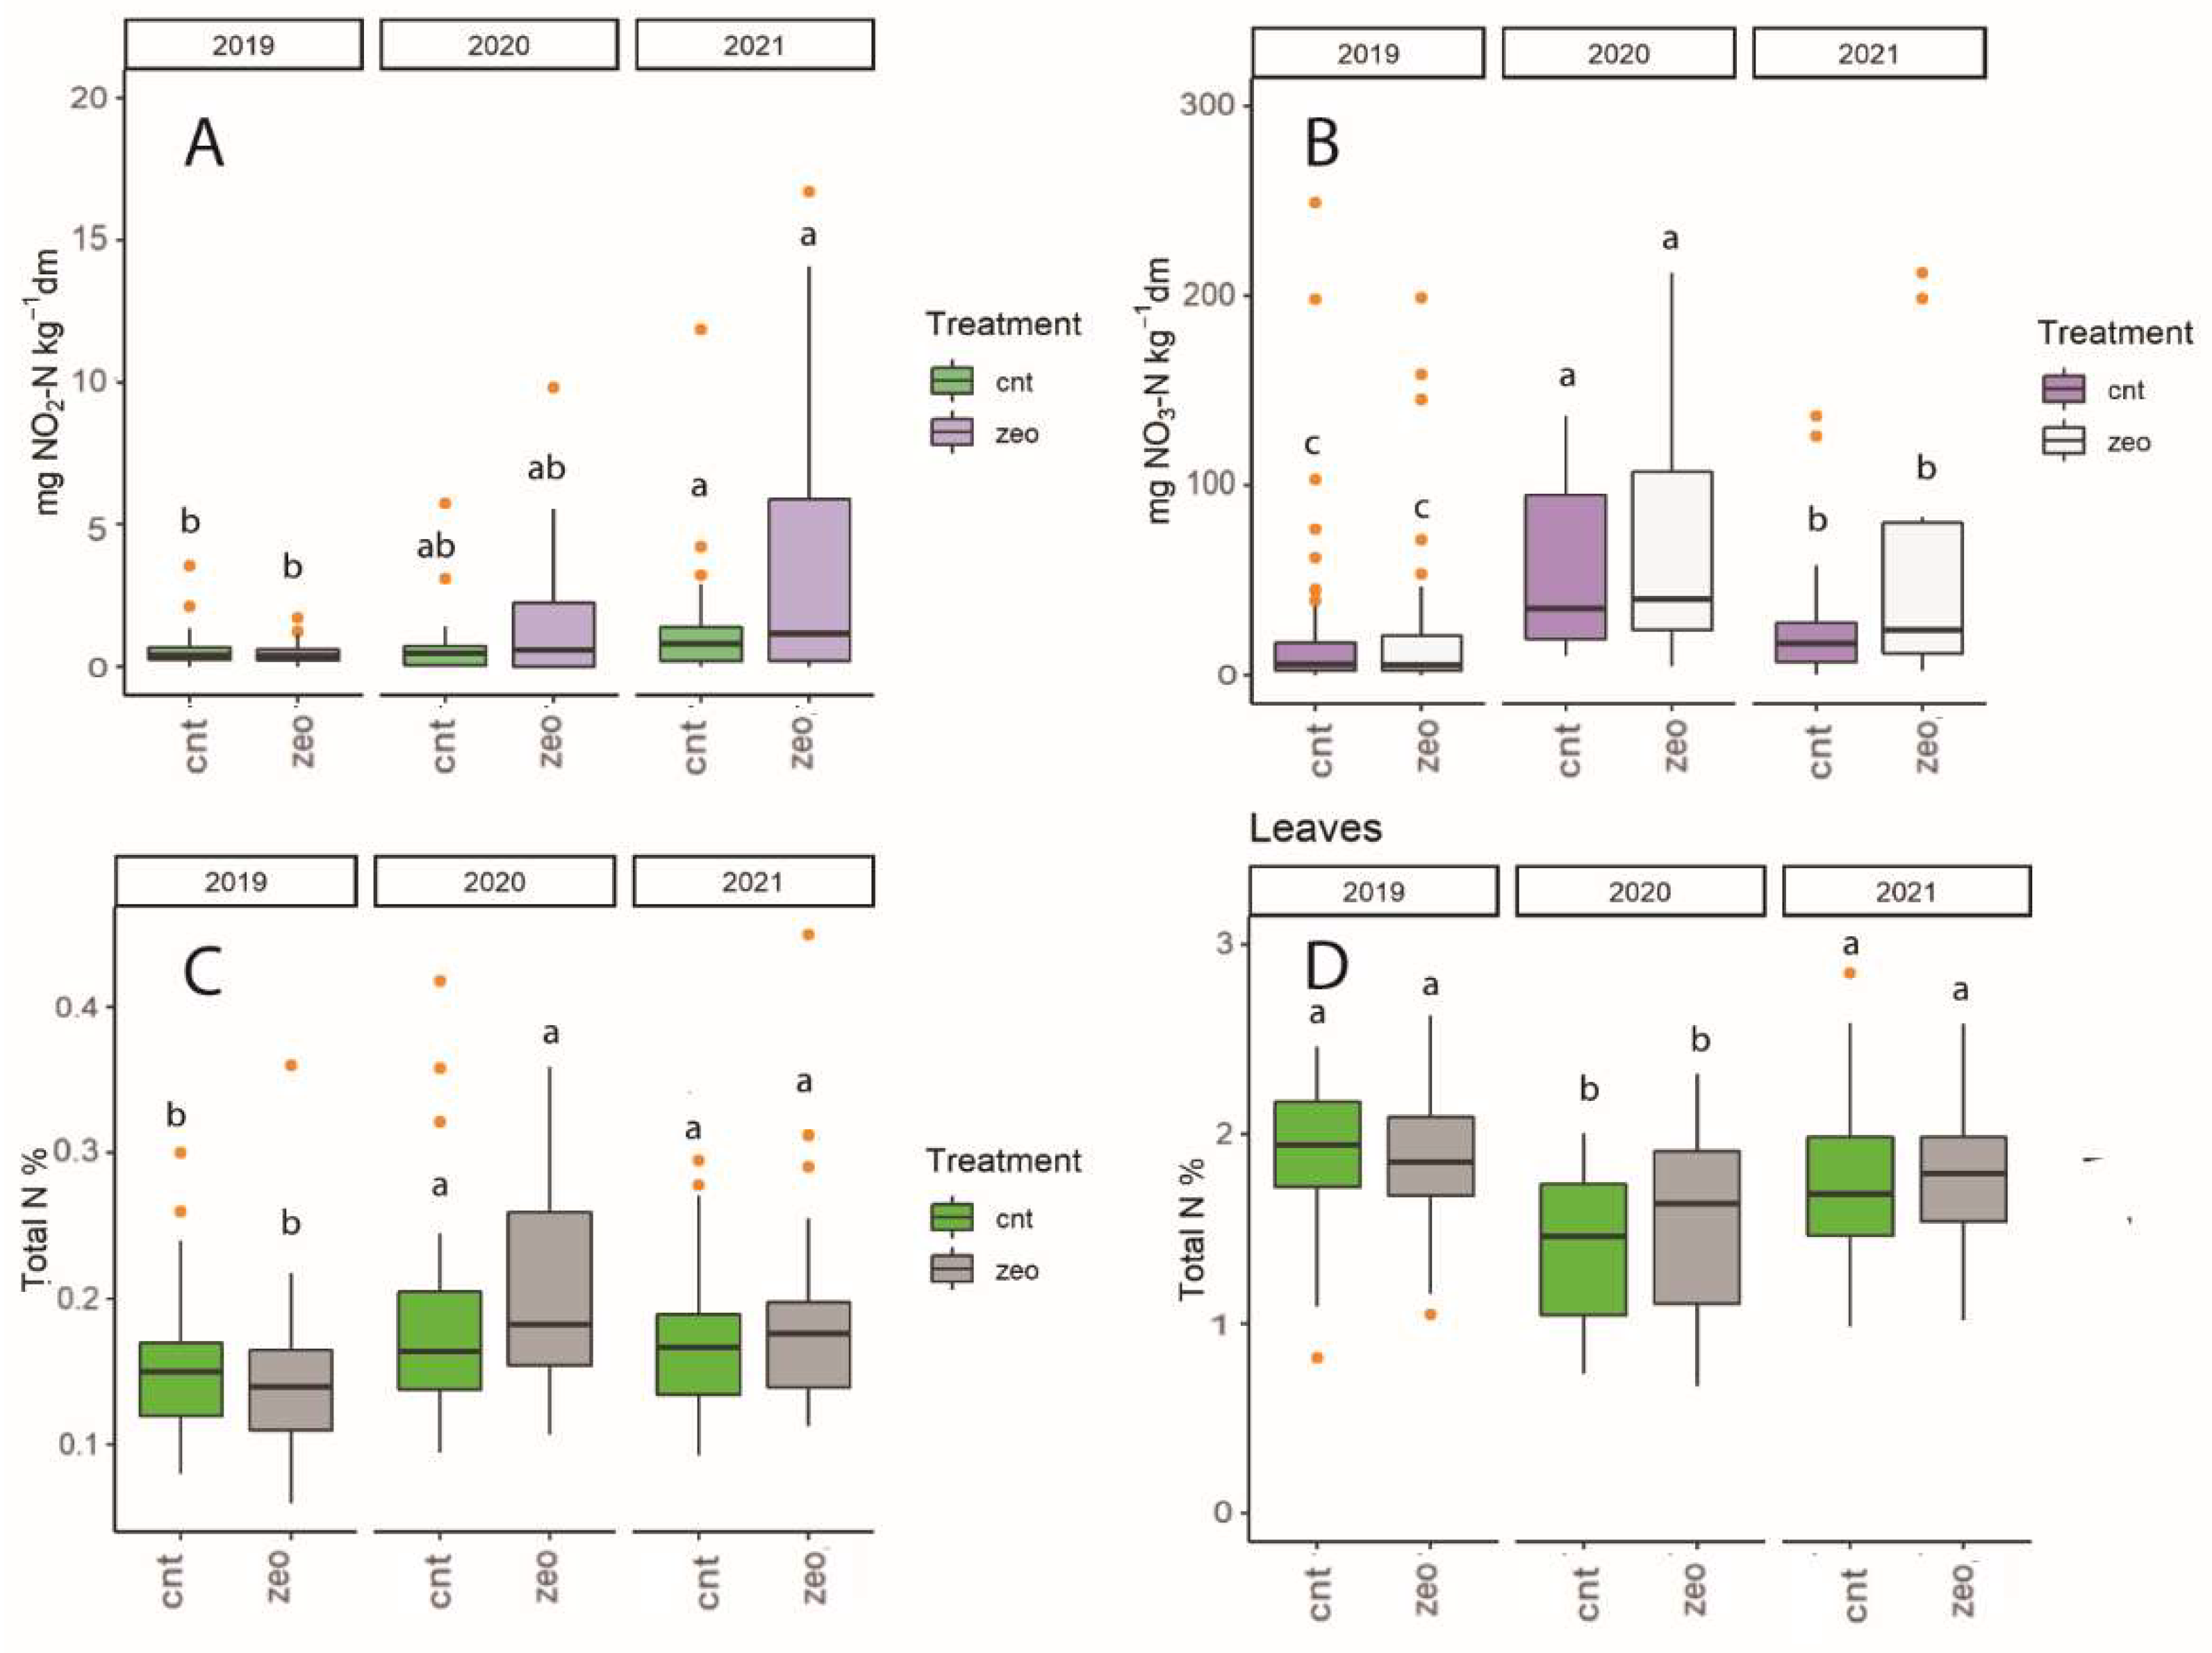
3.1. Dynamics at Each Experimental Site

Given the large dataset, in the following we will discuss only annual trends and 3-year average significant observations. The complete dataset is available as Supplementary Material (Table S1).
In Table 2, the 3-year average of soil pH and SOM at each experimental site are reported. These basic parameters are indicators of soil quality and plant growth: SOM is the primary source of essential nutrients (N, P and S) and influences bulk density, water retention and soil temperature as well as biological activity, and buffers pH [60].
In the BG site, a slight decline in soil pH was observed in Post-Fert samples (Table 3), probably due to chemical fertilizer addition. In BG and BN, SOM is generally higher than in SL site, due to the different soil texture. The presence of silt and clay in fact maintains more C from primary production and increases SOM under certain environments [60]. SOM could be influenced by fertilization and irrigation of soil, and they are correlated with SO42−, PO43− (Figure 4), δ15N (Figure 5) and Total Carbon (TC) (Figure 6). However, in SL and BN, SOM was higher in Post-Fert than in Pre-Fert and Harvest, while BG showed an opposite trend (Table 3). Moreover, Total Carbon (TC) in BG and BN sites confirmed the higher trend of SOM explained above, while SL showed an opposite trend (Figure 6). As far as pH and SOM are concerned, no significant effects related to the zeolitite addition to soil were observed over the 3 years of experimentation. The nutrient input reduction of 50% every year in ZEO treatment suggests a more favorable balance between inputs and outputs of SOM in the zeolitite-added soils.
Due to the different kind of fertilizer used, the SL site showed SO42− and PO43 values remarkably higher than BG and BN fields. The chemical fertilizer applied in SL in fact contained phosphate and sulfate, unlike the fertilizers used in BG and BN. Being both SO42− and PO43 negatively charged, they are unsuitable for cation exchange by natural zeolites, which led to non-significant differences in the retention of these ions in the soil between CNT and ZEO. However, given the lower amount of fertilizers applied to ZEO, a lower values of SO42− and PO43− were expected in this treatment, at least after fertilizer application. SL highlighted its highest values Post-Fertilization (Figure 4C,D), while BG and BN values showed no differences during the agronomic year.
The different kind of chemical fertilizers adopted in the experimental sites also influenced the N isotopic composition in the soil, as clearly shown in Figure 5A. On average, the δ15N of SL soil is higher than in the other sites due to the use of organic fertilizers, which generally have higher 15N content than the synthetic ones [61], but no significant variation over the agronomic year occurred (Figure 5B). At the BG site, after the addition of chemical fertilizers the δ15N of soil tended to decrease (Figure 5C) while at the BN site, no differences were detected (Figure 5D). In natural ecosystems, soil δ15N ranges from −6‰ to 16‰ [62] and this high variability can be related to climate gradients and different atmospheric conditions. An inverse and a direct correlation between mean annual precipitation (MAP) and mean annual temperature (MAT) can be in fact observed with δ15N [63]. BG presents the highest MAP, while both BG and BN sites show the lowest MAT during 2019–2021. An increase in the δ15N values at BG is also observed in concomitance with the harvest (Figure 5C), probably due to the temperature peaks recorded during the summers of 2020 and 2021. The lower δ15N values of BG and BN with respect to SL could thus result both from different N sources and climatic conditions.
To evaluate the influence of irrigation, the Carbon Discrimination Factor (Δ13C) was calculated from δ13C data. Figure 7 shows the Δ13C for leaves of each site, which means the δ13C normalized for changes in atmospheric CO2 concentration through Equation (1), where a and p refer to air and plant [64].
Δ = a p 1 + p
According to Riehl et al. (2014) [65] a 1‰ Δ13C variation can be used to distinguish stressed from well-watered plants without accounting for soil fertility effects. Water stress conditions in fact causes a decrease in photosynthesis, transpiration and leaf conductance which in turn modify the carbon isotopic composition [64,66,67]. As it is known, zeolites can adsorb water molecules in their structure, which means an increase in the overall soil water holding capacity and the consequent possibility to reduce irrigation [68]. Nevertheless, no significant variations between ZEO and CNT treatments were highlighted by the Δ13C data. This fact is partially in contrast with the results obtained by [26] where a change in Δ13C in maize and wheat grown in soil amended with the same natural zeolite- rich tuff was observed. Although in that case, the authors ascribed the Δ13C variations to the manuring effect. In our case, a significant difference in Δ13C was observed in BG only, likely due to the additional water provided to the plants’ trough irrigation. This site in fact is the only one which underwent artificial irrigation, added to the highest MAP over the three years of experimentation.
N is one of the most important nutrients for plants. Thus, analyses of its different inorganic speciation were performed to address the effects of natural zeolites on soil N cycling in the three experimental fields. Nitrite (NO2-N) usually does not accumulate in soils because it is an intermediate product of nitrification (that transforms NH4+ into NO3-N), or it is denitrified to NO and N2O and N2 gases. On the other hand, nitrate (NO3-N) is one of the main forms of N used by plants and can also be exploited by microbes to satisfy their N needs (immobilization processes) [69]. Nitrate, however, can follow various transformation pathways which may also lead to N losses in the atmosphere (as nitrous oxides due to incomplete denitrification) and/or can be leached into the water system as a result of anionic repulsion by soil particles.
The results of TN analyses of soils and leaves and NO3-N and NO2-N of soils are shown in Figure 8, Figure 9 and Figure 10 for SL, BG and BN sites, respectively (3-year average).
In SL no differences were observed between the different treatments, although the N input in CNT treatment was twice that in ZEO treatment. NO2-N of soil (Figure 8A) did not show any difference between treatments (ZEO and CNT) or sampling time (Pre-Fert, Post-Fert and Harvest) among the 3 years of the project, showing values always below 10 mg kg−1. Even NO3-N in soil samples (Figure 8B) showed no significant variations among the treatments. A remarkable difference between CNT treatment Post-Fertilization and Harvest can be observed, probably due to NO3-N removing processes (gaseous losses, leaching, microbial immobilization or Dissimilatory Nitrate Reduction to Ammonium). This evidence is partially sustained by a tendency to a lower N storage in olive leaves at the Harvest in the CNT (although not significant). Soil TN (Figure 8C), reflects the same trend for nitrate, showing no significant differences between treatments. The seasonal fluctuations of these N species (with higher values after fertilization) are related to the input of N brought by fertilizers. The TN of leaves (Figure 8D) likely supports this hypothesis because the leaves have shown no differences in N content due to treatments or time. However, they showed an opposite trend to that of soils, due to the different availability of N during the agronomic year in different environmental compartments. Immediately after fertilization, TN is concentrated in the soil, and it is lower in leaves while at the harvest the trend was opposite.
In the BG site, TN did not show any significant difference due to the treatment and sampling time for both soils (Figure 9C) and leaves (Figure 9D), coherently to the SL site. The NO2-N (Figure 9A) and NO3-N (Figure 9B) of BG soils showed a trend similar to SL and no differences were accounted for between ZEO (50% of fertilizer) and CNT (100% of fertilizer). However, sampling time significantly affected the amounts of N in the soil. NO2-N (Figure 9A) in Post-Fertilization ZEO samples showed significant differences with respect to ZEO at Harvest, suggesting lower nitrite production (or improved consumption) in this treatment. The NO3-N (Figure 9B) content in CNT treatment at Harvest was significantly lower than Post-Fertilization, but an increase in N uptake of plants is not able to explain the NO3-N reduction in soil. This decrease is probably due to a N loss in the surrounding environment which did not happen for ZEO treatments, as suggested by the tendency of ZEO leaves to have higher TN amounts for all sampling stages, although not statistically significant.
The BN samples showed a trend similar to the SL and BG areas during the three years of monitoring. NO2-N (Figure 10A) and NO3-N (Figure 10B) of soils showed no significant differences between ZEO and CNT. NO2-N showed significant differences between Pre-Fertilization and Post-Fertilization samplings, with higher values at Pre-Fert. NO3-N followed the trend linked to the fertilization, with higher values at Post-Fertilization right after the N input. The ZEO treatment in Pre-fertilization is similar to the CNT in Post-Fertilization (where twice the amount of fertilizer was applied with respect to the ZEO treatment), indicating that zeolite probably helped the soil to retain more N available to the plant during time. TN of soils (Figure 10C) revealed no variations due to the treatments or sampling time, and no other differences were highlighted neither for TN of leaves (Figure 10D) nor for the SL and BG sites. As for BG, also in BN a tendency for a higher N content of leaves was recorded although not significant from a statistical point of view.
In general, the results of N dynamics over the 3 years of monitoring in the 3 experimental sites indicate that notwithstanding 50% fewer N inputs, the soil N content was similar between CNT and ZEO. Given that no differences in N uptake by plants were observed, this evidence leads to the hypothesis that zeolite minerals helped to reduce N losses and promoted N storage in the soil, augmenting the fertilization efficiency.

3.2. Vegetative Measurements

The analysis of variance of the data collected in the BG field did not reveal any difference between the two treatments (Table 3), while some differences between ZEO and CNT were highlighted in both SL and BN fields. In the SL site, tree height, number and length of shoots were higher for Cv Montebudello and Farneto for ZEO treatment than for CNT (Table 4). The number of shoots was greater in the ZEO thesis for Cv Colombina, while other measurements exhibited no significant difference compared to CNT. The Cv. Capolga in the BN field showed no differences in the level of growth of the aerial part, while in the other two cultivars (Colombina and Correggiolo), a significantly greater development in the plants treated with natural zeolite-rich tuffs was observed, despite the reduced dose of fertilizer applied (Table 5).
The only field where no differences were observed between the two treatments is BG, the irrigated field. It is possible that the action of the zeolite, in addition to reducing N leaching and increasing the Nitrogen Use Efficiency (NUE), takes place at the water level (although no differences were observed by Δ13C), so in orchards without any water deficits, it is harder to account for differences in plant development.
These results are in agreement with those of Prisa (2020) [70], that found an increase in agronomic characteristics in plants of Ranunculus asiaticus treated with zeolites, and with Choo et al. (2020) [71] that found an increased number of fruits and greater fruit yield in papaya plants treated with zeolites.

3.3. Global Considerations

To evaluate the benefits of using zeolitite in olive growing, the general comparison of treatments year by year is presented in this chapter. pH, SOM and TC of soils are shown in Figure 11, while in Figure 12 each of the investigated N species is shown.
In all experimental fields, pH did not undergo any significant difference between CNT and ZEO treatments. A global trend towards an acidification of the soil from 2019 to 2021 can be however observed (Figure 11A), which can be a consequence of the leaching of exchangeable bases such as Mg2+, K+ and Ca2+ because of intense precipitation or irrigation practices. No significant differences were accounted between SOM and TC and they did not change in relation to different treatments and during time (Figure 11B,C). Although SOM and TC could be influenced by fertilization and irrigation practices, we did not observe any significant variation. At the same time, SOM, as well as TC, did not decrease over the 3 years of experimentation, proving that the use of zeolitite did not influence these parameters in soil but helps preserving SOM even with a reduced amount of nutrient inputs while maintaining or even improving the plant development.
The only difference that occurred in nitrogen species was linked to the time and to the type and amount of fertilizer applied to each field: (1) NO2-N showed a significant difference among years, with concentrations that increased from 2019 to 2021; (2) NO3-N in soil was significantly different during 3 years, with the lower values recorded in 2019 and the higher values recorded in 2020 and 2021; (3) TN in soil showed a very similar pattern to that of NO3-N with an increase after the first experimental year (2019) and (4) The TN of leaves was lower in 2020 (opposite trend to the NO3-N). For each N species, no differences were accounted for between CNT and ZEO treatments (notwithstanding the 50% reduction of fertilizers), as already demonstrated in detail for each experimental site.
TN of leaves strongly indicate that plants did not uptake more N in CNT than in ZEO treatment, although ZEO leaves showed a slight tendency in higher N uptake in 2020 and 2021 (not statistically significant), which can be caused by an augmented availability of N among the years.
Principal Component Analysis (PCA), which is often used to discriminate the groups of samples, reducing the dimensionality of the dataset without a large loss of information, was applied only to the data related to the ZEO and CNT treatments during the three years of the project.
PC1 and PC2 axes explained 48.59% of the total variance, divided into 30.61% of the First Principal Component (PC1) and 17.98% of the Second Principal Component (PC2). All the data showed a positive correlation in PC1, except Soil Organic Matter (SOM), Total Carbon (TC) and pH. Instead, in PC2 only Carbon Discrimination Factor (Δ13C) had a positive correlation, while all other parameters highlighted a negative correlation with PC2. This low value of total variance does not allow for distinguishing between the different treatments, thus further supporting the hypothesis that CNT and ZEO treatments were not different, notwithstanding the fertilizer input reduction of 50% in the ZEO treatment.
The similar N uptake recorded by the leaves in the three different experimental sites, as well as the tendency for a better development of plants grown on zeolite-amended soil, notwithstanding the 50% N input reduction, strongly suggest that in CNT treatment larger N losses occurred, leading to negative environmental and economic effects. On the other hand, the presence of zeolitite in the soil maintained the nutrient for a longer time contributing to a healthier condition for plants and yield production.
It is well known that zeolitite as a soil amendment reduces N leaching and increases Nitrogen Use Efficiency (NUE) and crop yield [72]. Since the addition of zeolitite probably influenced several pathways of N losses, it also allowed a more sustainable use of N fertilizers. Furthermore, the N in the topsoil is strongly related to agricultural practices and is influenced by the amount and form of the fertilizers used. This N can be easily lost by leaching, NH3 volatilization and other N gas losses. Chemical fertilizers, such as urea, can lose even more than 30% of the applied N as NH3 in the few hours after the spreading, if the conditions for volatilization are met [8]. Ferretti et al. (2017) found evidence of a higher FUE in zeolitite-amended soil after performing an isotopic tracing in the soil-plant system. In another study, it was demonstrated that in similar conditions, NH3 emissions can be reduced up to 60% using the same type of zeolitite used in this work [26]. Consequently, the application of zeolitite to soil can be the key to reducing N losses in the environment, allowing a significant reduction in fertilizer N inputs (50%), maintaining or even increasing the vegetative development.
The mechanism through which zeolitite is able to maintain the nutrients in the soil for longer periods of time is, however, still a matter of debate. Ferretti et al. (2021) employed the 15N pool dilution technique to measure gross N transformation rates in zeolitite-amended soil and found no evidence of increased ammonification in soil treated with natural zeolites in the short-term. Thus, the efficiency of zeolitites (at natural state) cannot be explained by an increased production of new mineral N from organic matter decomposition. However, from the same study emerges a slight “delay” effect on gross nitrification. Apparently, in zeolitite-amended soil, the ammonium is more slowly converted into nitrate. Thus, the mechanism that might be responsible for the improved NUE in the treated soil is the perturbation of various abiotic parameters after the addition of zeolite minerals (CEC, water retention) that is reflected in different biotic processes in the short-term, probably altering the quantity of N available for plant uptake. In another short-term incubation study at laboratory scale, it was observed that the exchange of N between minerals and the surrounding environment is very fast. Thus, N is accessible to microbial biomass in the short-term but only mild effects on the microbial community (fungal/bacterial ratio) and on N transformation rates were observed [73]. Thus, it is likely that the zeolites reduce the N mobility in the short-term and delay the transformation of ammonium into nitrate, resulting in “more time” for plants to uptake N and, by consequence, in a lower demand for N fertilizers and N losses.

4. Conclusions

Thanks to a 3-year experiment conducted in three sites within the Emilia-Romagna region, the efficiency of zeolite minerals in reducing the fertilizer N input up to 50% in olive growing was demonstrated.
N dynamics and all the observed variables were influenced by the fertilizer management (type, amount and timing of application), time, soil texture and irrigation.
However, no differences were observed owing to the different treatments (ZEO and CNT), neither in the detail of each experimental site nor from the general point of view, although in ZEO the fertilization had been reduced by 50%.
The vegetative measurements highlighted a greater development of the olive aerial parts in ZEO treatments compared to CNT. The vegetative measurements conducted in the first year indicate that the plants treated with zeolitite, despite the 50% reduction in fertilizers, have developed similarly to the CNT. In the two rainfed orchards (SL and BN), the ZEO-treated olive plants were characterized by a greater canopy development. Further studies are under way to evaluate the effects, in the long term, of the una tantum zeolitite addition as well as the influence on the fruit development and the chemical and sensorial quality of the oils.
In conclusion, the use of this specific Italian chabazite zeolitite in olive growing can allow a significant reduction in fertilizer N input, reducing the N losses and improving the plant’s physiological status, with meaningful benefits under agronomic, environmental, economic and health aspects. It is indeed very important to specify that the effects of these minerals in the soil are long-lasting due to their long-term structural stability at an ambient temperature and pressure. Moreover, the reduction in the application of N fertilizers can be performed repeatedly over the years, with significant economic and environmental benefits which last forever.

Supplementary Materials

The following supporting information can be downloaded at https://www.mdpi.com/article/10.3390/land11091471/s1, Table S1: Supplementary Material 1.

Author Contributions

Conceptualization, V.M. and G.F.; methodology, V.M., G.F. and A.R.; formal analysis, V.M., G.G., L.M. and A.R.; field sampling, G.F., G.G., L.M. and A.R.; investigation, V.M.; resources, B.F. and M.C.; data curation, V.M.; writing-original draft preparation, V.M.; writing-review and editing, G.F. and M.C.; visualization, V.M.; supervision, G.F. and M.C.; project administration, M.C.; funding acquisition, M.C. All authors have read and agreed to the published version of the manuscript.

Funding

This research was funded by the ZeOliva project financed by the Italian Ministry of Agricultural, Food, and Forestry Policies (MIPAAF, Project CUP: F76C19000070001).

Institutional Review Board Statement

Not applicable.

Informed Consent Statement

Not applicable.

Data Availability Statement

All the data are available within the manuscript and supplementary materials.

Acknowledgments

We gratefully thank the “Azienda Agricola Bonazza”, “Azienda Agricola Giorgia” and “Azienda Agricola Tenute Unite” for the land concession for the experiment. The authors are also grateful to Umberto Tessari for the textural analyses, Matteo Alberghini and Luca Adami for their help during laboratory procedures.

Conflicts of Interest

The authors declare no conflict of interest.

References

  1. Mustafa, A.; Hu, X.; Shah, S.A.A.; Abrar, M.M.; Maitlo, A.A.; Kubar, K.A.; Saeed, Q.; Kamran, M.; Naveed, M.; Boren, W.; et al. Long-term fertilization alters chemical composition and stability of aggregate-associated organic carbon in a Chinese red soil: Evidence from aggregate fractionation, C mineralization, and 13C NMR analyses. J. Soils Sediments 2021, 21, 2483–2496. [Google Scholar] [CrossRef]
  2. Drechsel, P.; Heffer, P.; Magen, H.; Mikkelsen, R.; Wichelns, D. Managing Water and Fertilizer for Sustainable Agricultural Intensification; IFA, IWMI, IPNI and IPI: Paris, France, 2015; ISBN 979-10-92366-02-0. [Google Scholar]
  3. Basso, B.; Dumont, B.; Cammarano, D.; Pezzuolo, A.; Marinello, F.; Sartori, L. Environmental and economic benefits of variable rate nitrogen fertilization in a nitrate vulnerable zone. Sci. Total Environ. 2016, 545, 227–235. [Google Scholar] [CrossRef] [PubMed]
  4. Peng, S.; Buresh, R.J.; Huang, J.; Yang, J.; Zou, Y.; Zhong, X.; Wang, G.; Zhang, F. Strategies for overcoming low agronomic nitrogen use efficiency in irrigated rice systems in China. Field Crop. Res. 2006, 96, 37–47. [Google Scholar] [CrossRef]
  5. Dawson, J.C.; Huggins, D.R.; Jones, S.S. Characterizing nitrogen use efficiency in natural and agricultural ecosystems to improve the performance of cereal crops in low-input and organic agricultural systems. Field Crop. Res. 2008, 107, 89–101. [Google Scholar] [CrossRef]
  6. Chien, S.H.; Teixeira, L.A.; Cantarella, H.; Rehm, G.W.; Grant, C.A.; Gearhart, M.M. Agronomic Effectiveness of Granular Nitrogen/Phosphorus Fertilizers Containing Elemental Sulfur with and without Ammonium Sulfate: A Review. Agron. J. 2016, 108, 1203–1213. [Google Scholar] [CrossRef]
  7. Ferretti, G.; Keiblinger, K.M.; Zimmermann, M.; Di Giuseppe, D.; Faccini, B.; Colombani, N.; Mentler, A.; Zechmeister-Boltenstern, S.; Coltorti, M.; Mastrocicco, M. High resolution short-term investigation of soil CO2, N2O, NOx and NH3 emissions after different chabazite zeolite amendments. Appl. Soil Ecol. 2017, 119, 138–144. [Google Scholar] [CrossRef]
  8. Soares, J.R.; Cantarella, H.; de Campos Menegale, M.L. Ammonia volatilization losses from surface-applied urea with urease and nitrification inhibitors. Soil Biol. Biochem. 2012, 52, 82–89. [Google Scholar] [CrossRef]
  9. Sharma, L.K.; Bali, S.K. A review of methods to improve nitrogen use efficiency in agriculture. Sustainability 2017, 10, 58. [Google Scholar] [CrossRef]
  10. Cataldo, E.; Salvi, L.; Paoli, F.; Fucile, M.; Masciandaro, G.; Manzi, D.; Masini, C.M.; Mattii, G.B. Application of Zeolites in Agriculture and Other Potential Uses: A Review. Agronomy 2021, 11, 1547. [Google Scholar] [CrossRef]
  11. Shi, L.; Liu, L.; Yang, B.; Sheng, G.; Xu, T. Evaluation of Industrial Urea Energy Consumption (EC) Based on Life Cycle Assessment (LCA). Sustainability 2020, 12, 3793. [Google Scholar] [CrossRef]
  12. Bremmer, J.; Gonzalez-Martinez, A.; Jongeneel, R.; Huiting, H.; Stokkers, R.; Ruijs, M. Impact Assessment of EC 2030 Green Deal Targets for Sustainable Crop Production; 2021; ISBN 9789464470413. [Google Scholar]
  13. Reháková, M.; Čuvanová, S.; Dzivák, M.; Rimár, J.; Gaval’Ová, Z. Agricultural and agrochemical uses of natural zeolite of the clinoptilolite type. Curr. Opin. Solid State Mater. Sci. 2004, 8, 397–404. [Google Scholar] [CrossRef]
  14. Ferretti, G.; Galamini, G.; Medoro, V.; Coltorti, M.; Giuseppe, D.D.; Faccini, B. Impact of sequential treatments with natural and na-exchanged chabazite zeolite-rich tuff on pig-slurry chemical composition. Water 2020, 12, 310. [Google Scholar] [CrossRef]
  15. Rotondi, A.; Morrone, L.; Facini, O.; Faccini, B.; Ferretti, G.; Coltorti, M. Distinct particle films impacts on olive leaf optical properties and plant physiology. Foods 2021, 10, 1291. [Google Scholar] [CrossRef] [PubMed]
  16. Eroglu, N.; Emekci, M.; Athanassiou, C.G. Applications of natural zeolites on agriculture and food production. J. Sci. Food Agric. 2017, 97, 3487–3499. [Google Scholar] [CrossRef] [PubMed]
  17. Kesraoui-Ouki, S.; Cheeseman, C.R.; Perry, R. Natural zeolite utilisation in pollution control: A review of applications to metals’ effluents. J. Chem. Technol. Biotechnol. 1994, 59, 121–126. [Google Scholar] [CrossRef]
  18. Colombani, N.; Di Giuseppe, D.; Faccini, B.; Ferretti, G.; Mastrocicco, M.; Coltorti, M. Estimated Water Savings in an Agricultural Field Amended With Natural Zeolites. Environ. Process. 2016, 3, 617–628. [Google Scholar] [CrossRef]
  19. Perez-Caballero, R.; Gil, J.; Benitez, C.; Gonzalez, J.L. The effect of adding zeolite to soils in order to improve the N-K nutrition of olive trees. Preliminary results. Am. J. Agric. Biol. Sci. 2008, 3, 321–324. [Google Scholar] [CrossRef]
  20. Passaglia, E. Zeoliti Naturali, Zeolititi e Loro Applicazioni; Arvan: Gardena, CA, USA, 2008; ISBN 9788887801194. [Google Scholar]
  21. Colombani, N.; Mastrocicco, M.; Giambastiani, B.M.S. Predicting Salinization Trends in a Lowland Coastal Aquifer: Comacchio (Italy). Water Resour. Manag. 2015, 29, 603–618. [Google Scholar] [CrossRef]
  22. Gholamhoseini, M.; Ghalavand, A.; Khodaei-Joghan, A.; Dolatabadian, A.; Zakikhani, H.; Farmanbar, E. Zeolite-amended cattle manure effects on sunflower yield, seed quality, water use efficiency and nutrient leaching. Soil Tillage Res. 2013, 126, 193–202. [Google Scholar] [CrossRef]
  23. Nakhli, S.A.A.; Delkash, M.; Bakhshayesh, B.E.; Kazemian, H. Application of Zeolites for Sustainable Agriculture: A Review on Water and Nutrient Retention. Water Air Soil Pollut. 2017, 228, 464. [Google Scholar] [CrossRef]
  24. Mirzaei Aminiyan, M.; Safari Sinegani, A.A.; Sheklabadi, M. Aggregation stability and organic carbon fraction in a soil amended with some plant residues, nanozeolite, and natural zeolite. Int. J. Recycl. Org. Waste Agric. 2015, 4, 11–22. [Google Scholar] [CrossRef]
  25. Eslami, M.; Khorassani, R.; Coltorti, M.; Malferrari, D.; Faccini, B.; Ferretti, G.; Di Giuseppe, D.; Fotovat, A.; Halajnia, A. Leaching behaviour of a sandy soil amended with natural and NH4+ and K+ saturated clinoptilolite and chabazite. Arch. Agron. Soil Sci. 2017, 64, 1142–1151. [Google Scholar] [CrossRef]
  26. Ferretti, G.; Di Giuseppe, D.; Natali, C.; Faccini, B.; Bianchini, G.; Coltorti, M. C-N elemental and isotopic investigation in agricultural soils: Insights on the effects of zeolitite amendments. Chem. Der Erde 2017, 77, 45–52. [Google Scholar] [CrossRef]
  27. Tsintskaladze, G.; Eprikashvili, L.; Mumladze, N.; Gabunia, V.; Sharashenidze, T.; Zautashvili, M.; Kordzakhia, T.; Shatakishvili, T. Nitrogenous zeolite nanomaterial and the possibility of its application in agriculture. Ann. Agrar. Sci. 2017, 15, 365–369. [Google Scholar] [CrossRef]
  28. Manjaiah, K.M.; Mukhopadhyay, R.; Paul, R.; Datta, S.C.; Kumararaja, P.; Sarkar, B. Clay minerals and zeolites for environmentally sustainable agriculture. Modif. Clay Zeolite Nanocompos. Mater. Environ. Pharm. Appl. 2019, 309–329. [Google Scholar] [CrossRef]
  29. Milosevic, T.; Milosevic, N. The effect of zeolite, organic and inorganic fertilizers on soil chemical properties, growth and biomass yield of apple trees. Plant Soil Environ. 2009, 55, 528–535. [Google Scholar] [CrossRef]
  30. Ferretti, G.; Faccini, B.; Antisari, L.V.; Di Giuseppe, D.; Coltorti, M. 15N natural abundance, nitrogen and carbon pools in soil-sorghum system amended with natural and NH4+-enriched zeolitites. Appl. Sci. 2019, 9, 4524. [Google Scholar] [CrossRef]
  31. Faccini, B.; Di Giuseppe, D.; Ferretti, G.; Coltorti, M.; Colombani, N.; Mastrocicco, M. Natural and NH4+-enriched zeolitite amendment effects on nitrate leaching from a reclaimed agricultural soil (Ferrara Province, Italy). Nutr. Cycl. Agroecosyst. 2018, 110, 327–341. [Google Scholar] [CrossRef]
  32. Hazrati, S.; Tahmasebi-Sarvestani, Z.; Mokhtassi-Bidgoli, A.; Modarres-Sanavy, S.A.M.; Mohammadi, H.; Nicola, S. Effects of zeolite and water stress on growth, yield and chemical compositions of Aloe vera L. Agric. Water Manag. 2017, 181, 66–72. [Google Scholar] [CrossRef]
  33. Ozbahce, A.; Tari, A.F.; Gönülal, E.; Simsekli, N.; Padem, H. The effect of zeolite applications on yield components and nutrient uptake of common bean under water stress. Arch. Agron. Soil Sci. 2014, 61, 615–626. [Google Scholar] [CrossRef]
  34. El-Sherpiny, M.; Baddour, A.G.; El-Kafrawy, M.M. Effect of Zeolite Soil addition under Different Irrigation Intervals on Maize Yield (zea mays L.) and some Soil Properties. J. Soil Sci. Agric. Eng. 2020, 11, 793–799. [Google Scholar] [CrossRef]
  35. Rodrigues, M.; Torres, L.D.N.D.; Damo, L.; Raimundo, S.; Sartor, L.; Cassol, L.C.; Arrobas, M. Nitrogen Use Efficiency and Crop Yield in Four Successive Crops Following Application of Biochar and Zeolites. J. Soil Sci. Plant Nutr. 2021, 21, 1053–1065. [Google Scholar] [CrossRef]
  36. Minardi, S.; Haniati, I.L.; Nastiti, A.H.L. Adding manure and zeolite to improve soil chemical properties and increase soybean yield. SainsTanah-J. Soil Sci. Agroclimatol. 2020, 17, 1. [Google Scholar] [CrossRef]
  37. Sun, Y.; Xia, G.; He, Z.; Wu, Q.; Zheng, J.; Li, Y.; Wang, Y.; Chen, T.; Chi, D. Zeolite amendment coupled with alternate wetting and drying to reduce nitrogen loss and enhance rice production. Field Crop. Res. 2019, 235, 95–103. [Google Scholar] [CrossRef]
  38. Ferreira, I.Q.; Arrobas, M.; Moutinho-Pereira, J.M.; Correia, C.M.; Rodrigues, M.Â. The effect of nitrogen applications on the growth of young olive trees and nitrogen use efficiency. Turk. J. Agric. For. 2020, 44, 278–289. [Google Scholar] [CrossRef]
  39. Fernández-Escobar, R.; Benlloch, M.; Herrera, E.; García-Novelo, J.M. Effect of traditional and slow-release N fertilizers on growth of olive nursery plants and N losses by leaching. Sci. Hortic. 2004, 101, 39–49. [Google Scholar] [CrossRef]
  40. Fernández-Escobar, R. Use and abuse of nitrogen in olive fertilization. Acta Hortic. 2011, 888, 249–257. [Google Scholar] [CrossRef]
  41. Othman, Y.A.; Leskovar, D. Nitrogen management influenced root length intensity of young olive trees. Sci. Hortic. 2019, 246, 726–733. [Google Scholar] [CrossRef]
  42. Fernández-Escobar, R.; García-Novelo, J.M.; Molina-Soria, C.; Parra, M.A. An approach to nitrogen balance in olive orchards. Sci. Hortic. 2012, 135, 219–226. [Google Scholar] [CrossRef]
  43. Lopes, J.I.; Arrobas, M.; Brito, C.; Gonçalves, A.; Silva, E.; Martins, S.; Raimundo, S.; Rodrigues, M.Â.; Correia, C.M. Mycorrhizal Fungi were More Effective than Zeolites in Increasing the Growth of Non-Irrigated Young Olive Trees. Sustainability 2020, 12, 10630. [Google Scholar] [CrossRef]
  44. Ferretti, G.; Keiblinger, K.M.; Faccini, B.; Di Giuseppe, D.; Mentler, A.; Zechmeister-Boltenstern, S.; Coltorti, M. Effects of Different Chabazite Zeolite Amendments to Sorption of Nitrification Inhibitor 3,4-Dimethylpyrazole Phosphate (DMPP) in Soil. J. Soil Sci. Plant Nutr. 2020, 20, 973–978. [Google Scholar] [CrossRef]
  45. Galamini, G.; Ferretti, G.; Medoro, V.; Tescaro, N.; Faccini, B.; Coltorti, M. Isotherms, Kinetics, and Thermodynamics of NH4+ Adsorption in Raw Liquid Manure by Using Natural Chabazite Zeolite-Rich Tuff. Water 2020, 12, 2944. [Google Scholar] [CrossRef]
  46. Stamatakis, M.G.; Stamataki, I.S.; Giannatou, S.; Vasilatos, C.; Drakou, F.; Mitsis, I.; Xinou, K. Characterization and evaluation of chabazite- and mordenite-rich tuffs, and their mixtures as soil amendments and slow release fertilizers. Arch. Agron. Soil Sci. 2016, 63, 735–747. [Google Scholar] [CrossRef]
  47. Malferrari, D.; Laurora, A.; Brigatti, M.F.; Coltorti, M.; Di Giuseppe, D.; Faccini, B.; Passaglia, E.; Vezzalini, M.G. Open-field experimentation of an innovative and integrated zeolitite cycle: Project definition and material characterization. Rend. Lincei 2013, 24, 141–150. [Google Scholar] [CrossRef]
  48. GeoViewer—Geoportale. Available online: https://geoportale.regione.emilia-romagna.it/mappe/geo-viewer?layer_id=0f536ddad2c442d293b6afa0119edde5 (accessed on 22 August 2022).
  49. World Reference Base.|FAO SOILS PORTAL|Food and Agriculture Organization of the United Nations. Available online: https://www.fao.org/soils-portal/data-hub/soil-classification/world-reference-base/en/ (accessed on 16 August 2022).
  50. Tarocco, A.; Aprea, A. Carta dei Suoli Della Regione Emilia-Romagna; Regione Emilia-Romagna: Bologna, Italy, 2021. [Google Scholar]
  51. Pavan, V.; Marletto, V. Rapporto IdroMeteoClima Emilia-Romagna. Dati 2019; Osservatorio Clima di ARPAE: Rimini, Italy, 2020. [Google Scholar]
  52. Pavan, V. Rapporto IdroMeteoClima Emilia-Romagna. Dati 2020; Osservatorio Clima di ARPAE: Rimini, Italy, 2021. [Google Scholar]
  53. Pavan, V. Rapporto IdroMeteoClima Emilia-Romagna. Dati 2021; Osservatorio Clima di ARPAE: Rimini, Italy, 2022. [Google Scholar]
  54. Di Giuseppe, D.; Faccini, B.; Mastrocicco, M.; Colombani, N.; Coltorti, M. Reclamation influence and background geochemistry of neutral saline soils in the Po River Delta Plain (Northern Italy). Environ. Earth Sci. 2014, 72, 2457–2473. [Google Scholar] [CrossRef]
  55. Wickham, H. Ggplot2: Elegant Graphics for Data Analysis; Springer International Publishing: Berlin/Heidelberg, Germany, 2016. [Google Scholar]
  56. De Mendiburu, F. Agricolae: Statistical Procedures for Agricultural Research. R Package Version 1.2-0. 2016. Available online: http://CRAN.R-project.org/package=agricolae (accessed on 11 April 2022).
  57. Schloerke, B.; Cook, D.; Larmarange, J.; Briatte, F.; Marbach, M.; Thoen, E.; Elberg, A.; Toomet, O.; Crowley, J.; Hofmann, H.; et al. GGally: Extension to Ggplot2 2021. Available online: https://CRAN.R-project.org/package=Ggally (accessed on 11 April 2022).
  58. Vincent, Q. Vu Ggbiplot: A Ggplot2 Based Biplot 2011. Available online: http://github.com/vqv/ggbiplot (accessed on 11 April 2022).
  59. Horikoshi, M.; Ggfortify, Y.T. Data Visualization Tools for Statistical Analysis Results; 2016; Available online: https://CRAN.R-project.org/package=ggfortify (accessed on 11 April 2022).
  60. Eldor, A.P. Soil Microbiology, Ecology, and Biochemistry; Academic Press: Burlington, NJ, USA, 2007; ISBN 9780125468077. [Google Scholar]
  61. Bateman, A.S.; Kelly, S.D. Fertilizer nitrogen isotope signatures. Isot. Environ. Health Stud. 2007, 43, 237–247. [Google Scholar] [CrossRef]
  62. Shan, Y.; Huang, M.; Suo, L.; Zhao, X.; Wu, L. Composition and variation of soil δ15N stable isotope in natural ecosystems. CATENA 2019, 183, 104236. [Google Scholar] [CrossRef]
  63. Amundson, R.; Austin, A.T.; Schuur, E.A.G.; Yoo, K.; Matzek, V.; Kendall, C.; Uebersax, A.; Brenner, D.; Baisden, W.T. Global patterns of the isotopic composition of soil and plant nitrogen. Glob. Biogeochem. Cycles 2003, 17, 1031. [Google Scholar] [CrossRef]
  64. Farquhar, G.D.; Ehleringer, J.R.; Hubick, K.T. Carbon Isotope Discrimination and Photosynthesis. Annu. Rev. Plant Physiol. Plant Mol. Biol. 1989, 40, 503–537. [Google Scholar] [CrossRef]
  65. Riehl, S.; Pustovoytov, K.E.; Weippert, H.; Klett, S.; Hole, F. Drought stress variability in ancient Near Eastern agricultural systems evidenced by δ13C in barley grain. Proc. Natl. Acad. Sci. USA 2014, 111, 12348–12353. [Google Scholar] [CrossRef] [Green Version]
  66. Busch, F.A.; Holloway-Phillips, M.; Stuart-Williams, H.; Farquhar, G.D. Revisiting carbon isotope discrimination in C3 plants shows respiration rules when photosynthesis is low. Nat. Plants 2020, 6, 245–258. [Google Scholar] [CrossRef] [PubMed]
  67. Kumar, S.; Singh, B. Effect of water stress on carbon isotope discrimination and Rubisco activity in bread and durum wheat genotypes. Physiol. Mol. Biol. Plants 2009, 15, 281–286. [Google Scholar] [CrossRef]
  68. Jakkula, V.; Zeolites, W.S.P. Potential Soil Amendments for Improving Nutrient and Water Use Efficiency and Agriculture Productivity. Available online: https://www.researchgate.net/publication/325544295_Zeolites_Potential_soil_amendments_for_improving_nutrient_and_water_use_efficiency_and_agriculture_productivity (accessed on 11 April 2022).
  69. Hatfield, J.L.; Follet, R.F. Nitrogen in the Environment; The Scientific World Journal: London, UK, 2018; ISBN 9780333227794. [Google Scholar]
  70. Prisa, D. Optimised fertilisation with zeolitites containing Plant Growth Promoting Rhizobacteria (PGPR) in Ranunculus asiaticus. GSC Biol. Pharm. Sci. 2020, 10, 096–102. [Google Scholar] [CrossRef]
  71. Choo, L.N.L.K.; Ahmed, O.H.; Talib, S.A.A.; Ghani, M.Z.A.; Sekot, S. Clinoptilolite zeolite on tropical peat soils nutrient, growth, fruit quality, and yield of Carica papaya L. CV. sekaki. Agronomy 2020, 10, 1320. [Google Scholar] [CrossRef]
  72. Sepaskhah, A.R.; Barzegar, M. Yield, water and nitrogen-use response of rice to zeolite and nitrogen fertilization in a semi-arid environment. Agric. Water Manag. 2010, 98, 38–44. [Google Scholar] [CrossRef]
  73. Ferretti, G.; Galamini, G.; Deltedesco, E.; Gorfer, M.; Fritz, J.; Faccini, B.; Mentler, A.; Zechmeister-Boltenstern, S.; Coltorti, M.; Keiblinger, K.M. Gross Ammonification and Nitrification Rates in Soil Amended with Natural and NH4-Enriched Chabazite Zeolite and Nitrification Inhibitor DMPP. Appl. Sci. 2021, 11, 2605. [Google Scholar] [CrossRef]
Figure 1. Geographical location of San Lazzaro (SL), Brisighella (BG) and Bertinoro (BN) experimental fields in Emilia-Romagna Region (Italy).
Land 11 01471 g001
Figure 2. Experimental set-up of the experimental site of San Lazzaro (SL), Brisighella (BG) and Bertinoro (BN). At each site ZEO and CNT treatments were tested. Samples were sampled three times per year (Pre-Fertilization, Post-Fertilization and Harvest).
Land 11 01471 g002
Figure 3. Particle size analysis and textural classification (USDA) of the soil samples from SL, BG and BN experimental fields.
Land 11 01471 g003
Figure 4. Box-plot of SO42− (A), PO43− (B) content of soil samples. The graphs are divided by experimental site (BG, BN, SL) and treatment (CNT and ZEO). Box-plot of SO42− (C), PO43− (D) content of soil samples from SL site. The graphs are divided by sampling (Pre-Fert, Post-Fert and Harvest) and Treatment (ZEO and CNT). (A,B): The graphs are constructed considering a 3-year average based on 27 samples per treatment at each site. (C,D): The graphs are constructed considering the site specific 3-year average (9 observations at each sampling time per each treatment, 54 total observations). Different letters represent significant differences (p < 0.05) as a result of ANOVA and Tukey (HSD) tests.
Land 11 01471 g004
Figure 5. Box-plot of δ15N (A) of soil samples of the three sites. The graph is divided by the experimental site (BG, BN, SL) and treatment. Boxplots of δ15N of San Lazzaro (SL) (B), Brisighella (BG) (C) and Bertinoro (BN) (D). The graphs are divided by agronomic season (Pre-Fert, Post-Fert and Harvest) and treatment (CNT and ZEO). (A): the graph is constructed considering a 3-year average based on 27 samples per treatment at each site. (BD): the graphs are constructed considering the site specific 3-year average (9 observations at each sampling time per each treatment, 54 total observations). Different letters represent significant differences (p < 0.05) as a result of ANOVA and Tukey (HSD) tests.
Land 11 01471 g005
Figure 6. Box-plot of Total Carbon (TC) of soil samples in San Lazzaro (SL), Brisighella (BG) and Bertinoro (BN). The graphs are divided by treatment (CNT and ZEO). Data are the results of 3 years of experiment: For each year, 3 samplings with 3 replicates per treatment were sampled (54 samples per each site, divided in 27 samples per treatment). Different letters represent significant differences (p < 0.05) as a result of ANOVA and Tukey (HSD) tests.
Land 11 01471 g006
Figure 7. Box-plot of Δ13C of leaves divided by area and treatment. The figure is constructed considering a 3-year average based on 27 samples per treatment at each site. Different letters represent significant differences (p < 0.05) as a result of ANOVA and Tukey (HSD) tests.
Land 11 01471 g007
Figure 8. Box-plot of NO2-N (A), NO3-N (B) content of soil samples, Total Nitrogen (TN) of soils (C) and leaves (D) in San Lazzaro field (SL). Graphs consider the site specific 3-year average (9 observations at each sampling time per each treatment, 54 total observations). Different letters represent significant differences (p < 0.05) as a result of ANOVA and Tukey (HSD) tests.
Land 11 01471 g008
Figure 9. Box-plot of NO2-N (A) and NO3-N (B) content of soil samples, Total Nitrogen (TN) of soils (C) and leaves (D) in Brisighella field (BG). The graphs are constructed considering the site specific 3-year average (9 observations at each sampling time per each treatment, 54 total observations). Different letters represent significant differences (p < 0.05) as a result of ANOVA and Tukey (HSD) tests.
Land 11 01471 g009
Figure 10. Box-plot of NO2-N (A) and NO3-N (B) content of soil samples, Total Nitrogen (TN) of soils (C) and leaves (D) in Bertinoro field (BN). The graphs are constructed considering the site specific 3-year average (9 observations at each sampling time per each treatment, 54 total observations). Different letters represent significant differences (p < 0.05) as a result of ANOVA and Tukey (HSD) tests.
Land 11 01471 g010
Figure 11. pH, Soil Organic Matter (SOM) and Total Carbon (TC) are shown for the three years of the project. Data are divided by year (2019, 2020 and 2021) and treatment (with zeolite and control for (A) pH, (B) Soil Organic Matter (SOM) and (C) Total Carbon (TC). The graphs are constructed considering the year specific average for all three sites (27 observations at each year per each treatment, 54 total observations per year). Different letters represent significant differences (p < 0.05) as a result of ANOVA and Tukey (HSD) tests.
Land 11 01471 g011
Figure 12. Box-plot of NO2-N (A) and NO3-N (B) content of soil samples, Total Nitrogen (TN) of soils (C) and leaves (D) divided by years and treatment. The graphs are constructed considering the year specific average for all three sites (27 observations at each year per each treatment, 54 total observations per year). Different letters represent significant differences (p < 0.05) as a result of ANOVA and Tukey (HSD) tests.
Land 11 01471 g012
Table 1. Apparent density (DA), water retention (WR) and cation exchange capacity (CEC) of the zeolitite used in the project; Quantitative Phase Analysis of the zeolitite. TZC refers to “total zeolitic content”, i.e., the total content of zeolite minerals (chabazite, phillipsite and analcime). Data from Malferrari et al. (2013) [47].
Phase%St.dev
DA (g cm−3)0.56chabazite68.50.9
HR (%)34.2phillipsite1.80.4
analcime0.60.3
CEC (meq g−1) TZC70.9
Ca2+1.46mica5.30.6
Mg2+0.04K-feldspar9.70.7
Na+0.07plagioclase-
K+0.6pyroxene2.90.4
Total2.17calcite-
volcanic glass 11.21.0
Table 2. pH and Soil Organic matter (SOM) at each site (San Lazzaro, SL; Brisighella, BG; Bertinoro, BN). Data are divided by time of sampling (Pre-Fertilization, Post-Fertilization and Harvest) and treatment (ZEO and CNT). Average values represent a 3-year average (3 replicate/treatment per sampling, 3 sampling per year, 54 samples in total per site). Means in the same column followed by different letters are significantly different (p < 0.05) as a result of ANOVA and Tukey (HSD) tests. The complete dataset is shown in Supplementary Material Table S1.
SLBGBN
pHSOM (%)pHSOM (%)pHSOM (%)
Pre-FertCNT8.01°±0.093.59°±1.128.83°±0.294.76ab±1.328.84°±1.216.44b±0.03
ZEO7.93°±0.374.04°±0.488.77°±0.225.51ab±2.048.86°±1.246.30b±0.33
Post-FertCNT7.71°±0.435.05b±0.808.66b±0.195.26b±0.308.65°±0.926.97°±0.38
ZEO8.27°±0.553.18b±2.728.67b±0.085.22b±0.948.45°±0.967.64°±0.63
HarvestCNT7.56°±0.243.21c±0.628.77ab±0.055.91°±0.518.47°±1.115.35b±2.37
ZEO7.56°±0.483.02c±0.518.84ab±0.136.16°±0.258.43°±1.094.79b±3.32
Table 3. Vegetative measurements of olive trees grown on soil treated with natural zeolite rich tuffs (ZEO) versus plants grown on unamended soil (CNT). Data are expressed as a mean of 15 replicates per thesis.
Tree Height (cm)Number of
Branches
Average
Branches Length (cm)
∑ Branches Length (cm)
Cv. Nostrana di Brisighella ZEO141.4863.3930.631918.05
CNT134.0951.7830.091597.65
Table 4. Vegetative measurements of olive trees grown on soil treated with natural zeolite rich tuffs (ZEO) versus plants grown on unamended soil (CNT). Data are expressed as a mean of 15 replicates per thesis. The bold font indicates statistically significant differences between the groups (p < 0.05).
Tree Height (cm)Number of Branches Average Branches Length (cm) ∑ Branches
Length (cm)
Cv. MontebudelloZEO121.1449.8624.711193.14
CNT92.0020.0022.39441.86
Cv. FarnetoZEO114.3169.6922.751592.50
CNT84.5444.3820.37972.15
Cv. MontecapraZEO104.5062.6322.711368.38
CNT99.2947.0021.551060.50
Table 5. Vegetative measurements of olive trees grown on soil treated with natural zeolite rich tuffs (ZEO) versus plants grown on unamended soil (CNT). Data are expressed as a mean of 15 replicates per thesis. The bold font indicates statistically significant differences between the groups (p < 0.05).
Tree Height
(cm)
Number of BranchesAverage
Branches Length (cm)
∑ Branches
Length (cm)
Cv. CapolgaZEO8620.7614.65392.18
CNT83.118.9513.92347.18
Cv. ColombinaZEO74.8810.5315.63233.82
CNT63.776.4611.33141.58
Cv. CorreggioloZEO102.389.2521.04291.38
CNT80.437.7915.76204.39
Publisher’s Note: MDPI stays neutral with regard to jurisdictional claims in published maps and institutional affiliations.

