
Exploring the Spillover Effects of Urban Renewal on Local House Prices Using Multi-Source Data and Machine Learning: The Case of Shenzhen, China


Abstract
:1. Introduction
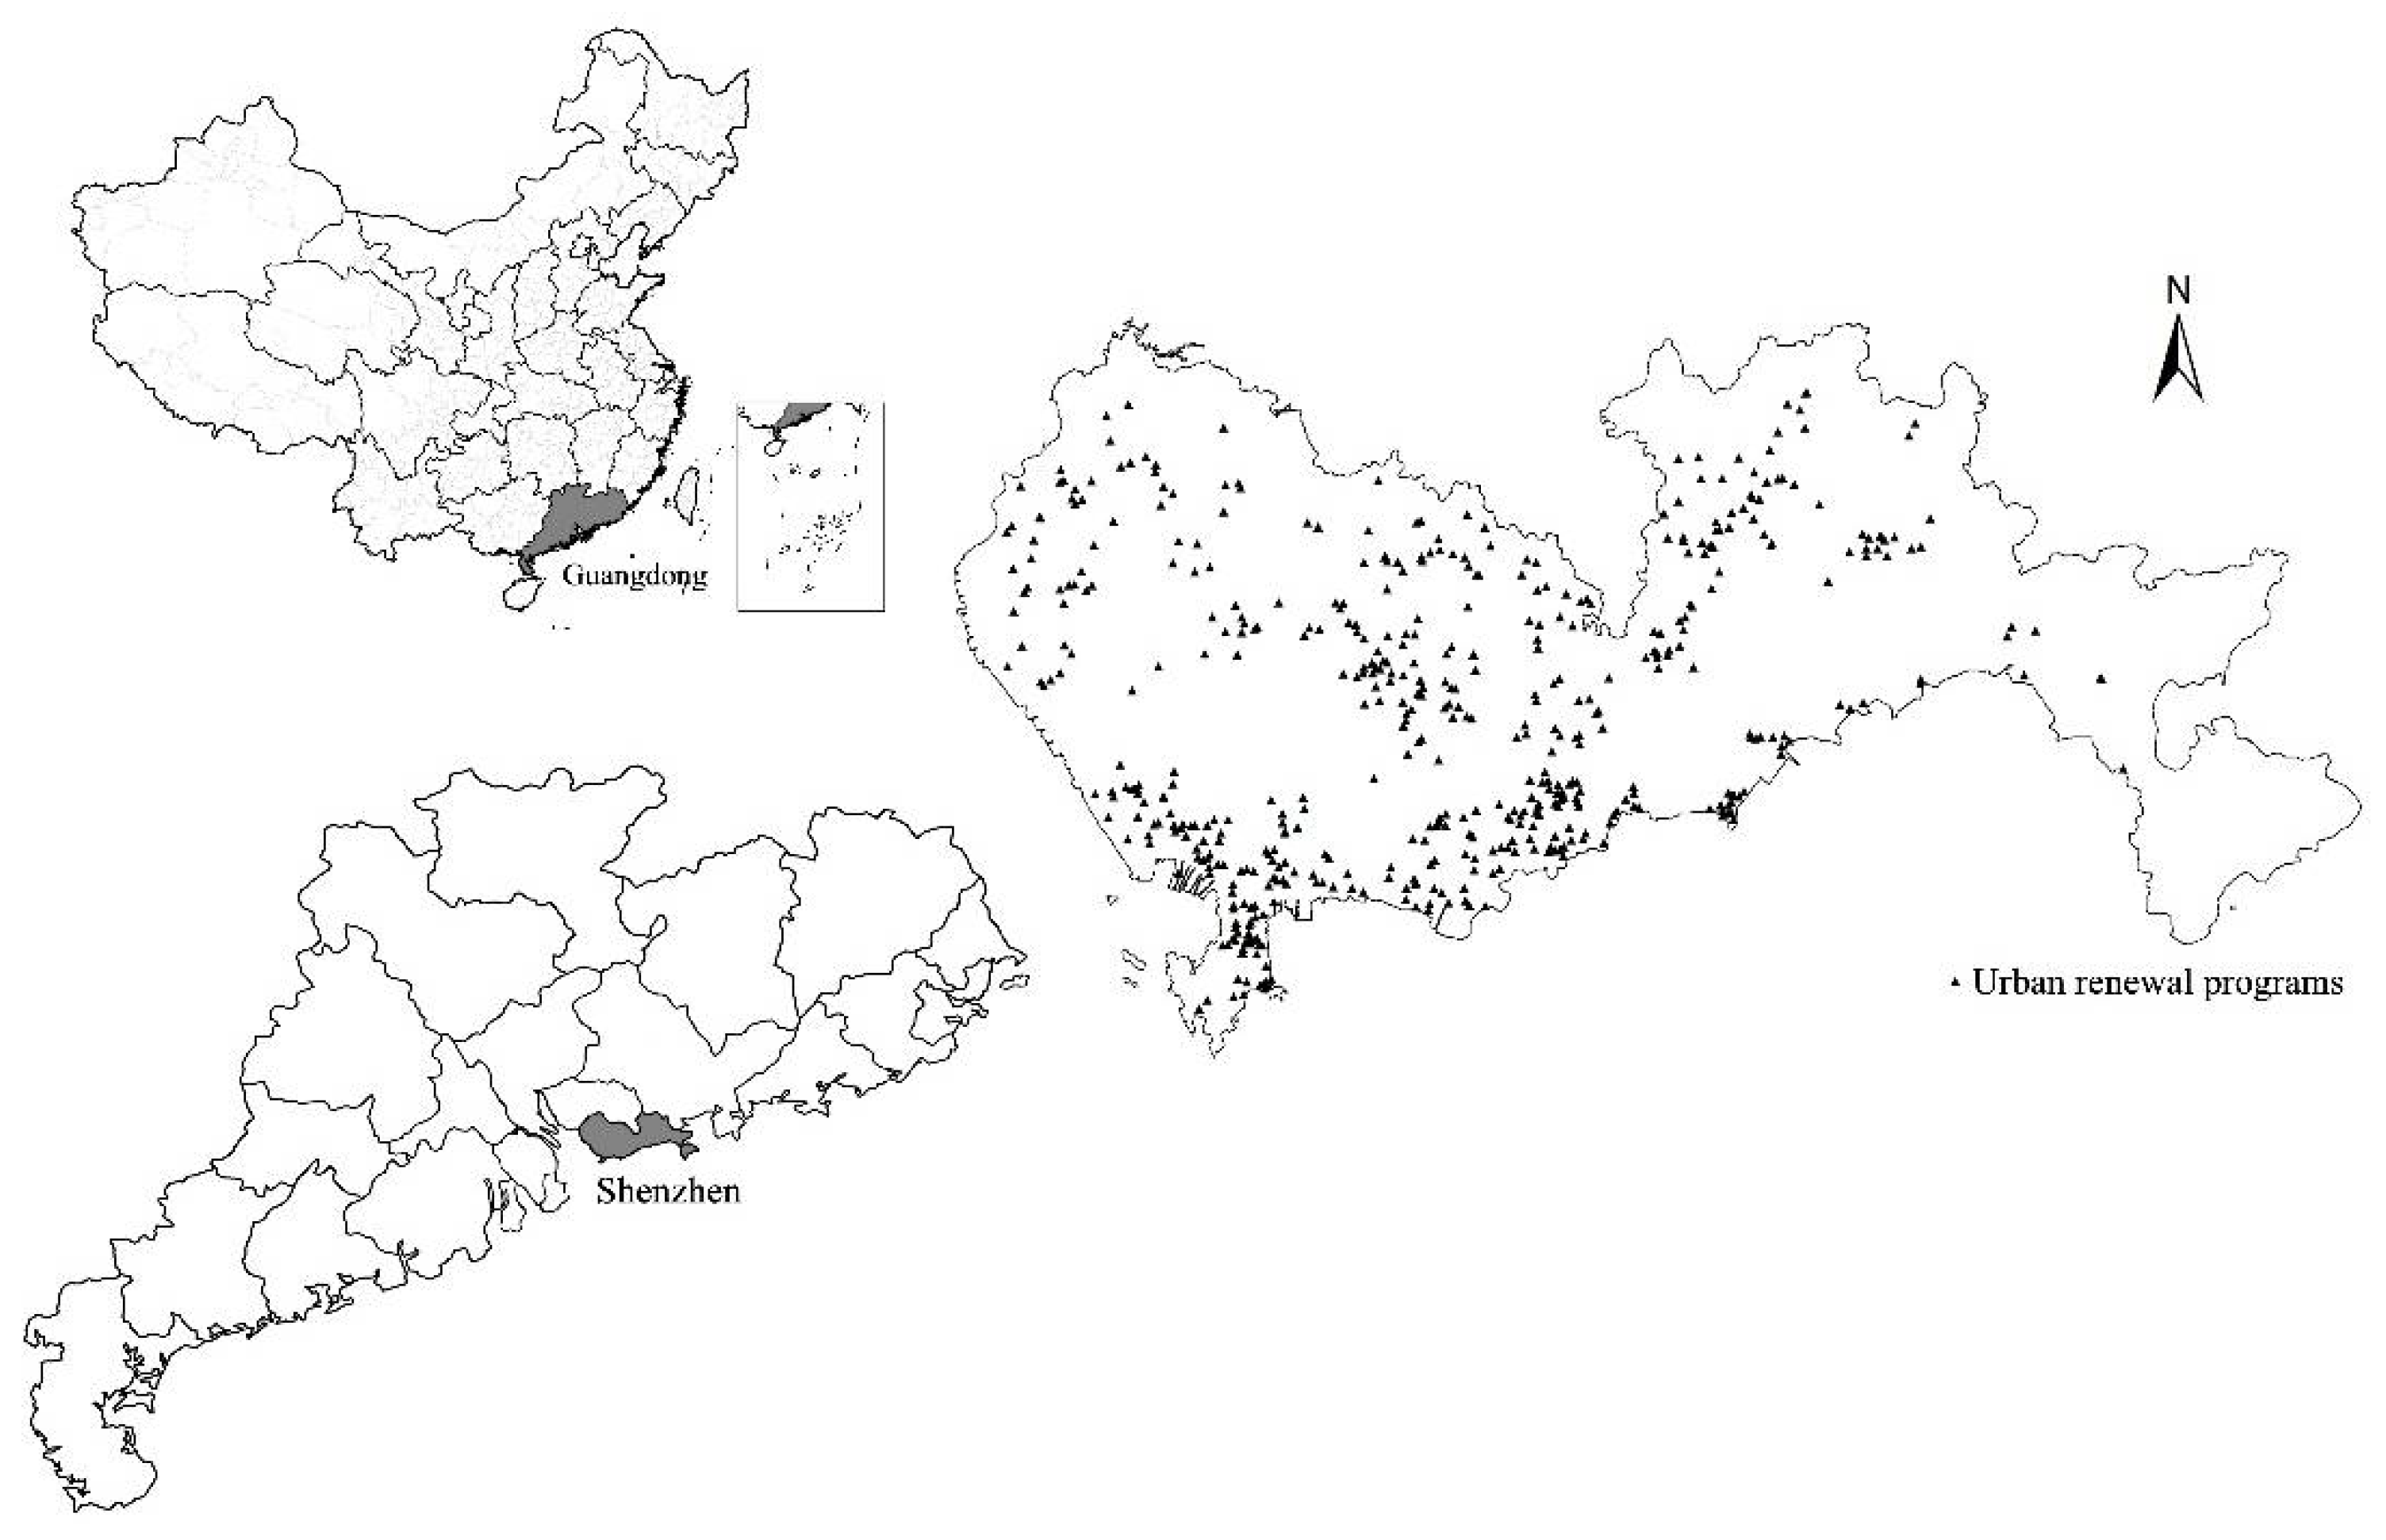
2. Study Area
3. Materials and Methods
3.1. Methods
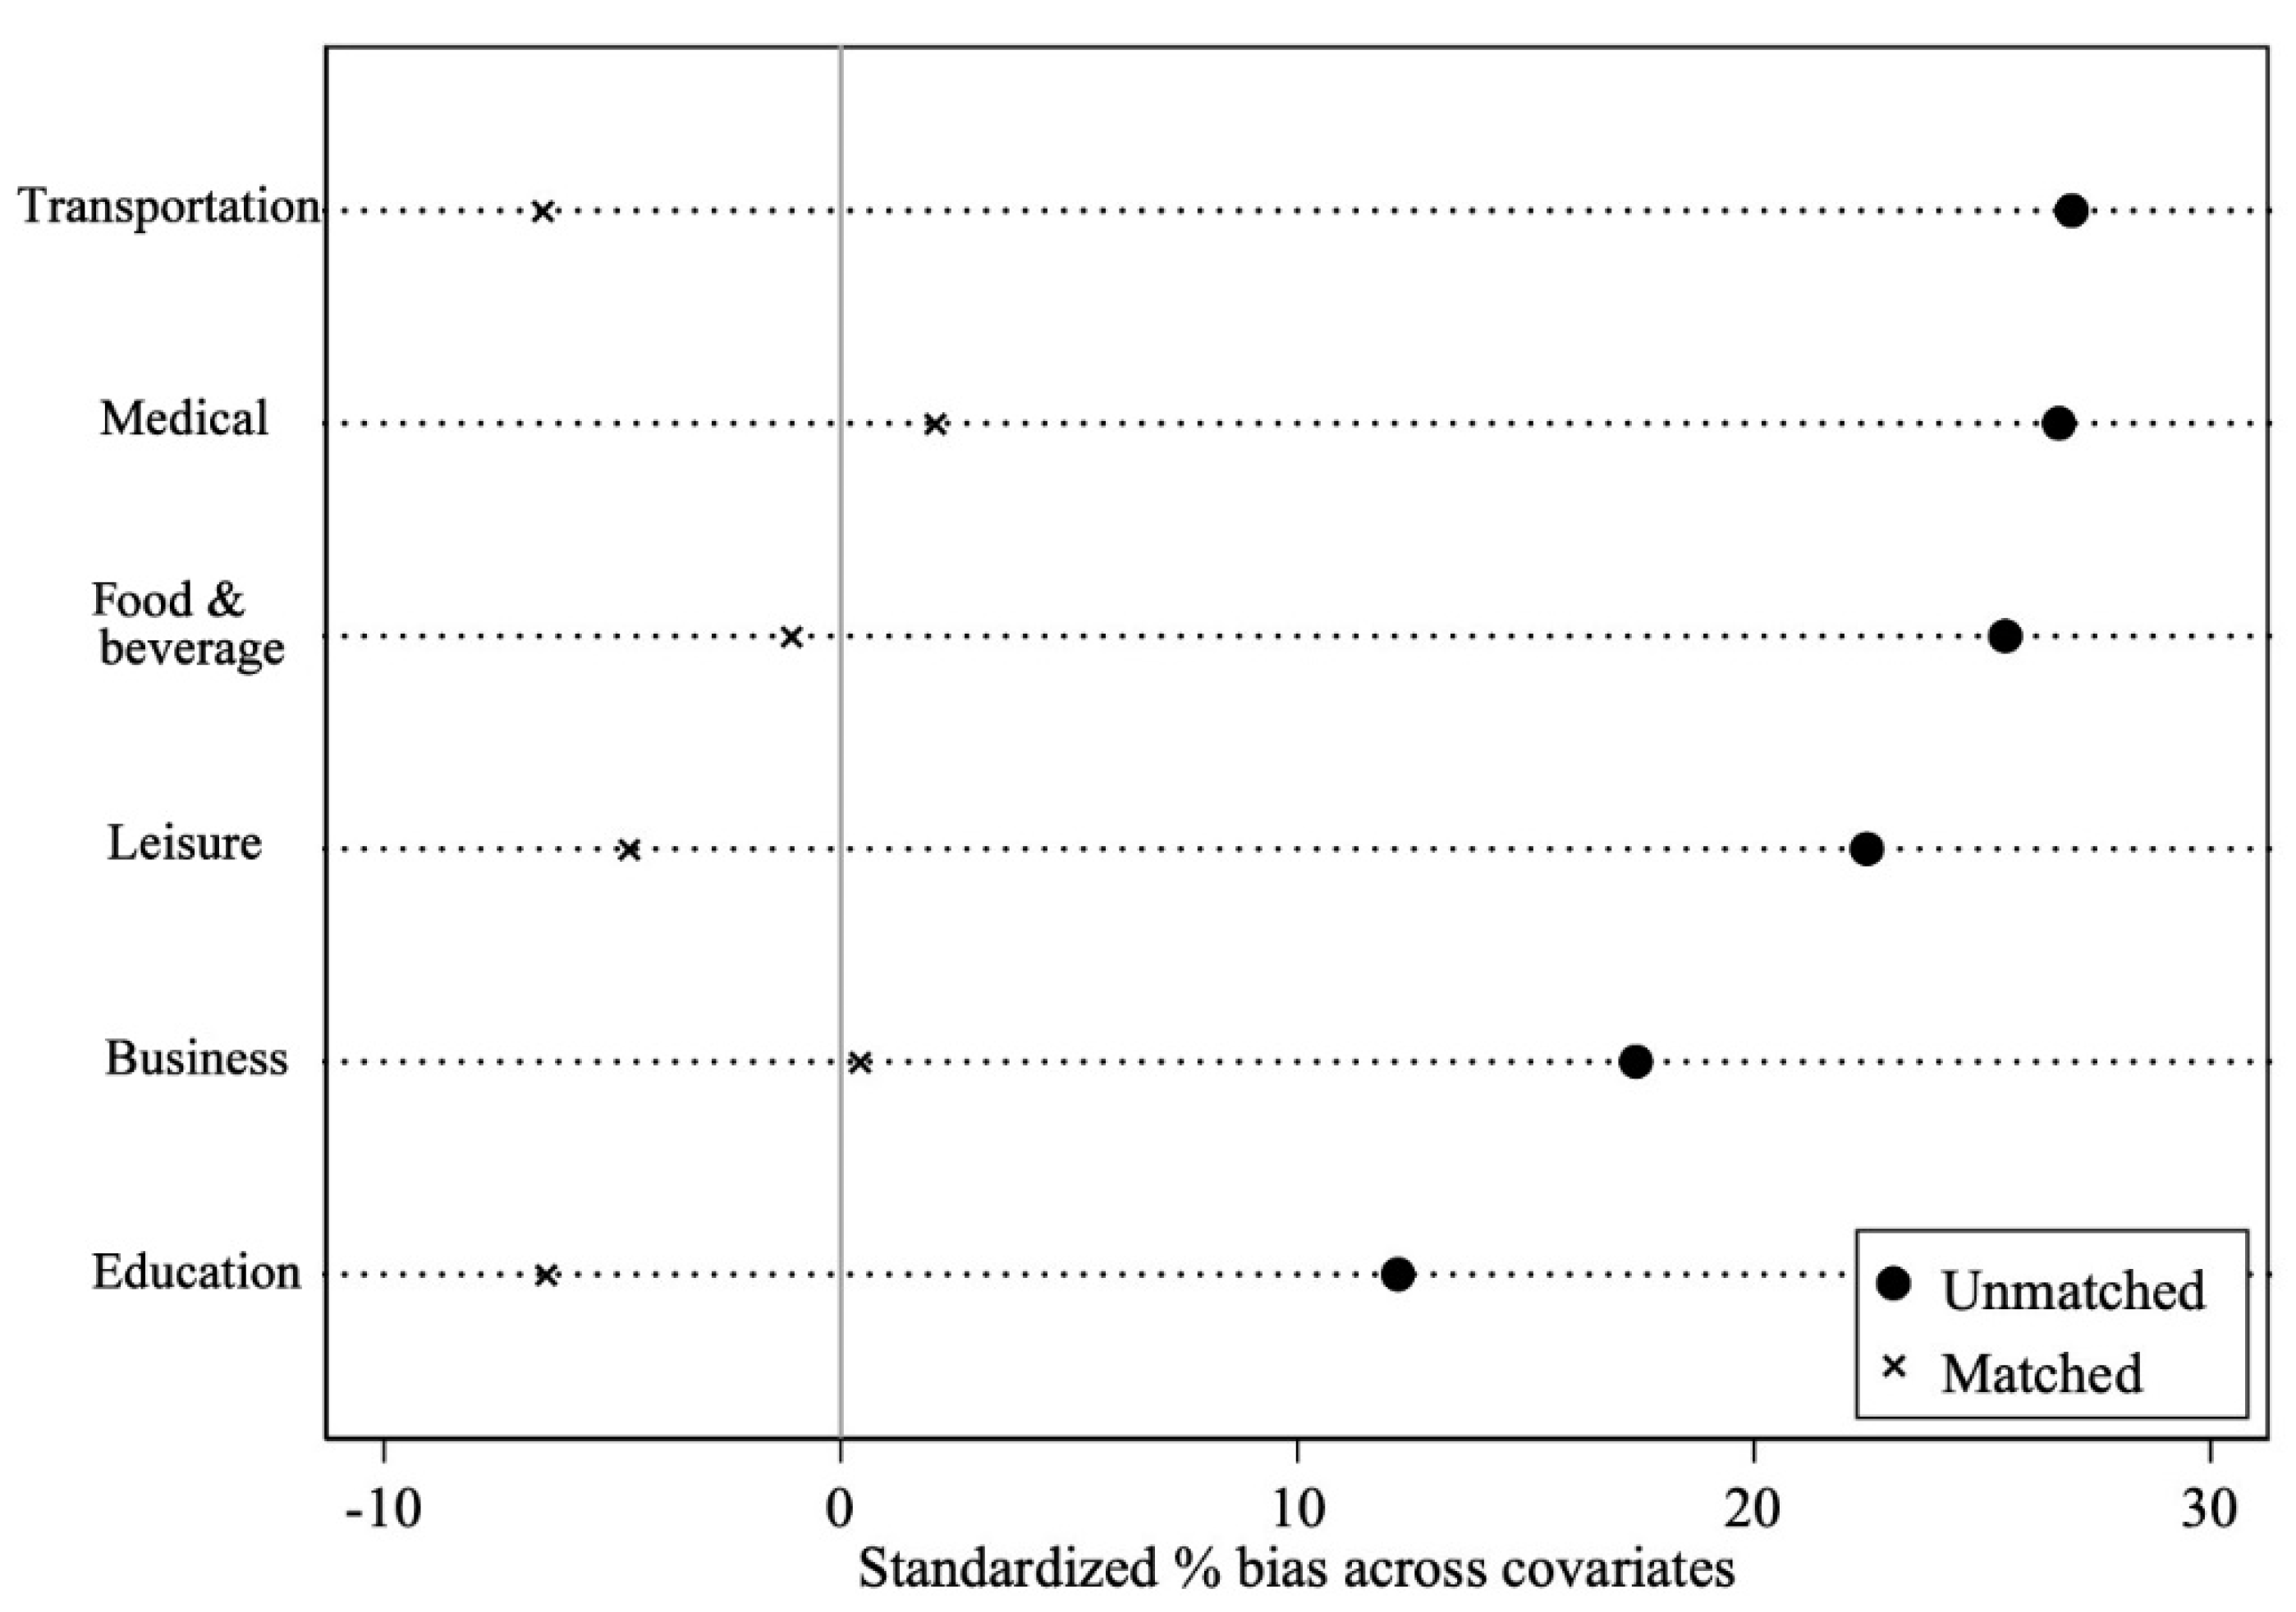
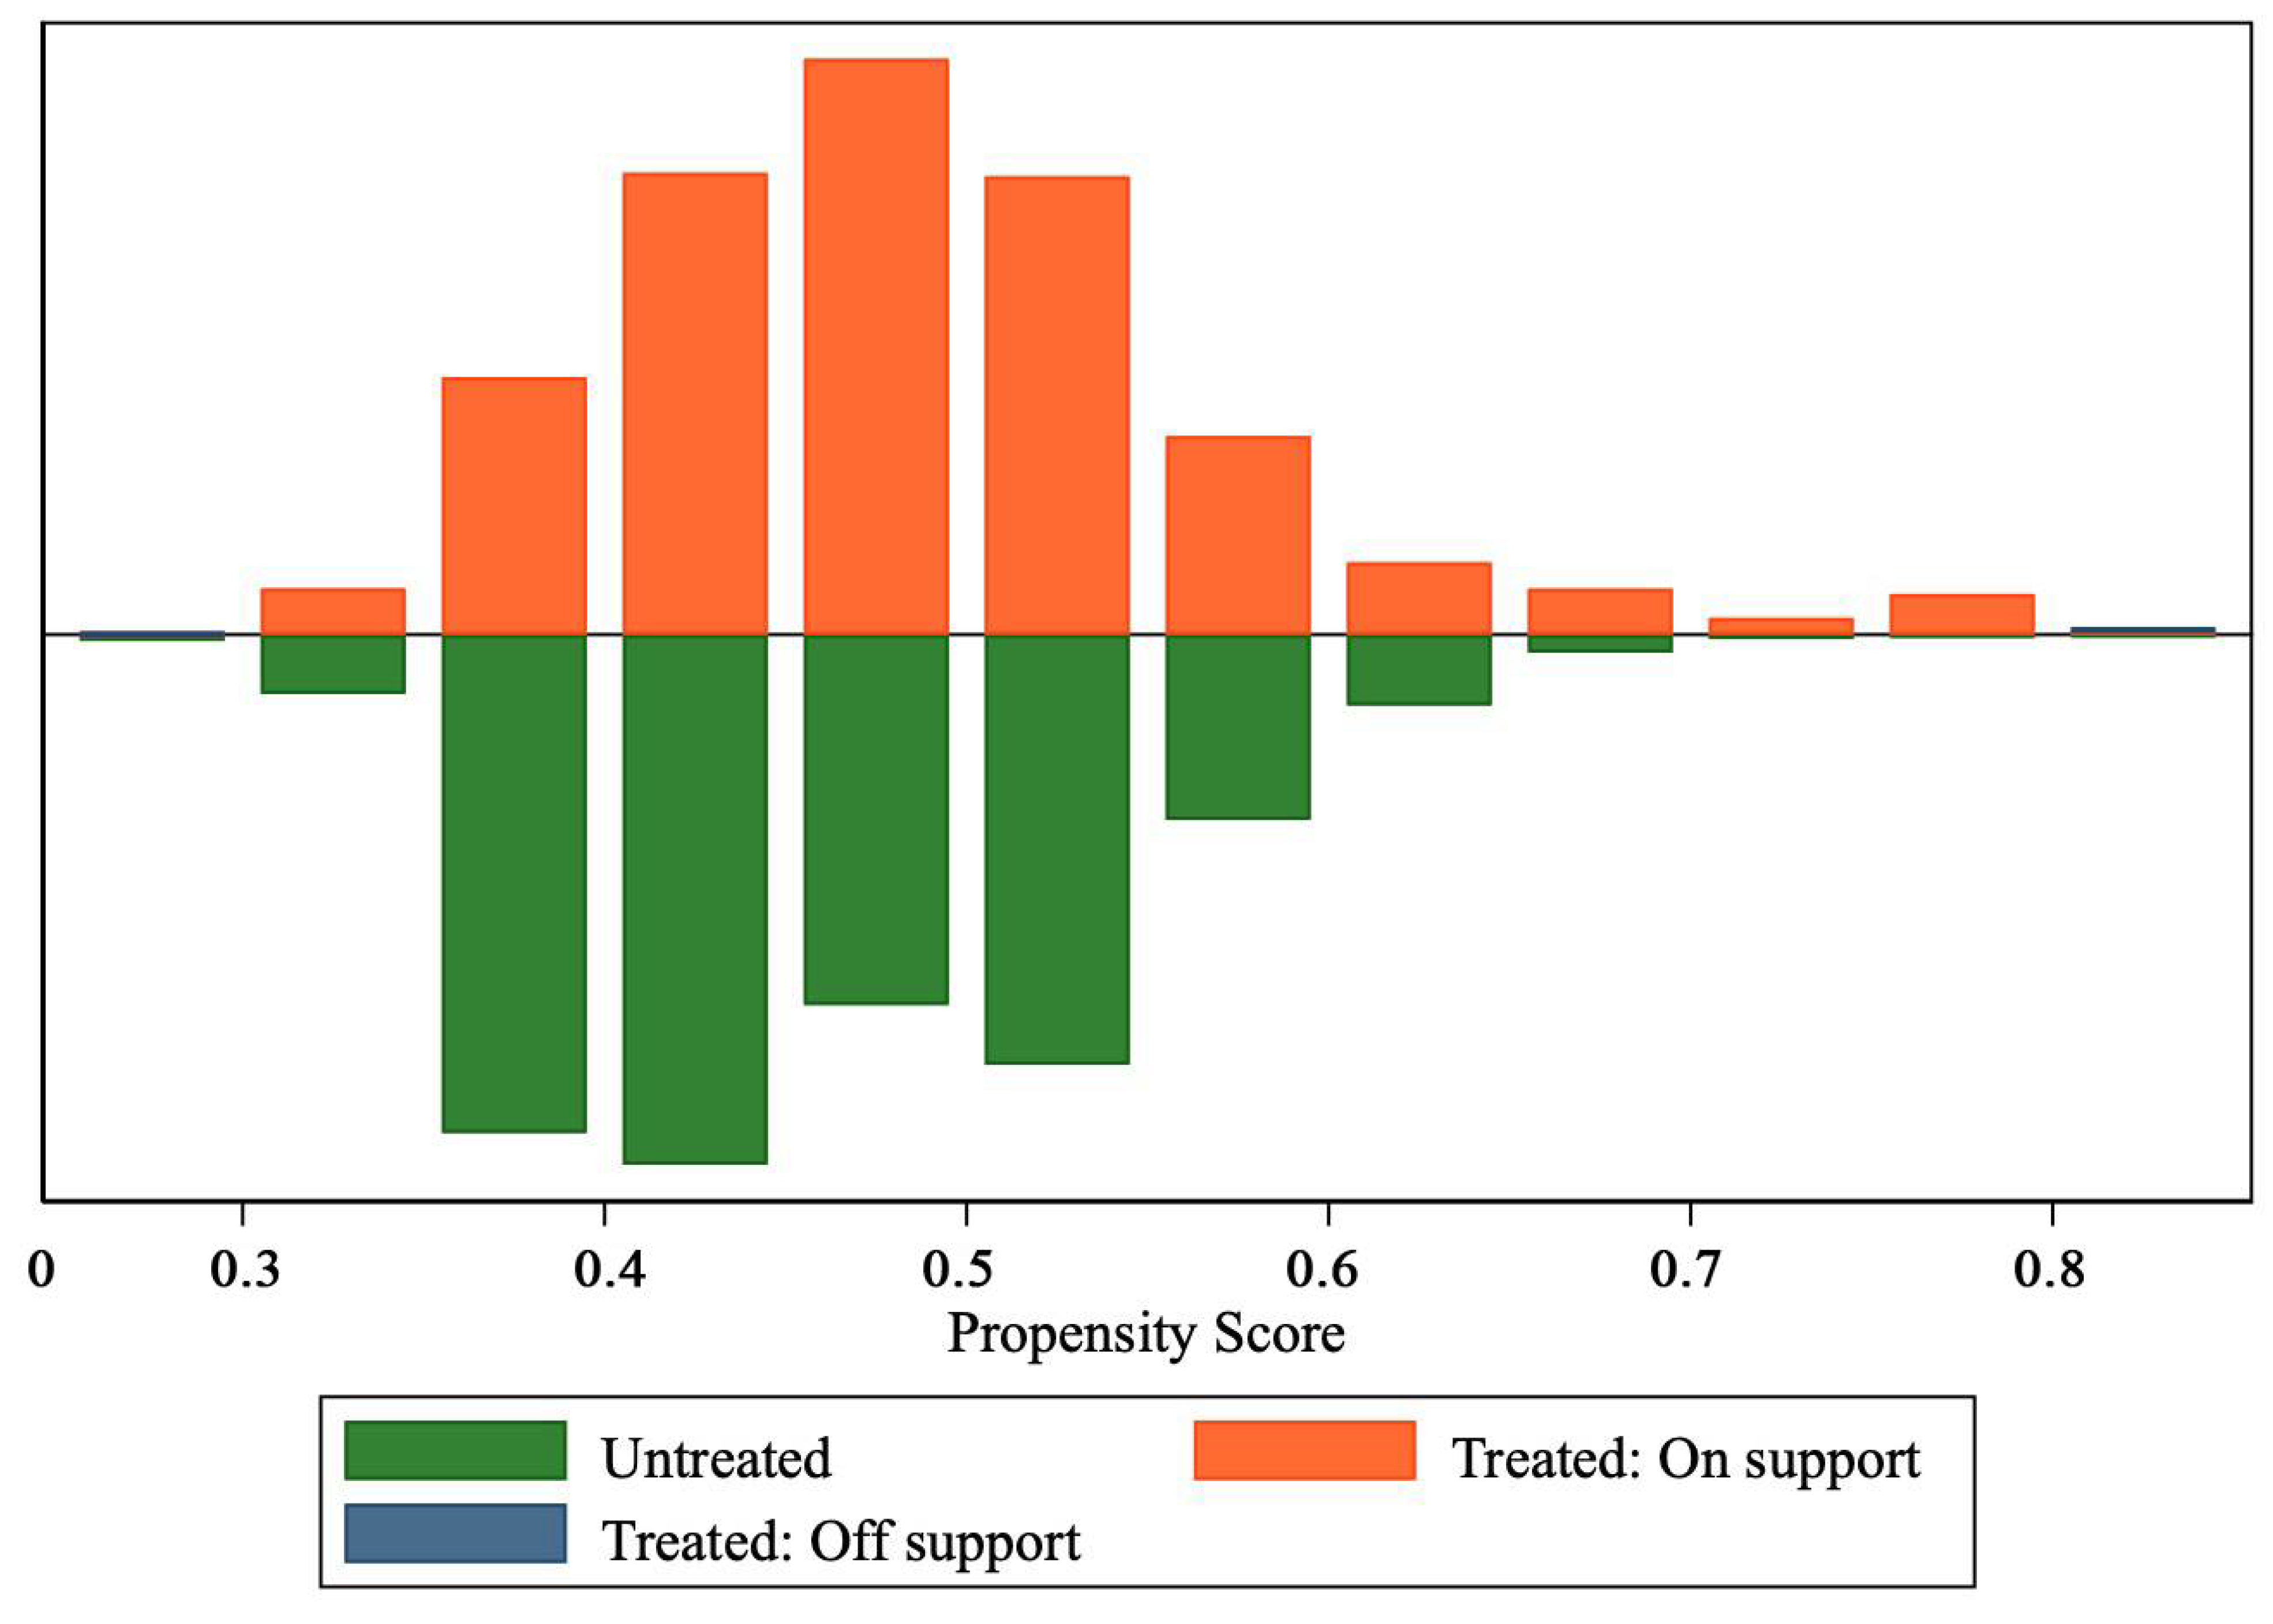
3.1.1. The Difference-in-Difference Model Based on Propensity Score Matching (PSM-DID)
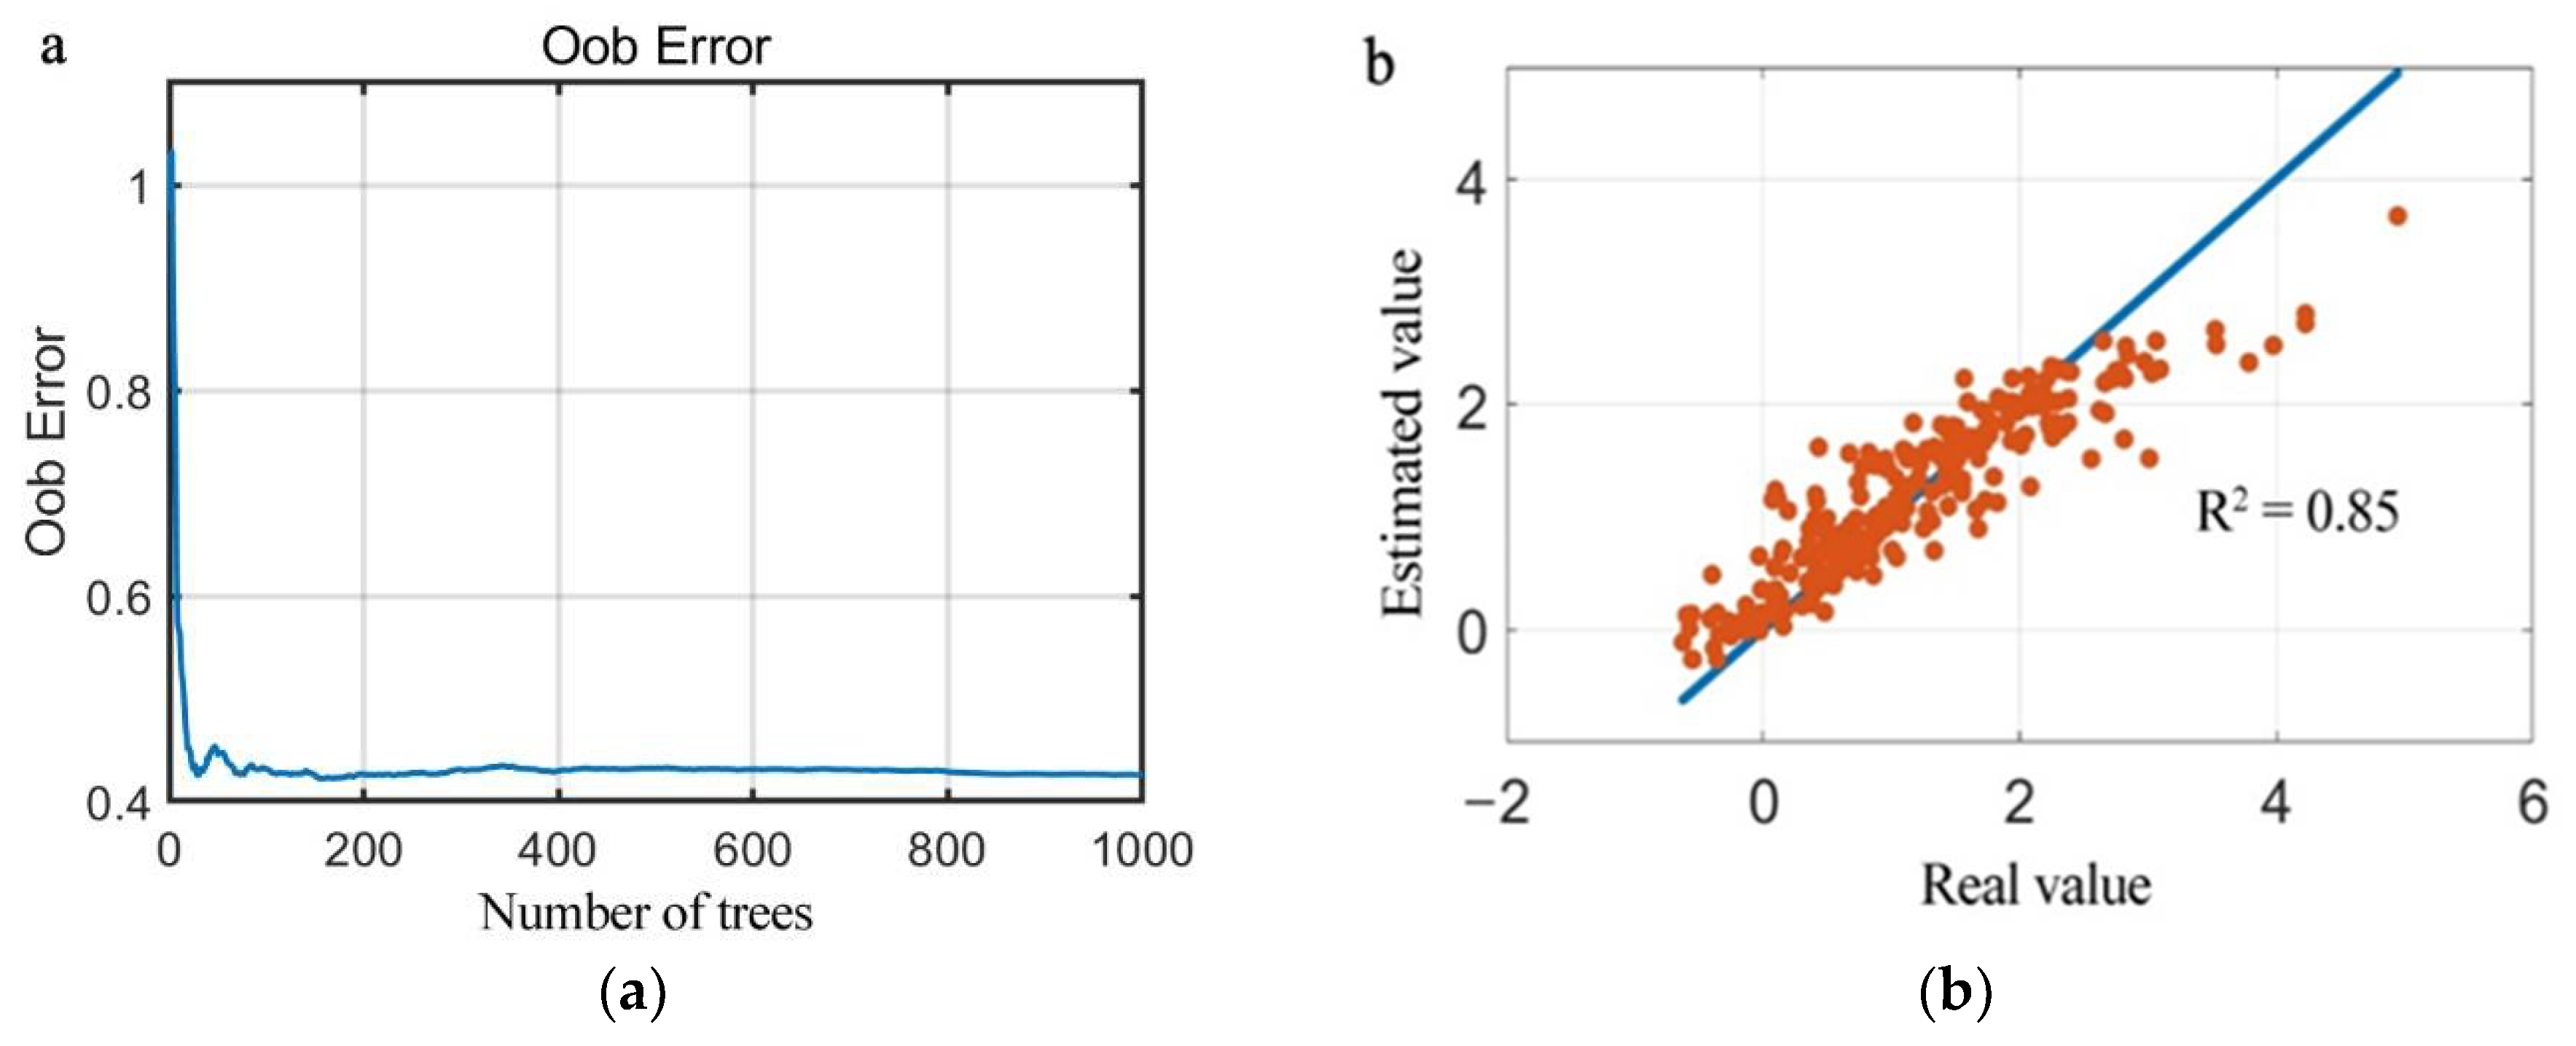
3.1.2. Random Forest Model
3.1.3. Geo-Detector Analysis
3.2. Data Sources
4. Results
4.1. Effects of Urban Renewal on the Housing Premium
4.2. Drivers for the Impact of Urban Renewal on Housing Premiums
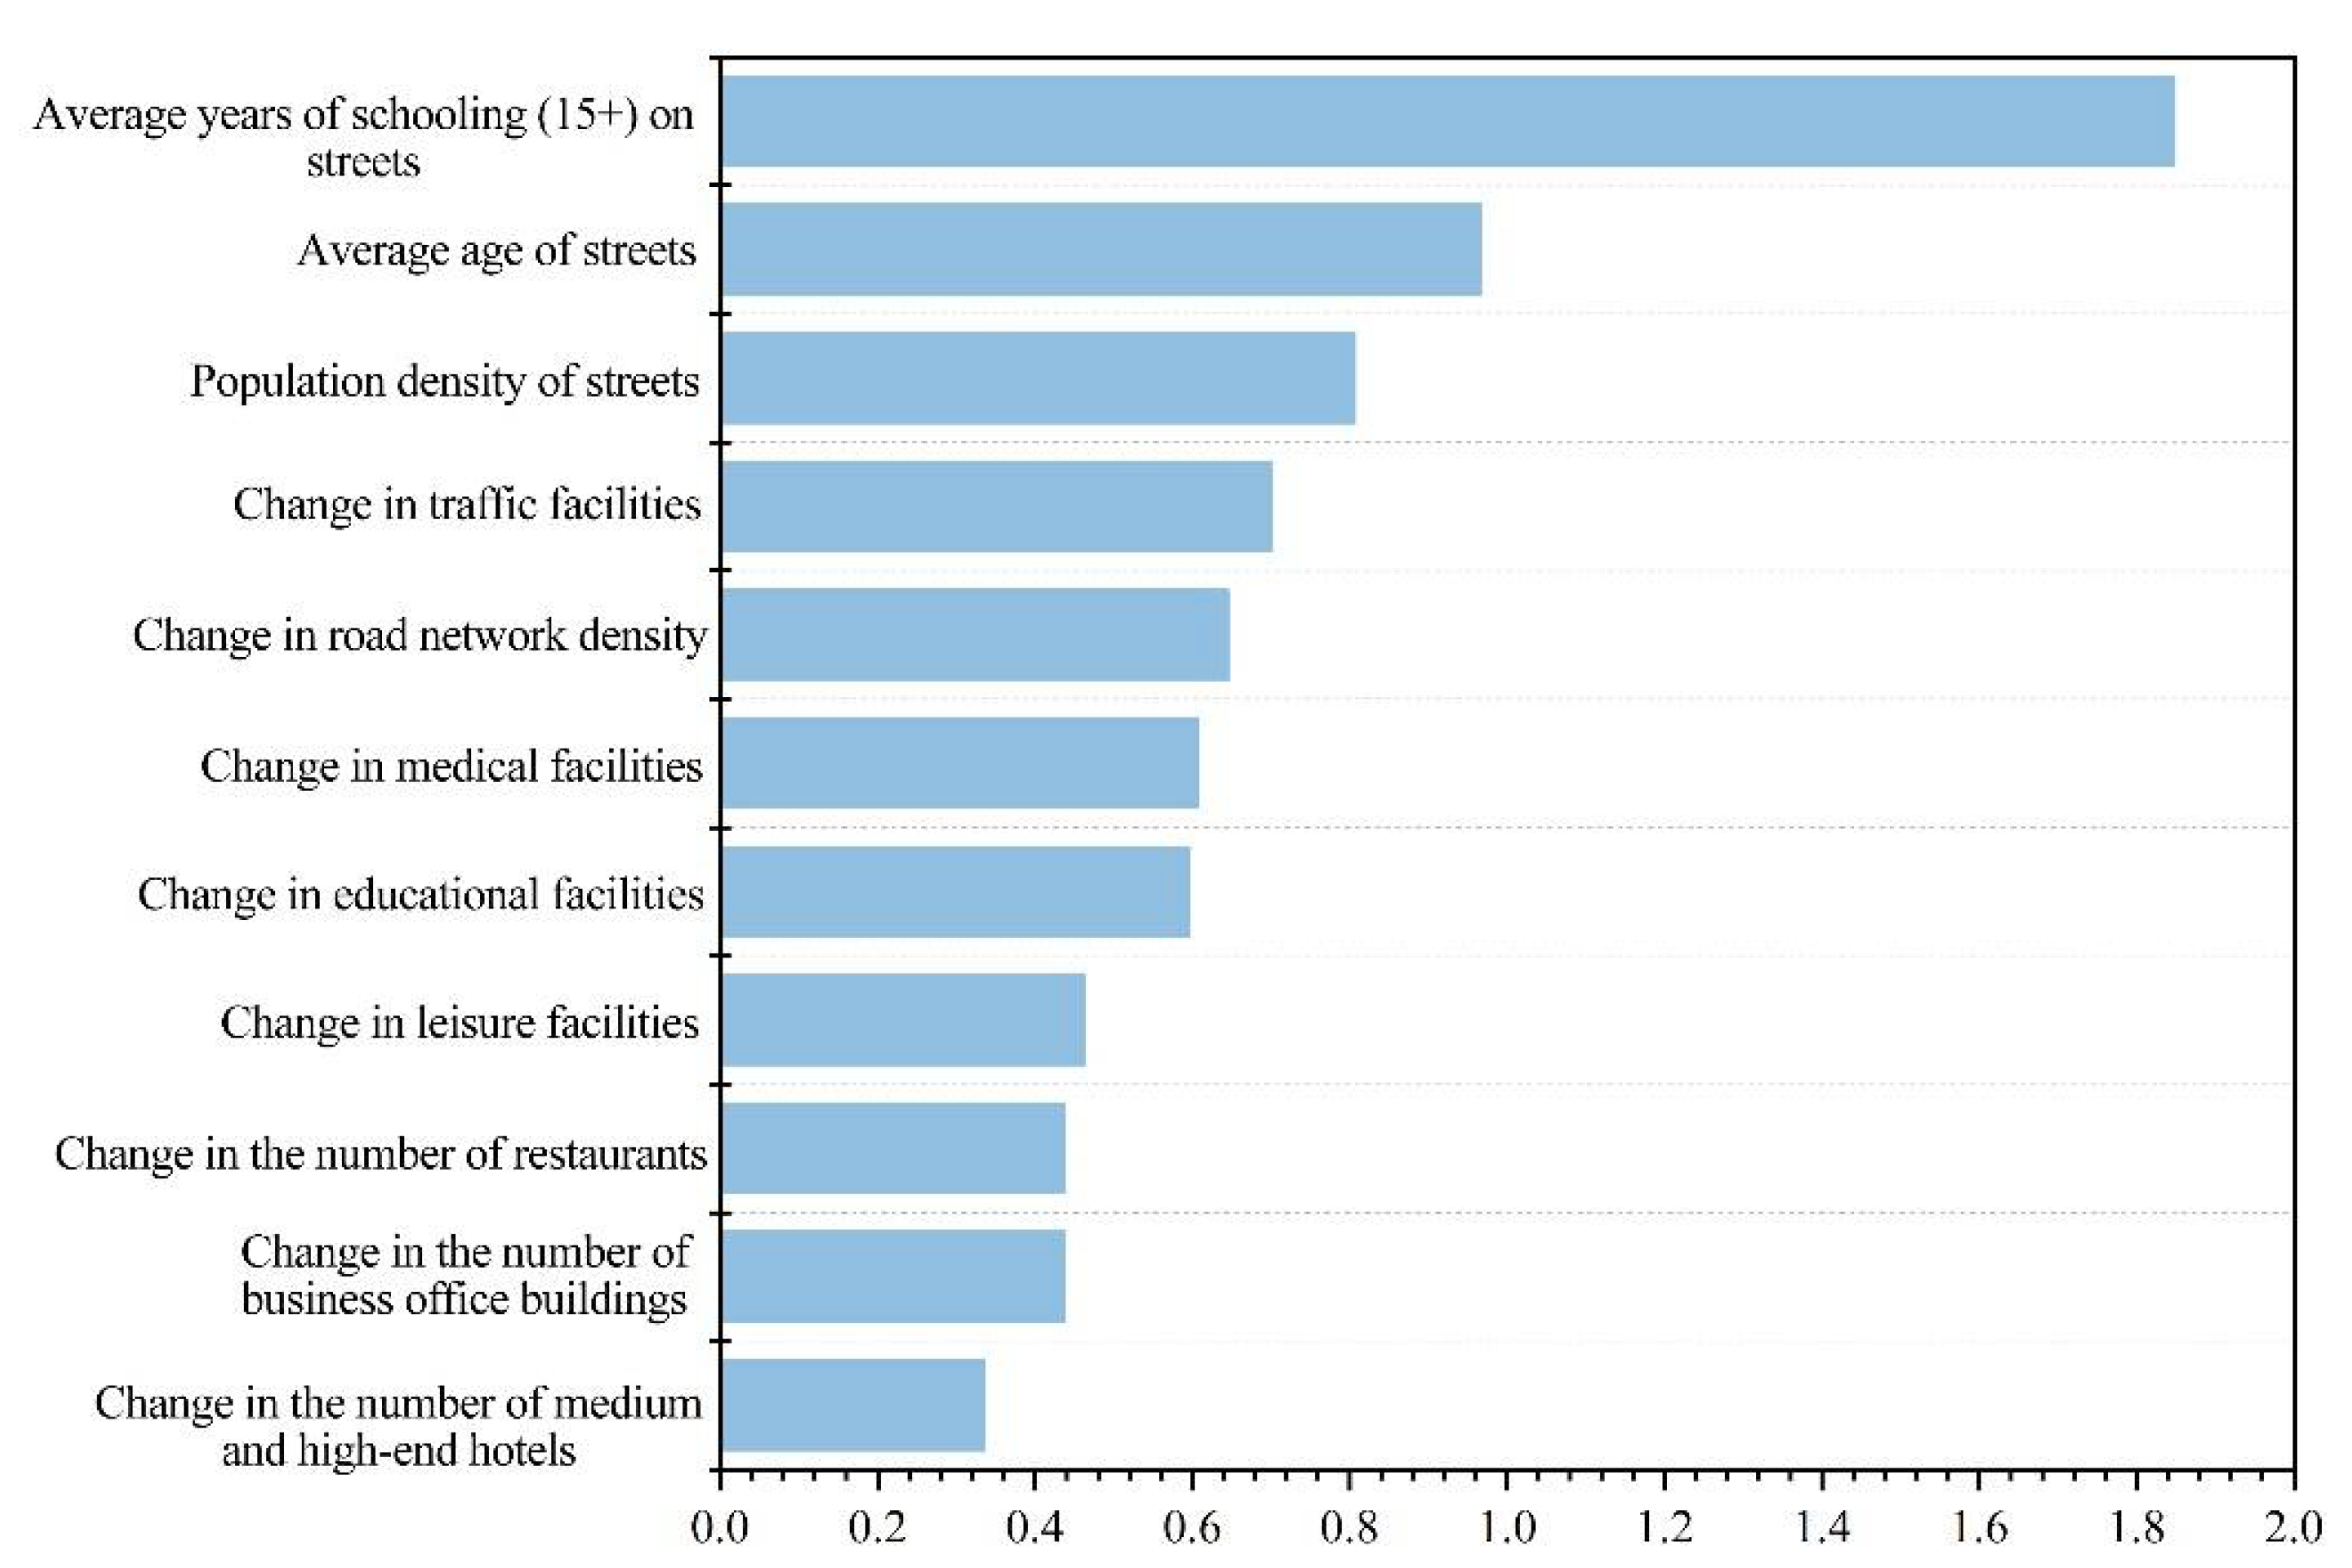
4.2.1. Random Forest Results
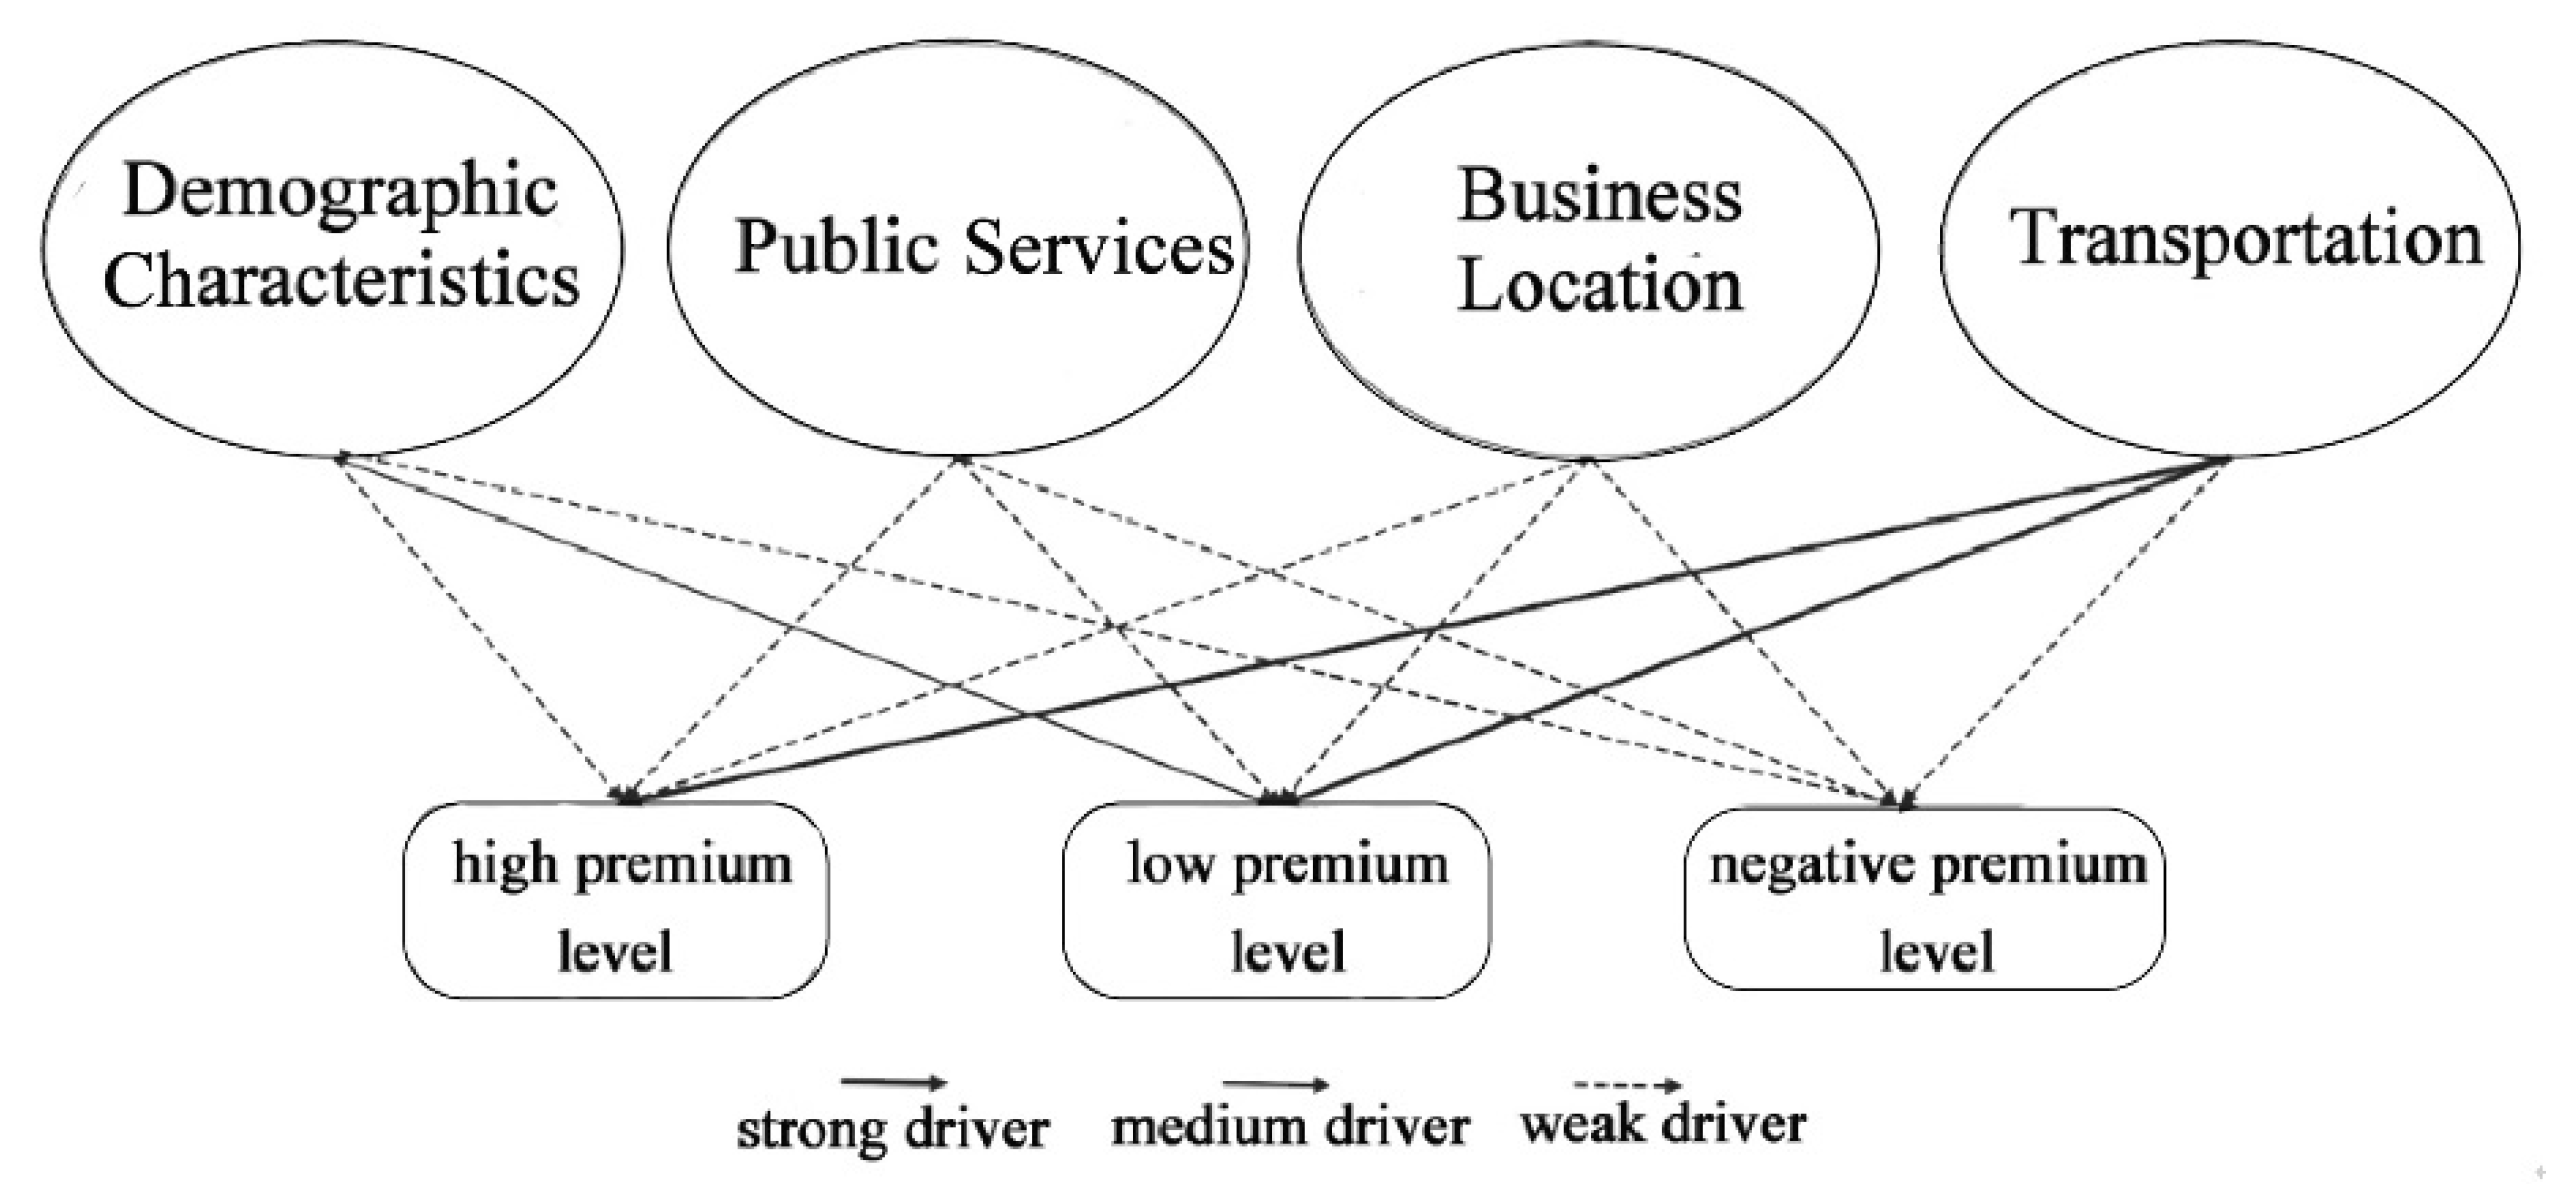
4.2.2. Geo-Detector Analysis
5. Conclusions and Policy Recommendations
Author Contributions
Funding
Institutional Review Board Statement
Informed Consent Statement
Data Availability Statement
Conflicts of Interest
References
- Lin, Q. Institutional arrangement and policy reflections of urban renewal: A case study of Shenzhen. City Plan. Rev. 2017, 41, 52–55+71. [Google Scholar]
- Yan, J.Q. The status quo, characteristics, and tendency of urban renewal in China. City Plan. Rev. 2000, 24, 53–55+63–64. [Google Scholar]
- Yin, J.; Si, N.; Zhang, W.J. Chinese urban renewal model through the lens of rent gap theory: A case study of Shenzhen city, China. City Plan. Rev. 2021, 45, 39–45. [Google Scholar]
- Huang, T.; Zheng, R.B.; Zhang, Y.Q. A comparative analysis on the urban renewal studies in China and foreign countries: Based on bibliometrics. City Plan. Rev. 2017, 41, 111–121. [Google Scholar]
- López-Morales, E.; Sanhueza, C.; Espinoza, S.; Ordenes, F.; Orozco, H. Rent gap formation due to public infrastructure and planning policies: An analysis of Greater Santiago, Chile, 2008–2011. Environ. Plan. A Econ. Space 2019, 51, 1536–1557. [Google Scholar] [CrossRef]
- Lopez-Morales, E. Gentrification by Ground Rent Dispossession: The Shadows Cast by Large-Scale Urban Renewal in Santiago de Chile. Int. J. Urban Reg. Res. 2011, 35, 330–357. [Google Scholar] [CrossRef]
- Shin, H.B. Property-based redevelopment, and gentrification: The case of Seoul, South Korea. Geoforum 2009, 40, 906–917. [Google Scholar] [CrossRef]
- Zhang, W.H.; Shao, S.G. Some problems of the regeneration of old city—From the governmental point of view. Planners 2008, 24, 45–48. [Google Scholar]
- Ren, S.B. The conflicts of interests and plan coordination in urban renewal. Mod. Urban Res. 2011, 26, 12–16. [Google Scholar]
- Wang, T.T. British urban renewal “Management to Governance”, “Region to Place”. Urban Dev. Stud. 2018, 25, 75–79. [Google Scholar]
- Priemus, H. Housing and New Urban Renewal: Current Policies in the Netherlands. Eur. J. Hous. Policy 2004, 4, 229–246. [Google Scholar] [CrossRef]
- Zhang, Y.; Fang, K. Is history repeating itself?—From us’ “Urban Renewal” to China’s “Old City Reconstruction”. Econ. Theory Bus. Manag. 2008, 12, 45–50. [Google Scholar]
- Qiu, X.Z. Application of differential land rent theory in old city reconstruction. Mark. Mod. 2007, 6, 379–380. [Google Scholar]
- Li, H.P.; Jiang, W. On the application of location theory in old city reconstruction. Urban. Archit. 2011, 8, 21–24. [Google Scholar]
- Wu, X.F.; Peng, J.D. The “San-jiu” transformation study based on the eco-city concept: A case of the “San-jiu” transformation of Dongguan city. Urban Dev. Stud. 2012, 19, 19–22. [Google Scholar]
- Song, W.X.; Ma, Y.Z.; Li, X.L.; Chen, Y.R. Housing price growth in different residences in urban Nanjing: Spatiotemporal pattern and social spatial effect. Acta Geogr. Sin. 2018, 73, 1880–1895. [Google Scholar]
- Song, W.X.; Wei, X.R.; Sun, J.; He, M. Spatial differentiation of urban housing prices in integrated region of Yangtze River Delta. Acta Geogr. Sin. 2020, 75, 2109–2125. [Google Scholar]
- Wang, S.J.; Wang, Y.; Liu, X.Q.; Zhang, H.O. Spatial differentiation patterns and influencing mechanism of housing prices in China: Based on data of 2872 counties. Acta Geogr. Sin. 2016, 71, 1329–1342. [Google Scholar]
- Chen, S.; Tong, X. The influence of urban in village reconstruction on real estate market: A case of the Hanyang zone in Wuhan. Econ. Geogr. 2009, 29, 1298–1301. [Google Scholar]
- Du, X.; Huang, Z. Spatial and temporal effects of urban wetlands on housing prices: Evidence from Hangzhou, China. Land Use Policy 2018, 73, 290–298. [Google Scholar] [CrossRef]
- Ooi, J.T.L.; Le, T.T.T. The spillover effects of infill developments on local housing prices. Reg. Sci. Urban Econ. 2013, 43, 850–861. [Google Scholar]
- Liu, C.X.; Chen, A.P. Urban renewal’s premium: Evidence from a Quasi–natural experiment of urban village redevelopment. China Econ. Stud. 2021, 4, 78–90. [Google Scholar]
- Liang, C.M.; Lee, C.C.; Yong, L.R. Impacts of urban renewal on neighborhood housing prices: Predicting response to psychological effects. J. Hous. Built Environ. 2020, 35, 191–213. [Google Scholar] [CrossRef]
- Albanese, G.; Ciani, E.; Blasio, G. Anything new in town? The local effects of urban regeneration policies in Italy. Reg. Sci. Urban Econ. 2021, 86, 103623. [Google Scholar] [CrossRef]
- Cho, G.H.; Kim, J.H.; Lee, G. Announcement effects of urban regeneration plans on residential property values: Evidence from Ulsan, Korea. Cities 2020, 97, 102570. [Google Scholar] [CrossRef]
- Wang, Y.R.; Wang, Z.Y.; Yi, C.D.; Wang, H.; Gao, R. Study on the jobs-housing relationship of the transient population in urban villages from the perspective of spatial mismatch: A case study of Guajiatum and Picum, Beijing. Urban Dev. Stud. 2020, 27, 106–113+131. [Google Scholar]
- Uitermark, J.; Loopmans, M. Urban renewal without displacement? Belgium’s ’housing contract experiment’ and the risks of gentrification. J. Hous. Built Environ. 2013, 28, 157–166. [Google Scholar] [CrossRef]
- Bao, S.J.; Lu, L. Impact of planning-guided spatial evolvement on temporal-spatial evolution of land price: Taking Hefei as an example. Acta Geogr. Sin. 2015, 70, 906–918. [Google Scholar]
- Huang, Z.H.; Xu, W.L.; Du, X.J. Spatial and temporal effects of urban renewal on real estate market: Empirical research based on Hangzhou city. Sci. Geogr. Sin. 2019, 39, 1757–1762. [Google Scholar]
- Chareyron, S.; Goffette-Nagot, F.; Letrouit, L. Impacts of a French Urban Renewal Program on Local Housing Markets; PSE Working Papers, HAL; GATE WP: Lyon, France, 2020. [Google Scholar]
- Rossi-Hansberg, E.; Sarte, P.D.; Owens, R., III. Housing Externalities. J. Political Econ. 2010, 118, 485–535. [Google Scholar]
- Chau, K.W.; Wongchau, S.K. Externalities of Urban Renewal: A Real Option Perspective. J. Real Estate Financ. Econ. 2014, 48, 546–560. [Google Scholar] [CrossRef] [Green Version]
- Zahirovich-Herbert, V.; Gibler, K.M. The effect of new residential construction on housing prices. J. Hous. Econ. 2014, 26, 1–18. [Google Scholar] [CrossRef]
- Dehring, C.A.; Depken, C.A.; Ward, M.R. The impact of stadium announcements on residential property-evidence from a natural experiment in Dallas-Fort Worth. Contemp. Econ. Policy 2007, 25, 627–638. [Google Scholar] [CrossRef]
- Kavetsos, C. The impact of the London Olympics announcement on property prices. Urban Stud. 2012, 49, 1453–1470. [Google Scholar] [CrossRef]
- Lee, C.C.; Liang, C.M.; Chen, C.Y. The impact of urban renewal on neighborhood housing prices in Taipei: An application of the difference-in-difference method. J. Hous. Built Environ. 2017, 3, 407–428. [Google Scholar] [CrossRef]
- Zhou, X. The use of GIS technique in old city reconstruction. Bull. Surv. Mapp. 2008, 6, 58–60. [Google Scholar]
- Dong, Z.Z.; Niu, Q. Evaluation and analysis of public service facilities based on GIS—Taking the community urban renewal project in Putuo District of Shanghai as an example. Theor. Res. Urban Constr. 2017, 5, 27+29. [Google Scholar]
- Tan, Y.X. Estimating the spatial layout of urban renewal based on the evaluation of public service facilities—A case study of Shenzhen. Informatiz. China Constr. 2017, 24, 78–80. [Google Scholar]
- Jin, Z.C.; Hong, Z.S. “New Normal” quantitative analysis research of protection and renewal of historical city. Archit. Cult. 2016, 7, 98–100. [Google Scholar]
- Li, L.J. Research on the implementation strategy of urban dilapidated building reconstruction based on GIS spatial analysis technology from the perspective of government decision-making—a case study of Baiyun District, Guangzhou. Hous. Real Estate 2019, 21, 228–229. [Google Scholar]
- Yuan, W.H.; Li, J.C.; Qin, X.N. Urban old area risk assessment and spatial differentiation mechanism based on the area governance. Econ. Geogr. 2020, 40, 81–92. [Google Scholar]
- Liu, R.M.; Zhao, R.J. Western development: Growth drive or policy trap—An analysis based on PSM-DID method. China Ind. Econ. 2015, 6, 32–43. [Google Scholar]
- Heckman, J.J.; Ichimura, H.; Todd, P.E. Matching as an econometric evaluation estimator: Evidence from evaluating a job training program. Rev. Econ. Stud. 1997, 64, 605–654. [Google Scholar] [CrossRef]
- Heckman, J.J.; Ichimura, H.; Todd, P.E. Matching as an economic evaluation estimator. Rev. Econ. Stud. 1998, 65, 261–294. [Google Scholar] [CrossRef]
- Liu, G.W.; Zhou, Q.Z.; Huang, J. Research on the spatio-temporal heterogeneous effects of urban renewal on housing prices: Empirical evidence based on Shenzhen. Constr. Econ. 2021, 42, 72–77. [Google Scholar]
- Li, X.H. Using “random forest” for classification and regression. Chin. J. Appl. Entomol. 2013, 50, 1190–1197. [Google Scholar]
- Zhao, Y.Y.; Zhang, X.P.; Chen, M.X.; Gao, S.S.; Li, R.K. Regional variation of urban air quality in China and its dominant factors. Acta Geogr. Sin. 2021, 76, 2814–2829. [Google Scholar] [CrossRef]
- Wang, J.F.; Xu, C.D. Geodetector: Principle and prospective. Acta Geogr. Sin. 2017, 72, 116–134. [Google Scholar]
- Jayantha, W.M.; Yung, E.H.K. Effect of revitalisation of historic buildings on retail shop values in urban renewal: An empirical analysis. Sustainability 2018, 10, 1418. [Google Scholar] [CrossRef]
- Ahlfeldt, G.M.; Maennig, W.; Richter, F.J. Urban renewal after the Berlin Wall: A place-based policy evaluation. J. Econ. Geogr. 2017, 17, 129–156. [Google Scholar] [CrossRef]
- Liu, X. Housing renewal policies, house prices and urban competitiveness. Appl. Geogr. 2010, 30, 221–228. [Google Scholar] [CrossRef]


| Factor Relationship | Interaction |
|---|---|
| q(X1∩X2) < Min(q(X1), q(X2)) | Non-linear weakening |
| Min(q(X1), q(X2)) < q(X1∩X2) < Max(q(X1), q(X2)) | Single non-linear weakening |
| q(X1∩X2) > Max(q(X1), q(X2)) | Two-factor enhancement |
| q(X1∩X2) = q(X1) + q(X2) | Independent |
| q(X1∩X2) > q(X1) + q(X2) | Non-linear enhancement |
| (1) | |
|---|---|
| Renew | |
| Transportation | 0.00441 *** |
| (19.41) | |
| Medical | 0.00561 *** |
| (13.88) | |
| Education | −0.00699 *** |
| (−24.98) | |
| Food and Beverages | 0.00030 *** |
| (4.45) | |
| Leisure | 0.00252 *** |
| (5.62) | |
| Business | 0.00084 *** |
| (5.36) | |
| Cons | −0.54159 *** |
| (−43.51) | |
| N | 101,914 |
| (1) | (2) | (3) | (4) | |
|---|---|---|---|---|
| OLS | FE | Weight | On_Support | |
| Renew | 0.87772 *** | 0.94245 *** | 1.38708 *** | 0.94255 *** |
| (8.66) | (85.37) | (101.49) | (85.37) | |
| Transportation | −0.00092 | −0.00624 *** | −0.00759 *** | −0.00624 *** |
| (−0.19) | (−27.32) | (−26.78) | (−27.33) | |
| Medical | −0.00719 * | −0.00752 *** | −0.00384 *** | −0.00753 *** |
| (−2.33) | (−21.02) | (−9.44) | (−21.02) | |
| Education | 0.00313 | 0.00251 *** | 0.00160 *** | 0.00252 *** |
| (1.49) | (10.65) | (5.80) | (10.68) | |
| Food and Beverages | 0.00035 | 0.00031 *** | 0.00069 *** | 0.00031 *** |
| (0.50) | (5.04) | (9.17) | (5.03) | |
| Leisure | −0.00151 | 0.00416 *** | 0.00237 *** | 0.00416 *** |
| (−0.57) | (11.07) | (5.72) | (11.05) | |
| Business | 0.00272 | 0.00473 *** | 0.00413 *** | 0.00473 *** |
| (1.49) | (31.43) | (22.43) | (31.42) | |
| Cons | 3.96364 *** | 4.19067 *** | 3.82565 *** | 4.19069 *** |
| (12.88) | (349.88) | (221.65) | (349.84) | |
| N | 101,914 (Total sample size) | 101,914 (Total sample size) | 67,069 (Number of matched samples) | 101,898 (Number of matched samples) |
| Dependent Variable | Dimension | Independent Variable |
|---|---|---|
| Housing premium for urban renewal projects | Business location | Change in the number of medium and high-end hotels (3-star and above) within the area of influence |
| Change in the number of business office buildings within the area of influence | ||
| Change in the number of restaurants in the area impacted | ||
| Public Services | Change in leisure facilities within the area impacted | |
| Change in educational facilities within the area of influence | ||
| Change in medical facilities within the area of influence | ||
| Transportation | Change in traffic facilities within the area impacted | |
| Change in the density of the road network within the area impacted | ||
| Demographic characteristics | Average years of schooling (15+) for streets within the area of influence | |
| Average age for streets within the area of influence | ||
| Population density for streets within the area of influence |
| Detection Factors | q-Value | ||
|---|---|---|---|
| Low Premium | Medium Premium | High Premium | |
| Change in traffic facilities (X1) | 0.7277 | 0.6758 | 0.7049 |
| Change in medical provision (X2) | 0.5569 | 0.5366 | 0.7144 |
| Average years of education for students in the street (>15 years old) (X3) | 0.3981 | 0.3240 | 0.4303 |
| Average age of population in the street (X4) | 0.3984 | 0.3240 | 0.4303 |
| Population density in the street (X5) | 0.3984 | 0.3240 | 0.4303 |
| Road network density (X6) | 0.9836 | 0.8816 | 0.9930 |
| Dominant interaction factor | X6 ∩ X4 or X5 | X6 ∩ X3 or X4 or X5 | X6 ∩ X1 or X2 or X3 or X4 or X5 |
| Dominant interaction factor: q value | 0.9838 | 0.9832 | 0.9932 |
Publisher’s Note: MDPI stays neutral with regard to jurisdictional claims in published maps and institutional affiliations. |
© 2022 by the authors. Licensee MDPI, Basel, Switzerland. This article is an open access article distributed under the terms and conditions of the Creative Commons Attribution (CC BY) license (https://creativecommons.org/licenses/by/4.0/).
Share and Cite
Li, X.; Wang, J.; Luo, K.; Liang, Y.; Wang, S. Exploring the Spillover Effects of Urban Renewal on Local House Prices Using Multi-Source Data and Machine Learning: The Case of Shenzhen, China. Land 2022, 11, 1439. https://doi.org/10.3390/land11091439
Li X, Wang J, Luo K, Liang Y, Wang S. Exploring the Spillover Effects of Urban Renewal on Local House Prices Using Multi-Source Data and Machine Learning: The Case of Shenzhen, China. Land. 2022; 11(9):1439. https://doi.org/10.3390/land11091439
Chicago/Turabian StyleLi, Xiaojun, Jieyu Wang, Ke Luo, Yuanling Liang, and Shaojian Wang. 2022. "Exploring the Spillover Effects of Urban Renewal on Local House Prices Using Multi-Source Data and Machine Learning: The Case of Shenzhen, China" Land 11, no. 9: 1439. https://doi.org/10.3390/land11091439
APA StyleLi, X., Wang, J., Luo, K., Liang, Y., & Wang, S. (2022). Exploring the Spillover Effects of Urban Renewal on Local House Prices Using Multi-Source Data and Machine Learning: The Case of Shenzhen, China. Land, 11(9), 1439. https://doi.org/10.3390/land11091439