Article

A Procedural Modeling Approach for Ecosystem Services and Geodesign Visualization in Old Town Pocatello, Idaho

Department of Geosciences, Idaho State University, Pocatello, ID 83209, USA
*
Author to whom correspondence should be addressed.
Land 2022, 11(8), 1228; https://doi.org/10.3390/land11081228
Submission received: 22 June 2022 / Revised: 31 July 2022 / Accepted: 2 August 2022 / Published: 3 August 2022
(This article belongs to the Special Issue Geodesign in Urban Planning)

Abstract

:
City population has been growing rapidly worldwide due to urban expansion, which can bring negative impacts on local ecosystem services (ES). Efficient tools for urban design and visualization are essential for city planners and stakeholders to better understand the valuation impact of plans for future sustainable development. Current urban design methods are mainly based on a 2D perspective and lack vertical visualization. Although conventional 3D modeling was introduced to address these limitations, it still has some challenges, such as requiring powerful computing resources and specialized training. Procedural 3D modeling is a grammar-based set of rules that can effectively generate 3D models and enhance spatial visualization when compared with conventional 2D or 3D methods. This paper describes a framework for developing a geodesign tool in Old Town Pocatello, Idaho, USA using procedural modeling to improve planning and visualization for urban design, including (1) Geospatial data preparation in ArcGIS, (2) 3D cityscape model generation in CityEngine, and (3) interactive visualization applications for multiple platforms developed with the Unity game engine. Pocatello is a mid-sized city in southeast Idaho that faces several challenges towards integrating ecosystem services in urban design. As a case study in ecosystem service modelling, we proposed a green scenario for Old Town to demonstrate a tool where permeable surfaces were increased from 37% to 45% to help mitigate urban land surface temperature and improve stormwater management. This geodesign tool offers city planners and stakeholders an opportunity to visualize and analyze block-level scenarios in real time. The interactive applications can encourage public participation in the design process. More ES measurements can be implemented into this tool in the future. The techniques of 3D procedural modeling and ES modeling in this study are also applicable to other small to mid-sized cities worldwide.

1. Introduction

Cities around the world have been growing rapidly. The population in urban regions constitutes over half of the world population, and it will reach 68% by 2050 [1]. Urbanization has changed land use and cover in urban areas and incurred negative influences on ecosystem services (ES), leading to severe environmental problems, such as heat island effects and water quality issues due to impervious surfaces [2]. ES supports human survival and welfare by providing clean food and water, climate regulation, and other environmental services [3,4,5]. Utilizing visualization tools in the early stages of urban planning is more likely to achieve desired outcomes for sustainable growth or redevelopment [6,7]. Hence, it is necessary for planning authorities to have an efficient system to integrate ecosystem services into their planning efforts, where they can visualize, collaborate, develop, and evaluate scenarios.
Incorporating ecology and environmental concerns in urban design was initially pioneered by Ian McHarg who integrated natural spatial data with city planning in his 1969 book Design with Nature [8]. Urban and regional planners introduced planning support systems in the late 1980s based on McHarg’s design with nature methods. As geographical information systems (GIS) emerged in the 1990s, more tools were created for supporting urban planning processes [9]. GIS plays an important role in urban planning; we can merge geodesign tools with spatial components for analysis and modeling to support stakeholders in collaborative planning and thereby increase the effectiveness of spatial designing [10]. Geodesign is an innovative approach that can help planners to integrate proposed ideas with simulated impacts for pre-assessment [11]. Current geodesign tools are mainly based on a 2D perspective, such as 2D sketches and maps [12]. Although 2D visualization is an effective tool to perform simple tasks for urban planning such as measuring the length and area of a building footprint, it is insufficient for complex tasks such as evaluating recession planes and shadows [13]. The conventional 2D plan of a city restricts planners’ conceptualization of vertical volume of a region [14]. 2D planning may display some spatial data, but it does not reveal volumetric measurements in a tangible way without the 3D perspective [15].
GIS-based 3D city models are a new concept introduced to the public in the urban design field and are integral to the development of the smart city [16]. It can address limitations in urban planning, such as a lack of analysis and modelling tools for the vertical dimension [17]. Smart cities utilize data, new technologies, and resources to realize a sustainable society and to provide a better quality of life for citizens [18]. However, there are still some challenges regarding 3D city modeling, such as the amount of time required to create detailed models, complexity of available software, and the expense of high-performance computing resources and hardware to provide fast rendering of 3D models [19,20,21]. Conventional 3D modeling also lacks dynamic visualization of land use and land cover change. Procedural modeling can overcome some of these challenges. Procedural modeling is a cost-effective and time-saving solution since it can generate numerous 3D models based on grammar-based rules in a short period of time. Consequently, planners can leverage these advantages to improve urban development and management [22].
Procedural techniques have been successfully and widely used in computer graphics to create 3D textures of natural objects such as waterfalls and trees [23]. Fast speed, random and structured models, and controllable contents are three essential advantages of procedural content generation [24]. Tiwari and Jain [25] used procedural modeling to create an innovative and smart 3D city with an integrated economic component, environment component, and a social component. Procedural modelling is available in CityEngine (Esri, Redlands, CA, USA). It is a robust and efficient 3D modelling software that controls models by defining rules with Computer Generated Architecture (CGA) [26]. Originally developed by Müller et al. [27], CGA is a shape grammar that is capable of efficiently building large cities with details (e.g., rules can generate windows and doors for buildings and cars and pedestrians). We can apply CGA rules to GIS data to model trees, streetscapes, landscapes, and buildings [28]. As an example, Schaller et al. [29] created a web-based application for Cologne, Germany that displayed the scenarios and projects for the city’s development to obtain sustainable growth using a LiDAR dataset and a procedural modeling approach that created rules to render open spaces, green spaces, and water bodies according to land use type from the attribute table.
Virtual reality (VR) technologies can enhance procedural 3D modeling for urban design by immersively engaging city planners in scenario development [9,29]. Ivan Sutherland invented VR and presented a head mount display (HMD) in the late 1960s. HMD then evolved into consumer-aimed VR headsets in 2012, such as the Oculus VR (Oculus, Menlo Park, CA, USA) and the HTC Vive (HTC, Seattle, WA, USA) [30,31]. The HTC Vive system includes a headset, two controllers, and two base stations. VR enables users to immerse themselves into dynamic virtual landscapes, which is an advantage for urban designers to assess landscape changes or proposed urban development [31,32]). A virtual city that uses VR technology and spatial GIS data can display real-time design concepts to planners and stakeholders in an interactive virtual environment. The VR experience can also be developed in a game engine, such as Unity and Unreal Engine. Sameeh, Sayad, and Ayad [33] proposed a VR-GIS model to link the northern and southern Gaza Strip, Rafah, State of Palestine and created multiple scenarios to assist urban planning and consulting processes. However, the effectiveness of how VR can present an immersive environment to stakeholders in urban planning has not been well researched [31] and is still at an experimental stage [34].
Previous studies separated the use of procedural modeling in urban design and visualization of simulated urban scenarios with game engines. There is a lack of studies that bring together procedural modeling, immersive simulation, and ES to support city planning. This paper demonstrates a complete workflow for generating a rule-based 3D city model in Old Town Pocatello, Idaho, USA and provides city planners and stakeholders with the tools to visualize and interact with planning scenarios on multiple platforms. We created a 3D procedural model with landscapes and streetscapes for the Old Town section of a mid-sized city in the western United States (Pocatello, Idaho) using CityEngine software. This city model was integrated into a gaming engine (Unity) to create an interactive 3D application where users can visualize and interact in Old Town Pocatello by virtually driving a car with a joystick on Android devices and walk around with a mouse and keyboard with the HTC Vive system. Additionally, we proposed a green scenario and analyzed the valuation and trade-offs of ES based on increasing green spaces and reducing impervious layers in Old Town that were scripted to allow users to visualize and assess the valuation impact between before and after simulations. Our geodesign tool can be used to assess the impact of a single investment on the entire cityscape at a given site. This case study also provides city designers and stakeholders in small to mid-sized cities with techniques for 3D procedural modeling and visualization for urban redevelopment planning and ES response based on simulated scenarios both visually and using monetary valuation.

2. Materials and Methods

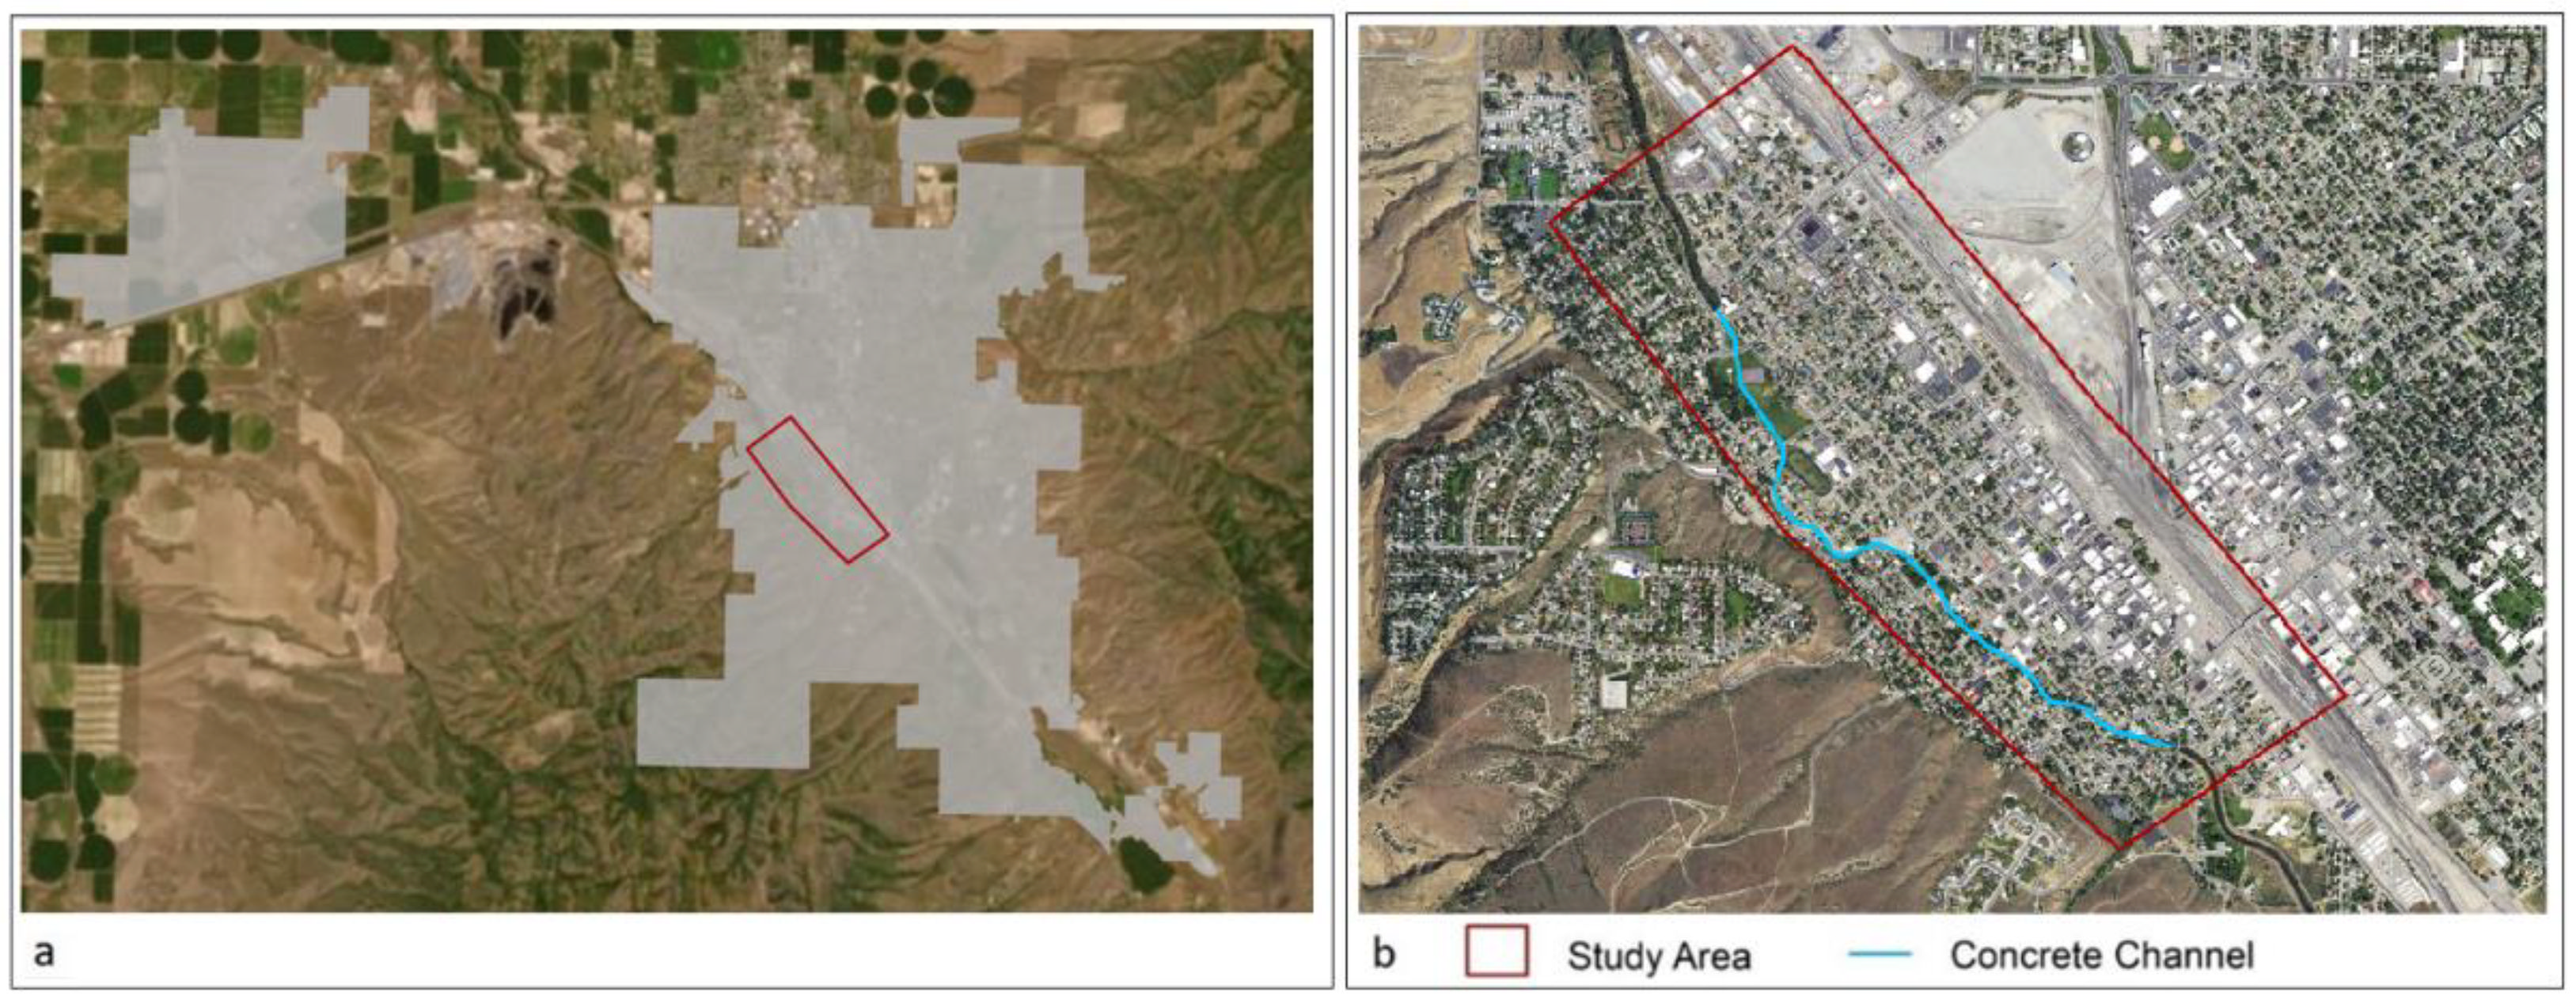
2.1. Study Area and Data Sources

Pocatello is a mid-sized city in Idaho, USA (42°52′30.8″ N 112°26′50.2″ W), as shown in Figure 1, with an estimated population of 57,092 (US Census Bureau, 2021) that is expected to reach 60,000 in 2030, as reported in the updated comprehensive plan from the City of Pocatello (2015). Pocatello sits along the Portneuf River, which provides habitat for fish and wildlife, recreational sites for the public, stormwater management, and is an irrigation source for farming. Excessive alternations to the river have affected local ecosystem health and limited public access [35]. The US Army Corps of Engineers (USACE) constructed a concrete wall along the Portneuf in Old Town Pocatello with levees that can contain a flood of up to 170 cms (cubic meters per second) to cope with flooding similar to the extreme flood event of 1968 [35]. The concrete channel, highlighted in Figure 1, is approximately 2414 m in length with different seasonal flow rates ranging from 0.85 cms in winter to 11.33 cms during Spring. It is along this channel that the City of Pocatello is proceeding with redevelopment plans to create a greenway space through the Old Town section of the city [36]. Adjacent to the concrete corridor, Old Town Pocatello consists of historical buildings and businesses and extends to the Union Pacific Railroad. As a consequence of the effort and interest by the city to enhance ecosystem service provision in Old Town, this site was selected as a suitable area to utilize geodesign tools.
Table 1 shows the sources and attributes of the vector data used for building the 3D city model for Old Town Pocatello. Vector data functioned as base layers for the 3D components in the urban landscape including polygon layers (building footprints and impervious areas), point data (streetlights and trees), and polyline data (streets and the concrete channel).
The sources of raster data used in this study are shown in Table 2. Raster images consisted of 2013 National Agriculture Imagery Program (NAIP) orthoimagery with 1 m resolution and Digital Elevation Model (DEM) data with 1 m resolution collected in 2016 with airborne LiDAR (Oregon Department of Geology and Mineral Industries). Natural textures for 3D objects, such as brick wall textures, window frame textures, etc. were obtained from online sources. The source for 3D objects: streetlights, signs, trees, etc., was collected from the 3D Warehouse website (https://3dwarehouse.sketchup.com/ (accessed on 1 May 2018)). The textures of streetscapes were sourced from default libraries in CityEngine. For landmark buildings, such as Hotel Yellowstone, the Union Pacific railway station, and Bannock County Veterans Memorial buildings in Pocatello, we went to the sites and took pictures around each building.

2.2. Procedural Modeling for Old Town Pocatello

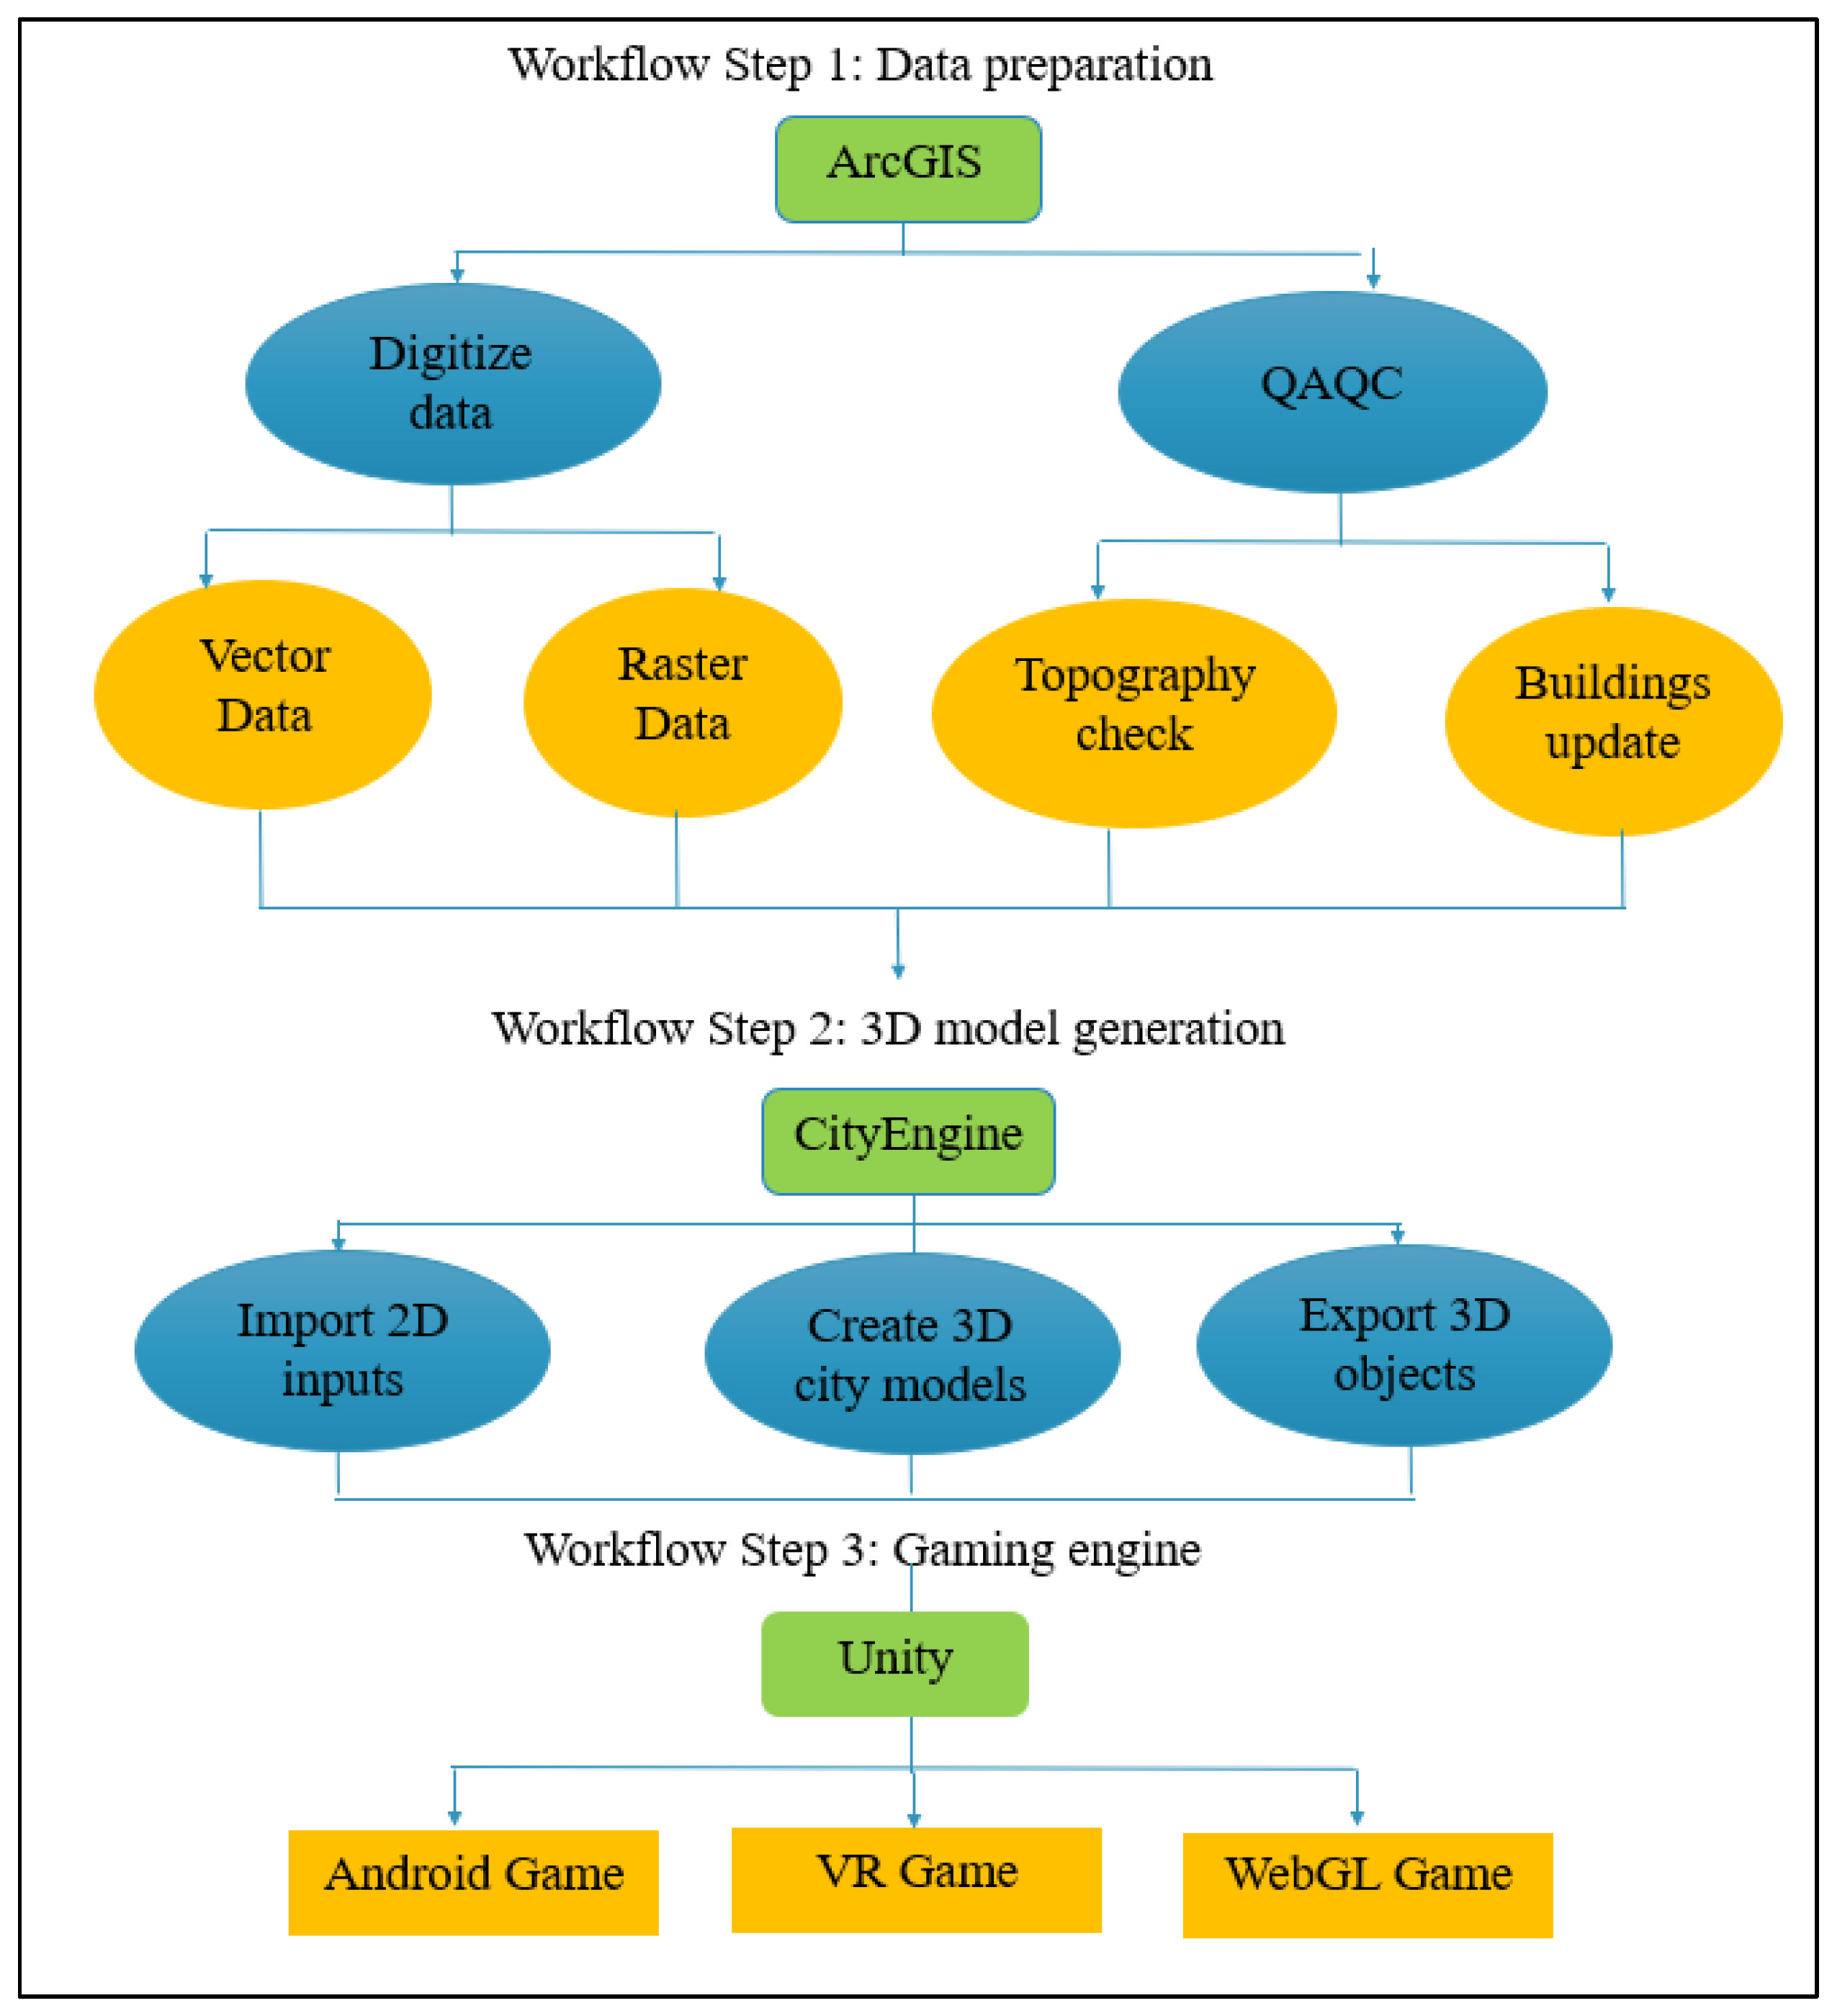
2.2.1. Procedural 3D Model Workflow

Figure 2 illustrates the workflow used to create a 3D procedural model for Old Town Pocatello in its current state. The software used in this study were ArcGIS Pro, CityEngine, and Unity. ArcGIS Pro and CityEngine are Esri software used for preparing data and generating 3D models. Unity is a gaming engine development platform for creating web, mobile, and VR games.

2.2.2. Data Preparation

The 3D city model in CityEngine used digitized vector data and raster images. We digitized GIS layers including green spaces, green blocks, parking lots, railyards, building sidewalks, and impervious areas in Old Town Pocatello based on NAIP imagery. We then populated attribute tables to digitized each layer with related data, such as area type and size. Green spaces were coded as grass and treed areas, including parks and school playgrounds. Green blocks included the surfaces that had partial or less grass coverage than green spaces—specifically, residential backyards. Parking lots in Old Town Pocatello were assigned five attribute categories: commercial, public, residential, school, and business. Commercial parking lots are for customer parking. Public parking lots are the parking spots for their employees that customers do not use. Public parking owned by the City of Pocatello is available to all residents at no charge. School parking lots are a local school’s property. Building sidewalks are the buffer surfaces in front of buildings. Impervious areas are the concrete or compacted surfaces that are barriers for water penetration into soil, thus funneling rainfall quickly over these surfaces into sewer drains or other water catchment infrastructure that channel stormwater into the Portneuf River. Height information for trees and buildings was extracted from a Surface Change Model (SCM), as shown below. A DSM is digital surface model from first return LiDAR data, and the DEM is a digital elevation model derived from last return LiDAR data; both datasets were available from the 1 m resolution DOGAMI LiDAR.
SCM = DSM − DEM
Quality assurance and quality control (QA/QC) checks confirmed the building heights in the footprint data. We corrected the building footprints by updating, deleting, or adding polygons by comparing each footprint to the presence or absence of buildings in the NAIP imagery. Topology rules were applied to verify that the polygon data did not have any overlaps.

2.2.3. Model Generation

CityEngine is a 3D modelling application with a built-in programming language called Computer Generated Architecture (CGA) for procedural modeling [37]. Procedural modelling interactively generates massive objects in 3D urban models [26]. We used a DEM to assign surface elevation to a terrain, and orthoimages to give the terrain model textures in CityEngine. The terrain model can help with aligning and locating other GIS layers with real-world elevations. Each GIS layer was assigned its own CGA rules to generate 3D shapes and render textures based on attributes to make the models look realistic. We generated streetscapes with pedestrians, road markers, and cars using a Esri’s Complete Streets rule, written by David Wasserman in 2015. We also used CGA rules to generate and export statistical reports on housing values and on the year built. A statistical report with total impervious area provided the percentage of impervious coverage in Old Town Pocatello. CityEngine does not have a complete toolkit for geospatial analysis. Our Python scripts made up for this deficiency. Customized Python scripts were applied to run advanced operations such as export selected objects (Appendix A), query by attributes (Appendix B), generate new scenarios (Appendix C), and export a statistical report for selected features (Appendix D). CityEngine can export graphs, shapes, and models while also offering various 3D exporting formats. CityEngine allows users to export a 3D view of the CityEngine model via the Esri Scene Layer Package, CityEngine Web Scene, and 360 VR Experience to ArcGIS Online. We exported all the textures and models to FBX format for immersive visualizations in the Unity gaming engine.

2.2.4. Interactive 3D Applications

Unity is a 3D gaming software with a powerful rendering engine for creating interactive 2D, 3D, and VR content. Unity supports gaming developments on various platforms, including PC, Mac and Linux computers, Android, WebGL, iOS, tvOS, Xbox, PS4, and Universal Windows platforms, as well as Facebook. We built three interactive applications in Unity displaying Old Town Pocatello to assist city planners, business owners, and the public to visualize, interact with, and stimulate discussions about redevelopment options during stakeholder engagement meetings. The visualization products for Old Town Pocatello include: (1) a 3D WebGL application where users can virtually walk inside the city; (2) an Android 3D game where users can drive a virtual car inside the city; and (3) an VR application where users can explore the city in an immersive environment.
The WebGL application loads 3D content on a web-based platform, such as Firefox or Google Chrome. Users can virtually explore the city with a first-person point of view. We used the Standard Assets package from Assets Store that has 3D assets and scripts for interactions, including first-person avatar, third-person avatar, car, aircraft, rollerball controllers, and cross-platform libraries. The function of the player’s view was assigned from a pre-scripted first-person shooter (FPS) controller. The FPS controller has an invisible capsule collider scripted by C# that has variables including walking speed, running speed, etc. The FPS controller leads the avatar to walk towards the direction where the camera is facing. We set the controller parameters to allow our users to rotate their view and control their movements with a mouse and WASD arrow keys.
The mobile game we developed lets users control a car inside the 3D city model using a joystick on Android devices. The main components derived from the Standard Assets package in this mobile application were a car model, a joystick control, and cross-platform libraries. The moving speed of the car is adjustable through a C# script. Users may virtually drive the car with a joystick button located on the bottom left of touchscreen devices. We added user interface (UI) buttons at the upper right corner that allow players to reload the scene. We also moved and attached the main camera to the back side of the car so the camera will move with the car. The application was built and exported as an apk file that can be installed on Android devices.
For an interactive VR perspective, we developed a touchpad walking simulation where players can virtually explore Old Town Pocatello with touchpad control on the HTC Vive system. To connect this application with the VR system, we imported the SteamVR plugin in Unity. The SteamVR plugin, maintained by Valve corporation, helps developers connect with one PC VR headset, load 3D models, and handle inputs for VR controllers (Unity 2016). We also imported the VR toolkit (VRTK) package in Unity that provides interacting functions in VR environments. The VRTK has a touchpad walking script that was added to a camera rig, so one can navigate the scene in a first-person’s view; the players walk towards the direction they face.

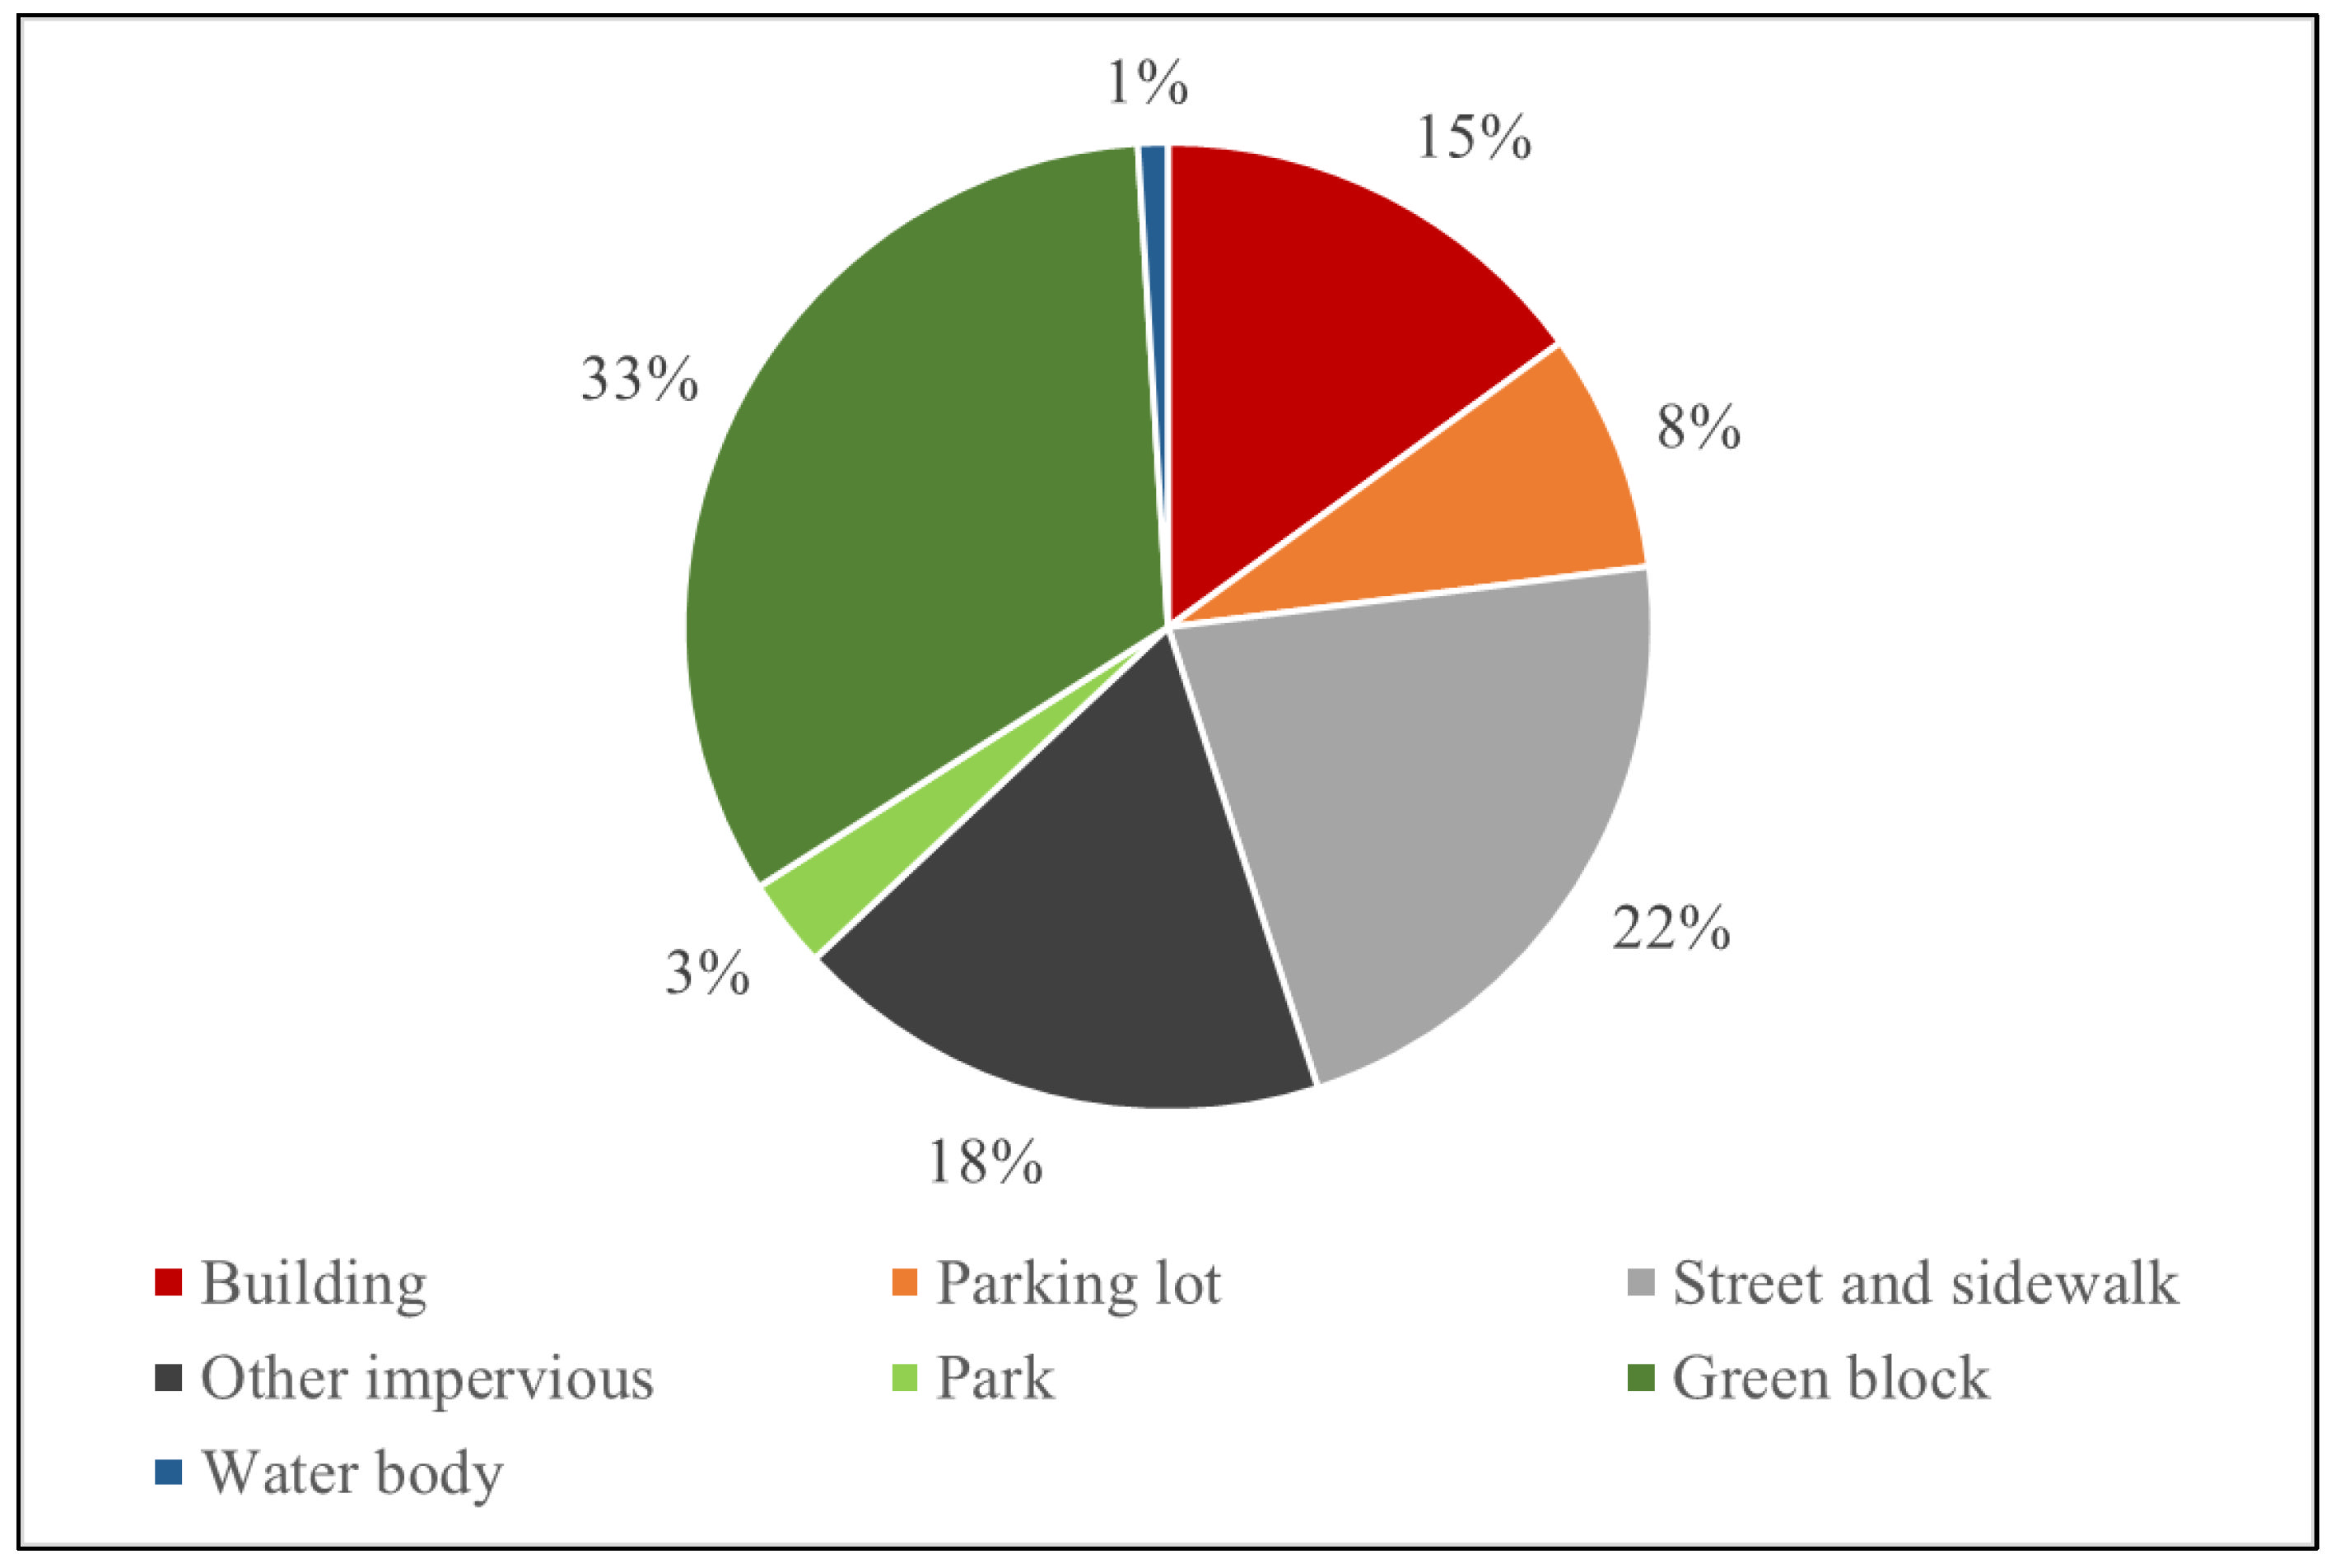
2.3. Ecosystem Services Modeling for Impervious Surface

A major concern for City of Pocatello planners for Old Town redevelopment is managing stormwater runoff to control flooding. Minimizing impervious coverage can reduce urban heating and stormwater runoff [38,39]. We proposed a green scenario, where more trees were added, and impermeable parking lots were replaced by turf blocks. We used i-Tree modeling software to choose planting sites. The i-Tree software, developed by the USDA Forest Service, consists of a set of tools that can quantify the ecosystem service benefits of trees across parcels, neighborhoods, and cities [40]. The proposed trees that can be planted in Pocatello from an i-Tree model has a “PPA_V_Pct” attribute, which is the percentage of possible planting areas for vegetation ranging from 0 to 100. The suitability value was calculated based on Normalized difference vegetation index (NDVI), which is the commonly used index for estimating biophysical property of vegetation coverage [41]. If the areas are covered by roads, they are considered unsuitable for planting. We selected planting suitability between 30 and 100% in Old Town Pocatello, yielding 248 trees. These 248 trees would be planted in the proposed future scenario. To estimate the cost of trees, we referenced a report from the Pocatello Chamber of Commerce. The average cost for a tree in Idaho is approximately USD 45. The green parking lots are defined as turf-based parking lots made of concrete or plastic grids and grass providing aesthetic and environmental benefits in urban areas [42]. The cost of turf-based parking lots is between USD 41 and 48 per square meter in Pocatello at 2019 prices, according to Remodeling Expense (https://www.remodelingexpense.com/costs/cost-of-turf-blocks/ (accessed on 1 May 2020)).

3. Results

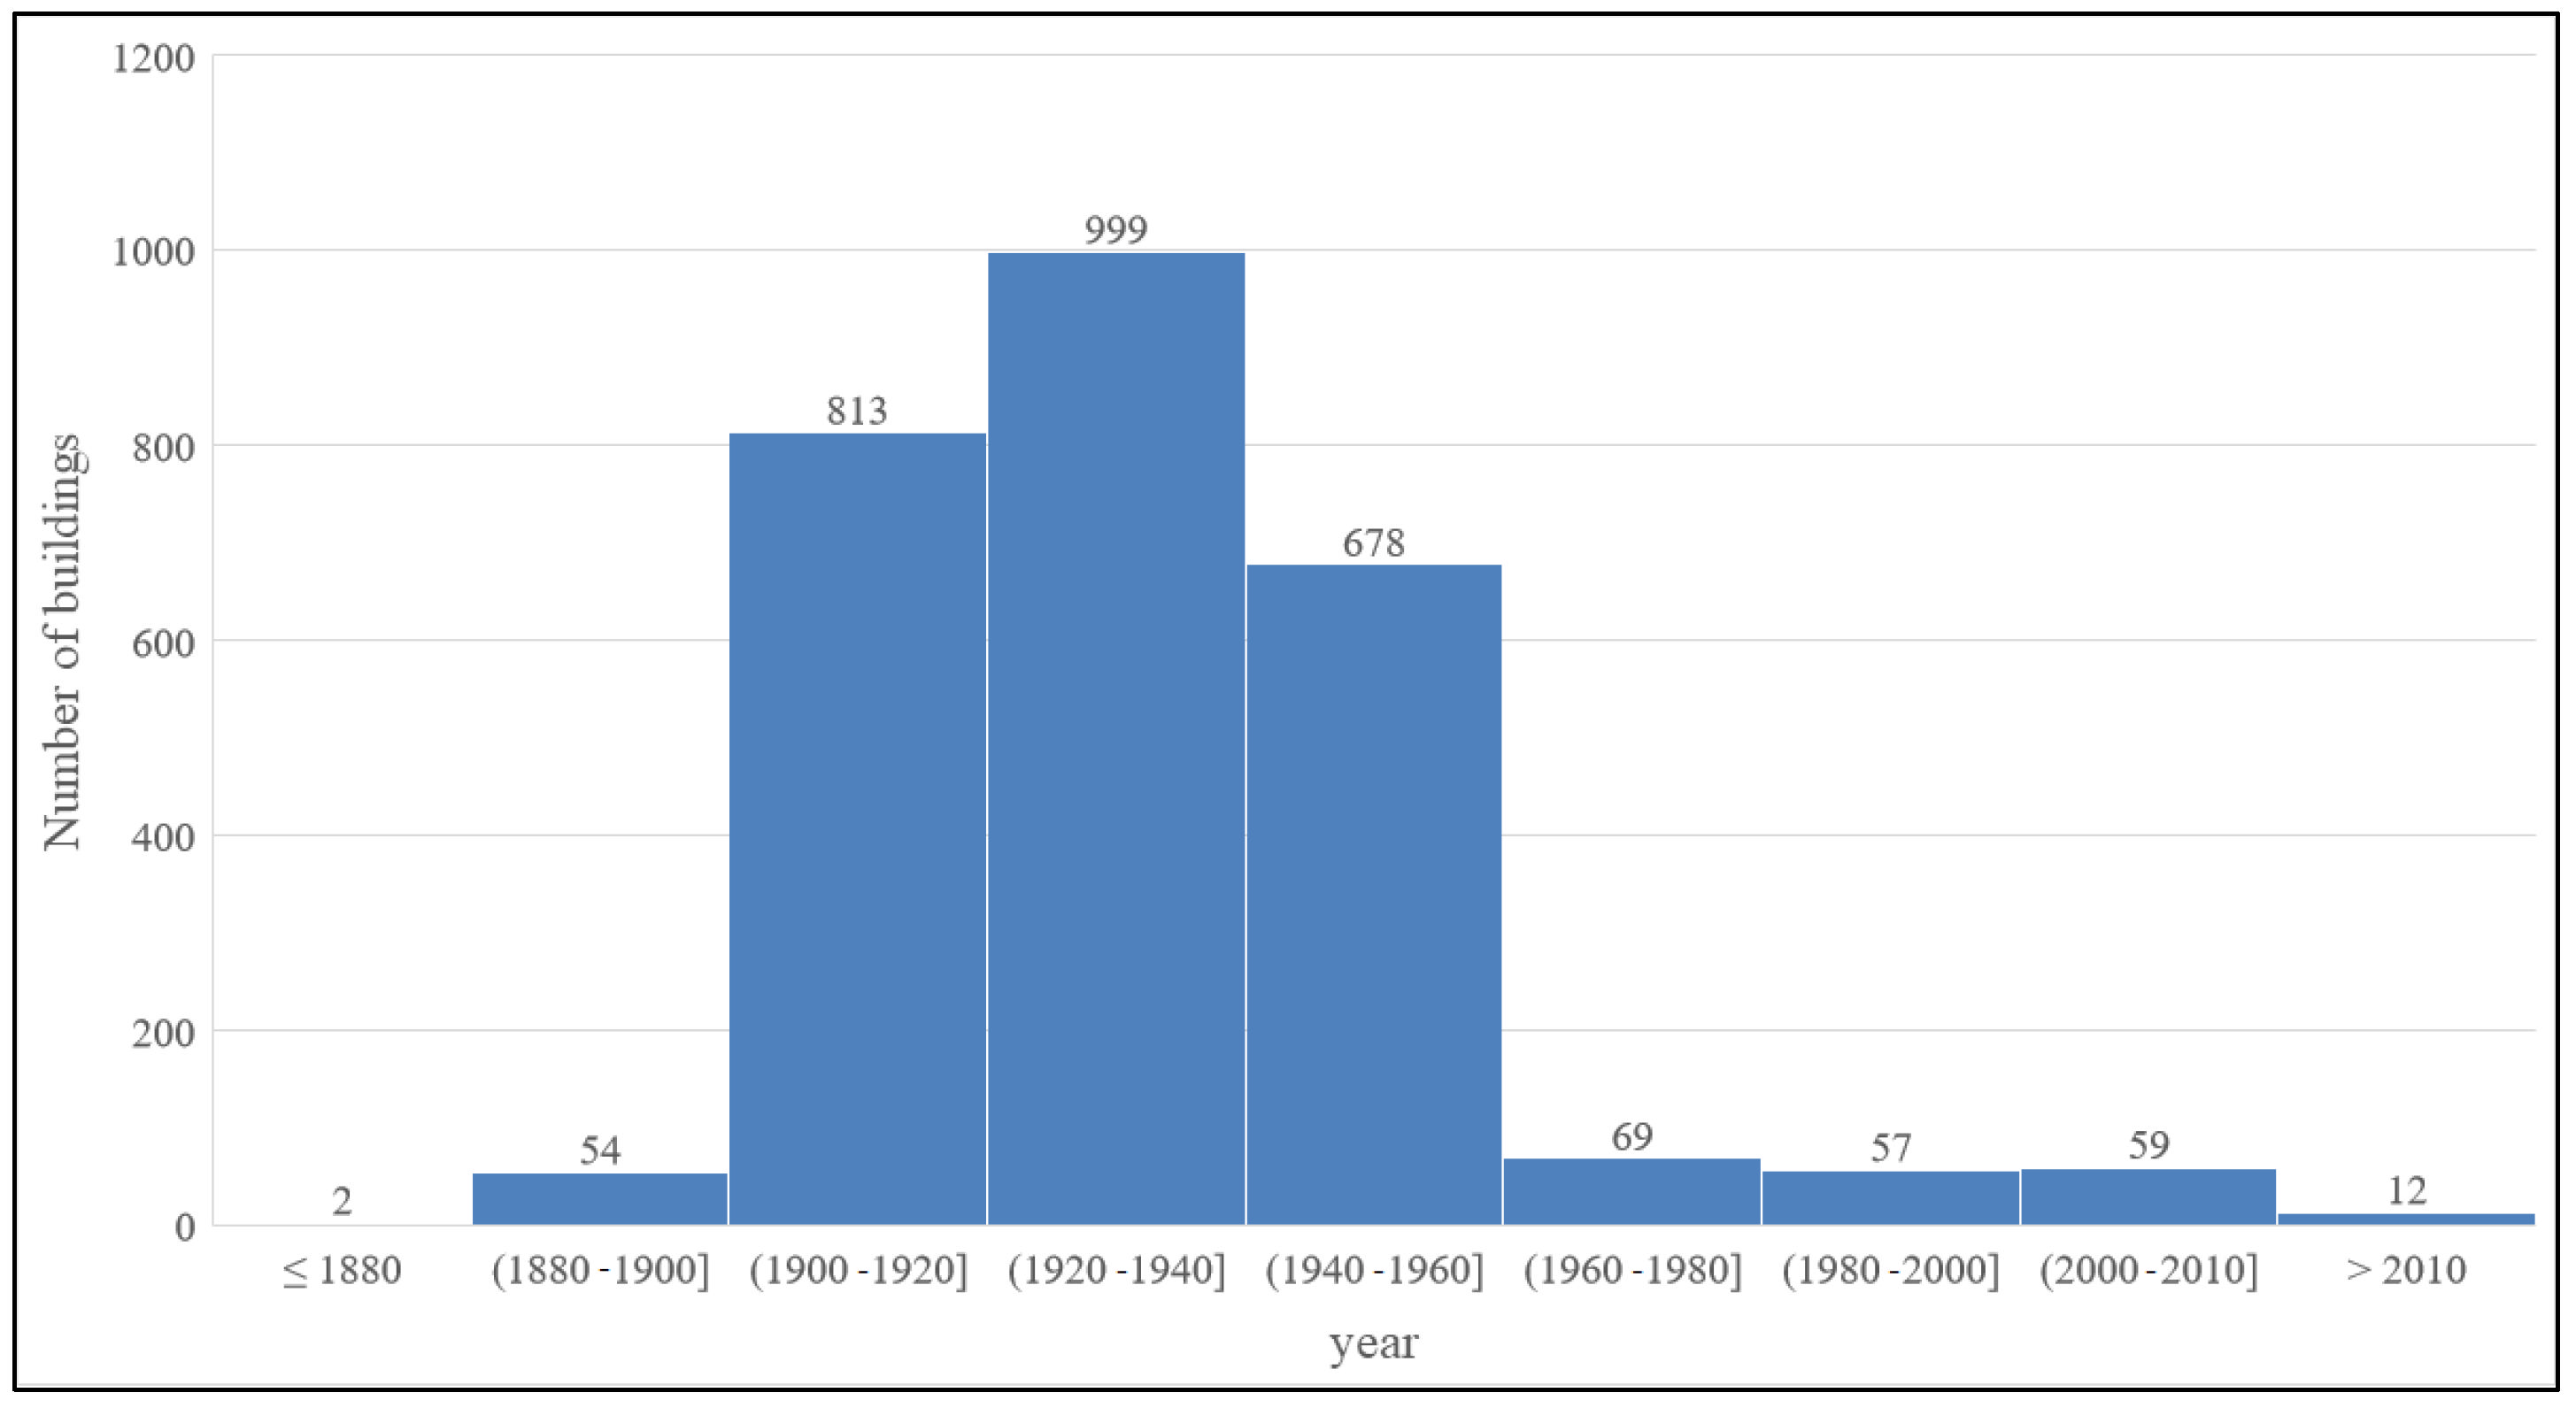
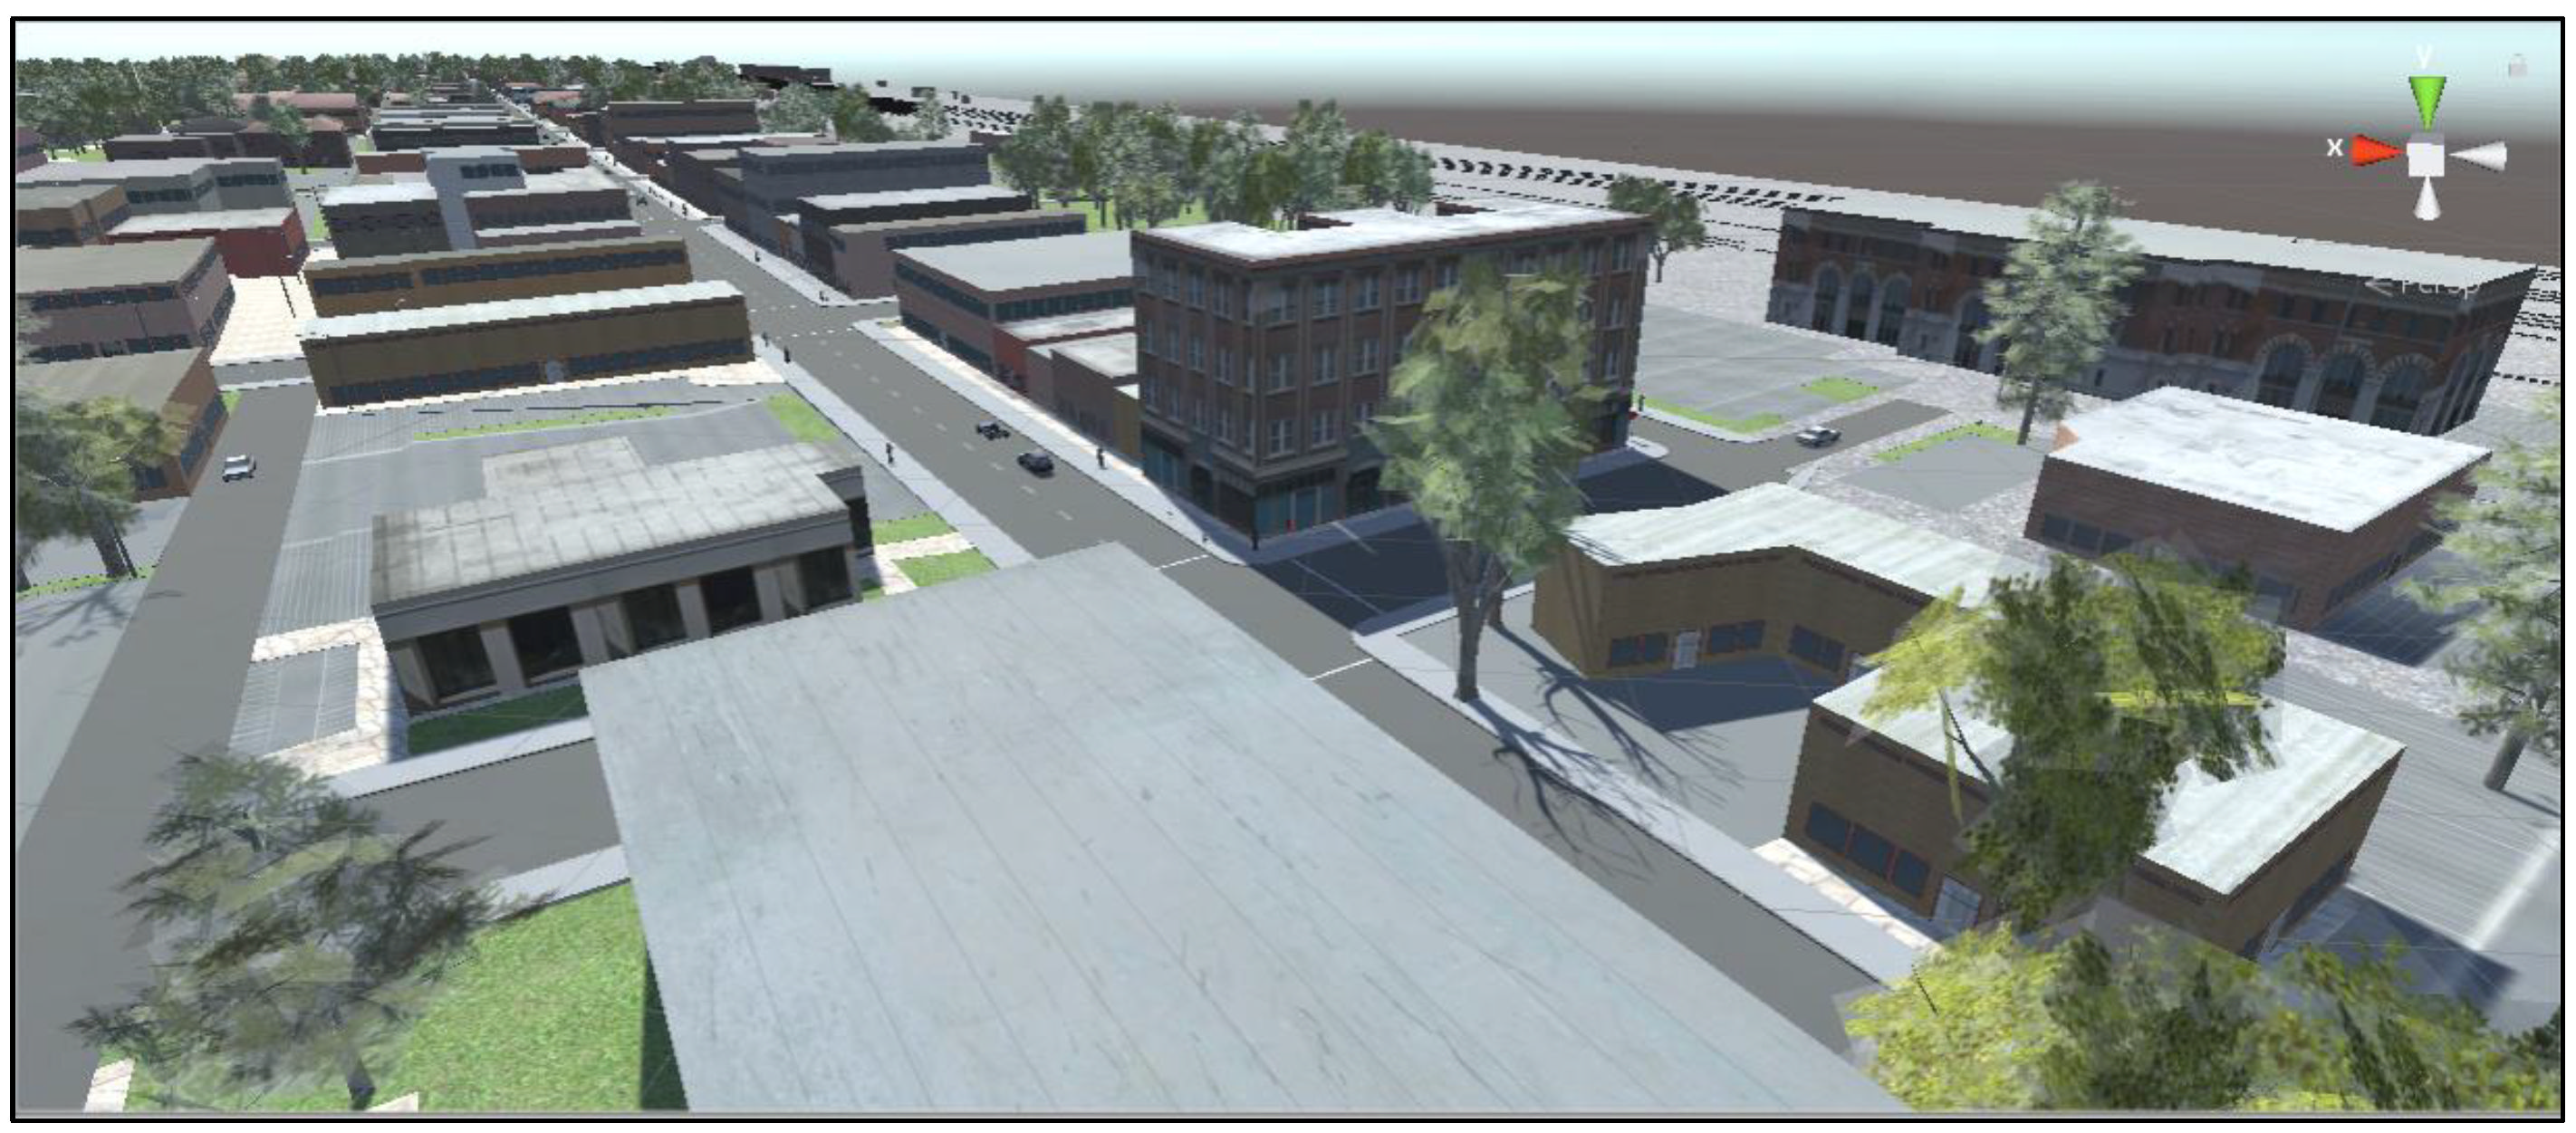
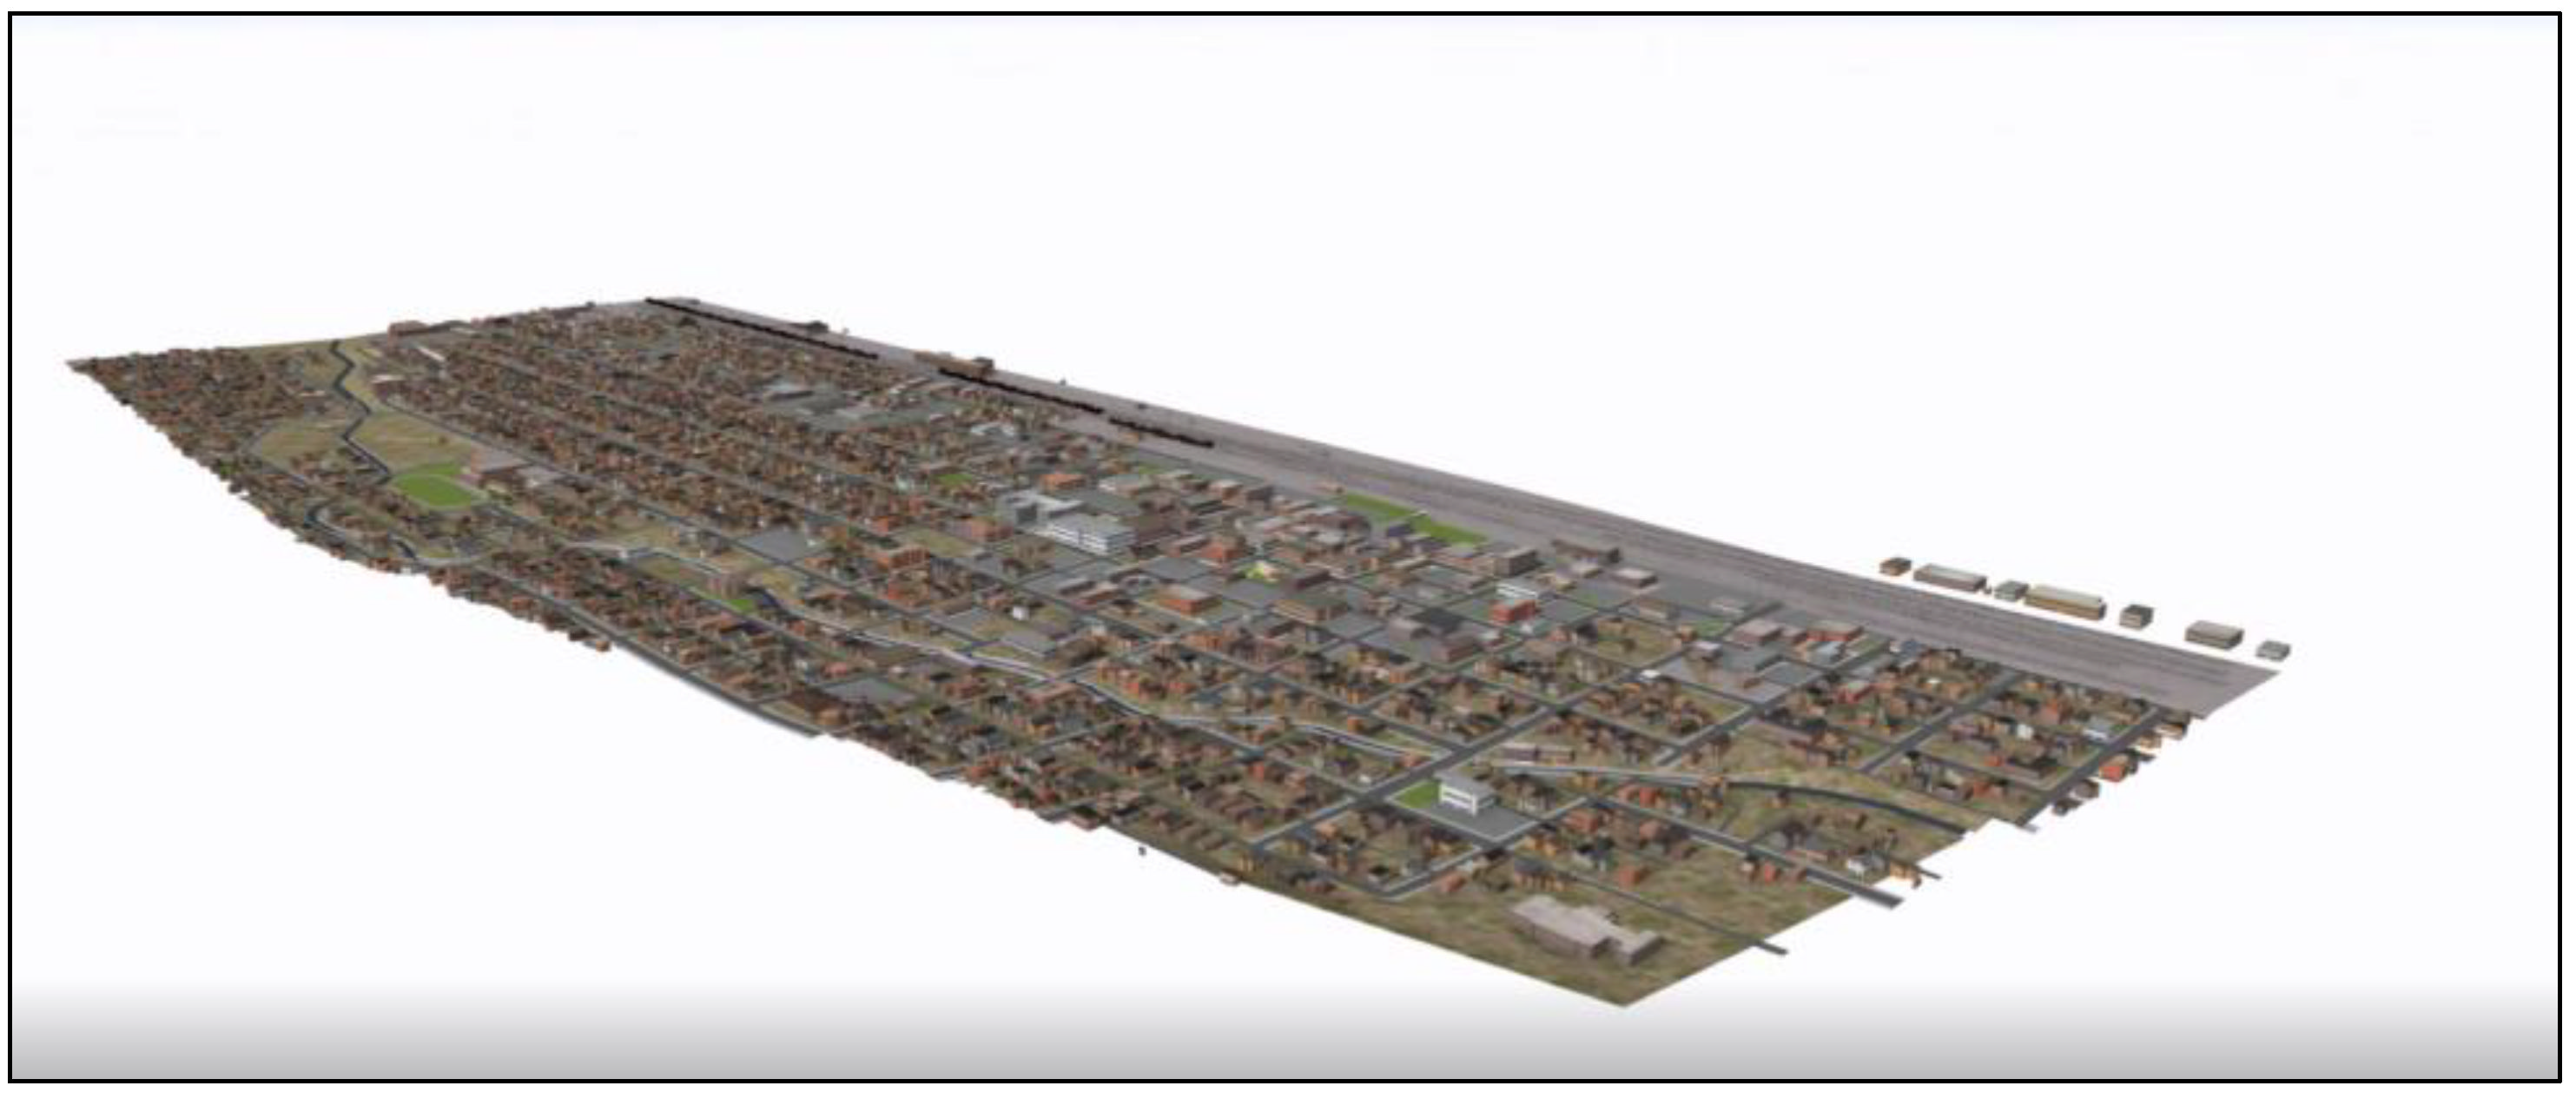
3.1. Procedural 3D Model for Old Town Pocatello

3.1.1. Scripting Reports for Urban Planning in Old Town Pocatello

Components of the 3D city model include a 2D GIS dataset displaying landcover types and percentages in Old Town Pocatello (Figure 3). In this case study, our Python scripting report provided several metrics to quantify Old Town impervious surface cover, landcover type, and year built for buildings. The total area was 2,831,722.1 m2. The major landcover type was impervious surfaces at approximately 63%. The impervious surfaces consisted of streets and sidewalks (22%), other impervious (18%), buildings (15%), and parking lots (8%). Residential green blocks were unoccupied or undeveloped parcels with a mix of plant and dirt cover and accounted for 33% of the entire area. The remaining landcover types were parks (3%) and water bodies (1%).
The total area of building coverage in Old Town Pocatello was 414,341.8 m2 with 2762 buildings (Figure 3 and Figure 4). Over 90% of the buildings in the Old Town Pocatello were built between 1900 and 1960 (Figure 4). Only 7% of the buildings were built after 1960, and the rest were likely built before 1900. There were 19 buildings that did not have built-year records. Old Town Pocatello had 162 parking lots covering 221,622 m2. Most (52%) of the parking lots in this area were for commercial use (Figure 5). Twenty percent of the parking lots were for business purposes; residential parking lots accounted for 18% of the total. Schools and public parking lots had the same coverage of 5%. There were seven parks included in this study area: Pioneer Park, Simplot Square, Old Town Park, and Raymond Park; they covered 73,888 m2 in total.

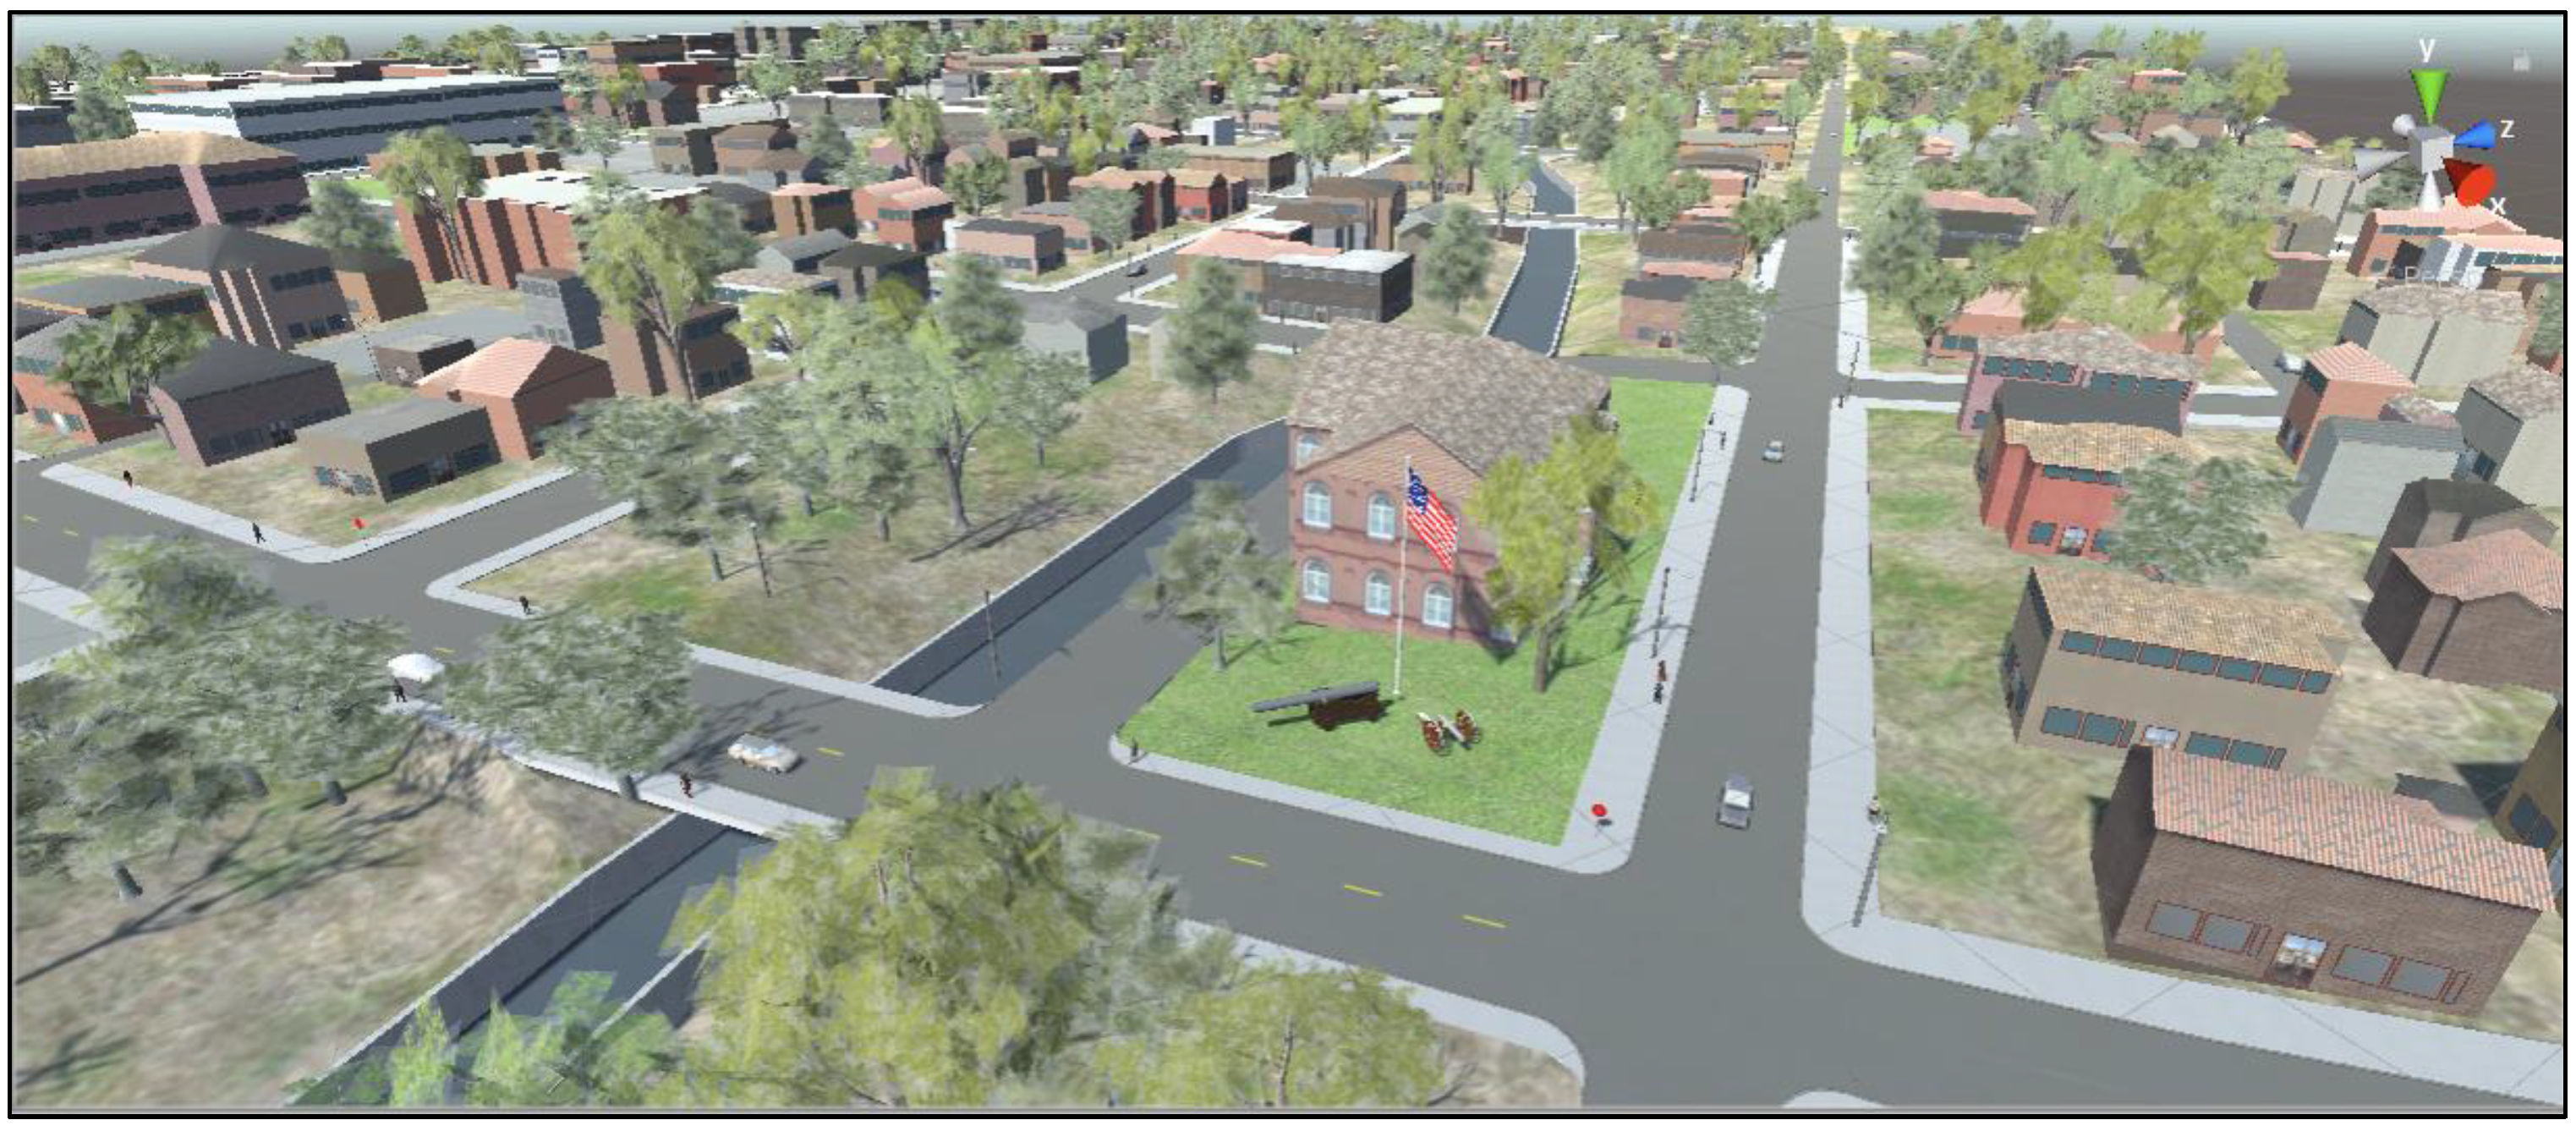
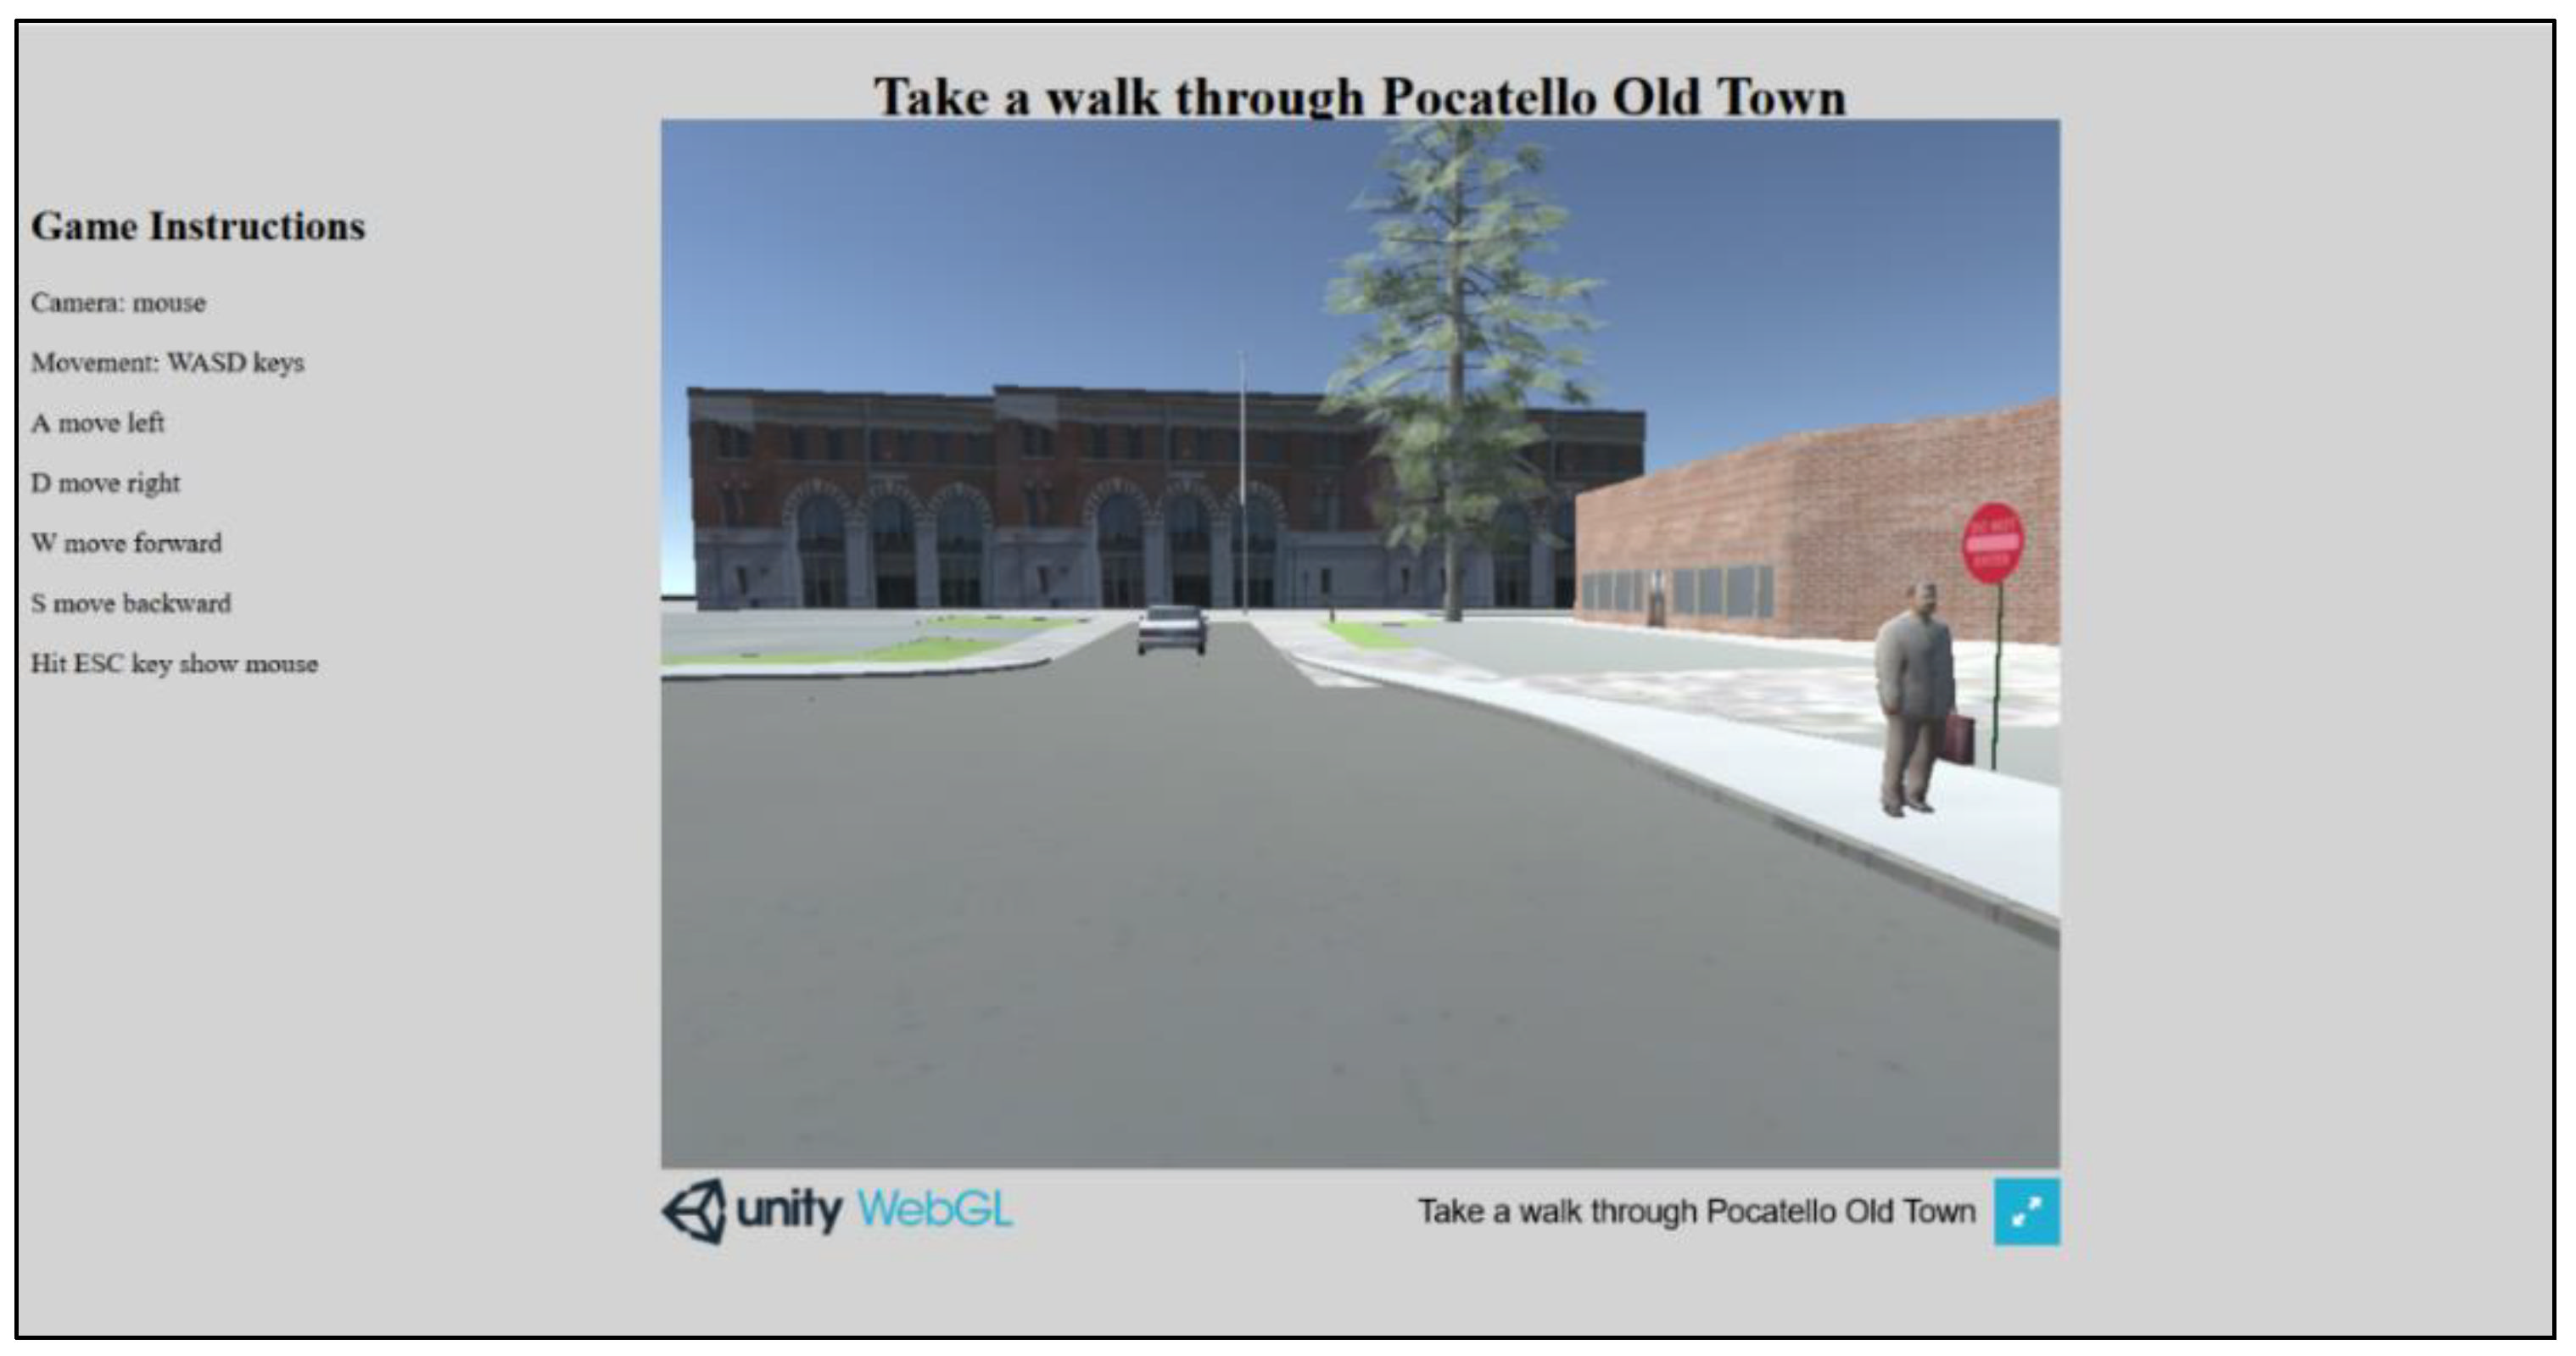
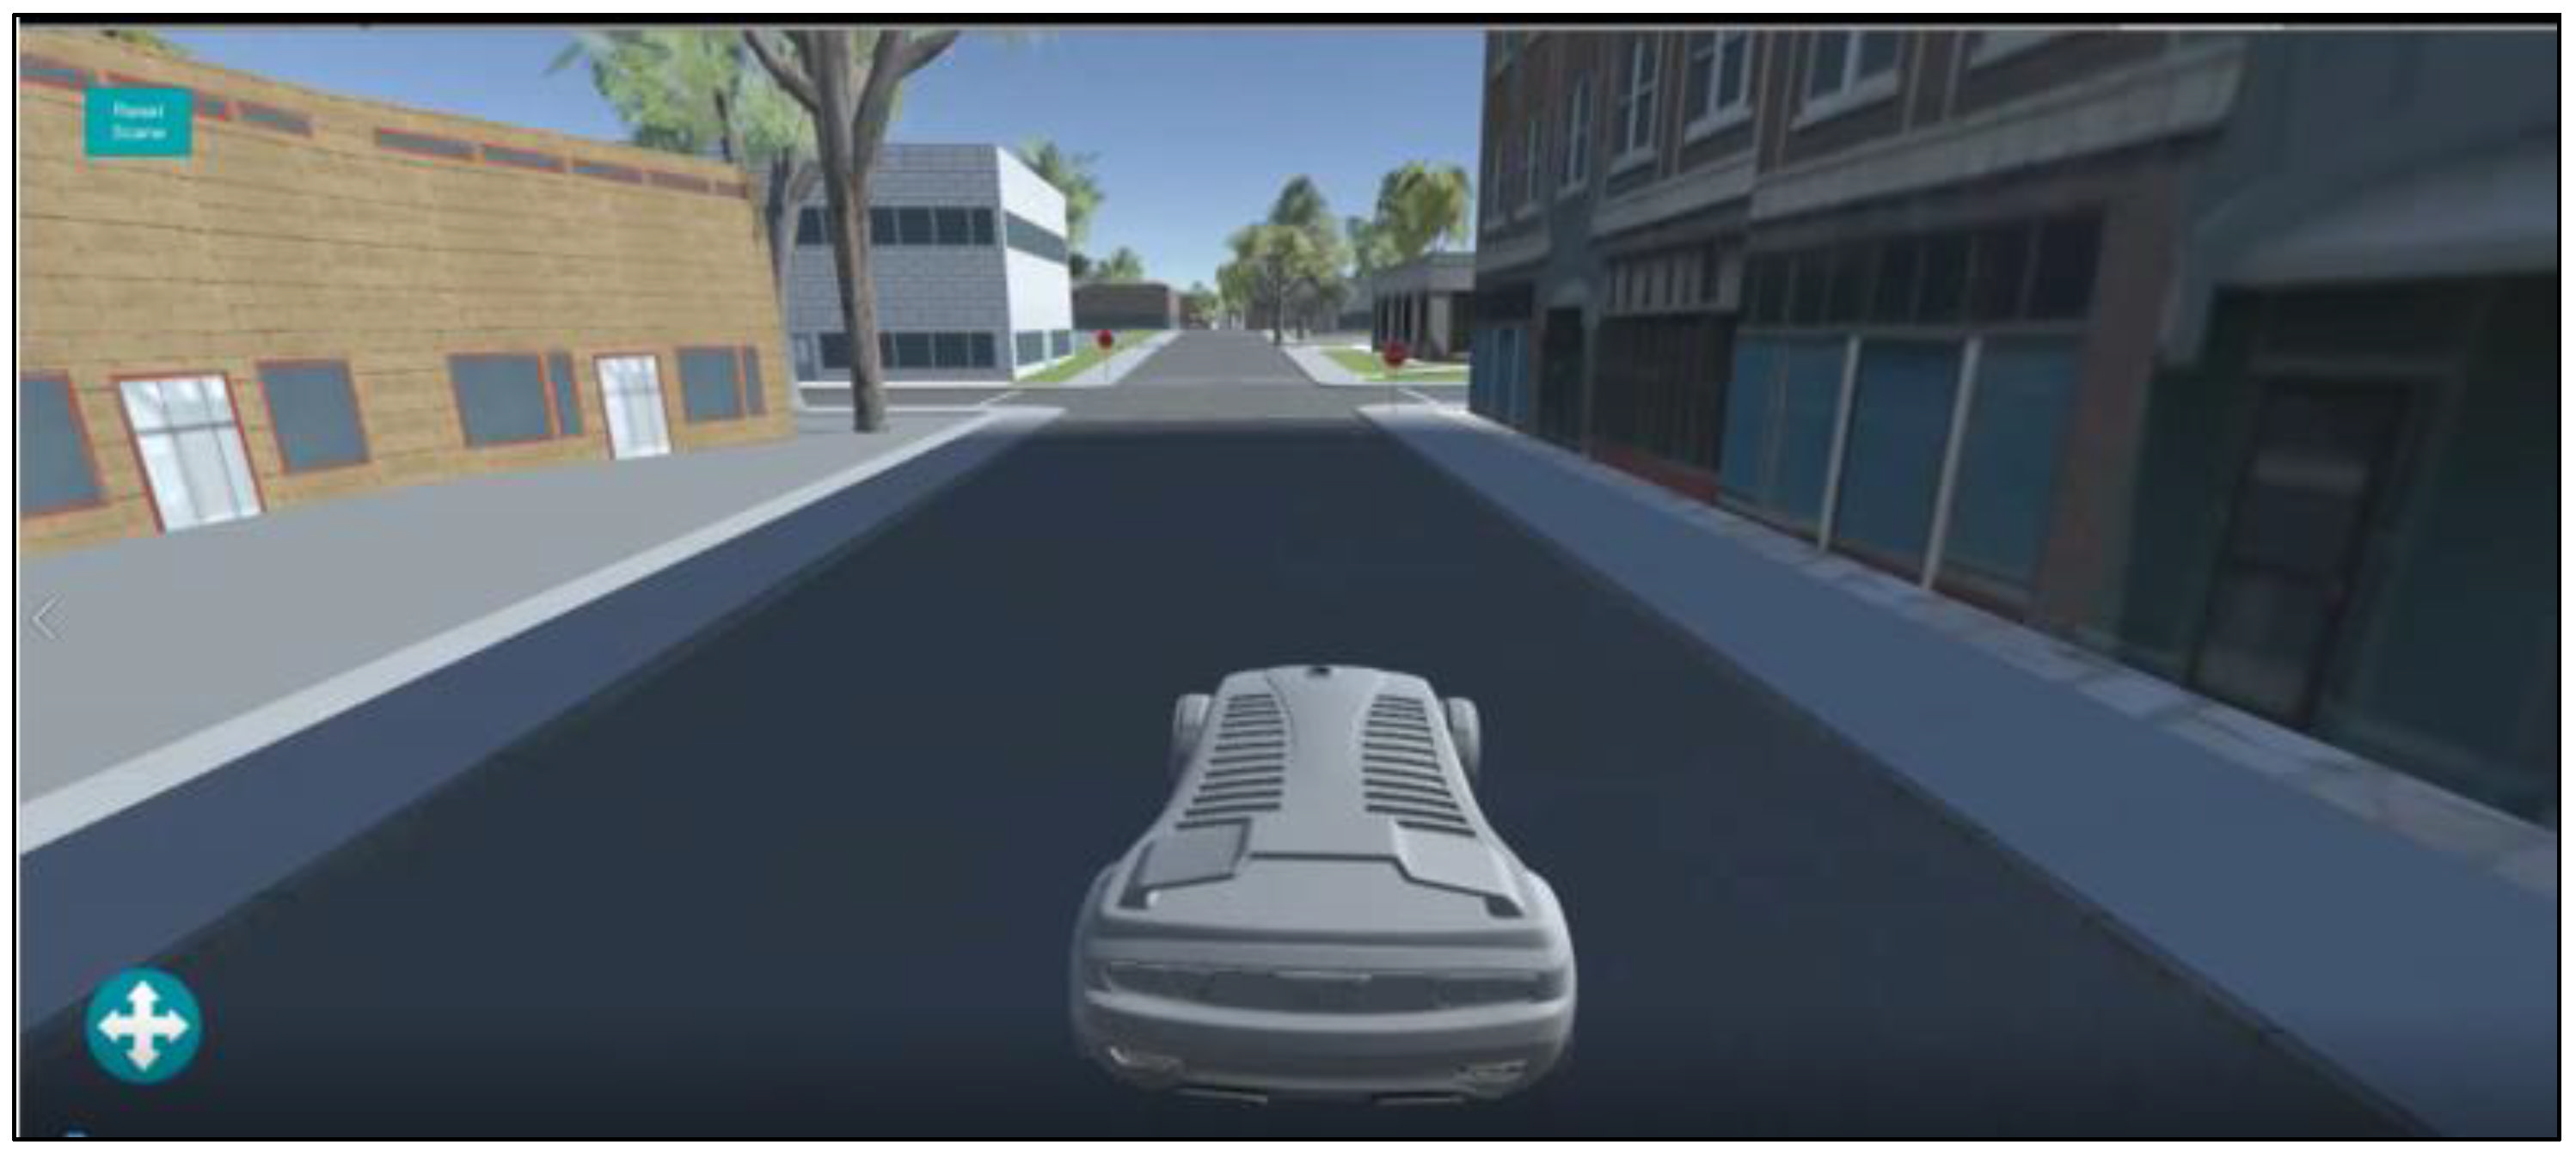
3.1.2. Interactive 3D Applications

The overview of the present-day 3D scenario in Pocatello Old Town is shown in Figure 6. The 3D city model included buildings, the concrete channel reach of the Portneuf River, parking lots, streets, trees, hydrants, pedestrians, cars, etc. The concrete channel flows through Old Town Pocatello and separates the study area into two sections. A zoom-in function is available for viewing details in this 3D model. For example, the Hotel Yellowstone, Union Pacific Railway Station, and Bannock County Veterans Memorial Building have real-world textures and act as landmarks in the 3D model (Figure 7 and Figure 8). The concrete channel reach is shown in Figure 8.
We published the interactive WebGL application for the Old Town Pocatello on Idaho State University’s Geo-visualization website that is publicly available for anyone to view and interact with. (http://geoviz.rdc.isu.edu/Walking/WalkingInDowntownPocatello.html (accessed on 1 August 2022)). The instructions are on the left side of the screen (Figure 9). Players can rotate the camera’s view with a mouse and virtually walk forward, backward, left, and right in the city with WASD keys or arrow keys. Firefox and Chrome are recommended browsers for this application because they support loading and rendering WebGL contents.
We built the mobile 3D application for the Old Town Pocatello in Android application package (APK) format. Players can virtually drive a car in the city with a joystick on the bottom left (Figure 10). The white arrows indicate different directions where a user may drive. The starting location is next to the Hotel Yellowstone. The UI button for restarting the game is in the left top corner. This mobile game is also free to the public and supports Android and Windows systems. The apk file or the executable file is available for download at the Managing Idaho’s Landscapes for Ecosystem Services (MILES) website (https://www.idahoecosystems.org/products (accessed on 1 August 2022)).
Users can virtually walk inside Old Town Pocatello. The application for an immersive VR experience launches and runs in Unity. The user wears an HTC Vive headset, holds two controllers, and stands inside the tracking area. The tracking area is a room-scaled area defined by two base stations to detect the headset and controllers’ presence, rotation, and position. Users can move their avatars in the 3D scene via a touchpad to go left, right, forward, or backward. The HTC Vive visualization work is archived in the MILES data and model repository (https://www.idahoecosystems.org/products (accessed on 1 August 2022)).

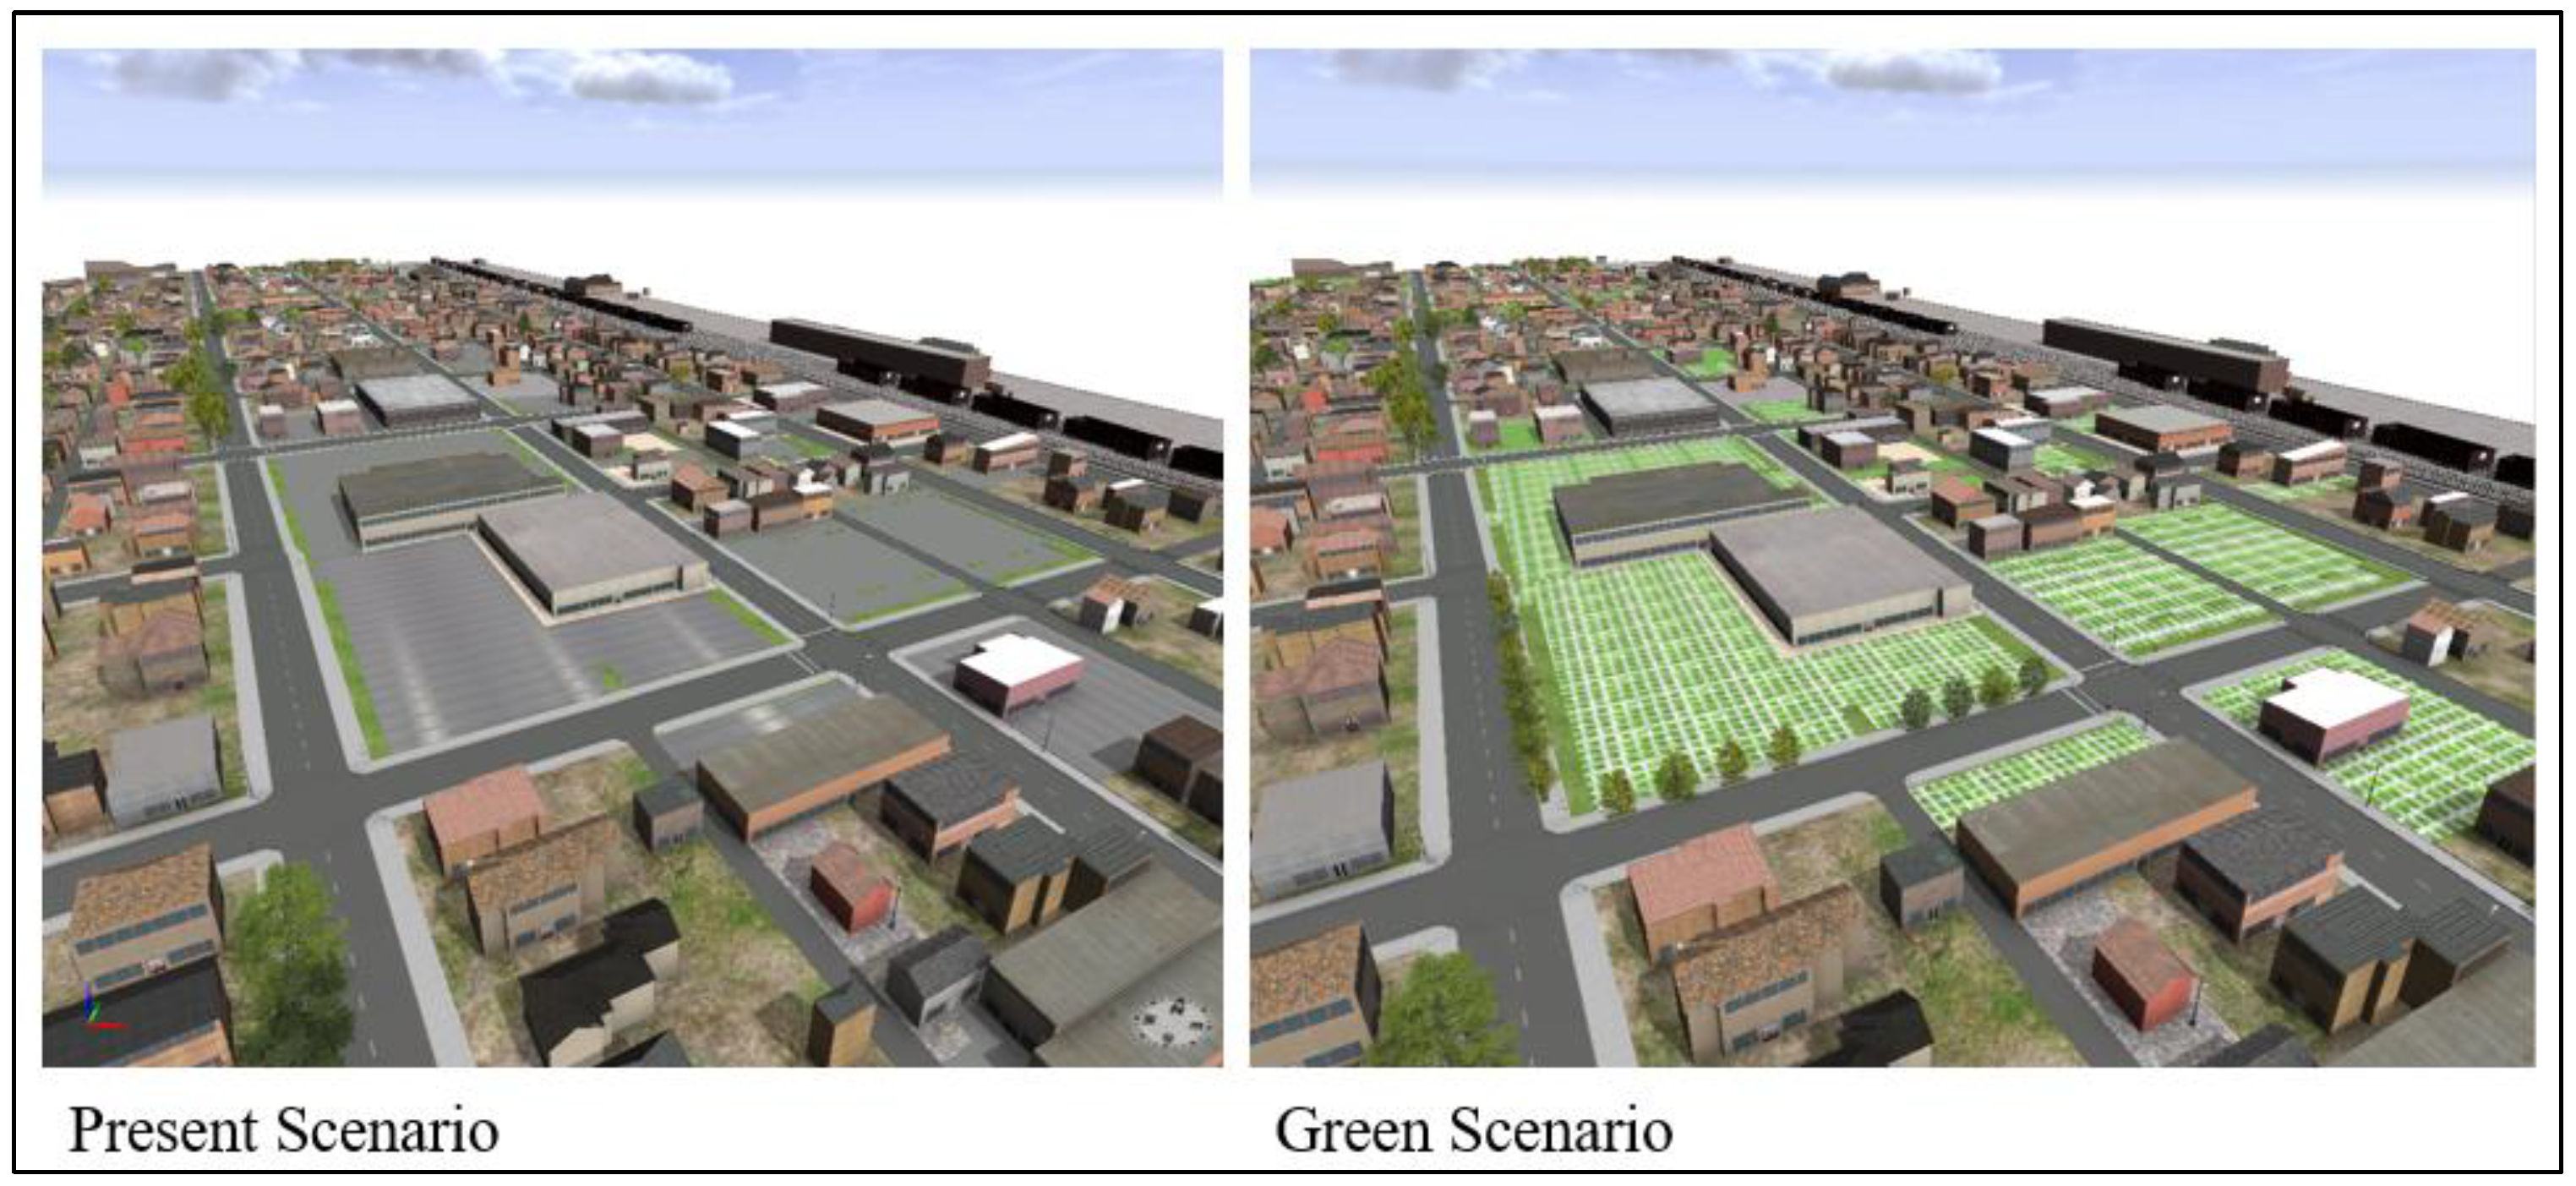
3.2. Modeling Scenarios for Measuring Ecosystem Services for Old Town Pocatello

In our proposed green scenario, all impervious parking lots in Pocatello (226,538 m2) were replaced by the green parking lots consisting of permeable turf blocks and semi-permeable paved areas. In addition, 248 trees were added to maintain and preserve local ES, such as mitigating urban heat island effect and improving water quality. To visualize and compare the changes in a real-world location and volume, Figure 11 displays the present-day scenario and a proposed green scenario at a block scale in a 3D model near the Hotel Yellowstone building in Old Town Pocatello. The percentage of total permeable surfaces in the Old Town area increased from 37% to 45% including green blocks (33%), green parking lots (8%), parks (3%), and water bodies (1%). The estimated cost for the trees was USD 11,1600 in 2019. The corresponding cost for the total area for turf-based parking lot in the proposed scenario (226,538 m2) was between USD9.3 million and 10.9 million in 2019.

4. Discussion

It is difficult to comprehensively implement sustainable urban development without appropriately interpreting and visualizing associated environmental and urban infrastructure data. This case study provided a complete workflow to build an interactive 3D city model for Old Town Pocatello using a procedural modeling approach and introduced modeling methodologies to visualize impacts on ecosystem services and to analyze statistical reports from reducing impervious surfaces and increasing green spaces in a proposed scenario in Pocatello, Idaho.
Procedural modeling can address the limitations faced by conventional 2D and 3D modeling approaches used in urban design. CityEngine software has procedural modeling capabilities and provides a platform that can effectively create 3D urban models across a large area ranging from a neighborhood to an entire city [43]. In this case study, we built a cityscape simulation for Old Town Pocatello based on a 2D GIS dataset, including building footprints, parking lots, trees, etc. The process for model generation for all layers took approximately 8 min on a laptop computer with an i7 processor of four cores, and 16 GB RAM, while more time is required with conventional 3D modeling software, such as Blender, MeshLab, and Sketchup [44]. Procedural modeling can generate different city scenarios for low cost by applying CGA rules in CityEngine.
Procedural 3D modeling has the potential to aid urban planners, stakeholders, and the public to query and visualize potential development scenarios for better urban plans [29]. The two main software used in the model generation process were CityEngine and ArcGIS Pro, which are commonly used in many countries and cities. Since they are both Esri software products, there are no barriers to import and load 2D spatial components in 3D modeling software. Although we can benefit from CityEngine’s procedural modeling capability, it is still a relatively new software for 3D modeling that lacks geospatial analysis tools. We wrote customized Python scripts to offset this deficiency (Appendix A, Appendix B, Appendix C and Appendix D). Scripts, such as exporting statistics for selected objects and generating new scenarios, can help city planners to quantify and visualize the data for a region of interest (ROI). For instance, impermeable surfaces can cause serious environmental problems, including water pollution, flooding, and heat island effects. The building-built year histogram displays the built year distribution for the buildings in Old Town Pocatello (Figure 4). City designers can use the histogram to find the buildings that are old and have low value and could be redeveloped into affordable housing or used for other purposes.
Although CityEngine is an effective software for building 3D models, there are some limitations, such as the high cost of required computing resources and software licenses [14,45]. Preparing data for 3D models can be time consuming because procedural modeling requires more 3D-related attributes for automatic model generation. For example, the roof type attribute needs manual inputs since most of the building footprint data commonly available for cities do not record it. CityEngine allows users to share and publish contents in a web scene; however, it lacks immersive user interaction. We used Unity software to add the option of immersing users into our scenarios across accessible platforms. The published web game, VR application, and mobile game offers multiple platforms for users to engage in urban design by perceiving and interacting with the scenarios virtually by walking or driving inside Old Town. Residents can visualize the urban layout in the Old Town area and can propose redevelopment ideas to planners. In addition, the applications can help with geodesign education and outreach for K-12.
The City of Pocatello is looking at opportunities for redeveloping the Old Town area. The City has initiated projects to enhance local ecosystem health, recreation access, and economic development. The City launched the Portneuf River Vision Study in December 2016 with objectives to revive the relationship between communities along the Portneuf River by improving river corridor management and providing riparian restoration [46]. The research team studied the trade-offs and synergies of ES along the Portneuf river corridor and made recommendations based on balancing ecosystem health, public participation, and economic development. We proposed a green scenario for a case study in Pocatello where 248 trees and 226,538 m2 of green spaces were added. Impervious coverages in urban areas have a negative correlation with provisioning ES, especially soil-based ES, such as water quality and climate regulations, and as urban heat island effects [47,48]. The impervious surfaces near river corridors may bring surface pollutants to water bodies through runoff events [49]. Urban green spaces play an major role in contributing to urban soil-based ES impacting water quality regulation and carbon sequestration [50]. In addition to the green scenario, this city model is also capable of creating other scenarios with customized CGA rules and providing reports with simulated ES valuation and statistics.
The 3D model for Old Town Pocatello in its current state can assist city planners and stakeholders visualize different scenarios at a block scale (Figure 11). It can also assist planning authorities to visualize and assess spatial contrast at city-scale in different development scenarios. This procedural 3D model for Old Town Pocatello can assist city planners to visualize design scenarios and analyze impacts to local ES in real-time and in a real-world volume. More ES measurements can be implemented in the future by building upon our impervious surfaces and green scenario tool. The methods and framework introduced in this study are also applicable to other small and mid-size cities worldwide that face challenges in sustainable urban development. For example, many cities in Southeast Europe require a more sustainable system for transport, energy, water, and waste management [51]. This study has the potential to assist with the planning and visualization of future development scenarios worldwide.

5. Conclusions

City planners often consider social and economic functions as main factors for land use planning; the impacts to natural resources are therefore of lower priority [52]. It is necessary for city planners to understand the impacts on local ES from different scenarios to foster a sustainable, growing city. Integrating 3D city models and ES modeling in urban design can help city planners and stakeholders find a balance between urban infrastructure and sustainable urban ecology. The geodesign visualization proposed in this study not only can assist city planners to visualize designs in real-time and in a real-world environment, but also bring ES factors to planning processes early on. In this case study, we addressed and modeled green space and impervious surface coverage in the study for urban planning with the ability to add on to this functionality. Future improvements will be to add more ES factors and upgrade the 3D city model into a web application where city planners can interact with 3D models to build different scenarios and visualize the impacts on ES in real time. The geodesign tools with procedural modeling introduced in this study could help cities to grow and redevelop with ecosystem services at the forefront of planning considerations.

Author Contributions

Conceptualization, X.Y. and D.D.; methodology, X.Y. and D.D.; software, X.Y.; validation, X.Y. and D.D.; formal analysis, X.Y. and D.D.; investigation, X.Y.; resources, X.Y. and D.D; data curation, X.Y.; writing—original draft preparation, X.Y.; writing—review and editing, X.Y. and D.D.; visualization, X.Y.; supervision, D.D.; project administration, X.Y. and D.D.; funding acquisition, D.D. All authors have read and agreed to the published version of the manuscript.

Funding

This study was funded by Idaho EPSCoR’s Managing Idaho’s Landscapes for Ecosystem Services (MILES) program (National Science Foundation award number IIa-1301792) and by Center for Advanced Energy Studies (CAES).

Institutional Review Board Statement

Not applicable.

Informed Consent Statement

Not applicable.

Data Availability Statement

Not applicable.

Acknowledgments

I would like to thank the City of Pocatello for providing the data for this research.

Conflicts of Interest

The authors declare no conflict of interest.

Appendix A

Export selected objects Python Script
ce = CE()
REPORT = “”
def initExport(exportContextOID):
 global REPORT
 REPORT = "Property Type,Year Built,Gross Floor Area,\n"
def finishModel(exportContextOID, shapeOID, modelOID):
 shape = Shape(shapeOID)
 model = Model(modelOID)
 global REPORT
 reports = model.getReports()
 if reports[‘Property Type’]!=None:
  PT=str(reports[‘Property Type’][0])
 else:
  PT="Null"
 if reports[‘Built’]!=None:
  YB=str(reports[‘Built’][0])
 else:
  YB="Null"
 if reports[‘Gross Floor Area’]!=None:
  GFA=str(reports[‘Gross Floor Area’][0])
 else:
  GFA="Null"
REPORT +=‘{0:2d} {1:3d} {2:4d} \n’.format(PT, YB,GFA)
def finishExport(exportContextOID):
 file = ce.toFSPath(“models”+“/instanceMap.txt”)
 FILE = open(filename, “w”)
 FILE.write(REPORT)
 FILE.close()

Appendix B

Select by attributes Python Script
# Get a CityEngine instance
ce = CE()
# Select buildings by built year
def SelectBuildingsByYear(YearBuilt):
 objects = ce.getObjectsFrom(ce.scene())
 selection=[]
 for o in objects:
  attrvalue = int(ce.getAttribute(o,“/ce/rule/Built”))
  if attrvalue!=None:
   BuiltYear=int(attrvalue)
   if BuiltYear>YearBuilt:
    selection.append(o)
 ce.setSelection(selection)
if __name__ == ’__main__’:
 SelectBuildingsByYear(1990)

Appendix C

Generate new scenarios Python Script
#Change the selected buildings into green parking lots
def BuildingToParkinglot():
 objects=ce.getObjectsFrom(ce.selection())
 for o in objects:
  ce.setRuleFile(o,“rules/ParkingLot.cga”)
  ce.setStartRule(o,“Lot”)
  MakeModels()
#Change the selected parking lots into buildings
def ParkinglotToBuilding():
 objects=ce.getObjectsFrom(ce.selection())
 for o in objects:
  ce.setRuleFile(o,“rules/Buildings/Building.cga”)
  ce.setStartRule(o,“Buildings”)
  MakeModels()
#Adjust the selected street width and sidewalk width
def AdjustStreetWidth(StreetWidth):
 selectedSegments = ce.getObjectsFrom(ce.selection())
 for segment in selectedSegments:
  ce.setAttribute(segment, “/ce/street/streetWidth”, StreetWidth)
  ce.generateModels(segment)
def AdjustStreetSideWalk(increment):
 selectedSegments = ce.getObjectsFrom(ce.selection, ce.isGraphSegment)
 for segment in selectedSegments:
  Left=float(ce.getAttribute(segment, “sidewalkWidthLeft”))
  Left=Left+increment
  Right=float(ce.getAttribute(segment, “sidewalkWidthRight”))
  Right=Right+increment
  ce.setAttribute(segment, “/ce/street/sidewalkWidthLeft”, Left)
  ce.setAttribute(segment, “/ce/street/sidewalkWidthRight”, Right)

Appendix D

Export statistics table for selected features Python Script
#Export the attributes for the selected objects to a txt file
# Globals
gInstanceData = “” # global string that collects all data to be written
gInstanceCount = 0 # global count to enumerate all instances
# Called for each initial shape after generation.
def finishModel(exportContextOID, initialShapeOID, modelOID):
 global gInstanceData, gInstanceCount
 model = Model(modelOID)
 if(model.getReports().has_key(‘asset’)): # only write t3d entry if report data available
  # there might be more than one asset per model, therefore loop
  l = len(model.getReports()[‘asset’])
  for i in range(0,l):
   instanceData = processInstance(model.getReports(),gInstanceCount, i-1)
   gInstanceData = gInstanceData+instanceData
   gInstanceCount = gInstanceCount+1
def processInstance(reports, count, index):
 ## remove path from asset string
 asset = reports[‘asset’][index]
 asset = asset.rpartition(“/”)[2]
 ## prepare the string for the instance map
 text = “%d\t” % count;
 text += “%s\t” % asset;
 text += “%.3f\t%.3f\t%.3f\t” % (reports[‘xpos’][index],reports[‘ypos’][index], reports[‘zpos’][index])
 text += “%.3f\t%.3f\t%.3f\t” % (reports[‘xrot’][index],reports[‘yrot’][index], reports[‘zrot’][index])
 text += “%.3f\t%.3f\t%.3f\n” % (reports[‘xscale’][index], reports[‘yscale’][index], reports[‘zscale’][index])
 return text
# Called after all initial shapes are generated.
def finishExport(exportContextOID):
 global gInstanceData, gInstanceCount
 ## path of the output file
 file = ce.toFSPath(“maps”)+“/instanceMap.txt”
 ## write collected data to file
 writeFile(file, gInstanceData)
print str(gInstanceCount)+“instances written to “+file +”\n”

References

  1. United Nationas. World Urbanization Prospects; United Nationas: New York, NY, USA, 2019. [Google Scholar]
  2. McPherson, G.E.; Nowak, D.J.; Rowntree, R.A. Chicago’s urban forest ecosystem: Results of the Chicago urban forest climate project. Urban Ecosyst. 1994, 186, 201. [Google Scholar]
  3. Costanza, R.; d’Arge, R.; de Groot, R.; Farber, S.; Grasso, M.; Hannon, B.; Limburg, K.; Naeem, S.; O’Neill, R.V.; Paruelo, J.; et al. The value of the world’s ecosystem services and natural capital. Nature 1997, 387, 253–260. [Google Scholar] [CrossRef]
  4. Reid, W.V.; Mooney, H.A.; Cropper, A.; Capistrano, D.; Carpenter, S.R.; Chopra, K.; Dasgupta, P.; Dietz, T.; Duraiappah, A.K.; Hassan, R.; et al. Ecosystems and Human Well-Being-Synthesis: A Report of the Millennium Ecosystem Assessment; Island Press: Washington, DC, USA, 2005. [Google Scholar]
  5. Manes, F.; Incerti, G.; Salvatori, E.; Vitale, M.; Ricotta, C.; Costanza, R. Urban ecosystem services: Tree diversity and stability of tropospheric ozone removal. Ecol. Soc. Am. 2017, 22, 349–360. [Google Scholar] [CrossRef]
  6. Gil, J.; Duarte, J.P. Tools for evaluating the sustainability of urban design: A review. Proc. Inst. Civ. Eng. Urban Des. Plan. 2013, 166, 311–325. [Google Scholar] [CrossRef]
  7. Hunt, D.V.; Lombardi, D.R.; Rogers, C.D.; Jefferson, I. Application of sustainability indicators in decision-making processes for urban regeneration projects. Proc. Inst. Civ. Eng. Eng. Sustain. 2008, 161, 77–91. [Google Scholar] [CrossRef]
  8. Fleming, W.; Steiner, F.; Whitaker, W.; M’Closkey, K.; Weller, R. How Ian McHarg Taught Generations to ‘Design with Nature’. 2019. Available online: https://www.bloomberg.com/news/articles/2019-06-10/the-legacy-of-design-with-nature-50-years-later (accessed on 24 September 2019).
  9. Batty, M. Planning support systems: Progress, predictions, and speculations on the shape of things to come. Plan. Support Syst. Urban Reg. Anal. 2007, 44, 1–18. [Google Scholar]
  10. Eikelboom, T.; Janssen, R. Comparison of geodesign tools to communicate stakeholder values. Group Decis. Negot. 2015, 24, 1065–1087. [Google Scholar] [CrossRef] [Green Version]
  11. Flaxman, M. Fundamentals of Geodesign. Peer Rev. Proc. Digit. Landsc. Archit. 2010 Anhalt Univ. Appl. Sci. 2010, 2, 28–41. [Google Scholar]
  12. Mueller, J.; Lu, H.; Chirkin, A.; Klein, B.; Schmitt, G. Citizen Design Science: A strategy for crowd-creative urban design. Cities 2018, 72, 181–188. [Google Scholar] [CrossRef]
  13. Grant, H.; Chen, X. A comparison of usefulness of 2D and 3D representations of urban planning. Cartogr. Geogr. Inf. Sci. 2014, 42, 37–41. [Google Scholar]
  14. Ahmed, F.C.; Sekar, S.P. Using three-dimensional volumetric analysis in everyday urban planning processes. Appl. Spat. Anal. Policy 2015, 8, 393–408. [Google Scholar] [CrossRef]
  15. Ahmed, C.F.; Sekar, S.P. Three-dimensional (3D) volumetric analysis as a tool for urban planning: A case study of Chennai. WIT Trans. Ecol. Environ. 2013, 179, 731–742. [Google Scholar]
  16. Luo, Y.; He, J.; He, Y. A rule-based city modeling method for supporting district protective planning. Sustain. Cities Soc. 2017, 28, 277–286. [Google Scholar] [CrossRef]
  17. Koziatek, O.; Dragićević, S. iCity 3D: A geosimualtion method and tool for three-dimensional modeling of vertical urban development. Landsc. Urban Plan. 2017, 167, 356–367. [Google Scholar] [CrossRef]
  18. Albino, V.; Berardi, U.; Dangelico, R.M. Smart cities: Definitions, dimensions, performance, and initiatives. J. Urban Technol. 2015, 22, 3–21. [Google Scholar] [CrossRef]
  19. Parish, Y.I.H.; Müller, P. Procedural modeling of cities. In Proceedings of the 28th Annual Conference on Computer Graphics and Interactive Techniques, Los Angeles, CA, USA, 12–17 August 2001; pp. 301–308. [Google Scholar]
  20. Paar, P. Landscape visualizations: Applications and requirements of 3D visualization software for environmental planning. Comput. Environ. Urban Syst. 2006, 30, 815–839. [Google Scholar] [CrossRef]
  21. Wang, X.; Zhang, Q.; Chen, Y.; Liang, S. Multimedia teaching platform for urban planning utilizing 3D technology State of the art. Int. J. Emerg. Technol. Learn. 2018, 13, 187–199. [Google Scholar] [CrossRef] [Green Version]
  22. Breuste, J.; Qureshi, S. Urban sustainability, urban ecology and the Society for Urban Ecology (SURE). Urban Ecosyst. 2011, 14, 313–317. [Google Scholar] [CrossRef]
  23. Kelly, G.; McCabe, H. A survey of procedural techniques for city generation. ITB J. 2006, 7, 87–130. [Google Scholar]
  24. Parberry, I. Designer Worlds: Procedural generation of infinite terrain from real-world elevation data. J. Comput. Graph. Tech. 2014, 3, 74–85. [Google Scholar]
  25. Tiwari, A.; Jain, K. 3D city model enabled e-governance for sustainable urbanization. In Proceedings of the 14th Esri India User Conference ID: UCP0024, Esri, India, 11–12 December 2013; pp. 1–8. [Google Scholar]
  26. Grêt-Regamey, A.; Celio, E.; Klein, T.M.; Wissen Hayek, U. Understanding ecosystem services tradeoffs with interactive procedural modelling for sustainable urban planning. Landsc. Urban Plan. 2013, 109, 107–116. [Google Scholar] [CrossRef]
  27. Müller, P.; Wonka, P.; Haegler, S.; Ulmer, A.; van Gool, L. Procedural modeling of buildings. ACM Trans. Graph. 2006, 25, 614. [Google Scholar] [CrossRef]
  28. Albracht, R. Visualizing Urban Development: Improved Planning & Communication with 3D Interactive Visualizations. Master’s Thesis, Kansas State University, Manhattan, KS, USA, 2016. [Google Scholar]
  29. Schaller, J.; Ertac, Ö.; Freller, S.; Mattos, C. Geodesign apps and 3D modelling with CityEngine for the city of tomorrow. Digit. Landsc. 2015, 2015, 59–70. [Google Scholar]
  30. Sutherland, I.E. A head-mounted three dimensional display. Quat. Res. 1975, 5, 391–394. [Google Scholar]
  31. Hayek, U.W. Exploring issues of immersive virtual landscapes for participatory spatial planning support. J. Digit. Landsc. Archit. 2016, 1, 100–108. [Google Scholar]
  32. Slater, M.; Wilbur, S. A framework for immersive virtual environments (FIVE): Speculations on the role of presence in virtual environments. Presence Teleoperators Virtual Environ. 1997, 6, 603–616. [Google Scholar] [CrossRef]
  33. Sameeh, A.; El Sayad, Z.T.; Ayad, H.M. VRGIS as assistance tool for urban decision making Rafah–Gaza–Palestine. Alex. Eng. J. 2019, 98, 102559. [Google Scholar]
  34. Jamei, E.; Mortimer, M.; Seyedmahmoudian, M.; Horan, B.; Stojcevski, A. Investigating the role of virtual reality in planning for sustainable smart cities. Sustainability 2017, 9, 2006. [Google Scholar] [CrossRef] [Green Version]
  35. Rowland, M.; Byrne, J.; Hummer, D.; Blasko, B.L.; Souza, K.A.; Via, B.; Principe, S.D.; Taxman, F.S.; Tomlinson, K.D.; Schumaker, D.; et al. Portneuf River Visioning Plan; The City of Pocatello: Pocatello, ID, USA, 2016.
  36. City of Pocatello. City of Pocatello Comprehensive Plan 2015 Update; The City of Pocatello: Pocatello, ID, USA, 2015. [Google Scholar]
  37. Kim, K.; Wilson, J.P. Planning and visualising 3D routes for indoor and outdoor spaces using CityEngine. J. Spat. Sci. 2014, 60, 179–193. [Google Scholar] [CrossRef]
  38. Rogan, J.; Ziemer, M.; Martin, D.; Ratick, S.; Cuba, N.; DeLauer, V. The impact of tree cover loss on land surface temperature: A case study of central Massachusetts using Landsat Thematic Mapper thermal data. Appl. Geogr. 2013, 45, 49–57. [Google Scholar] [CrossRef]
  39. Livesley, S.; Baudinette, B.; Glover, D. Rainfall interception and stem flow by eucalypt street trees—The impacts of canopy density and bark type. Urban For. Urban Green. 2014, 13, 192–197. [Google Scholar] [CrossRef]
  40. i-Tree. What Is i-Tree? 2019. Available online: https://www.itreetools.org/about (accessed on 30 June 2019).
  41. Jiang, Z.; Huete, A.R.; Chen, J.; Chen, Y.; Li, J.; Yan, G.; Zhang, X. Analysis of NDVI and scaled difference vegetation index retrievals of vegetation fraction. Remote Sens. Environ. 2006, 101, 366–378. [Google Scholar] [CrossRef]
  42. Volterrani, M.; Grossi, N.; Magni, S.; Miele, S. Turf parking lots: Performance of different growing media and cool season turfgrass mixtures. Int. Turfgrass Soc. 2001, 9, 629–635. [Google Scholar]
  43. Li, J.; Han, J.Y.; Hao, L.J. The discussion of appling parametric 3D modeling in urban design based on CityEngine. Adv. Mater. Res. 2013, 2009, 1734–1737. [Google Scholar] [CrossRef]
  44. Tsiliakou, E.; Labropoulos, T.; Dimopoulou, E. Transforming 2D cadastral data into a dynamic Smart 3D model. Int. Arch. Photogramm. Remote Sens. Spat. Inf. Sci. ISPRS Arch. 2013, XL-2/W2, 105–111. [Google Scholar] [CrossRef] [Green Version]
  45. Al-Douri, F.A. The impact of 3D modeling function usage on the design content of urban design plans in us cities. Environ. Plan. B Plan. Des. 2010, 37, 75–98. [Google Scholar] [CrossRef]
  46. Wu, D.; Delparte, D.; Sanger, H.; Boyack, D.; Ogle, J.; Richardson, R. Creating integrating participatory mapping through a web application to enable public involvement in city planning: The Portneuf River Vision Study. GI_Forum 2017, 1, 97–112. [Google Scholar] [CrossRef]
  47. Solecki, W.D.; Rosenzweig, C.; Parshall, L.; Pope, G.; Clark, M.; Cox, J.; Wiencke, M. Mitigation of the heat island effect in urban New Jersey. Environ. Hazards 2005, 6, 39–49. [Google Scholar] [CrossRef]
  48. Kourdounouli, C.; Jönsson, A.M. Urban ecosystem conditions and ecosystem services–a comparison between large urban zones and city cores in the EU. J. Environ. Plan. Manag. 2020, 63, 798–817. [Google Scholar] [CrossRef]
  49. Cochran, F.; Daniel, J.; Jackson, L.; Neale, A. Earth observation-based ecosystem services indicators for national and subnational reporting of the sustainable development goals. Remote Sens. Environ. 2020, 244, 111796. [Google Scholar] [CrossRef] [PubMed]
  50. Ziter, C.; Turner, M.G. Current and historical land use influence soil-based ecosystem services in an urban landscape. Ecol. Appl. 2018, 28, 643–654. [Google Scholar] [CrossRef] [PubMed]
  51. Kılkış, Ş. Benchmarking South East European cities with the sustainable development of energy, water and environment systems index. J. Sustain. Dev. Energy Water Environ. Syst. 2018, 6, 162–209. [Google Scholar] [CrossRef]
  52. Yee, S.H.; Paulukonis, E.; Simmons, C.; Russell, M.; Fulford, R.; Harwell, L.; Smith, L. Projecting effects of land use change on human well-being through changes in ecosystem services. Ecol. Model. 2021, 440, 109358. [Google Scholar] [CrossRef] [PubMed]
Figure 1. (a) Pocatello Old Town. The red section highlights the study area within the City of Pocatello limits. The section inside the red boundary in (b) is the study area, and the blue line is the concrete channel section of the Portneuf River.
Land 11 01228 g001
Figure 2. The workflow steps to create a city model from 2D to 3D including data preparation, 3D model generation, and visualization applications.
Land 11 01228 g002
Figure 3. Landcover types in Old Town Pocatello.
Land 11 01228 g003
Figure 4. Building year built in Pocatello Old Town.
Land 11 01228 g004
Figure 5. Parking lot types in Pocatello Old Town.
Land 11 01228 g005
Figure 6. CityEngine 3D model of Old Town Pocatello in ArcGIS Online.
Land 11 01228 g006
Figure 7. CityEngine model showing Hotel Yellowstone and the Union Pacific Railway Station.
Land 11 01228 g007
Figure 8. CityEngine model displaying the concrete channel reach of the Portneuf River and the Bannock County Veteran Memorial building.
Land 11 01228 g008
Figure 9. Unity WebGL walking game in a Firefox browser window.
Land 11 01228 g009
Figure 10. The mobile game in Android phone that allows user to drive a car.
Land 11 01228 g010
Figure 11. Visualization at a block scale for present and proposed scenarios in CityEngine.
Land 11 01228 g011
Table 1. Vector data sources.
DataAttributesSources
Building footprintsParcel No., Property type, Year built, etc.City of Pocatello
TreesAddress, Species, Condition, DBH, etc.City of Pocatello
Fire hydrantsHydrant number, Hydrant type, etc.City of Pocatello
Street signsFile name code, Sign ID, etc.City of Pocatello
StreetlightsSubtype, Ownership, etc.Idaho Power
Portneuf RiverLength, Name, etc.Bannock County
StreetsDescription, Location, Road width, etc.Bannock County
Table 2. Raster data sources.
DataResolution (m)YearSources
Digital Elevation Model (DEM)1 m2016DOGAMI
DOGAMI
Digital Surface Model (DSM)1 m2016
NAIP orthoimagery0.5 m2013USDA
DOGAMI (Oregon Department of Geology and Mineral Industries). USDA (United States Department of Agriculture).
Publisher’s Note: MDPI stays neutral with regard to jurisdictional claims in published maps and institutional affiliations.

