Article

Geo-Design in Planning for Bicycling: An Evidence-Based Approach for Collaborative Bicycling Planning

1
School of Arts, Design and Architecture, University of New South Wales, Sydney, NSW 2052, Australia
2
School of Population Health, University of New South Wales, Sydney, NSW 2052, Australia
*
Author to whom correspondence should be addressed.
Land 2022, 11(11), 1943; https://doi.org/10.3390/land11111943
Submission received: 16 August 2022 / Revised: 12 October 2022 / Accepted: 25 October 2022 / Published: 31 October 2022
(This article belongs to the Special Issue Geodesign in Urban Planning)

Abstract

:
In recent times, cities have increasingly promoted bicycling as a mode of transport as part of their strategy to develop a more sustainable transportation system. Australia is one of the countries that seeks to promote bicycling in a significant manner. There are two primary barriers faced in this effort. The first is the organizational complexity of planning and of implementing cycling-related projects, which can span across different agencies in government at various levels, from federal to local. Second is the lack of a clear framework for effectively planning a bicycling network using multiple data and tools available to these agencies within a limited budget. This study investigates the use of a geo-design-based, collaborative, and data-driven framework for planning bicycling networks, which brings various stakeholders, such as transport planners, urban designers, and academics, into the planning practice, thus overcoming the mentioned barriers. Geo-design is an environmental design framework for complex problems involving the collaboration of different teams and stakeholders, supported by digital computing and communication technologies. To the best of our knowledge, there is no study in the literature applying the geo-design approach for bicycling planning. Therefore, this study aims to develop and test a geo-design framework for planning bicycling networks to examine possible design scenarios and facilitate decision-making processes. In this regard, this study developed a geo-design framework for planning for bicycling using various bicycling-related datasets and digital tools, such as the Agent-Based Model. Then, it applied the framework to design a real-world bicycle network through a geo-design workshop while examining the usefulness and effectiveness of the developed procedures and tools. Policymakers attended the geo-design workshop from the local government authority of the case study area, Penrith, and post-graduate level urban planning students from UNSW. Due to COVID-19-related restrictions, the workshop was held in a hybrid format, with half of the participants joining online. The results of this study revealed that by facilitating collaboration and applying data-driven approaches, the proposed geo-design bicycling framework could improve the process of planning for bicycling infrastructure. This study also enabled the research team to understand the strengths and limitations of the developed framework and associated tools, which will help to optimize them for other planning practices in the future.

1. Introduction

Today, more than half of the world’s population lives in urban areas, which is expected to increase to more than 68% by 2050 [1]. In Australia, 86% of the population lives in urban areas, with 40% living in Sydney and Melbourne. Transportation planning in today’s congested cities is critical as it defines the dynamics of people’s movement [2]. Bicycling as an alternative mode of transport has gained attention in transportation studies due to increasing congestion and vehicle traffic in cities [3]. Bicycling is a physical activity that can promote public health and environmental sustainability, leading to significant economic benefits [4]. To achieve these benefits, many countries, including Australia, are planning to increase bicycling to create more sustainable urban transportation [5]. Countries have considered infrastructure programs and policies to increase bicycling. Some of the efforts look to provide bicycling infrastructures, such as bicycling tracks [6], bicycle racks on public transit systems, and bicycle traffic signals [7,8,9], or consider programs like bike share schemes [10] or car-free zones [11], and policies like city bike systems (in the city of Lublin) [12].
To increase the number of bike riders in Australia and, more specifically, in the Greater Sydney Area (GSA), several strategies have been developed. According to the Inner Sydney Regional Bicycle Network report, in the Sydney region, one of Australia’s largest cities, the economic cost-benefit ratio of investing in the bicycle infrastructure development is estimated to be 3.88$, with a net economic benefit of $500 million a year [13]. The Committee for Sydney cycling report stated that Sydney needs more programs and funding to make Sydney a more bicycling-friendly city. To encourage more riders, there is a need for a well-connected and safe bicycling infrastructure [14]. More recently, the Movement and Place framework has considered a place-based approach for planning and designing transport networks and includes guidelines and toolkits to support bicycling planning [15]. In response to COVID-19, a few strategies were implemented to address the new demand for a better network for bicycling, such as new pop-up cycleways around the city [16,17]. Despite all efforts, in Australia, the level of bicycling is about 1%. Similarly, according to the Australian Bureau of Statistics (ABS), in the GSA, only 1.1% of trips are made by bicycle [18]. This level of modal share for bicycling is lower than in many countries around the world, such as the Netherlands (27%) and Denmark (16%) [19,20,21]. One of the main reasons for the insignificant number of bike trips is that there is more emphasis on motorized modes of transportation. As a result, vehicle traffic takes more consideration in street designs, and therefore, bicycling is a marginalized mode of transport [22]. Furthermore, there are challenges in the collaboration of different agencies in the planning process on a government and local scale. Planning and, more specifically, bicycling planning traditionally occur in a series of long and short-term plans proposed by different governmental agencies. This process has caused problems and issues in the coordination and sequencing of urban projects [23]. Therefore, bicycling planning, as part of the city and metropolitan planning, can be considered a significant problem with high complexity and impacts on different systems that change and constantly evolve [24]. To overcome this, there is a need to engage different stakeholders and experts in the decision-making process to explore their views and consider new strategies for improving planning for bicycling [23,25].
Applying the geo-design approach can overcome challenges in coordinating critical urban projects by supporting collaborative and integrative planning. Geo-design is a collaborative planning process that changes the geography with design, by developing and applying a collaborative design process [26]. Geo-design can improve traditional environmental design and planning practices by using modern communication, computing, and collaboration technologies. This approach allows for analysis of the impact of design scenarios by the simulation to integrate theoretical and societal knowledge into the practice of designing alternative futures [27]. With the geo-design framework, barriers to creating single strategic planning by different stakeholders can be broken down using data-driven approaches [23].
This work developed a geo-design framework using different datasets and tools. This framework was used in a geo-design workshop for bicycling planning. To the best of our knowledge, most previous studies have held geo-design workshops in person. However, with COVID-19 restrictions, there was a need for a more hybrid model of participation due to work-from-home (WFH) approaches. Similarly, half of the participants in this study needed to participate online. To the best of our knowledge, no bicycling research has adopted a geo-design approach using digital tools like ABM. Altogether, this study aims to understand the use of the geo-design approach in planning and designing infrastructures for bicycling, using the case study of Sydney to develop a hybrid mode in response to the new post-COVID-19 environment. To achieve this objective, the authors addressed the following research question:
-
How can the geo-design approach support planning for bicycling?
-
What are the strengths and weaknesses of using geo-design approaches for bicycling planning?
-
How can a hybrid geo-design workshop be organized? What are the applicable methods and techniques?
The result of this study was an integrative geo-design framework for planning bicycle infrastructure that can then be used to examine the current situation of bicycling in a case study and evaluate future strategies and design ideas for a bicycling network. The following sections describe the proposed framework and methodology designed to achieve the aim of the study.

2. Literature Review

Ervin (2012) defines geo-design as an environmental design for complex issues in large areas involving the collaboration of different teams and stakeholders with digital computing and communication technologies. Geo-design depends on feedback on the effects of proposed design scenarios based on simulation, dynamic modelling, and systematic thinking. Geo-design tools are an innovative way to integrate technology and the process of decision-making in planning and design. Applying this method can produce better outcomes for any project, the community, and the environment [28].
Geo-design combines geography with design and provides tools to support decision-making. Geo-design is a holistic approach that has been increasingly applied over the last five years in design, landscaping, transportation, and land-use planning studies [29,30,31]. Nonetheless, to the best of our knowledge, no bicycling studies have applied this approach. For instance, a geo-design approach has been used in designing the fuel station network in the southwestern U.S.; developing an open-sourced platform for facilitating interactive and collaborative development scenarios with spatial data layers and the evaluation of the network performances, named Collablocation [31]. In a similar study, Kazak et al. (2019) [32] used a geo-design framework to engage citizens in planning public transport processes to verify the suitability of the planning support systems, such as CommunityViz, to create public transport facilities scenarios. In more recent research, led by Liu et al. (2020) [33], a geo-design approach was developed for sustainable urban landscaping under the pressure of climate change effects to optimize urban landscape composition in the north of China. One of the main challenges to creating more sustainable futures is traditional barriers to collaborative planning across government agencies. For example, in metropolitan planning, different agencies separately carry out processes. Pettit et al. (2019) [23], proposed a siloed approach through the geo-design framework for city planning to solve coordination problems with collaboration through geo-design workshops exploring alternative future scenarios for 2050.
The geo-design collaboration approach uses the power of digital technologies in computing and communication to enhance the information-based design and receive feedback about the implication of design alternatives. The most used technical tools for this are Geographic Information Systems (GIS), Computer-Aided Design (CAD), and Multi-Criteria Evaluation (MCE), in conjunction with dashboards and spreadsheets [27]. Some software has been developed to conduct geo-design studies, such as Geo-design Hub® (https://www.geo-designhub.com/ (accessed on 11 August 2022)), which is software to analyze and assign land use. Furthermore, ESRI®’s GeoPlanner® is another commercial software for urban planning. Debnath et al. (2021) comprehensively discussed commonly used tools in geo-design studies. Considering a geo-design approach in the post-COVID-19 world necessitates considering new tools and PSSs that can support face-to-face and virtual collaboration using online platforms and workshops [34]. Accordingly, some studies have adopted the online and hybrid geo-design approaches. For instance, they used tools like GISColab, which is a shared spreadsheet in Excel software [35], or had remote meeting rooms and used digital tools [36], which have been proven to be effective [35,36,37].
Geo-design is a data-driven paradigm that uses geographic and spatial information to improve and structure urban planning processes [26,38]. As previously mentioned, geo-design approaches have not been used in bicycling planning. However, by having data-driven approaches to decision-making, some studies have developed tools and techniques, such as planning support systems (PSS) or decision support systems (DSS) [39]. They have assumed that interventions in bicycling networks necessitate considering what and where to build the infrastructure using PSS or DSS. One example of these tools is the Propensity to Cycle Tool, an online PSS developed by Lovelace et al. (2015) to determine where to build new infrastructure for bicycling [40]. Another example is the NCHRP Project by Kuzmyak et al. (2014), which used to estimate walking and bicycling routes according to different criteria [41]. Attracting more cyclists needs developing methodologies to prioritize the location of bicycling facilities. Larsen et al. (2012) created a GIS-based model as a prioritization index for locating bicycling infrastructure in Montreal, Canada [42]. In addition, there was research on applications for new crowdsourced and open-sourced data in urban planning research and practice [43]. For example, Lissner et al. (2018) used smartphone-based data to model bicycling traffic volume and used the information in planning and political discussions [44]. Using open and crowdsourced data can enable stakeholders to access detailed bicycling data, such as the type of bicycle, the socio-demographics of bicyclists, and route choices [45]. Although these studies have provided a tool to support decision-making, it is essential to use them in a collaborative planning environment. Ratanaburi et al. (2021) confirmed that the presence of stakeholders in the process of planning for bicycling is essential to receive positive outcomes [46]. Similarly, Macmillan et al. (2014) explored the role of participatory modeling by comparing the impact of realistic policies to increase the number of bicyclists in cities, and they confirmed that the understanding of stakeholders has improved regarding complex bicycling systems [47].
This study proposes that a hybrid geo-design framework is an efficient approach for planning bicycling infrastructure networks, especially in an Australian context, as it enables the participation of different stakeholders and practitioners alongside applying data-driven approaches using open and crowdsourced data, PSSs, and simulation of future scenarios. The current study uses different tools and platforms to apply the geo-design framework to bicycling planning. Each tool was expected to suit one stage of a geo-design study. The main tool developed for this study is an Agent-Based Model (ABM) for the simulation of bicyclists’ behavior in the built environment as PSS. ABMs are complex systems that use the perspective of individual agents and represent emerging patterns and structures [48,49]. The specification of the model has been presented in the methodology section, and more details on this model have been placed in a separate study [50]. Overall, this study can improve the current process of bicycling planning in the following ways: (1) improving practitioners discussion regarding planning and design for bicycling; (2) enabling community and stakeholder engagement in the planning process and empower them to evaluate future plans for their community; and (3) enabling the use of data-driven approaches in planning for bicycling and using evidence for decision-making processes in a hybrid mode.

3. Materials and Methods

This study aims to develop and test a geo-design framework for bicycling planning to explore and analyze the current situation in the case study and future scenarios for bicycling networks. The framework would also enable collaboration between various participants, including people, practitioners, local government stakeholders, and other relevant actors from the community [26]. By definition, this framework does not represent a linear process, as it needs to support iterative stages and feedback loops, thus enabling the convergence of decision-making processes towards the most optimal scenario. This includes organizing workshops during different stages of the study for participating practitioners, stakeholders, and people in the design process and then evaluating the results.
The core process of the geo-design bicycling workshop is based on six geo-design models proposed by [26], including representation, process, evaluation, change, impact, and decision models (Figure 1). The workshop starts with a representation model and an understanding of the current situation based on the available maps and data. It then moves on to the process model, which clarifies the planning process for bicycling in the case study area. In the process model, the design systems, which are the collection of design elements (projects and policies), are safety, end-of-trip facilities, green spaces and landscaping, shared bikes, and cycling pathways. In the evaluation model, the current functions of different urban systems are assessed, considering data like propensity to cycle, cycling infrastructure, and accessibility by bike. In the change model, future planned changes based on the data of the previous stages should be studied. This includes understanding the future vision, strategies, tactics, and design scenarios (in the current study, the change design scenarios are commuting by bicycle, recreational bicycling, safe paths to school, and bicycling to the high street). These strategies and design scenarios in the change models will be evaluated in the next step, which is the impact model. At this stage, each design scenario will be simulated with the Agent-Based Model, developed using GAMA platform. Agent-Based Modeling (ABM) is a method for simulating the systems of individual agents to observe their collective behavior (more model specifications are presented in Section 3.3.1) [51]. This tool enables participants to see the impact of the changes they have made. The last step is the decision model to compare the result of the change and impact models and decide whether the design process was successful.

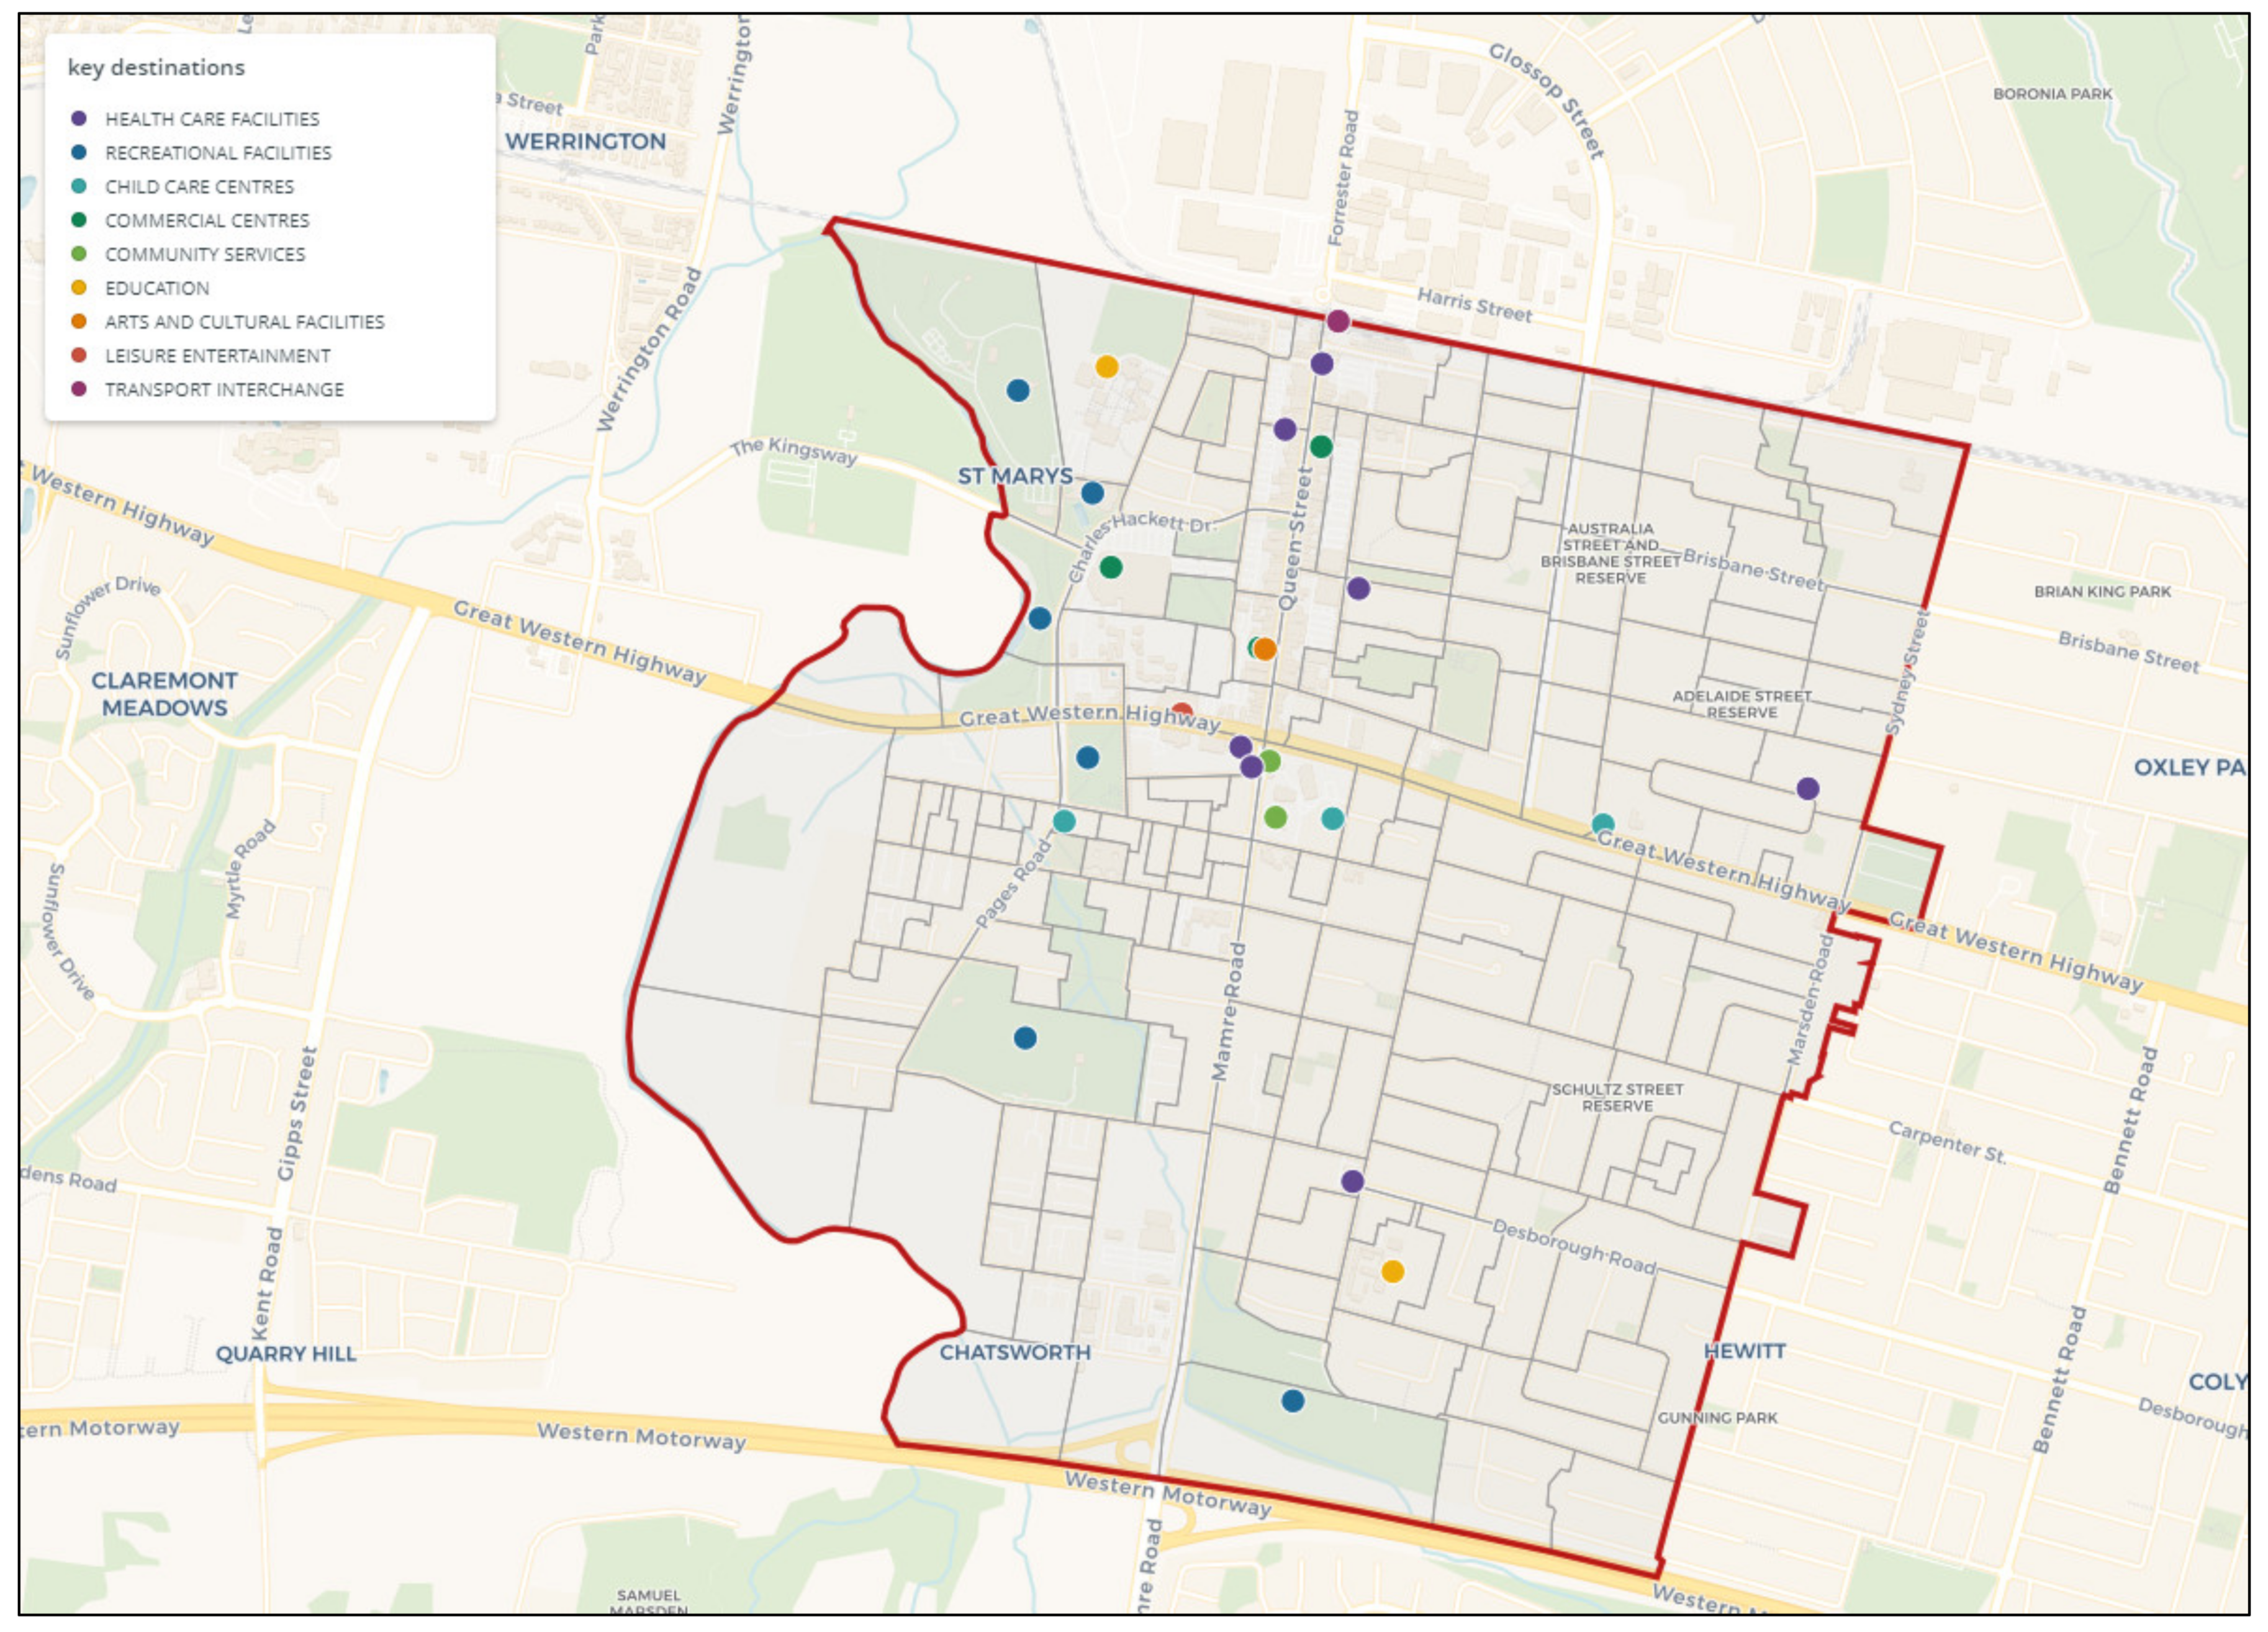
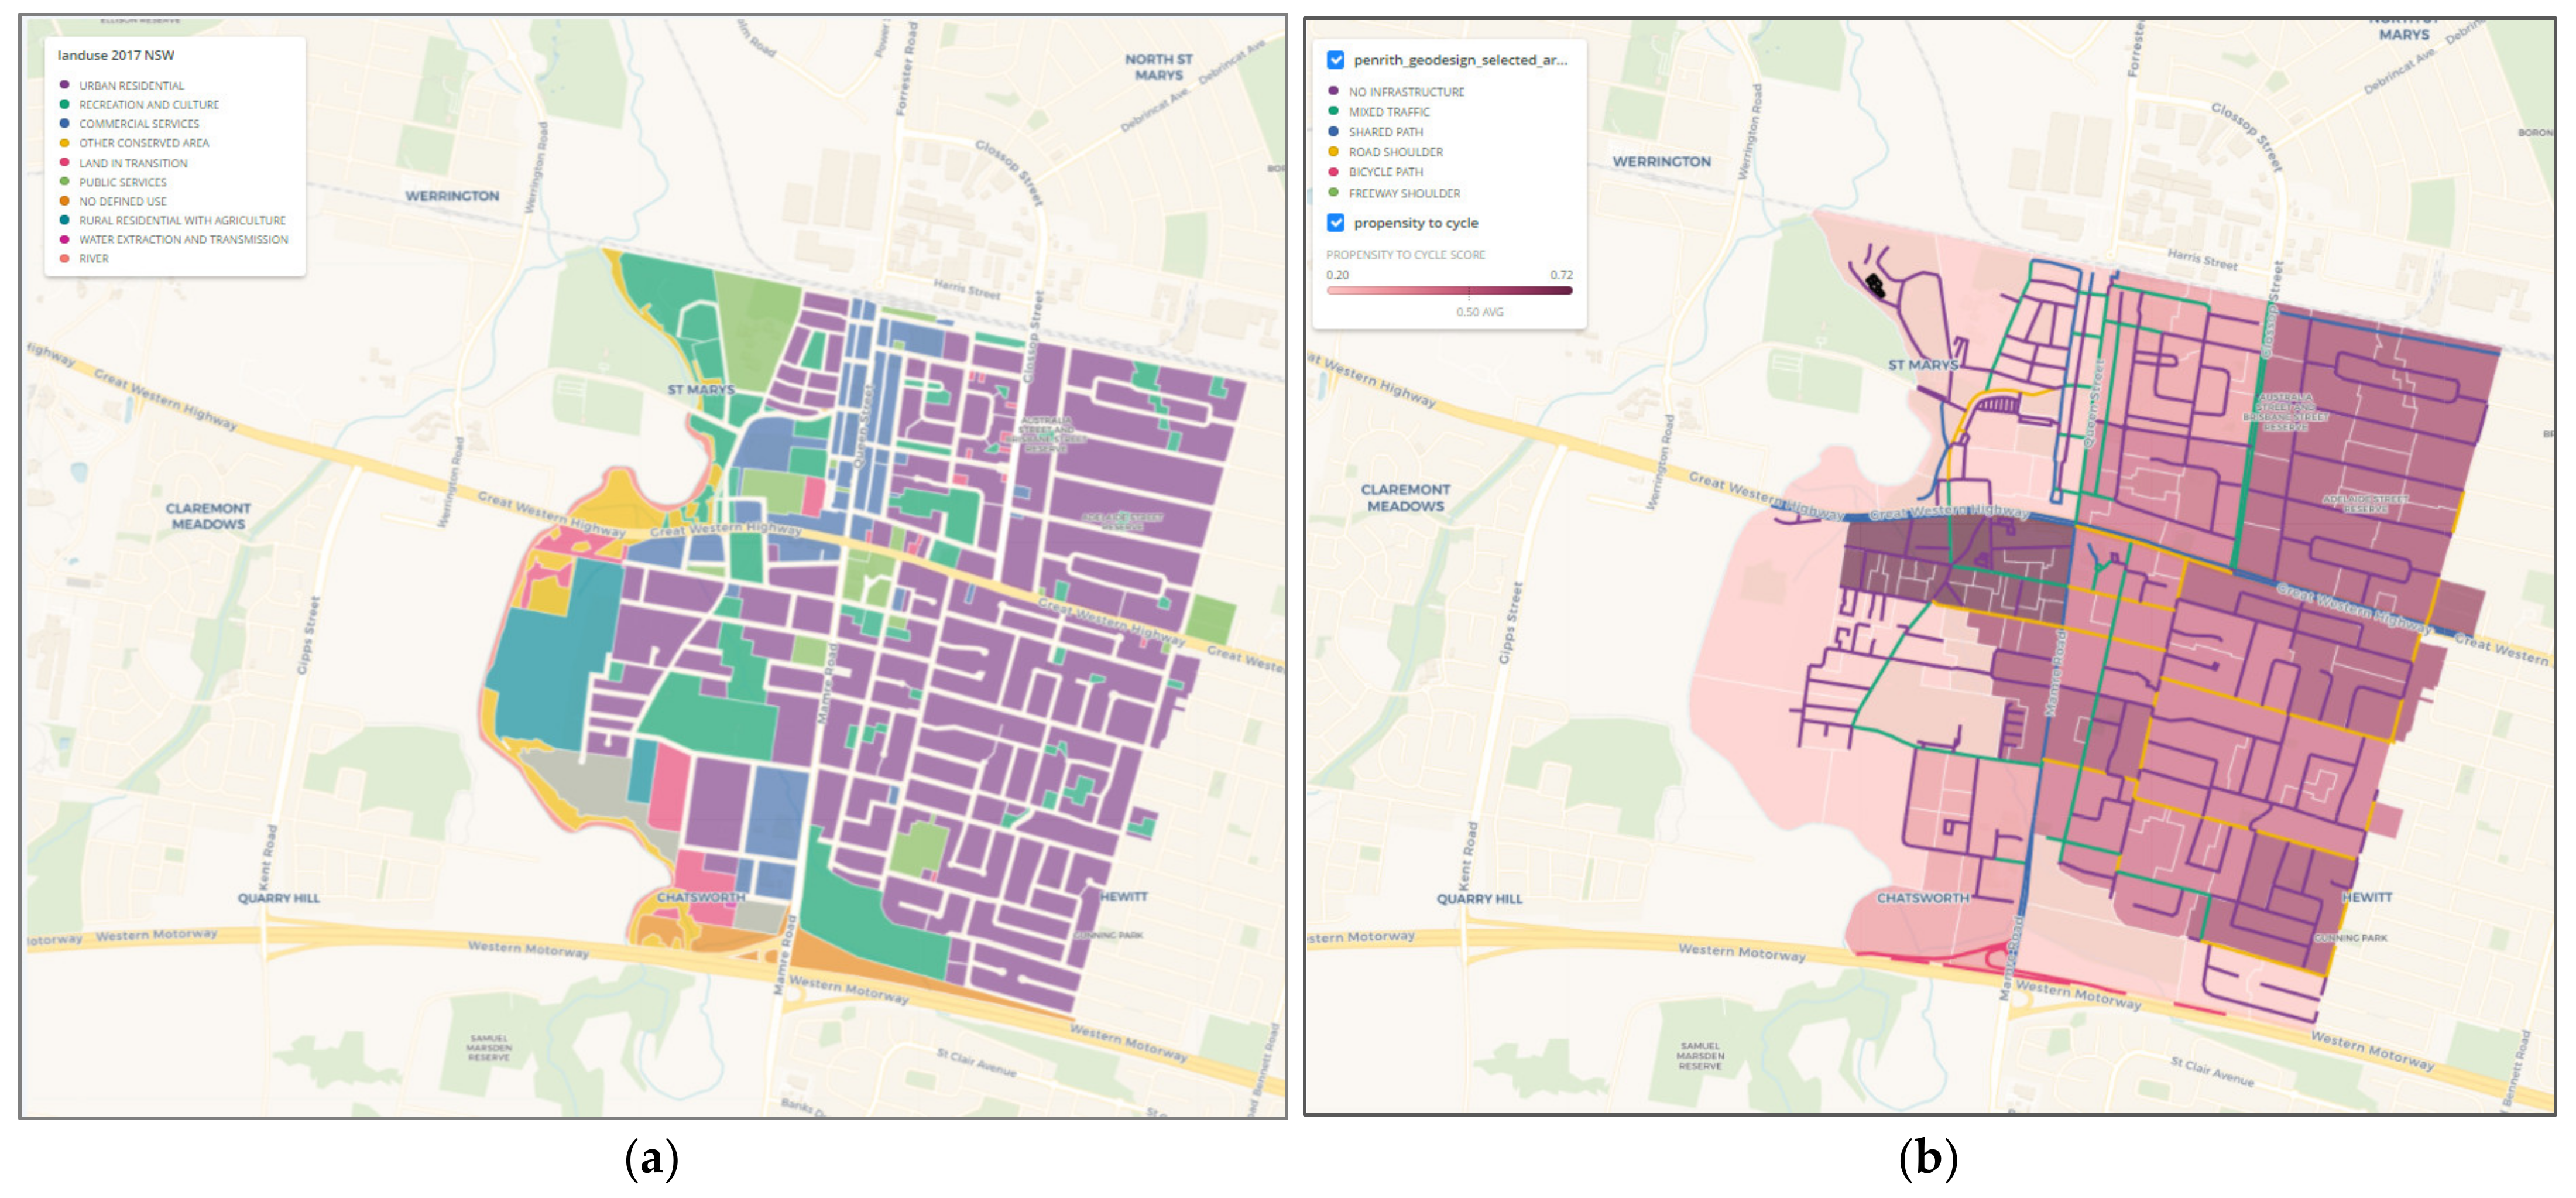
3.1. Case Study of Sydney

The case study considered for the geo-design bicycling workshop was the Penrith Local Government Area (LGA) (Figure 2). The City of Penrith is a local government area in New South Wales, Australia. Penrith LGA is located around 50 kilometres west of Sydney’s central business district. According to the Penrith strategic plan, improving the bicycle ways is one of the top five priorities for future improvement, as less than 1% of trips are made by bicycle in this area (ABS, 2016).
The selected area is approximately 534 hectares and is situated around St Marys station. The total population of this area is 16,720. This population includes 8275 male and 8485 female residents. One of the main reasons for selecting this area is that it is located reasonably far away from Sydney CBD; hence, reducing the effect of complicated urban systems in the data analysis and simulation. In addition, the Penrith LGA council is currently investing significant resources in improving its bicycling infrastructure. Therefore, they stated their interest in participating in the geo-design bicycling workshop. The selected area is predominantly residential with a few industrial areas in the north of this area that characterize the site. There are 26 key destinations in the area, including two education centres, seven healthcare facilities, three childcare centres, two community services, one leisure entertainment centre, six recreational centres, one art and cultural centre, three commercial centres, and one train station; all of which were the core input to the network and ABM analysis. The key destinations the great western highway are highlighted in Figure 3.

3.2. Geo-Design Workshop Details

The geo-design bicycling workshop was held over two consecutive weeks and on four days, on 12, 13, 19, and 20 November 2020 at the City Analytics Lab in the Built Environment faculty at the University of New South Wales, Sydney, Australia. The workshop was attended by three key personnel from the Penrith City Council’s bicycling planning team and 32 students of the MSc programs in City Analytics, Landscape Architecture, and Urban Planning. Participants were enrolled in the geo-design course (BENV 7502) for Term 3 during 2020 at UNSW. The workshop was organized in a hybrid manner where the participants could attend both via online and in person. Thirteen students participated in person, while the rest joined online via the UNSW teaching platform due to COVID-19 restrictions. The main role of the Penrith stakeholders was supervising, advising the workshop, and informing participants about the process of planning for bicycling in the selected area (In these workshops, nineteen online students were divided into three main groups for the first design section (design systems), and into two groups for the second design section (design scenarios). In-person groups were initially divided into two groups for the first and second round of the design section. There was only one online group and one in-person group for the last section of the design session). Figure 4 illustrates how participants were organized into groups and engaged with the council during the design process.
The in-person workshop was run at City Analytics Lab (CAL). The City Analytics Lab is a dedicated space designed to support collaborative city planning and user-centered design. Human-centered technologies are available at the lab to support co-design solutions, where participants define the future of smart, sustainable cities in Australia. The equipment used for the geo-design bicycling workshop were Cruiser Map Tables (multi-touch screens), a camera and projector, and eight screen monitors (installed on the wall and controlled through a central laptop) (Figure 5).
The online portion of the workshop was run through BlackBoard Collaborate, one of the most popular platforms for distance learning systems, which creates a reliable and simple virtual classroom to power online teaching and accommodate web conferencing needs. Online participants could see what was happening in the in-person workshop via BB Collaborate and CAL cameras. In-person groups could see online participants via the media wall in the CAL. Three main moderators helped the online participants stay on track and keep pace with in-person groups.

3.3. Data Collection and Applied Tools

This study needed consideration and analysis of different data sources and tools to understand the dynamics of bicycling planning and design. Table 1 shows the data sources used in geo-design models, which were mainly available through open data sources. This data went through several geospatial analyses in QGIS, such as network analysis, slope analysis, catchment analysis, and General Transit Feed Specification (GTFS) analysis.

3.3.1. Agent-Based Model and Simulation

The literature shows that features of the built environment that affect bicycling attitudes can be modelled using methods such as Agent-Based Model (ABM). The agents are programmed based on their observed behavior in the real world [51], and they have specific characteristics, and there is a set of rules between them [52]. The developed ABM aims to simulate and understand how bicyclists move on streets between a defined origin and destination matrix considering attributes of the built environment and road network identified from the literature, such as the socio-demographic status of the area [53], bicycling infrastructure [54], and street network design (including distance, slope, and tree canopy) [55]. This simulation can enable design scenario evaluation by examining changes in bicyclist behavior considering changes in the built environment. The description of the design, implementation, and testing of the ABM model used in the workshop was detailed in [50]. This tool was used at two stages of the geo-design bicycling workshop, as indicated in Table 1.

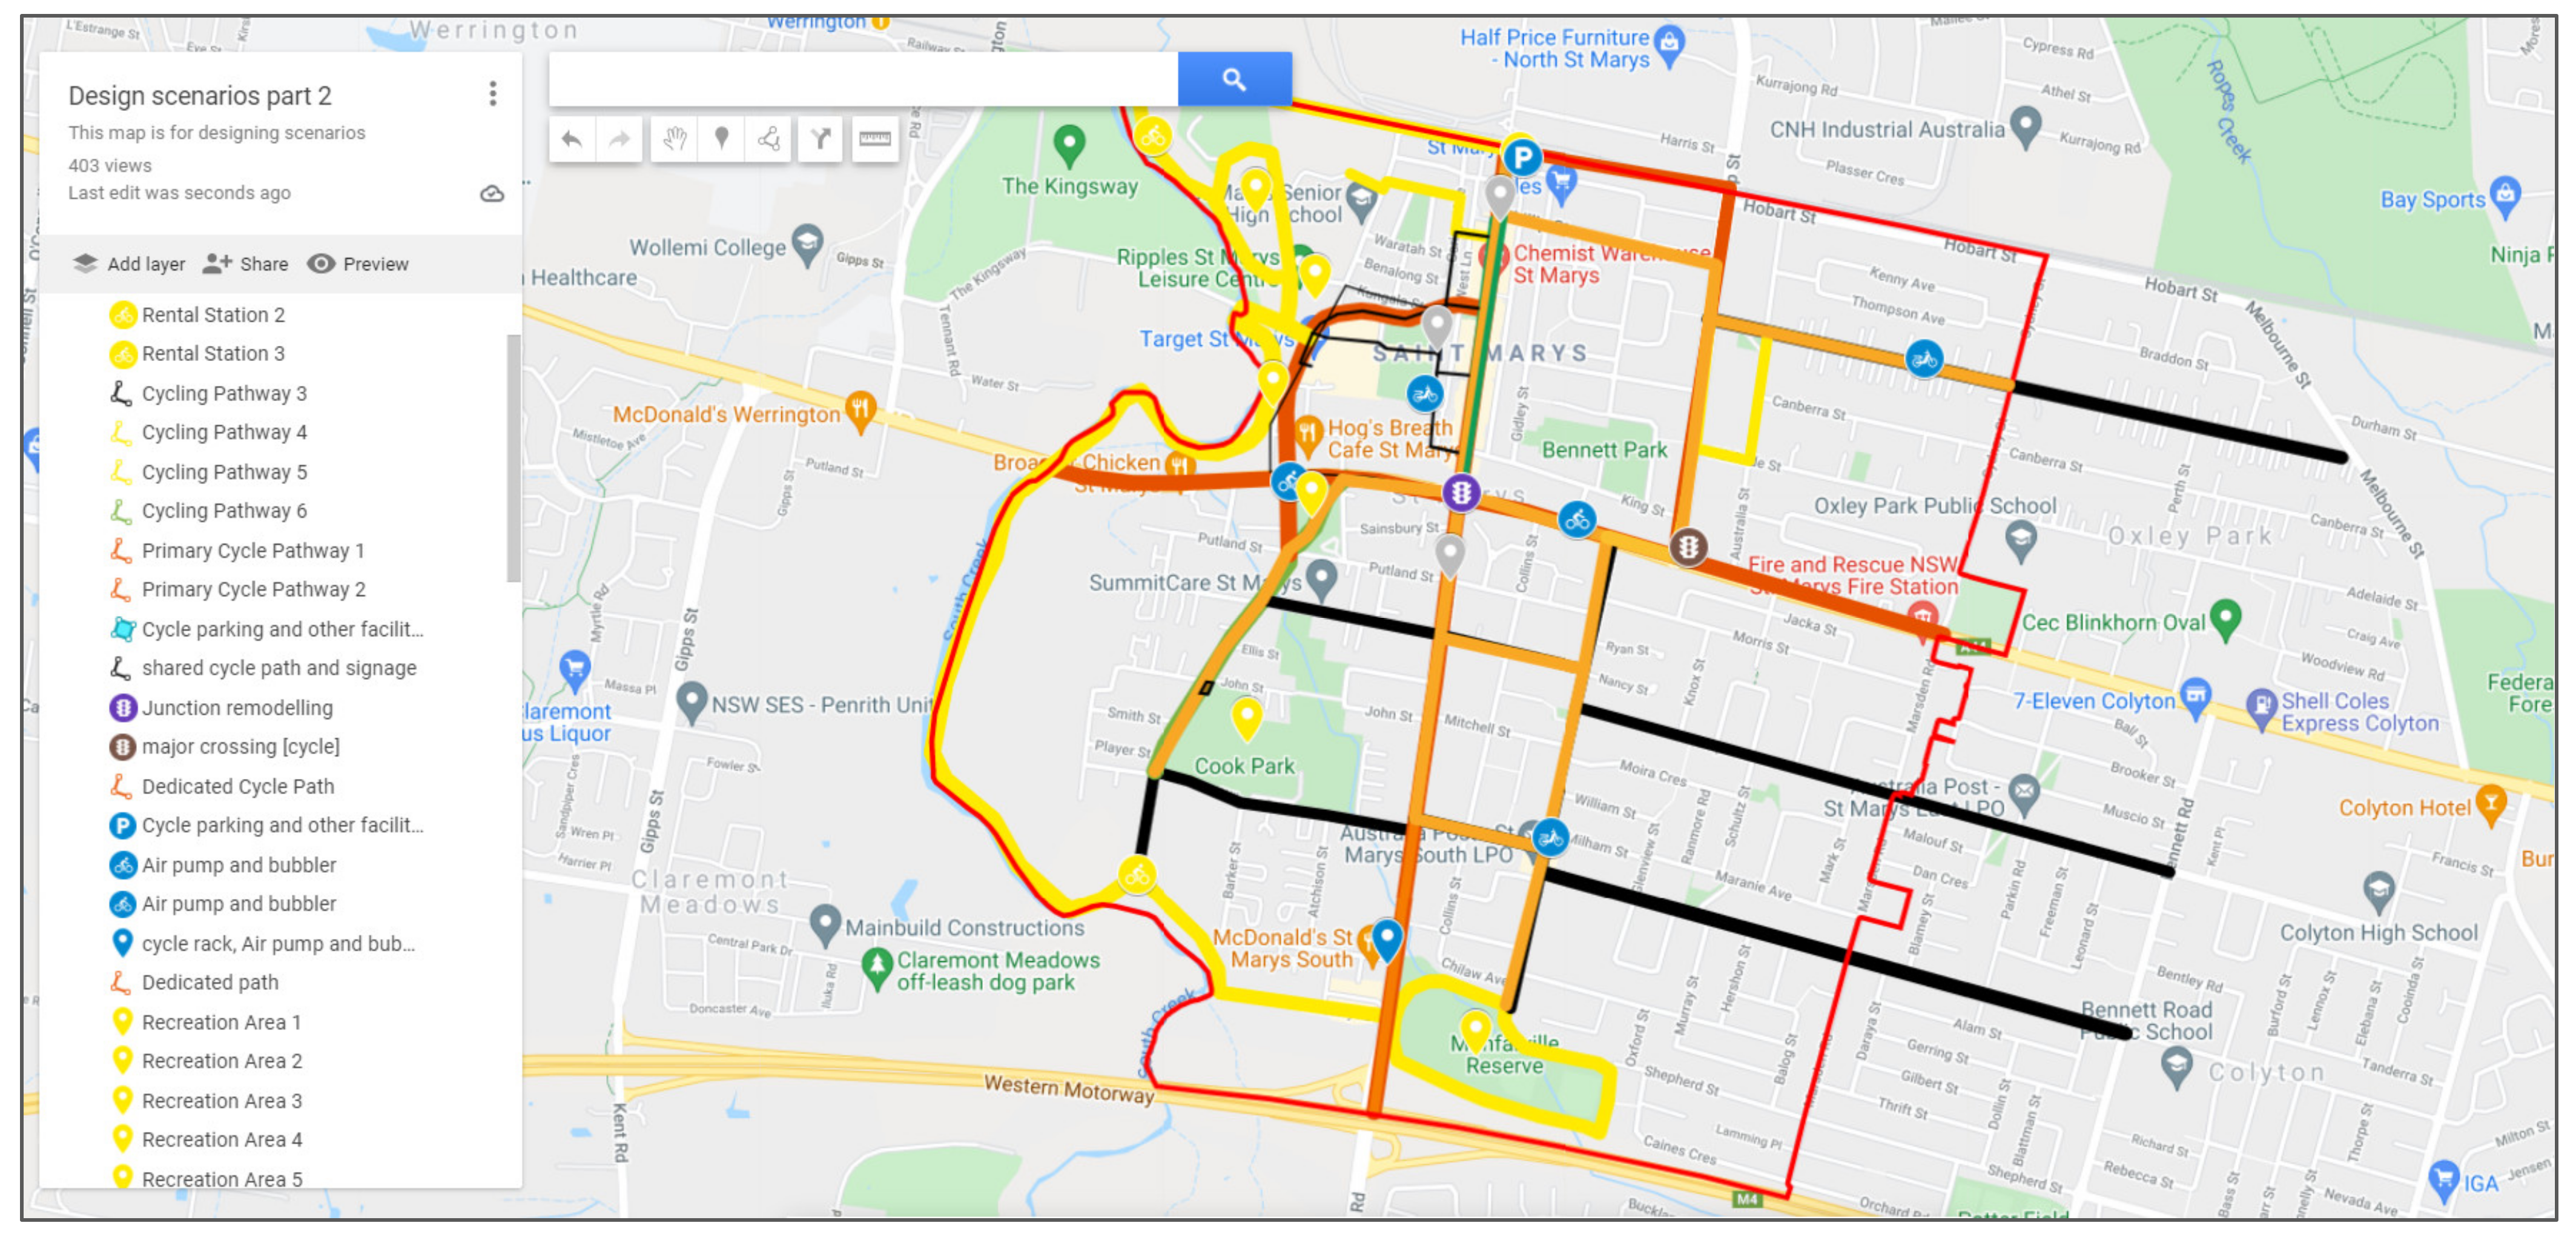
3.4. Geo-Design in Action

The geo-design workshop was held for two consecutive weeks over four days. All required materials, including readings and a detailed agenda, participants’ consent forms, and a pre-workshop questionnaire, were provided one week prior to the workshop. The reading list for the workshop included all presentations, tutorials, and required documents for the design systems, scenarios, and the ABM. The agenda of the geo-design bicycling workshop included details of each step of the geo-design framework, with the corresponding link to the platforms and reading lists stored in a shared storage space.
At the beginning of the workshop, through a questionnaire, the participants were asked about the proposed geo-design framework and were asked to prioritize and rank urban system provisions in bicycling infrastructure planning. The systems provisions ranked were:
-
Provision of integrating bicycling and public transport (bike-transit integration).
-
Provision of safe paths to school (strategies to increase bicycling and physical activity among youth).
-
Provision of providing appropriate bicycling infrastructure (bike stations, various path types, i.e., painted cycleways, separated and designed cycleways, and shared bike services, etc.).
-
Provision of bicycles for leisure, recreation, and tourism.
-
Provision of work/business close to home (balancing jobs and housing in the urban system).
-
Provision of required infrastructure for bicycling sharing systems.
-
Provision of improving real and perceived bicycling safety and provision of social infrastructure (programs and policies to increase bicycling).
All platforms and materials were tested and reviewed prior to the workshop through online discussions 1. Platforms included GitHub, Carto, story map, Poll Everywhere, Mozilla Hub, Google My Map, OneDrive, and BB Collaborate (Appendix A presents the details of used platforms). Each participant was required to create a personal account to share maps and designs in online groups during the workshop. Instructions for using all these platforms were provided before the start of the workshop, along with an online tutorial. The summary and agenda of the workshop is presented in Table 2.
The first day of the geo-design workshop included activities introducing the case study area to the participants. All maps and data were provided in the form of a GIS story map, and the participants could explore and discuss the maps for a specified amount of time. The first story map introduced the case study area using data such as geographic location and key destinations. The participants were also provided with the opportunity to download data from Digital Twin NSW, which upgraded the existing two-dimensional maps into a real-world digital model of cities, facilitating better planning, design, and modelling. To make sure that participants had a sense of the study area, google street view was used to provide a walkthrough of the study area. After introducing the case study, participants were divided into five smaller groups to explore and discuss these maps and datasets.
The rest of the data and maps were presented in six primary models based on the framework outlined by [26]. The representation model included a story map that showed data on destinations, land-use (distance to main destinations); ABS travel to work: distance to work, method of travel, car ownership, public transportation, train stations, bus routes and stops, socio-demographics (age, household size, population), and slope (Figure 6).
The process model included a story map that showed future growth projections (based on new development sites), planning regulations, growth population demands (infrastructure for bicycling), and housing schemes. A survey using ‘Poll Everywhere’ was conducted after each section of the workshop to record participants’ experiences of each section.
On the second day of the geo-design workshop, suitability analysis was introduced as the evaluation model of the geo-design framework. This analysis includes the Propensity to Cycle Tool (based on NSW government data), available cycling infrastructure, accessibility by bicycle, STRAVA and crashes, and a suitability map that overlapped the previous three maps.
The Propensity to Cycle Tool (PCT) or cycling propensity index is an online, interactive planning support system designed to assist transportation planners and policymakers in prioritizing investments and interventions to promote cycling. Accessibility by bicycle map represents access by bicycle to key destinations (10, 20, and 30 min cycling). STRAVA data is the product of several cyclists’ GPS traces, integrated and anonymized in a format useful for urban planners. Crash data was obtained from the Centre for Road Safety of Transport for NSW, focusing on pedal cyclist crashes from 2014 to 2018. The suitability map contains data from all these three layers in one map, and this means that each mesh block on this map has a pop-up that shows the score of each analysis.
The fourth model of this geo-design framework was the change model, which included design systems and two design scenarios presented as story maps. Links and instructions for each of these sections were provided in the story map, and participants could use ‘Google My Map’ to draw up their design projects and policies with a focus on the design systems (Figure 7). The participants worked on five pre-defined systems: (i) Safety; (ii) End-of-trip facilities; (iii) Green spaces and landscaping; (iv) Shared bikes; (v) Cycling pathways. Participants recorded their design in ‘Google My Map’ in five groups (three online groups and two in-person groups) and drew their design strategies for each system, and presented their group design ideas to the Penrith Council, who then provided further feedback.
On the third day of the workshop, as the second part of the change model, participants were assigned to four new groups based on four design scenarios that were defined for them (two online and two in-person groups), including commuting bicycling, recreational bicycling, bicycling to school, and bicycling on the high street and near retail shops.
Participants were instructed to use the design strategies and policies they had used in the previous design section (design systems) to develop their ideas and suggest a specific cycling infrastructure. They were also asked to estimate the cost of the design scenarios based on a cost estimate instruction file provided. With four maps providing a summary of information based on each design scenario, the participants needed to develop their design ideas and strategies with the aim of improving the sustainability, resilience, cost, and health features of the case study area.
The impact of foreseen changes should be evaluated based on their benefits, opportunities, limitations, and harm. In this study, ABM was used as a tool to assess the impact of the change scenarios. The ABM included a model that represented the bicyclist’s movement in the environment; the main agents were bicyclists who started their trip from a living place and chose the shortest path to the desired destination.
The ABM in this study was applied in two iterations of the design. For the first time application of the ABM, the result of the model included maps showing the most used paths (based on the number of agents that had passed from a road) to the desired destination (this destination was selected based on the design scenario concept: train station, shopping centres, schools, and parks) and this could help participants to improve their design. In the second round of design, participants redesigned the area based on each scenario’s ABM results. They created maps in Google My Map and presented their work to each other. Ultimately, everyone in the workshop ranked design scenarios based on the four main criteria of sustainability, resilience, cost, and health.
On the fourth day of the geo-design workshop, the main aim was to complete the design process and have a final design scenario. This should be conducted with stakeholder collaboration (in collaborative workshops) to define decision-makers’ main objectives and requirements and to rank their relevant importance. In this regard, for the second application of the ABM, the results of the model simulation for the satisfaction of bicyclists from their trip for all four design scenarios were used. The satisfaction of bicyclists was calculated according to the type of bicycling infrastructure that was changed before and after the design, which showed participants how their design strategies have improved the experience of bicycling in the areas.
With the design process complete, the groups merged into one online group and one in-person group (commuting bicycling + recreational bicycling and bicycling to school + bicycling in and to the high street and retail shops) and tried to iteratively merge their design ideas while discussing new design strategies and policies to improve their designs. This included a one and a half-hour group discussion. They used all the maps and data that could help them present their final design ideas. The participants presented their design scenarios to Penrith Council in detail, and they, in return, provided constructive feedback. Finally, the participants ranked the design scenarios, and based on the results, bicycling to school + bicycling in and to the high street and retail shops achieved the highest rank.
A comprehensive survey was conducted to assess the effectiveness of the geo-design workshop and the experience of the participants. This survey included questions about the administration of the workshop, geo-design approaches, e.g., how well geo-design approaches can fit into different stages of the process of planning for bicycling infrastructure, simulation, and agent-based modelling, e.g., how useful was the simulated model in the process of preparing the bike plan, geo-design concept, e.g., how useful are the main concepts of geo-design approach in preparing a bike plan, as well as participant suggestions for future studies. In the four days of the geo-design bicycling workshop, participants developed geo-design models through several iterative stages, and created more than 100 design policies and projects based on the defined systems and design scenarios (safety, end-of-trip facilities, bike share, bicycling infrastructure, and green space and landscaping). Figure 8 illustrates the final proposed plan to the council according to the final ranking (the recreational bicycling design scenarios achieved the highest score according to voting results).

4. Findings

This section represents the findings of this study, including the results of the surveys and the feedback from the participants and facilitators. In total, two surveys were conducted: a pre-workshop questionnaire, which assessed the different provisions for planning the bicycling network, and a post-workshop questionnaire, which assessed the participants’ experiences both during the workshop and in using the technological tools and platforms. In these surveys, 30 responses were collected. In the pre-workshop questionnaire, participants were asked to prioritize eight provisions of urban systems for bicycling planning. The highest scores were given to “improvement of real and perceived bicycling safety”. The next highest score was given to “providing appropriate bicycling infrastructure (bike station, various path types such as painted cycleway, separated and designed cycleway)” (Figure 9).
According to the post-workshop questionnaire, fourteen participants had participated in a previous workshop, and three had participated in a geo-design workshop. For the first part of the survey concerning the administration of the workshop, participants rated their overall experience (1 = very poor, 2 = poor, 3 = average, 4 = good, and 5 = excellent). Based on the findings, all items had a rate higher than 3.5, showing their relative satisfaction with the workshop.
The second section of the survey included questions regarding: “How well geo-design approach can fit into different stages of the process of planning for bicycling infrastructure”. More than 20 participants found this process valuable in cycling planning, and the highest score among the different stages was attributed to the proposal of future alternatives (4.12 out of 5). In the next section, the survey asked, “How useful was the simulated model in the process of preparing the bike plan”. A total of 19 participants found this modelling method easy to use for the simulation of bicyclist movements. In the last section of the survey, 23 participants confirmed that they would recommend this method for future planning of bicycling infrastructure.
Feedback from moderators and participants was collected and reviewed to improve the geo-design process in the future both during and after the workshop. There were five moderators for each group discussion, and they helped participants go through the workshop agenda. Based on the moderators’ experience, engaging online participants in the discussions was challenging. Online participants were not talking much and needed some encouragement from the moderators to discuss online. Few participants were involved in discussions; a few kept silent,, participated in passive modes, and no one turned cameras on. This was more challenging when all participants were asked to work together in a large group (final design stage). There was no issue with group discussion in the in-person groups. Therefore, there is a need to consider ways to keep online groups active in the online workshop.
Participants were confused by the platforms they had to work with. They required more instruction and time to become familiar with these platforms. Furthermore, participants needed more time for their design sessions. The design sessions were around 45 to 90 min, depending on the purpose of the design. For the first design session (systems design), which was 45 min, participants could thoroughly discuss their design strategies and draw them on Google My Map. For the last part of the design, time was insufficient.
In addition to the mentioned surveys, participants answered nine questions in a workbook that reflected their experience in each section of the geo-design workshop. They were asked to write 100–200 words about their insight for each section, and support their statements with screenshots and photos of the workshop session. Participants asserted that, for the design sessions, they needed a guideline that could lead them to complete their assigned tasks. This could include a role that each participant could take (for example, one could take a role as an urban designer; another could take a landscape designer role or transportation engineer). This would help them take responsibility, and they could more efficiently achieve their objectives. Homogenous and inexperienced participants may find it challenging to come up with perfect ideas; a lack of confidence in their own judgment and a lack of authoritative affirmation may cause some participants to be afraid to challenge others’ views or voice their own opinions. As a result, the most confident and active participants often draw conclusions. This could be facilitated by engaging different participants, such as professors from other disciplines or even more government personnel. Participants also asked for a platform that would enable them to export, analyze, or edit data.

5. Discussion

The current study developed a geo-design framework for planning bicycling infrastructure. This framework aimed to investigate the application of collaborative and data-driven approaches in a hybrid mode in response to the new post-COVID-19 environment. This study empirically tested and analysed the developed framework by performing co-design workshops and conveying surveys and obtained the following findings.
First, according to the pre-workshop questionnaire, the most important provision of an urban system for bicycling planning is providing a safe environment and infrastructure for bicycling. This finding aligns with [7,56,57]. Second, for providing the appropriate and safe infrastructure for bicycling, the geo-design approach is valuable for different stages of bicycling planning, especially for proposing various alternatives for future networks. Third, a developed ABM was found useful and replicable to other experiments to simulate bicyclists in a built environment based on various design scenarios. Finally, although the geo-design approach in a hybrid mode has limitations in team collaboration, developed methods, online platforms, and facilitating tools proved successful and applicable to bicycling infrastructure planning practice.

5.1. A Geo-Design Approach to Bicycling Planning

The findings presented illustrate essential evidence for applying collaborative geo-design workshops in planning bicycling networks. This geo-design process proved to be generally helpful in facilitating the bicycling planning process: (1) design scenarios for the bicycling network were found successful as they can be translated as proposed plans for the case study, (2) a successful and facilitated discussion environment for collaborative planning had been created, (3) the geo-design workshop provides a framework for comprehensive and efficient usage of different tools and datasets.
The geo-design process created room for participatory scenario planning for bicycling networks using different tools and datasets. This process was aimed at creating a co-learning process that enables creative thinking [58]. There are various proposed plans for the future of bicycling networks; using impact assessment methods, such as ABM, enables the examination of design scenarios using exemplary indicators, such as the level of satisfaction of bicyclists according to the new proposed infrastructure. At the next stage, these indicators can be translated into the co-cost and co-benefit of design ideas.
One of the main challenges in developing plans for more sustainable cities is breaking down the traditional barriers to collaborative planning in government agencies. Using a geo-design approach can enable the engagement of key government agencies to break down these barriers and allow them to create more integrated plans for cities [23]. According to the received feedback, these workshops enabled participants to go through the planning process more efficiently. This process facilitated their communication in group work and allowed them to propose various design ideas and strategies in a small amount of time. This shows that even though the workshop is held for authorities to plan a real bicycling network, geo-design enables effective collaboration. Having a hybrid mode allows participation even from other countries.
As noted in Section 2 and Section 3, the focus of this study was on using available open-sourced and crowdsourced data to have an evidence-based approach. Using these datasets and tools provided insight into how the study area works regarding the built environment and bicyclist behavior. Participants could receive sufficient information to start designing and planning the case study without visiting the site. Using Google Street View lets participants virtually wander the area; Digital Twin NSW allows them to obtain any data they want; STRAVA data shows the number of bicyclists passing through the routes. This data enables participants to compare the current number of bicyclists and potential bicyclists according to the proposed plans. Using the ABM to simulate bicyclist movement in the existing built environment and proposed plans provided helpful insights that facilitated the design and planning process, according to the participants’ feedback.

5.2. Limitations and Future Suggestions

Despite the merits of this study, some limitations need to be addressed for future research. Although the workshop revealed that it could support planning for bicycling infrastructure at the local government level in four days, more time should be allocated for the workshop to produce better results or to tackle infrastructure at a larger scale. Some of the challenges faced involved encouraging collaboration between people with different backgrounds, which could be solved through the provision of more time and more organized discussion sessions. The range of datasets provided for the workshop and the effort spent exploring them were also limited by the overall length of the workshop. A hybrid workshop requires a new and effective set of tools and platforms, such as Miro or Poll Everywhere, to accommodate an in-person and fully online workshop. Although geo-design-specific platforms such as Geo-designhub.com can provide better feature sets, the hybrid format requires flexibility which is only achievable through a combination of tools. A unified platform that can include all maps and data allows participants to draw and design, perform impact analysis of design scenarios, and enable collaboration in a hybrid mode that can improve participants’ experience and result in greater engagement by online participants. In addition, although thirty-two postgraduate students (who were undertaking advanced studies in built environments and some were practising professionals in built environments) and three stakeholders provided enough feedback to draw conclusions about the effectiveness of this approach, in future studies, including participants from local and governmental agencies could help to improve the process.

6. Conclusions

Currently, due to the rapid increase in city populations and congestion problems, bicycling has gained attention in the design of streets, being a more sustainable mode of transport. However, the increasing number of bicyclists necessitates considering appropriate infrastructure and policies. Data-driven tools and methods can support the current process of planning in the new environment of open and crowdsourced data. Furthermore, as there are different stakeholders involved in the planning process, there is a need for effective frameworks for collaborative planning. Geo-design is a collaborative framework that can enable such processes using data-driven methods. Applying this approach to bicycling planning can help to overcome some of the issues in the current process. In this study, a four-day geo-design workshop was conducted with geo-design course students and planning practitioners from the local government to create a space for a collaborative designing process. In this workshop, with the support of moderators and stakeholders from the Penrith Council, participants with different backgrounds could create design scenarios, evaluate the scenarios using the ABM model, and make evidence-based decisions for the study area. Using various platforms, the workshop was conducted in a hybrid format for geo-design, which also enables people from different locations to participate in geo-design bicycling workshops and collaborate effectively in a virtual environment. This proposed geo-design framework, in conjunction with data-driven methods such as ABM, and digital collaborative platforms, supports a creative environment that enables an evidence-based bicycling infrastructure planning process in the study area. This process can be successfully repeated in other practices of planning and by other authorities and government agencies engaged in planning and designing bicycling infrastructure.

Author Contributions

Conceptualization, P.Z., C.P., S.L. and O.G.; methodology, P.Z., C.P., S.L. and O.G.; software, P.Z.; validation, P.Z., C.P., S.L. and O.G.; formal analysis, P.Z.; investigation, P.Z., C.P., S.L. and O.G. and B.S.; writing—original draft preparation, P.Z.; writing—review and editing, P.Z., C.P., S.L., O.G. and B.S.; visualization, P.Z.; supervision, C.P., S.L. and O.G. All authors have read and agreed to the published version of the manuscript.

Funding

This research received no external funding.

Institutional Review Board Statement

The study was conducted in accordance with the Declaration of Helsinki, and approved by Ethics Committee of University of New South Wales (protocol code HC200637 and 2 September 2020).

Informed Consent Statement

Informed consent was obtained from all subjects involved in the study.

Data Availability Statement

Data available on request due to restrictions eg privacy or ethical.

Conflicts of Interest

The authors declare no conflict of interest.

Appendix A. Used Platforms

As this geo-design workshop was conducted in a hybrid format, several online platforms were used to run the workshop. There were several test sessions for all these platforms before the start of the workshop. Based on these tests, some platforms were inefficient, such as ‘github’ for creating a shared space. The primary platform for this geo-design workshop was ‘BlackBoard Collaborate’, a platform that enables group discussion in a virtual environment and allows the group to break into which smaller sections for focused work.
‘Mozilla Hub’, a virtual room in which users can collaborate, share ideas, maps, notes, and files, was also used. The workshop created a room with six main screens for sharing maps (one screen for each model) and two whiteboards for writing notes. Participants could see all the geo-design models in one place, and they could collaborate through this platform. ‘Mozilla Hub’ was found to be unsuitable after the first day of the workshop, due to difficulties participants faced in entering the hub room.
All maps and models were prepared in ‘shape file’ format, and they were uploaded to the ArcGIS online platform. This platform enabled participants to have access to all written materials and maps in one place. ‘ArcGIS StoryMaps’ were used to create inspiring, immersive stories on the models by combining text, interactive maps, and other multimedia content. The workshop also used Carto, an online service for web mapping and spatial analysis, which enables a user to interact with maps and provided data. These interactive maps and data were embedded in the ‘ArcGIS StoryMaps’ via this platform.
The participants used ‘Google My Map’ to create their design maps, a free online mapping platform for drawing and sharing maps and design ideas. This platform’s link was embedded in the change model story map, and participants could directly create their maps within their group. All groups were defined in this platform before the workshop session, and there was one map per design session on the workshop agenda. This platform enables participants to see all design ideas on one map.
‘Poll Everywhere’ was used for collecting participants’ live responses to the workshop questions. This online tool allows users to create and collect responses to poll questions or activities. In a live session, such as in a lecture, tutorial, or webinar, answers can be collected by displaying a unique link. To respond to the activity, participants access the link using their laptops and responses can be shown in real time, allowing for an interactive session. A Poll Everywhere link was provided after each section of the workshop, and responses were collected and stored.
‘Qualtrics’ is another online platform used to collect participants’ responses in the geo-design workshop. This platform’s advantage over Poll Everywhere was that it enables collecting data for an unlimited number of questions and answers in CSV format. Therefore, this platform was used for pre-and post-workshop questionnaires.

Note

1
This study is a chapter of broader research/dissertation for applying a geo-design and data-driven approach to planning for bicycling infrastructure.

References

  1. United Nations. “68% of the World Population Projected to Live in Urban Areas by 2050, Says UN,” United Nations Department of Economic and Social Affairs. 2018. Available online: https://www.un.org/development/desa/en/news/population/2018-revision-of-world-urbanization-prospects.html (accessed on 1 January 2020).
  2. Infrastructure Australia. “Urban Transport Crowding and Congestion: The Australian Infrastructure Audit 2019. 2019. Available online: https://www.infrastructureaustralia.gov.au/sites/default/files/2019-08/Urban%20Transport%20Crowding%20and%20Congestion.pdf (accessed on 11 November 2019).
  3. Murphy, E.; Usher, J. The Role of Bicycle-sharing in the City: Analysis of the Irish Experience. Int. J. Sustain. Transp. 2015, 9, 116–125. [Google Scholar] [CrossRef]
  4. Porter, A.K.; Salvo, D.; Pérez, A.; Reininger, B.; Kohl, H.W. Intrapersonal and Environmental Correlates of Bicycling in U.S. Adults. Am. J. Prev. Med. 2018, 54, 413–418. [Google Scholar] [CrossRef] [PubMed]
  5. Pucher, J.; Garrard, J.; Greaves, S. Cycling down under: A comparative analysis of bicycling trends and policies in Sydney and Melbourne. J. Transp. Geogr. 2011, 19, 332–345. [Google Scholar] [CrossRef]
  6. Titze, S.; Stronegger, W.J.; Janschitz, S.; Oja, P. Association of built-environment, social-environment and personal factors with bicycling as a mode of transportation among Austrian city dwellers. Prev. Med. 2008, 47, 252–259. [Google Scholar] [CrossRef]
  7. Pucher, J.; Dill, J.; Handy, S. Infrastructure, programs, and policies to increase bicycling: An international review. Prev. Med. 2010, 50, S106–S125. [Google Scholar] [CrossRef] [PubMed]
  8. Stinson, M.A.; Bhat, C. Commuter Bicyclist Route Choice: Analysis Using a Stated Preference Survey. Transp. Res. Rec. J. Transp. Res. Board 2003, 1828, 107–115. [Google Scholar] [CrossRef]
  9. Rybarczyk, G.; Gallagher, L. Measuring the potential for bicycling and walking at a metropolitan commuter university. J. Transp. Geogr. 2014, 39, 1–10. [Google Scholar] [CrossRef]
  10. Turoń, K.; Sierpiński, G. Bike-sharing as a possibility to support Vision Zero. MATEC Web Conf. 2018, 231, 03005. [Google Scholar] [CrossRef] [Green Version]
  11. Topp, H.; Pharoah, T. Car-free city centres. Transportation 1994, 21, 231–247. [Google Scholar] [CrossRef]
  12. Dudziak, A.; Caban, J. The Urban Transport Strategy on the Example of the City Bike System in the City of Lublin in Relation to the COVID-19 Pandemic. LOGI—Sci. J. Transp. Logist. 2022, 13, 1–12. [Google Scholar] [CrossRef]
  13. City of Sydney. Inner Sydney Regional Bicycle Network: Demand Assessment and Economic Appraisal; AECOM: Sydney, Australia, 2010. [Google Scholar]
  14. Committe for Sydney. Making Sydney a Cycling City. 2021. Available online: https://sydney.org.au/wp-content/uploads/2021/05/Committee-for-Sydney-Making-Sydney-a-cycling-city-May-2021.pdf (accessed on 11 September 2022).
  15. NSW Government. Movement and Place. 2021. Available online: https://www.movementandplace.nsw.gov.au/ (accessed on 11 August 2022).
  16. The City of Sydney. Creating Pop-Up Cycleways in Sydney. 2021. Available online: https://www.cityofsydney.nsw.gov.au/building-new-infrastructure/creating-pop-up-cycleways-in-sydney (accessed on 11 August 2022).
  17. Transport for NSW. Pop-Up Transport. 2021. Available online: https://roads-waterways.transport.nsw.gov.au/projects/popup-covid-19-infrastructure/index.html (accessed on 11 August 2022).
  18. Australian Bureau of Statistics. Regional Population by Age and Sex. 2016. Available online: https://www.abs.gov.au/statistics/people/population/regional-population-age-and-sex/latest-release (accessed on 11 February 2022).
  19. Pucher, J.; Buehler, R. Making Cycling Irresistible: Lessons from The Netherlands, Denmark and Germany. Transp. Rev. 2008, 28, 495–528. [Google Scholar] [CrossRef]
  20. Ellison, R.B.; Greaves, S. Travel Time Competitiveness of Cycling in Sydney, Australia. Transp. Res. Rec. J. Transp. Res. Board 2011, 2247, 99–108. [Google Scholar] [CrossRef]
  21. Leao, S.Z.; Lieske, S.N.; Pettit, C.J. Validating crowdsourced bicycling mobility data for supporting city planning. Transp. Lett. 2017, 11, 486–497. [Google Scholar] [CrossRef]
  22. Koglin, T.; Rye, T. The marginalisation of bicycling in Modernist urban transport planning. J. Transp. Health 2014, 1, 214–222. [Google Scholar] [CrossRef] [Green Version]
  23. Pettit, C.J.; Hawken, S.; Ticzon, C.; Leao, S.Z.; Afrooz, A.E.; Lieske, S.N.; Canfield, T.; Ballal, H.; Steinitz, C. Breaking down the silos through geodesign—Envisioning Sydney’s urban future. Environ. Plan. B Urban Anal. City Sci. 2019, 46, 1387–1404. [Google Scholar] [CrossRef]
  24. Tackling Wicked Problems: Through the Transdisciplinary Imagination; Harris, J.; Brown, V.A.; Russell, J. (Eds.) Routledge: London, UK, 2010. [Google Scholar] [CrossRef]
  25. Mayer, I.S.; van Bueren, E.M.; Bots, P.W.G.; van der Voort, H.; Seijdel, R. Collaborative Decisionmaking for Sustainable Urban Renewal Projects: A Simulation—Gaming Approach. Environ. Plan. B Plan. Des. 2005, 32, 403–423. [Google Scholar] [CrossRef]
  26. Steinitz, C. A framework for geodesign: Changing geography by design. In The People of the Place, Design Professions, Geographic Sciences, Information Technologies, 1st ed.; Esri Press: Redlands, CA, USA, 2012. [Google Scholar]
  27. Ervin, S. A system for GeoDesign. Proc. Digit. Landsc. Archit. 2012, 25, 145–154. [Google Scholar]
  28. Slotterback, C.S.; Runck, B.; Pitt, D.G.; Kne, L.; Jordan, N.R.; Mulla, D.J.; Zerger, C.; Reichenbach, M. Collaborative Geodesign to advance multifunctional landscapes. Landsc. Urban Plan. 2016, 156, 71–80. [Google Scholar] [CrossRef] [Green Version]
  29. Davis, J.; Pijawka, D.; Wentz, E.A.; Hale, M. Evaluation of community-based land use planning through Geodesign: Application to American Indian communities. Landsc. Urban Plan. 2020, 203, 103880. [Google Scholar] [CrossRef]
  30. Lenferink, S.; Arciniegas, G.; Samsura, A.; Carton, L. Integrating Geodesign and game experiments for negotiating urban development. Res. Urban. Ser. 2016, 4, 70–92. [Google Scholar] [CrossRef]
  31. Kuby, M.; Bailey, K.; Wei, F.; Fowler, J.; Tong, D.; Zhong, Q.; Lopez, O.; Sheaffer, W. Collaborative Geodesign for Alternative-Fuel Station Location using “Collablocation” Software. Transp. Res. Rec. J. Transp. Res. Board 2018, 2672, 98–108. [Google Scholar] [CrossRef]
  32. Kazak, J.K.; Garcia Castro, D.; Swiader, M.; Szewrański, S. Decision Support System in Public Transport Planning for Promoting Urban Adaptation to Climate Change. IOP Conf. Ser. Mater. Sci. Eng. 2019, 471, 112007. [Google Scholar] [CrossRef]
  33. Liu, Z.; He, C.; Yang, Y.; Fang, Z. Planning sustainable urban landscape under the stress of climate change in the drylands of northern China: A scenario analysis based on LUSD-urban model. J. Clean. Prod. 2019, 244, 118709. [Google Scholar] [CrossRef]
  34. Debnath, R.; Pettit, C.; Leao, S.Z.; Lock, O. The Role of Technology Tools to Support Geodesign in Resilience Planning. In Urban Informatics and Future Cities; Geertman, S.C.M., Pettit, C., Goodspeed, R., Staffans, A., Eds.; Springer: Cham, Switzerland, 2021; pp. 447–463. [Google Scholar] [CrossRef]
  35. De Oliveira, F.H.; Lazaro, J.C.; Moura, A.C.M.; Soares, M.C.; Braghirolli, G. Geodesign Experience in Florianópolis Metropolitan Region: Practical Planning with Different Professional Backgrounds. In Computational Science and Its Applications—ICCSA 2022 Workshops; Gervasi, O., Murgante, B., Misra, S., Rocha, A.M.A.C., Garau, C., Eds.; Springer: Cham, Switzerland, 2022; Volume 13379, pp. 117–131. [Google Scholar] [CrossRef]
  36. Sandre, A.A.; Fruehauf, A.L.; Miyahara, A.A.L.; Rosa, A.A.; Maruyama, C.M.; Locoselli, G.M.; Candido, L.F.; Lombardo, M.A.; Coelho, M.A.; Murolo, R.P.; et al. Geodesign Brazil: Trees for the Metropolitan Area of São Paulo. In Computational Science and Its Applications—ICCSA 2021; Gervasi, O., Murgante, B., Misra, S., Garau, C., Blečić, I., Taniar, D., Apduhan, B.O., Rocha, A.M.A.C., Tarantino, E., Torre, C.M., Eds.; Springer: Cham, Switzerland, 2021; Volume 12954, pp. 463–475. [Google Scholar] [CrossRef]
  37. Moura, A.C.M.; Freitas, C.R. Co-creation of Ideas in Geodesign Process to Support Opinion and Decision Making: Case Study of a Slum in Minas Gerais, Brazil. In Innovation in Urban and Regional Planning; La Rosa, D., Privitera, R., Eds.; Springer: Cham, Switzerland, 2021; Volume 146, pp. 255–264. [Google Scholar] [CrossRef]
  38. Foster, K. Geodesign parsed: Placing it within the rubric of recognized design theories. Landsc. Urban Plan. 2016, 156, 92–100. [Google Scholar] [CrossRef] [Green Version]
  39. Planning Support Systems in Practice; Geertman, S.; Stillwell, J. (Eds.) Springer: Berlin/Heidelberg, Germany, 2003. [Google Scholar] [CrossRef]
  40. Lovelace, R.; Goodman, A.; Aldred, R.; Berkoff, N.; Abbas, A.; Woodcock, J. The Propensity to Cycle Tool: An open source online system for sustainable transport planning. J. Transp. Land Use 2017, 10, 505–528. [Google Scholar] [CrossRef]
  41. Kuzmyak, J.R.; Walters, J.; Bradley, M.; Kockelman, K.M. Estimating Bicycling and Walking for Planning and Project Development: A Guidebook; Transportation Research Board: Washington, DC, USA, 2014. [CrossRef] [Green Version]
  42. Larsen, J.; Patterson, Z.; El-Geneidy, A. Build It. But Where? The Use of Geographic Information Systems in Identifying Locations for New Cycling Infrastructure. Int. J. Sustain. Transp. 2013, 7, 299–317. [Google Scholar] [CrossRef]
  43. Nelson, T.; Ferster, C.; Laberee, K.; Fuller, D.; Winters, M. Crowdsourced data for bicycling research and practice. Transp. Rev. 2020, 41, 97–114. [Google Scholar] [CrossRef]
  44. Lißner, S.; Francke, A.; Becker, T. Modeling Cyclists Traffic Volume—Can Bicycle Planning benefit from Smartphone based Data? In Proceedings of the 7th Transport Research Arena TRA 2018, Vienna, Austria, 16–19 April 2018. [Google Scholar] [CrossRef]
  45. Larsson, M.; Silvano, A.P. Open Data for Bicycle Classification for Better Planning and Simulation, and for Better Detection from Motorized Vehicles (OpenBike-CD). SAFER. 2022. Available online: http://urn.kb.se/resolve?urn=urn:nbn:se:vti:diva-18781 (accessed on 11 August 2022).
  46. Ratanaburi, N.; Alade, T.; Saçli, F. Effects of stakeholder participation on the quality of bicycle infrastructure. A case of Rattanakosin bicycle lane, Bangkok, Thailand. Case Stud. Transp. Policy 2021, 9, 637–650. [Google Scholar] [CrossRef]
  47. Macmillan, A.; Connor, J.; Witten, K.; Kearns, R.; Rees, D.; Woodward, A. The Societal Costs and Benefits of Commuter Bicycling: Simulating the Effects of Specific Policies Using System Dynamics Modeling. Environ. Health Perspect. 2014, 122, 335–344. [Google Scholar] [CrossRef] [Green Version]
  48. Heath, B.L.; Hill, R.R. Some insights into the emergence of agent-based modelling. In Agent-Based Modeling and Simulation; Taylor, S.J.E., Ed.; Palgrave Macmillan: London, UK, 2014; pp. 32–44. [Google Scholar] [CrossRef]
  49. Stieler, D.; Schwinn, T.; Leder, S.; Maierhofer, M.; Kannenberg, F.; Menges, A. Agent-based modeling and simulation in architecture. Autom. Constr. 2022, 141, 104426. [Google Scholar] [CrossRef]
  50. Zare, P.; Leao, S.; Pettit, C.J.; Gudes, O. Agent-based modelling in planning for bicycling: Practice of using open data for simulation of cyclists’ movement in the urban environments. 2022. [Google Scholar]
  51. Macal, C.M.; North, M.J. Tutorial on agent-based modelling and simulation. J. Simul. 2010, 4, 151–162. [Google Scholar] [CrossRef]
  52. Crooks, A.T.; Heppenstall, A.J. Introduction to Agent-Based Modelling. In Agent-Based Models of Geographical Systems; Heppenstall, A.J., Crooks, A.T., See, L.M., Batty, M., Eds.; Springer: Dordrecht, The Netherlands, 2012; pp. 85–105. [Google Scholar] [CrossRef]
  53. Piatkowski, D.P.; Marshall, W. Not all prospective bicyclists are created equal: The role of attitudes, socio-demographics, and the built environment in bicycle commuting. Travel Behav. Soc. 2015, 2, 166–173. [Google Scholar] [CrossRef]
  54. Panter, J.; Heinen, E.; Mackett, R.; Ogilvie, D. Impact of New Transport Infrastructure on Walking, Cycling, and Physical Activity. Am. J. Prev. Med. 2015, 50, e45–e53. [Google Scholar] [CrossRef] [PubMed] [Green Version]
  55. Furth, P.G.; Mekuria, M.C.; Nixon, H. Network Connectivity for Low-Stress Bicycling. Transp. Res. Rec. J. Transp. Res. Board 2016, 2587, 41–49. [Google Scholar] [CrossRef] [Green Version]
  56. Dill, J. Bicycling for Transportation and Health: The Role of Infrastructure. J. Public Health Policy 2009, 30, S95–S110. [Google Scholar] [CrossRef] [PubMed]
  57. Tulu, G.S.; Hadgu, M.; Tarekegn, A. Bicycling in Addis Ababa, Ethiopia: Opportunities and challenges. J. Sustain. Dev. Transp. Logist. 2019, 4, 50–59. [Google Scholar] [CrossRef]
  58. Oteros-Rozas, E.; Martín-López, B.; Daw, T.M.; Bohensky, E.L.; Butler, J.R.A.; Hill, R.; Martin-Ortega, J.; Quinlan, A.; Ravera, F.; Ruiz-Mallén, I.; et al. Participatory scenario planning in place-based social-ecological research. Ecol. Soc. 2015, 20, 4. Available online: http://www.jstor.org/stable/26270296 (accessed on 11 August 2022). [CrossRef]
Figure 1. Workflow of the geo-design workshop adopted from [26].
Land 11 01943 g001
Figure 2. The location of the case study in the Penrith LGA.
Land 11 01943 g002
Figure 3. The case study boundary and main destinations.
Land 11 01943 g003
Figure 4. Groups and participants in the geo-design bicycling workshop.
Land 11 01943 g004
Figure 5. Hybrid geo-design workshop (left), participants in groups using touch tables (right).
Land 11 01943 g005
Figure 6. Example of used maps and data: (a) land use; (b) propensity to cycle.
Land 11 01943 g006
Figure 7. Screenshots of sketch designs using Google My Map.
Land 11 01943 g007
Figure 8. Proposed bicycling network for the case study using Google My Map.
Land 11 01943 g008
Figure 9. Level of priority (mean of the scores) for design provisions according to the pre-workshop survey.
Land 11 01943 g009
Table 1. Data sources and tools used in the geo-design workshop.
Geo-Design
Framework
Data SourceApplicationAnalysis Method
Representation
model
Open Street MapRoad networkNetwork analysis
Infrastructure Cycleway Data (NSW)Bicycling facility typeNetwork analysis
Elevation—ElvisSlope Slope analysis
Land useLiving and working placesCatchment analysis
Australian Bureau of StatisticsPopulation demographics Spatial analysis
General Transit Feed Specification (GTFS)Public transport stationsGeneral Transit Feed Specification analysis
Process
model
Council strategic planFuture structure plan
Housing scheme
Spatial analysis
Australian Bureau of StatisticsPopulation projectionSpatial analysis
Giraffe with the innovative NSW Spatial ServicesFuture and current development projectsSpatial analysis
Evaluation modelPropensity to cycle (Open data—Transport NSW)Willingness to use a bikeSpatial analysis
Accessibility by bikeAccessibility of main destinations by bikeNetwork analysis
StravaBicycling countsSpatial analysis
Crash data—Road safety crash statistics NSWSafety to ride a bikeSpatial analysis
Change
model
Google map placesBicycling trip destinations Spatial analysis
Infrastructure Cycleway Data (NSW)Current bicycling facility typeNetwork analysis
GTFS- Public transit stops and routes (ABM simulation)Design scenario 1Catchment analysis
Recreational centers—tree canopy Design scenario 2ABM simulation
Public schools—catchment area Design scenario 3Catchment analysis—ABM simulation
Land use and trip destinations Design scenario 4
Impact
model
Number of bicyclists according to each design scenario Design scenario impact assessmentABM simulations
Decision
model
Satisfaction of bicyclists from each design scenario according to the bicycling infrastructureDesign scenario impact assessmentABM simulation
statistical
Table 2. Bicycling planning steps and geo-design models in the four days of workshops.
DayGeo-Design ModelBicycling Planning Step
Day 1Representation modelCurrent situation study
Process modelBicycling systems assessment
Day 2Evaluation modelAnalysis of the current situation
Change modelDesign systems
Day 3Change modelDesign scenarios: Four scenarios
Impact modelImpact assessment: ABM
Day 4Change modelDesign scenarios: Two scenarios
Impact modelImpact assessment: ABM
Decision modelFinal proposed plan
Publisher’s Note: MDPI stays neutral with regard to jurisdictional claims in published maps and institutional affiliations.

