
Nature-Based Solutions in “Forest–Wetland” Spatial Planning Strategies to Promote Sustainable City Development in Tianjin, China


Abstract
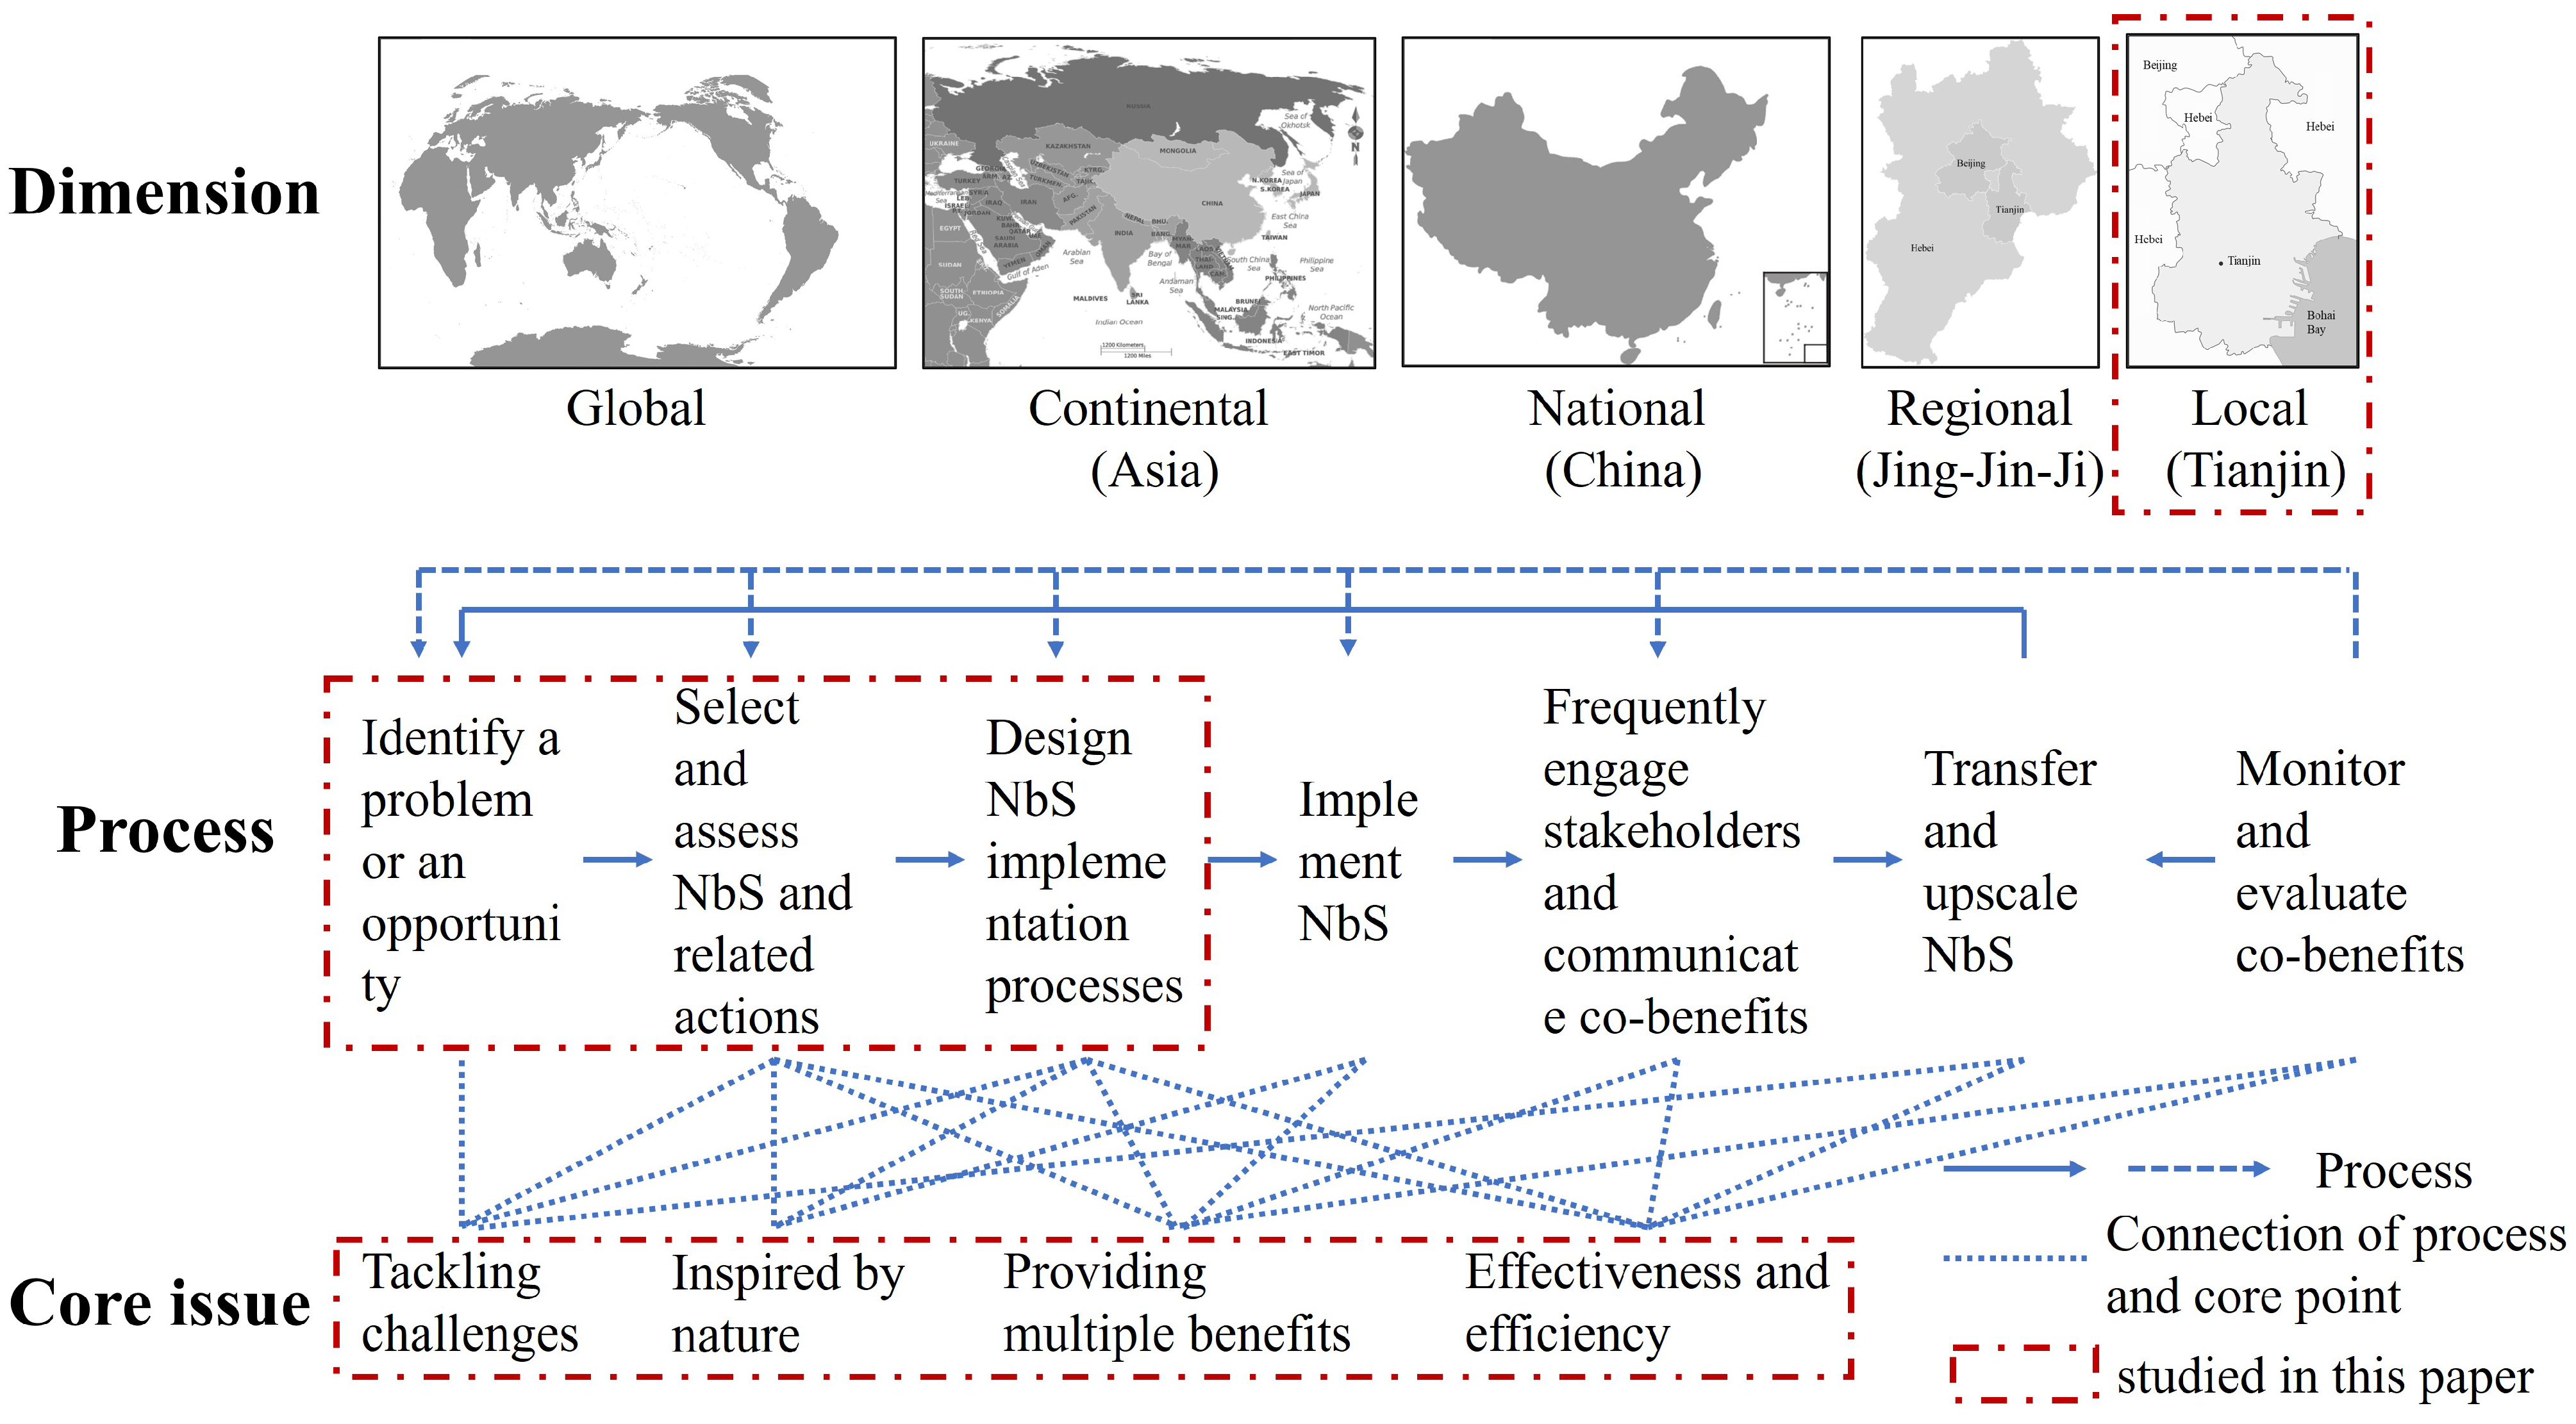
:1. Introduction
2. Materials and Methods
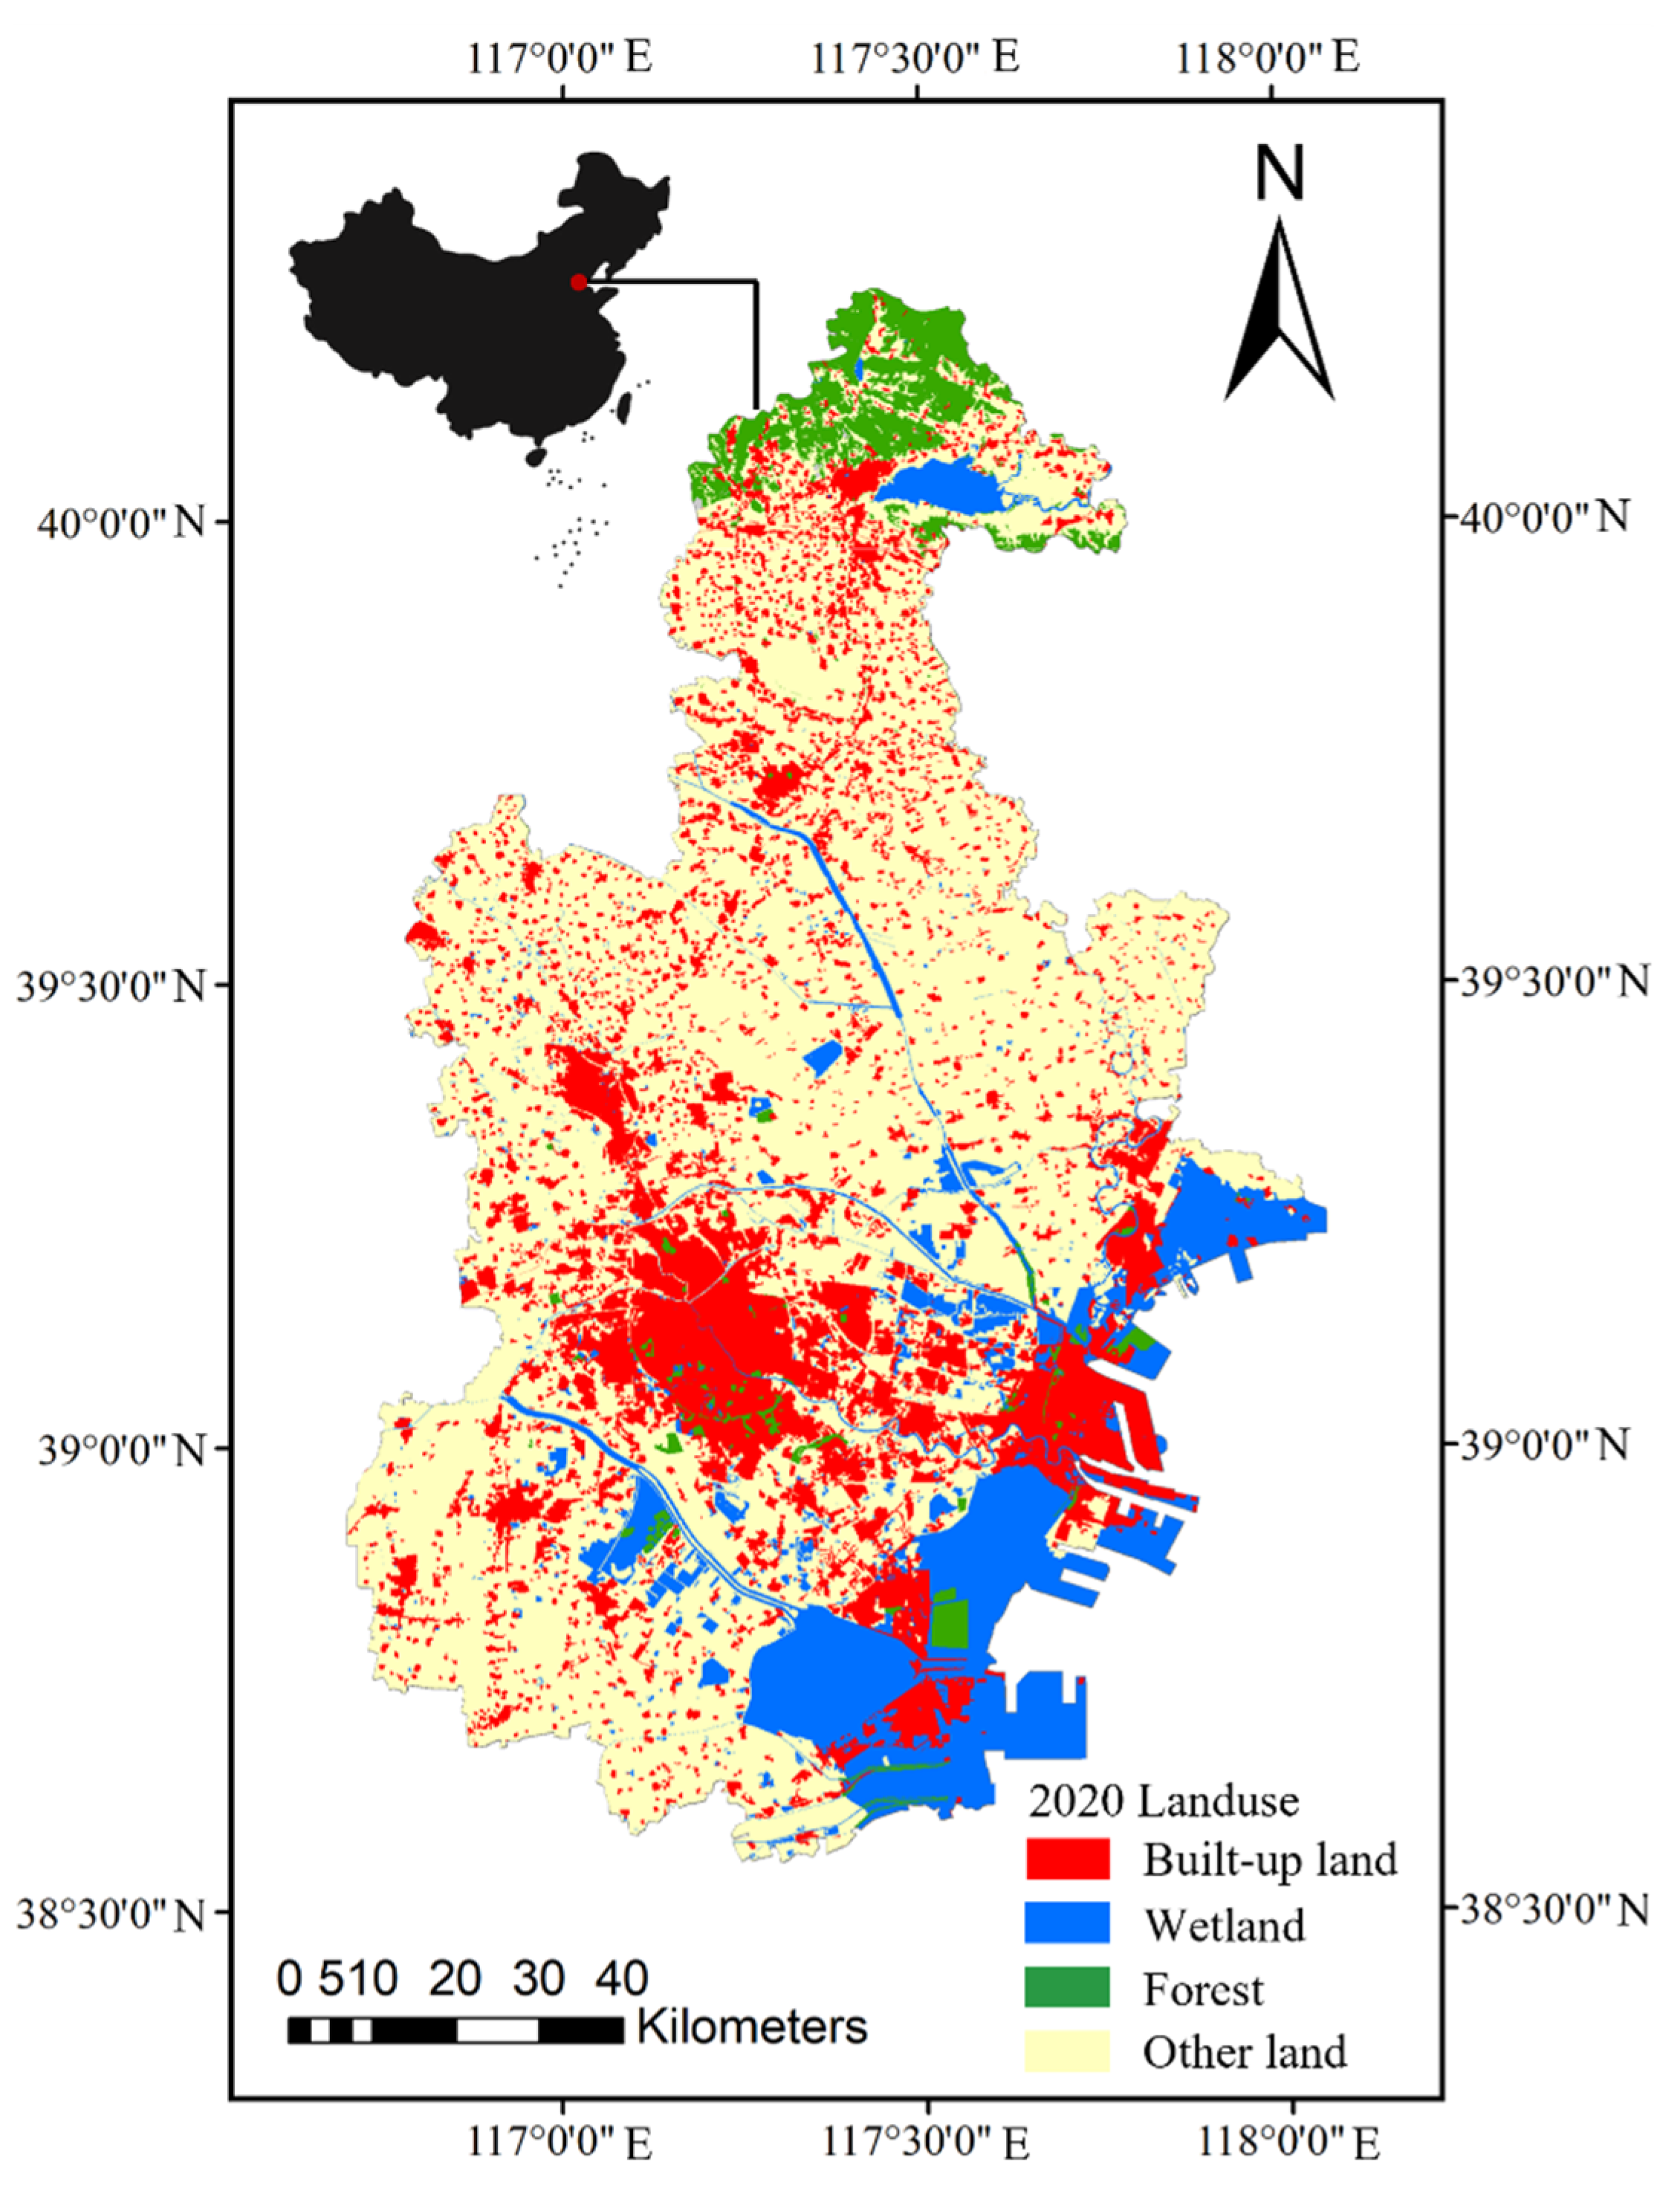
2.1. Study Area
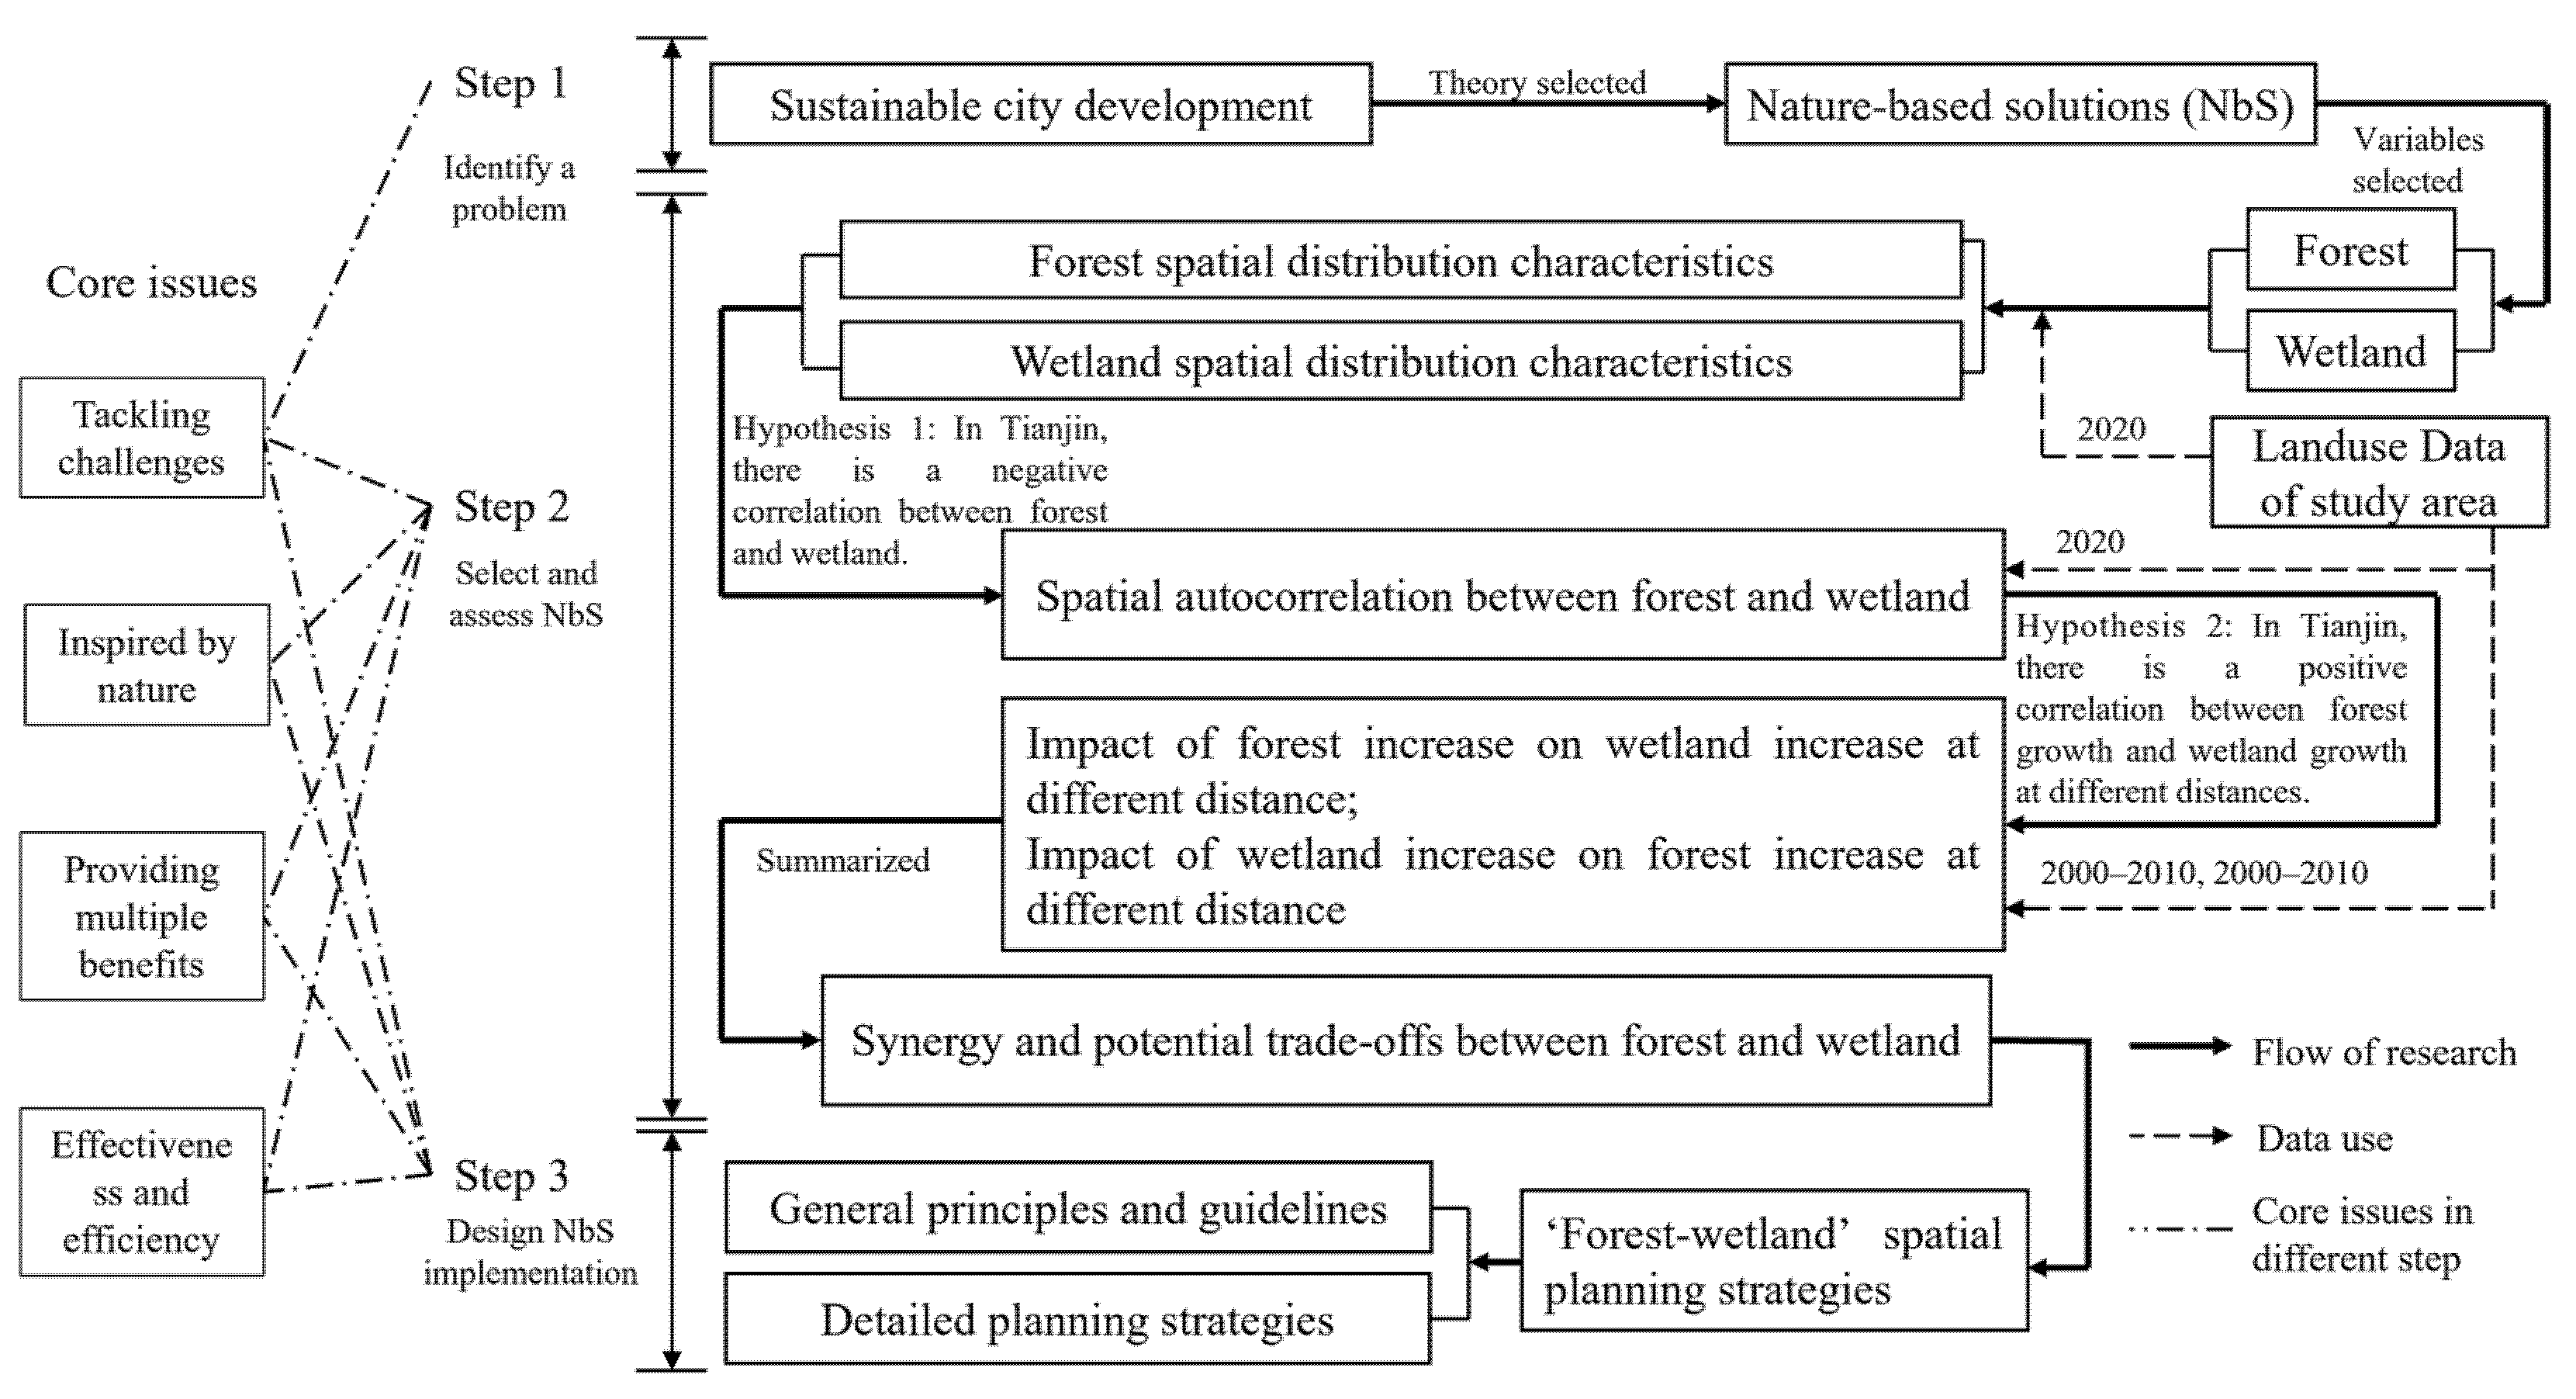
2.2. Research Approach
2.3. Data Sources and Database
2.4. Methods
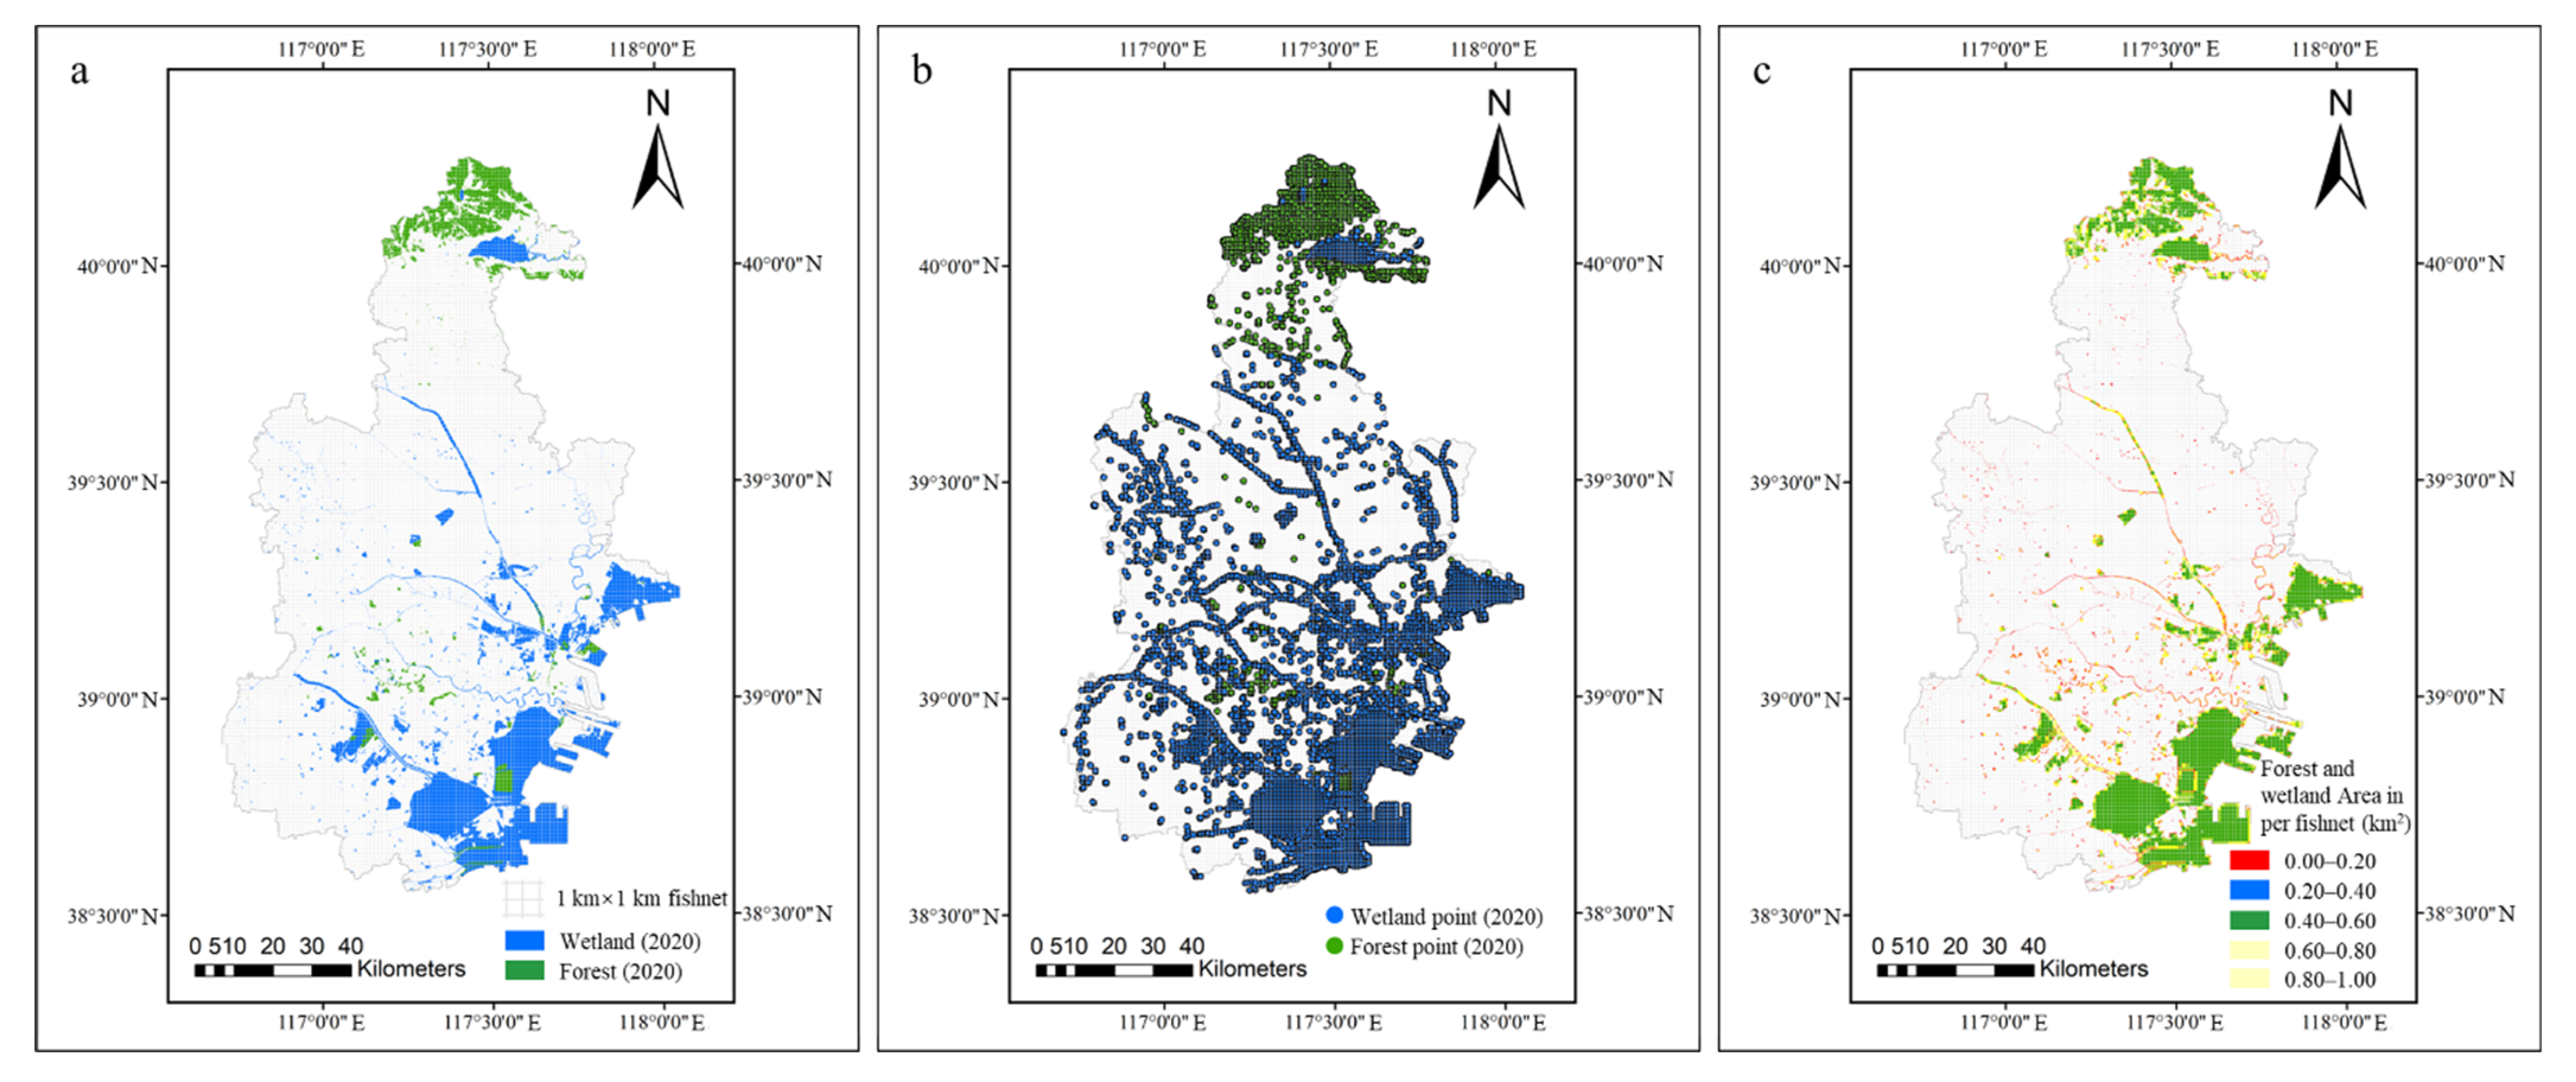
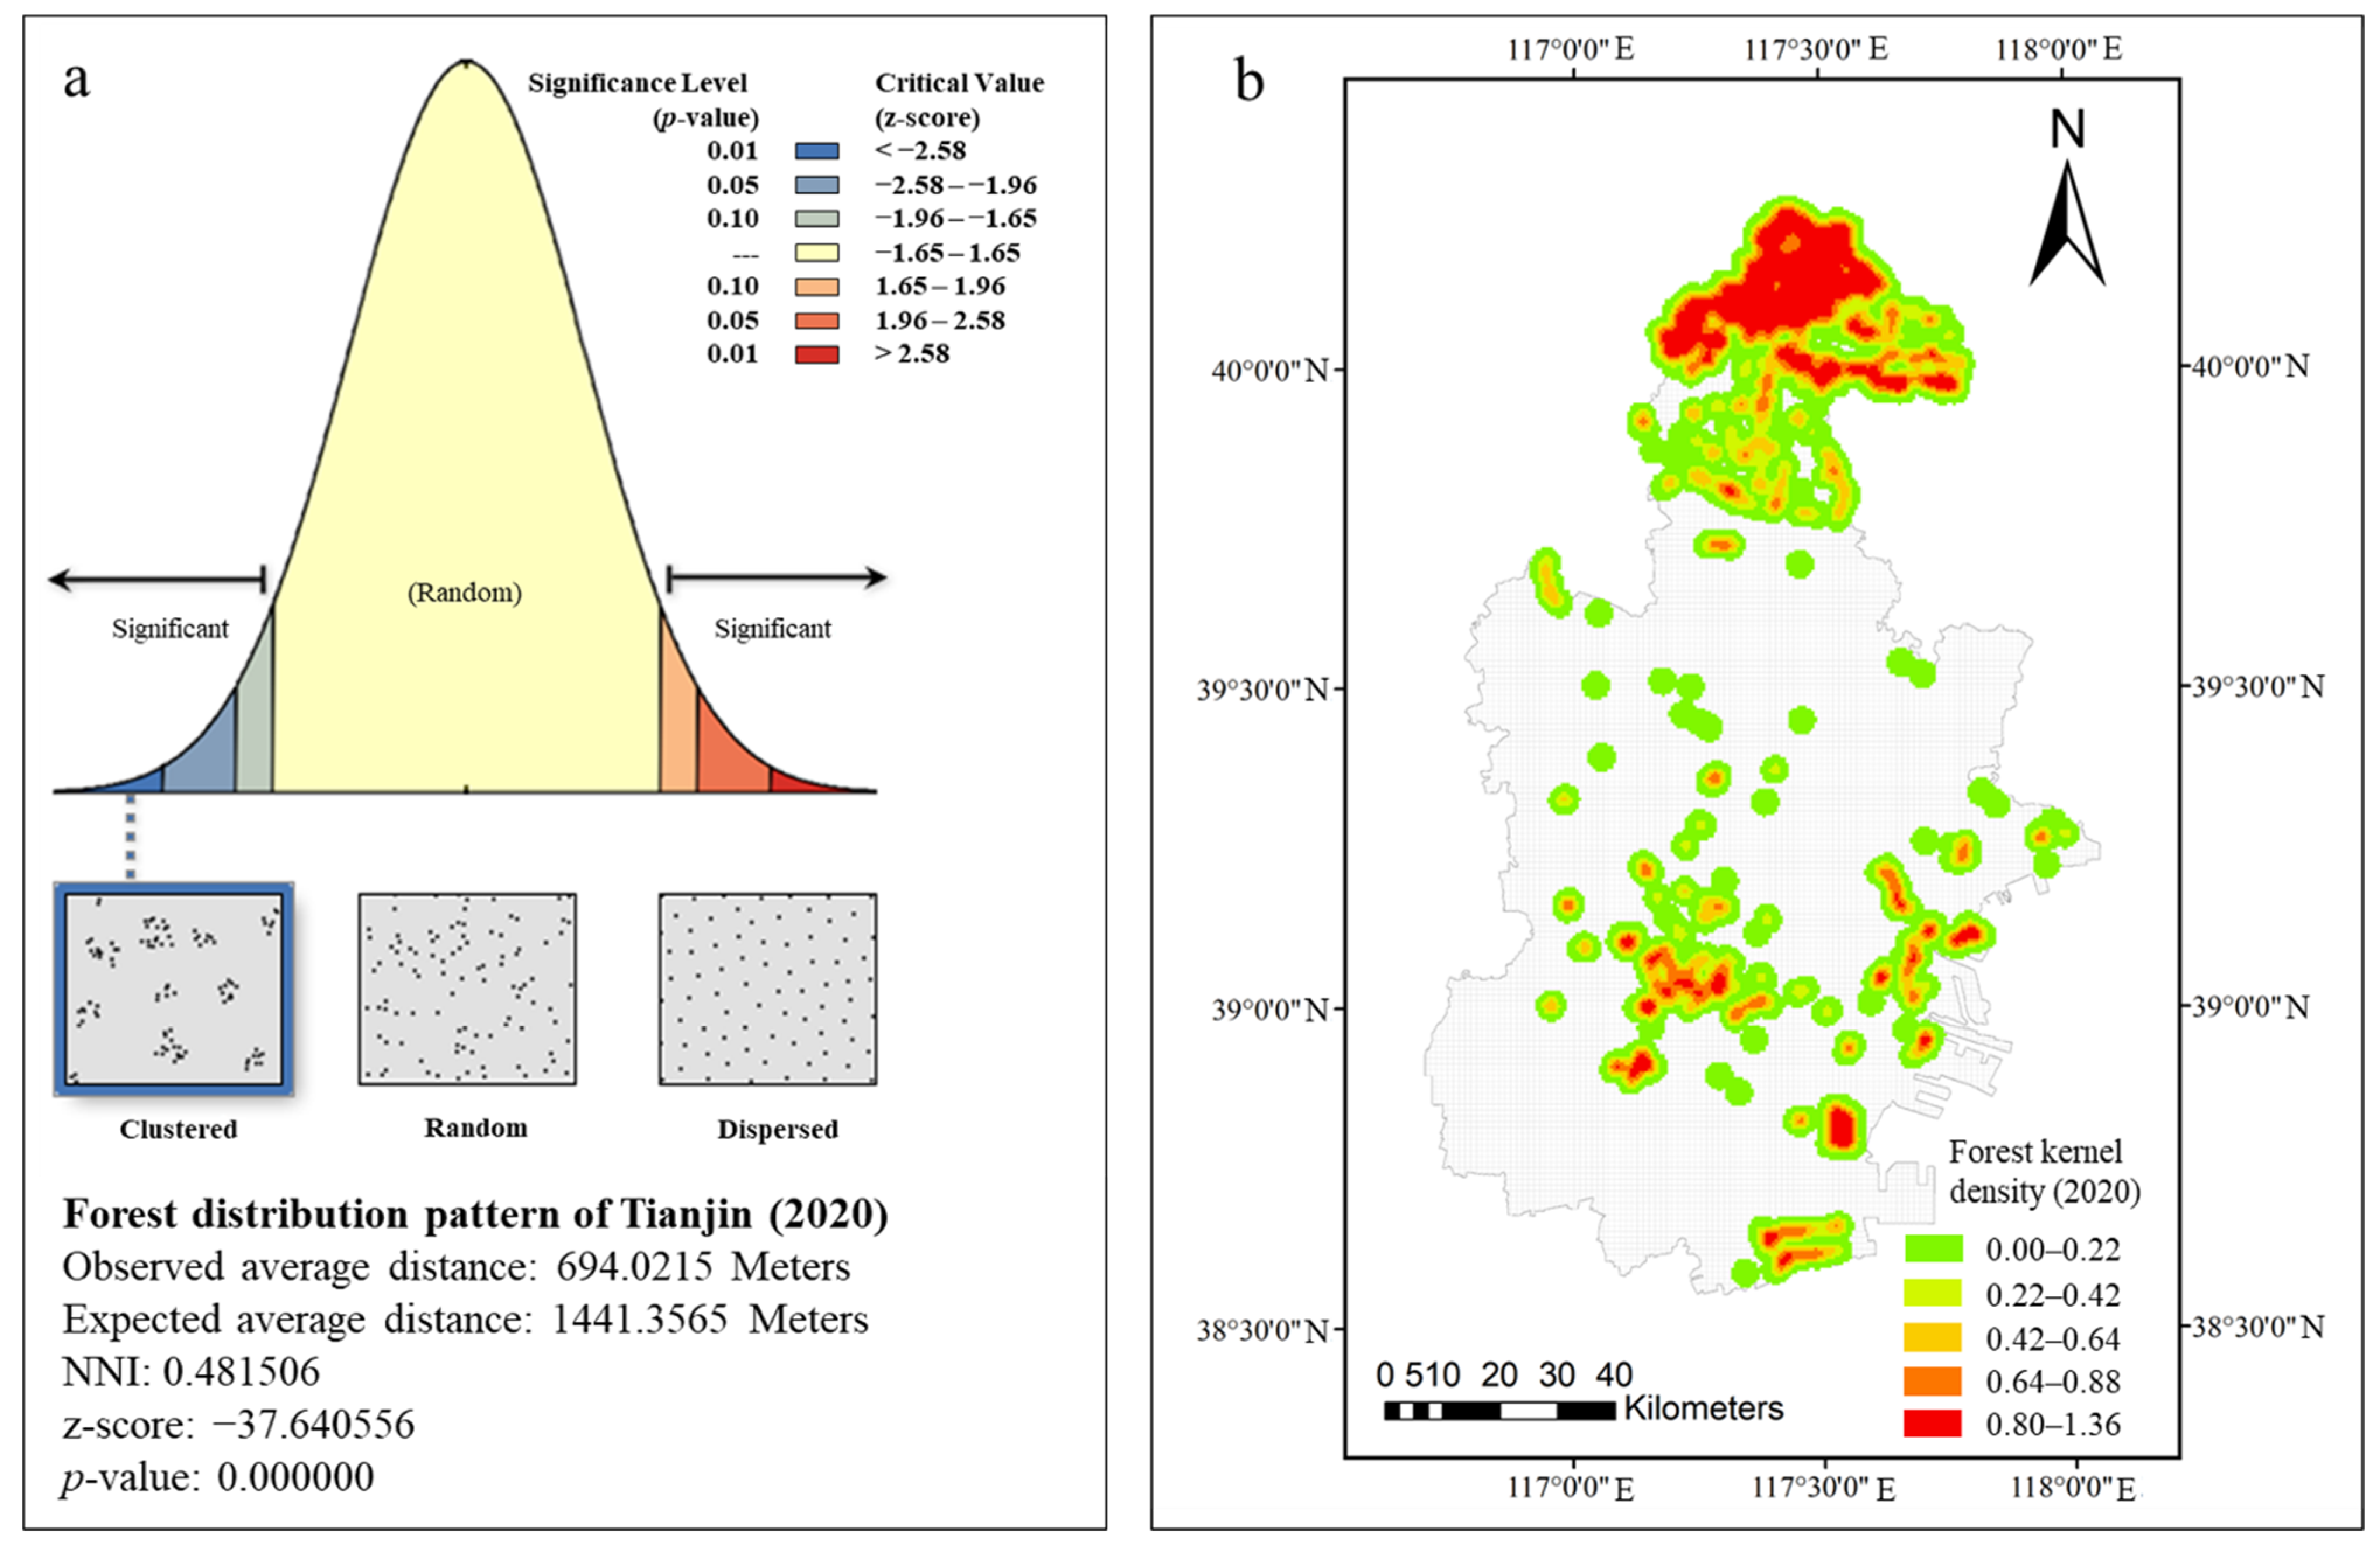
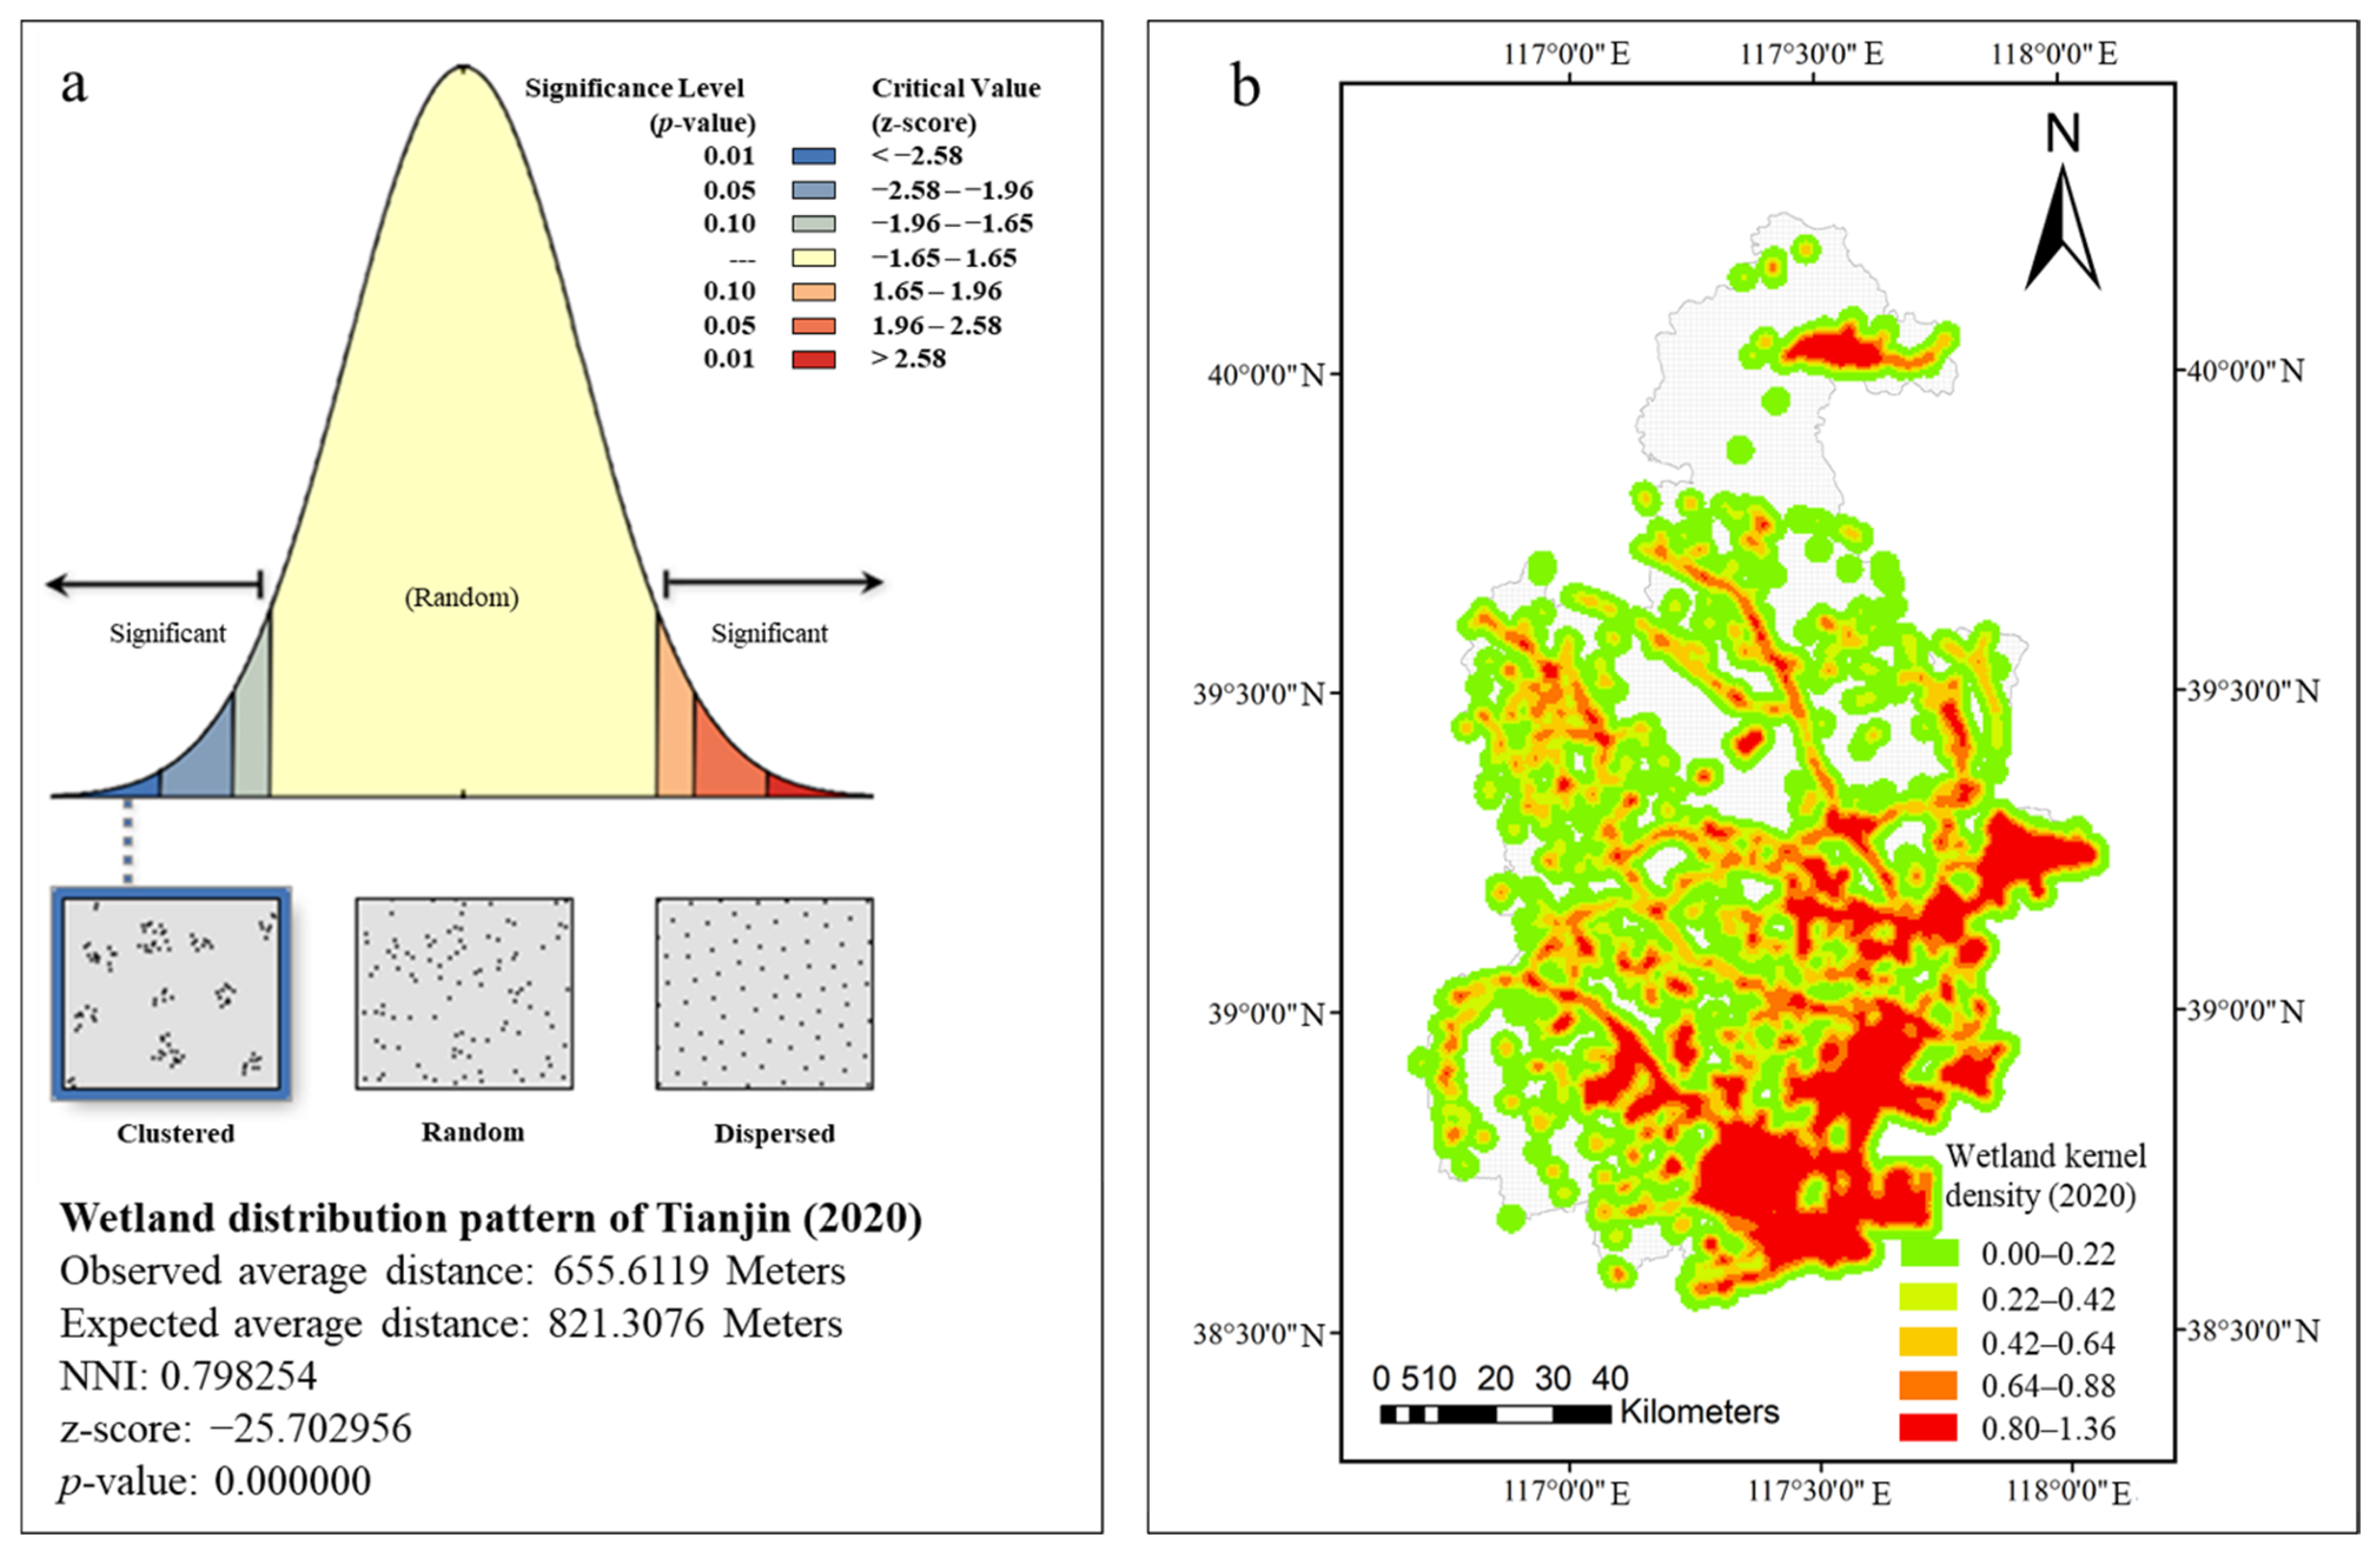
2.4.1. Spatial Distribution Pattern
2.4.2. Geographic Concentration
- Equilibrium determination
- 2.
- Equilibrium Degree Densification
2.4.3. Kernel Density
2.4.4. Spatial Autocorrelation
2.4.5. Hydrological Analysis
3. Results
3.1. Spatial Distribution of Forests
3.2. Spatial Distribution of Wetlands
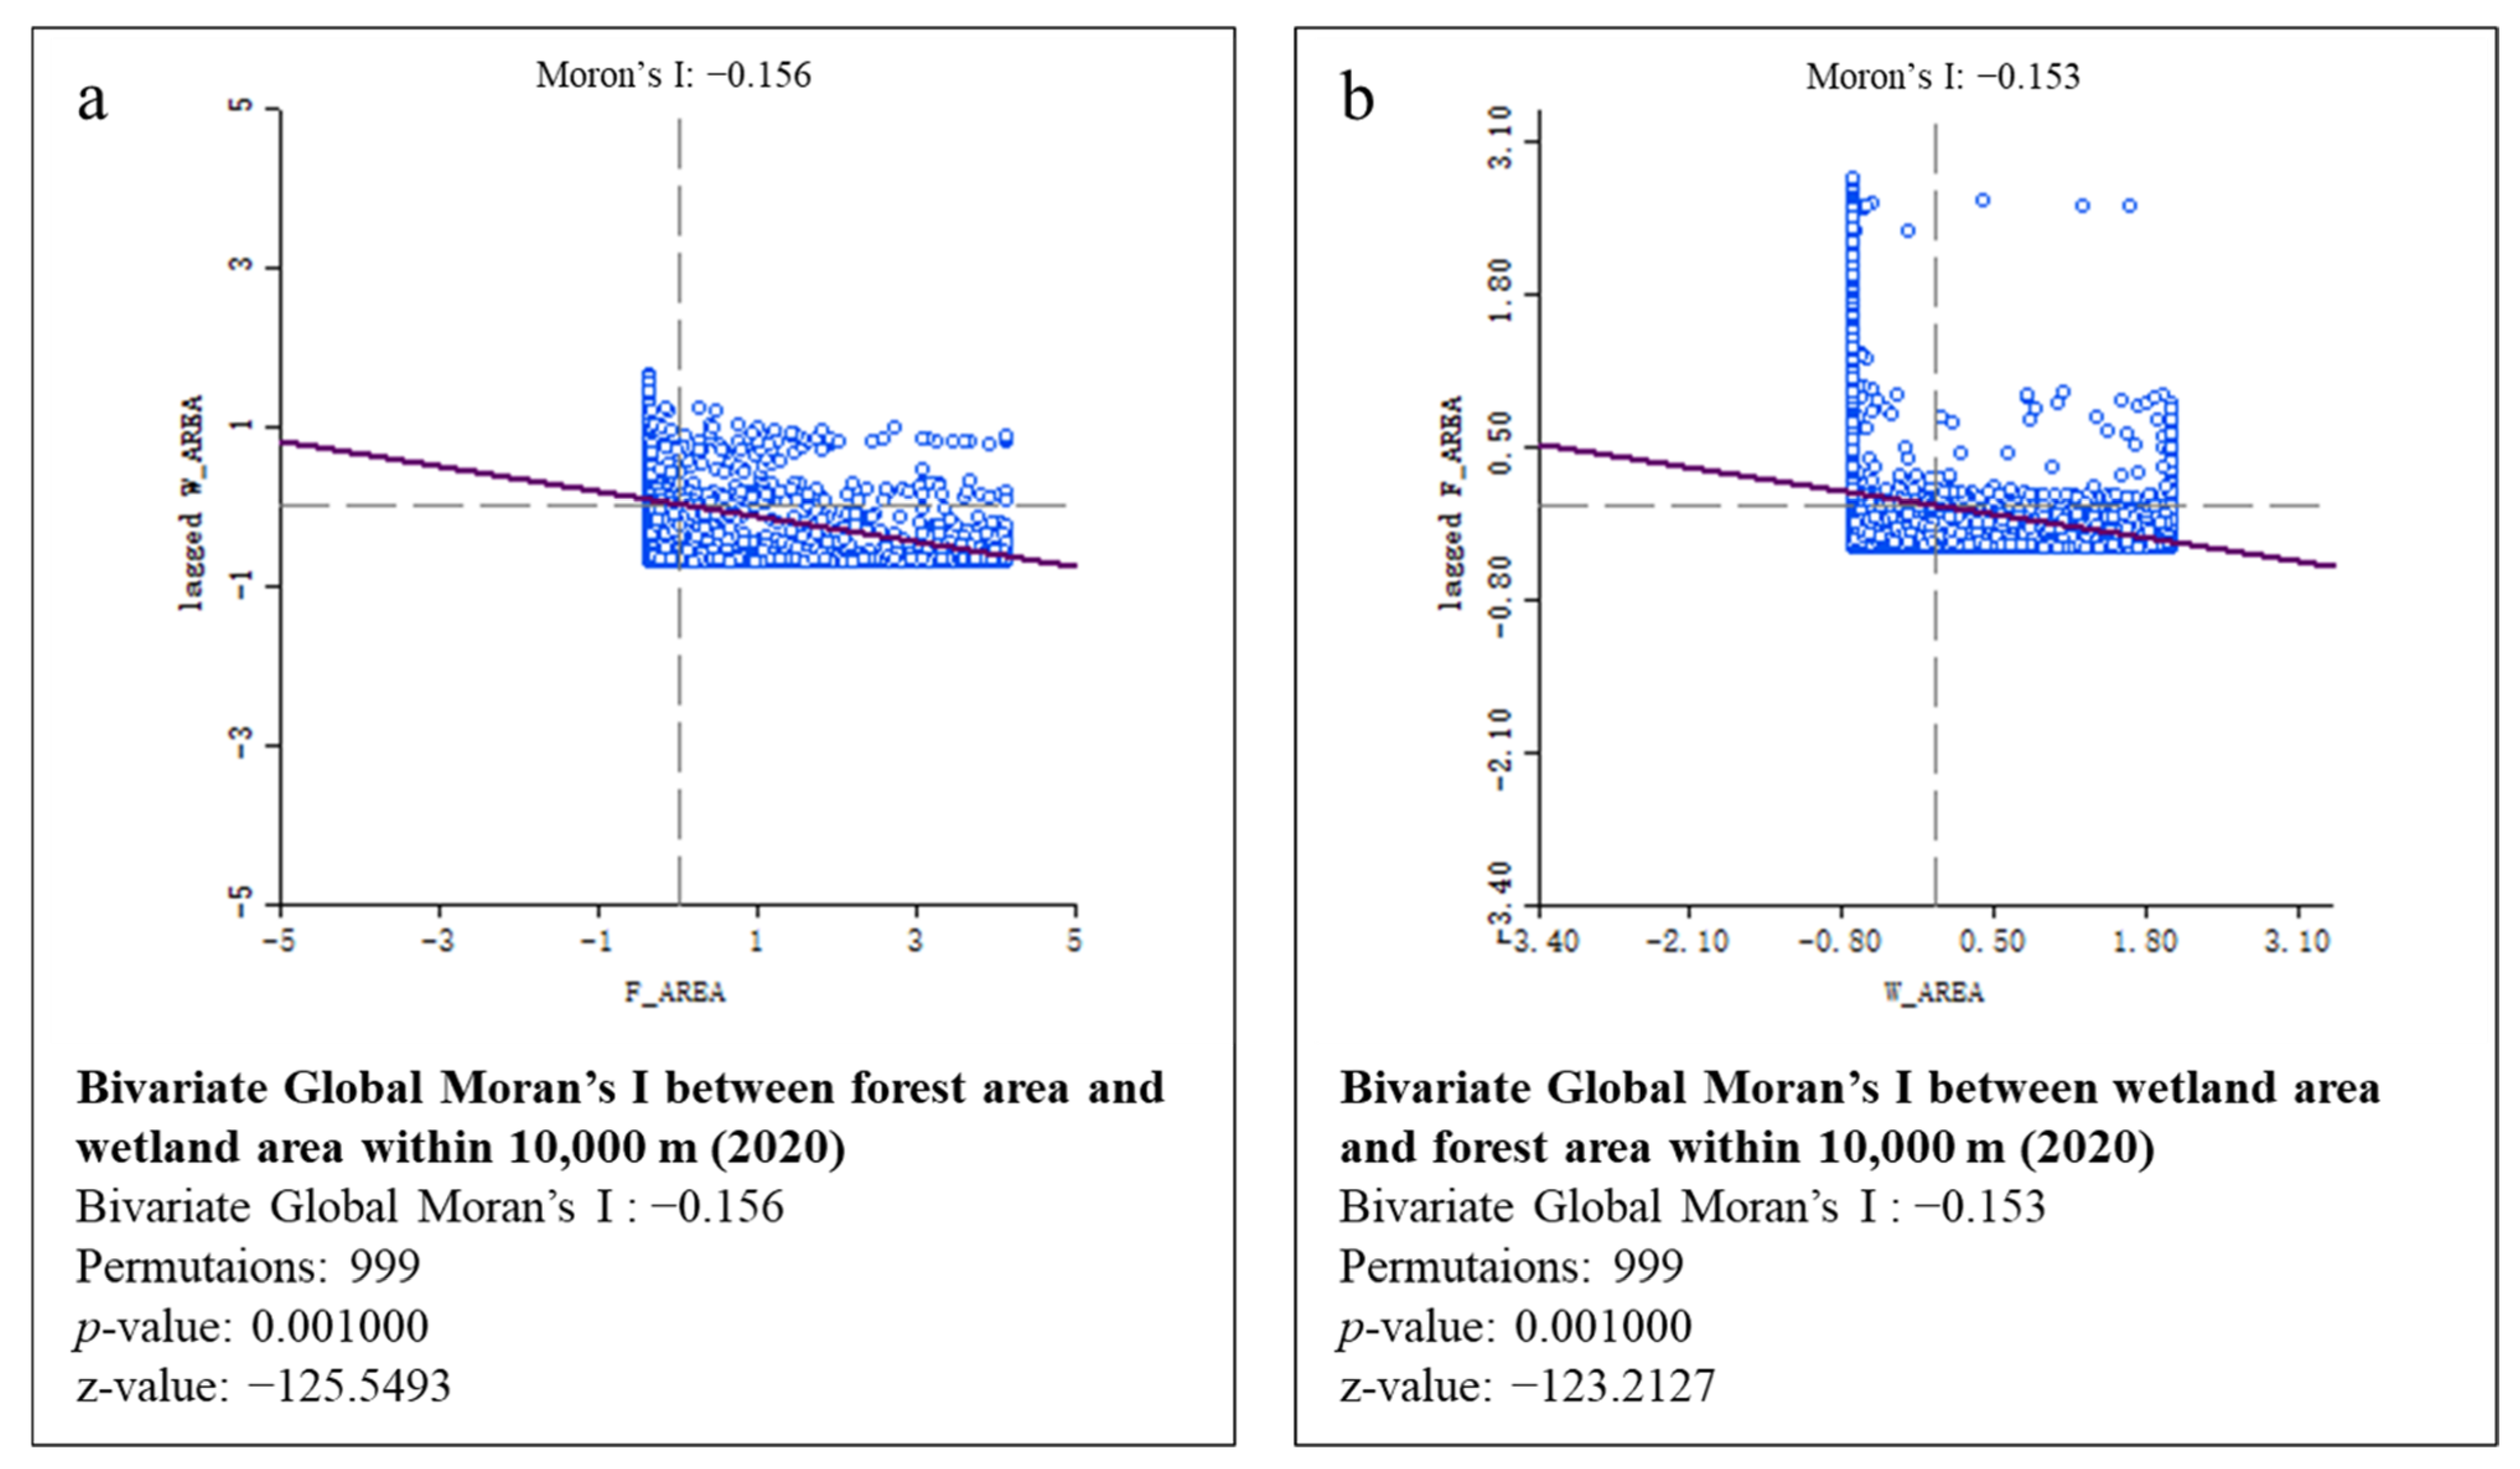
3.3. Macro Spatial Autocorrelation between Forests and Wetlands of Tianjin
3.3.1. Bivariate Global Moran’s I
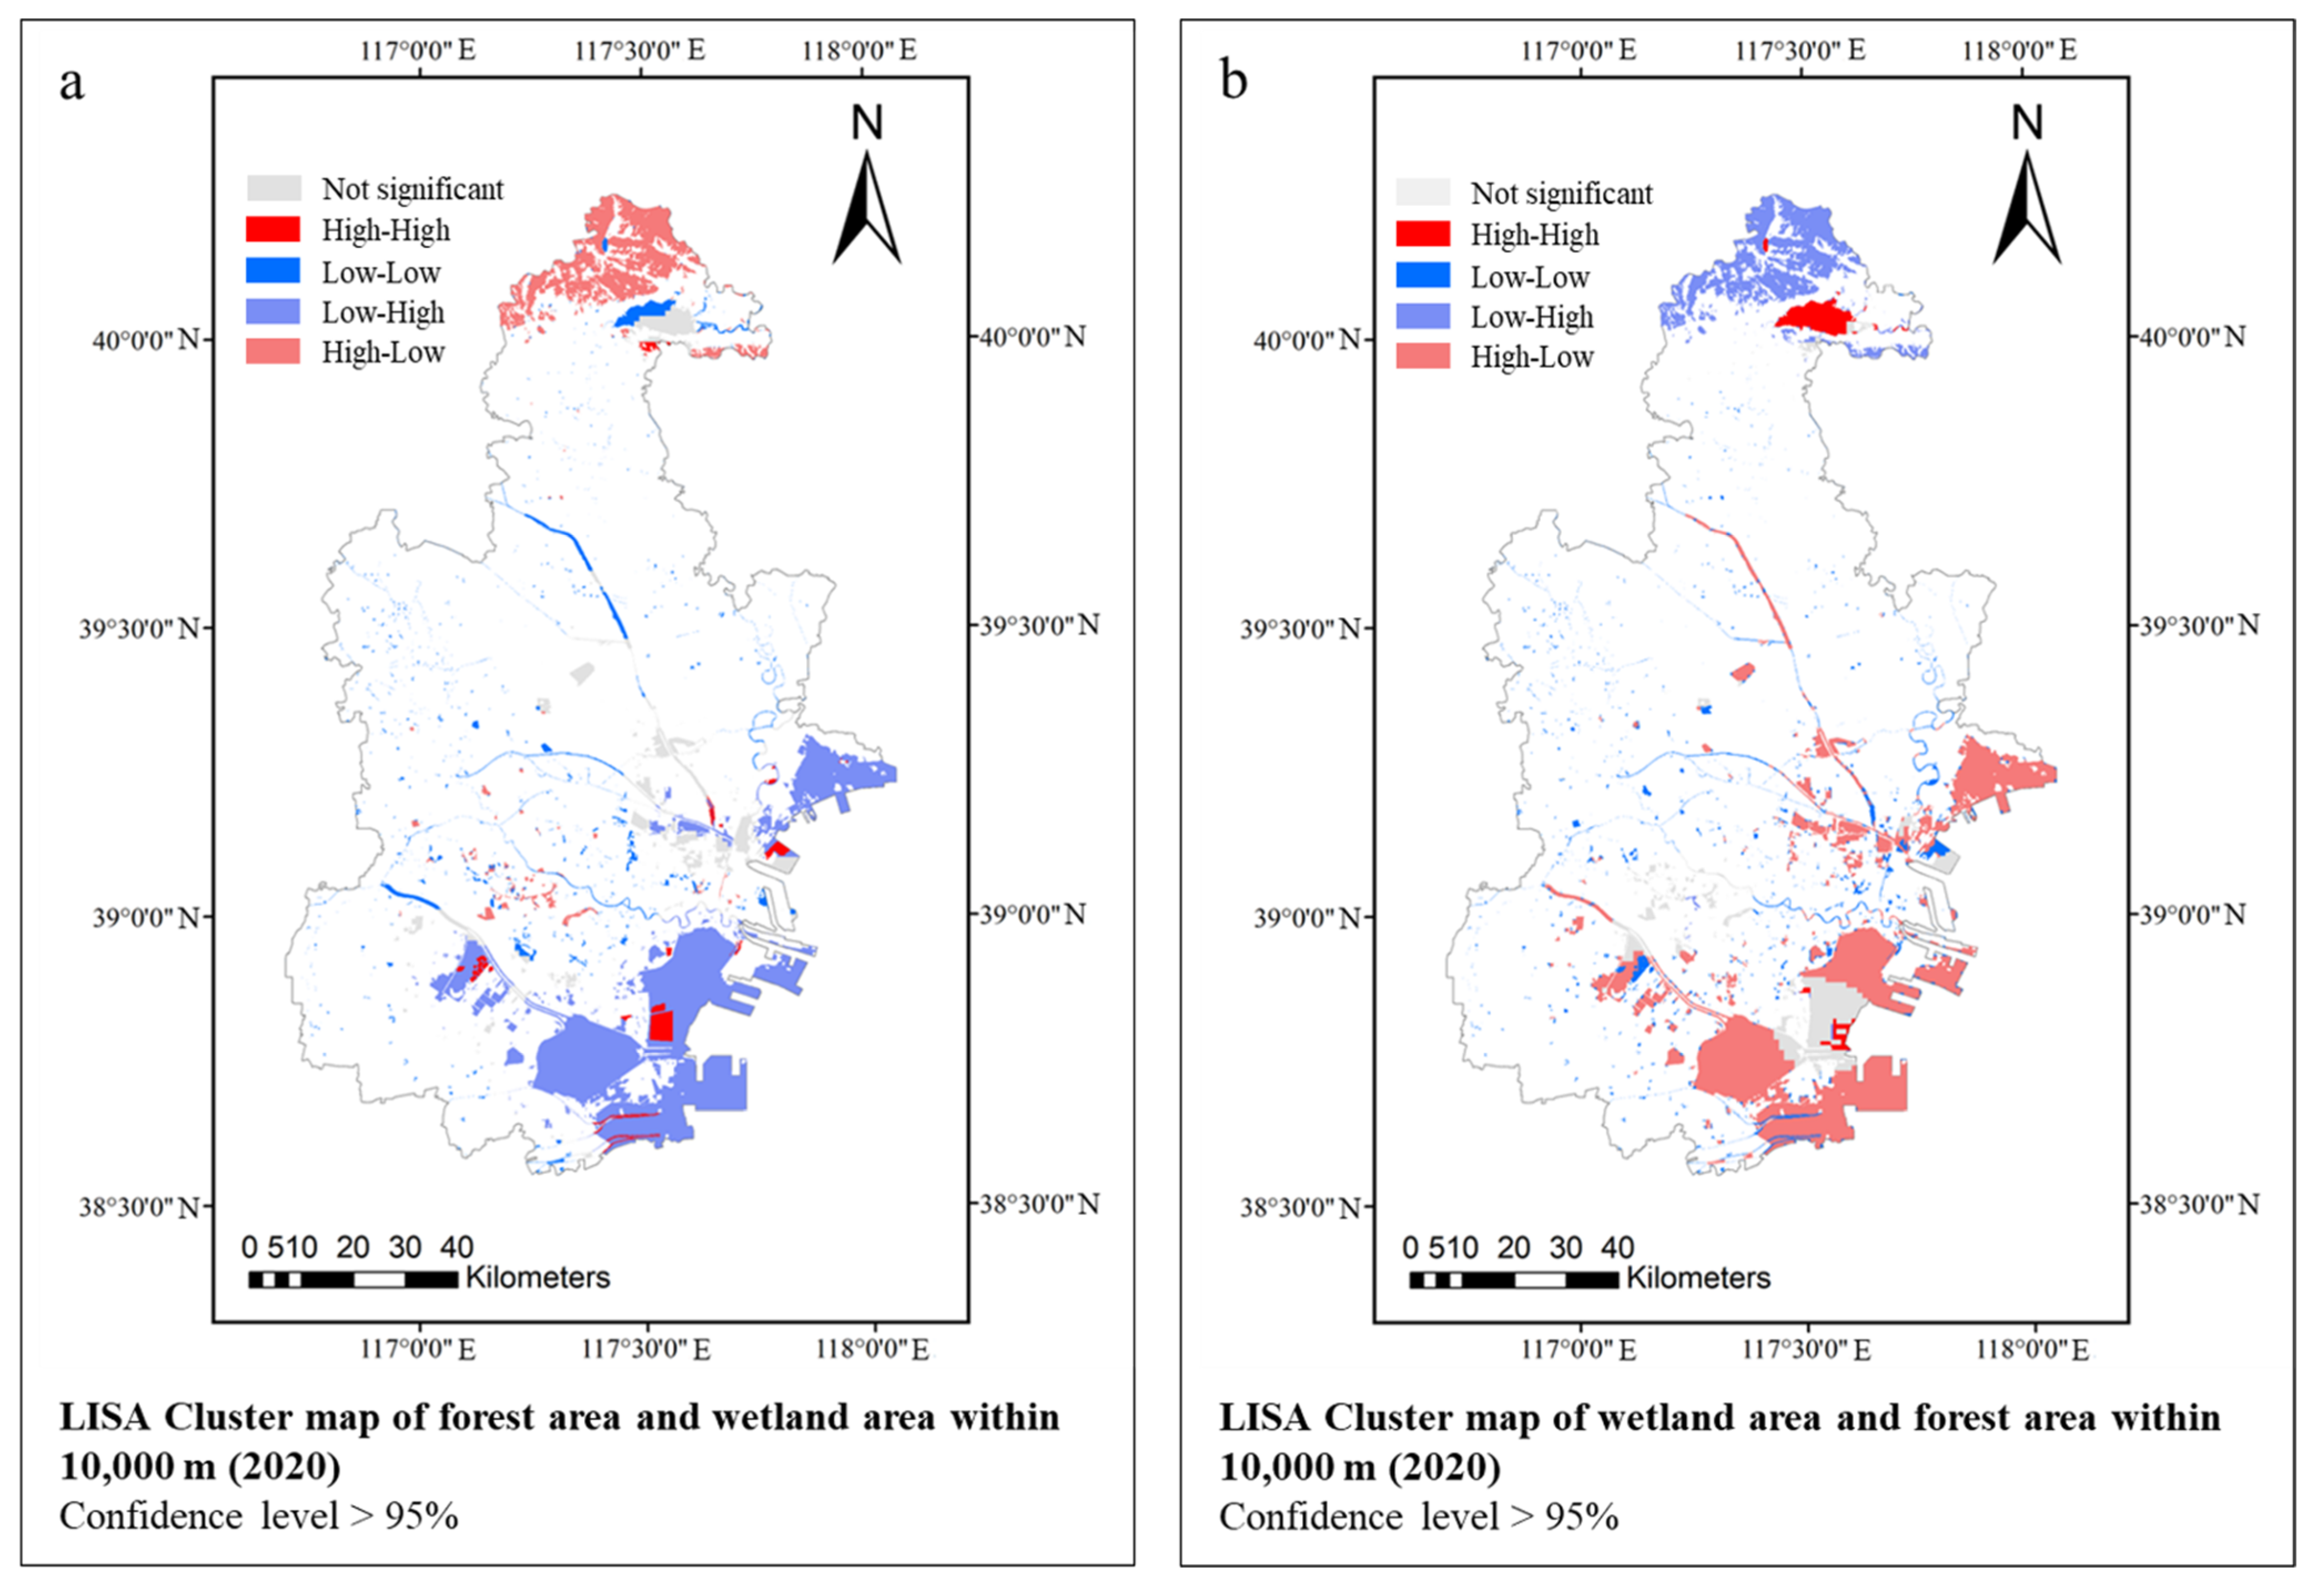
3.3.2. Bivariate Local Moran’s I
3.4. Micro Spatial Autocorrelation between Forest and Wetland at Different Distance
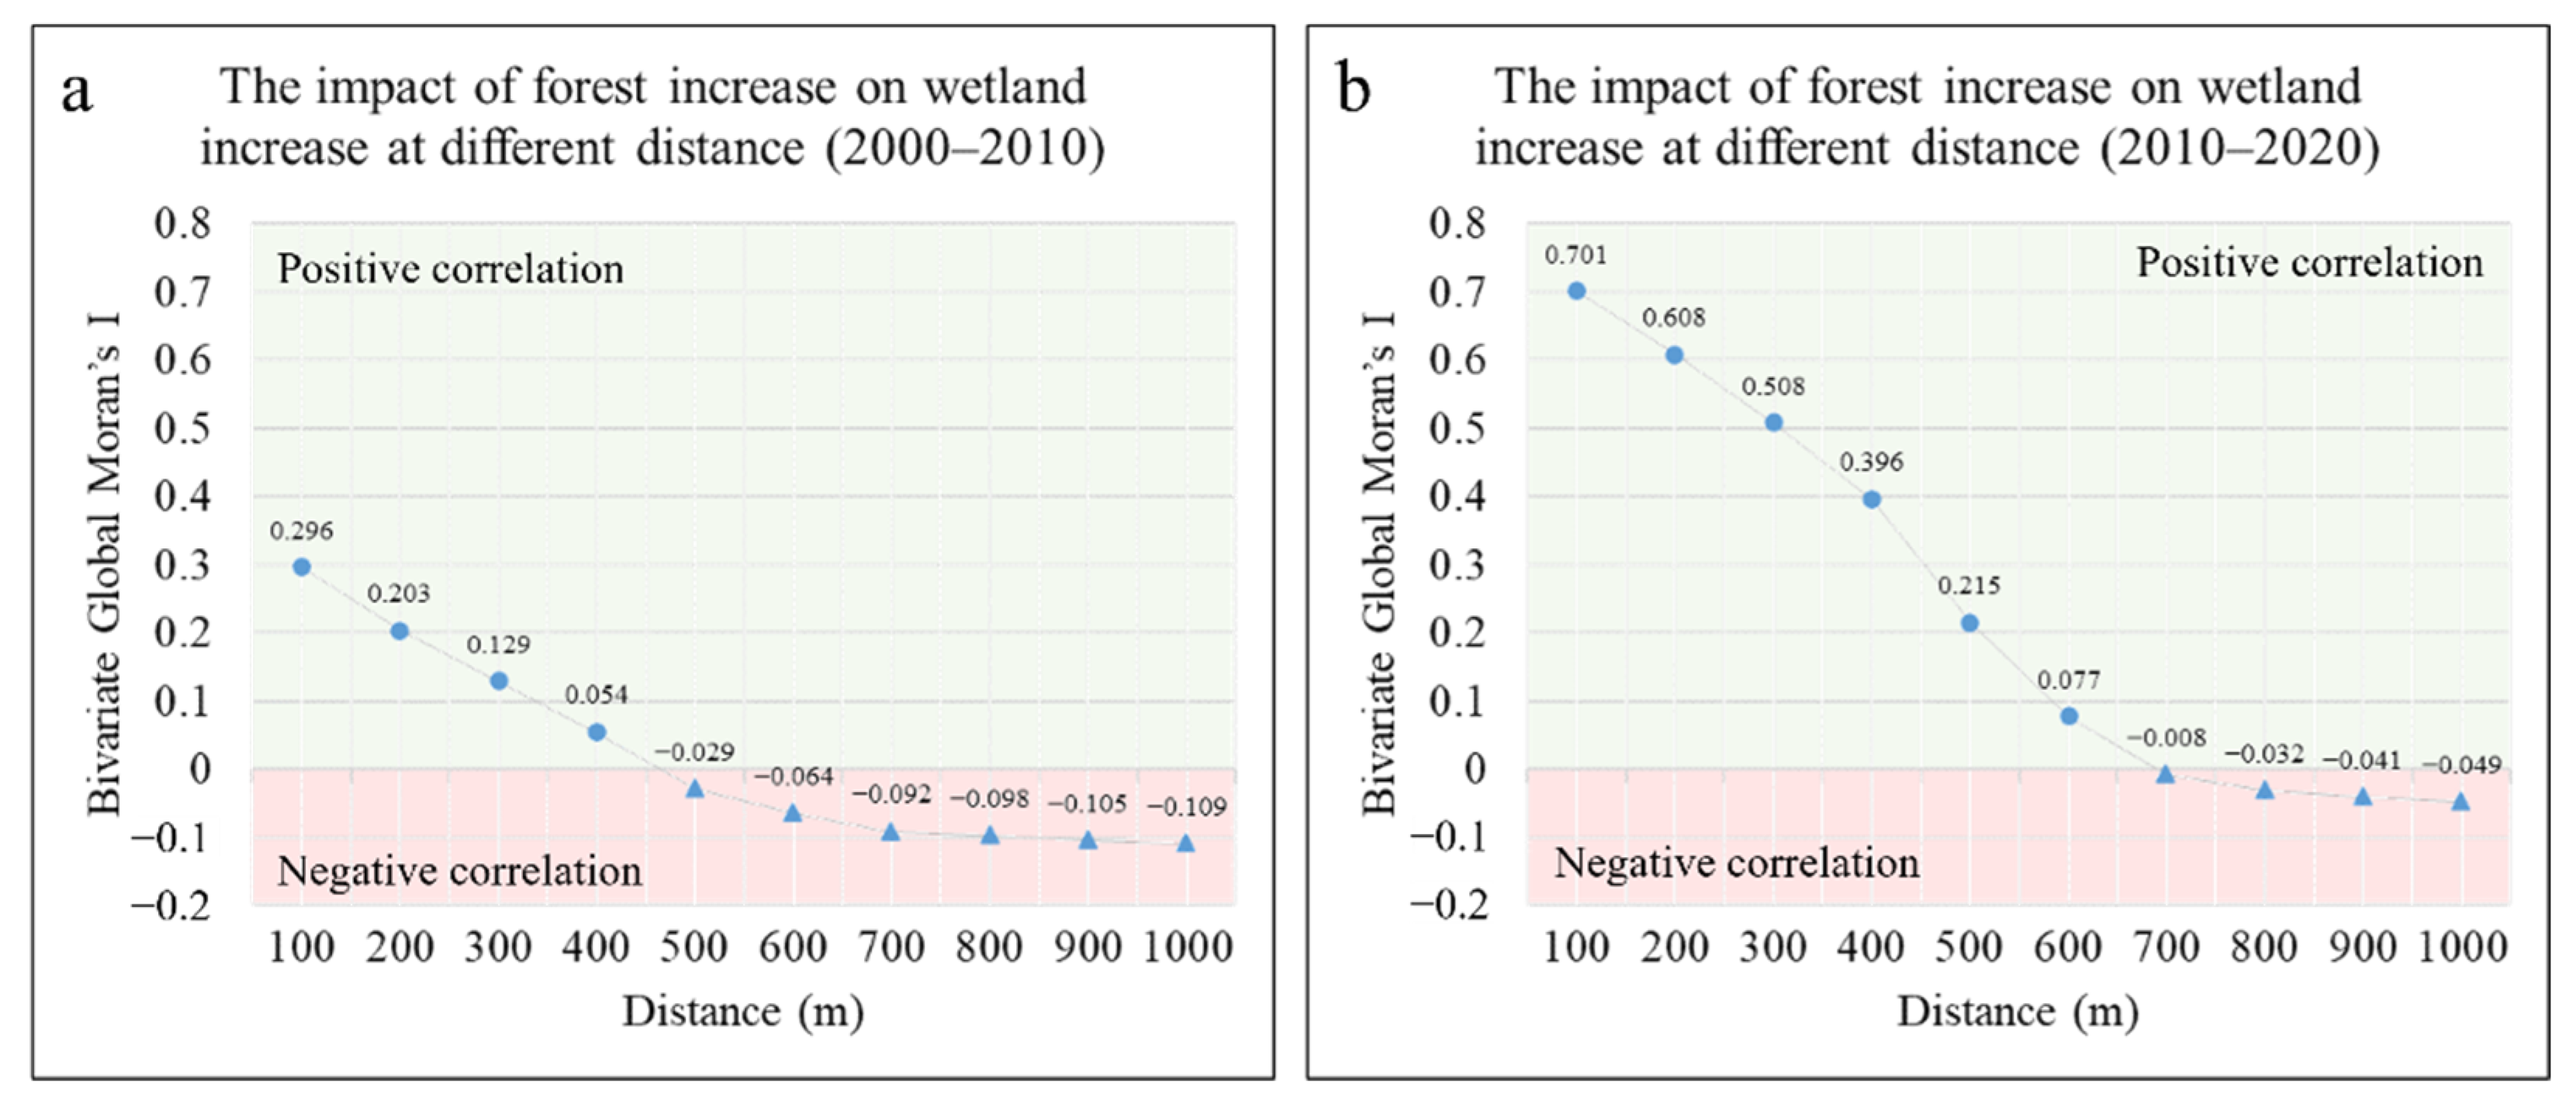
3.4.1. Impact of Forest Increase on Wetland Increase at Different Distances
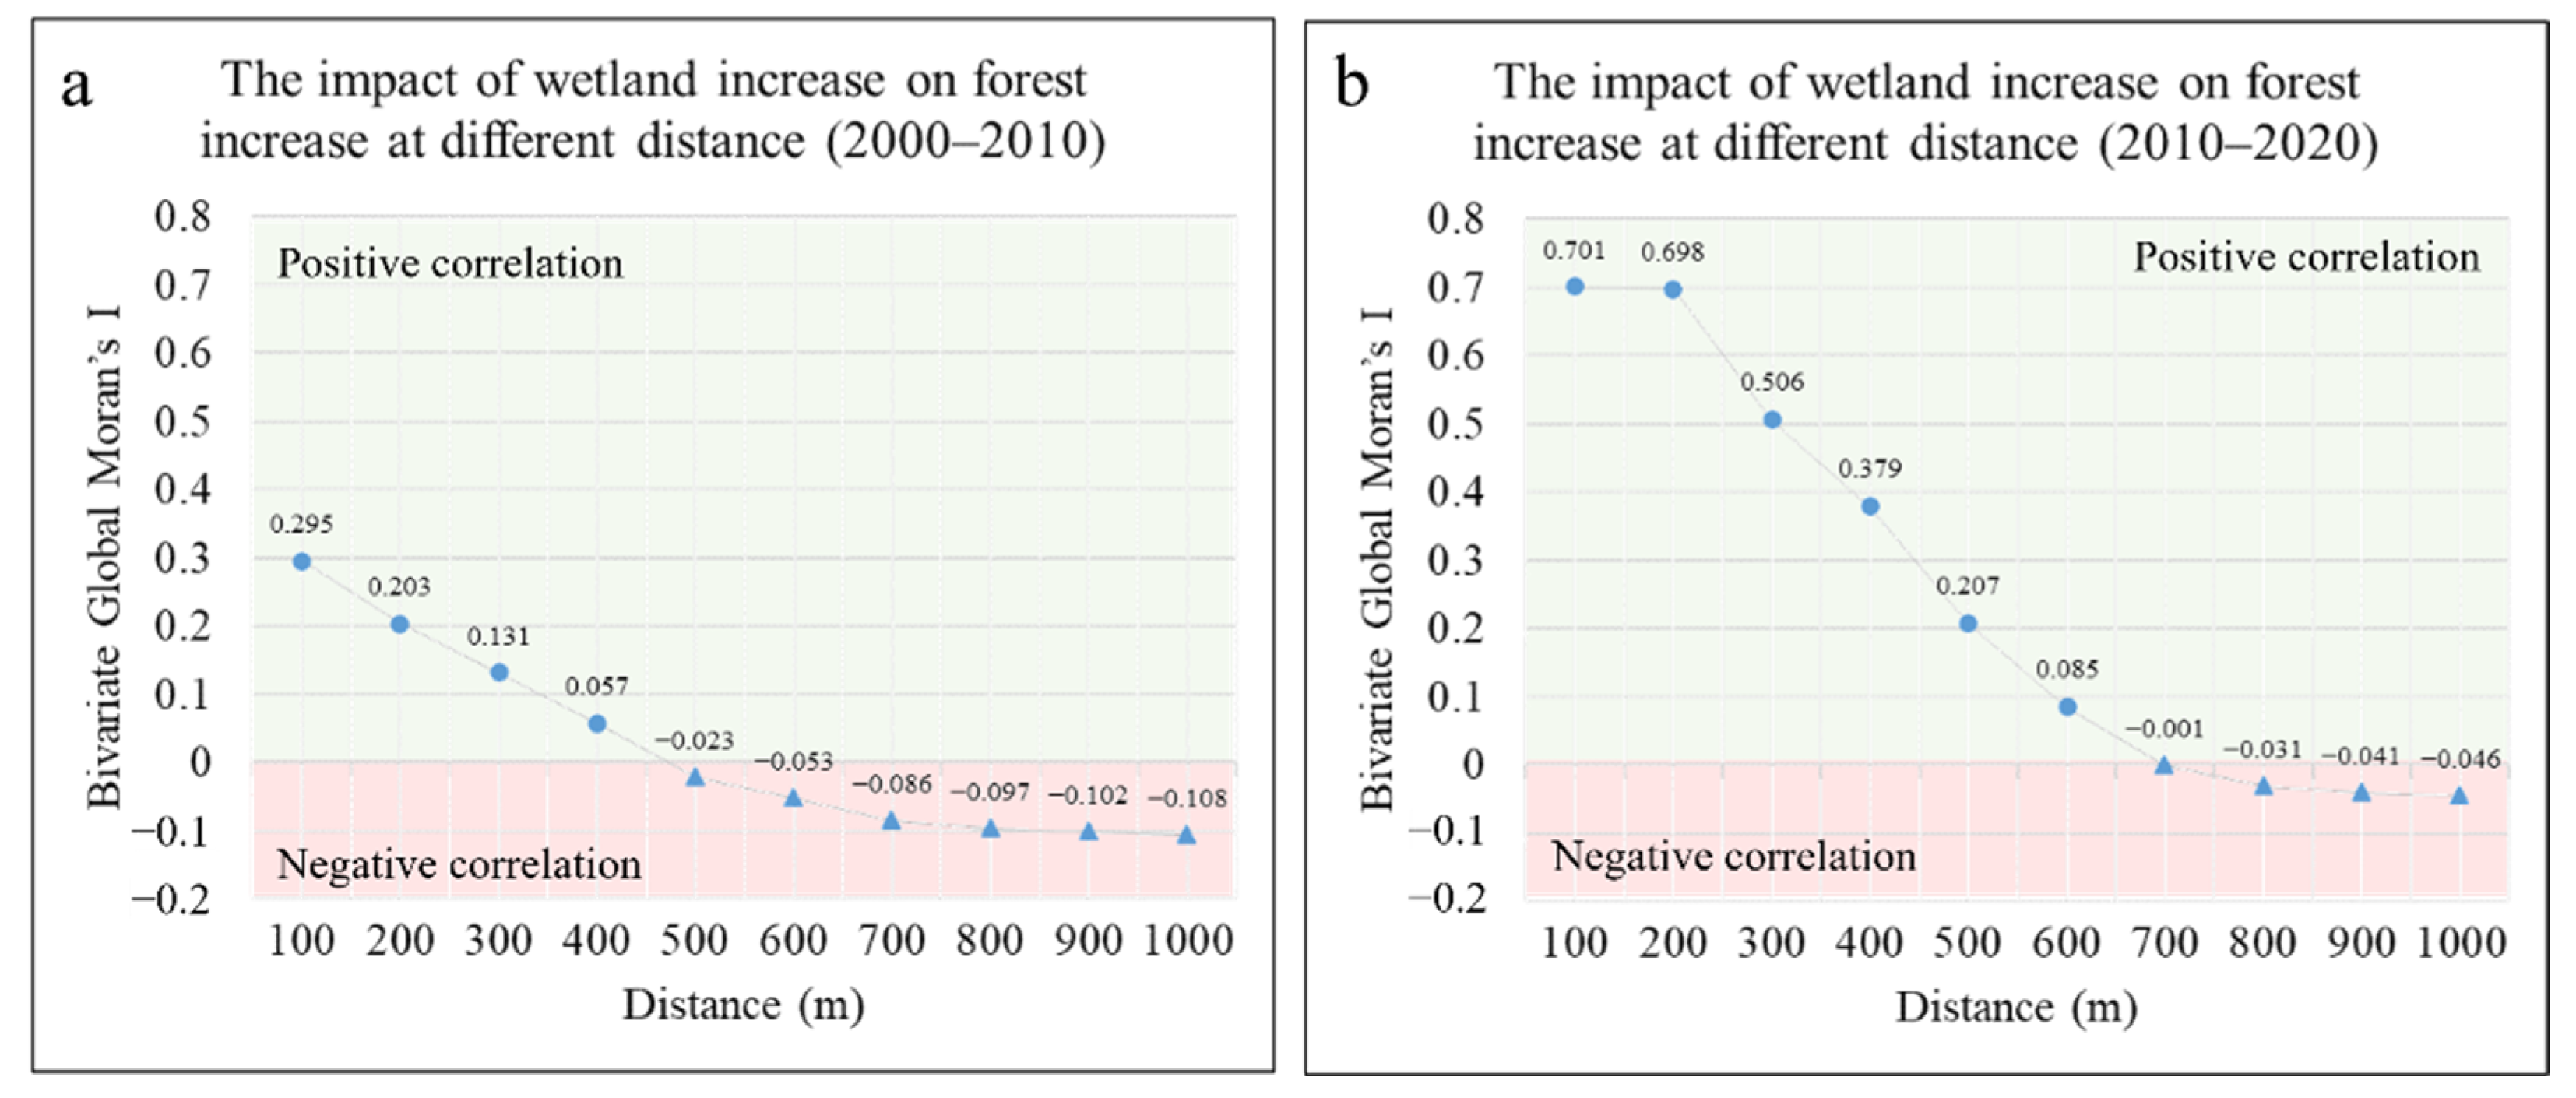
3.4.2. Impact of Wetland Increase on Forest Increase at Different Distance
3.4.3. Synergy and Potential Trade-Off between Forest and Wetland at Different Distance
3.5. Hydrological Analysis of Tianjin
4. Discussion
4.1. General Principles and Guidelines for Planning Strategy
4.1.1. General Principles
- Tackling challenges: To holistically address challenges tied to sustainable city development and to form a complete forest-wetland ecological network.
- Inspired by nature synergy: The strategy should follow the synergistic relationship between forests and wetlands, to ensure that they efficiently promote each other.
- Providing multiple benefits: The new forest/wetland is not only meant to serve as an ecological substrate for the city, but as a public feature that provides socioeconomic benefits to the general population.
- Effectiveness and efficiency: To avoid potential trade-offs between forests and wetlands, the effect of grey infrastructure should be considered in an integrated manner. The synergy of “Blue-Green-Grey” facilities enhances NbS performance.
4.1.2. General Guidelines
- An increase in the number and area of forests. To promote the construction of forest cities, including building urban forest parks, forested areas around cities, and protective forest belts; overall, to increase the number of forest patches. These forest patches would act as stepping stones to improve north–south forest connectivity. Protective forest belts should be preserved in mountains, waterways, and roads to form ecological corridors and serve as a “green-blue ecological corridor” for biological circulation and ecological connectivity [31].
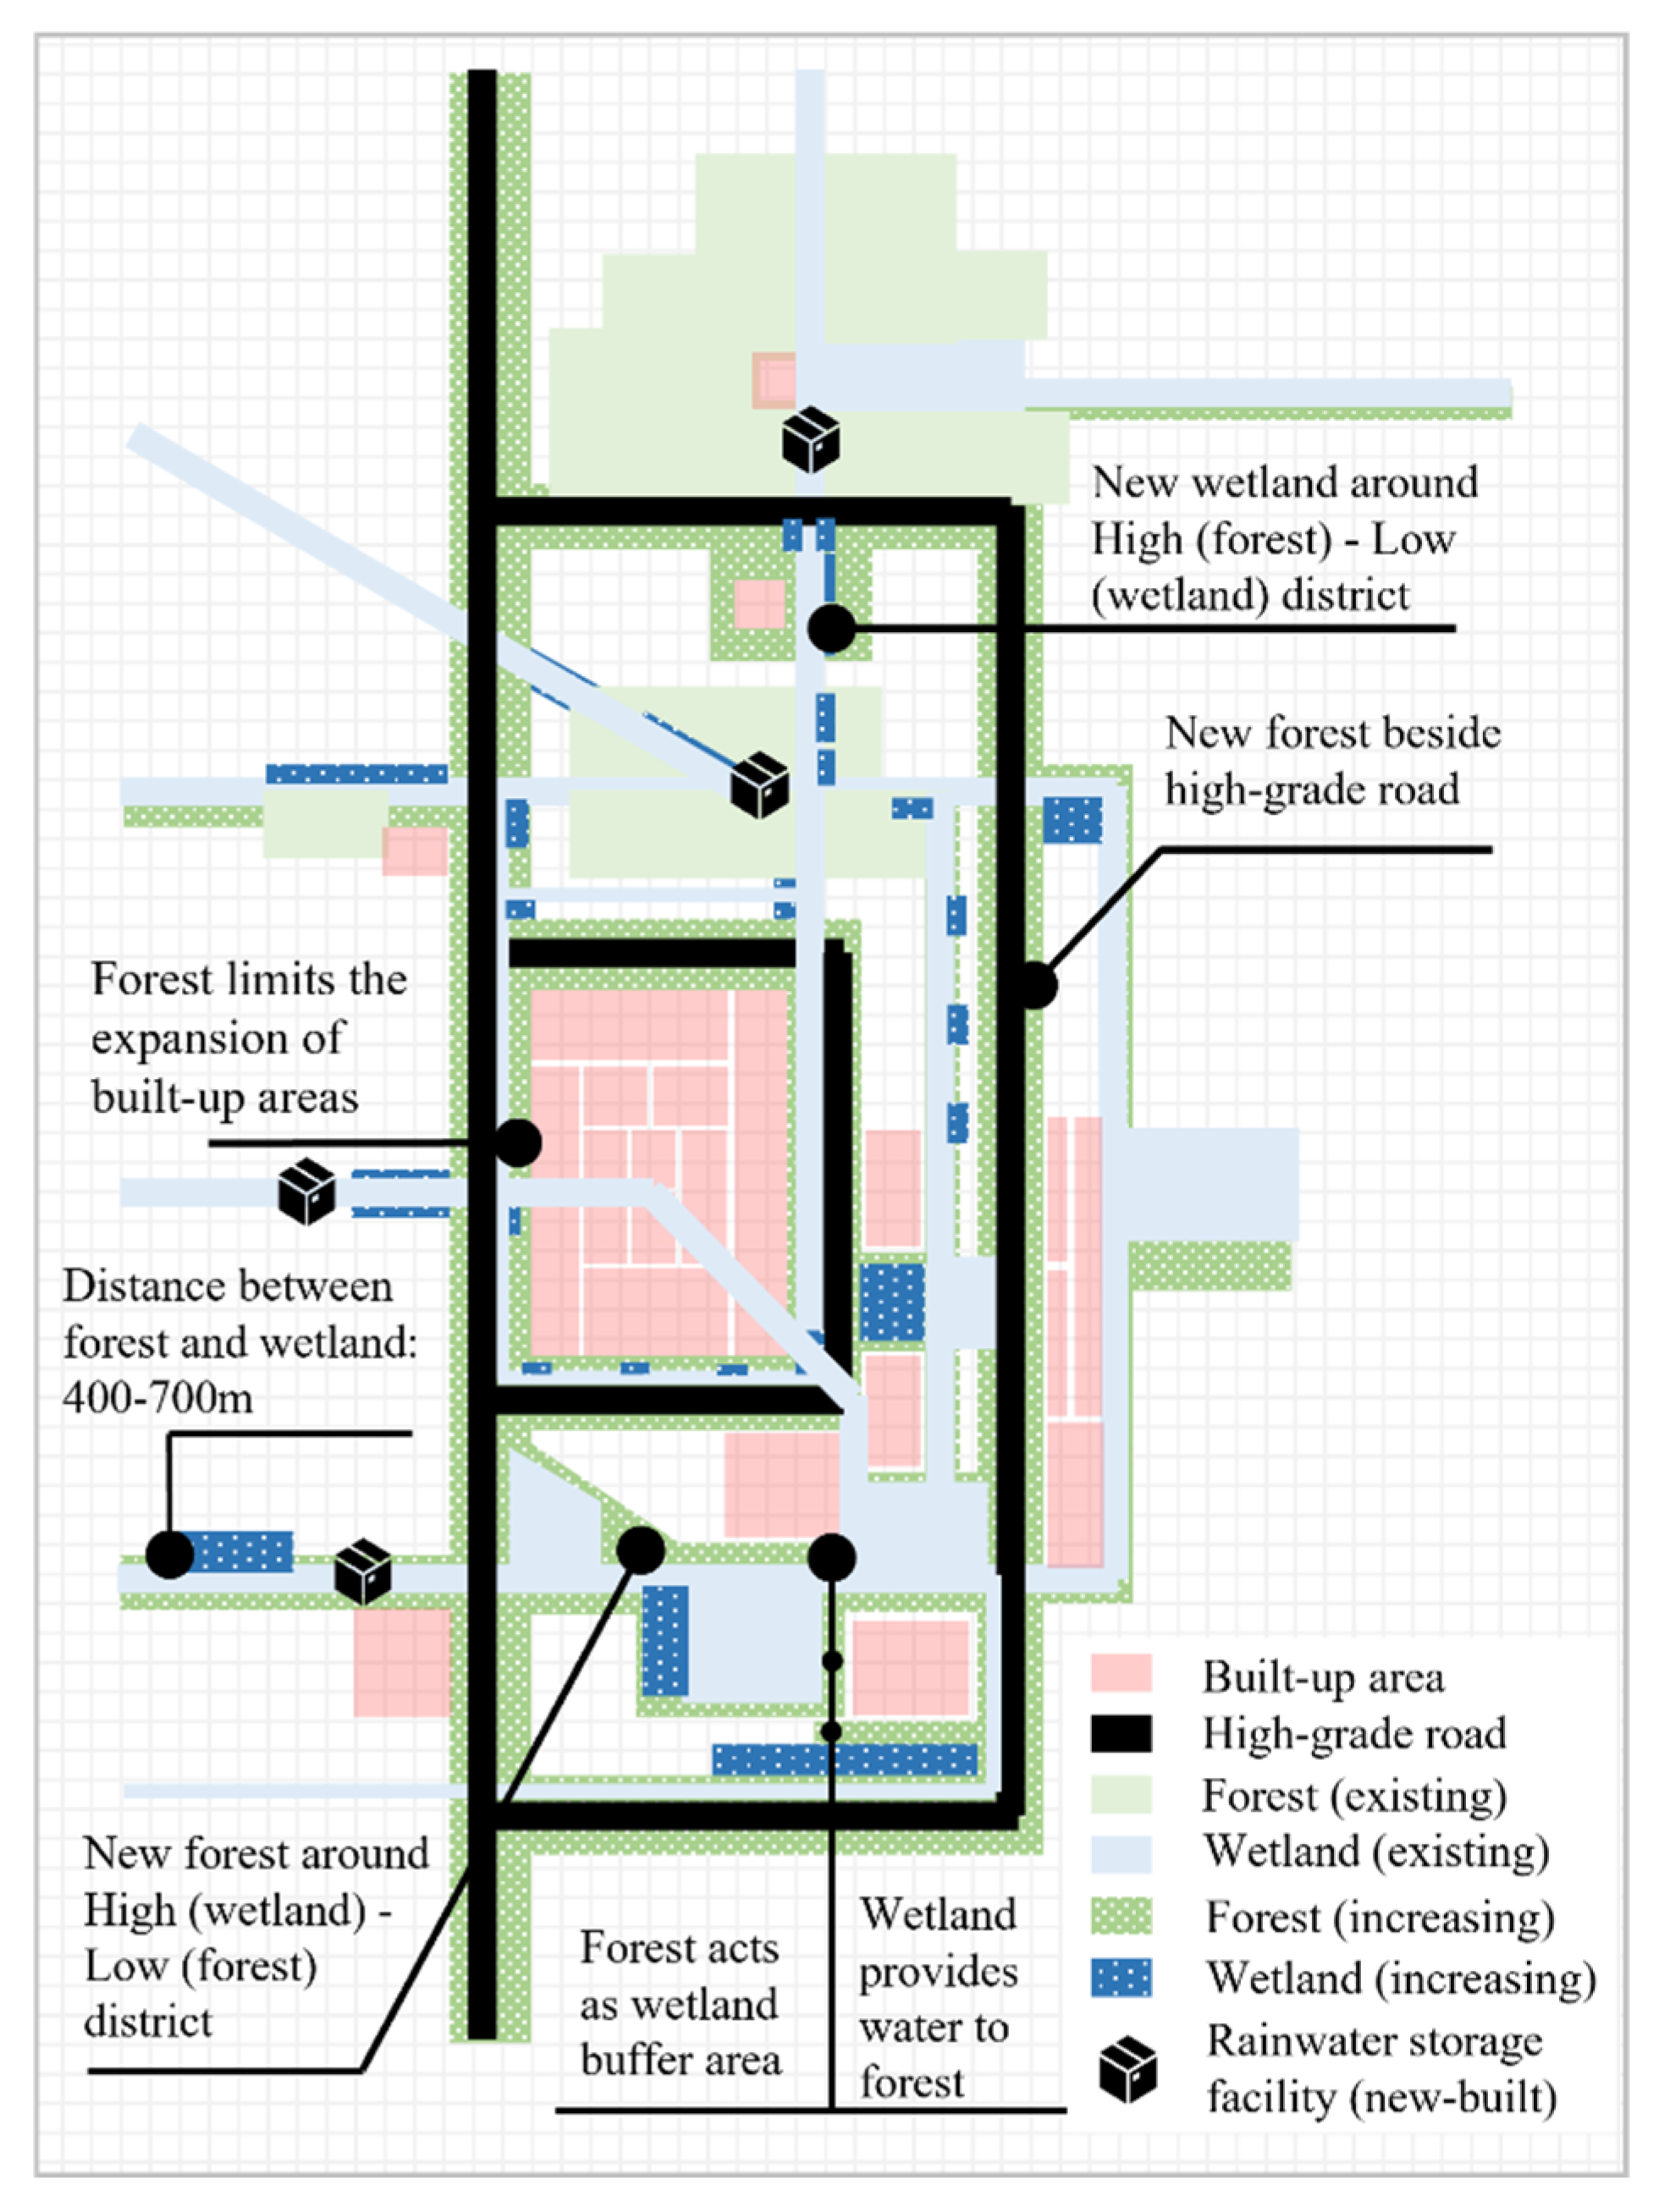
- On the one hand, the number and area of wetlands should be increased, and on the other hand, sufficient space and basic conditions for wetland development should be set aside. Increasing the number of wetland patches should be based on current water systems. Combined with forest construction, forests should be used as an ecological buffer for wetlands to guarantee the conservation and restoration of wetland ecosystems, which could protect and enhance water quality [32]. The optimal distance between the forest and wetland should not be more than 400 m.
- Promoting the synergistic benefits of forests and wetlands by leveraging their positive spatial correlation. It is recommended that newly created forests be located adjacent to wetlands and vice versa. In some cases, the distance can be adjusted appropriately, but it should not exceed 700 m. Based on this proximity, forests and wetlands can be integrated to build Tianjin’s blue–green ecological network.
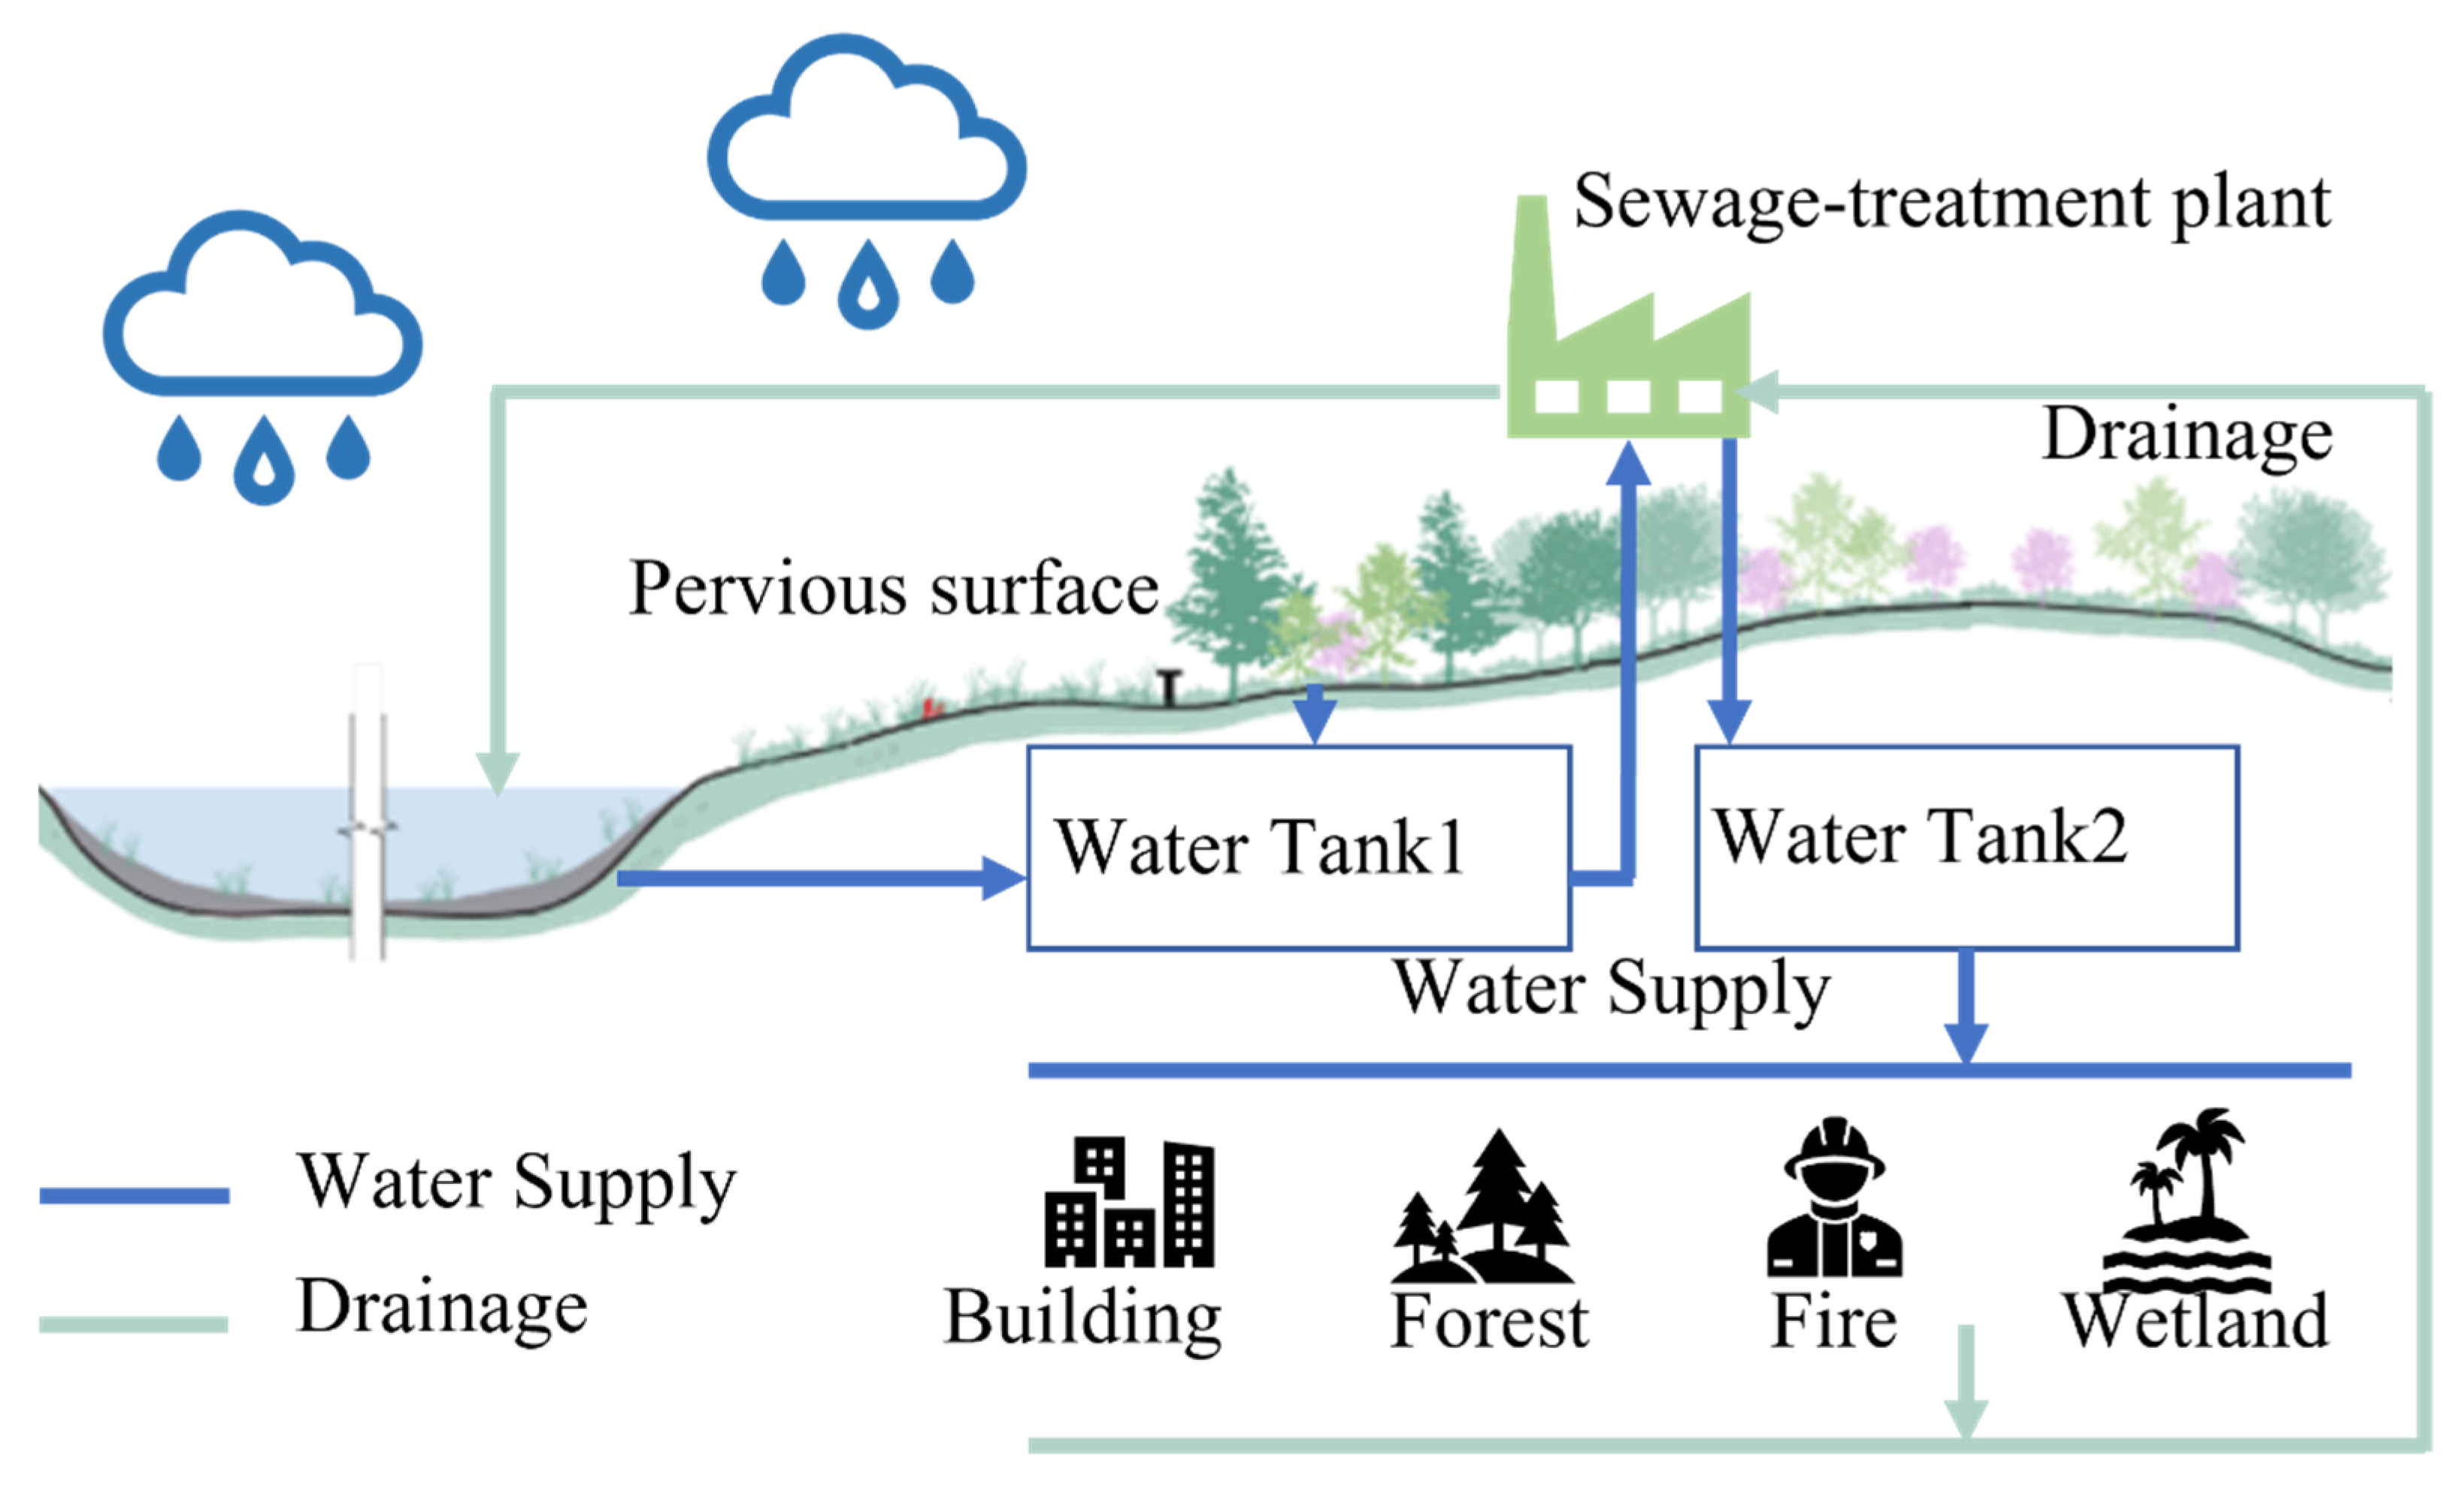
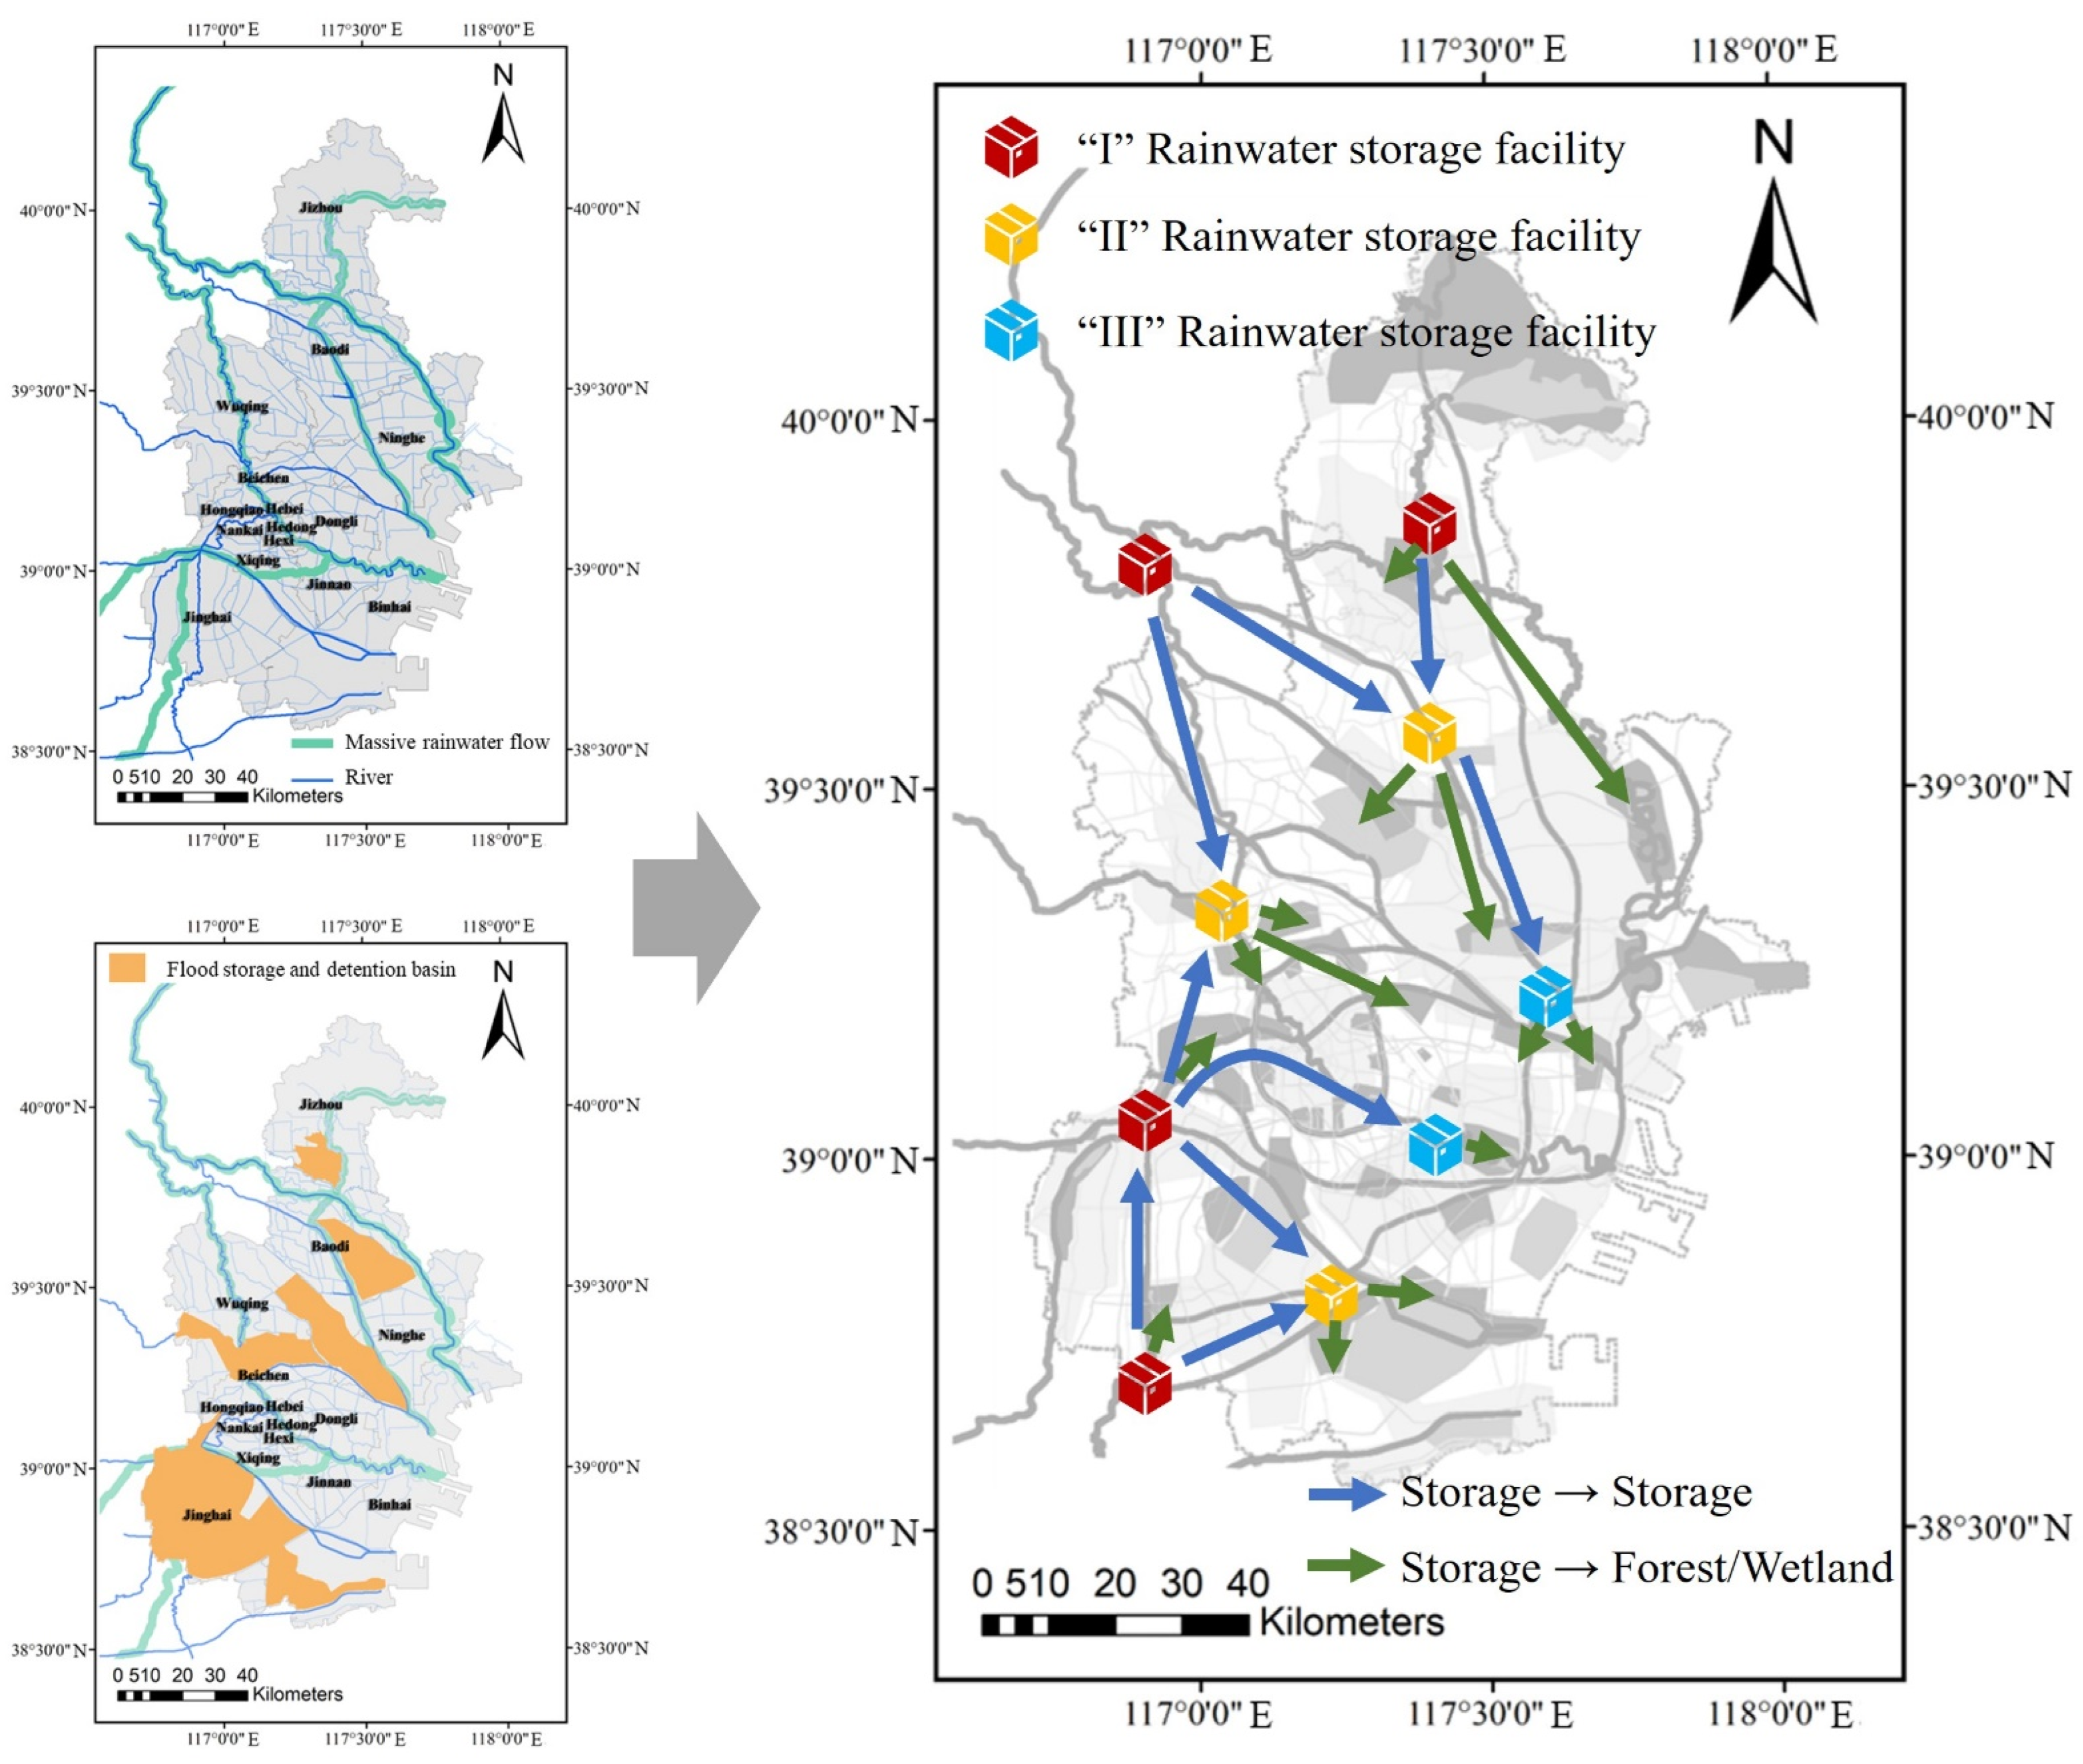
- Based on the hydrological analysis and distribution of flood storage areas, new rainwater harvesting measures were proposed. In combination with the “Forest–Wetland” spatial planning strategy, rainwater should be harvested during periods of abundance to reduce the impacts of urban flooding [33]. Accordingly, rivers should be recharged during periods of water shortage to ensure that the ecological environment uses water for natural restoration.
4.2. “Forest-Wetland” Spatial Planning Strategies Inspired by Nature Synergy
4.2.1. Forest-Wetland Ecological Network
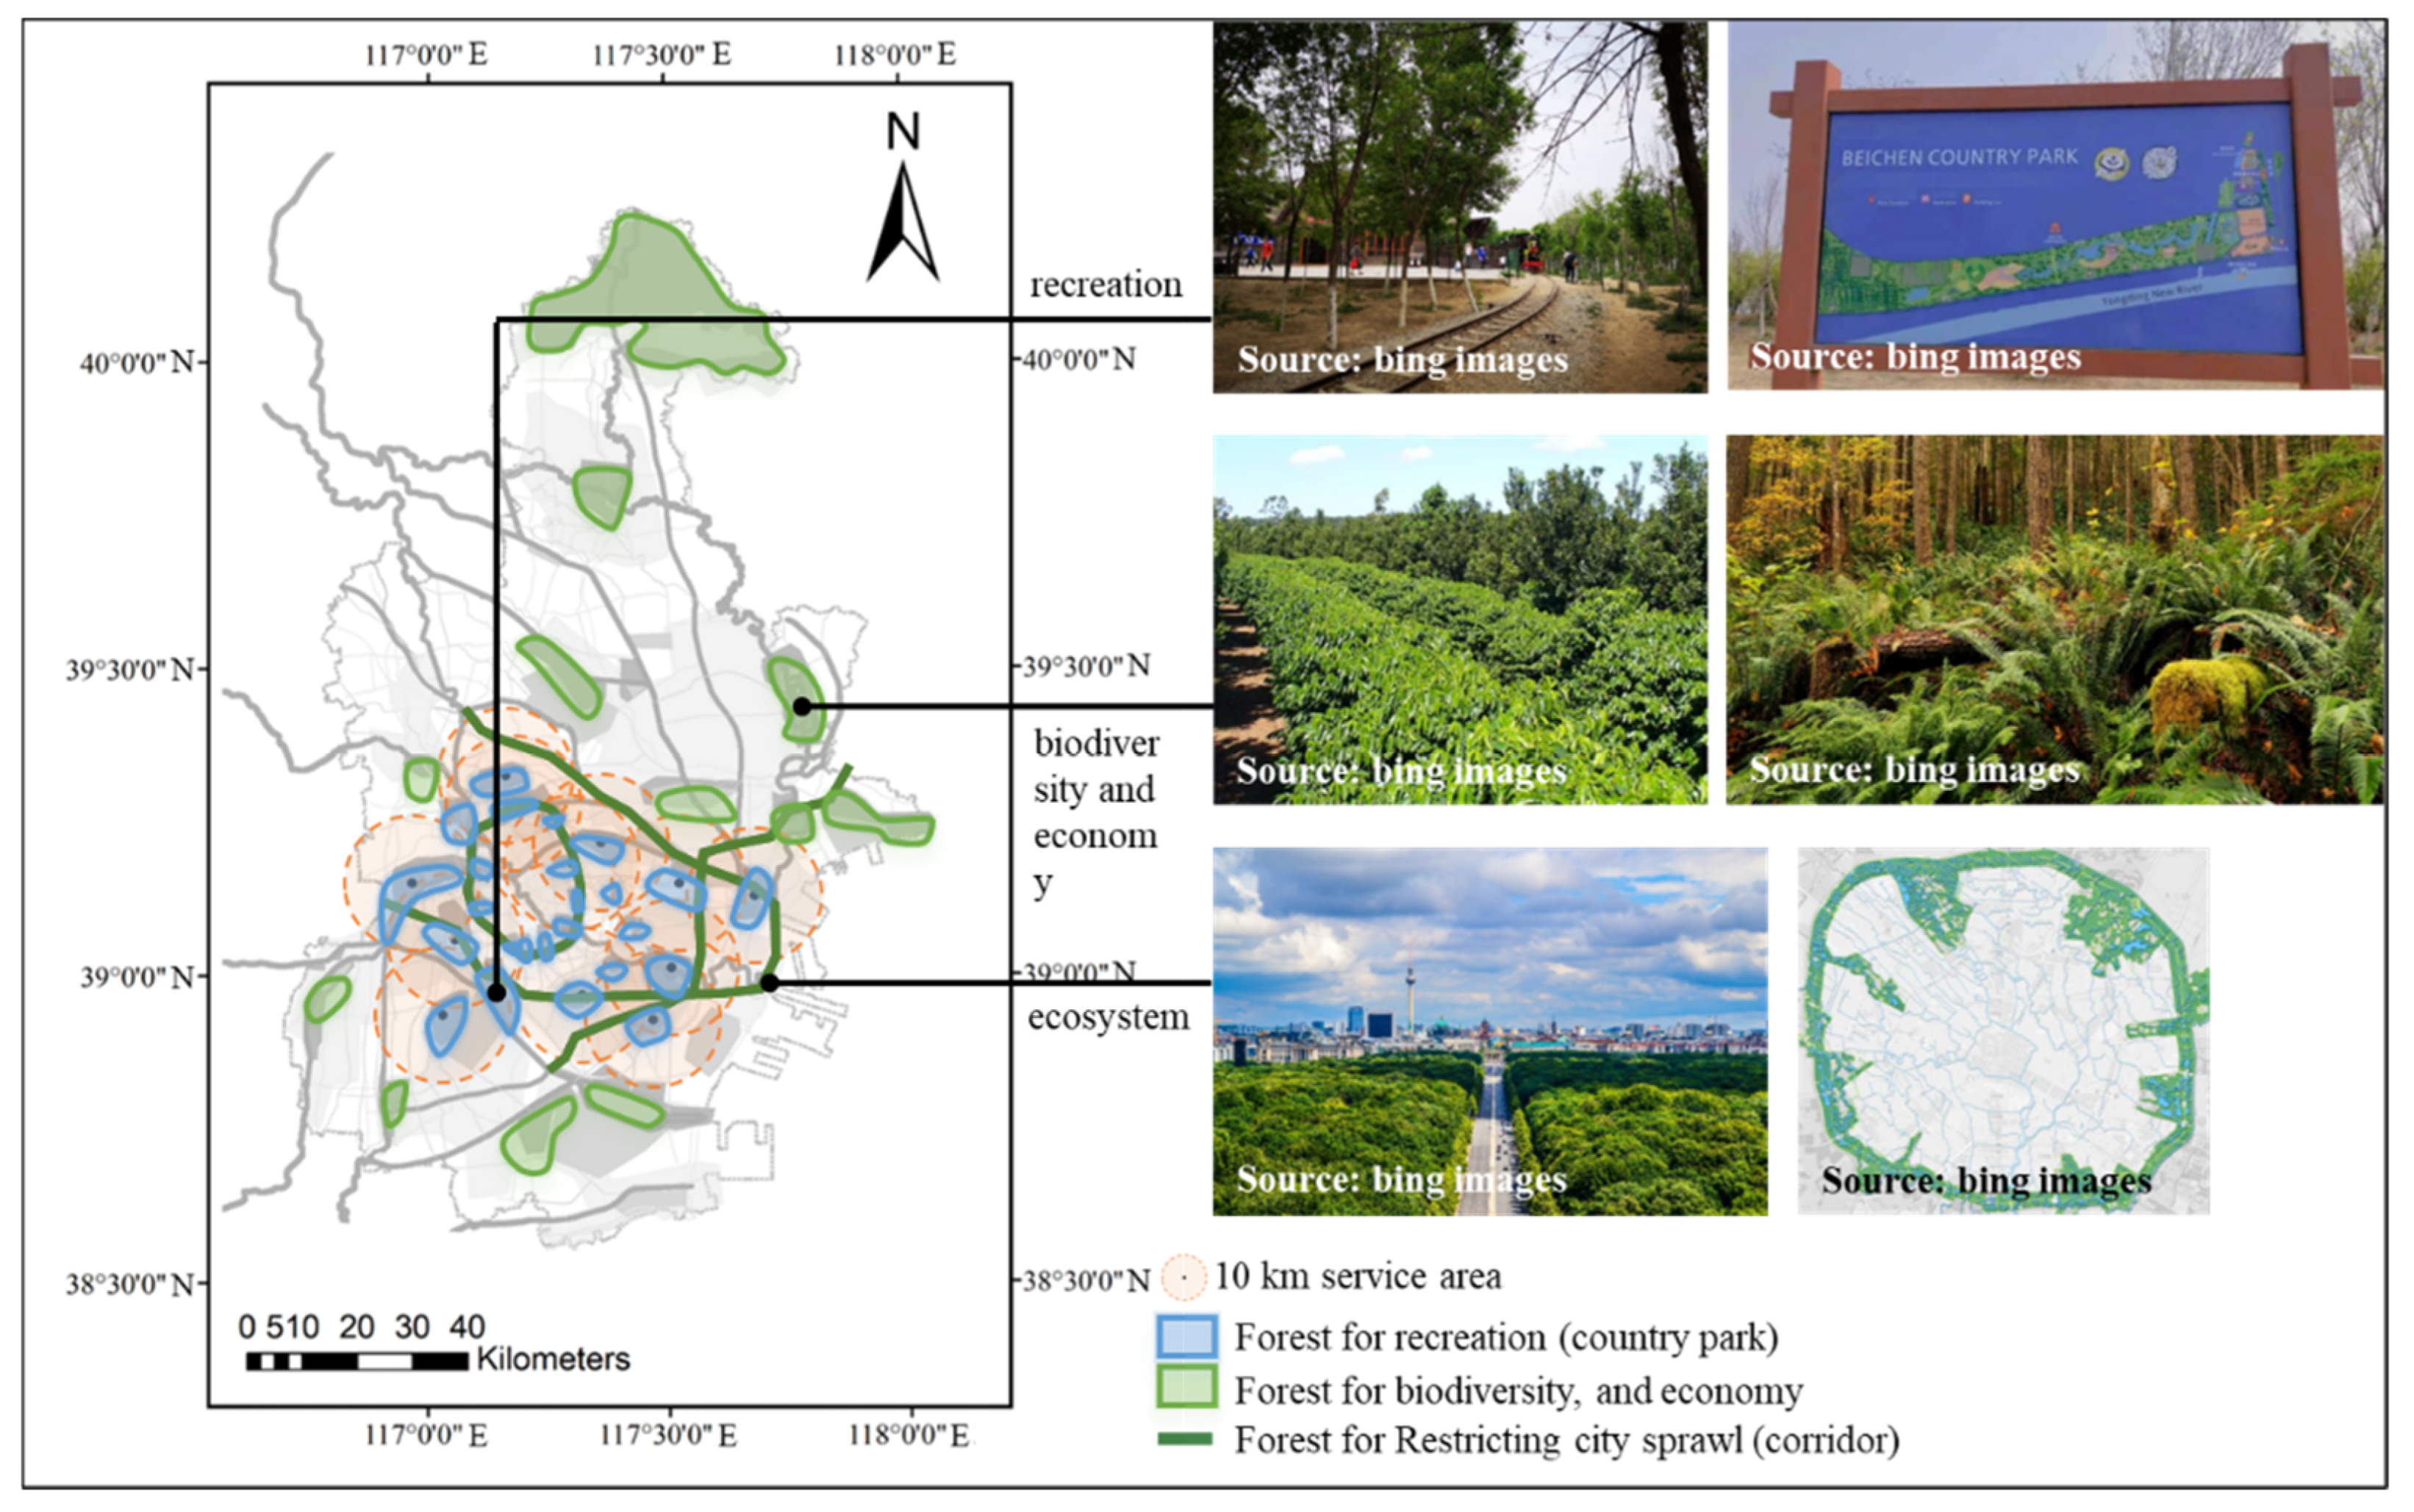
4.2.2. Functions of Recreation, Biodiversity, and Economy
4.3. Grey Infrastructure to Reduce Potential Trade-Off between Forest and Wetland
5. Conclusions
Author Contributions
Funding
Institutional Review Board Statement
Informed Consent Statement
Data Availability Statement
Conflicts of Interest
References
- Acosta, F.; Haroon, S. Memorial Parking Trees: Resilient Modular Design with Nature-Based Solutions in Vulnerable Urban Areas. Land 2021, 10, 298. [Google Scholar] [CrossRef]
- Cohen-Shacham, E.; Walters, G.; Janzen, C.; Maginnis, S. Nature-Based Solutions to Address Global Societal Challenges; IUCN: Gland, Switzerland, 2016; Volume 97, pp. 2016–2036. [Google Scholar]
- Benyus, J.M. Biomimicry: Innovation Inspired by Nature; Harper Perennial: New York, NY, USA, 1997; p. 320. [Google Scholar]
- MacKinnon, K.; Sobrevila, C.; Hickey, V. Biodiversity, Climate Change, and Adaptation: Nature-Based Solutions from the World Bank Portfolio; World Bank: Washington, DC, USA, 2008. [Google Scholar]
- Dumitru, A.; Wendling, L. Evaluating the Impact of Nature-Based Solutions: A Handbook for Practitioners; European Commission: Brussels, Belgium, 2021. [Google Scholar]
- Sowińska-Świerkosz, B.; Garcia, J. What are Nature-based solutions (NBS)? Setting core ideas for concept clarification. Nat.-Based Solut. 2022, 2, 100009. [Google Scholar] [CrossRef]
- Ma, S.; Wang, H.Y.; Zhang, X.; Wang, L.J.; Jiang, J. A nature-based solution in forest management to improve ecosystem services and mitigate their trade-offs. J. Clean. Prod. 2022, 351, 131557. [Google Scholar] [CrossRef]
- Raymond, C.M.; Frantzeskaki, N.; Kabisch, N.; Berry, P.; Breil, M.; Nita, M.R.; Geneletti, D.; Calfapietra, C. A framework for assessing and implementing the co-benefits of nature-based solutions in urban areas. Environ. Sci. Policy 2017, 77, 15–24. [Google Scholar] [CrossRef]
- Lara, Á.; Moral, L.D. Nature-Based Solutions to Hydro-Climatic Risks: Barriers and Triggers for Their Implementation in Seville (Spain). Land 2022, 11, 868. [Google Scholar] [CrossRef]
- Marando, F.; Heris, M.P.; Zulian, G.; Udías, A.; Mentaschi, L.; Chrysoulakis, N.; Parastatidis, D.; Maes, J. Urban heat island mitigation by green infrastructure in European Functional Urban Areas. Sustain. Cities Soc. 2022, 77, 103564. [Google Scholar] [CrossRef]
- Jin, L.; Yi, Y.; Xu, J. Forest carbon sequestration and China’s potential: The rise of a nature-based solution for climate change mitigation. China Econ. J. 2020, 13, 200–222. [Google Scholar] [CrossRef]
- Lallemant, D.; Hamel, P.; Balbi, M.; Lim, T.N.; Schmitt, R.; Win, S. Nature-based solutions for flood risk reduction: A probabilistic modeling framework. One Earth 2021, 4, 1310–1321. [Google Scholar] [CrossRef]
- Cariñanos, P.; Casares-Porcel, M.; de la Guardia, C.D.; Aira, M.J.; Belmonte, J.; Boi, M.; Elvira-Rendueles, B.; De Linares, C.; Fernández-Rodriguez, S.; Maya-Manzano, J.M.; et al. Assessing allergenicity in urban parks: A nature-based solution to reduce the impact on public health. Environ. Res. 2017, 155, 219–227. [Google Scholar] [CrossRef]
- Haddis, A.; Van der Bruggen, B.; Smets, I. Constructed wetlands as nature based solutions in removing organic pollutants from wastewater under irregular flow conditions in a tropical climate. Ecohydrol. Hydrobiol. 2020, 20, 38–47. [Google Scholar] [CrossRef]
- Xi, Y.; Peng, S.; Liu, G.; Ducharne, A.; Ciais, P.; Prigent, C.; Li, X.; Tang, X. Trade-off between tree planting and wetland conservation in China. Nat. Commun. 2022, 13, 1967. [Google Scholar] [CrossRef] [PubMed]
- Chausson, A.; Turner, B.; Seddon, D.; Chabaneix, N.; Girardin, C.A.; Kapos, V.; Key, I.; Roe, D.; Smith, A.; Woroniecki, S.; et al. Mapping the effectiveness of nature-based solutions for climate change adaptation. Glob. Change Biol. 2020, 26, 6134–6155. [Google Scholar] [CrossRef] [PubMed]
- Jones, C.N.; Evenson, G.R.; McLaughlin, D.L.; Vanderhoof, M.K.; Lang, M.W.; McCarty, G.W.; Golden, H.E.; Lane, C.R.; Alexander, L.C. Estimating restorable wetland water storage at landscape scales. Hydrol. Processes 2018, 32, 305–313. [Google Scholar] [CrossRef]
- Thorslund, J.; Jarsjo, J.; Jaramillo, F.; Jawitz, J.W.; Manzoni, S.; Basu, N.B.; Chalov, S.R.; Cohen, M.J.; Creed, I.F.; Goldenberg, R.; et al. Wetlands as large-scale nature-based solutions: Status and challenges for research, engineering and management. Ecol. Eng. 2017, 108, 489–497. [Google Scholar] [CrossRef]
- Jun, G. Research on Tianjin Wetland Change Based on Remote Sensing Technology. Master’s Thesis, Tianjin Normal University, Tianjin, China, 2013. (In Chinese). [Google Scholar]
- Yao, H. Characterizing landuse changes in 1990–2010 in the coastal zone of Nantong, Jiangsu province, China. Ocean Coast. Manag. 2013, 71, 108–115. [Google Scholar] [CrossRef]
- Rajala, T.A.; Särkkä, A.; Redenbach, C.; Sormani, M. Estimating geometric anisotropy in spatial point patterns. Spat. Stat. 2016, 15, 100–114. [Google Scholar] [CrossRef]
- Diggle, P.J.; Chetwynd, A.G. Second-order analysis of spatial clustering for inhomogeneous populations. Biometrics 1991, 47, 1155–1163. [Google Scholar] [CrossRef]
- Xinyue, W.; Juanjuan, H. Spatial Distribution Features and Influence Factors of Rural Leisure Tourism Destinations in Shandong Province. Sci. Geogr. Sin. 2016, 36, 1706–1714. (In Chinese) [Google Scholar]
- Ellison, G.; Glaeser, E.L. Geographic concentration in US manufacturing industries: A dartboard approach. J. Political Econ. 1997, 105, 889–927. [Google Scholar] [CrossRef] [Green Version]
- Loffredo, F.; Scala, A.; Serra, M.; Quarto, M. Radon risk mapping: A new geostatistical method based on Lorenz Curve and Gini index. J. Environ. Radioact. 2021, 233, 106612. [Google Scholar] [CrossRef]
- Chan, T.N.; Ip, P.L.; U, L.H.; Tong, W.H.; Mittal, S.; Li, Y.; Cheng, R. KDV-Explorer: A near real-time kernel density visualization system for spatial analysis. Proc. VLDB Endow. 2021, 14, 2655–2658. [Google Scholar] [CrossRef]
- Xiao, Y.; Gong, P. Removing spatial autocorrelation in urban scaling analysis. Cities 2020, 124, 103600. [Google Scholar] [CrossRef]
- Matkan, A.A.; Shahri, M.; Mirzaie, M. Bivariate Moran’s I and LISA to explore the crash risky locations in urban areas. In Proceedings of the Conference of Network-Association of European Researchers on Urbanisation in the South, Enschede, The Netherlands, 12–14 September 2013. [Google Scholar]
- Zhao, G.J.; Gao, J.F.; Tian, P.; Tian, K. Comparison of two different methods for determining flow direction in catchment hydrological modeling. Water Sci. Eng. 2009, 2, 1–15. [Google Scholar]
- Hongtao, L.; Wei, L.; Yong, S.; Yi, Z. Analysis of ecological water demand in Tianjin. Resour. Econ. Environ. Prot. 2015, 8, 126–128. (In Chinese) [Google Scholar]
- Hilty, J.; Worboys, G.L.; Keeley, A.; Woodley, S.; Lausche, B.; Locke, H.; Carr, M.; Pulsford, I.; Pittock, J.; White, J.W.; et al. Guidelines for conserving connectivity through ecological networks and corridors. Best Pract. Prot. Area Guidel. Ser. 2020, 30, 122. [Google Scholar]
- Powers, K.; Hairston-Strang, A.; Koehn, S.; Jolly, K. Forest Plans of North America; Academic Press: Salt Lake City, UT, USA, 2015; pp. 139–148. [Google Scholar]
- de Sá Silva, A.C.R.; Bimbato, A.M.; Balestieri, J.A.P.; Vilanova, M.R.N. Exploring environmental, economic and social aspects of rainwater harvesting systems: A review. Sustain. Cities Soc. 2022, 76, 103475. [Google Scholar] [CrossRef]
- Ma, L.; Li, Y.; Wu, P.; Zhao, X.; Chen, X.; Gao, X. Coupling evapotranspiration partitioning with water migration to identify the water consumption characteristics of wheat and maize in an intercropping system. Agric. For. Meteorol. 2020, 290, 108034. [Google Scholar] [CrossRef]
- Shi, X.; Qin, T.; Yan, D.; Sun, R.; Cao, S.; Jing, L.; Wang, Y.; Gong, B. Analysis of the Changes in the Water Yield Coefficient over the Past 50 Years in the Huang-Huai-Hai River Basin, China. Adv. Meteorol. 2018, 2018, 6302853. [Google Scholar] [CrossRef]


| Province or Municipality | Precipitation | WYC | Total Water Resources | Percentage of Ecological Environment Water to Total Water Resources | Ecological Environment Water |
|---|---|---|---|---|---|
| Sichuan | 5093.93 | 57.96% | 2952.64 | ||
| Tianjin | 69.35 | 25.34% | 17.58 | 31.68% | 5.57 |
| Tianjin * | 69.35 | 57.96% * | 40.19 * | 31.68% | 12.73 * |
Publisher’s Note: MDPI stays neutral with regard to jurisdictional claims in published maps and institutional affiliations. |
© 2022 by the authors. Licensee MDPI, Basel, Switzerland. This article is an open access article distributed under the terms and conditions of the Creative Commons Attribution (CC BY) license (https://creativecommons.org/licenses/by/4.0/).
Share and Cite
Li, Y.; Wang, G.; Chen, T.; Zhang, R.; Zhou, L.; Yan, L. Nature-Based Solutions in “Forest–Wetland” Spatial Planning Strategies to Promote Sustainable City Development in Tianjin, China. Land 2022, 11, 1227. https://doi.org/10.3390/land11081227
Li Y, Wang G, Chen T, Zhang R, Zhou L, Yan L. Nature-Based Solutions in “Forest–Wetland” Spatial Planning Strategies to Promote Sustainable City Development in Tianjin, China. Land. 2022; 11(8):1227. https://doi.org/10.3390/land11081227
Chicago/Turabian StyleLi, Yangli, Gaoyuan Wang, Tian Chen, Rui Zhang, Long Zhou, and Li Yan. 2022. "Nature-Based Solutions in “Forest–Wetland” Spatial Planning Strategies to Promote Sustainable City Development in Tianjin, China" Land 11, no. 8: 1227. https://doi.org/10.3390/land11081227
APA StyleLi, Y., Wang, G., Chen, T., Zhang, R., Zhou, L., & Yan, L. (2022). Nature-Based Solutions in “Forest–Wetland” Spatial Planning Strategies to Promote Sustainable City Development in Tianjin, China. Land, 11(8), 1227. https://doi.org/10.3390/land11081227