Review

An Overview of Fractal Geometry Applied to Urban Planning

School of Planning, University of Waterloo, 200 University Ave. W., Waterloo, ON N2L3G1, Canada
*
Author to whom correspondence should be addressed.
Land 2022, 11(4), 475; https://doi.org/10.3390/land11040475
Submission received: 7 February 2022 / Revised: 3 March 2022 / Accepted: 19 March 2022 / Published: 25 March 2022
(This article belongs to the Special Issue Geodesign in Urban Planning)

Abstract

:
Since computing advances in the last 30 years have allowed automated calculation of fractal dimensions, fractals have been established as ubiquitous signatures of urban form and socioeconomic function. Yet, applications of fractal concepts in urban planning have lagged the evolution of technical analysis methods. Through a narrative literature review around a series of “big questions” and automated bibliometric analysis, we offer a primer on fractal applications in urban planning, targeted to urban scholars and participatory planners. We find that developing evidence demonstrates linkages between urban history, planning context, and urban form and between “ideal” fractal dimension values and urban aesthetics. However, we identify gaps in the literature around findings that directly link planning regulations to fractal patterns, from both positive and normative lenses. We also find an increasing trend of most literature on fractals in planning being published outside of planning. We hypothesize that this trend results from communication gaps between technical analysts and applied planners, and hope that our overview will help to bridge that gap.

1. Introduction

In our rapidly urbanizing world where cities are becoming hotspots for climate change [1], it is increasingly important to understand how cities work and how urban form influences peoples’ life ([2] p. 79). To form this understanding, the land-change science community advises that we view land systems from a complex systems lens, noting that “land systems exhibit complex behaviors with abrupt, hard-to-predict changes;” and “irreversible changes and path dependence are common features of land systems” ([3] p. 1). This mandate applies equally to urban areas, which are a deeply interconnected part of the complex land system [4]. How can this mandate be translated into lessons for urban planning? Do these lessons already exist in literature and simply deserve synthesis, or do important questions remain open? This paper addresses these questions in one small aspect, reviewing what we now know about the application of fractal form and function, a key aspect of complex systems, and what questions remain open.
Numerous evidence demonstrates that cities, in their organic and irregular form, reflect fractal principles both in the way they fill the space available to them as they evolve over time and in the patterns that they create. These space-filling processes include how new developments take place near already developed sites, how already developed sites change to accommodate growth, and how individuals’ desire for open space and access to services scale up to the fractal pattern. Patterns include the size distribution of the built environment including buildings, parcels, and road networks [5].
Fractal concepts have mainly been applied as an analytical tool to characterize and interpret urban areas and have led to advancements in urban simulation models [6,7,8]. As research on fractals has developed in geography, planning, and outside fields, scholars have divided into two diverging groups. The first group appears alienated by the highly technical nature of fractal analysis and has asked “so what?”, while more technically oriented researchers have leveraged the recognition that cities across space and time follow fractal forms to ask, “what else?”. In participatory planning tools, this gap is particularly apparent. Specifically, the question “what is the fractal dimension calculation tool and how it can help the planning process?” has not yet been clearly answered in terms that are accessible to both academic and practicing planners.
The goal of this paper is to provide academic and practicing planners with an answer to that question by (1) providing an organic and visual explanation of the fractal patterns and how they are measured; (2) providing a targeted review of the academic literature on the application of fractal theory in planning; (3) analyzing the areas of focus and disciplinary literature where such work is published; and (4) suggesting directions, remaining gaps, and open questions for future research. In this paper, we do not aim to comprehensively review the broad corpus of literature on this topic. Rather, we focus on key representative works, discuss overall trends, direct the reader to other comprehensive works where they exist, and highlight gaps in the literature.
The paper is organized around a series of “big questions”. In Section 2, we define fractals and explain how fractal patterns are generated and measured, both theoretically and empirically. Section 3 reviews empirical evidence from the literature on fractal signatures the urban built form and socioeconomic phenomena. In Section 4, we discuss evidence on how urban fractal patterns are generated. Section 5 reviews how fractal dimension varies across time and cultural, historical, and political contexts. Section 6 explores the findings related to the normative aspects of fractal urban form—whether and how fractal patterns may relate to good urban function. Section 7 uses bibliometric analysis tools to explore how the academic literature on fractals in planning are represented in planning journals, examining its publication trajectory, authorship clusters, and thematic areas. In the concluding section, we synthesize our findings and offer recommendations to help bridge language and disciplinary gaps to further research and application around the role of fractal analysis in planning.
For the reader seeking a broad overview, we recommend they follow the graphical figures and illustrations in Section 2, review the framing questions of Section 3, Section 4, Section 5 and Section 6, and read the concluding Section 8 in full. For readers with a special interest in one of the questions, raised, each section stands on its own as a short overview.

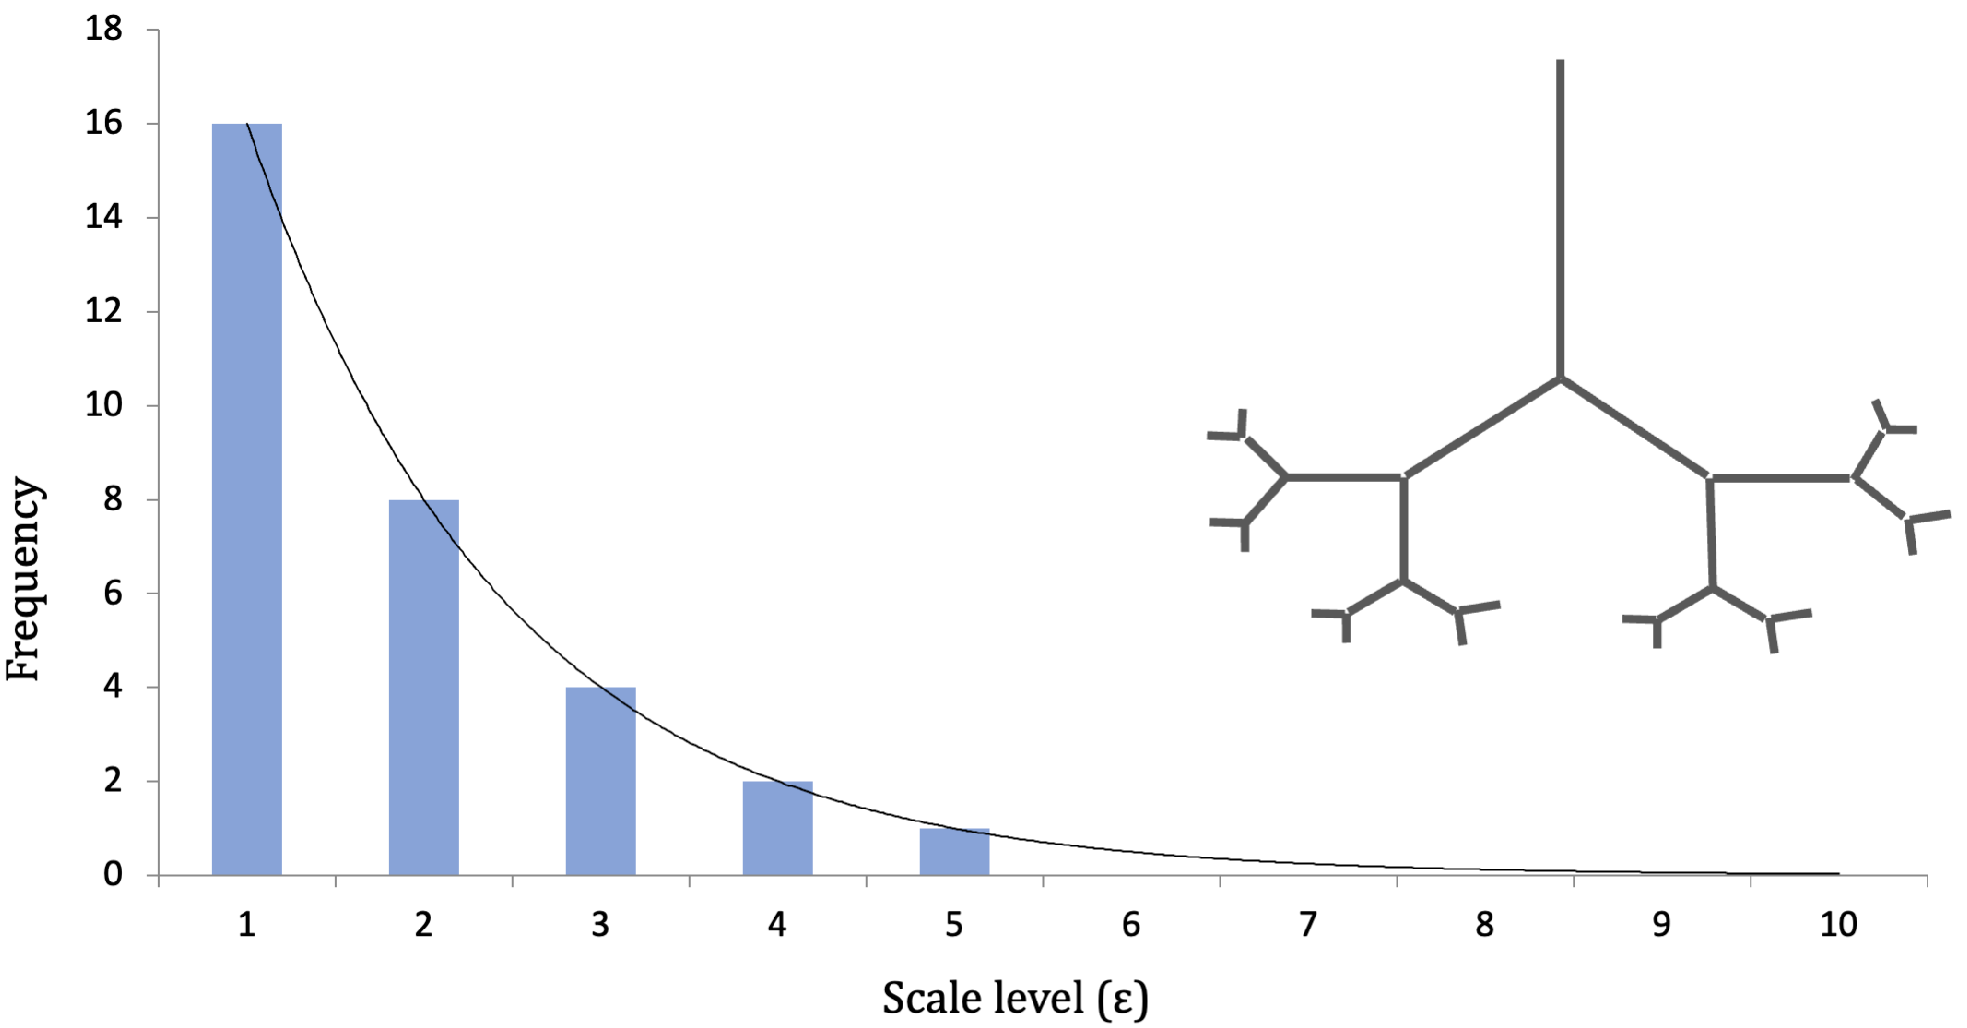
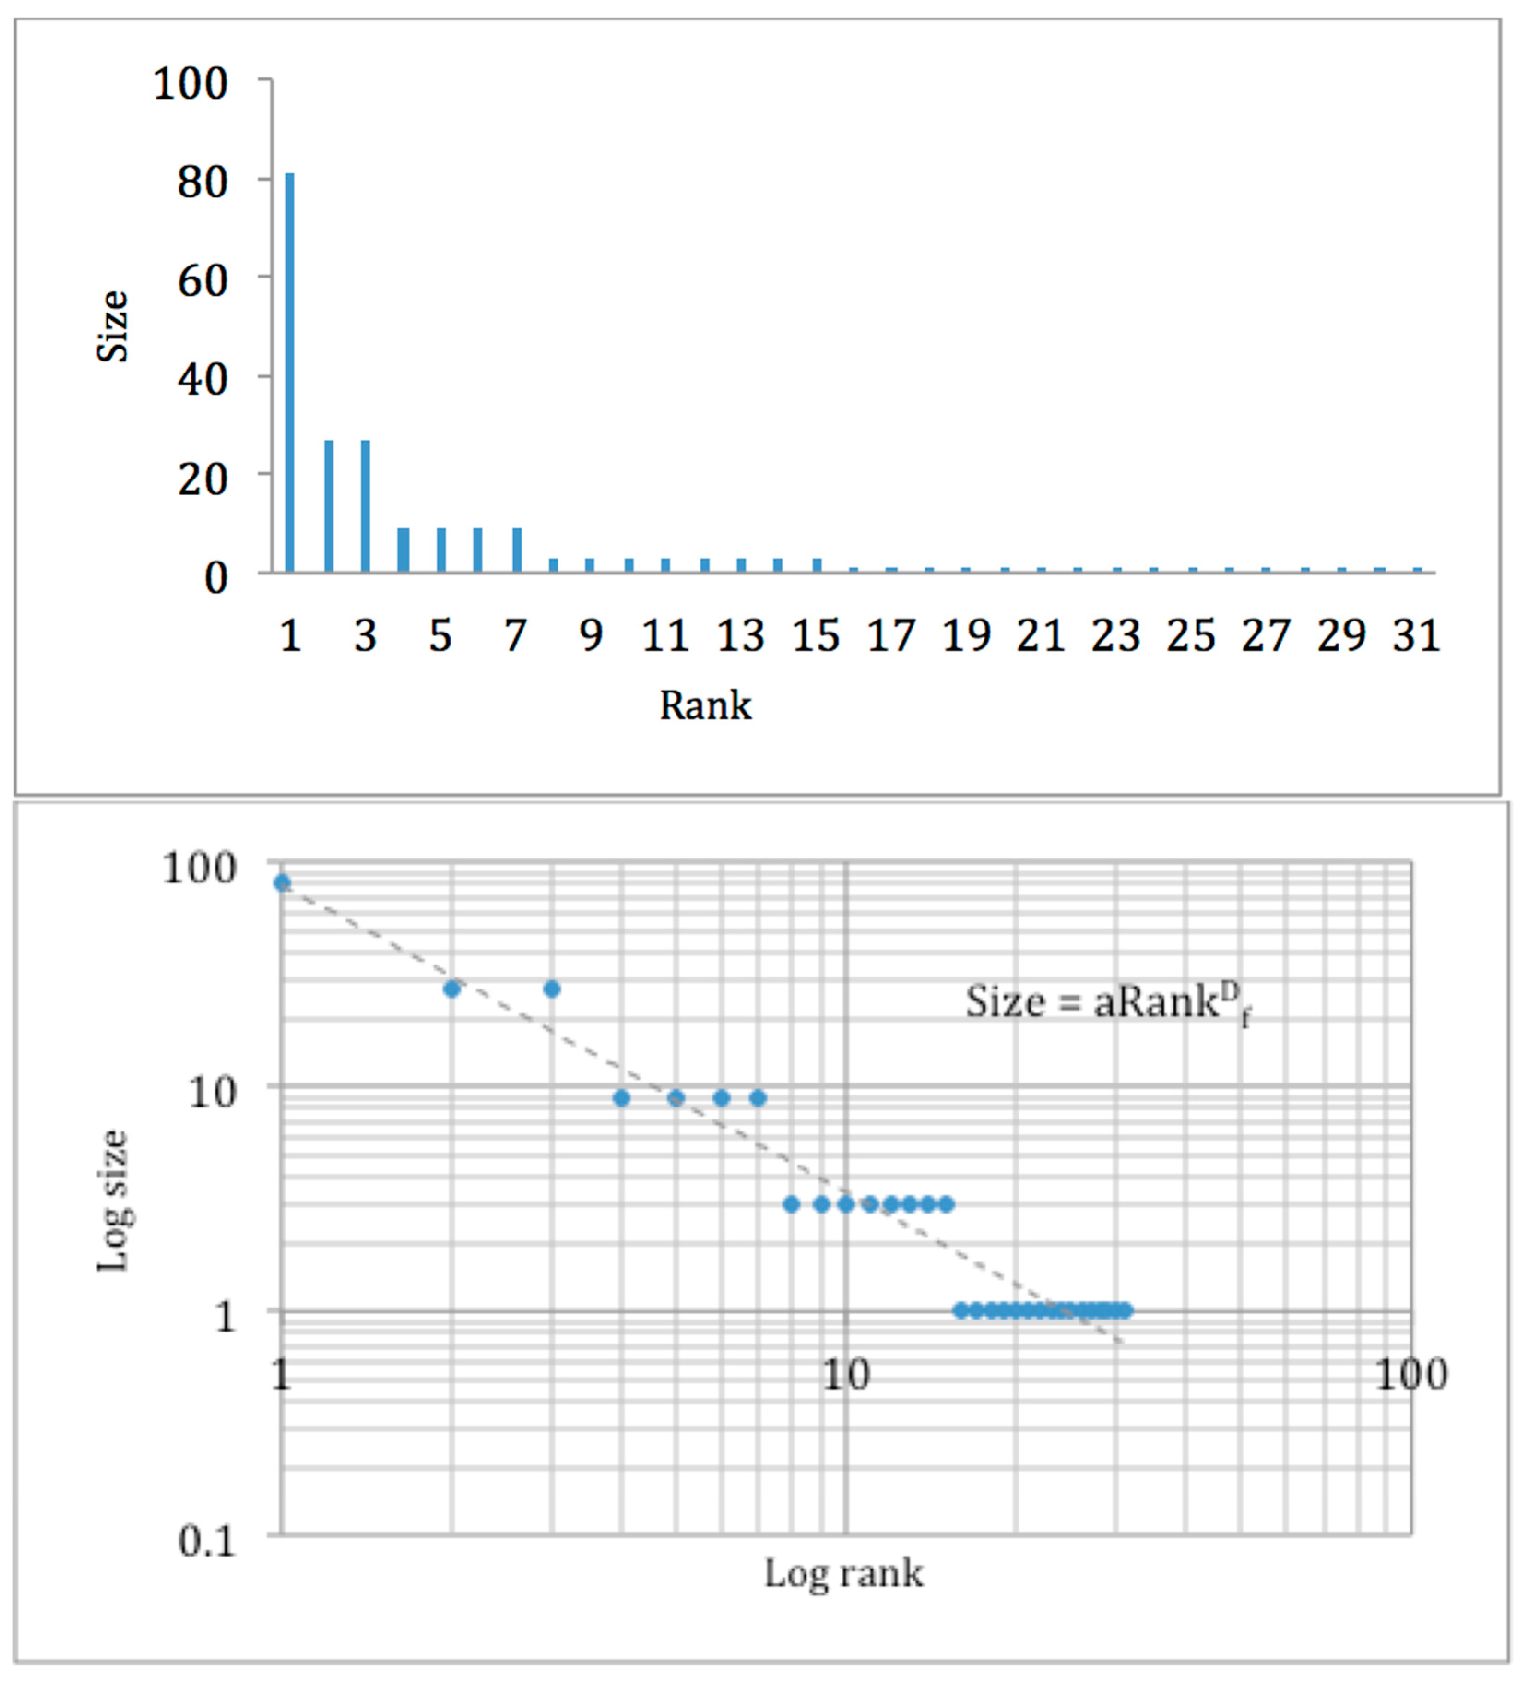
2. What Are Fractals and How Are They Measured?

A fractal form fills space by replicating its form at increasingly finer scales. Thus, fractal forms fill their available dimensional space with increasing density as their form iterates to increasingly finer scales. Fractal structures grow incrementally from the bottom up or top down through infinite recurring accumulation or subdivision processes in feedback loops. Fractals are a classic illustration of complex systems, where seemingly highly complex global spatial patterns are generated by simple, local rules [9].
The term “fractal” was first used to describe the geometry of nature, such as branches of trees, the surface of mountains, and the shape of coastlines that can be described as irregular and fragmented, and furthermore shows these properties in all scales [10]. These properties can be measured by Fractal Dimension (D), which is defined as the degree to which the shape occupies the space available to it. Fractals were not widely studied until advancements in computer simulations allowed the generation of artificial and mathematical fractals and easily automated calculations of fractal dimension [11].
The rest of this section provides a detailed, but accessible primer on the definition and measurement techniques of fractals for interested readers. Full equations are provided for the mathematically oriented reader. For visual learners, we illustrate these questions through figures. (For those who prefer a dynamic presentation, we direct the reader to minutes 19:50–23:15 in [12]).
We provide an example of a simple artificial fractal tree in Figure 1 to illustrate the generation process and the measurement techniques to calculate the fractal dimension. The formation process, referred to as the iteration stages, start from t = 0 (left) to t = 4 (right). In each iteration, n = 2 branches are added which are each 1/ε of the size of the branches in the previous iteration stage. Here, ε = 3 is referred to as the scale. Because they fill space in a two-dimensional plane, such structures have a dimension higher than a line (D = 1) and lower than a plane (D = 2). This fractal dimension falls between 1 and 2. The value of fractal dimension is directly related to the value of the scale and multiplication factors used to generate the fractal object [13]. In our artificial fractal tree example, the fractal dimension ( D f )   is calculated through the following equation whose value depends on the relationship between the sizes of units in adjacent steps (scale) and the number of iterations (N):
D E D f = lim t log N ε /   log ε
  D E   is the Euclidean dimension of the space that encloses the form and, thus, is a greater integer number D E = 2   in   a   plane ,   for   example .
Figure 1. Example of a simplified formation process of a fractal tree. t refers to the iteration stage, so the form develops as t increases; N refers to the number of branching in the multiplication process, so in each development stage N times the initial number of elements is added. Scale refers to the ratio of the new element size to the size of the initial element. So, in the fractal tree above, D E D f = lim t log N ε /   log ε = log   2 / log   3 = log   4 / log   9 = log   8 / log 27 = log   16 / log   81 = 0.63 . D f = 2 0.63 = 1.36 Panels (ae) represent the first through fifth stages of iteration. Source authors [14].
Land 11 00475 g001
The size distribution of elements in a fractal structure follows a power-law relationship, implying that there are very few large components, some middle size, and many small components. The frequency of components of certain size scales by a constant factor N ε = a ε α , where N ε refers to the number of components of size ε in the system, and α represents the scaling exponent. More simply, the second-largest element in a fractal series is a certain proportion smaller than the first element, the third element is smaller than the second by the same proportion, and so on [15]. Figure 2 shows the distribution of element sizes of the artificial fractal tree presented in Figure 1. As shown, the distribution is power-law and thus is best presented in logarithmic scales (Figure 3). The power-law distribution of fractal elements reveals a linear relation when plotted in a log-log rank-size graph.
The slope of the fitted line to this graph, using linear regression analysis, is used to calculate the fractal dimension when the details of the iteration process and behavior are unknown—as is most often the case when analyzing real-world fractal patterns. In this approach, the statistical fractal dimension is calculated as D f = lim ε 0 d log n d log 1 ε   , where log n refers to the y-axis and log 1/e refers to the x-axis value on the graph. The same method is used with the rank-size distribution graph of fractal elements:
D f = lim ε 0 d log s i z e d log s i z e r a n k
Equations (1) and (2) can be used to calculate an empirical fractal dimension using data that measure urban form and function, such as distributions of land-use parcels, building heights, employment, or population density [11]. Unlike theoretical fractals, however, the size distributions of elements in empirical fractal phenomena do not follow power-law distributions perfectly. Their distributions generally have bent heads and fat tails. When the fitted line bends and is best captured by two or more slopes the situation is referred to as a bi-fractal or multi-fractal, respectively [16].
In some real-world phenomena, where the units are not institutionally defined (such as raster images), black and white maps and images can be used to calculate the fractal dimension, known as the cell-counting or box-counting method ([11] p. 225). This method involves the use of a grid that covers the whole image or map and counts the number of cells that contain at least part of the image. By changing the cell sizes of the grid (scale of measurement or ε ) and recording the number of cells contacting the image in each variation ( n ), a size-distribution graph is obtained.
Several other fractal dimension measurements have been developed to target specific features of fractals such as the area-perimeter fractal dimension to measure the dendricity of shape borders, Ht-indext to measure the scales of hierarchy, and power-law scales [17]. These methods have been applied as a landscape metric to characterize urban patterns [18,19], improve the accuracy of land-use and land-cover classification using aerial photographs [20], and capture the structure of urban growth processes [21], whether the land-use class under study has changed to be more fragmented or aggregated.
While the above equation analyzes scaling properties in the size distribution of elements, further fractal dimension measurements can capture self-similarity in their spatial arrangement. In cities, as with other natural systems such as snowflakes, the recursive generation process operates radially from a central starting point. The radial fractal dimension measures how a property scales in reference to a single point in space. For this purpose, ε is replaced by the distance r from the central point in the above equation and yields:
F r = F 1 r D f d = F 1 r a ;   α = d D f
where F r   can be any function such as population or land use density at distance r, a refers to the scaling exponent of density distribution, d is the Euclidean dimension (which equals 2 in the two-dimensional plane of maps and images), and D f   denotes the radial fractal dimension of the urban form [8]. Radial fractal dimension methods have been also modified to measure fractal patterns of non-polycentric cities [22]. (We leave the further investigation to the motivated technical reader [23,24]).

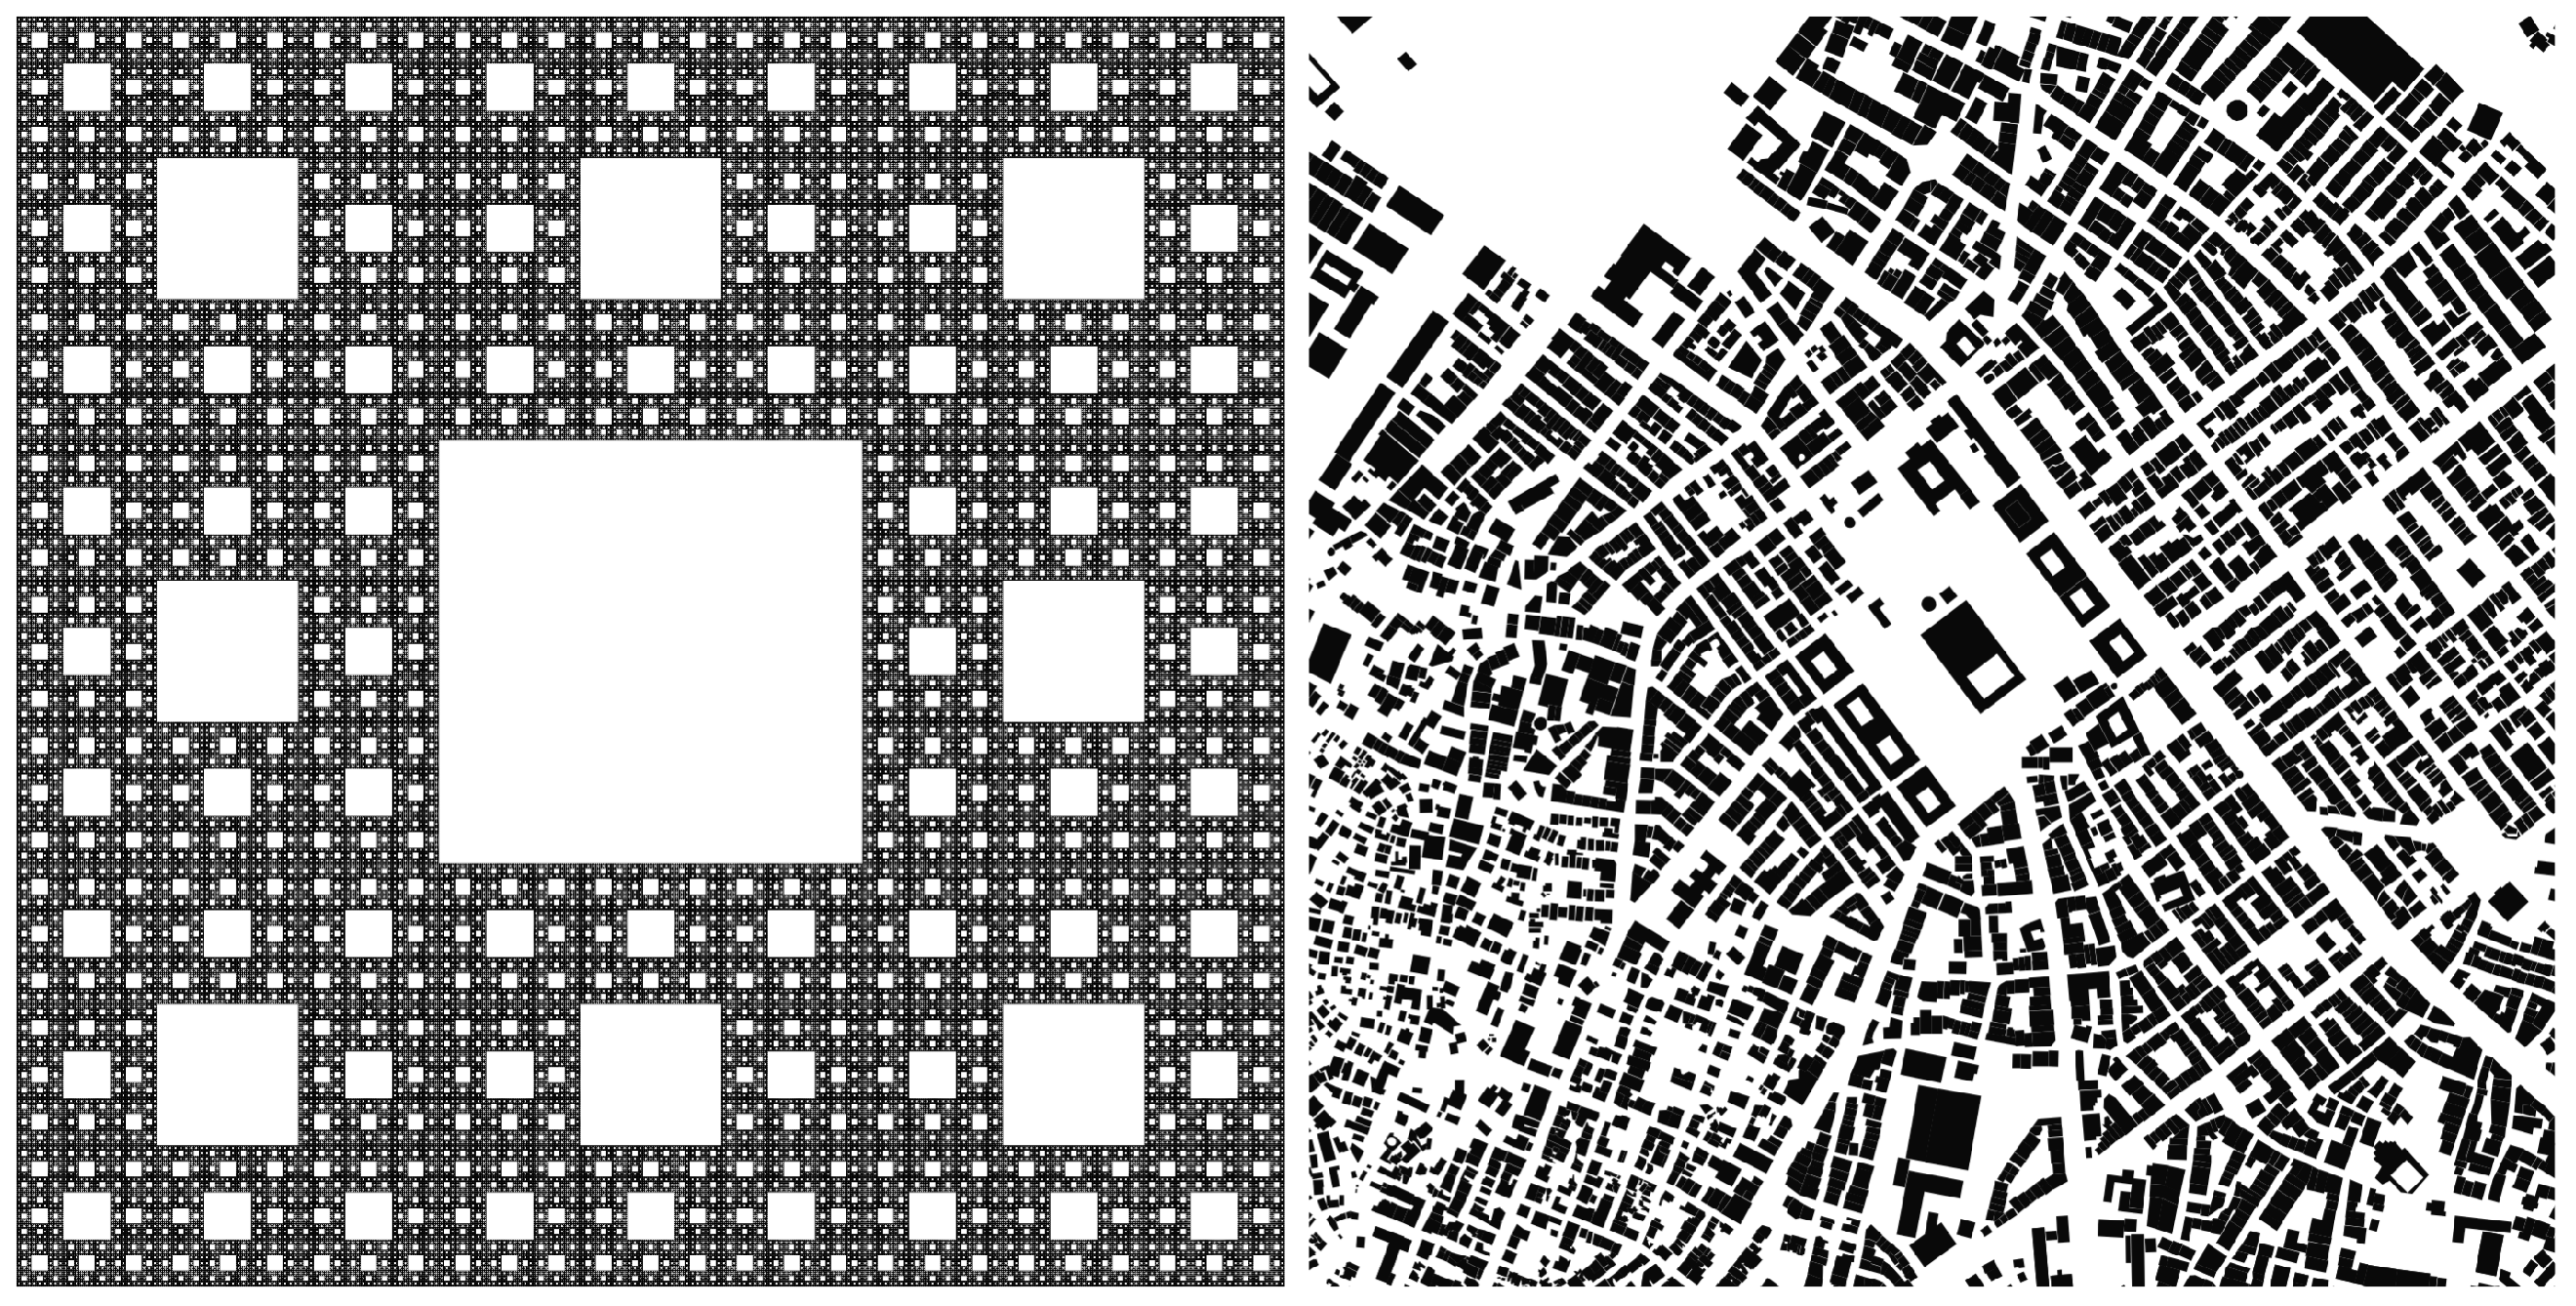
3. What Fractal Signature Are Found in Urban Fabric?

Evidence of fractal properties in urban contexts spans both spatial and non-spatial profiles of cities. As soon as an abundance of digital maps, images, and geographic information systems technology was made available, many studies began to identify fractal patterns in urban landscapes [20]. Thus, earlier evidence for the fractal city focused on the built environment, including but not limited to the urban boundary [25], the radial land-use density gradient [6], parcel size by area [26], building footprints and allometry [27,28], impervious land [29], road network [30], and city-scale traffic flow [31]. An example of a fractal urban form in the city of Istanbul is provided in Figure 4. Compared visually to mathematical fractals shown on the left, in the real-world urban fabric, the fractal patterns show more random and irregular forms.
Recently, the ability to obtain and analyze large-scale data on the socio-economic aspects of cities has provided us with new insights into the complexity of urban dynamics [34,35]. Thus, our review includes evidence on both the spatial and non-spatial profiles of cities. It is important to note that the analysis of urban socioeconomic signatures has focused more generally on their power-law distributions. (All fractals show power-law distributions, but power-law distributions are not necessarily generated by fractal processes.) Yet, it is common in the literature to refer to non-spatial power-law phenomena as a fractal, such as time series [36,37], complex networks [38], and demographic distributions [39,40].
Table 1 summarizes the fractal/power-law signatures of urban profiles in two general categories: the built form and socio-economic profiles. For each category, the table provides the metrics analyzed with references to key empirical studies. On the table’s left side, evidence from many empirical studies suggests that the complex patterns in the urban built form have fractal properties including but not limited to the urban boundary [41], the radial land-use density gradient [6], parcel size by area [26], buildings footprints and allometry [27,28], impervious land [29], road network [30], and city-scale traffic flow [31]. The table’s right side highlights socioeconomic phenomena that follow power-law distributions. Empirical evidence suggests that social group size either in-person [42] or online [43], personal income distribution in metropolitan areas [44], the distribution of firm size by revenue [45] or by the number of employees [46], and land price distribution [47] are among clear examples of power-laws in urban socio-economic profiles.
This empirical evidence lends support for the complex systems approach to understanding urban form and function, as the presence of power-law behavior in the size distribution of a system’s elements implies self-similarity in its underlying system dynamics [11]. However, it does not yet tell an empirical story about how these systems evolve. Potentially, due to the historical availability of static GIS and remotely sensed data, most analyses of fractal patterns in urban form have taken a cross-sectional lens. Yet theoretically, the power-law distribution of component sizes is only one of the properties of a fractal system, while the dynamic spatial configuration of the components, their growth path, and the way they fill the available space are important determinants as well. Yu and Zhao [55] address this measurement challenge by employing nonlinear least-squares regression to estimate the rate of change of fractal dimension which can vary across different urban growth contexts.

4. What Real-World Evidence Links Urban Processes and Fractal Dimension?

The fractal patterns in nature and human artifacts are snapshots reflecting the last scene of an evolutionary story. The story’s roots include a base (where the resources lay), an initiator (where the story starts), a generator (the forces that move the system forward), a path (the sequence of events in time), and perturbations (what makes its story unique from any other similar systems). The generator in a fractal system recurs in several (and in some cases, infinite) scales in time or space, and gives the system scaling structure, where the hierarchy emerges and is visualized in the outcome snapshot. A snowflake (“no two are alike”) is a commonly understood example of the outcome of the fractal formation process.
In the example of a fractal urban built form, the land, the initial settlement, and the process of population growth and development are (respectively) the base, the seed, and the generator. Concurrent with the earliest identification of fractal forms in the urban fabric, several models were developed to replicate/understand the generator of the phenomena under study using computer simulations. These include Diffusion Limited Aggregation Models [56,57,58], Cellular Automata models [6,59,60], and Agent-Based Models [61,62,63]. In the following paragraphs, we elaborate on these models in more detail.
Urban models demonstrate how fractal patterns are generated by replicating the underlying process from the most simplified micro-scale units and allowing simulations to iterate long enough to reveal emergent macro-scale patterns. Pioneer simulation models include location models (mainly cellular automata) that model the process of land-use or land-cover change from the micro-level land unit and generate patterns that mirror those of real-world cities [6,64,65,66], thus harnessing fractal theory to validate simulation results. The ability of computer models to iterate functions over the scope of time and space, developed since the early 1990s, made it possible to generate and validate such patterns. The empirical identification of a common range of urban scaling exponents has thus significantly improved the predictability of urban growth in models [66]. The set of rules that govern the transition of the cell states work as the generators of fractal patterns and can be summarized in the combination of counteracting (agglomerative and dispersive) forces.
The first class of urban fractal models is Diffusion Limited Aggregation (DLA), where clusters of urban cells develop around a single point in a simulated landscape through accretion [57]. In these models, urban growth is modeled at each time step by a free particle in a random walk that joins an existing urban patch when it encounters one. The generator here is the counteracting forces between the centripetal attraction of the less accessible seed and the centrifugal force of more accessible distant cells. This process can produce density distributions very similar to those of real cities with similar geography [56]. However, the process of urban development from these models does not have a strong analog to real-world urban growth processes, especially as it cannot model so-called “leapfrog” development.
The next generation of urban models follows a well-known article by White and Engelen [6] who modeled the growth of a hypothetical city using a cellular automaton (CA) model with four different land use states: vacant, residential, commercial, and industrial. Using very simple transition rules and growth rates, they show that the log-log size-frequency plot of commercial clusters agrees with empirical studies of a set of US cities. They further simulated the evolution of Berlin’s urban morphology and demonstrated concurrence between their simulated radial fractal dimension and actual Berlin measurements produced by Frankhauser and Sadler [67]. The cellular automaton modeling process more closely mirrors observed urban growth processes, where cities evolve iteratively from a central core, while also mirroring the underlying complex science processes of fractal formation. The majority of the applications of fractals in urban CA models cluster around the validation of model outcomes with real-world observations. As such, fractal dimensions, along with other complementary landscape metrics, are used to compare the simulation result with actual cities [68,69,70].
Van Vliet et al. [71] note that the emerging fractal patterns are the result of two counteracting forces in the model dynamics: the neighborhood effect working as a centripetal force and the diseconomy of scale and stochastic perturbation working as centrifugal forces. While they do not estimate fractal dimension for their generated landscapes, Parker and Meretsky [72] demonstrate how agglomerative forces (travel costs and positive spatial externalities) encourage compact landscapes, whereas dispersive forces (open space attractiveness) increase fragmentation of developed landscapes. White and Engelen [6] emphasize these fundamental complex systems linkages, drawing on Langton’s law [73] to conclude that fractal structure emerges in cities as a transient state from chaos to order, and is a necessary characteristic that enables cities to evolve through time.
These models focus on replication of urban form, but the explicit chain of processes that links the fractal urban signatures to the underlying socio-economic processes remains largely unarticulated. The next generation of dynamic urban models extends to Agent-Based Models (ABM) which focus on human and institutional actors in the urban system and model the individual-level decision-making processes that produce large-scale patterns [74]. These models focus on social science questions and include examples such as the small-world network model [75] and the emergence of firms [76] that produce power-law size distribution based on preferential attachment, or “the rich get richer”, as the recurring generator. While many ABMs of urban growth have been developed ([77] pp. 885–910) very few [69,71,72] specifically focus on fractals. Jahanmiri [14] has developed a simple agent-based model that links social network formation to the generation of fractal urban form, offering a pioneering effort to address this gap. Yet, more work is needed to elaborate on the details of these processes and to better represent and incorporate data on urban actors.
The more accurately these models are able to simulate realistic urban growth and land-use patterns, the better planners are able to test the possible consequences of various policies and actions. However, as calibration of these models (ABMs in particular) requires data at both the parcel and agent level, they are considered highly data-demanding if they are to be used for prediction purposes. Therefore, Batty [28] and Batty and Milton [78] advise that CA and ABM models are best to inform planners about “what-if” intervention scenarios rather than to predict actual urban dynamics.
Parallel to these specialized urban simulation models, a comprehensive vision of cities has been developed that generalizes dispersed theories on urban dynamics through a set of mathematical models ([2], pp. 55–122). This literature posits a different view on the origin of fractal urban form, putting its roots in the physical form of the city. It argues that fractal patterns in urban statistics lie in the scaling properties of the physical structure of cities, e.g., the transportation network. The fractal dimension of the road network, in turn, determines the mobility of agents in space over time. That is, the interaction of populations in space follows their mobility patterns which are framed by the physical structure. In this framework, the fractal geometry of urban form implies scaling in urban structure and that, in turn, results in the social network effect.

5. How Does Fractal Dimension Indicate History and Institutional Context?

So far, we have shared the robust empirical evidence that urban form evolves into fractal structures, mirrored by power-law distributions of socioeconomic phenomena within cities. This recognition raises fundamental questions about planning agency in cities. The reader may now be wondering, as we were, how planning policies influence whether cities develop in fractal forms. Do initial city layouts or zoning policies such as height restrictions, massing restrictions, and setbacks matter? Do restrictions on land uses (such as policies to encourage segregation or mixing of uses) matter? Does the form of transportation networks matter? If so, how? The review below demonstrates, theoretically and empirically, only preliminary answers to these questions in the current literature.
The primary theoretical connection of fractal dimension is with density, as by definition, fractal dimension is the degree by which the geometry fills the space available to it [79,80]. As such, for a given fractal process, a form with a higher fractal dimension has a higher density, representing a higher number of iterations and thus more filling of available space. However, when comparing fractal distributions to uniform ones, a fractal form will not necessarily mean higher density. Urban areas with similar density measurements can have very different fractal dimensions, as shown in Figure 3 in [81] Consequently, fractal dimension cannot be used as a proxy for density; rather, it can supplement density metrics to distinguish between urban and rural areas in large-scale urban regions [82,83,84,85,86,87].
Natural fractals have diversity both in the size variation of their components and in the arrangement of their components in space. So, a higher fractal dimension implies more heterogeneity in the variation of the components. Urban areas with higher fractal dimension values have a higher diversity of elements at different scales (i.e., very large and very small buildings and/or parcels) and thus are interpreted by some authors as more urbanized. In an extensive study of the allometric properties of 3.5 million buildings in London, UK, Batty et al. [27] show that the power-law scaling parameter (equivalent to fractal dimension in this discussion context) is higher for land-uses such as office, retail, and industrial, compared to residential, whose components are more homogeneous. These findings also reflect the impact of planning policy regarding building height restriction on the fractal dimension, as there is significant distortion in the fit of the log-log regression line in certain distances from the city center where central business district policies are in place. Yu and Zhao [55] analyze the evolution of fractal dimension in three Chinese coastal cities that have similar cultural and socioeconomic contexts but have divergent planning histories and rates of growth. They argue that the demolition of large-scale urban clusters has led to a more homogeneous landscape of single buildings which yields a lower fractal dimension. Thus, planning context appears to influence fractal dimension by constraining the naturally skewed distributions of urban components.
As discussed earlier, fractal patterns are generated gradually through an iterative self-similar process (i.e., a single generating process reoccurs over time), leading to the emergence of self-similar patterns in the landscape. As such, fractal dimension, as an aggregate signature, reflects a hierarchical structure generated by the urban area’s growth history, planning history, and other theoretical determinants of urban evolution. These relationships were demonstrated in a study of the scaling parameters of numerous European cities, where cities with similar fractal dimensions were shown to have similar planning structures and history [19]. Classic dense urban areas consisting of many small buildings mixed with a few large ones had the highest average fractal dimension value of about D = 1.7. However, “Le Corbusier-style” urban areas characterized by “tower in the park” developments had lower average fractal dimension values of 1.3 < D < 1.5. The lowest fractal dimension category includes dispersed freestanding buildings in recently planned cities in France that have a linear (rather than planar) character (Figure 7 in [19]).
Generally, evidence shows that the fractal dimension of urban areas increases across time, and this pattern is evident in several cities across Europe and the United States [88,89,90,91]. For example, in the Lisbon metropolitan area, the aggregate fractal dimension has grown from 1.42 (1960) to 1.61 (1990) to 1.66 (2004), following a progressive pattern of parcel subdivision and urban intensification over time [92]. The study’s authors use fractal signatures to create urban areas classifications based on their development stage: 1, small and isolated built-up patches; 2, dispersed built up areas; 3, metastatic growth; 4, rapid growth and metastatic consolidation; and 5, consolidated compact areas, arguing that each fractal signature reflects a stage of the urban growth process [92]. More examples of how the fractal dimension reflects growth hierarchy can be found in studies of systems of cities [93,94], transportation system [95,96,97,98,99], and social networks in the city [42].

6. What Normative Evidence Exists about Urban Fractal Patterns?

The previous sections have established that fractal patterns are universal in urban form, and to some extent, that links exist between planning history and fractal dimension, in that higher fractal dimension has some correspondence with “more urbanized” forms. What has been discovered about the normative aspects of fractal patterns? We know that cities are fractal; is that a good thing? Is the higher fractal dimension good or bad from urban design and urban function viewpoints? Which planning policies facilitate “good” fractal development and which stand in the way? Several areas of the literature offer preliminary answers. Reviewed below, these include the environmental quality of urban areas, urban design, and the planning process.

6.1. Fractal Forms and Open Space

In the landscape ecology tradition, fractal dimension has been used to measure the fragmentation in spatial patterns of forests and urban green patches to characterize their associated environmental quality [100,101,102,103]. For species whose ideal habitat lies at the borders between different land uses, fragmented landscapes are good. Where humans living in cities are concerned, fragmented landscapes of development and open space can provide access to open space for large populations. Here, direct lessons can also be taken from classic literature in landscape ecology on ecological edge effects and applied to economic externalities [73]. Highly fragmented landscapes are high in edge/area ratio and, in urban landscapes, more “edges” between urbanized land and open space mean that more residents have direct access to open space. Such an arrangement can, for instance, help to meet calls for each resident to be able to see three mature trees from their home and be no more than 300 m from greenspace [104].
Alternatively, when considering the associations between higher fractal dimension and increased density from Section 4, a larger fractal dimension means denser built-up areas and less open green space interspersed within the urban fabric. To the extent to which open green space contributes to the health of cities and their residents (strongly supported in the planning literature and beyond, see [104]), a higher fractal dimension of the built (non-open space) environment can therefore be associated with poorer environmental conditions. For example, fractal dimension is shown to be an indicator of the proportion and distribution of green space in cities, in terms of the balance between built-up areas and green space [101]. This study on the evolution of urban land in Lijiang city in China demonstrates that as the fractal dimension increases (to 1.73 in 2006), the proportion of green space drops to 12%. The authors, therefore, assert that future infill development between existing built-up areas should be limited and that instead, the city should focus on improving the quality and quantity of the green spaces in between built-up areas. Thus, a fractal analysis may be a useful tool when applied to fundamental debates over the trade-offs between urban intensification and urban green space provision—but it needs to be interpreted purposefully, with an understanding of what is being measured and how it is valued from a planning perspective.

6.2. Fractal Framework Guiding Urban Design

As fractals are ubiquitously observed in natural objects, such as mountains, trees, snowflakes, and crystals, they are visually pleasing to human eyes [105]. Many authors have translated these findings into implications for urban design [106,107,108,109,110,111,112,113]. In experiments, Taylor et al. [114] found that humans have the highest preference for visual images with fractal dimensions between 1.3 and 1.5, labeling this range the “‘universal’ character of fractal esthetics”, as the finding was independent of gender and cultural background. Their analysis further suggests that urban skylines that follow fractal distributions—which match the skylines of natural features such as mountain ranges—have more visual appeal than uniform or highly skewed forms. Experiments confirmed that images with a fractal dimension of 1.3 produced the highest physiological relaxation response. Cooper et al. [115] have also studied the relationship between human perception of beauty in street vistas in Witney, UK, and fractal dimension. They find that a positive relationship exists between fractal dimension and the quality of the street vistas perceived by people walking in those streets. Liang et al. [111] show that public squares that include more human-scaled features and have a hierarchy in their layout are better fits to fractal models and thus represent good design.
The existence of vegetation in the design of urban open space has proved to influence the fractal dimension of street vista and thus the visual quality [116]. In short, vegetation has fractal forms and therefore adds an aesthetic “bonus” to urban design. Thus, scenes that are dominated by vegetation have generally higher fractal dimensions and are judged as more visually appealing by pedestrians.
In the larger scale of urban expansion, fractals can be used as a diagnostic metric to identify areas with functional performance such as sprawl and access to amenities [117,118,119,120]. Fractal urban patterns have the potential to include density mixed concentrations with various sizes of open space [121]. This feature is empirically demonstrated in a multi-scale fractal simulation system which tested 50 alternative development pattern scenarios and demonstrated that in fractal scenarios, people need to travel shorter distances to reach open-space amenities but longer distances to shops and services. Relative to the non-fractal scenarios, the fractal scenarios offer a higher potential for creating accessible locations of shops and services by rearranging land uses (Figure 5 in [121]).

6.3. Fractal Metaphors to Guide the Planning Process

A strand of literature focuses on the metaphoric application of fractal concepts to the planning process [122,123,124] and points to key applications that can lead to future research streams. These can be clustered as (1) fractals in the planning process, (2) fractal-orientated policies, and (3) fractal participation. A cluster of studies points to the contribution of complexity theory to the administrative organization of planning practice [125]. Planning governance naturally follows a nested and hierarchical structure, with governance structures following different scales such as neighborhood, city, regional, etc. At each scale, there is also a variety of scope or specializations, e.g., at the municipal scale: transportation planning, environmental planning, zoning, etc. Fractals, as a self-similar model of complex systems, provide an operational example of how scales in a system are proportionally aligned and connected to perform the system goal at the outcome level. The alliance and synergies of flow between these scales of planning intervention applied to individuals, groups, and institutions are argued to be keys to facilitating the emergence of high-level order in cities [125].
A clear metaphoric application of the fractal concept in planning practice can be found in a case study of solid waste management in the state of Kerala in India. Chettiparamb [125] contrasts the traditional process of waste reduction at different planning scales (household, neighborhood, and city) with an alternative management model based on fractal principles. A traditional model would apply the principles of “reduce, re-use, recycle” at the household level, and “transport and dispose of” at the neighborhood and city levels. In contrast, the municipality under study implemented a process of “reduce/reuse/recycle” at all three scales. These processes, however, are carried on with variations according to different contexts and capacities at each scale of the operation, creating a more effective waste management system. Similar case studies are described in detail in [126,127,128].

7. What Does the Literature on Fractals and Urban Planning Look Like?

Method and tools: To identify the corpus of academic literature on fractals and urban planning, we ran a synchronized search in three of the leading databases: Scopus, Web of Science, and Google Scholar. Analyzing the search retrieval with different variations of keywords led us to the following query that best fit the planning literature on fractals: journal articles with “fractal*” and either “urban” or “planning” and “land*” as author or index keyword without any time limits (i.e., (KEY (fractal* AND urban AND (planning OR land*)) AND (LIMIT-TO (SRCTYPE, “j”))). This query led to 428 results in Scopus (as of 10 January 2022). After considerable experimentation, we identified this query as the most effective to capture articles relevant to the aims of this paper in this literature. Comparing the query results of the three databases, the Scopus query covered every search result made available by the Web of Science and excluded non-relevant results listed by Google Scholar. Further, Scopus offers helpful bibliometric tools, including a direct connection to the SciVal analysis environment. Therefore, this paper uses the documents retrieved by Scopus (developed by Elsevier) as a solid basis for the bibliometric analysis to describe the domain and evolution of this highly interdisciplinary topic.
This bibliometric analysis supports this paper’s purpose to (1) provide planners with an overview of the application of fractals in their field and (2) explore the distributions of publications on this topic across disciplinary fields. With these goals in mind, we used SciVal and VOSviewer, two tools that can quickly and economically analyze and visualize the corpus of literature. SciVal is a web-based analytical tool that works hand-in-hand with Scopus to visualize research performance, key phrase analysis, and emerging trends [129]. We also used VOSviewer—a free desktop software to construct and visualize bibliometric networks developed by Eck and Waltman [130]—to map the publication landscape of our literature.

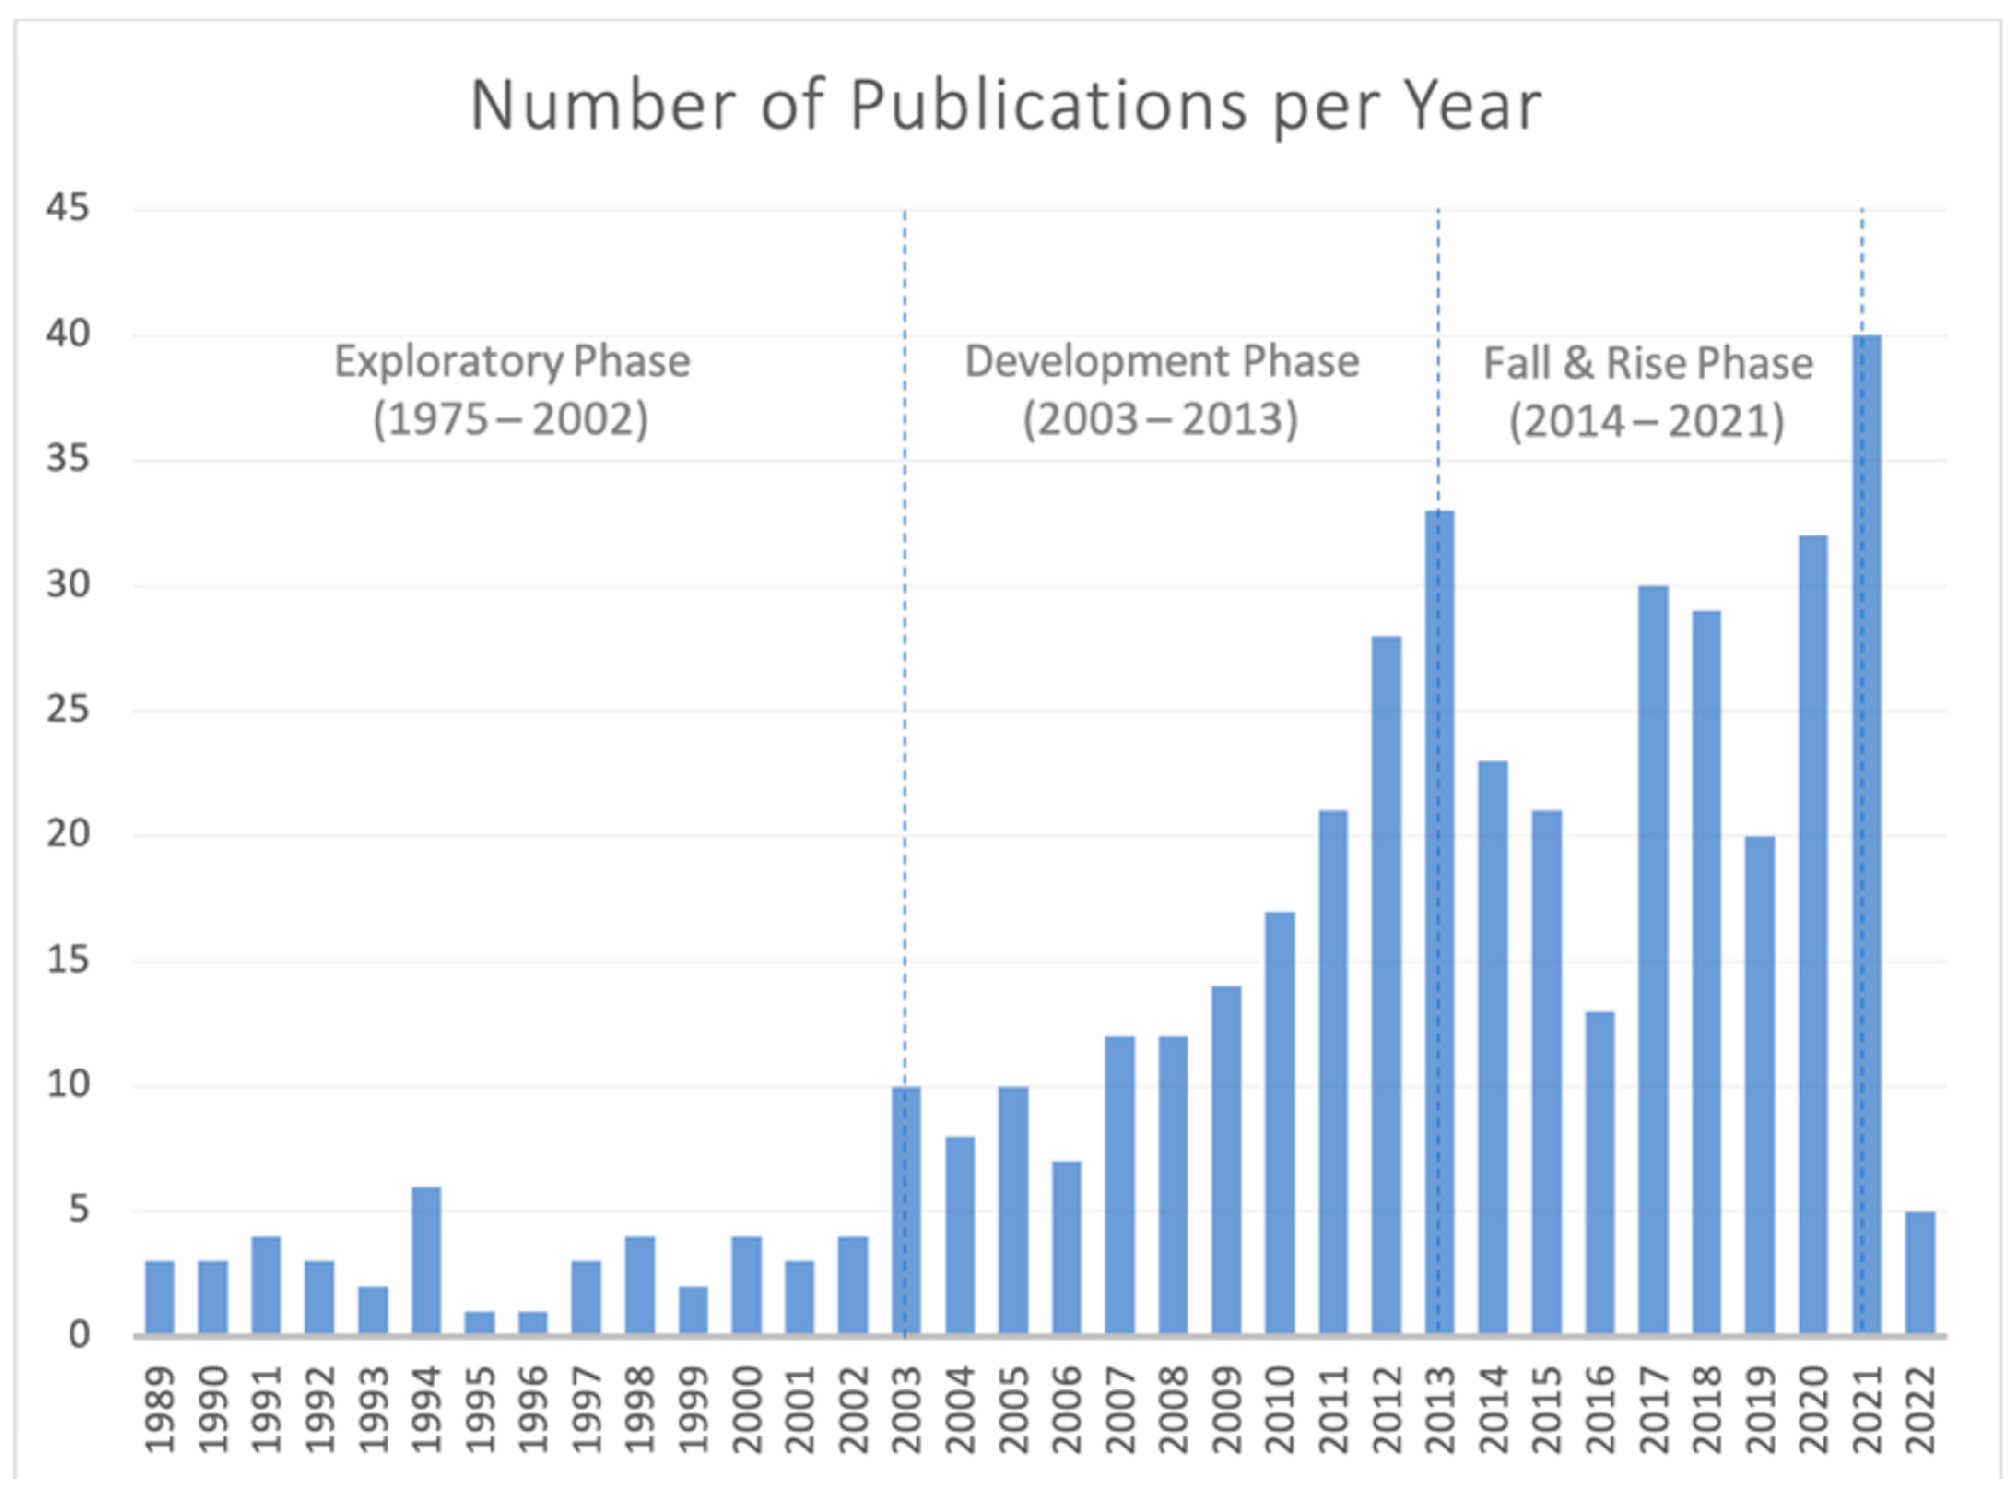
7.1. Publication History
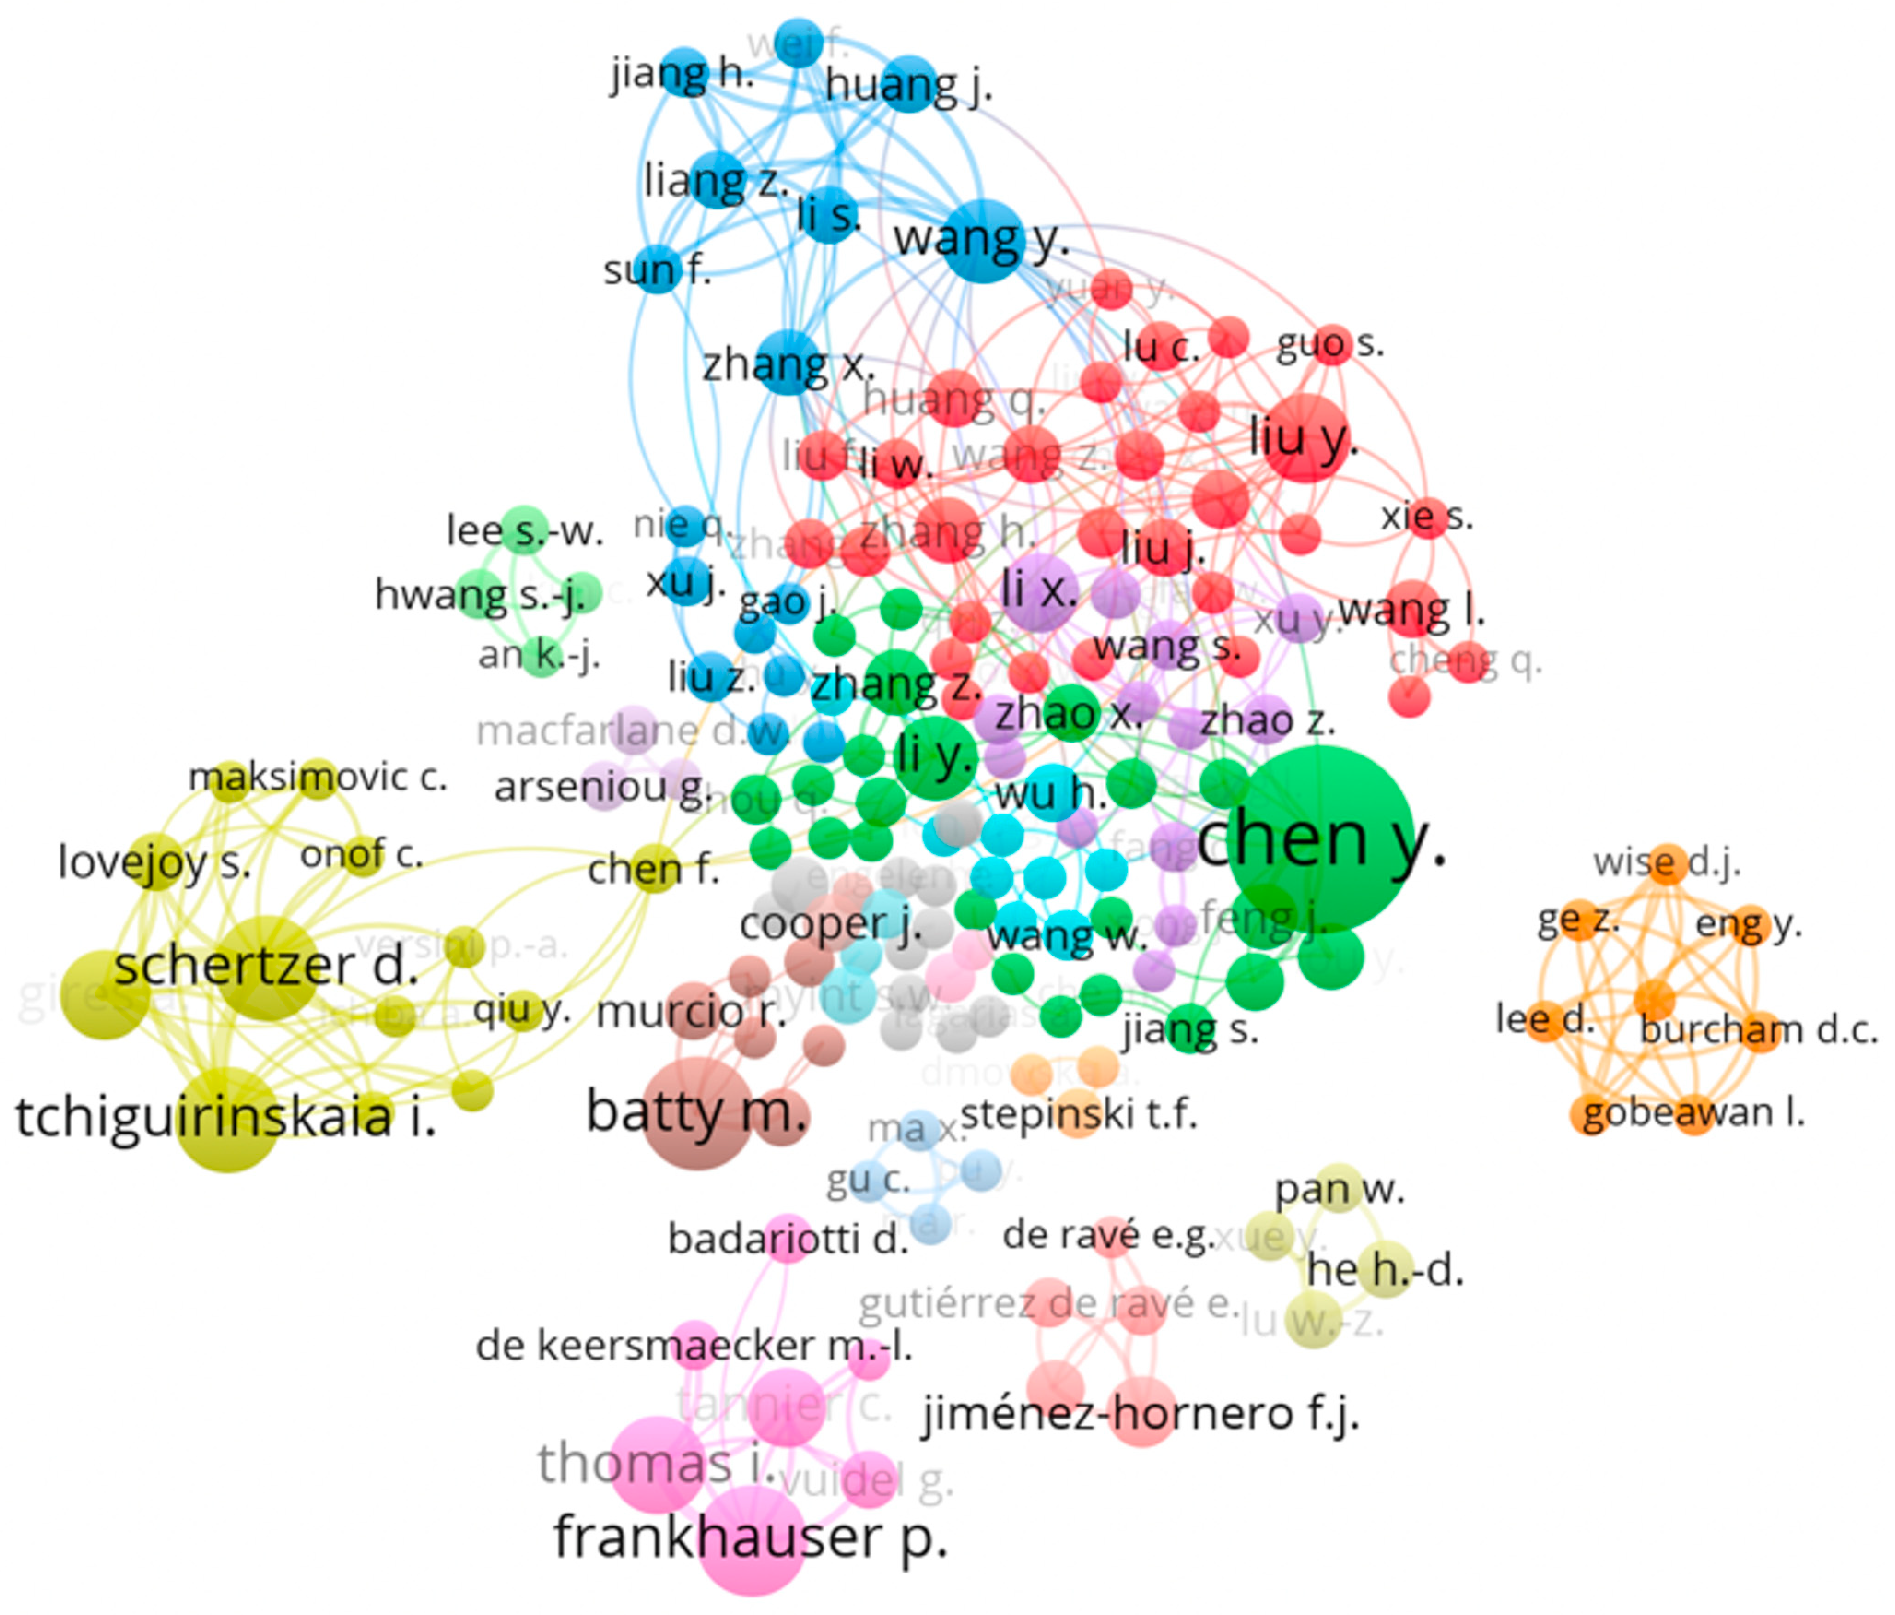
The literature appears to have evolved analyzing the number of publications per year for fractals in planning in three stages to date (Figure 5). We refer to the first stage, from 1987 (the earliest our database reaches) until 2002, as the “exploratory phase”, where the number of publications remained below five per year. The first article in this stage, “Urban Shapes as Fractals” was published by Batty and Longley [41] and initiated the use of fractal measurement to define the urban area of Cardiff through time. White and Engelen [6] provided key evidence that urban fractal form could be replicated using simulation modeling, whose decision rules mirrored the process of fractal formation. Next, analysis of the fractal dimension of transport networks in cities was established by Liu and Chen [131].
We label the stage from 2003 to 2013 the “development phase”, when the research in this field developed a deeper understanding of the concept and started to flourish, showing non-linear growth and expanding to different disciplinary areas. Most of the work in this period grew by and around a few pioneering scholars who mastered technical challenges and promoted new applications in urban planning [19,94,102,132,133].
From 2013 to 2021, as the publication rate seems to fluctuate, we label this era “the fall and rise phase”. While numbers of publications dropped off in some years, some deeper theoretical investigations have arisen. As a theoretical concept, fractals helped build the foundations of urban science [2] and their applications include GIS, urban growth simulation [134], urban design [9], climate change [135], and transportation [136].

7.2. Topic Analysis

Figure 6 illustrates the 50 most frequent important concepts, titled keyphrases in SciVal, which appeared in the literature published over 2011–2021. SciVal derives these key phrases through text mining and applying language processing techniques to identify the important phrases in the titles, abstracts, and author keywords in a publication set [138]. Positively trending concepts are shown in green, static in gray, and declining in blue; more prominent trends are larger. In this case, frequent concepts such as “fractal dimension”, “fractal analysis”, “multifractal”, and “urban form” suggest that applications of fractals in planning so far occur mainly in methodology and use fractal measurement to calculate fractal dimension as an indicator of urban form. Other trends include “landscape”, “road network”, “heat island”, “land use”, and “land cover”. Notably “land use planning” and “urban design” are both less prominent in the literature and declining.
Using Scopus’ own topic definitions, SciVal also analyses the topics that are included in our body of literature. A topic is defined as a new area of research identified by a dynamic collection of documents that focus on the same interest. Topics are ranked by Prominence, an indicator of the momentum of the field, using three metrics: citation count, view count, and average CiteScore in Scopus in two consecutive years [137]. In our search result, the topic of “City size distribution, Zipf’s law, and rank-size” dominates other topics by far, as visualized in the wheel chart in the yellow bubble in Figure 7, left. SciVal combines three metrics to indicate the momentum of the topics worldwide, and notably, this topic appears in the 93rd percentile by worldwide Topic Prominence (very high forward momentum). The top three topic clusters—frequent topics with strong citation links between them)—highlighted by SciVal in our database include: (1) Models; Social Networking (Online); Algorithms (92nd percentile); (2) Land Use; Models; Rural Areas (68th percentile); and (3) Climate Models; Models; Rainfall (99th percentile). These rankings suggest that despite the sparse distribution of topics covered by our publication set, a singular clustering direction seems to emerge slowly from multidisciplinary collaborations around modeling cities that target both social and environmental aspects of urban living. “Fractal” appears in this body of literature mainly as a tool for analyzing urban form and patterns.
What is remarkable to note in Figure 6, the left panel, is the profound concentration of literature on the right side of the circle where natural science is represented. This visual illustrates the extent to which this literature is dominated by computer, engineering, and environmental sciences and further highlights the paucity of exploration of links between human agency and urban form and of the planning application in this literature.

7.3. Journal Representations

Analysis shows that a total of 428 documents were published in 211 different journals, illustrating that publications on this topic are highly dispersed among disciplines. Although our search query is designed to be focused on fractal application in urban planning, only 68 (16%) are published in planning journals (according to the list provided by Stevens et al. [139]. The top 20 most frequent journals are listed in Table 2, with planning journals presented in bold. Table 3 summarizes how this proportion has in fact fallen over time, from 28% in 2002, to 18% in 2012, and 16% in 2022. For comparison and validation of the method, we have performed the same analysis for the broader topic of “urban models in planning” as well, acknowledging that many applications of fractal to planning involve modeling. In both topics, the results show rapid growth of the literature in general and a decline in the representation of the publications in planning journals in the last 20 years. This decline is steeper for the fractal topics in planning, suggesting potentially that technical language and approaches may create barriers. Whatever the underlying causes, it is our view that such bifurcation towards under-representation by planning journals disadvantages planners, as the field that is developing is mainly outside of their sight.
We further used VOSviewer to create a co-authorship map using our literature review documents. In Figure 8, only authors with more than three publications in the dataset are represented here (of the 994 authors, 97 meet this threshold) with bubbles proportionally sized to the number of their documents and links representing co-authorship. While the document shows closely connected and interspersed networks of Chinese authors, it also demonstrates the development of several quite independent authorship networks. While it is possible that these networks are closely connected through co-citation, the figure does suggest that concerted efforts to create cross-fertilization across these networks—and with leading planning authors—may be fruitful.

7.4. Gaps

We offer three summary points highlighting apparent gaps in disciplinary focus, thematic area, and interdisciplinary communication based on the bibliometric analysis presented above. First, topically, most of the work is identified as natural science, with minimal social science representation, but social science representation is needed. For instance, the leading topic, “city size distribution, Zipf’s law, and rank-size”, exists at the intersection of natural and social science, yet the “people” aspect of “people and places” as the fundamental building blocks of cities is missing. Second, based on text analysis of abstracts (Figure 5), there is generally little engagement with planning policy terms such as “zoning”, “bylaw”, or “policy”, indicating a departure of the direction of studies from mainstream planning vocabulary. This indeed is a self-reinforcing process as the lack of familiar language in fractal research leads to less work on how planning policy impacts the evolution of urban form and vice versa. Third, temporal analysis of literature indicates an increasing gap in the representation of this topic in planning journals. In an increasingly numbers-driven world, and the big data era, it is even more essential for planning journals to incorporate advancements in urban analytics and city science to equip planners with the newest quantitative techniques to tackle problems. In the final section, we suggest some ways to encourage communication and collaborations of scholars in the field that can bridge the language gap and pave the way for future research generations.

8. Discussion and Conclusions

In the last few decades, the fractal structure has been recognized as representing the geometry of many natural phenomena, leading to wide applications in reading imagery, geography, and medical science. In the urban planning context, fractal analysis has made diverse advancements in analyzing physical patterns, revealing underlying growth processes, developing urban simulation models, and guiding the planning process as we reviewed above. We suggest that fractal analysis can provide insights to urban scholars and planners in three areas:
  • As an explanatory theory, providing an understanding of urban form. Urban patterns (both built and socioeconomic) display fractal properties of self-similarity and hierarchy. Different fractal signatures may be associated with different urban development processes/developmental stages, and this association can be used to categorize urban landscapes. Fractal-based models that can simulate urban growth/development can be developed to improve understanding of (1) underlying processes generating the patterns observed and (2) examine ‘what if’ scenarios for urban policymaking.
  • As a metric for guiding urban planning and evaluating outcomes. When combined with other metrics and an understanding of the urban context, fractal dimension can reflect human well-being outcomes and urban aesthetics, and fractal values between a certain range may be more functional or desirable.
  • As a metaphor/framework for developing more effective urban policies; because fractals are self-similar systems that are aligned at multiple scales to achieve a system goal, they can be a useful model or metaphor for urban governance.
However, our overview makes clear that additional research is needed to understand both the positive (what is) and normative (what should be) relationships between planning policies and fractal dimension. More specifically, the role of fractals in planning theory is still not fully established, in contrast to their role in landscape ecology theory (where they reflect processes of landscape fragmentation and biodiversity changes) and in urban growth theories (where they complement agglomerative central place theories by reflecting the influence of dispersive forces).
As these theories develop, we argue that consideration of fractal processes and their resulting patterns should play a role in planning, not only for new developments but in guiding continuing development of urban areas where the planner inherits a legacy of previous planning regimes and their resulting built forms. Certainly, as an ideal, a planner may have the most influence when establishing initial conditions for development on new development sites where they start with a blank canvas. However, even then fractal theories should encourage planners to see their role as guiding, rather than mandating, development patterns, acknowledging the incremental nature of fractal urban growth processes. As such, fractal principles argue against urban designs and planning interventions that impose pre-defined and large-scale blueprints of forms.
These principles are in line with planning theories that acknowledge complexity and holism, such as those pioneered by Alexander [140] and Jane Jacobs [141], and in contrast with simplicity and reductionism ideas such as Garden City, City Beautiful, and Modern Movement practiced by Rational Planning regimes [11]. However, these theories, likely due to the era in which they were developed, do not explicitly acknowledge and discuss fractals and other mathematical aspects of complex systems.
To date, there is no easy answer to how a new subdivision should be planned in a fractal structure, or how a new city should be best laid out to allow it to grow to a best-functioning fractal dimension. However, complex systems viewpoints suggest that small-scale interventions in the form of decision-support to people, groups, and organizations can help to achieve positive large-scale results. Complex systems theories and tools can thus be harnessed to help planners and stakeholders navigate and find solutions to “wicked” problems by expanding and enhancing the role of communicative planning [4]. The appropriate role of planners may be more in stakeholder guidance and, where appropriate, constraint, rather than in direct design. We see fractals as supporting the communicative planning process through the development of a deeper understanding of the order in inherent irregular urban patterns and how and whether this order represents good urban form.
Although in theory fractals have provided important insights in the field of planning, our bibliometric analysis show that the applications are very dispersed and increasingly moving out of sight of planning practice. Among many possible causes are that most authors of such articles are specialized in other fields; planning journals are reluctant to publish works on fractal topics; or most likely, the high mathematical requirements for fractal analysis [142]. If the technical language and jargon associated with fractals is one barrier to its applications in planning, this review seeks to tackle it by providing urban scholars with a primer that helps them to employ fractal tools to their advantage. Although not completely identical, studying fractals—or the natural geometry of cities—might be as applicable to “the planning problem” as researching the wing design of birds is to “the flying problem”.

Author Contributions

Conceptualization, F.J. and D.C.P.; methodology, F.J.; software, F.J.; formal analysis, F.J. and D.C.P.; resources, D.C.P.; writing—original draft preparation, F.J.; writing—review and editing, D.C.P.; visualization, F.J.; supervision, D.C.P.; funding acquisition, D.C.P. All authors have read and agreed to the published version of the manuscript.

Funding

Funding support from the Canadian Social Science and Humanities Research Council (grants 435-2012-1697 and 890-2013-0034 to D.C. Parker) and from the Waterloo Institute for Complexity and Innovation to F.J. is gratefully acknowledged.

Data Availability Statement

We have provided all information needed to replicate our bibliometrics analysis.

Acknowledgments

We thank members of D.C. Parker’s Urban Growth and Change research group (Hazem Ahmed, Yuanqui Feng, and Alex Petric) as well as Pierre Filion and Janice Barry for helpful feedback on the manuscript drafts.

Conflicts of Interest

The authors declare no conflict of interest.

References

  1. Rosenzweig, C.; Solokei, W.; Romero-Lankao, P.; Mehrota, S.; Dhakal, S.; Ibraham, S.A. Urban Climate Science; Climate Change and Cities, Second Assessment Report of the Urban Climate Change Research; Cambridge University Press: New York, NY, USA, 2018. [Google Scholar]
  2. Bettencourt, L.M.A. Introduction to Urban Science: Evidence and Theory of Cities as Complex Systems. Introd. Urban Sci. 2021. [Google Scholar] [CrossRef]
  3. Meyfroidt, P.; de Bremond, A.; Ryan, C.M.; Archer, E.; Aspinall, R.; Chhabra, A.; Camara, G.; Corbera, E.; De Fries, R.; Díaz, S.; et al. Ten facts about land systems for sustainability. Proc. Natl. Acad. Sci. USA 2022, 119, 7. [Google Scholar] [CrossRef] [PubMed]
  4. Zellner, M.; Campbell, S.D. Planning for deep-rooted problems: What can we learn from aligning complex systems and wicked problems? Plan. Theory Pract. 2015, 16, 457–478. [Google Scholar] [CrossRef]
  5. Batty, M.; Xie, Y. Preliminary Evidence for a Theory of the Fractal City. Environ. Plan. A Econ. Space 1996, 28, 1745–1762. [Google Scholar] [CrossRef]
  6. White, R.; Engelen, G. Cellular Automata and Fractal Urban Form: A Cellular Modelling Approach to the Evolution of Urban Land-Use Patterns. Environ. Plan. A Econ. Space 1993, 25, 1175–1199. [Google Scholar] [CrossRef] [Green Version]
  7. Batty, M.; Longley, P. The fractal city. Archit. Des. 1997, 129, 74–83. [Google Scholar]
  8. Chen, Y. A set of formulae on fractal dimension relations and its application to urban form. Chaos Solitons Fractals 2013, 54, 150–158. [Google Scholar] [CrossRef] [Green Version]
  9. Boeing, G. Measuring the complexity of urban form and design. Urban Des. Int. 2018, 23, 281–292. [Google Scholar] [CrossRef] [Green Version]
  10. Mandelbrot, B.B. Is nature fractal? Science 1998, 279, 783–786. [Google Scholar] [CrossRef]
  11. Batty, M.; Longley, P.A. Fractal Cities: A Geometry of Form and Function; Academic Press Inc.: San Diego, CA, USA, 1994; p. 394. [Google Scholar]
  12. Parker, D.C.; Tolmie, S.; Euerby, A.; Jahanmiri, F.; Mansell, N.; Mansell, D. Canada. In Dancing the Math of Complex Systems: An Introduction to Complexity, Emergence, and Fractals; University of Waterloo Bridges Lecture Series; St. Jermone’s College: Waterloo, ON, Canada, 2015; Available online: https://www.youtube.com/watch?v=bWWJXreuA2w (accessed on 6 February 2022).
  13. Jin, Y.; Wu, Y.; Li, H.; Zhao, M.; Pan, J. Definition of fractal topography to essential understanding of scale-invariance. Sci. Rep. 2017, 7, 46672. [Google Scholar] [CrossRef] [Green Version]
  14. Jahanmiri, F. Making sense of the fractal urban form and function: An agent-based modeling approach. In Making Sense of the Fractal Urban Form and Function: An Agent-Based Modeling Approach; University of Waterloo: Waterloo, ON, Canada, 2015. [Google Scholar]
  15. Stumpf, M.P.H.; Porter, M.A. Critical Truths About Power Laws. Science 2012, 335, 665–666. [Google Scholar] [CrossRef] [PubMed]
  16. Chen, Y.; Wang, J. Multifractal characterization of urban form and growth: The case of Beijing. Environ. Plan. B Plan. Des. 2013, 40, 884–904. [Google Scholar] [CrossRef]
  17. Soille, P.; Rivest, J.-F. On the Validity of Fractal Dimension Measurements in Image Analysis. J. Vis. Commun. Image Represent. 1996, 7, 217–229. [Google Scholar] [CrossRef]
  18. Thomas, I.; Frankhauser, P.; Biernacki, C. The morphology of built-up landscapes in Wallonia (Belgium): A classification using fractal indices. Landsc. Urban Plan. 2008, 84, 99–115. [Google Scholar] [CrossRef]
  19. Thomas, I.; Frankhauser, P.; Frenay, B.; Verleysen, M. Clustering Patterns of Urban Built-up Areas with Curves of Fractal Scaling Behaviour. Environ. Plan. B Plan. Des. 2010, 37, 942–954. [Google Scholar] [CrossRef]
  20. Herold, M.; Scepan, J.; Clarke, K.C. The Use of Remote Sensing and Landscape Metrics to Describe Structures and Changes in Urban Land Uses. Environ. Plan. A Econ. Space 2002, 34, 1443–1458. [Google Scholar] [CrossRef] [Green Version]
  21. Lemoy, R.; Caruso, G. Evidence for the homothetic scaling of urban forms. Environ. Plan. B Urban Anal. City Sci. 2018, 47, 870–888. [Google Scholar] [CrossRef]
  22. Li, Y.; Rybski, D.; Kropp, J.P. Singularity cities. Environ. Plan. B Urban Anal. City Sci. 2019, 48, 43–59. [Google Scholar] [CrossRef]
  23. Chen, Y. Fractal analytical approach of urban form based on spatial correlation function. Chaos Solitons Fractals 2013, 49, 47–60. [Google Scholar] [CrossRef] [Green Version]
  24. Chen, Y. Normalizing and classifying shape indexes of cities by ideas from fractals. Chaos Solitons Fractals 2021, 154, 111653. [Google Scholar] [CrossRef]
  25. Batty, M. Cellular Automata and Urban Form: A Primer. J. Am. Plan. Assoc. 1997, 63, 266–274. [Google Scholar] [CrossRef]
  26. Fialkowski, M.; Bitner, A. Universal rules for fragmentation of land by humans. Landsc. Ecol. 2008, 23, 1013–1022. [Google Scholar] [CrossRef]
  27. Batty, M.; Carvalho, R.; Hudson-Smith, A.; Milton, R.; Smith, D.; Steadman, P. Scaling and allometry in the building geometries of Greater London. Eur. Phys. J. B 2008, 63, 303–314. [Google Scholar] [CrossRef]
  28. Batty, M. Building a science of cities. Cities 2012, 29, S9–S16. [Google Scholar] [CrossRef] [Green Version]
  29. Ma, Q.; Wu, J.; He, C.; Hu, G. Spatial scaling of urban impervious surfaces across evolving landscapes: From cities to urban regions. Landsc. Urban Plan. 2018, 175, 50–61. [Google Scholar] [CrossRef]
  30. Wang, H.; Luo, S.; Luo, T. Fractal characteristics of urban surface transit and road networks: Case study of Strasbourg, France. Adv. Mech. Eng. 2017, 9, 1687814017692289. [Google Scholar] [CrossRef] [Green Version]
  31. Umemoto, D.; Ito, N. Power-law distribution found in city-scale traffic flow simulation. J. Phys. Conf. Ser. 2021, 2122, 012006. [Google Scholar] [CrossRef]
  32. Figure 4, Schwarzplan.eu © OpenStreetMap Contributors. Available online: https://schwarzplan.eu/lizenzbestimmungen-copyright/ (accessed on 3 February 2022).
  33. Greig, J. Sierpinski Carpet. Available online: https://commons.wikimedia.org/wiki/File:Sierpinski_carpet.png (accessed on 3 February 2022).
  34. Martínez, F. Cities’ power laws: The stochastic scaling factor. Environ. Plan. B Plan. Des. 2015, 43, 257–275. [Google Scholar] [CrossRef]
  35. Clauset, A.; Shalizi, C.R.; Newman, M.E.J. Power-Law Distributions in Empirical Data. SIAM Rev. 2009, 51, 661–703. [Google Scholar] [CrossRef] [Green Version]
  36. Weng, Y.-C.; Chang, N.-B.; Lee, T. Nonlinear time series analysis of ground-level ozone dynamics in Southern Taiwan. J. Environ. Manag. 2008, 87, 405–414. [Google Scholar] [CrossRef]
  37. Packard, N.H.; Crutchfield, J.P.; Farmer, J.D.; Shaw, R.S. Geometry from a Time Series. Phys. Rev. Lett. 1980, 45, 712–716. [Google Scholar] [CrossRef]
  38. Kim, J.S.; Goh, K.-I.; Salvi, G.; Oh, E.; Kahng, B.; Kim, D. Fractality in complex networks: Critical and supercritical skeletons. Phys. Rev. E 2007, 75, 016110. [Google Scholar] [CrossRef] [PubMed] [Green Version]
  39. Padua, R.N.; Borres, M.S. University of San Jose-Recoletos From Fractal Geometry to Statistical Fractal. Recoletos Multidiscip. Res. J. 2013, 1, 73–80. [Google Scholar] [CrossRef]
  40. Akkerman, A. Fuzzy targeting of population niches in urban planning and the fractal dimension of demographic change. Urban Stud. 1992, 29, 1093–1113. [Google Scholar] [CrossRef]
  41. Batty, M.; Longley, P.A. Urban shapes as fractals (Cardiff). Area 1987, 19, 215–221. [Google Scholar] [CrossRef]
  42. Zhou, W.-X.; Sornette, D.; Hill, R.; Dunbar, R.I.M. Discrete hierarchical organization of social group sizes. Proc. R. Soc. B Boil. Sci. 2005, 272, 439–444. [Google Scholar] [CrossRef] [Green Version]
  43. Fuchs, B.; Sornette, D.; Thurner, S. Fractal multi-level organisation of human groups in a virtual world. Sci. Rep. 2014, 4, 6526. [Google Scholar] [CrossRef] [Green Version]
  44. Brelsford, C.; Lobo, J.; Hand, J.; Bettencourt, L.M.A. Heterogeneity and scale of sustainable development in cities. Proc. Natl. Acad. Sci. USA 2017, 114, 8963–8968. [Google Scholar] [CrossRef] [Green Version]
  45. Axtell, R.L. Zipf Distribution of U.S. Firm Sizes. Science 2001, 293, 1818–1820. [Google Scholar] [CrossRef] [Green Version]
  46. Aoyama, H.; Yoshikawa, H.; Iyetomi, H.; Fujiwara, Y. Labour productivity superstatistics. Prog. Theor. Phys. Suppl. 2009, 179, 80–92. [Google Scholar] [CrossRef] [Green Version]
  47. Hu, S.; Cheng, Q.; Wang, L.; Xu, D. Modeling land price distribution using multifractal IDW interpolation and fractal filtering method. Landsc. Urban Plan. 2013, 110, 25–35. [Google Scholar] [CrossRef]
  48. Muchnik, L.; Pei, S.; Parra, L.C.; Reis, S.D.S.; Andrade, J.S., Jr.; Havlin, S.; Makse, H.A. Origins of power-law degree distribution in the heterogeneity of human activity in social networks. Sci. Rep. 2013, 3, 1783. [Google Scholar] [CrossRef] [Green Version]
  49. Beare, B.K.; Toda, A.A. On the emergence of a power law in the distribution of COVID-19 cases. Phys. D Nonlinear Phenom. 2020, 412, 132649. [Google Scholar] [CrossRef] [PubMed]
  50. Sarkar, S.; Phibbs, P.; Simpson, R.; Wasnik, S. The scaling of income distribution in Australia: Possible relationships between urban allometry, city size, and economic inequality. Environ. Plan. B Urban Anal. City Sci. 2016, 45, 603–622. [Google Scholar] [CrossRef] [Green Version]
  51. Gunz, H.P.; Lichten, B.M.B.; Long, R.G. Self-Organization in Career Systems: A View from Complexity Science. Management 2002, 5, 63–88. [Google Scholar] [CrossRef] [Green Version]
  52. Batty, M. The Size, Scale, and Shape of Cities. Science 2008, 319, 769–771. [Google Scholar] [CrossRef] [PubMed] [Green Version]
  53. Samaniego, H.; Moses, M.E. Cities as organisms: Allometric scaling of urban road networks. JSTOR 2008, 1, 21–39. Available online: https://www.jstor.org/stable/26201607 (accessed on 6 February 2022). [CrossRef] [Green Version]
  54. Shpuza, E. Allometry in the Syntax of Street Networks: Evolution of Adriatic and Ionian Coastal Cities 1800–2010. Environ. Plan. B Plan. Des. 2014, 41, 450–471. [Google Scholar] [CrossRef]
  55. Yu, X.; Zhao, Z. Fractal Characteristic Evolution of Coastal Settlement Land Use: A Case of Xiamen, China. Land 2021, 11, 50. [Google Scholar] [CrossRef]
  56. Andersson, C.; Rasmussen, S.; White, R. Urban Settlement Transitions. Environ. Plan. B Plan. Des. 2002, 29, 841–865. [Google Scholar] [CrossRef]
  57. Batty, M.; Longley, P.; Fotheringham, S. Urban Growth and Form: Scaling, Fractal Geometry, and Diffusion-Limited Aggregation. Environ. Plan. A Econ. Space 1989, 21, 1447–1472. [Google Scholar] [CrossRef]
  58. Sander, L.M. Diffusion-limited aggregation: A kinetic critical phenomenon? Contemp. Phys. 2000, 41, 203–218. [Google Scholar] [CrossRef]
  59. Yeh, A.G.-O.; Li, X. A Constrained CA Model for the Simulation and Planning of Sustainable Urban Forms by Using GIS. Environ. Plan. B Plan. Des. 2001, 28, 733–753. [Google Scholar] [CrossRef] [Green Version]
  60. Liu, C.L.; Duan, D.-Z. Spatial Growth of Urban-Rural Road Network in Wuhan Metropolitan Area Based on Fractal Theory. J. Transp. Syst. Eng. Inf. Technol. 2013, 13, 185–193. [Google Scholar]
  61. Makse, H.A.; Havlin, S.; Stanley, H.E. Modelling urban growth patterns. Nature 1995, 377, 608–612. [Google Scholar] [CrossRef]
  62. Geoff Kimm, S.J.K.; Alhadidi, S. Generative Architecture in Dla Space. In Proceedings of the 20th International Conference on Computer-Aided Architectural Design Research in Asia (CAADRIA 2015), Emerging Experiences in The Past, Present and Future of Digital Architecture, Daegu, Korea, 20–22 May 2015; pp. 189–198. [Google Scholar]
  63. van Vliet, J.; Hurkens, J.; White, R.; van Delden, H. An Activity-Based Cellular Automaton Model to Simulate Land-Use Dynamics. Environ. Plan. B Plan. Des. 2012, 39, 198–212. [Google Scholar] [CrossRef]
  64. Batty, M. Cities as fractals: Simulating growth and form. In Fractals and Chaos; Springer: New York, NY, USA, 1991; pp. 43–69. [Google Scholar]
  65. Clarke, K.C.; Gaydos, L.J. Loose-coupling. A cellular automaton model and GIS: Long-term urban growth prediction for San Francisco and Washington/Baltimore. Int. J. Geogr. Inf. Sci. 1998, 1, 699–714. [Google Scholar] [CrossRef] [Green Version]
  66. Portugali, J.; Meyer, H.; Stolk, E.; Tan, E. (Eds.) Complexity Theories of Cities Have Come of Age: An Overview with Implications to urban Planning and Design; Springer: Berlin/Heidelberg, Germany; Dordrecht, The Netherlands; London, UK; New York, NY, USA, 2012. [Google Scholar]
  67. Frankhauser, P.; Sadler, R. Fractal analysis of agglomerations. In Natural Structures: Principles, Strategies, and Models in Architecture and Nature; University of Stuttgart: Stuttgart, Germany, 1991; pp. 57–65. [Google Scholar]
  68. Lin, J.; Huang, B.; Chen, M.; Huang, Z. Modeling urban vertical growth using cellular automata—Guangzhou as a case study. Appl. Geogr. 2014, 53, 172–186. [Google Scholar] [CrossRef]
  69. Caruso, G.; Rounsevell, M.; Cojocaru, G. Exploring a spatio-dynamic neighbourhood-based model of residential behaviour in the Brussels periurban area. Int. J. Geogr. Inf. Sci. 2005, 19, 103–123. [Google Scholar] [CrossRef]
  70. Barredo, J.I.; Kasanko, M.; McCormick, N.; Lavalle, C. Modelling dynamic spatial processes: Simulation of urban future scenarios through cellular automata. Landsc. Urban Plan. 2003, 64, 145–160. [Google Scholar] [CrossRef]
  71. van Vliet, J.; White, R.; Dragicevic, S. Modeling urban growth using a variable grid cellular automaton. Comput. Environ. Urban Syst. 2009, 33, 35–43. [Google Scholar] [CrossRef]
  72. Parker, D.C.; Meretsky, V. Measuring pattern outcomes in an agent-based model of edge-effect externalities using spatial metrics. Agric. Ecosyst. Environ. 2004, 101, 233–250. [Google Scholar] [CrossRef]
  73. Langton, C.G. Computation at the edge of chaos: Phase transitions and emergent computation. Phys. D Nonlinear Phenom. 1990, 1, 12–37. [Google Scholar] [CrossRef] [Green Version]
  74. Crooks, A.; Heppenstall, A.; Malleson, N.; Manley, E. Agent-based modeling and the city: A gallery of applications. In Urban Informatics; Springer: Singapore, 2021; pp. 885–910. [Google Scholar]
  75. Barabási, A.-L.; Albert, R. Emergence of scaling in random networks. Science 1999, 286, 509–512. Available online: https://arxiv.org/pdf/cond-mat/9910332.pdf%3Forigin%3Dpublication_detail (accessed on 30 October 2017). [CrossRef] [Green Version]
  76. Axtell, R. The Emergence of Firms in a Population of Agents: Local Increasing Returns, Unstable Nash Equilibria, And Power Law Size Distributions; Working paper no. 3; Brookings Institution: Washington, DC, USA, 1999; Available online: https://www.brookings.edu/wp-content/uploads/2016/06/firms.pdf (accessed on 30 October 2017).
  77. Shi, W.; Goodchild, M.F.; Batty, M.; Kwan, M.-P.; Zhang, A. Urban Informatics; Springer: Singapore, 2021. [Google Scholar] [CrossRef]
  78. Batty, M.; Milton, R. A new framework for very large-scale urban modelling. Urban Stud. 2021, 58, 3071–3094. [Google Scholar] [CrossRef]
  79. Batty, M.; Kim, K.S. Form Follows Function: Reformulating Urban Population Density Functions. Urban Stud. 1992, 29, 1043–1069. [Google Scholar] [CrossRef]
  80. Longley, P.A.; Mesev, V. Measurement of density gradients and space-filling in urban systems. Pap. Reg. Sci. 2002, 81, 1–28. [Google Scholar] [CrossRef]
  81. Thomas, I.; Frankhauser, P.; De Keersmaecker, M.-L. Fractal dimension versus density of built-up surfaces in the periphery of Brussels. Pap. Reg. Sci. 2007, 86, 287–308. [Google Scholar] [CrossRef]
  82. Filion, P.; McSpurren, K.; Appleby, B. Wasted Density? The Impact of Toronto’s Residential-Density-Distribution Policies on Public-Transit Use and Walking. Environ. Plan. A Econ. Space 2006, 38, 1367–1392. [Google Scholar] [CrossRef] [Green Version]
  83. Chen, Y. A new model of urban population density indicating latent fractal structure. Int. J. Urban Sustain. Dev. 2010, 1, 89–110. [Google Scholar] [CrossRef] [Green Version]
  84. Filion, P.; Bunting, T.; Pavlic, D.; Langlois, P. Intensification and Sprawl: Residential Density Trajectories in Canada’s Largest Metropolitan Regions. Urban Geogr. 2010, 31, 541–569. [Google Scholar] [CrossRef]
  85. Chen, Y.; Feng, J. Fractal-based exponential distribution of urban density and self-affine fractal forms of cities. Chaos Solitons Fractals 2012, 45, 1404–1416. [Google Scholar] [CrossRef] [Green Version]
  86. Csikós, N.; Szilassi, P. Modelling the Impacts of Habitat Changes on the Population Density of Eurasian Skylark (Alauda arvensis) Based on Its Landscape Preferences. Land 2021, 10, 306. [Google Scholar] [CrossRef]
  87. Newton, P.; Glackin, S.; Witheridge, J.; Garner, L. Beyond small lot subdivision: Towards municipality-initiated and resident-supported precinct scale medium density residential infill regeneration in greyfield suburbs. Beyond Small Lot Subdivision: Towards Municipality-initiated and Resident-supported Precinct-Scale Medium-Density Residential Infill Regeneration in Greyfield Suburbs. Urban Policy Res. 2020, 38, 338–356. [Google Scholar] [CrossRef]
  88. Marat-Mendes, T.; de Sampayo, M.T.; Rodrigues, D. Measuring Lisbon patterns: Baixa from 1650 to 2010. Nexus Netw. J. 2011, 13, 351–372. [Google Scholar] [CrossRef] [Green Version]
  89. Tannier, C.; Pumain, D. Fractals in urban geography: A theoretical outline and an empirical example. Cybergeo 2005, 2005. [Google Scholar] [CrossRef]
  90. Fang, G.; Zhang, Y.; Yang, J. Evolution of Urban Landscape Pattern in Suzhou City during 1987–2009. Appl. Mech. Mater. 2012, 178–181, 332–336. [Google Scholar] [CrossRef]
  91. Feng, J.; Chen, Y. Spatiotemporal Evolution of Urban Form and Land-Use Structure in Hangzhou, China: Evidence from Fractals. Environ. Plan. B Plan. Des. 2010, 37, 838–856. [Google Scholar] [CrossRef]
  92. Encarnação, S.; Gaudiano, M.; Santos, F.C.; Tenedório, J.A.; Pacheco, J.M. Fractal cartography of urban areas. Sci. Rep. 2012, 2, 527. [Google Scholar] [CrossRef] [Green Version]
  93. Chen, Y.; Feng, J. A Hierarchical Allometric Scaling Analysis of Chinese Cities: 1991–2014. Discret. Dyn. Nat. Soc. 2017, 2017, 5243287. [Google Scholar] [CrossRef]
  94. Chen, Y.; Zhou, Y. The Rank-Size Rule and Fractal Hierarchies of Cities: Mathematical Models and Empirical Analyses. Environ. Plan. B Plan. Des. 2003, 30, 799–818. [Google Scholar] [CrossRef]
  95. McLeod, S.; Scheurer, J.; Curtis, C. Urban Public Transport. J. Plan. Lit. 2017, 32, 223–239. [Google Scholar] [CrossRef]
  96. Handy, S. Smart Growth and the Transportation-Land Use Connection: What Does the Research Tell Us? Int. Reg. Sci. Rev. 2005, 28, 146–167. [Google Scholar] [CrossRef]
  97. Benguigui, L. A Fractal Analysis of the Public Transportation System of Paris. Environ. Plan. A Econ. Space 1995, 27, 1147–1161. [Google Scholar] [CrossRef]
  98. Lu, Y.; Tang, J. Fractal Dimension of a Transportation Network and its Relationship with Urban Growth: A Study of the Dallas-Fort Worth Area. Environ. Plan. B Plan. Des. 2016, 31, 895–911. [Google Scholar] [CrossRef] [Green Version]
  99. Sahitya, K.S.; Prasad, C. Fractal modelling of an urban road network using Geographical Information Systems (GIS). World Rev. Intermodal Transp. Res. 2020, 9, 376–392. [Google Scholar] [CrossRef]
  100. Rydin, Y.; Bleahu, A.; Davies, M.; Dávila, J.D.; Friel, S.; De Grandis, G.; Groce, N.; Hallal, P.C.; Hamilton, I.; Howden-Chapman, P.; et al. Shaping cities for health: Complexity and the planning of urban environments in the 21st century. Lancet 2012, 379, 2079–2108. [Google Scholar] [CrossRef] [Green Version]
  101. Wang, H.; Su, X.; Wang, C.; Dong, R. Fractal analysis of urban form as a tool for improving environmental quality. Int. J. Sustain. Dev. World Ecol. 2011, 18, 548–552. [Google Scholar] [CrossRef]
  102. Thomas, I.; Tannier, C.; Frankhauser, P. Is there a link between fractal dimension and residential environment at a regional level? Cybergeo 2008, 413, 24. [Google Scholar] [CrossRef]
  103. Hepcan, C.C. Quantifying landscape pattern and connectivity in a Mediterranean coastal settlement: The case of the Urla district, Turkey. Environ. Monit. Assess. 2012, 185, 143–155. [Google Scholar] [CrossRef]
  104. Konijnendijk, C. The 3-30-300 Rule for Urban Forestry and Greener Cities. Biophilic Cities J. 2021. Available online: https://static1.squarespace.com/static/5bbd32d6e66669016a6af7e2/t/6101ce2b17dc51553827d644/1627508274716/330300+Rule+Preprint_7-29-21.pdf (accessed on 2 February 2022).
  105. Spehar, B.; Taylor, R.P. Fractals in art and nature: Why do we like them? Hum. Vis. Electron. Imaging XVIII 2013, 8651, 865118. [Google Scholar] [CrossRef]
  106. Nagy, D.; Villaggi, L.; Benjamin, D. Generative Urban Design: Integrating Financial and Energy Goals for Automated Neighborhood Layout. Proc. Symp. Archit. Urban Des. 2018, 25, 1–8. [Google Scholar] [CrossRef]
  107. Milne, B.T. The utility of fractal geometry in landscape design. Landsc. Urban Plan. 1991, 21, 81–90. [Google Scholar] [CrossRef]
  108. Jevrić, M.; Knežević, M.; Kalezić, J.; Kopitović-Vuković, N.; Ćipranić, I. Application of fractal geometry in urban pattern design. Teh. Vjesn. Tech. Gaz. 2014, 21, 873–879. [Google Scholar]
  109. Wang, X.; Song, Y.; Tang, P. Generative urban design using shape grammar and block morphological analysis. Front. Arch. Res. 2020, 9, 914–924. [Google Scholar] [CrossRef]
  110. Wilson, L.; Danforth, J.; Davila, C.C.; Harvey, D. How to Generate a Thousand Master Plans: A Framework for Computational Urban Design. In Proceedings of the 10th Symposium on Simulation for Architecture and Urban Design SimAUD, Atlanta, GA, USA, 7–9 April 2019. [Google Scholar]
  111. Liang, J.; Hu, Y.; Sun, H. The Design Evaluation of the Green Space Layout of Urban Squares Based on Fractal Theory. Nexus Netw. J. 2012, 15, 33–49. [Google Scholar] [CrossRef] [Green Version]
  112. Ahern, J. Urban landscape sustainability and resilience: The promise and challenges of integrating ecology with urban planning and design. Landsc. Ecol. 2012, 28, 1203–1212. [Google Scholar] [CrossRef]
  113. Yanyan, W.; Jiejun, H.; Yunjun, Z.; Yanbin, Y.; Fawang, Y. Analysis of Yiwu Urban Expansion and Spatial Morphologic Changes Based on Fractal and RS. In Proceedings of the 2008 International Symposium on Computational Intelligence and Design, Wuhan, China, 17–18 October 2008; Volume 2, pp. 203–206. [Google Scholar] [CrossRef]
  114. Taylor, R.P.; Spehar, B.; Van Donkelaar, P.; Hagerhall, C.M. Perceptual and Physiological Responses to Jackson Pollock’s Fractals. Front. Hum. Neurosci. 2011, 5, 60. [Google Scholar] [CrossRef] [Green Version]
  115. Cooper, J.; Watkinson, D.; Oskrochi, R. Fractal analysis and perception of visual quality in everyday street vistas. Environ. Plan. B 2010, 37, 808–822. Available online: https://www.researchgate.net/profile/Jon_Cooper2/publication/227472693_Fractal_analysis_and_perception_of_visual_quality_in_everyday_street_vistas/links/00b7d529884cc7c1a3000000.pdf (accessed on 30 October 2017). [CrossRef]
  116. Cooper, J.; Su, M.-L.; Oskrochi, R. The Influence of Fractal Dimension and Vegetation on the Perceptions of Streetscape Quality in Taipei: With Comparative Comments Made in Relation to Two British Case Studies. Environ. Plan. B Plan. Des. 2013, 40, 43–62. [Google Scholar] [CrossRef]
  117. Feng, L.; Li, H. Spatial Pattern Analysis of Urban Sprawl: Case Study of Jiangning, Nanjing, China. J. Urban Plan. Dev. 2012, 138, 263–269. [Google Scholar] [CrossRef]
  118. Terzi, F.; Kaya, H. Dynamic spatial analysis of urban sprawl through fractal geometry: The case of Istanbul. Environ. Plan. B Plan. Des. 2011, 38, 175–190. [Google Scholar] [CrossRef]
  119. bin Ibrahim, A.L.; Sarvestani, M.S. Urban sprawl pattern recognition using remote sensing and GIS-Case study Shiraz city, Iran. In Proceedings of the 2009 Joint Urban Remote Sensing Event, Shanghai, China, 20–22 May 2009. [Google Scholar] [CrossRef]
  120. Huang, S.-L.; Wang, S.-H.; Budd, W.W. Sprawl in Taipei’s peri-urban zone: Responses to spatial planning and implications for adapting global environmental change. Landsc. Urban Plan. 2009, 90, 20–32. [Google Scholar] [CrossRef]
  121. Tannier, C.; Vuidel, G.; Houot, H.; Frankhauser, P. Spatial accessibility to amenities in fractal and nonfractal urban patterns. Environ. Plan. B Plan. Des. 2012, 39, 801–819. [Google Scholar] [CrossRef]
  122. Chettiparamb, A. Metaphors in Complexity Theory and Planning. Plan. Theory 2006, 5, 71–91. [Google Scholar] [CrossRef]
  123. Kauffman, S.A. Whispers from Carnot-The Origins of Order and Principles of Adaptation in Complex Nonequilibrium Systems. Complex. Metaphor. Models Real. 1994, 19, 83–160. [Google Scholar]
  124. Crowley, D.; Marat-Mendes, T.; Falanga, R.; Henfrey, T.; Penha-Lopes, G. Towards a necessary regenerative urban planning: Insights from community-led initiatives for ecocity transformation. Cidades. Comunidades E Territ. 2021, 83–104. [Google Scholar] [CrossRef]
  125. Chettiparamb, A. Complexity theory and planning: Examining ‘fractals’ for organising policy domains in planning practice. Plan. Theory 2014, 13, 5–25. [Google Scholar] [CrossRef]
  126. Wohl, S. From form to process: Re-conceptualizing Lynch in light of complexity theory. Urban Des. Int. 2017, 22, 303–317. [Google Scholar] [CrossRef]
  127. Mady, C.; Chettiparamb, A. Planning in the face of ‘deep divisions’: A view from Beirut, Lebanon. Plan. Theory 2017, 16, 296–317. [Google Scholar] [CrossRef]
  128. Chettiparamb, A. Fractal spaces for planning and governance. Town Plan. Rev. 2005, 76, 317–340. [Google Scholar] [CrossRef]
  129. Elsevier, B.V. SciVal®. 2022. Available online: www.scival.com (accessed on 3 February 2022).
  130. Van Eck, N.J.; Waltman, L. Visualizing bibliometric networks. In Measuring Scholarly Impact; Springer: Cham, Switzerland, 2014; pp. 285–320. [Google Scholar] [CrossRef]
  131. Liu, J.S.; Chen, Y.G. A study on fractal dimensions of spatial structure of transport networks and the methods of their determination. Acta Geogr. Sin. 1999, 54, 471–478. [Google Scholar]
  132. Keersmaecker, M.L.; Frankhauser, P.; Thomas, I. Using fractal dimensions for The example of Brussels. Geogr. Anal. 2003, 35, 310–328. [Google Scholar] [CrossRef]
  133. Tannier, C.; Foltête, J.-C.; Girardet, X. Assessing the capacity of different urban forms to preserve the connectivity of ecological habitats. Landsc. Urban Plan. 2012, 105, 128–139. [Google Scholar] [CrossRef]
  134. Zhao, C.; Li, Y.; Weng, M. A Fractal Approach to Urban Boundary Delineation Based on Raster Land Use Maps: A Case of Shanghai, China. Land 2021, 10, 941. [Google Scholar] [CrossRef]
  135. Cremades, R.; Sommer, P.S. Computing climate-smart urban land use with the Integrated Urban Complexity model (IUCm 1.0). Geosci. Model Dev. 2019, 12, 525–539. [Google Scholar] [CrossRef] [Green Version]
  136. Lu, Z.; Zhang, H.; Southworth, F.; Crittenden, J. Fractal dimensions of metropolitan area road networks and the impacts on the urban built environment. Ecol. Indic. 2016, 70, 285–296. [Google Scholar] [CrossRef] [Green Version]
  137. Elsevier, B.V. Scopus®. 2022. Available online: www.scopus.com (accessed on 3 February 2022).
  138. Elsevier, SciVal, Research Analytics Services. 2022. Available online: https://www.elsevier.com/solutions/scival (accessed on 3 February 2022).
  139. Stevens, M.R.; Park, K.; Tian, G.; Kim, K.; Ewing, R. Why Do Some Articles in Planning Journals Get Cited More than Others? J. Plan. Educ. Res. 2019, 1–22. [Google Scholar] [CrossRef]
  140. Alexander, C. Notes on the Synthesis of Form; Harvard University Press: Cambridge, MA, USA, 1964. [Google Scholar]
  141. Jacobs, J. The Death and Life of Great American Cities; Vintage Books: New York, NY, USA, 1961. [Google Scholar]
  142. Khan, F.; Pinter, L. Scaling indicator and planning plane: An indicator and a visual tool for exploring the relationship between urban form, energy efficiency and carbon emissions. Ecol. Indic. 2016, 67, 183–192. [Google Scholar] [CrossRef] [Green Version]
Figure 2. An example of the power-law distribution of component sizes of a simple fractal structure. Source authors [14].
Land 11 00475 g002
Figure 3. Rank-size distribution graph related to the sample fractal tree illustrated in Figure 2. Source authors [14].
Land 11 00475 g003
Figure 4. Examples of a fractal pattern. Left: Sierpinski Carpet, a mathematical fractal used as a base for visual comparison. Right: Istanbul’s fractal urban pattern. Image sources [32,33].
Land 11 00475 g004
Figure 5. Historical bibliometric analysis of literature on fractals in urban planning based on the count of publications per year. Source authors using Elsevier Scopus [137].
Land 11 00475 g005
Figure 6. Text mining analysis for key phrases in abstracts of the literature on fractals in urban planning. Source authors using SciVal [138].
Land 11 00475 g006
Figure 7. Topic and “topic cluster” analysis of the topics included in the literature on fractals in urban planning. Source authors using SciVal [138].
Land 11 00475 g007
Figure 8. Co-authorship analysis of literature on fractals in urban planning. Each bubble represents an author tagged with a family name automatically generated by SciVal based on the literature database. Colors represent different clusters of authors published together and the size of the bubbles represents the number of publications. As shown, there are few main authors with large bubbles and many authors with very small bubbles. Additionally, there are separate clusters of authors publishing together. Source authors using VosViewer [130].
Land 11 00475 g008
Table 1. Examples of empirical evidence of power-law phenomena in cities grouped by built form (left) and socio-economic data (right).
Power-Law Phenomena SourcePower-Law PhenomenaSource
In Built Form In Socio-Economic Profiles
Radial land use density and clusters [6]Hierarchy of social group size [42]
Population density (radial) [21]Social group size [43]
Building geometries for each land use [27]Social networks [48]
Traffic flow distribution (city-scale) [33]Covid-19 pandemic growth pattern [49]
Impervious land [29]Income distribution [50]
Parcel size by area [28]Job vacancies [51]
Building footprint area [52,53]Personal income [44]
Length of road network [53]Firm size (by revenue) [45]
Allometry of street network [54]Firm size by number of employees [46]
Urban boundary [7]Land price [47]
Table 2. Bibliometric analysis of the literature based on publication source: The top 20 journals titles based on the number of publications of the literature on fractal in planning. The titles in bold are planning journals.
Journal TitleCountJournal TitleCount
Physica A: Statistical Mechanics and its Applications18Chinese Geographical Science6
Chaos, Solitons and Fractals18Environmental Monitoring and Assessment6
Dili Xuebao/Acta Geographica Sinica12Photogrammetric Engineering and Remote Sensing6
Landscape and Urban Planning 111Fractals6
Environment and Planning B: Planning and Design 111Environment and Planning A 15
Remote Sensing10Nongye Gongcheng Xuebao/Transactions of the Chinese Society of Agricultural Engineering5
Computers, Environment and Urban Systems 19Cities 15
Science of the Total Environment7Nexus Network Journal4
Sustainability (Switzerland)7Chinese Journal of Ecology4
Ecological Indicators6Hydrology and Earth System Sciences4
1 Planning journals are in bold.
Table 3. Comparison results of the cumulative number of publications in planning journals in the last 20 years on our topic (fractal in urban planning) compared with the broader topic of “urban models in planning”.
Fractals in Urban PlanningUrban Models in Planning
Publication YearPlanning JournalsAny JournalPlanning Journals’ SharePlanning JournalsAny JournalPlanning Journals’ Share
<20226842816%69715212113%
<20123318218%26372146112%
<2002124328%1102637117%
Publisher’s Note: MDPI stays neutral with regard to jurisdictional claims in published maps and institutional affiliations.

