Abstract
As China’s main grain-producing region, the ecological security pattern of Liaoning Province has an extremely important impact on the ecological security of Northeast China and even the whole country. Furthermore, the construction of the ecological security pattern is restricted by the ecological vulnerability assessment in order to explore the ecological vulnerability pattern of spatial distribution and the trend of future vulnerability development in Liaoning Province and guide how to formulate ecological protection policies scientifically. Based on the sensitivity–resilience–pressure (SRP) conceptual model which is combined with natural and socio-economic factors, the ecological vulnerability evaluation index system of Liaoning Province is established in this paper. This paper also evaluates the ecological vulnerability of Liaoning Province from 2010 to 2020 and analyzes the driving factors by using a geographic detector and the CA-Markov model. Moreover, the study forecasts the growing tendency of vulnerability in 2025. The results show that (1) the ecological vulnerability of Liaoning Province is mainly light and has medium vulnerability, which gradually decreases from northwest to southeast; (2) the spatial heterogeneity of the ecological vulnerability index (EVI) is very significant in the southeast and northwest region but not significant in the middle; (3) from the past decade to the next five years, the ecological vulnerability of Liaoning Province has been improving, and the overall distribution pattern of ecological vulnerability is relatively stable; (4) the analysis of driving factors indicates that the impact of natural environmental factors such as land-use type and habitat quality on EVI is more significant than socio-economic factors such as population density. The research results implicate that it is necessary to formulate an ecological protection and restoration plan in Liaoning Province to prevent further ecological degradation in high-value areas of northwest Liaoning, and to balance the relationship between human development and ecological protection and restoration in the metropolitan district.
1. Introduction
On 27 February 2022, the Intergovernmental Panel on Climate Change (IPCC) released the sixth assessment report “Climate Change 2022 Impacts, Adaptation and Vulnerability” [1], which mentioned that approximately 3.3 to 3.6 billion people around the world live in an ecosystem which is extremely vulnerable to climate change and the vulnerability of ecosystems will be strongly affected by human development. The predicted climate change and non-climate factors will lead to the loss and degradation of most forests, coral reefs and low-lying coastal wetlands in the world, and unsustainable agricultural expansion will also increase ecological and human vulnerability. Ecological vulnerability has become an important problem that restricts human and ecological development. In recent years, China has regarded the construction of an ecological civilization as a vital part of its development. A healthy ecological environment is not only an important condition for the sustainable development of the economy and society, but also an essential foundation for the survival and progress of a nation. However, China has the most vulnerable ecosystem in the world, in which the vulnerable ecological land area accounts for 65% of the total land area [2]. Based on the present situation in which the vulnerable ecological area is large, China has put forward the development goal of accelerating the reform of the ecological civilization system and building a “beautiful China”. In May 2019, the “Several Opinions on Establishing a Territorial Spatial Planning System and Supervising its Implementation” issued by the State Council of China clearly put forward the delineation of “Three Zones and Three Lines” [3], i.e., urban, agricultural and ecological spaces correspond to the red line of permanent basic farmland protection, urban development boundaries and ecological protections. Besides, determining the delineation of the ecological protection red line in the fragile ecological environment area has significant meaning for maintaining the ecological integrity and the sustainability of the ecological service function, solving the degradation of the ecological environment and dealing with other ecological problems [4].
“Ecosystem” is a general term that covers all organisms and their nonliving environment in a specific space to delineate a complex open system [5]. Adger believes that vulnerability is a vulnerable state caused by the pressure of social and environmental changes and the lack of adaptability to respond to those changes [6]. If the ecological environment is in a vulnerable state, human sustainable development and economic growth will be negatively affected as an inevitable consequence; at the same time, ecological security will be threatened [7]. The essence of ecological security has two aspects—one is ecological risk and the other is ecological vulnerability. Ecological vulnerability is the core of ecological security. Through the analysis of vulnerability, we can know the factors that threaten ecological security and their mechanism of action. Human beings can actively and effectively safeguard ecological security by taking corresponding measures based on the research results. The research into ecological vulnerability can provide a scientific basis for the restoration of the ecological environment and the promotion of ecological progress, as well as the premise of regional sustainable development plans [8]. The reason is that vulnerability evaluation results are the direct embodiment of ecological vulnerability in the study area. According to the results of the regional ecological vulnerability evaluation, spatial management policies will be specified more effectively, which can guide how to utilize urban resources sustainably and draw up sustainable development patterns [9].
The research on ecological vulnerability in western countries started earlier. In 1905, the American ecologist Clements introduced the concept of an ecological transition zone into the field of ecology [10], which was regarded as the beginning of ecological vulnerability research [11]. In the 1980s and 1990s, some scholars introduced the concept of vulnerability into the study of global environmental change [12], and more focused on linking vulnerability with climate change [13]. With the passage of time, the focus of vulnerability research gradually shifted from the climate to ecology, and some scholars began to explore the driving factors and mechanisms of the vulnerability of different ecosystems. Compared with western countries, relevant research on ecological vulnerability is being conducted comparatively late. At the end of the 1980s, Niu et al. [14] carried out research from the perspective of ecological ecotones. In terms of time, it was the beginning of China’s research into ecological vulnerability. From the 1980s to the 1990s, research into ecological vulnerability was primarily executed from the perspective of the impact of climate change and natural factors on the ecosystem. In 1993, Su Weici et al. [15] selected 15 indicators from six aspects to evaluate the ecological vulnerability of the Wujiang River Basin in Guizhou. It was an earlier piece of research which evaluated ecological vulnerability from the perspective of human activities and natural factors by Chinese specialists. Since the new century, domestic scholars have always regarded natural and social factors as an important part of evaluating ecological vulnerability, and have carried out a lot of research on mountainous areas [16], river deltas [17], urban ecosystems [18], forest belts [19] and other research areas.
Ecological vulnerability is disturbed by natural and human factors in many ways, with many types and rapid changes, which is an important obstacle to the sustainable utilization of land resources and the ecological environment in China since the new century. In recent years, the state has strictly implemented the strategy of ecological priority development, and introduced a series of control measures such as the red line of cultivated land protection, the red line of ecological protection, and the boundary of urban development, with the aim of ensuring the ecologically sustainable utilization of resources and the sustainable development of the social economy. Liaoning Province is one of the 13 major grain-producing areas in China. It is a crucial agricultural area and commodity grain base. It is also the core channel of the Chinese “grain transportation from North to South” strategy. On the macro scale, ecological security patterns mainly refer to the form, proportion and spatial allocation of ecosystems and land use types on the scales of landscape and region. Among them, there are some key potential patterns composed of the positional relationships of points, lines and areas, which are of great significance for maintaining and controlling some ecological processes, protecting the integrity of ecosystem structure and functions, and maintaining ecosystem services. On the national scale, Liaoning Province is a point in the national ecological security pattern, and its ecological security pattern composed of different ecological regions and different land types also determines the ecological security pattern in Northeast China. As the northernmost region in China, the ecological security pattern within the region will also affect the national ecological security pattern. Hence, that Liaoning Province has a high nationwide ecological status is self-evident. Understanding and mastering the spatial distribution pattern of ecological vulnerability in Liaoning Province and the future development trend of ecological vulnerability with time under the current policy conditions is conducive to better formulating ecological environmental protection and restoration measures and more scientifically delineating the ecological protection red line, whereas there is no correlational study on the ecological vulnerability evaluation of Liaoning Province in existing research. At present, there is an evaluation of the ecological sensitivity of Liaoning Province [20], but the evaluation results can only reflect the problems existing at the sensitivity level. As the government has paid more and more attention to the field of ecological protection, the sensitivity evaluation results cannot meet the needs of Territorial Spatial Planning for ecological protection. In summary, this paper selects Liaoning Province as the research area to carry out ecological vulnerability assessment research.
The purpose of this study is to explore the temporal and spatial changes, spatial distribution and the impact on natural and socio-economic factors of ecological vulnerability in Liaoning Province. We also predict future vulnerability distribution patterns. Specifically, two hypotheses are tested by means of this research: (1) the spatial distribution of ecological vulnerability in Liaoning Province has an obvious spatial pattern characteristic; (2) under the existing policy conditions, the ecological vulnerability of Liaoning Province will improve with the passage of time.
2. Literature Review
2.1. The Concept of Ecological Vulnerability
The concept of vulnerability first appeared in the study of natural disasters in the 1960s and began to be applied in the fields of ecology, geography and sustainability in the 1970s [21]. As the degradation of the ecological environment has gradually attracted people’s concern, Timmerman first proposed that the vulnerability performance reflects the extent to which a system may react negatively at a catastrophic time [22]. Watts et al. [23] thought that the aim of reflecting on vulnerability is to enhance the ability to deal with catastrophic events through various measures, strengthen the restorative potential and damage control, and minimize the catastrophic consequences caused by adverse events. Chambers identified three basic indicators that define vulnerability [24]: (1) exposure to stress and crisis; (2) the risk of an inadequate ability to cope with crisis and pressure; (3) the risk of severe results of crisis and stress and the consequent risk of slow or limited resilience. W. Niel Adger [6] presented vulnerability as referring to the state of being vulnerable owing to exposure to pressure related to environmental and social changes and a lack of adaptability. Most of the research mentioned above mentions several correlative keywords of vulnerability—namely pressure, exposure and adaptation. Following Timmernan [22], Dowing [25] and other scholars and the fourth report of IPCC [26], respectively, defined the connotation of vulnerability from different perspectives. By the 21st century, the concept of vulnerability has been widely applied to other fields, including ecology [27] and sustainable development [28].
The concept of ecological vulnerability was first put forward by Clements [5], an American ecologist, in his study of an “Ecological Ecotone”. Henceforth, the research on ecological vulnerability gradually became a topic of great interest. Williams [29] believes that ecosystem vulnerability is an estimation of the ability of a specific ecosystem to withstand pressures and risks from various aspects in both time and space dimensions and is a potential response to pressures. The concept of ecological fragile zones was first confirmed at the seventh conference held by the Scientific Committee on Problems of the Environment (SCOPE) in Budapest, Hungary, in 1988. Since then, studies on ecological fragile zones have become increasingly active. However, the unified definition of ecological vulnerability has not been confirmed until now; yet, the definition of ecological vulnerability by the IPCC has been widely accepted and adopted by each research field, which can be summarized as the sensitivity and resilience of the ecosystem to the pressure of human disturbance, climate change and other external disturbance factors.
2.2. The Assessment of Ecological Vulnerability
Until now, the evaluation of ecological vulnerability has mainly depended on the establishment of models. Due to different research areas, it is difficult to establish a unification ecological vulnerability evaluation model for the research areas with disparate terrain, climate conditions or other factors. Currently, common models include the pressure–state–response model (PSR) [30] and the exposure–sensitive–adaptive model (ESA) [31]. These models were initially employed for land quality evaluation. After the evaluation system was mature, some scholars introduced it into the field of land ecological security assessment [32], and then applied it to ecological vulnerability assessment. On the basis of the PSR model, some scholars have expanded a series of new models by adding more factors, such as the driving force–pressure–state–impact–response model (DPSIR) [33], the pressure–support–state–response model (PSSR) [17] and the system dynamic model (SD) [8]. The sensitivity–resilience–pressure model (SRP) used in this paper is comprehensively proposed on the ground of the PSR model and the ESA model. With the deepening of research, the ecological vulnerability assessment model has been advancing towards diversification and multi-factor synthesis, and more brand-new models are being developed and utilized.
Over the years, many scholars have evaluated and analyzed the ecological vulnerability of different research areas. Some researchers have explored the ecological vulnerability of arid and semi-arid areas in order to discover the major driving factors that generate ecological vulnerability in a particular region. For instance, Xuejiao LV et al. built an evaluation model that was based on the pressure–state–response model and selected eight indicators such as slope, soil erosion factor and vegetation coverage in the arid coal mining areas of Western China [34]. Rong Li et al. chose the Ningxia Hui Autonomous Region on the Loess Plateau as a case to investigate the spatial heterogeneity of the ecological vulnerability index from 1990 to 2015 [35]. Some researchers also selected the forest belt as the research area to study the spatial distribution of ecological vulnerability in Daxinganling [36], as well as the temporal and spatial changes and driving factors of ecological vulnerability in the northeast forest belt [19]. Others contraposed extreme terrain areas such as the Qinghai Tibet Plateau [5,37] to explore the spatial distribution pattern, driving factors and spatial heterogeneity of ecological vulnerability. Karst landform areas [38], tropical ecosystems [39] and water environment systems [40] were bought into ecological vulnerability as well. Nevertheless, there are few studies on ecological vulnerability evaluation in provincial administrative regions.
Different models provide the necessary basis for ecological vulnerability assessment. More evaluation approaches and technical means need to be combined with those models’ foundations, such as principal component analysis [5], the analytic hierarchy process [41], the fuzzy evaluation method [42], the entropy weight method [43], the grey clustering method [44] and so on. With the increasing maturity of information technology, 3S technology [45] is increasingly utilized to carry out an ecological vulnerability assessment to make the evaluation results more accurate. For example, Taohong Zou et al. [46] analyzed and evaluated the ecological vulnerability of Jilin Province by using GIS technology and investigated its influencing factors. The spatial principal component analysis based on the combination of traditional principal component analysis and spatial feature extraction has additional advantages in ecological vulnerability assessment than traditional ways [36]. Spatial principal component analysis not only adds spatial constraints to the traditional principal component analysis but also considers the spatial characteristics of the data.
On account of the discrepancies between the geographical location, research purpose and focus of the study area, each scholar has a distinctive research system, which means that a unified index system does not exist. Referring to the research results in recent years, this study adopts the sensitivity resilience pressure model (SRP) to construct the evaluation index system and adopts the spatial principal component analysis method to determine the index weight. The model is based on the connotation of ecological vulnerability and is widely used in the Qinghai Tibet Plateau [37], Zhangjiakou [47] and Jakarta [48]. In this index system, sensitivity reveals the anti-interference ability of the ecosystem to various adverse factors. Resilience refers to the ability of the ecosystem to recover to its original state after having been damaged by internal and external factors, which is primarily characterized by vegetation factors. While stress refers to diversified pressures on the ecosystem produced by mankind, those are usually manifested as population density pressure and economic activity pressure. Ecosystem vulnerability is the consequence of the joint action of natural factors and human activities. The driving factors affecting ecological vulnerability chiefly contain natural environmental factors and socio-economic factors. Therefore, this paper selects indicators from these two aspects.
3. Methods and Data Sources
3.1. Study Area
Liaoning Province is located in the south of Northeast China, between 118° and 125° E and 38° and 43° N, and has jurisdiction over 14 prefecture-level cities with a total area of 148,000 square kilometers. The landform is generally described as “Sixth percent of Mountains, Ten percent of aquatorium and Thirty percent of farmlands”. Mountainous and hilly areas are mainly distributed on both sides of eastern and western Liaoning, where the average altitude is between 500 and 800 m above sea level. The central area is the Liao River Plain with an average altitude of 200 m (Figure 1). Liaoning Province is located on the east coast of the Eurasian continent and is a temperate monsoon climate. The rainy season and hot season coincide in the same season but the precipitation is uneven in the study area—it is higher in the east of Liaoning province than in the west. The annual sunshine hours are 2100 to 2600 h. The annual mean temperature is 7 to 11 °C; the maximum temperature can reach 30 °C and the minimum temperature can reach minus 30 °C. Precipitation in Liaoning Province is higher than in all the other provinces located in Northeast China. The annual precipitation in the eastern mountainous and hilly area is more than 1100 mm. Since the western mountainous and hilly area is close to the Inner Mongolia Plateau, the annual precipitation is about 400 mm and the average annual precipitation in the central plain area is about 60 mm. Due to the influence of human activities and the natural environment, the chief ecological problems confronted by Liaoning Province are land desertification, soil erosion, mountain desertification, etc.
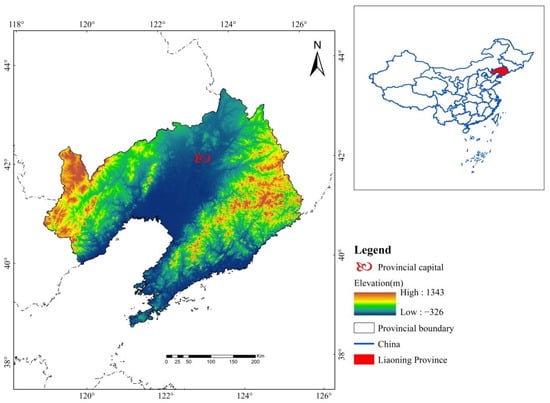
Figure 1.
Geographical location of Liaoning Province.
3.2. Data Sources
In order to explore the ecological vulnerability pattern of Liaoning Province in recent ten years, considering the availability of data and referring to previous related studies, this paper selected 2010–2020 as the research period, and 2010, 2015 and 2020 were selected as the time nodes to collect and analyze the data of these three periods and reflect the ecological vulnerability pattern of Liaoning Province in the last ten years. The data used in this study (Table 1) cover the socio-economic, remote sensing, topographic, meteorological and land use data in 2010, 2015 and 2020. The normalized difference vegetation index (NDVI), soil erosion and night light index are derived from the Resource and Environmental Science Data Center (RESDC) of the Chinese Academy of Sciences. The land use data come from the Earth big data science project (CASEarth). The elevation and slope data are from the geospatial data cloud (GSclould) and are 90 m resolution digital elevation product data. The population density data are obtained from WorldPoP. The annual average temperature, annual precipitation, annual sunshine hours and gross national product (GDP) data are obtained from the statistical yearbook of Liaoning Province and in ArcGIS10.2, with a resolution of 200 m. The habitat quality data are calculated based on land use data by Invest software with a resolution of 200 m.

Table 1.
Data and sources of ecosystem vulnerability assessment for Liaoning Province.
The original data are projected into the same coordinate system (WGS_1984_UTM_Zone_51N) through ArcGIS10.2 and are unified into the same spatial boundary that equals the boundary of the research area by cutting. The above process of data preprocessing was carried out in ArcGIS 10.2. Finally, the data are resampled to the same spatial resolution of 200 m × 200 m by means of bilinear interpolation and nearest neighbor.
3.3. Technology Route
This research is conducted according to the following steps (Figure 2).
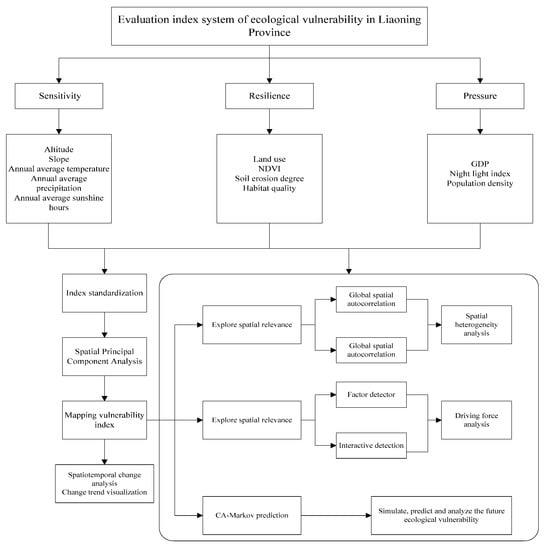
Figure 2.
Flowchart showing the process followed in this analysis for assessing the ecological vulnerability of Liaoning Province.
Firstly, the indicators used to reflect the content of the hierarchy are determined by three different levels. After the indicators are decided, the weight of each indicator is dependent on spatial principal component analysis, whereafter the vulnerability index map is drawn, the global and local autocorrelation processing are managed, and geographic detector and CA-Markov prediction are carried out, respectively, to reflect the temporal and spatial distribution law of ecosystem vulnerability in the study area. The spatial heterogeneity law of ecological vulnerability distribution in the study area is analyzed through a Moran index and cluster diagram. The impact degrees of index factors on vulnerability are determined through factor detectors and interaction detectors in a geographic detector, and ascertain which is more significant between interaction and a single factor. Ultimately, CA-Markov prediction is accomplished with the IDRISI software, and the prospective ecological vulnerability is predicted through existing data, which provide a reference database for future ecological protection.
3.4. Establishment of Ecological Vulnerability Index System
In this study, based on the sensitivity–resilience–pressure (SPR) model, 12 indicators of different types were selected for sensitivity, resilience and pressure (Table 2). In previous studies, sensitivity was considered to be the result of the joint action of topographic factors and climatic conditions, and there were also studies [47] in which vegetation conditions were added to sensitivity. However, at the sensitivity level of this study, terrain and climate indicators were selected to reflect the ecological sensitivity of Liaoning Province, including elevation and slope. In terms of climate factors, the average annual temperature and average annual precipitation were selected. Besides, the average annual sunshine hours were also considered to reflect the hydrothermal conditions of the ecosystem. Altitude and slope can clearly show the topographic factors [53] of the study area. In terms of resilience, this study selects land-use types, soil erosion, vegetation coverage and habitat quality, which can represent ecology. NDVI can monitor the growth of vegetation and accurately reflect the coverage rate of surface vegetation [54]. The degree of soil erosion is also an index that can reflect the status of vegetation. At the pressure level, population density, GDP and night light index are selected to reflect the interference intensity of human activities on the ecosystem. When the interference intensity is too large, the ecological environment will deteriorate.

Table 2.
Ecological vulnerability assessment indicators for Liaoning Province.
3.5. Mapping Ecosystem Vulnerability
3.5.1. Data Standardization
Because there are some differences in the order of magnitude of each index, this paper uses the range standardization method to process each index before analysis and calculation. There are two relationships between ecological vulnerability and indicators [55]. One is that the lower the value is, the lower the ecological vulnerability, showing a positive correlation such as elevation, slope, land-use type, soil erosion degree and socio-economic data are positive indicators; the other is that the lower the value, the higher the ecological vulnerability. For example, the annual average temperature and annual precipitation are negative indicators. The standardization method of positive indicators is as follows [43]:
Negative indicators are handled as follows:
where “” is the standardized value of index ; “” is the initial value of index ; “” is the minimum value of index ; “” is the maximum value of index .
3.5.2. Spatial Principal Component Analysis
By reducing dimensions, spatial principal component analysis replaces multiple initial indicators with fewer comprehensive indicators [56] so that the information reflected by more variables can be retained to the greatest extent and the original data attributes can be transformed into a new multivariate attribute set rotated relative to the original space [36]. In this study, the principal component with a cumulative contribution rate meeting the standard is used to replace the original indicators, and then the principal component indicators are used to determine the factors participating in the evaluation. On this basis, the comprehensive index of the principal component is calculated as follows:
where “” is the -th principal component; “,” are the feature vectors corresponding to the respective index factors of the -th principal component; “,” are the respective index factors.
The ecological vulnerability index (EVI) in this study is calculated by the grid calculator function in ArcGIS based on principal component analysis and using the following equation:
The SPCA results for the years 2010, 2015 and 2020 are shown in Table 3.

Table 3.
Results of the SPCA (spatial principal components analysis) of ecological vulnerability in Liaoning Province.
3.5.3. EVI Classification
In this study, the natural breakage classification (NBC) is used to classify EVI to distinguish different levels of ecological vulnerability [55]. The natural breakage classification can maximize the differences between classes. There are some natural turning points or characteristic points in any statistical series. These points can be used to divide the research object into several levels with similar properties. The natural breakpoint itself is a good boundary for classification. In this study, the EVI in 2010 is classified by natural breakage classification. As the classification standard (Table 4) of EVI in this paper, EVI is divided into five categories: slightly vulnerable area, lightly vulnerable area, medium vulnerable area, heave vulnerable area and extremely vulnerable area. After classification, ArcGIS software is used to visualize the spatial distribution of EVI.

Table 4.
Classification of the ecological vulnerability index (EVI).
3.6. Spatial Autocorrelation Analysis
Spatial autocorrelation refers to the potential interdependence between the observed data of variables in the same distribution area [57]. In this study, the spatial autocorrelation module in Geoda software is used to explore the potential spatial correlation between variables. In the analysis results, the positive correlation shows that the attributes of adjacent spaces within the boundary of the research area have the same evolution trend and have certain spatial aggregation characteristics; the negative correlation indicates that the spatial unit attributes adjacent to the boundary in the study area are different, and there is no spatial agglomeration.
Global spatial autocorrelation is mainly used to describe the spatial distribution and agglomeration characteristics of some attributes in the whole study area. Spatial autocorrelation is usually measured by the global Moran’s I index proposed by Moran. At present, Moran’s I index is widely used in spatial autocorrelation research. The calculation formula is [58]:
where “” represents the observed value of the-th grid; “” is the number of grids; “” is binary adjacency space weight matrix. The range of Moran’s I index is (−1,1). When the index value is greater than 0, it indicates that the attribute presents a spatial aggregation state, and when it is less than 0 it indicates that the attribute is in a discrete state in spatial distribution. When it is approaching 0, it indicates that the attribute is randomly distributed in space [59].
Local indicators of spatial association (LISA) are mainly used to reflect the correlation between the index in the local area and the adjacent area. The local Moran’s I index is often used to analyze the local spatial difference characteristics of the study area [57]. The calculation formula is as follows:
where “” is the number of analysis units; is the element of spatial weight matrix; “” and “” are spatial units after row standardization.
Using Geoda software to calculate the data, the local spatial autocorrelation analysis results are divided into five categories: “H-H” is high and high agglomeration, “H-L” is high and low agglomeration, “L-H” is low and high agglomeration, “L-L” is low and low agglomeration and “N-N” is no significant type.
3.7. Driving Force Analysis
Geo detector is a research model used to detect the spatial differentiation law of regional geographical elements and explain the driving force affecting the distribution of geographical elements. It is widely used in the research fields of natural and social sciences [60]. The model consists of four modules: the factor detector is used to test the differentiation degree of dependent variables and independent variables in the research area. The detection result is measured by q-statistics. The larger the q-statistics, the deeper the influence of independent variables on the distribution of dependent variables in the research area. The interaction detector is used to identify whether the interaction between different factors enhances the interpretation of dependent variables. The risk detector is used to identify whether there is a significant difference in the attribute mean between any two sub-regions in the study area, and is tested by T statistics. The ecological detector is used to compare whether there is a significant difference between the effects of two independent variables on the spatial distribution of dependent variables, which is measured by F statistics.
In this study, factor detectors and interaction detectors are used to analyze the driving factors of ecological vulnerability in Liaoning Province. The purpose is to explore the main driving mechanism of ecological vulnerability in Liaoning Province, compare it with the spatial distribution pattern of EVI, and use the q-statistical value to measure the impact of indicators on EVI. The calculation equation is as follows [5]:
where “” is the explanatory power of the influencing factors to the vulnerability of the ecosystem, “” is the sample size, “” is the classification number of the index factors and “” and “” represent the variance of h-layer sample size and ecosystem vulnerability, respectively.
3.8. Prediction Analysis
In this study, the CA-Markov model is used for the simulation, prediction and analysis of ecological vulnerability. The Markov model was first proposed by Andrey Markov, a mathematician of the former Soviet Union. It is a process theoretical model based on the Markov random process system so as to achieve the purpose of prediction and random control. The cellular automata (CA) model is a lattice dynamics model with discrete temporal and spatial states [61]. It focuses on the interaction of cells with different temporal and spatial characteristics. It has strong spatial computing and simulation ability and is especially suitable for the dynamic simulation and spatial display of self-organizing functional systems. The formula is expressed as follows [62]:
where is a set of cellular states; is the cellular field; and are different moments; is the cellular transformation rule of local space.
The Markov model is a stochastic model in the time domain, which is transformed to the state at t + 1 time according to the state of the event at t time, and the state at t + 1 time is only related to the state at t time; its essence is to predict the probability of an event [63]. The transition matrix is a digital reflection of the possibility of events transforming into the t + 1 state at t time, and it is an important quantitative basis for simulation and prediction results under the Markov model. The formula is expressed as follows [63]:
where is a state transition matrix, and its formula is expressed as follows [64]:
where 0 ≤ < 1, (i,j = 1,2, …, n); n is the number of land-use types; represents the probability that the initial type i is converted to type j; i is the row of the matrix; j is the column of the matrix. Each row of the matrix represents the probability of land use type i transforming to each land-use type.
The CA-Markov model makes use of the respective advantages of the CA model and the Markov model to combine the two models and the principle of multi-criteria and multi-objective land allocation to predict land use; that is, the simulation of land use prediction is realized by adding the spatial distribution elements with continuous properties to the analysis process of the Markov chain [65]. The working principle is to take the distribution pattern of the predicted initial year as the initial state and redistribute different types of land based on the transfer area of the previous period and the suitability Atlas of the initial year until the predicted area of the Markov chain is reached. This study uses the CA-Markov module in IDRISI software and ArcGIS software to complete the process of CA-Markov prediction.
4. Results
4.1. Temporal and Spatial Distribution Characteristics of Ecological Vulnerability
The results of this study show that the ecological vulnerability in most areas of Liaoning Province is mainly light vulnerable and medium vulnerable (Figure 3). In 2010, 2015 and 2020, the proportion of light vulnerable areas and medium vulnerable areas reached 56.98, 58.5 and 61.04%, respectively, with a stable upward trend. The area proportion of extremely vulnerable areas has decreased by 0.41% in the decade 2010–2020, the area of slightly vulnerable areas has increased by 1.28% in the decade, and the area of heavily vulnerable areas has changed most significantly, reducing by 4.92%.
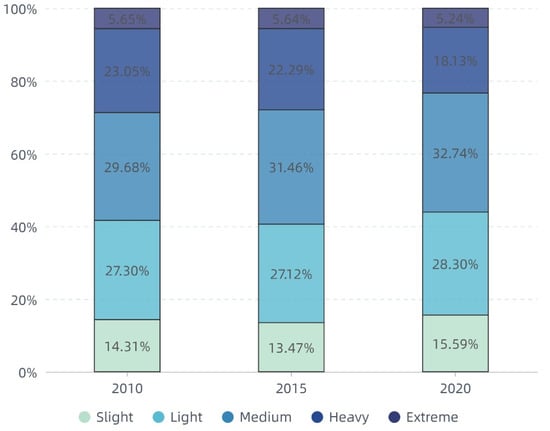
Figure 3.
Area proportion of different ecological vulnerability levels in Liaoning Province 2010, 2015 and 2020.
By calculating the area transfer between 2010, 2015 and 2020, it can be found that the area conversion of different ecologically vulnerable areas mainly occurs between adjacent levels (Figure 4). For example, the lightly vulnerable areas in 2015 mainly come from the slightly vulnerable areas, lightly vulnerable areas and medium vulnerable areas in 2010; most of the extremely vulnerable areas in 2020 come from the original extremely vulnerable areas and heavily vulnerable areas. It also shows that there is usually no mutation process in the transformation of ecological vulnerability. The types of scale transformation mainly include the transformation of light and medium vulnerable areas, the transformation of medium and heavily vulnerable areas, and the transformation between heavily and extremely vulnerable areas.
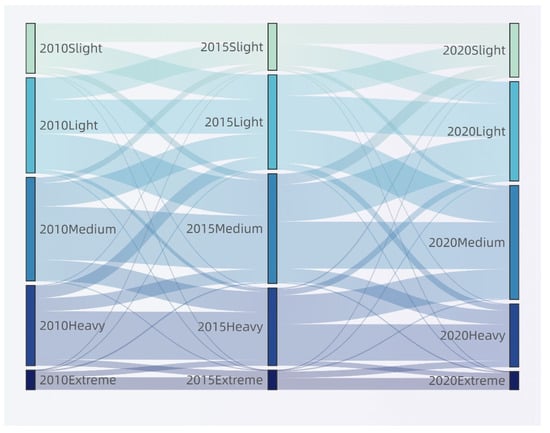
Figure 4.
Area conversion of ecologically vulnerability areas on Liaoning Province in 2010, 2015 and 2020.
According to the spatial distribution pattern of the ecological vulnerability index, the area with better ecological vulnerability in Liaoning Province accounts for a relatively large proportion (Figure 5). In terms of overall hierarchical distribution, the areas with high ecological vulnerability are mainly distributed in the windy sand area in the northwest of Liaoning, the central urban area of the city and the Liaodong Peninsula. The areas with low ecological vulnerability are concentrated in the southern plain area and the eastern mountainous water source area, which generally shows that the ecological vulnerability in the northwest is high and the vulnerability level in the south is low. From the perspective of time scale, the ecological vulnerability level of the whole northwest of Liaoning Province was extremely vulnerable from 2010 to 2020, and the area of extremely vulnerable areas shows a decreasing trend. The ecological vulnerability level of large and medium-sized urban areas has been extremely vulnerable over the ten years due to the significant impact of human activities. The areas with low ecological vulnerability in the south and east of Liaoning have maintained a relatively good level of ecological vulnerability in the past ten years, and the area of overall slightly vulnerable and lightly vulnerable areas has an increasing trend with the passage of time.
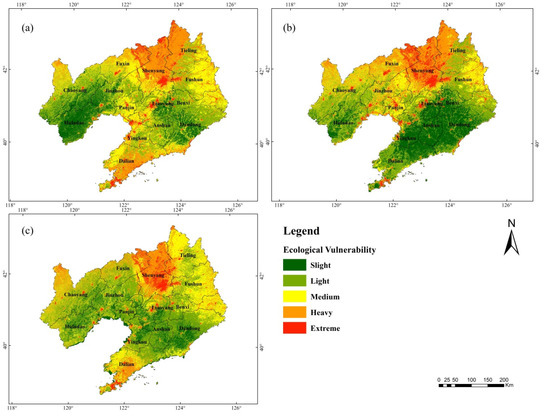
Figure 5.
Spatial distribution of ecological vulnerability in Liaoning Province in (a) 2010, (b) 2015 and (c) 2020.
In order to intuitively feel the change of vulnerability level of each area between different years, this study visualized the change of vulnerability level from 2010 to 2020 (Figure 6). In the decade from 2010 to 2020, 51.2% of the study areas have changed their ecological vulnerability level, with a total of 20 transformation types, of which 0.1% changed from medium vulnerable areas to extremely vulnerable areas, mainly distributed in the northwest and central urban areas of Liaoning Province. In total, 2.4% of the area has changed from a moderately vulnerable area to a slightly vulnerable area, mainly distributed in the southern plain area and the eastern low mountain and hilly area. The overall ecological vulnerability is changing in a good direction, and the area changing to mildly vulnerable areas is larger than that to severe and extremely vulnerable areas.
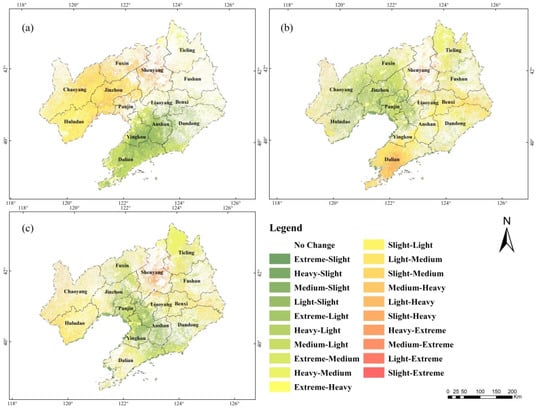
Figure 6.
Temporal changes of ecological vulnerability in Liaoning Province in (a) 2010–2015, (b) 2015–2020 and (c) 2010–2020.
4.2. Spatial Heterogeneity of Ecosystem Vulnerability
The Moran indexes in the three years 2010, 2015 and 2020 are 0.675, 0.731 and 0.625, respectively, and all of them have passed the significance test (Figure 7). In terms of the overall trend, the ecological vulnerability in the three years shows the characteristics of positive spatial autocorrelation and high aggregation. The overall cluster trend has an upward trend from 2010 to 2015 and a certain decline from 2015 to 2020.
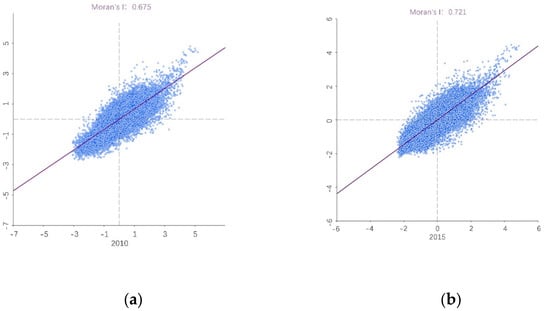
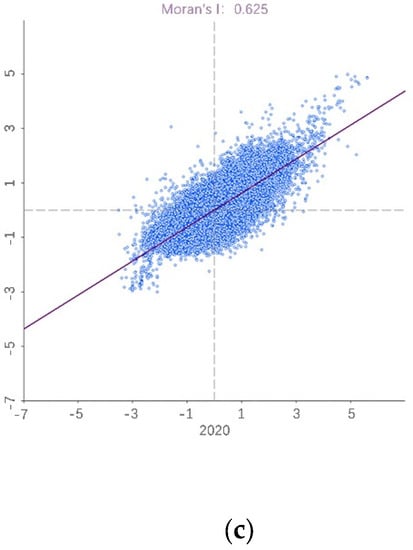
Figure 7.
Moran scatterplot of EVI on Liaoning Province in (a) 2010, (b) 2015, (c) 2020.
By calculating the local spatial autocorrelation index from 2010 to 2020, we can clearly show the spatial and temporal distribution of the spatial clustering characteristics of ecological vulnerability from 2010 to 2020 and the spatial variation difference on the time scale (Figure 8). The spatial clustering characteristics and spatial distribution pattern of ecological vulnerability in 2010, 2015, 2020 are generally similar, and the main spatial clustering characteristics are high-high and low-low. High-high areas are mainly distributed in Northwest Liaoning and the Liaodong Peninsula and are mainly severe and extremely vulnerable. The central region shows no significant spatial aggregation distribution, with mainly moderate vulnerable areas, while the West Liaoning Corridor and low mountains and hills in East Liaoning are mainly low-low areas, mainly consisting of mild and micro vulnerable areas. Compared with the high-high and low-low cluster types, the distribution range of low-high and high-low cluster types was lower, and most of these regions are divided into the transition areas of low-low cluster type distribution areas and high-high cluster type distribution areas.
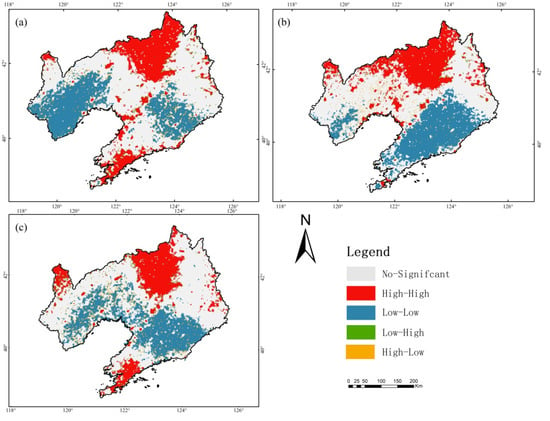
Figure 8.
Local spatial autocorrelation diagram in Liaoning Province in (a) 2010, (b) 2015 and (c) 2020.
4.3. Influencing Factors and Interaction of Ecological Vulnerability
Geographic detectors can not only test the spatial differentiation of a single variable, but also test the coupling of spatial distribution for two variables to explore the potential causal relationship between the two variables. The potential determinants of ecological vulnerability in this study, their importance and their interaction forms can be determined through geographic detectors.
Using the factor detector in the geographical detector to calculate the ecological vulnerability indexes in 2010, 2015 and 2020, we can obtain the q-value statistical data of the explanatory power of each impact factor on ecological vulnerability in each year (Table 5). In 2010, the q-statistic value of natural factors ranged from 0.069 to 0.335, with an average value of 0.178, and the q-statistic value of socio-economic factors ranged from 0.079 to 0.148, with an average value of 0.112. In 2015, the q-statistic value of natural factors ranged from 0.031 to 0.448, with an average value of 0.177; that of socio-economic factors ranged from 0.029 to 0.101, with an average value of 0.064; that of natural factors ranged from 0.050 to 0.230, with an average value of 0.118; that of socio-economic factors ranged from 0.068 to 0.195, with an average value of 0.121. All factors were statistically significant.

Table 5.
Results for different factors of EVI.
According to the q-statistics in 2010, 2015 and 2020, on the whole, the influence of natural factors on ecological vulnerability are stronger than that socio-economic factors. In the statistical data of the three periods, the highest q-statistical value was the land use type in 2015, which reached 0.449, and the highest q-statistical value of habitat quality also reached 0.359 in 2015, and the q-statistical values of land use type and habitat quality ranked the top three in the corresponding years. However, the q-statistical value of terrain factors in the statistics of the third period is low, and the highest q-statistical value of elevation and slope in the data of the three periods is only 0.201, and the lowest is only 0.051. In terms of social and economic factors, the highest q-statistics of the night light index and GDP reached 0.110 and 0.195, respectively, both of which were significantly higher than the q-statistics of population density. The highest q-statistics of population density in the third period was only 0.079. The influence of social factors on ecological vulnerability can be ranked in descending order according to GDP, night light index and population density. These results show that land use type and habitat quality are the most important determinants of the spatial distribution of ecological vulnerability, while the influence of topographic factors is relatively weak. At the same time, ecological vulnerability is more affected by natural environmental factors than by socio-economic factors. Generally speaking, the selected natural and socio-economic factors can explain the spatial pattern and change of the whole ecological vulnerability index.
The factor detector part of the geographic detector can explore the impact of a single factor on ecological vulnerability, while the interactive detection module can judge the impact of two factors on ecosystem vulnerability through calculation. In this part of the study, the average EVI from 2010 to 2020 is selected as the dependent variable. The results of the interaction detector show that the interaction between the two factors has a greater impact on ecological vulnerability than that of a single factor (Figure 9), indicating that the ecological vulnerability of Liaoning Province is more the result of the comprehensive action of multiple factors. The interaction between annual average temperature and habitat quality has the most significant impact on ecological vulnerability. The average temperature and habitat quality are the main factors affecting ecological vulnerability in Liaoning Province. The interaction of socio-economic factors is smaller than the q-statistical value of natural factors, but the interaction between socio-economic factors and natural factors also has a strong impact on ecological vulnerability.
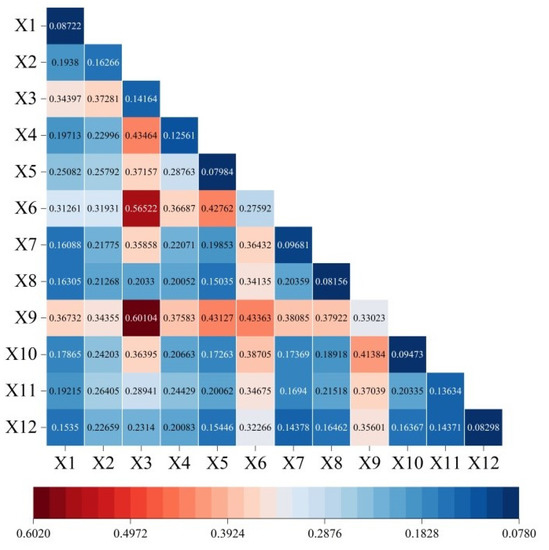
Figure 9.
Interaction between pairs of forces influencing EVI.
In the detection results of the interaction detector, there are two types of enhancement effects, one is double factor enhancement and the other is nonlinear enhancement. In this study, the interaction of the two factors has a double factor enhancement effect, and a small part is a nonlinear enhancement effect (Figure 10). Among them, the enhancement effect of the interaction between the two factors and other factors is a mostly nonlinear enhancement. It shows that the combined effect of these two factors on ecological vulnerability is more than the sum of their respective factors. The two-factor enhancement is common in topographic factors, such as altitude and slope factors, indicating that the impact of their interaction on ecological vulnerability is more significant than that of a single factor.
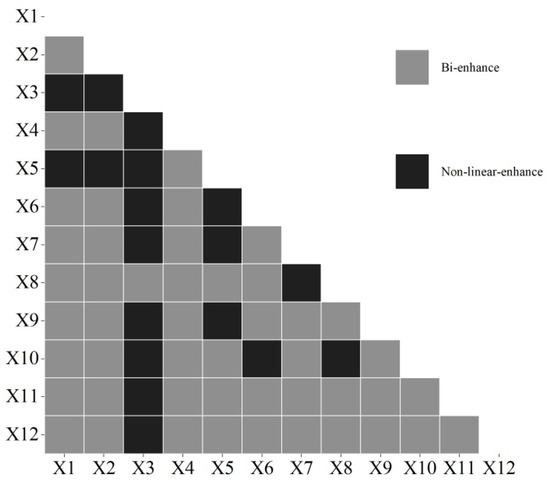
Figure 10.
Interaction type between pairs of forces influencing EVI.
4.4. Prediction and Analysis of Ecological Vulnerability
Using the CA-Markov module in IDRISI software, based on the ecological vulnerability results in 2010, 2015 and 2020, taking 2010 as the starting year, we calculated the ecological vulnerability level area transfer matrix from 2010 to 2015, predicted the ecological vulnerability of Liaoning Province in 2020, compared it with the actual data, and calculated the kappa coefficient of 0.62, indicating that the prediction results are highly consistent with the actual situation. We took 2015 as the starting year, where based on the ecological vulnerability area transfer matrix from 2015 to 2020 and the generated suitability Atlas of various vulnerability levels, we assumed that the ecological vulnerability level transfer trend from 2010 to 2020 is basically similar to that ten of years later, and a 5 × 5 mole neighborhood is used as the filtering parameter of the CA-Markov model. The operation of the model is an iterative cycle every year. Through 10 iterations, the spatial data set of ecological vulnerability in Liaoning Province in 2025 is simulated, and the spatial distribution prediction map is formed (Figure 11).
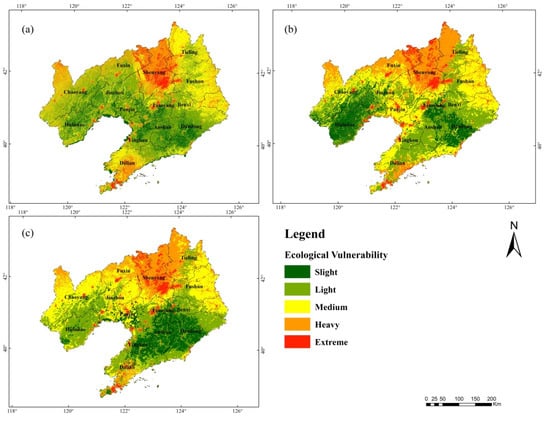
Figure 11.
The distribution pattern of ecological vulnerability in Liaoning Province in (b) 2020 and (c) 2025 predicted by (a) 2010 basic images.
The prediction results show that the distribution pattern of ecological vulnerability level in Liaoning Province in 2025 is consistent with that of the past decade. The statistics show that the proportions of five levels of ecological vulnerability areas in 2025 are as follows: slightly vulnerable areas are 14.6%, lightly vulnerable areas are 29.4%, medium vulnerable areas are 30.9% and heavily vulnerable areas are 20.3%. While the area of extremely vulnerable areas is only 7130 square kilometers, accounting for only 4.8% of the total area, this level is far lower than the data of ten years ago. The area of heavily vulnerable areas has decreased by about 8 percentage points and has shifted toward slightly vulnerable areas and lightly vulnerable areas. It also shows that the ecological vulnerability of Liaoning Province is gradually shifting in a better direction. The overall distribution pattern is still extremely vulnerable areas, mainly distributed in economically developed central urban areas and wind-blown sand areas in Northwest Liaoning. The regions with good ecological vulnerability are distributed in the central plain area and the eastern hilly area.
5. Discussion
5.1. Temporal and Spatial Distribution of Ecological Vulnerability
Based on the SRP model and the principal component analysis method, combined with the collected remote sensing data, this study processes the selected indicators with a spatial resolution of 200 m, calculates the ecological vulnerability index, and evaluates the ecological vulnerability of Liaoning Province in 2010, 2015 and 2020. The results show an obvious spatial distribution pattern. The overall distribution trend is that the ecological vulnerability of the northwest region and central urban area with better economic development is high. The eastern and western Liaoning Corridor regions and the southern plain region have a low ecological vulnerability, and their spatial distribution characteristics are in line with the current situation of the ecological environment in Liaoning Province. Liaoning Province is mainly in a state of moderate ecological vulnerability, and the overall vulnerability level is mainly light and medium. Previous studies mainly focus on some areas of Liaoning Province, such as the health evaluation of coastal wetland ecosystems in Liaoning Province [30], and there are also assessments of the ecological sensitivity of Liaoning Province [20]. However, there is no similar assessment of ecological vulnerability for the whole of Liaoning Province. Compared with previous studies, this study expands the scope of the study area to the whole of Liaoning Province. Generally speaking, in the evaluation results of ecological vulnerability in Liaoning Province, extremely vulnerable ecological functional areas account for a small proportion of the whole of Liaoning Province. Through the evaluation process and the final result, the first research hypothesis put forward in this paper is that the ecological vulnerability of Liaoning Province has a certain spatial distribution pattern, which has been verified.
5.2. Future Prediction of Ecological Vulnerability
Using the CA-Markov model, based on remote sensing data and GIS spatial analysis technology, taking 2015 as the starting year, this paper forecasts the spatial distribution of ecological vulnerability in Liaoning Province in 2025, compares and analyzes the ecological vulnerability in the 15 years from 2010 to 2025, and realizes the simulation analysis of the temporal and spatial pattern of ecological vulnerability in Liaoning Province over the past 15 years. The overall distribution of cities in the northwest shows a small change in spatial vulnerability, but the overall distribution of cities in the southeast shows a certain trend of low vulnerability in the past 15 years. However, the overall distribution of cities in the northwest shows a certain change in spatial vulnerability and high vulnerability over time, the prediction results in 2025 show that the areas of extremely vulnerable areas and severely vulnerable areas are decreasing, and the areas of moderate and micro vulnerable areas are increasing or decreasing. However, due to the problem of the prediction method, the division between layers in the prediction results is obvious from the figure, which may be different from reality. Previously, CA-Markov prediction was mostly used in the prediction of land use and cover change [65] and to simulate land-use patterns [63]. Few studies combine CA-Markov prediction with ecological vulnerability assessment results. Although there are no more prediction scenarios in the prediction in this study, the overall prediction results have high reliability. According to the forecast results and the evolution trend of ecological vulnerability pattern in Liaoning Province, the second hypothesis put forward in this paper is that the ecological vulnerability of Liaoning Province has a trend of developing in a good direction under the current policy conditions, which has been verified. This also shows that our current ecological priority development strategy is correct, and we should constantly improve the development concept and carry it out in the future development process.
5.3. Policy Suggestions
Aiming at ecologically vulnerable areas with different degrees of vulnerability, ecological restoration will be vigorously carried out in combination with comprehensive land consolidation across the region. From the time and space distribution pattern of the ecological environment, we can see that fragile areas in Liaoning Province are located in the northwest of Liaoning Province and the Inner Mongolia border. Semi-arid sandy areas, due to natural factors and human activities, such as climate, soil erosion and land desertification in the region, lead to the serious problem for the region in strengthening regional ecological management comprehensive land use planning and establishing windbreaks and a sand-fixation belt in the region. We will promote the comprehensive development of agriculture, forestry and animal husbandry in light of local conditions. Some scholars’ research results show that in a certain area, the impact of human activities on the ecological environment has exceeded the impact of natural environmental changes [66], so future ecological protection should pay more attention to sustainable human activities. Aiming at the problem of urban ecological vulnerability being higher, with large and medium-sized cities as the core to establish a comprehensive urban and rural ecological restoration area, such as constructing Shenyang city circle as the core of urban and rural ecological restoration area, Dalian as the core of the Liaodong peninsula urban and rural ecological restoration area, we may set up a file in northern Liaodong bay, Yingkou, as the core of the urban and rural repair area and with the core of the western Liaoning Fuxin, Chaoyang, repair zone between urban and rural areas. The results of driving force analysis show that land-use type and habitat quality have a great influence on ecological vulnerability, and both indicators are affected by land-use patterns. Therefore, we suggest that land-use patterns should be optimized to promote the development of ecological resources in the context of local conditions. At the same time, we should improve the ecological restoration planning system, improve the implementation management system of ecological restoration, strengthen the technical support for the implementation of ecological restoration planning, and encourage the public to participate in the implementation of ecological restoration in the whole Liaoning Province.
5.4. Limitations and Future Research Prospects
In this study, we rely on the SRP model to select 12 different natural economic indicators from three levels of sensitivity, resilience and pressure to construct an indicator system, calculate the index weight by principal component analysis, and obtain the ecological vulnerability index of Liaoning Province from 2010 to 2020 and grade the results. Then, the spatial and temporal distribution pattern of ecological vulnerability in Liaoning province was analyzed, and the future spatial distribution pattern of ecological vulnerability was predicted by the CA-Markov model. However, there are some limitations and uncertainties in the research process. First of all, the selection of indicators involves many factors such as nature, economy and society. Due to limitations of data sources and spatial expression, some indicators are not included in the index system, and there is also the problem that the selection of indicators may affect the results. There is no unified standard for selecting indicators at the three levels of sensitivity, resilience and pressure. In this paper, climatic conditions and topographic factors are treated as sensitive factors, but some scholars regard them as the interference of environmental pressure on the ecosystem in their own research [67]. Even based on the same evaluation model, some scholars divide the same factors into different index levels [68]. At the same time, there are subjective ideas of researchers in the selection of indicators [69], which cannot guarantee that the selected indicators can fully express the ecological vulnerability of the study region objectively and accurately. In consequence, how to select the corresponding indicators reflecting the ecological vulnerability of the region scientifically and accurately according to the evaluation system remains to be further discussed. Secondly, the ecological vulnerability classification divided into five levels based on natural breakage classification should also be explored. In this study, the areas are divided by their relative differences into extremely vulnerable areas and severely vulnerable areas. In other studies, the division may be into micro or mild degrees, so the division standard does not apply to other areas. The CA-Markov model is used to predict the future overall pattern of ecological vulnerability distribution, but this article is based on land-use policy and ecological restoration under invariable policies, and does not take into account that a variety of human-made, shallow and quantitative analyses were carried out on the assumptions, Therefore, the prediction results are bound to have certain errors. The above deficiencies need to be further studied in order to improve the accuracy of ecosystem vulnerability assessment results and prediction accuracy in the study area, so as to provide some reference for future ecological restoration.
6. Conclusions
In this study, an index system was established based on the model selected indicators, and the ecological vulnerability of Liaoning Province was evaluated. The evaluation results predict the future spatial distribution of ecological vulnerability. From 2010 to 2020, The evaluation results show that the main light and medium vulnerable areas in Liaoning Province account for about 60% of the area of Liaoning Province. The area of extremely vulnerable areas is relatively small. The northwest showed a more vulnerable state than the southeast. In general, the ecological vulnerability deteriorated slightly in the past ten years and continues to improve. The spatial distribution of the ecological vulnerability index has obvious clustering characteristics. The prediction results of the CA-Markov model show that the ecological vulnerability of Liaoning Province is developing in many directions under the condition that the existing policy conditions remain unchanged. The area is increasing, and the overall distribution pattern is changing.
Ecological vulnerability is the result of the comprehensive action of many factors. In this study; it is mainly believed that it is affected by both natural factors and socio-economic factors. Among them, the influence of natural factors is greater than that of socio-economic factors, and natural factors have the strongest impact on ecological vulnerability. The main effects were land-use type, habitat quality, annual average sunshine hours and annual average precipitation. Compared with natural factors, the impact of socioeconomic factors on ecological vulnerability is less significant. The ranking of these variables on the ecological vulnerability index is GDP, night light index and population density. The explanatory power of the interaction between factors on ecological vulnerability is greater than that of a single factor. The main type of interaction between two factors is bi-enhanced, and some interactions between factors show nonlinear enhanced effects, among which is the interaction detector. It is shown that the interaction of annual mean temperature and habitat quality had the greatest explanatory power for ecological vulnerability.
The results of this paper provide a scientific basis for the formulation of relevant ecological protection and restoration policies in Liaoning Province. At present, the ecological problems we are facing are still severe [70]. We should increase our efforts to designate ecological protection and restoration policies, take corresponding ecological restoration measures for areas with very fragile ecology, improve the ecological compensation mechanism, balance the relationship between ecological restoration and economic growth, adapt to nature, develop the law, adhere to the concept of overall planning, and strengthen the systematic planning of ecological restoration.
Author Contributions
Conceptualization, D.L. and H.G.; formal analysis, C.H.; funding acquisition, H.G.; data curation, C.H.; methodology, J.Y.; writing—review and editing, D.L. and J.Y. All authors have read and agreed to the published version of the manuscript.
Funding
This research was funded by the Scientific Research Foundation of Liaoning Province (Grant No. WSNZK202002), the China Postdoctoral Science Foundation (Grant Nos 2020T130433 and 2018M631824) and the Liaoning Province Social Science Foundation (Grant No. L19CGL009).
Institutional Review Board Statement
Not applicable.
Informed Consent Statement
Not applicable.
Data Availability Statement
Not applicable.
Conflicts of Interest
The authors declare no conflict of interest.
References
- IPCC. Climate Change 2022: Mitigation of Climate Change. Contribution of Working Group III to the Sixth Assessment Report of the Intergovernmental Panel on Climate Change; Shukla, P.R., Skea, J., Slade, R., Khourdajie, A.A., van Diemen, R., McCollum, D., Pathak, M., Some, S., Vyas, P., Fradera, R., et al., Eds.; Cambridge University Press: Cambridge, UK; New York, NY, USA, 2022. [Google Scholar] [CrossRef]
- Zhen, L.; Ishwaran, N.; Luo, Q.; Wei, Y.; Zhang, Q. Role and Significance of Restoration Technologies for Vulnerable Ecosystems in Building an Ecological Civilization in China. Environ. Dev. 2020, 34, 100494. [Google Scholar] [CrossRef]
- Liu, D.; Ma, Z. The Relationship between Three Districts and Three Lines and Its Spatial Control. China Land 2019, 7, 22–24. [Google Scholar] [CrossRef]
- Lin, Y.; Fan, J.; Wen, Q.; Liu, S.; Li, B. Theory and Technology of Ecological Redline Demarcation. Acta Ecol. Sin. 2016, 36, 1244–1252. [Google Scholar]
- Li, H.; Song, W. Spatiotemporal Distribution and Influencing Factors of Ecosystem Vulnerability on Qinghai-Tibet Plateau. Int. J. Environ. Res. Public Health 2021, 18, 6508. [Google Scholar] [CrossRef]
- Adger, W.N. Vulnerability. Glob. Environ. Change 2006, 16, 268–281. [Google Scholar] [CrossRef]
- Ying, L.; Kong, L.; Xiao, Y.; Ouyang, Z. Research Progress on Ecological Security and Its Evaluation Methods. Acta Ecol. Sin. 2022, 42, 1679–1692. [Google Scholar]
- Zhang, F.; Liu, X.; Zhang, J.; Wu, R.; Ma, Q.; Chen, Y. Ecological Vulnerability Assessment Based on Multi-Sources Data and SD Model in Yinma River Basin, China. Ecol. Model. 2017, 349, 41–50. [Google Scholar] [CrossRef]
- Hong, W.; Jiang, R.; Yang, C.; Zhang, F.; Su, M.; Liao, Q. Establishing an Ecological Vulnerability Assessment Indicator System for Spatial Recognition and Management of Ecologically Vulnerable Areas in Highly Urbanized Regions: A Case Study of Shenzhen, China. Ecol. Indic. 2016, 69, 540–547. [Google Scholar] [CrossRef]
- Wu, J.; Zhang, Z.; He, Q.; Ma, G. Spatio-Temporal Analysis of Ecological Vulnerability and Driving Factor Analysis in the Dongjiang River Basin, China, in the Recent 20 Years. Remote Sens. 2021, 13, 4636. [Google Scholar] [CrossRef]
- Xu, J.; Li, G.; Wang, Y. A review and prospect of research on ecological vulnerability at home and abroad. East China Econ. Manag. 2016, 30, 149–162. [Google Scholar]
- Fang, C.; Wang, Y.; Fang, J. Comprehensive measurement and spatial differentiation characteristics of urban vulnerability in China. J. Geogr. Sci. 2016, 26, 153–170. [Google Scholar] [CrossRef]
- Ribot, J.C. The Causal Structure of Vulnerability: Its Application to Climate Impact Analysis. GeoJournal 1995, 35, 119–122. [Google Scholar] [CrossRef]
- Niu, W. Basic judgment of ECONETONE in ecological and environmental fragility zone. Acta Ecol. Sin. 1989, 2, 97–105. [Google Scholar]
- Su, W.; Mou, J. A Preliminary Study on the Regionalization of Ecological Environment Vulnerability in Karst Area: A Case Study of Wujiang River Basin in Guizhou Province. Guizhou Sci. 1993, 3, 24–30. [Google Scholar]
- Song, G.; Chen, Y.; Tian, M.; Lv, S.; Zhang, S.; Liu, S. The Ecological Vulnerability Evaluation in Southwestern Mountain Region of China Based on GIS and AHP Method. Procedia Environ. Sci. 2010, 2, 465–475. [Google Scholar] [CrossRef] [Green Version]
- Zhang, X.; Wang, L.; Fu, X.; Li, H.; Xu, C. Ecological Vulnerability Assessment Based on PSSR in Yellow River Delta. J. Clean. Prod. 2017, 167, 1106–1111. [Google Scholar] [CrossRef]
- Wang, Y.; Li, X.; Zhang, F.; Wang, W.; Xiao, R. Effects of Rapid Urbanization on Ecological Functional Vulnerability of the Land System in Wuhan, China: A Flow and Stock Perspective. J. Clean. Prod. 2020, 248, 119284. [Google Scholar] [CrossRef]
- Zhu, Q.; Wang, Y.; Zhou, W.; Zhou, L.; Yu, C.; Qi, L. Temporal and spatial changes of ecological vulnerability in the Northeast Forest Belt and its driving factors. Chin. J. Ecol. 2021, 40, 474–3482. [Google Scholar] [CrossRef]
- Wang, S. Evaluation of ecological sensitivity in Liaoning Province. Res. Land Nat. Resour. 2021, 1, 35–38. [Google Scholar] [CrossRef]
- Yang, F.; Ma, C.; Fang, H. Research progress on vulnerability: From theoretical research to comprehensive practice. Acta Ecol. Sin. 2019, 39, 441–453. [Google Scholar]
- Timmerman, P. Vulnerability, Resilience and the Collapse of Society; Environmental Monograph—Institute for Environmental Studies, University of Toronto: Toronto, ON, Canada, 1981. [Google Scholar]
- Watts, M.J.; Bohle, H.G. The Space of Vulnerability: The Causal Structure of Hunger and Famine. Prog. Hum. Geogr. 1993, 17, 43–67. [Google Scholar] [CrossRef]
- Chambers, R. Vulnerability, Coping and Policy (Editorial Introduction). IDS Bull. 2006, 37, 33–40. [Google Scholar] [CrossRef] [Green Version]
- Dow, K. Exploring Differences in Our Common Future(s): The Meaning of Vulnerability to Global Environmental Change. Geoforum 1992, 23, 417–436. [Google Scholar] [CrossRef]
- IPCC. Summary for Policymakers. In Climate Change 2007: Impacts, Adaptation and Vulnerability. Contribution of Working Group II to the Fourth Assessment Report of the Intergovernmental Panel on Climate Change; Parry, M.L., Canziani, O.F., Palutikof, J.P., van der Linden, P.J., Hanson, C.E., Eds.; Cambridge University Press: Cambridge, UK, 2007; pp. 7–22. [Google Scholar]
- Li, Q.; Shi, X.; Wu, Q. Effects of Protection and Restoration on Reducing Ecological Vulnerability. Sci. Total Environ. 2021, 761, 143180. [Google Scholar] [CrossRef]
- Turner, B.L.; Kasperson, R.E.; Matson, P.A.; McCarthy, J.J.; Corell, R.W.; Christensen, L.; Eckley, N.; Kasperson, J.X.; Luers, A.; Martello, M.L.; et al. A Framework for Vulnerability Analysis in Sustainability Science. Proc. Natl. Acad. Sci. USA 2003, 100, 8074–8079. [Google Scholar] [CrossRef] [Green Version]
- Williams, L.R.R.; Kapustka, L.A. Ecosystem Vulnerability: A Complex Interface with Technical Components. Environ. Toxicol. Chem. 2000, 19, 1055–1058. [Google Scholar] [CrossRef]
- Song, Z.; Sun, Y.; Chen, P.; Jia, M. Assessing the Ecosystem Health of Coastal Wetland Vegetation (Suaeda Salsa) Using the Pressure State Response Model, a Case of the Liao River Estuary in China. Int. J. Environ. Res. Public Health 2022, 19, 546. [Google Scholar] [CrossRef]
- Reinhart, V.; Fonte, C.C.; Hoffmann, P.; Bechtel, B.; Rechid, D.; Boehner, J. Comparison of ESA Climate Change Initiative Land Cover to CORINE Land Cover over Eastern Europe and the Baltic States from a Regional Climate Modeling Perspective. Int. J. Appl. Earth Obs. Geoinf. 2021, 94, 102221. [Google Scholar] [CrossRef]
- Hua, Y.; Yan, M.; Limin, D. Land Ecological Security Assessment for Bai Autonomous Prefecture of Dali Based Using PSR Model–with Data in 2009 as Case. Energy Procedia 2011, 5, 2172–2177. [Google Scholar] [CrossRef] [Green Version]
- Chen, H.; Xu, J.; Zhang, K.; Guo, S.; Lv, X.; Mu, X.; Yang, L.; Song, Y.; Hu, X.; Ma, Y.; et al. New Insights into the DPSIR Model: Revealing the Dynamic Feedback Mechanism and Efficiency of Ecological Civilization Construction in China. J. Clean. Prod. 2022, 348, 131377. [Google Scholar] [CrossRef]
- Lv, X.; Xiao, W.; Zhao, Y.; Zhang, W.; Li, S.; Sun, H. Drivers of Spatio-Temporal Ecological Vulnerability in an Arid, Coal Mining Region in Western China. Ecol. Indic. 2019, 106, 105475. [Google Scholar] [CrossRef]
- Li, R.; Han, R.; Yu, Q.; Qi, S.; Guo, L. Spatial Heterogeneous of Ecological Vulnerability in Arid and Semi-Arid Area: A Case of the Ningxia Hui Autonomous Region, China. Sustainability 2020, 12, 4401. [Google Scholar] [CrossRef]
- Zou, T.; Yoshino, K. Environmental Vulnerability Evaluation Using a Spatial Principal Components Approach in the Daxing’anling Region, China. Ecol. Indic. 2017, 78, 405–415. [Google Scholar] [CrossRef]
- Xia, M.; Jia, K.; Zhao, W.; Liu, S.; Wei, X.; Wang, B. Spatio-Temporal Changes of Ecological Vulnerability across the Qinghai-Tibetan Plateau. Ecol. Indic. 2021, 123, 107274. [Google Scholar] [CrossRef]
- Guo, B.; Zang, W.; Luo, W. Spatial-Temporal Shifts of Ecological Vulnerability of Karst Mountain Ecosystem-Impacts of Global Change and Anthropogenic Interference. Sci. Total Environ. 2020, 741, 140256. [Google Scholar] [CrossRef]
- Eguiguren-Velepucha, P.A.; Chamba, J.A.M.; Aguirre Mendoza, N.A.; Ojeda-Luna, T.L.; Samaniego-Rojas, N.S.; Furniss, M.J.; Howe, C.; Aguirre Mendoza, Z.H. Tropical Ecosystems Vulnerability to Climate Change in Southern Ecuador. Trop. Conserv. Sci. 2016, 9, 194008291666800. [Google Scholar] [CrossRef] [Green Version]
- Yang, X.-H.; Xie, Y.; Sun, B.-Y.; Li, M.-S.; Ye, Y.; Li, Y.-Q. Vulnerability Assessment of Water Environmental System in Beijing-Tianjin-Hebei(BTH) Region. In Proceedings of the 2nd 2016 International Conference on Sustainable Development (ICSD 2016), Xi’an, China, 2–4 December 2006; Atlantis Press: Xi’an, China, 2017. [Google Scholar]
- Hu, X.; Ma, C.; Huang, P.; Guo, X. Ecological Vulnerability Assessment Based on AHP-PSR Method and Analysis of Its Single Parameter Sensitivity and Spatial Autocorrelation for Ecological Protection—A Case of Weifang City, China. Ecol. Indic. 2021, 125, 107464. [Google Scholar] [CrossRef]
- Zhao, Y.; He, L.; Liu, S.; Liu, W.; He, Y.; Zhang, J. Vulnerability assessment methods of agro-ecosystems. Chin. J. Ecol. 2007, 5, 754–758. [Google Scholar]
- Yang, W.; Xu, K.; Lian, J.; Ma, C.; Bin, L. Integrated Flood Vulnerability Assessment Approach Based on TOPSIS and Shannon Entropy Methods. Ecol. Indic. 2018, 89, 269–280. [Google Scholar] [CrossRef]
- Zhang, X.; Du, C.; Cai, H. Ecological vulnerability assessment of Jialu River Basin in the middle reaches of the Yellow River. Chin. Resour. Environ. 2010, 20, 155–158. [Google Scholar]
- Thakur, J.K.; Singh, S.K.; Ekanthalu, V.S. Integrating Remote Sensing, Geographic Information Systems and Global Positioning System Techniques with Hydrological Modeling. Appl. Water Sci. 2017, 7, 1595–1608. [Google Scholar] [CrossRef] [Green Version]
- Zou, T.; Chang, Y.; Chen, P.; Liu, J. Spatial-Temporal Variations of Ecological Vulnerability in Jilin Province (China), 2000 to 2018. Ecol. Indic. 2021, 133, 108429. [Google Scholar] [CrossRef]
- Xu, C.-X.; Lu, C.-X.; Huang, S.-L. Study on ecological vulnerability and its influencing factors in Zhangjiakou area. J. Nat. Resour. 2020, 35, 1288. [Google Scholar] [CrossRef]
- Yoo, G.; Kim, A.R.; Hadi, S. A Methodology to Assess Environmental Vulnerability in a Coastal City: Application to Jakarta, Indonesia. Ocean Coast. Manag. 2014, 102, 169–177. [Google Scholar] [CrossRef]
- Geospatial Data Cloud. Available online: https://www.gscloud.cn/ (accessed on 1 December 2021).
- International Research Center of Big Data for Sustainable Development Goals CASearth. Available online: https://data.casearth.cn/ (accessed on 1 December 2021).
- Resource Environmental Science and Data Center, Chinese Academy of Sciences. Available online: http://www.resdc.cn/Default.aspx (accessed on 11 December 2021).
- WorldPop. Available online: https://www.worldpop.org/ (accessed on 15 December 2021).
- Li, L.; Shi, Z.-H.; Yin, W.; Zhu, D.; Ng, S.L.; Cai, C.-F.; Lei, A.-L. A Fuzzy Analytic Hierarchy Process (FAHP) Approach to Eco-Environmental Vulnerability Assessment for the Danjiangkou Reservoir Area, China. Ecol. Model. 2009, 220, 3439–3447. [Google Scholar] [CrossRef]
- Luo, H.; Wang, L.; Fang, J.; Li, Y.; Li, H.; Dai, S. NDVI, Temperature and Precipitation Variables and Their Relationships in Hainan Island from 2001 to 2014 Based on MODIS NDVI. In Proceedings of the Geo-Informatics in Resource Management and Sustainable Ecosystem, Wuhan, China, 16–18 October 2015; Bian, F., Xie, Y., Eds.; Springer: Berlin/Heidelberg, Germany, 2016; pp. 336–344. [Google Scholar]
- Ding, Q.; Shi, X.; Zhuang, D.; Wang, Y. Temporal and Spatial Distributions of Ecological Vulnerability under the Influence of Natural and Anthropogenic Factors in an Eco-Province under Construction in China. Sustainability 2018, 10, 3087. [Google Scholar] [CrossRef] [Green Version]
- Joliffe, I.; Morgan, B. Principal component analysis and exploratory factor analysis. Stat. Methods Med. Res. 1992, 1, 69–95. [Google Scholar] [CrossRef]
- Shi, Y.; Shi, D.; Cao, X. Impacting Factors and Temporal and Spatial Differentiation of Land Subsidence in Shanghai. Sustainability 2018, 10, 3146. [Google Scholar] [CrossRef] [Green Version]
- Moran, P.A.P. Notes on Continuous Stochastic Phenomena. Biometrika 1950, 37, 17–23. [Google Scholar] [CrossRef]
- Li, H.; Calder, C.A.; Cressie, N. Beyond Moran’s I: Testing for Spatial Dependence Based on the Spatial Autoregressive Model. Geogr. Anal. 2007, 39, 357–375. [Google Scholar] [CrossRef]
- Wang, J.; Xu, C. Geographical Detectors: Principles and Prospects. Acta Geogr. Sin. 2017, 72, 116–134. [Google Scholar]
- Yulianto, F.; Maulana, T.; Khomarudin, M.R. Analysis of the Dynamics of Land Use Change and Its Prediction Based on the Integration of Remotely Sensed Data and CA-Markov Model, in the Upstream Citarum Watershed, West Java, Indonesia. Int. J. Digit. Earth 2019, 12, 1151–1176. [Google Scholar] [CrossRef]
- Sang, L.; Zhang, C.; Yang, J.; Zhu, D.; Yun, W. Simulation of Land Use Spatial Pattern of Towns and Villages Based on CA–Markov Model. Math. Comput. Model. 2011, 54, 938–943. [Google Scholar] [CrossRef]
- Behera, M.D.; Borate, S.N.; Panda, S.N.; Behera, P.R.; Roy, P.S. Modelling and Analyzing the Watershed Dynamics Using Cellular Automata (CA)–Markov Model—A Geo-Information Based Approach. J. Earth Syst. Sci. 2012, 121, 1011–1024. [Google Scholar] [CrossRef] [Green Version]
- Fu, F.; Deng, S.; Wu, D.; Liu, W.; Bai, Z. Research on the Spatiotemporal Evolution of Land Use Landscape Pattern in a County Area Based on CA-Markov Model. Sustain. Cities Soc. 2022, 80, 103760. [Google Scholar] [CrossRef]
- Rahman, M.T.U. Spatio-Temporal Variation and Prediction of Land Use Based on CA-Markov of Southwestern Coastal District of Bangladesh. Remote Sens. Appl. 2021, 19, 100609. [Google Scholar]
- Chen, J.; John, R.; Shao, C.; Fan, Y.; Zhang, Y.; Amarjargal, A.; Brown, D.G.; Qi, J.; Han, J.; Lafortezza, R.; et al. Policy Shifts Influence the Functional Changes of the CNH Systems on the Mongolian Plateau. Environ. Res. Lett. 2015, 10, 085003. [Google Scholar] [CrossRef]
- Cheng, Z.; Zhao, T.; Song, T.; Cui, L.; Zhou, X. Assessing the Spatio-Temporal Pattern and Development Characteristics of Regional Ecological Resources for Sustainable Development: A Case Study on Guizhou Province, China. Land 2022, 11, 899. [Google Scholar] [CrossRef]
- Shao, H.; Liu, M.; Shao, Q.; Sun, X.; Wu, J.; Xiang, Z.; Yang, W. Research on Eco-Environmental Vulnerability Evaluation of the Anning River Basin in the Upper Reaches of the Yangtze River. Environ. Earth Sci. 2014, 72, 1555–1568. [Google Scholar] [CrossRef]
- Zhao, Z.; Sharifi, A.; Dong, X.; Shen, L.; He, B.-J. Spatial Variability and Temporal Heterogeneity of Surface Urban Heat Island Patterns and the Suitability of Local Climate Zones for Land Surface Temperature Characterization. Remote Sens. 2021, 13, 4338. [Google Scholar] [CrossRef]
- He, B.-J.; Zhao, Z.-Q.; Shen, L.-D.; Wang, H.-B.; Li, L.-G. An Approach to Examining Performances of Cool/Hot Sources in Mitigating/Enhancing Land Surface Temperature under Different Temperature Backgrounds Based on Landsat 8 Image. Sustain. Cities Soc. 2019, 44, 416–427. [Google Scholar] [CrossRef]
Publisher’s Note: MDPI stays neutral with regard to jurisdictional claims in published maps and institutional affiliations. |
© 2022 by the authors. Licensee MDPI, Basel, Switzerland. This article is an open access article distributed under the terms and conditions of the Creative Commons Attribution (CC BY) license (https://creativecommons.org/licenses/by/4.0/).
