Article

Scaling Behavior of Peat Properties during the Holocene: A Case Study from Central European Russia

1
Division of Environmental Physics and Meteorology, Faculty of Physics, National and Kapodistrian University of Athens, Campus Bldg. Phys. V, 15784 Athens, Greece
2
General Lyceum of Kapandriti, Tsemperlidi Ayathagelou 5, 19014 Kapandriti, Greece
3
Department of General Ecology and Hydrobiology, Faculty of Biology, Lomonosov Moscow State University, Leninskiye Gory, 1, 199991 Moscow, Russia
4
A.N. Severtsov Institute of Ecology and Evolution, Russian Academy of Sciences, Leninskiy Avenue, 33, 119071 Moscow, Russia
5
Faculty of Biology, Shenzhen MSU-BIT University, Shenzhen 518100, China
6
Section of Condensed Matter Physics, Department of Physics, National and Kapodistrian University of Athens, Panepistimiopolis Zografos, 15784 Athens, Greece
*
Author to whom correspondence should be addressed.
Land 2022, 11(6), 862; https://doi.org/10.3390/land11060862
Submission received: 20 April 2022 / Revised: 2 June 2022 / Accepted: 3 June 2022 / Published: 7 June 2022
(This article belongs to the Special Issue Land Ecosystems and Global Ecodynamics: The Role of Remote Sensing)

Abstract

:
A better understanding of past climate change is vital to our ability to predict possible future environmental dynamics. This study attempts to investigate the dynamic features of the temporal variability of peat humification, water table depth and air temperature by analyzing palaeoecological data from the Valdai Uplands region (Central European Russia). The regression analysis revealed the presence of a periodicity of about 6000 years in the reconstructed peat humification timeseries. Nonlinear analysis showed that humification time variability, water table depth and air temperature exhibit persistent long-range correlations of 1/f type. This indicates that a fluctuation in these variables in the past is very likely to be followed by a similar one in the future, but is magnified by 1/f power-law. In addition, it dictates that humification, water table depth and temperature are key parameters of a system that implies the existence of a special structure, such as self-organized criticality, operating close to a minimum stability configuration, and achieves it without any fine adjustment by external forcing. These conclusions point to new avenues for modeling future ecosystem disturbances and, in particular, for predicting relevant extreme events.

1. Introduction

It is currently a common belief that understanding climate change in the past is vital in predicting possible future environmental dynamics to which the biosphere responds through mechanisms established via geological history [1]. Hence, it is important to explore how past biological responses to climate change could be used to predict future dynamics. To this end, proxy-based paleoclimate reconstructions are very important because they help us to understand how natural mechanisms operate and interact in the climate system [1,2,3,4,5,6,7].
In these studies, peatland deposits are often used as a useful record that preserves past climate information. Peatlands are water-dependent ecosystems characterized by the accumulation of organic matter and are strongly linked to aquifers, rivers and atmospheric precipitation. The ability of peatlands to accumulate and store carbon is a function of the water table depth, which is strongly influenced by the climatic conditions and the physical properties of the peat [8,9].
It should be noted that although considerable improvements have been made to the hydrological modeling of peatlands, it remains important to better understand how the connectivity of peatlands aquifers, rivers and atmospheric precipitation can affect water table depth in peatlands [8,10]. In this context, peat humification analysis is a widely used technique for estimating the degree of decomposition of plant material or organic matter [11]. The degree of peat humification is closely related to climatic conditions. In particular, peat formation is favored in cool and humid conditions, while the dry climate favors the decomposition of plant material. As water tables fall lower in the ground, it takes longer for organic matter to reach the catotelm, i.e., the bottom layer of peat that is permanently below the water table. Based on this approach, the humification analysis of stratified peat deposits can reveal information about past climatic conditions [11,12].
Recently, Mazei et al. [7] presented a multi-proxy palaeoecological study to investigate climate dynamics and human impact on the boundary between mixed and boreal forests for most of the Holocene. This study contains data on peat humification dynamics, reconstructed water table depth (WTD) and mean July air temperatures during the Holocene [7] that can be used to reveal their future dynamics, using recent analytical methods [13,14,15,16,17,18,19,20]. These methods are suitable in cases where the data points are not evenly spaced, and the creation of a continuous record is possible by developing an appropriate algorithm that reveals an optimal fixed time step that better describes the original timeseries.
One way to reveal the future dynamics of a parameter is to study whether it is characterized by long-range dependence. Long-range dependencies are often associated with the self-similar phenomena, i.e., they behave the same when observed at different magnifications, or at different time scales. Here, we aim to investigate whether peat humification, reconstructed water table depth (WTD) timeseries and July air temperatures display long-range dependence (also called long memory), or in other words, whether dependence decays more slowly than an exponential decay, i.e., in a scale-free (fractal-like) power-like decay.

2. Data and Analysis

2.1. Study Site and Peat Sampling
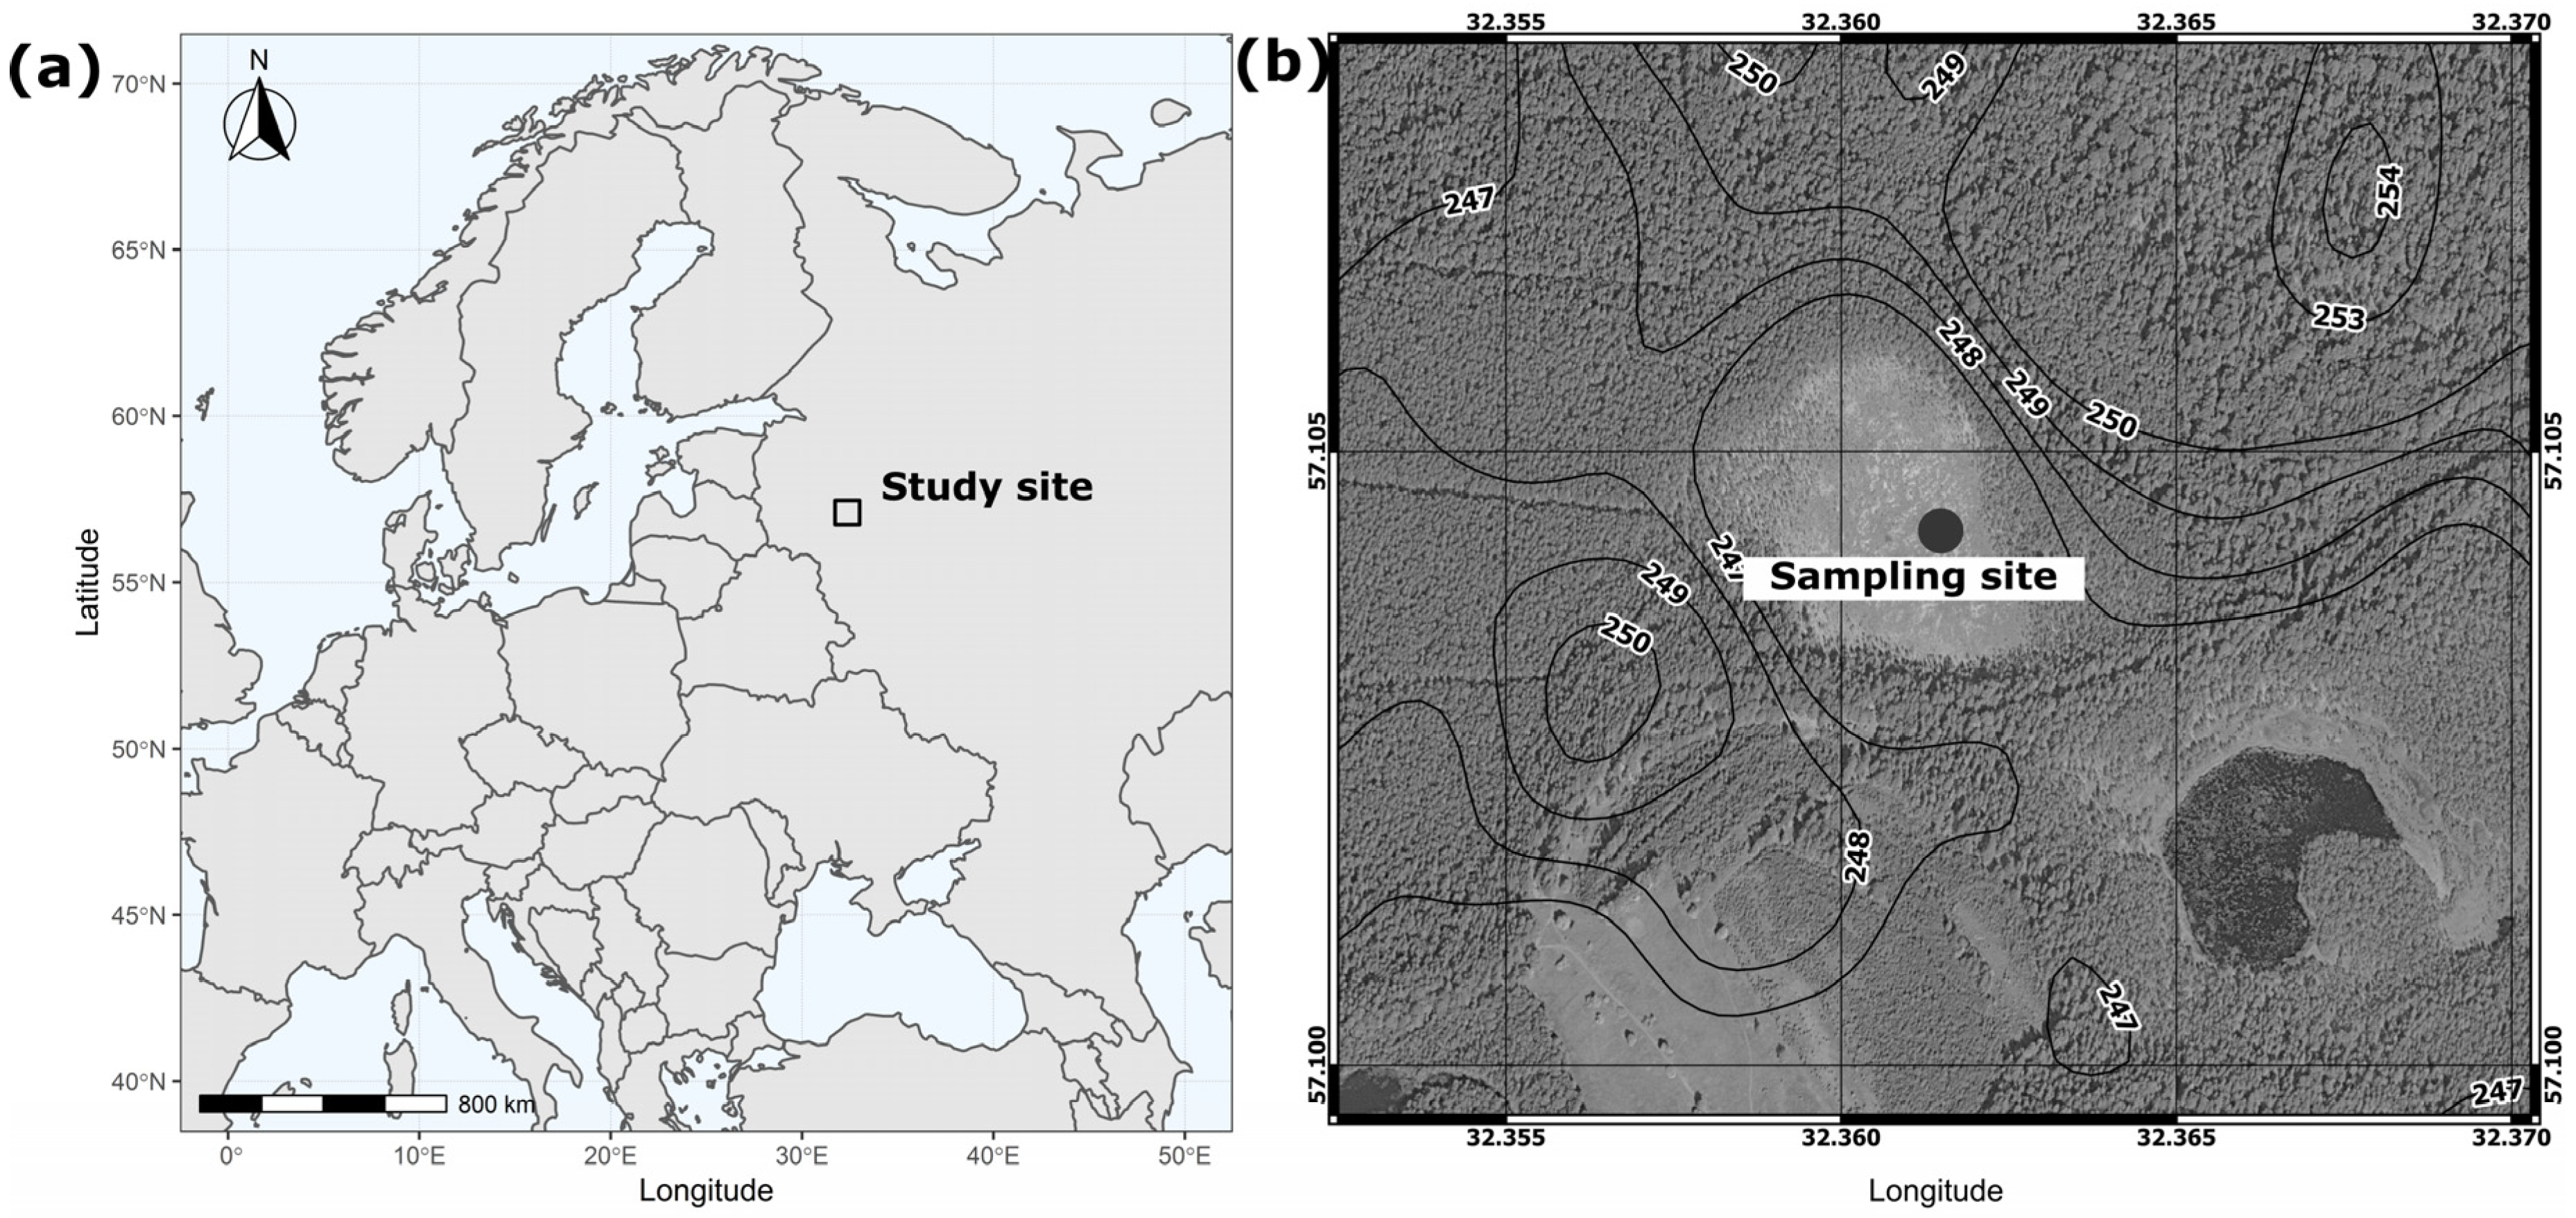
In the present study, we used data from a multi-proxy reconstruction based on the peat deposits of a medium-size mire (57.10460° N, 32.35895° E) located north of the Valdai Uplands (Russia) [7] (Figure 1a,b). The area extends to the southern sub-zone of boreal forests and represents a hilly terrain (150–250 m a.s.l., maximum elevation is 275 m). The climate is temperate (mean annual temperature +5.6 °C) and moderately continental (mean annual precipitation about 761 mm) (Toropets weather station, 1988–2019; http://www.meteo.ru, accessed on 7 October 2020). The average January temperature is −5.9 °C, while the summers are relatively warm with a mean July temperature of +18.3 °C. The area is situated on the border between the mixed forest in the south and boreal forests in the north. The vegetation is dominated by Pinus sylvestris (Scots pine) and Picea abies (European spruce) with Betula spp. (birch) and Populus tremula (common aspen). The studied mire is formed in the depression between the moraine hills, has a well-defined ridge-hollow surface topography and can be classified as meso-oligotrophic.
The peat deposits were extracted in July 2018 and 2019 with a Russian corer (5 cm in diameter, 50 cm long). The maximum depth of the peat deposits in the mire is 7 m. The deposition chronology was determined by an accelerator mass spectrometer radiocarbon dating (AMS 14C) of eight samples [7]. The obtained data were calibrated and used to develop an age-depth model based on the Bayesian approach [21].
Figure 1. (a) The study area (source: https://www.naturalearthdata.com/, accessed on 12 May 2022) and (b) the study site (source: Yandex.Maps service). The elevation lines are created with a resolution of 1 m based on the SRTM 1 arc-second global (source: https://earthexplorer.usgs.gov, accessed on 12 May 2022).
Land 11 00862 g001
The humification of peat deposits was measured as the optical density of alkali extract according to Chambers et al. [22]. This technique is based on the assumption that higher decomposed peat produces a darker extract, and therefore has reduced light transmission or increased light absorption [11]. The obtained light absorbance values were corrected for ignition loss as D’ = D/LOI (where LOI is the ignition loss as a ratio) to account for a lower organic matter content in mineral-rich samples. The surface wetness of the mire was reconstructed WTDs, based on the species composition of testate amoeba assemblages using a transfer function developed for the region by Tsyganov et al. [23]. The mean July air temperatures were reconstructed based on pollen data with a transfer function developed by Salonen et al. [24]. Due to the differences in the proxy preservation, temporal coverage of the data differed, so that the data represented the period starting from the sampling time (2018/2019) to 7136 cal.yr. BP for peat humification, at 2658 cal.yr. BP for WTDs and up to 10,315 cal.yr. BP for the July mean air temperature. The time dynamics of these characteristics are presented in Figure 2a,c (solid lines).

2.2. Analytical Methodology

2.2.1. Reconstruction of Humification, WTD and Temperature Timeseries
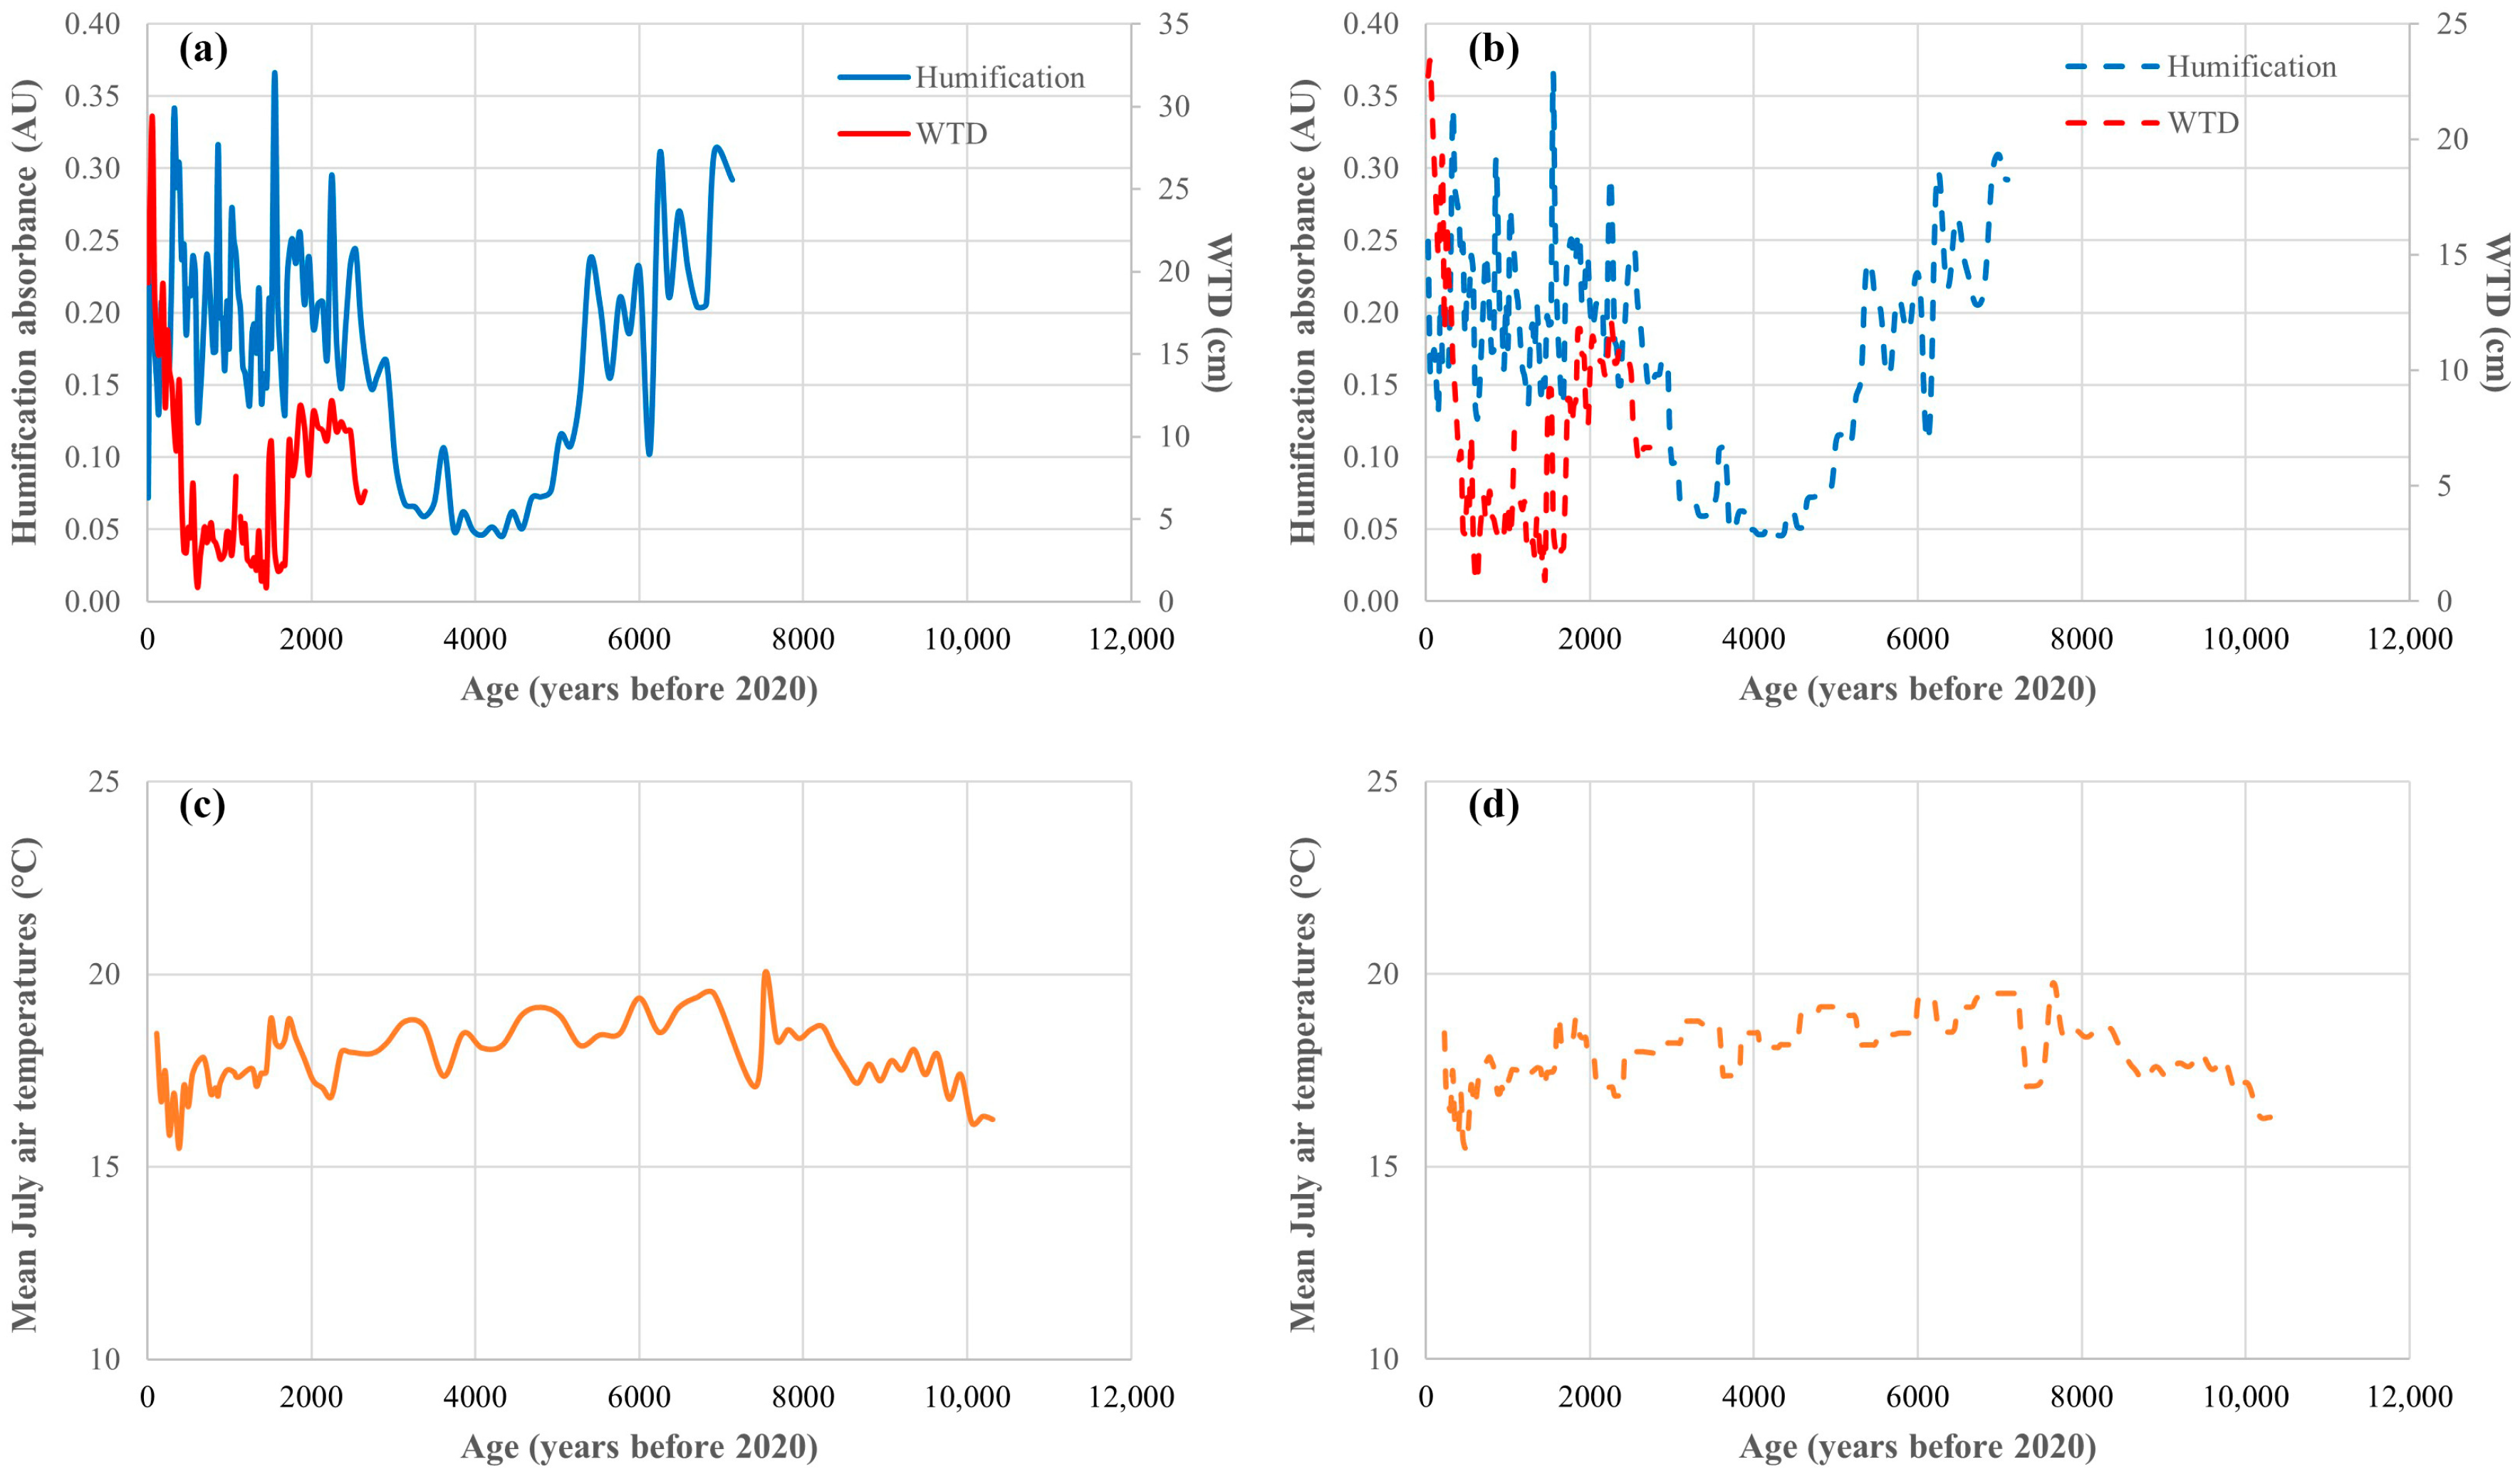
The data points are not equidistant in time, which does not allow the employment of conventional analytical tools. To create a continuous record, we applied an interpolation technique, following the method proposed by Snyder [14], resulting in a “new” fixed-step timeseries. The application of this method is based on a local constant regression with a weighted Nadaraya–Watson kernel, using the k-smooth function in R language and environment for statistical calculations [25] (http://stat.ethz.ch/R-manual/R-patched/library/stats/html/ksmooth.html, accessed on 3 February 2022). The best time step for each parameter was evaluated by reconstructing timeseries with different time steps (25, 50, 100 etc. years) and checking the fit of the new timeseries to the original one (not presented here). The result was a time of 25 years for humification and WTD, and a time of 50 years for temperature.
For this calculation, the applicable statistical weightings were based on the time distance between the initial value and the time point of interest. The bandwidth was set according to the dating uncertainty for that time point. The uncertainty of the interpolated values was estimated as the weighted average of the square differences between the initial values and the interpolated values. To emphasize the inherent properties of WTD and temperature timeseries, we removed seasonality and external trend by using the classic Wiener filter and the linear regression analysis, respectively [26]. The comparison of the original (Figure 2a,c) and the fixed-time-step timeseries (Figure 2b,d) is illustrated in Figure 2.
Figure 2. (a) The original timeseries of humification as light absorbance of alkali extract (blue) and WTD (red). (b) The 25-year step timeseries of humification as light absorbance of alkali extract (blue) and WTD (red). (c) The original timeseries of mean July air temperatures. (d) The 50-year step timeseries of mean July air temperatures.
Land 11 00862 g002

2.2.2. Search for Memory Effects in Humification Data

Complex natural structures and processes often appear as long-range, strong spatial and temporal correlations (e.g., a basic property in fractional Brownian motion—a typical stochastic model). These structures or processes are characterized by scaling (self-similar) phenomena controlled by a power-law exponent α. An analytical tool for extracting this exponent is the Detrended Fluctuation Analysis (DFA), which is based on the random walk hypothesis and is used to detect self-similarities in timeseries of non-stationary data [27]. The first step of the DFA tool is to integrate the timeseries and then divide it into τ-length intervals. Second, the locally fitted trend z(t) of each interval is calculated and subtracted by the interval’s data y(t), and the mean of these square differences is calculated as follows:
F 2 ( τ ) = 1 τ t = k τ + 1 ( κ + 1 ) τ [ y ( t ) z ( t ) ] 2 ,       k = 0 , 1 , 2 , , ( N τ 1 )
Finally, the squared root of mean F2(τ) is calculated over all τ-lengths:
F d ( τ ) = F 2 ( τ )
A straight line on the log–log graph of Fd(τ) versus τ reveals self-affinity, expressed as the power-law:
F d ( τ ) ~ τ α
The scaling exponent α is then estimated as the slope of the abovementioned straight line. In other words, this straight line indicates that the timeseries exhibits a long-range correlation and is characterized by a 1/f type of long memory process. In general, α = 0.5 matches white noise (ideally an uncorrelated signal), 0 < α < 0.5 indicates anti-persistence, 0.5 < α < 1.5 indicates persistence (power-law scaling behavior and the presence of temporal long-range correlations in the range τ where the relation Fd~τα holds), α = 1 corresponds to 1/f noise. Although it is a non-stationary process, fractional Brownian motion is often naturally considered as the reference for the 1/f process. Finally, α = 1.5, matching the Brownian noise.

2.2.3. Ensemble Empirical Mode Decomposition (EEMD) Analysis

We also employed ensemble empirical mode decomposition (EEMD), which was introduced by Wu and Huang [28]. EEMD improves the empirical mode decomposition (EMD). The EMD introduced by Huang et al. [29] decomposes a timeseries into component timeseries called intrinsic mode functions (IMF) and a trend. The IMFs are selected so that their Hilbert transform [29] occurs at a well-defined instantaneous amplitude and frequency. However, they are oscillating functions that do not have a constant frequency—as in the case of the Fourier transform—or take the shape of a given function under scaling in the case of the wavelet transform. Interestingly, the total number of IMFs does not deviate and in the extreme case of white noise is close to log2N [28], where N stands for the total number of data points.
EMD uses the so-called sifting process to separate the high- and low-frequency IMF components of the signal. This process, which is described in detail in [30,31,32,33], consists of four steps, which are briefly summarized below.
In the first step, an upper and lower envelope of the signal s ( t ) is created by connecting its maxima and minima to a cubic spline. In the second step, the mean value of the two envelopes m ( t ) is subtracted from the signal to obtain a component h 1 ( t ) = s ( t ) m ( t ) . In the third step, we consider as signal h 1 ( t ) and repeat the first two steps to derive a new component, h 2 ( t ) etc. If one of these components h i ( t ) satisfies the definition [29] of IMF, which means: (1) the average value of the upper and lower shells of the first step for each point is zero, and (2) the number of extrema and the number of zero crossings must be equal or differ at most by one, the process results in producing the first IMF. The IMF is then ascribed to a new variable, I 1 ( t ) = h i ( t ) . In the fourth step, the extracted IMF I 1 ( t ) is subtracted from the signal s ( t ) , and the residual s ( t ) I 1 ( t ) is treated as a new signal that starts the sifting process from the beginning, thus producing a second IMF, I 2 ( t ) . The end of the sifting process is reached when the residual is a monotonic function, called trend T ( t ) , and we can reconstruct the original signal as s ( t ) = i = 1 n I i ( t ) + T ( t ) , where I i ( t ) denotes the i-th IMF.
EEMD [28] uses noise to improve EMD by repeating the above four steps for various timeseries s ( t ) + w ( t ) , where w ( t ) is a white noise. The IMF extracted by EEMD, denoted by E i ( t ) , is the mean value of the corresponding I i ( t ) IMFs of the EMD. Ideally, the white noises cancel each other and E i ( t ) will not have any noise. Here, instead of the MATLAB code FEEMD.zip discussed in detail in [34] and used in [35], we utilized the R package [25] ‘Rlibeemd’, which is an R interface for libeemd [36].
Hurst analysis was implemented on the IMFs of the reconstructed humification timeseries to reveal long-range dependence in the timeseries [35]. A Hurst exponent H greater than 0.5 indicates that the timeseries exhibits long-range correlation, while an H < 0.5 points to anticorrelation.

3. Results and Discussion

3.1. Non-Linearity in Reconstructed Humification Timeseries

DFA results indicate the existence of long-range dependence in a timeseries. After applying the DFA method to the 25-year fixed-step timeseries of humification, a DFA-exponent α = 1.07 was found (Figure 3a).
However, in order to confirm the scaling property of this timeseries, the following two criteria must be considered, namely, the Maraun criteria, [37]:
  • First, the spectral density must be better described by the power-law than the exponential fitting. As can be seen in Figure 3b, this criterion is met.
  • Second, the local slopes of logFd(τ) vs. logτ (calculated for a 10-point window and a 9-point window) must be stable to a sufficient range. To this aim, Monte Carlo simulations were performed by applying the DFA method in 500 timeseries characterized by fractional Gaussian noise (with α = 1.07) in order to calculate the local slopes-α (τ) for each of them, accompanied by the corresponding 2σ intervals. Thus, according to Figure 3c, all local slopes (after the scale logτ = 1.18) are within the range, indicating sufficient stability. Therefore, the second criterion is also met.
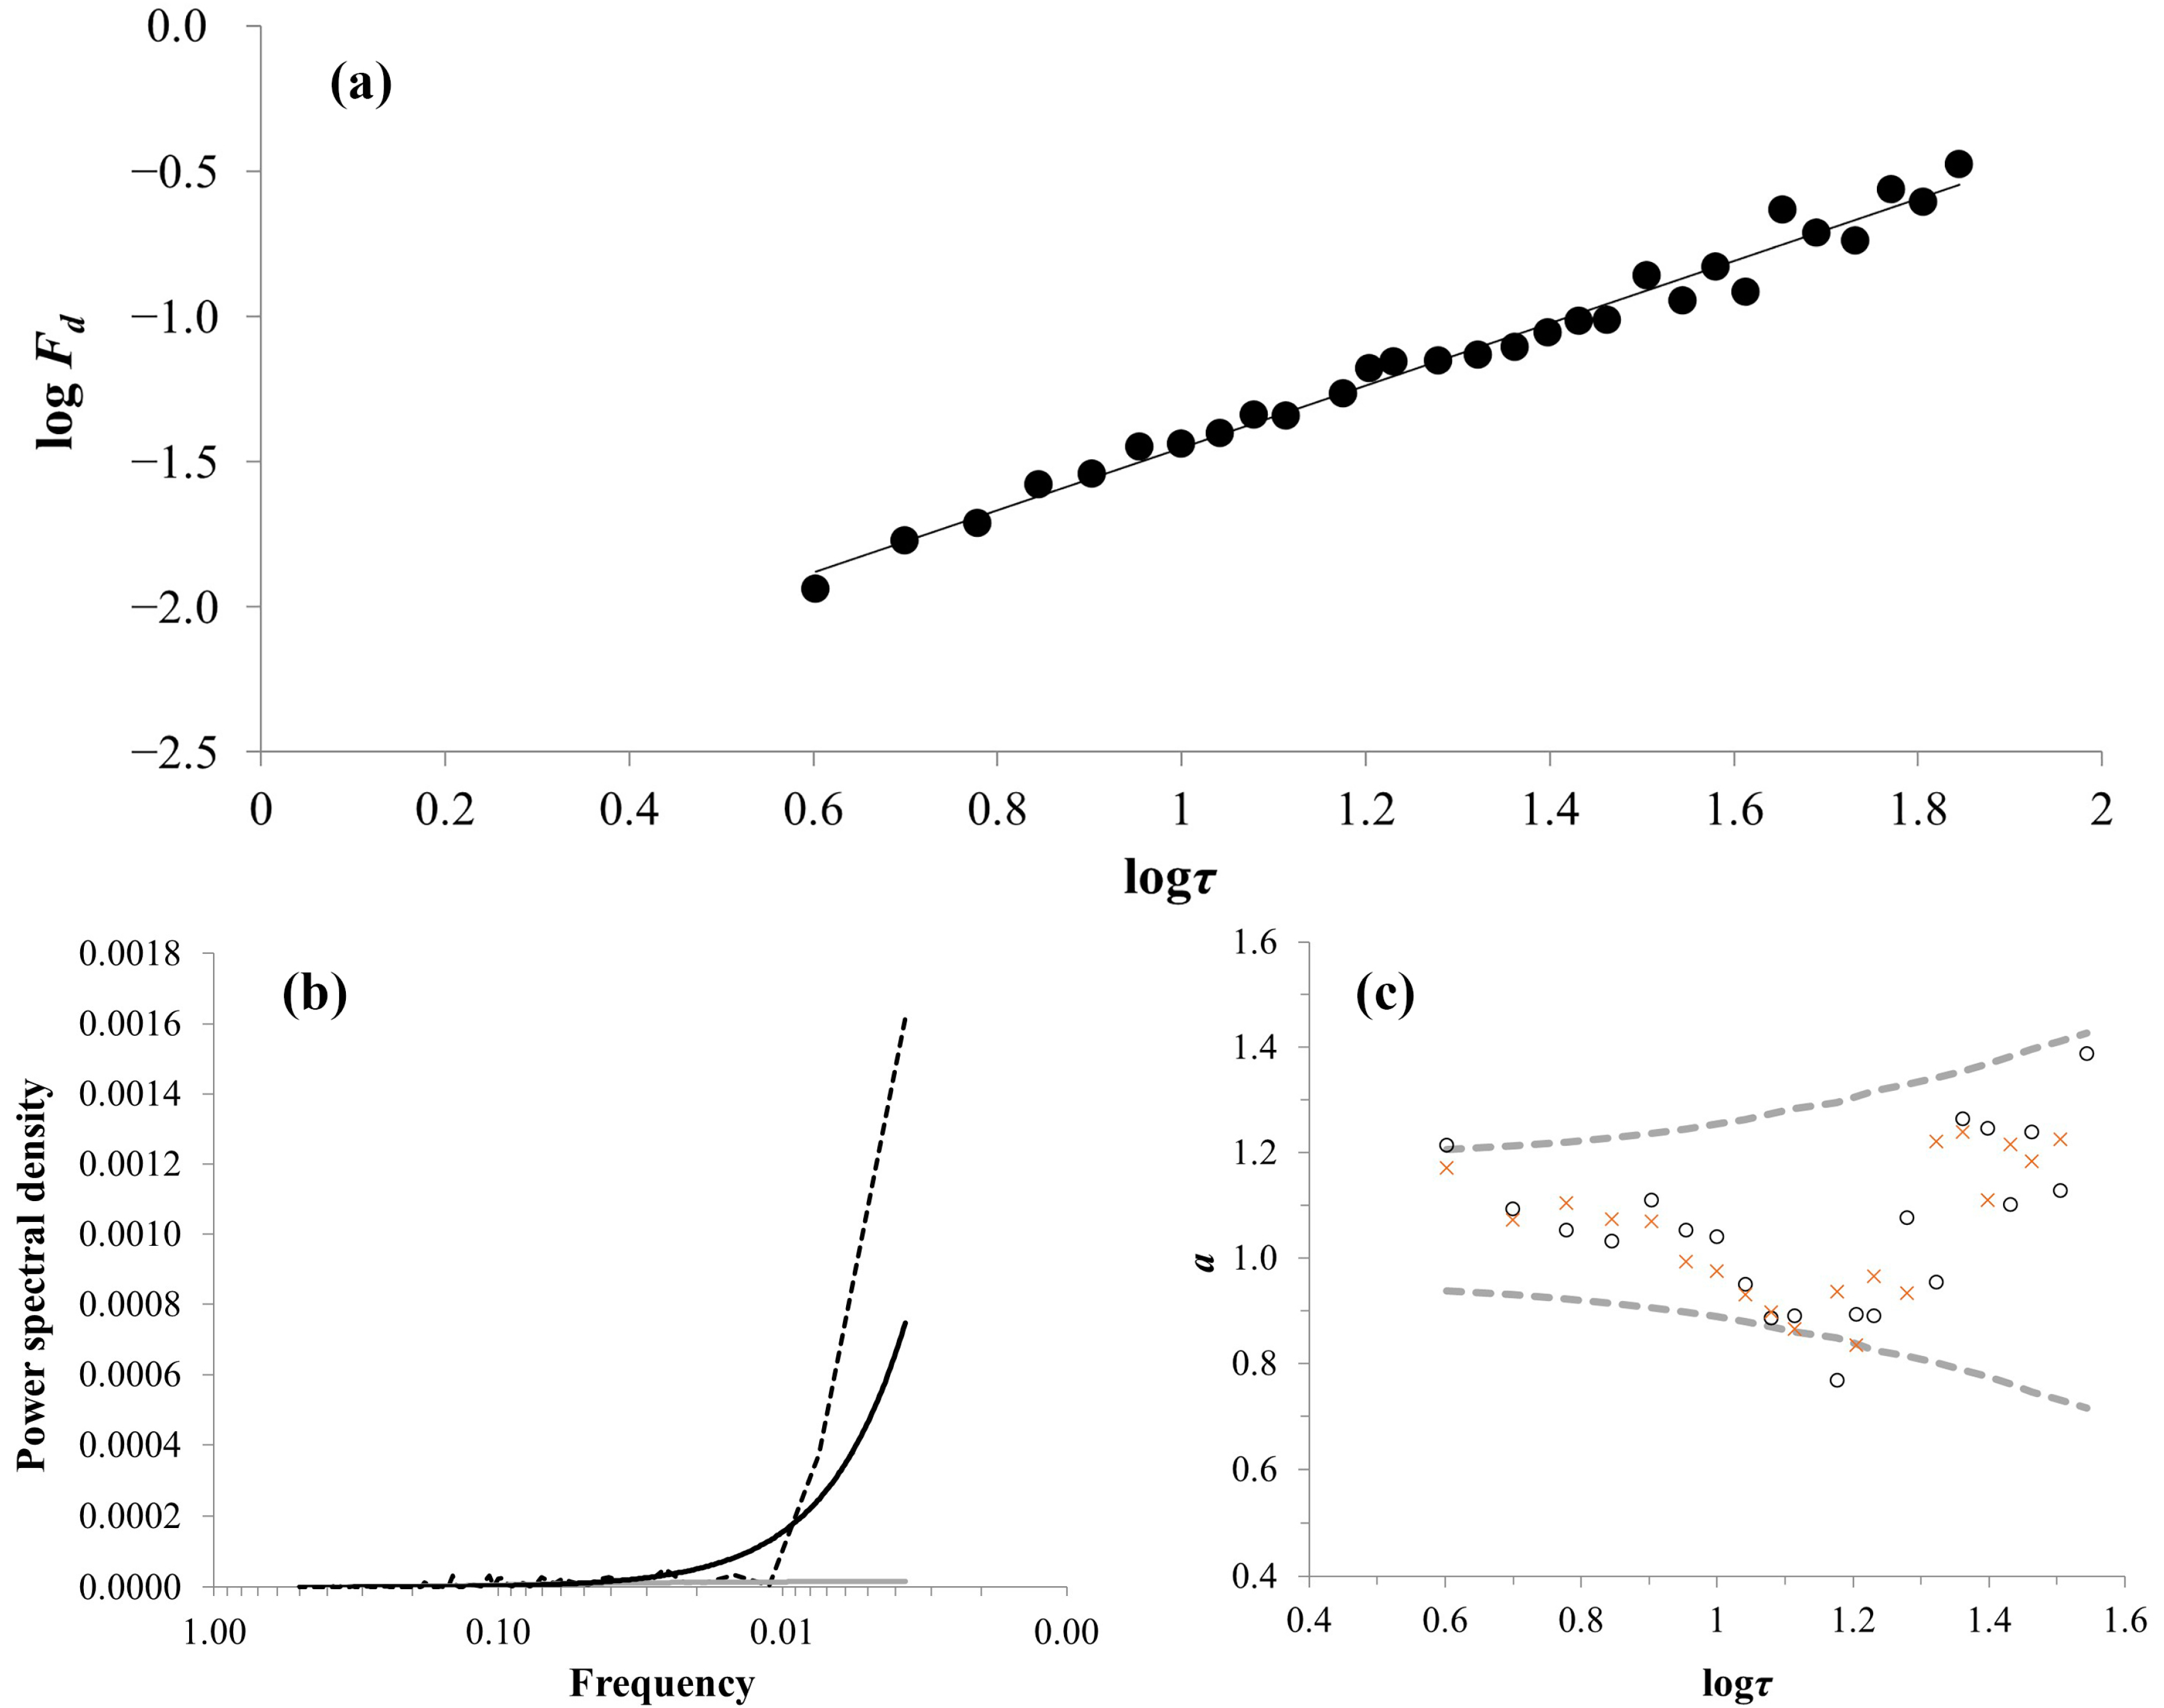
Figure 3. (a) Log–log plot of the root mean square fluctuation function, Fd, for the 25-year fixed-step humification versus the time interval τ (in 25-year steps) and the corresponding best fit equation (y = 1.07·x − 2.52, R2 = 0.98). (b) Power spectral density for the initial timeseries (dashed black line) with the corresponding power-law (black solid line) and exponential (gray solid line) fit (y = 0.0000001·x−1.58, R2 = 0.52; y = 0.00001701·e−9.71·x, R2 = 0.59). (c) Local slopes stability of logFd(τ) vs. logτ calculated for a 10-point window (red crosses) and a 9-point window (black circles) for the 25-year fixed-step timeseries. The dashed gray line illustrates the corresponding 2σ range, derived from the 500 fractional noise simulations.
Land 11 00862 g003
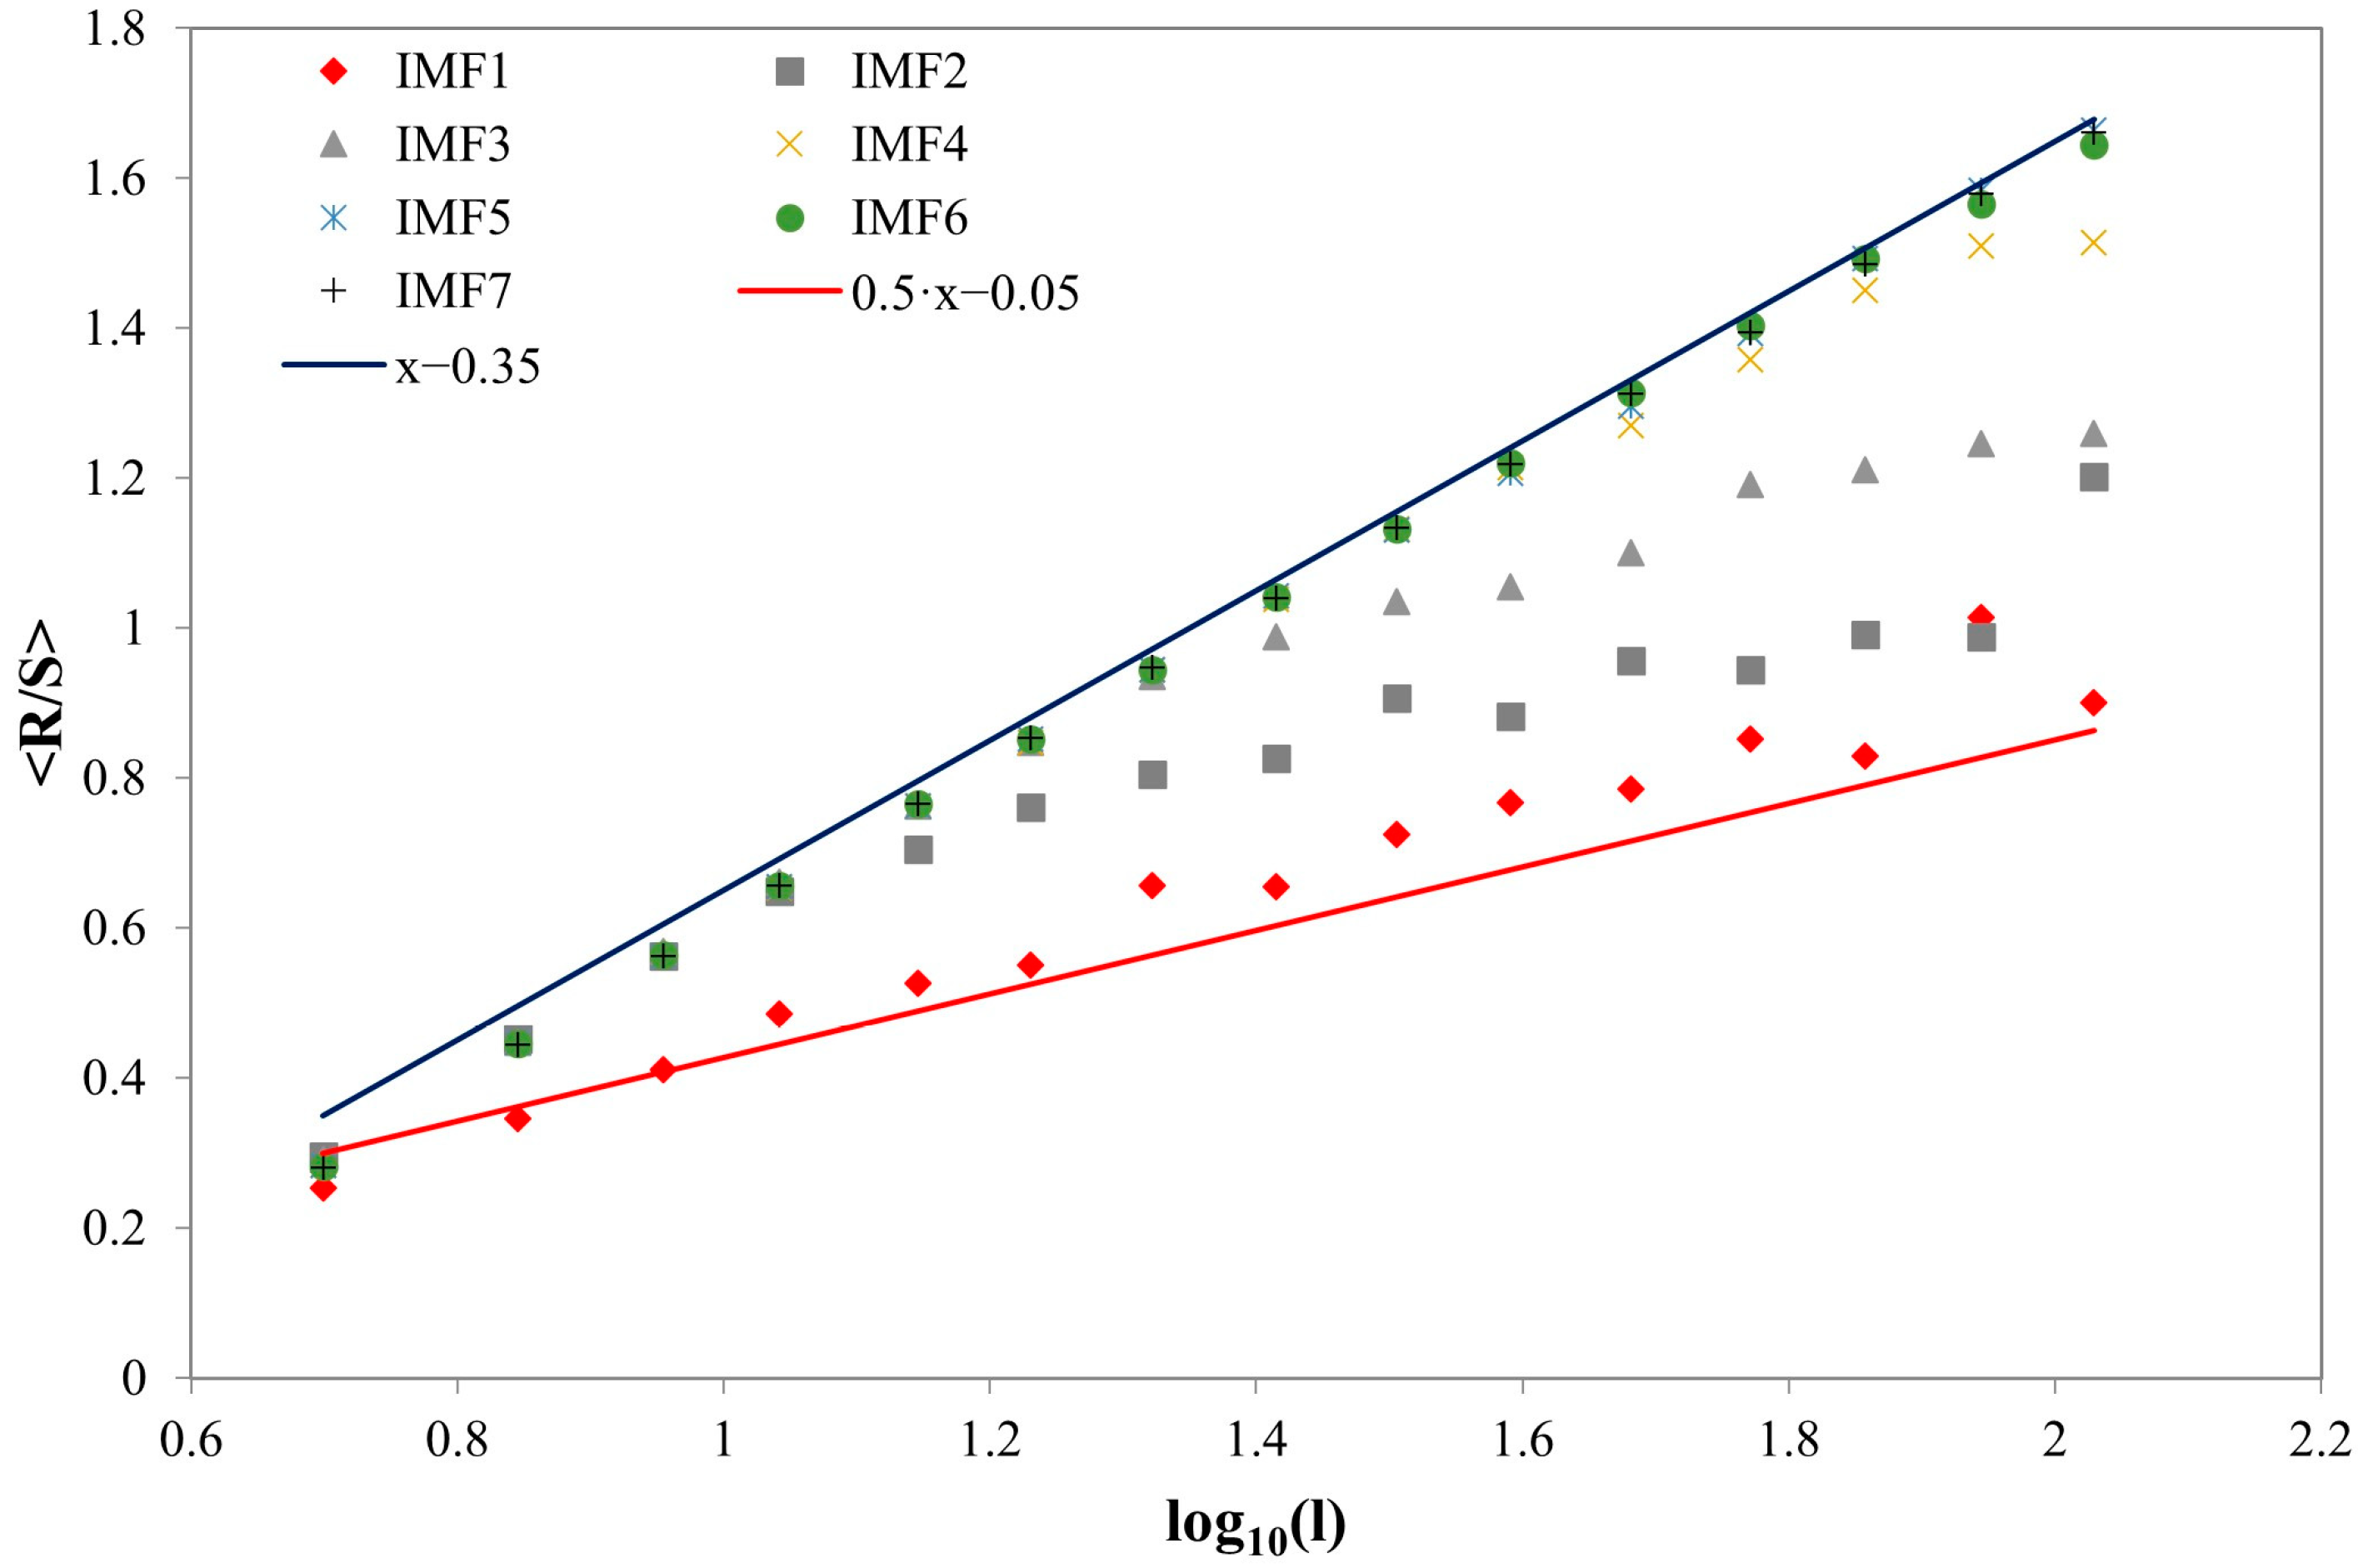
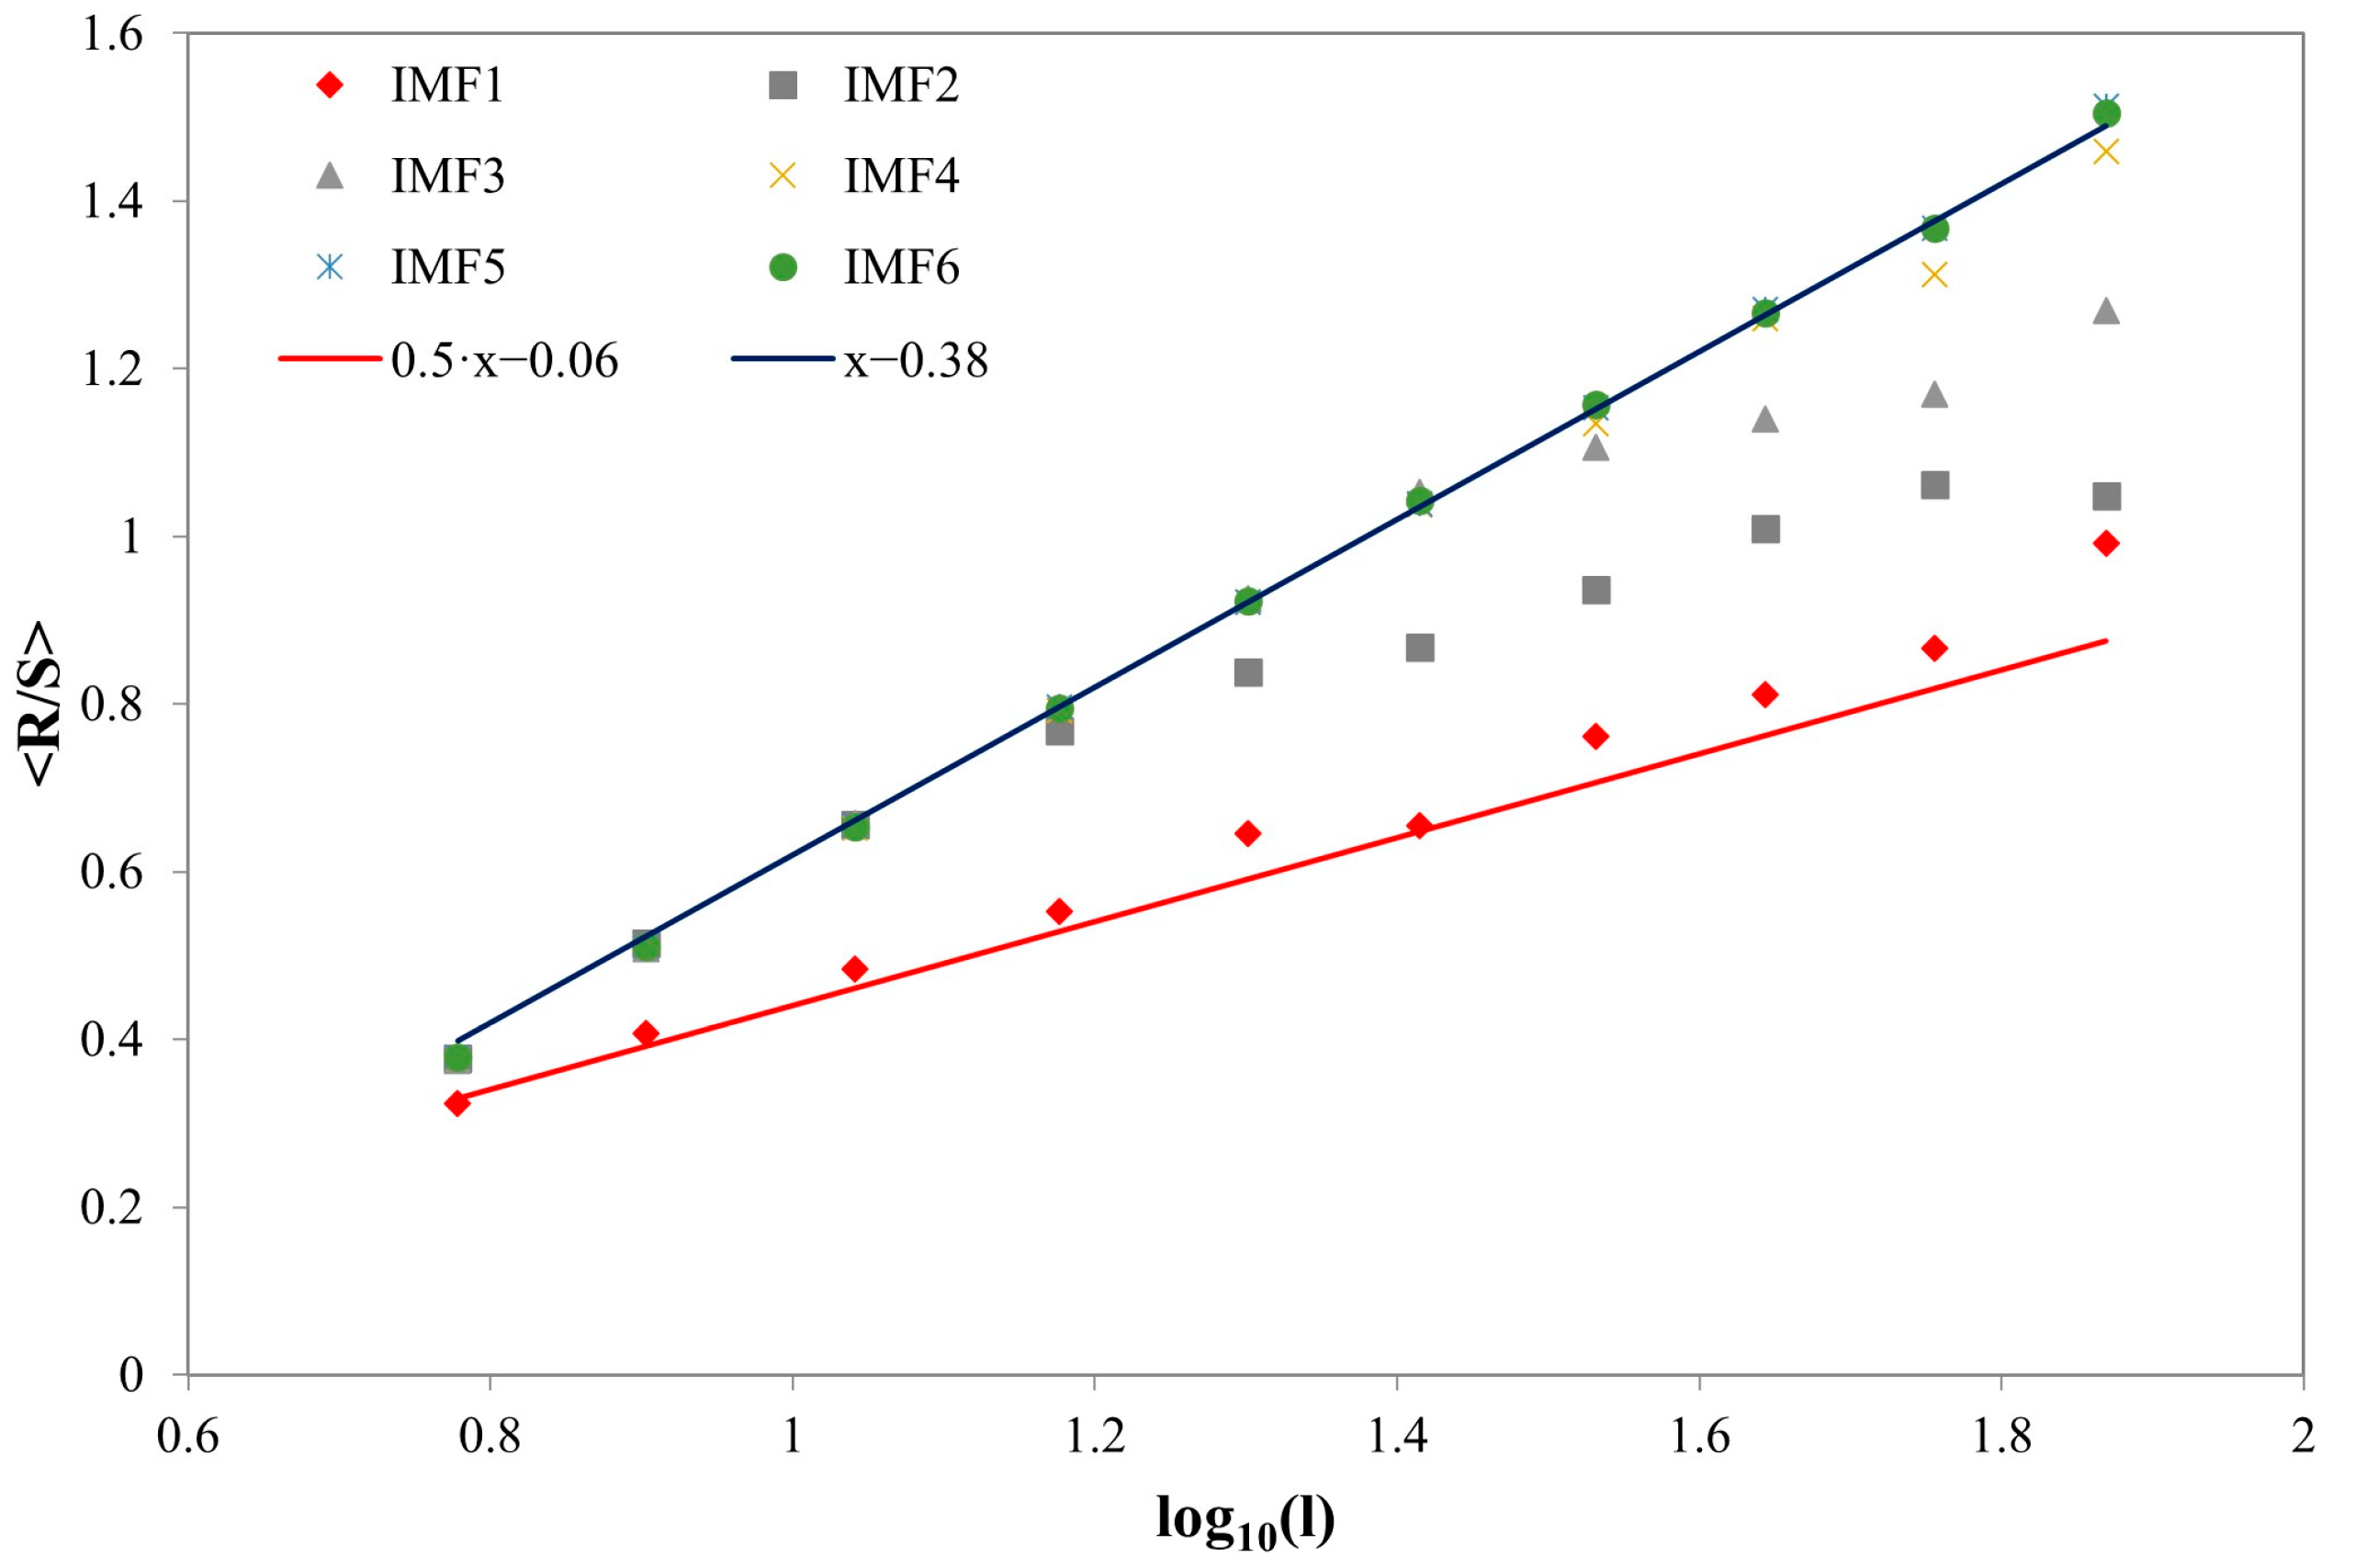
EEMD analysis was performed on the reconstructed humification timeseries and seven IMFs (IMF1–IMF7), and the trend was also obtained (Figure 4). For IMFs 5, 6 and 7, a straight line of the unit slope results in the log–log plot of the rescaled range (R/S) versus l. This behavior is identified as indicative of the IMFs that make up the macro-scale. For IMF 1, the result in the log–log plot of R/S versus l is also a straight line, but with a slope less than 0.5. This is the typical characteristic behavior of the IMFs that constitute the micro-scale. Finally, the Hurst analysis (Figure 5) of IMFs 2, 3 and 4 indicates slopes ranging between H = 1 and H = 0.5, which are typical for mid-scale IMFs. Thus, we conclude that the mid-scale exhibits long-range correlation.

3.2. Non-Linearity in Detrended Reconstructed Humification Timeseries
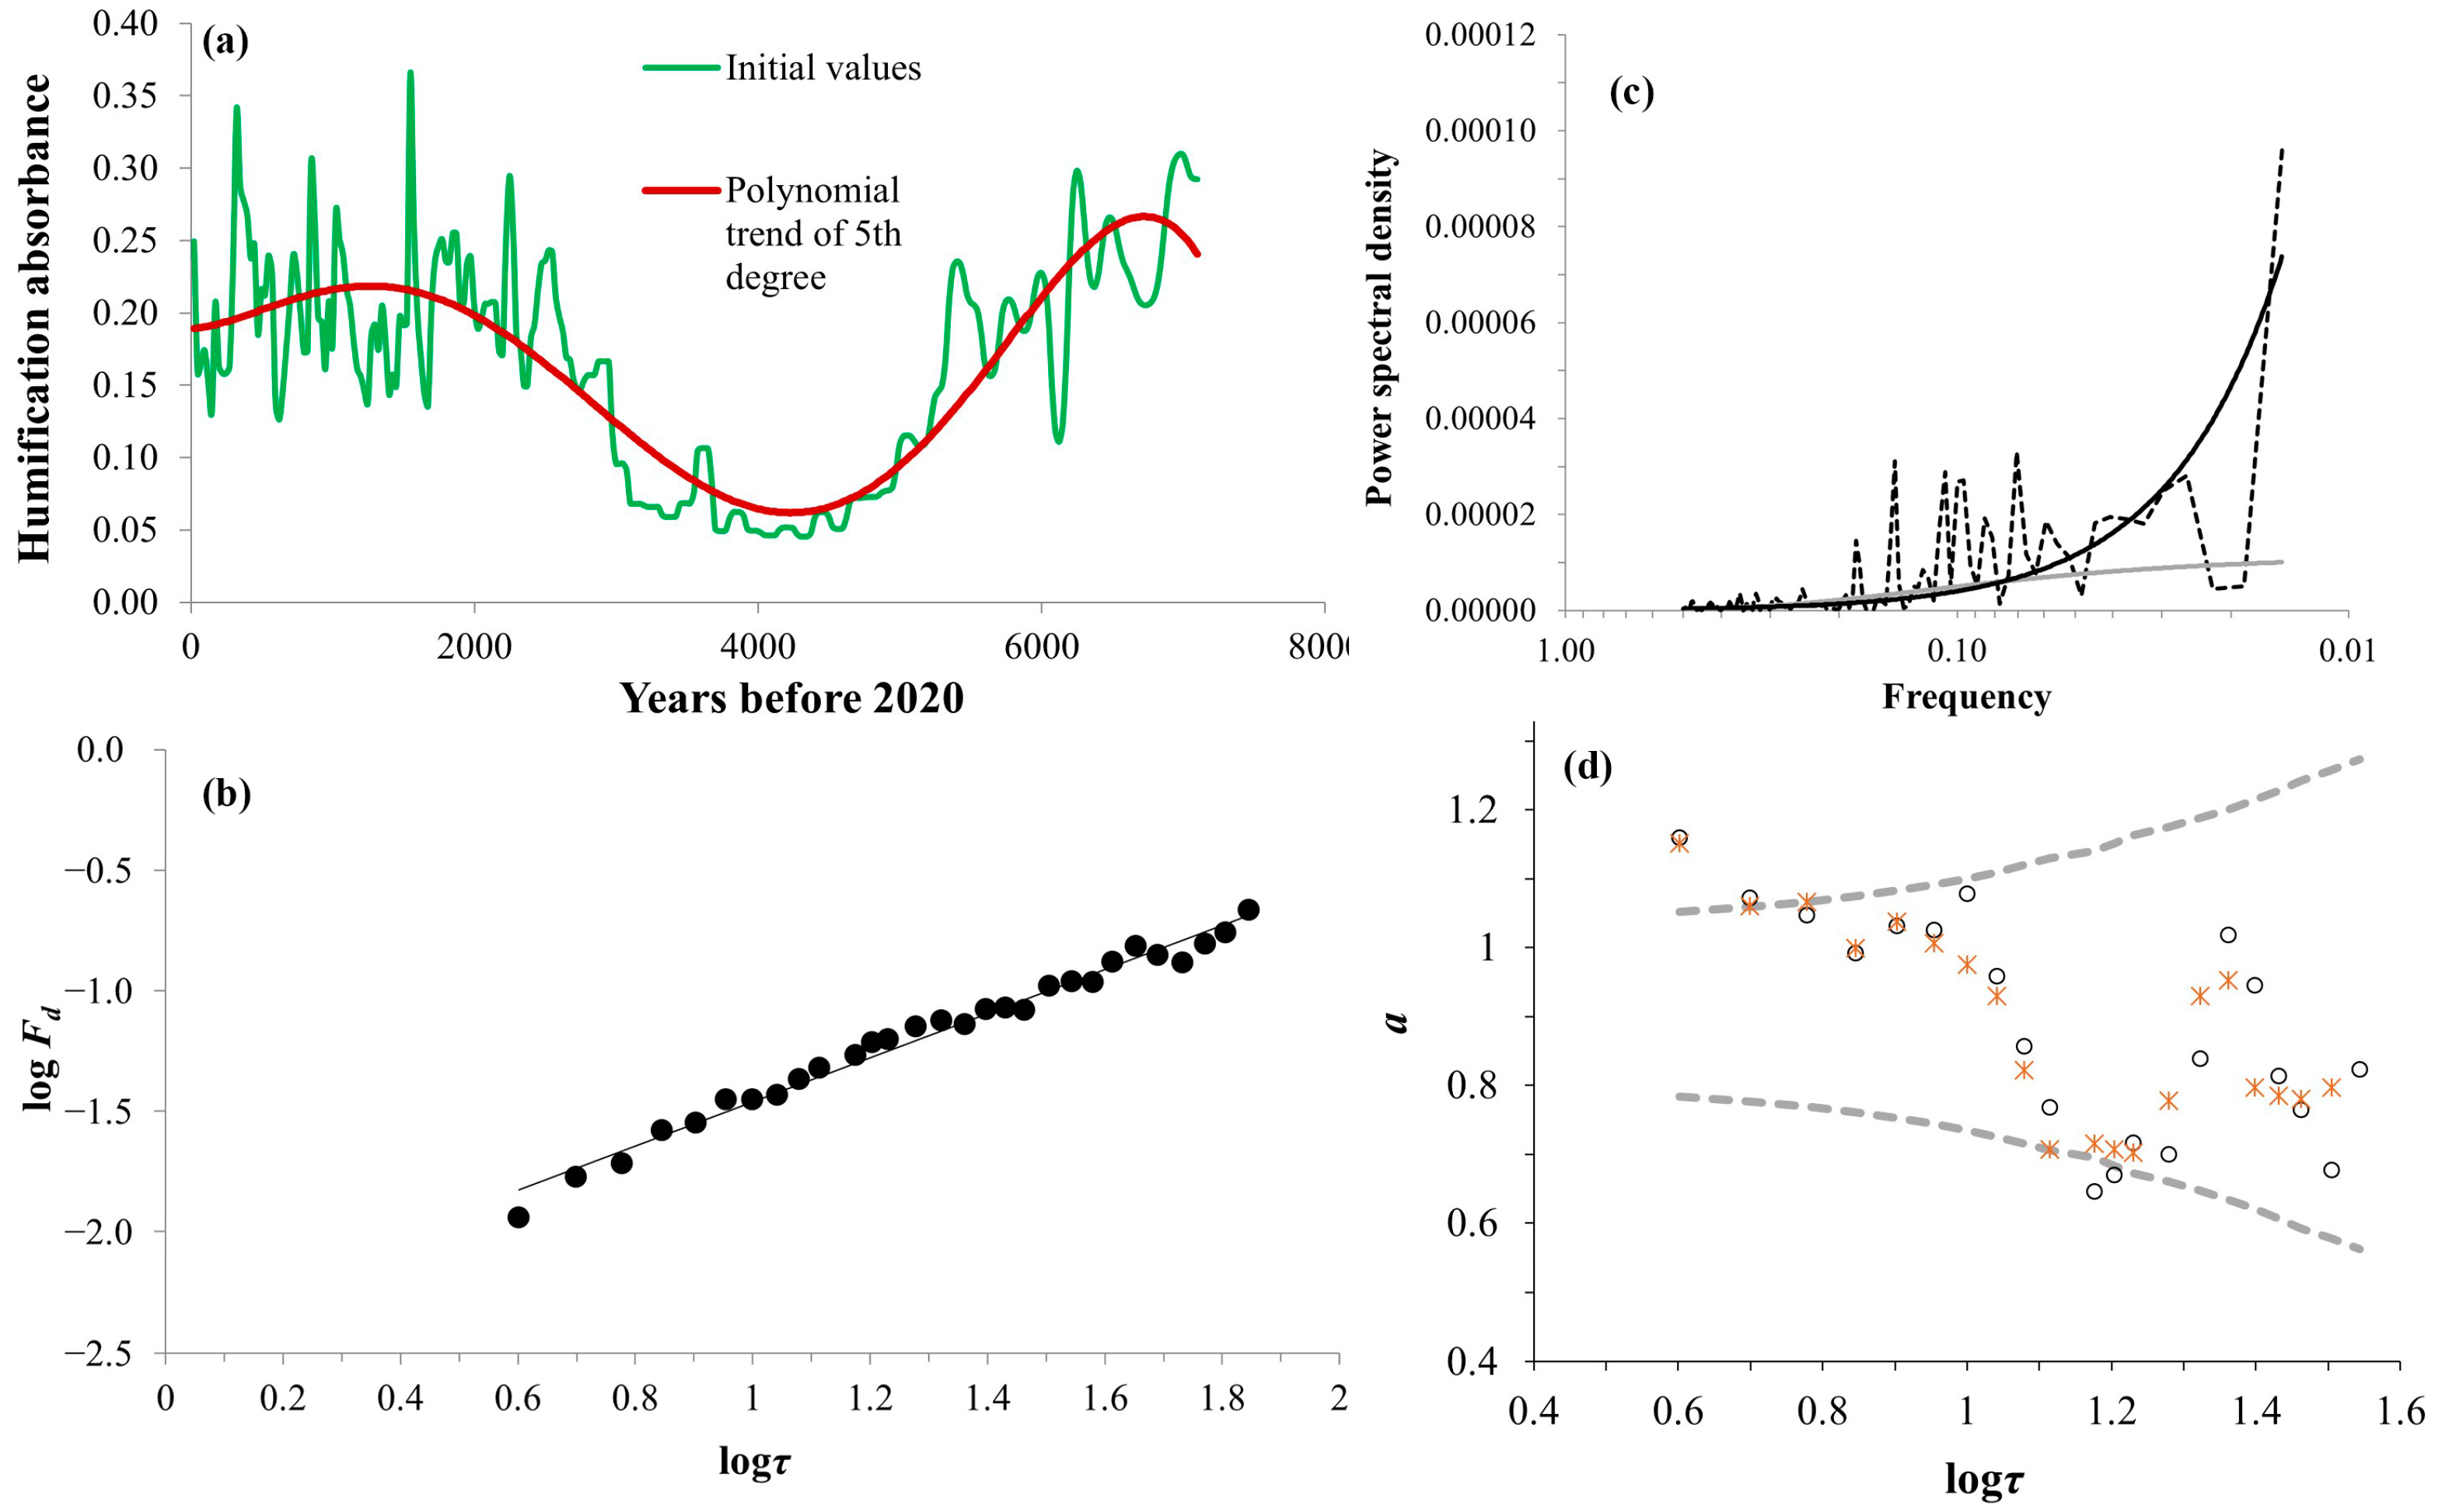
To find out the source of the scaling property obtained in Section 3.1, the DFA analysis was repeated on the reconstructed humification timeseries after detrending the dataset. This detrending was accomplished by applying a fifth-degree polynomial regression tool, as shown in Figure 6a. This figure shows that a periodicity of almost 6000 years prevails in the reconstructed humification timeseries. This periodicity has already been identified in solar activity analyzing reconstructed sunspot data back to 11,360 years before the present [38].
The DFA results obtained are shown in Figure 6b, where an exponent α = 0.92 is obtained, indicating persistent power-law correlations. This means that the long-term 6000-year periodicity does not significantly disturb the long-range correlations found in Figure 3 and Figure 7. In addition, as can be seen in Figure 6c,d both Maraun criteria for the detrended timeseries are also met.
Figure 6. (a) Fifth-degree polynomial fit to the humification timeseries. (b) Log–log plot of the root mean square fluctuation function, Fd, for the detrended 25-year fixed-step timeseries of humification vs. temporal interval τ (25-year step) and the corresponding best fit equation (y = 0.92·x − 2.38, R2 = 0.98). (c) Power spectral density for the detrended timeseries (dashed black line) with the corresponding power-law (black solid line) and the exponential (gray solid line) fit (y = 0.00000012·x−1.47, R2 = 0.40; y = 0.000011·e−8.25·x, R2 = 0.44). (d) Local slope stability of logFd(τ) vs. logτ, calculated for a 10-point window (red crosses) and a 9-point window (black circles) for the detrended 25-year fixed-step timeseries of humification. The dashed gray line represents the corresponding 2σ threshold range, derived from the 500 fractional noise simulations.
Land 11 00862 g006
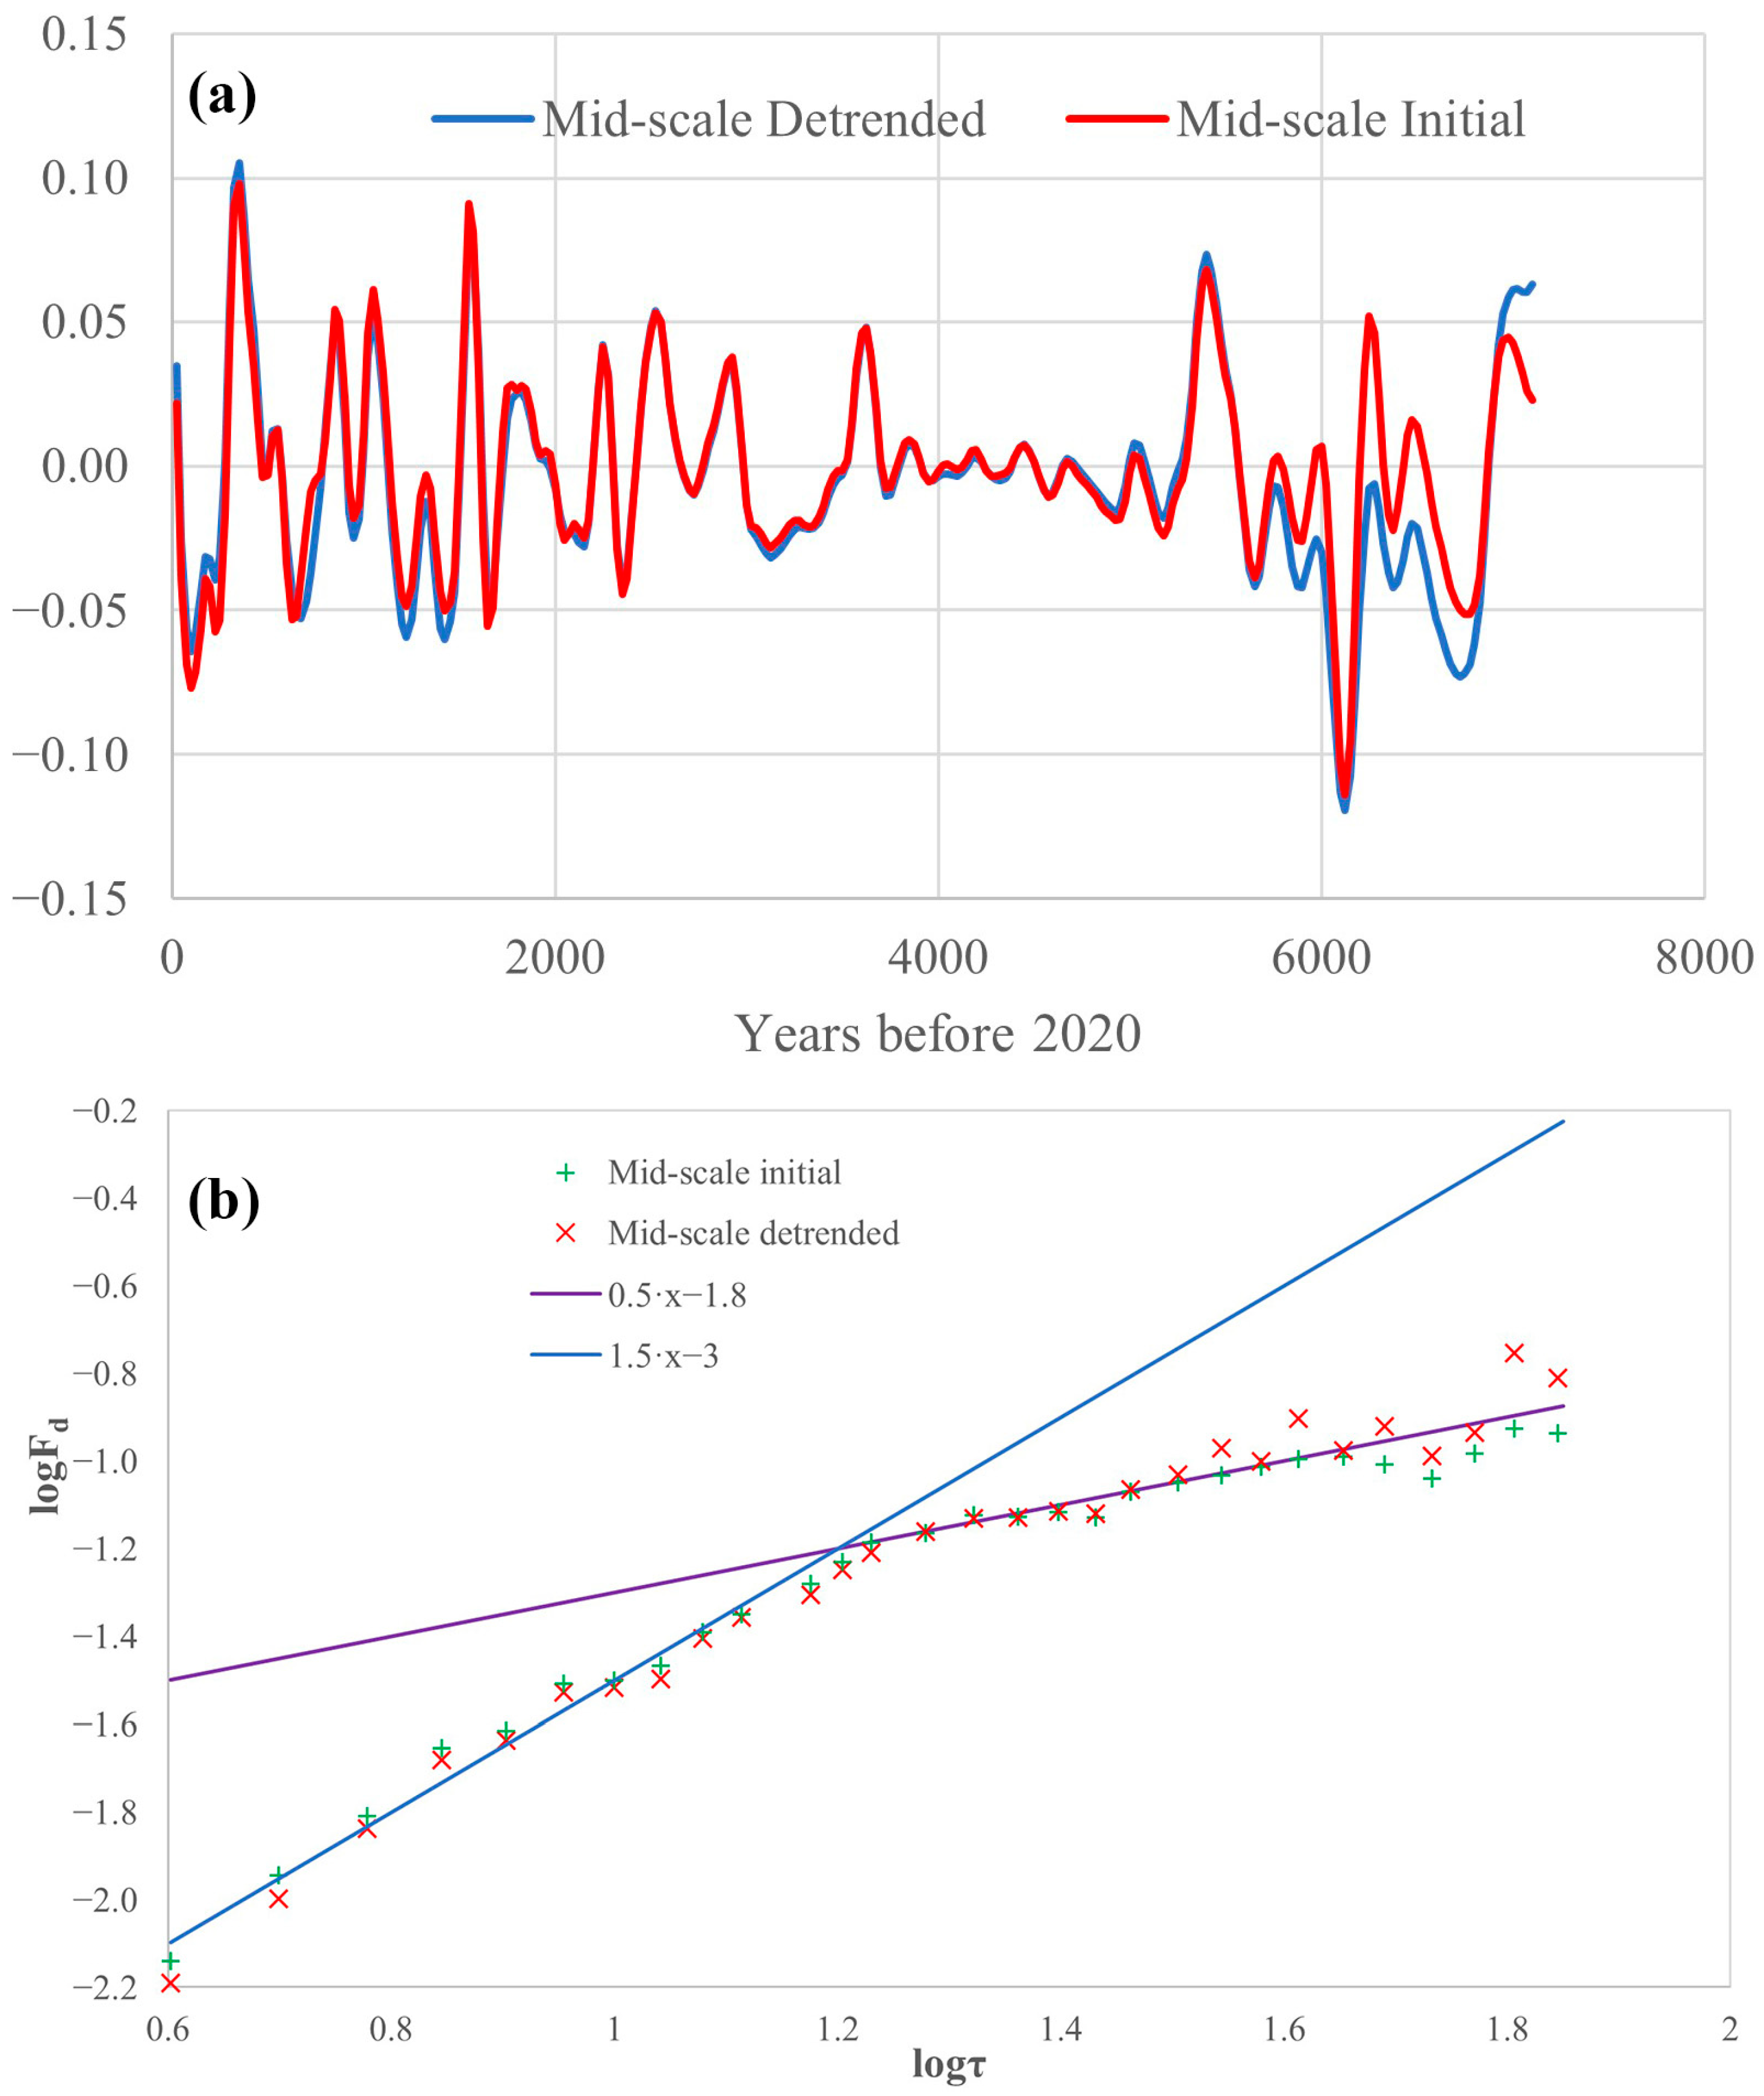
As in the previous case, EEMD analysis was performed on detrended reconstructed humification timeseries. As a result, seven IMFs (IMF1–IMF7) and one trend emerged (Figure 7). This can be explained by the removal of the trend in the initial timeseries. The results of the Hurst analysis of the detrended reconstructed humification timeseries (Figure 8) show that micro-, mid- and macro-scales are identified for the same IMFs, i.e., 1, 2-3-4 and 5-6-7, respectively. The mid-scale in 5-6-7 also exhibits a long-range correlation. The mid-scale IMFs for the reconstructed humification timeseries (mid-scale initial) and detrended reconstructed humification timeseries (mid-scale detrended) are directly com-pared in Figure 9. It is worth noting the distinction of the mid-scale detrended timeseries in comparison to the mid-scale initial timeseries from about 6000 years before 2020 and earlier.
Figure 7. EEMD of the detrended reconstructed humification timeseries in seven IMFs and a trend.
Land 11 00862 g007
According to the humification timeseries as well as the detrended humification timeseries, they can be decomposed into three timeseries, the micro-scale, the mid-scale and the macro-scale, based on their R/S or Hurst analysis, shown in Figure 5 and Figure 8. Each mid-scale timeseries component consists of the sum of IMF2, IMF3 and IMF4, and their comparison is shown in Figure 9a. It is remarkable, to distinguish the mid-scale detrended timeseries from the mid-scale original timeseries from about 6000 years before 2020 and earlier. Next, we use the DFA for the mid-scale components of the humification timeseries and the detrended humification timeseries, which is shown in Figure 9b. For the logτ time intervals of 0.6 to about 1.2, an α-exponent of 0.5 is obtained, revealing an uncorrelated signal, while for 1.2 < logτ < 1.85, the α-exponent is equal to 1.5, denoting the presence of temporal long-range correlations.
Figure 9. (a) Mid-scale IMFs calculated as the sum of IMFs 2, 3 and 4 for the case of mid-scale initial and mid-scale detrended timeseries. (b) DFA analysis for the mid-scale components of the initial humification timeseries and the detrended humification timeseries.
Land 11 00862 g009
The results presented in this section showed the existence of a long-range memory effect in both versions of the humification timeseries—the observed and the detrended one. In addition, the analysis showed a DFA-exponent close to 1, indicating the persistence and long-range correlations of the 1/f type (“flicker noise”). It should be recalled that although 1/f noise was discovered by Johnson [39], the production of the 1/f signal was introduced as a mechanism for the concept of self-organized criticality (SOC) by Bak et al. [40,41] to explain the wide appearance of fractal structures in nature. In fact, it was revealed that the self-similarity in space and time are interrelated, and one emerges from the other. The concept of SOC refers to the fact that a dissipative dynamical system with many degrees of freedom operates close to a minimum stability configuration, achieving it without any fine tuning from an external cause. Therefore, the results of the analysis reveal the fractal behavior of the humification temporal evolution.

3.3. Non-Linearity in Deseasonalized and Detrended Reconstructed Water Table Depth and Temperature Timeseries

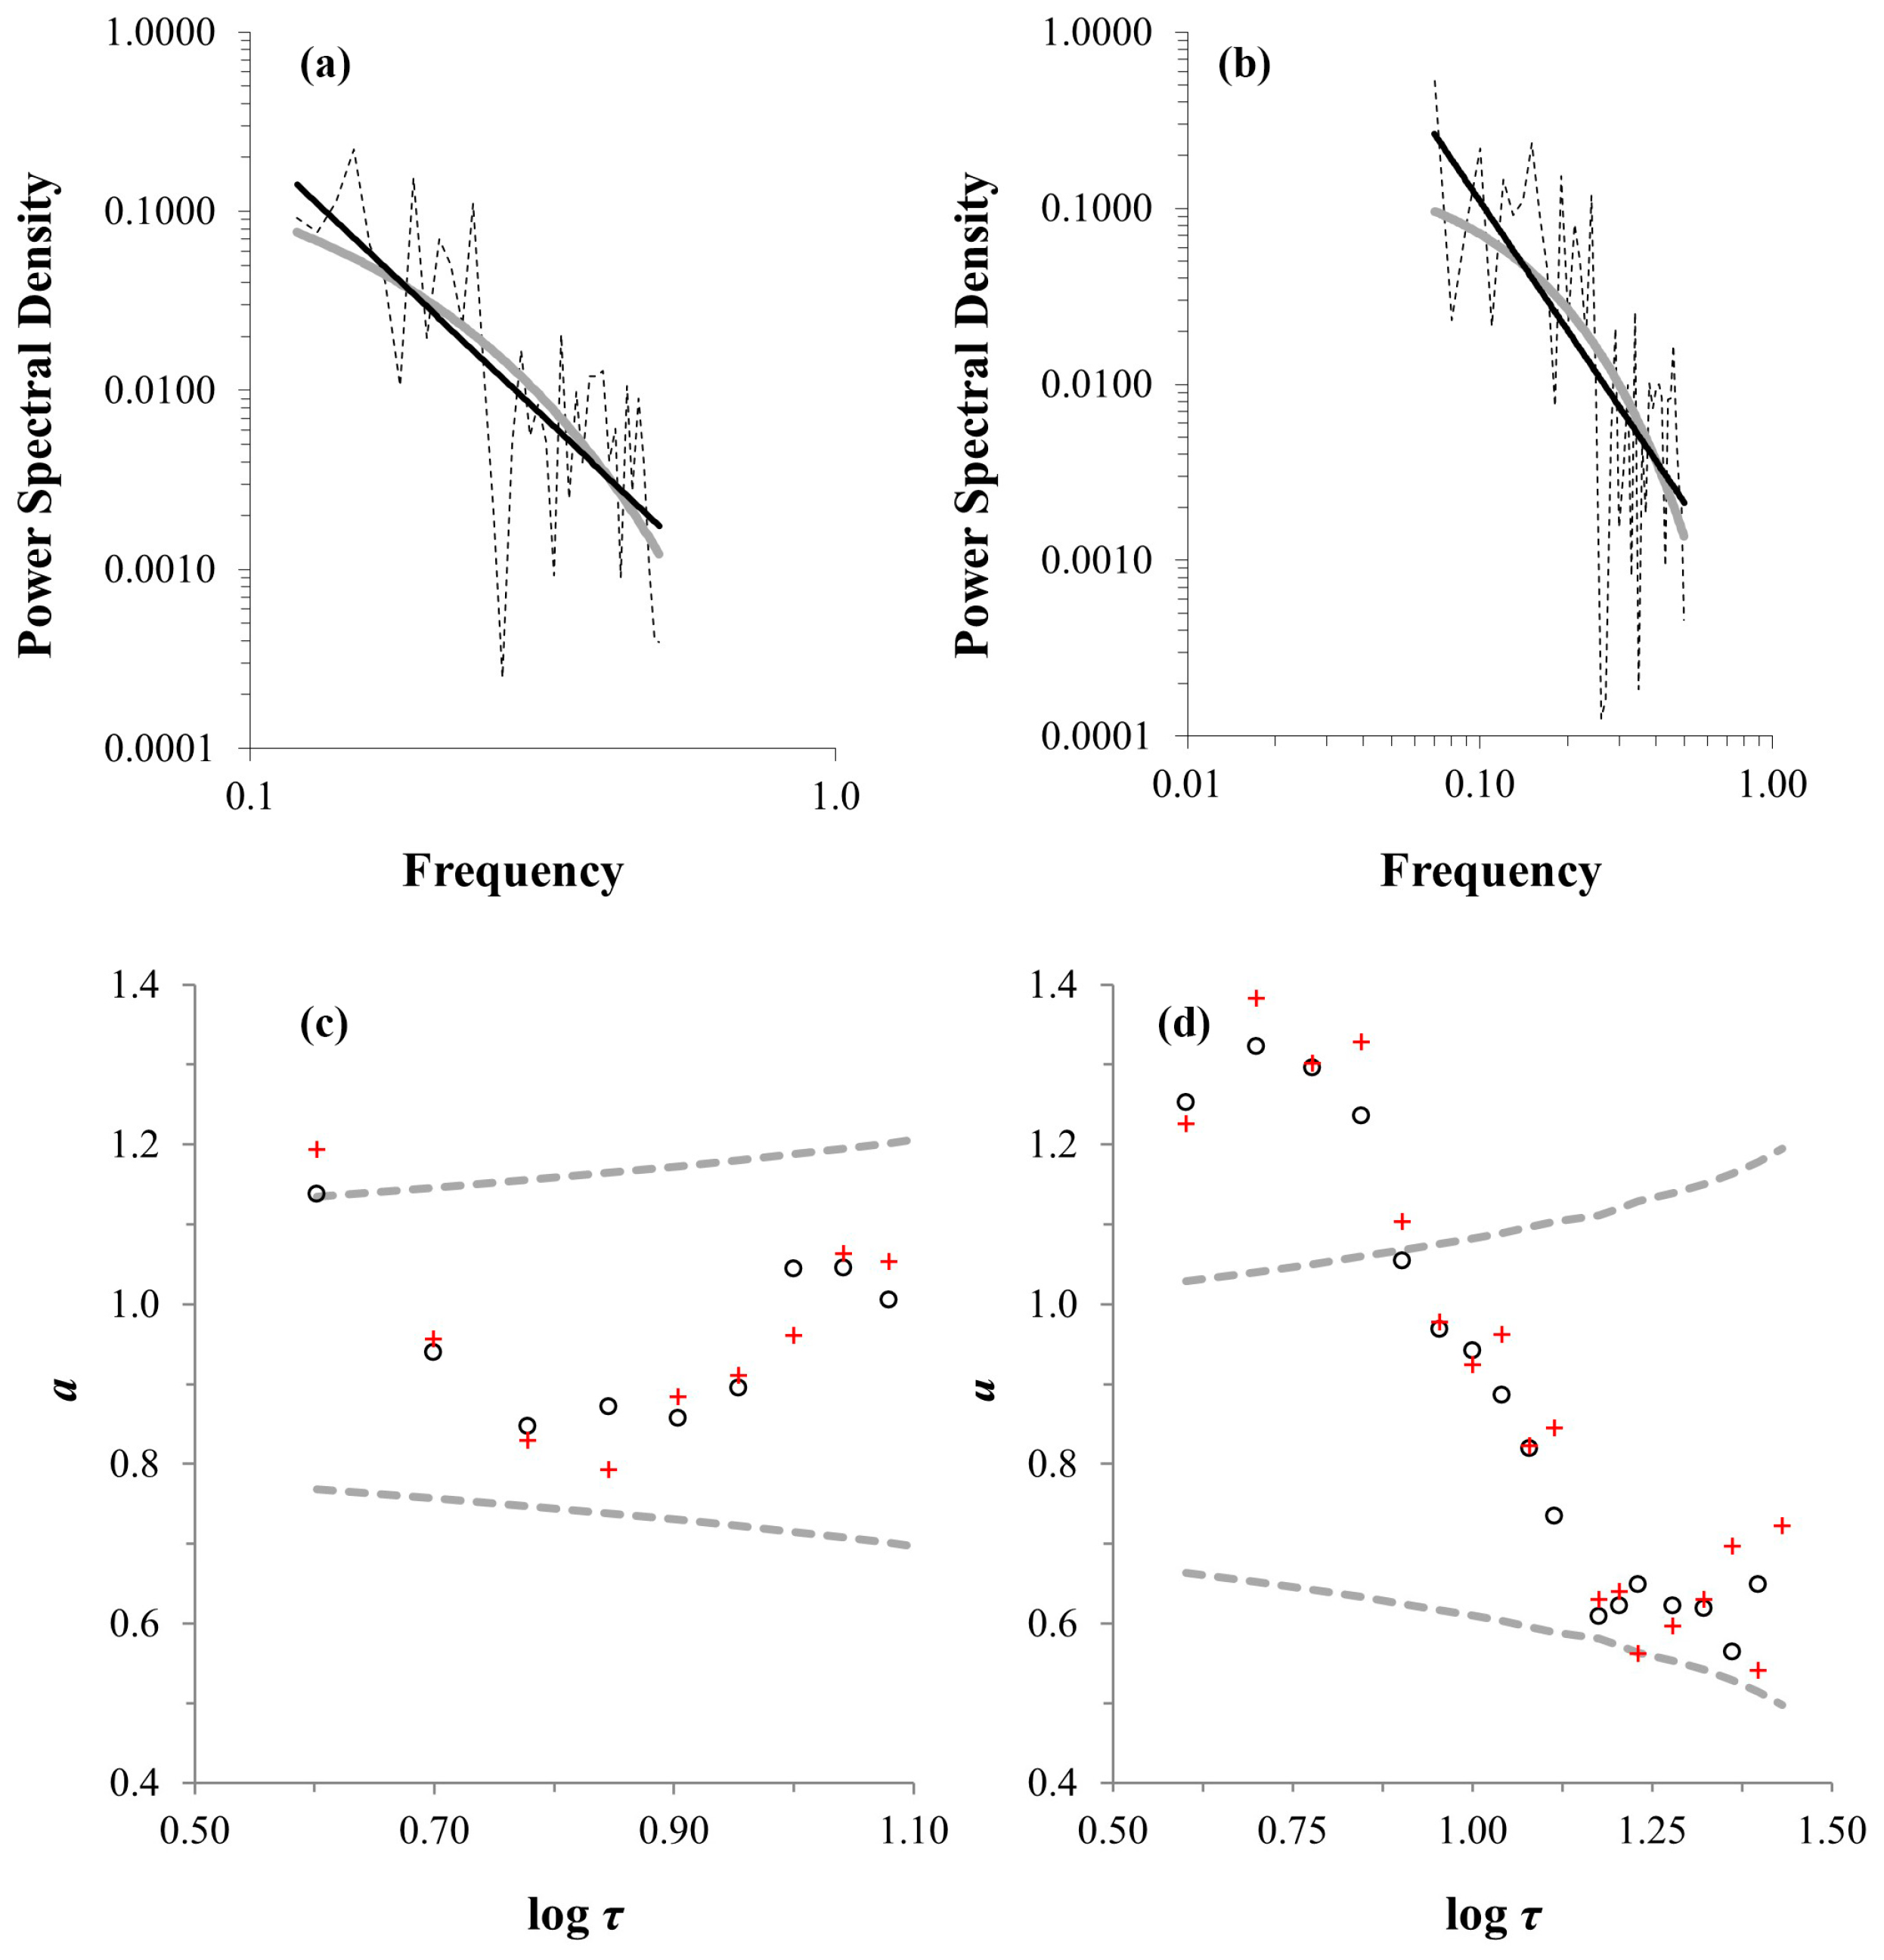
We examined whether the above-described power-law persistence also occurs in WTD and temperature data dynamics. The application of the DFA technique to the detrended and deseasonalized WTD and temperature timeseries resulted in a scaling exponent α = 1.02 and α = 0.92, respectively, showing a persistent behavior of the 1/f type (see Figure 10a,b). To confirm these scaling properties, the power spectral density and the method of the local slopes of the fluctuation functions were also employed (i.e., the two criteria proposed by Maraun et al. [37]). The results obtained are shown in Figure 11a–d, where both Maraun criteria are met, verifying the power-law long-range correlations in the temporal evolution of WTD and temperature.
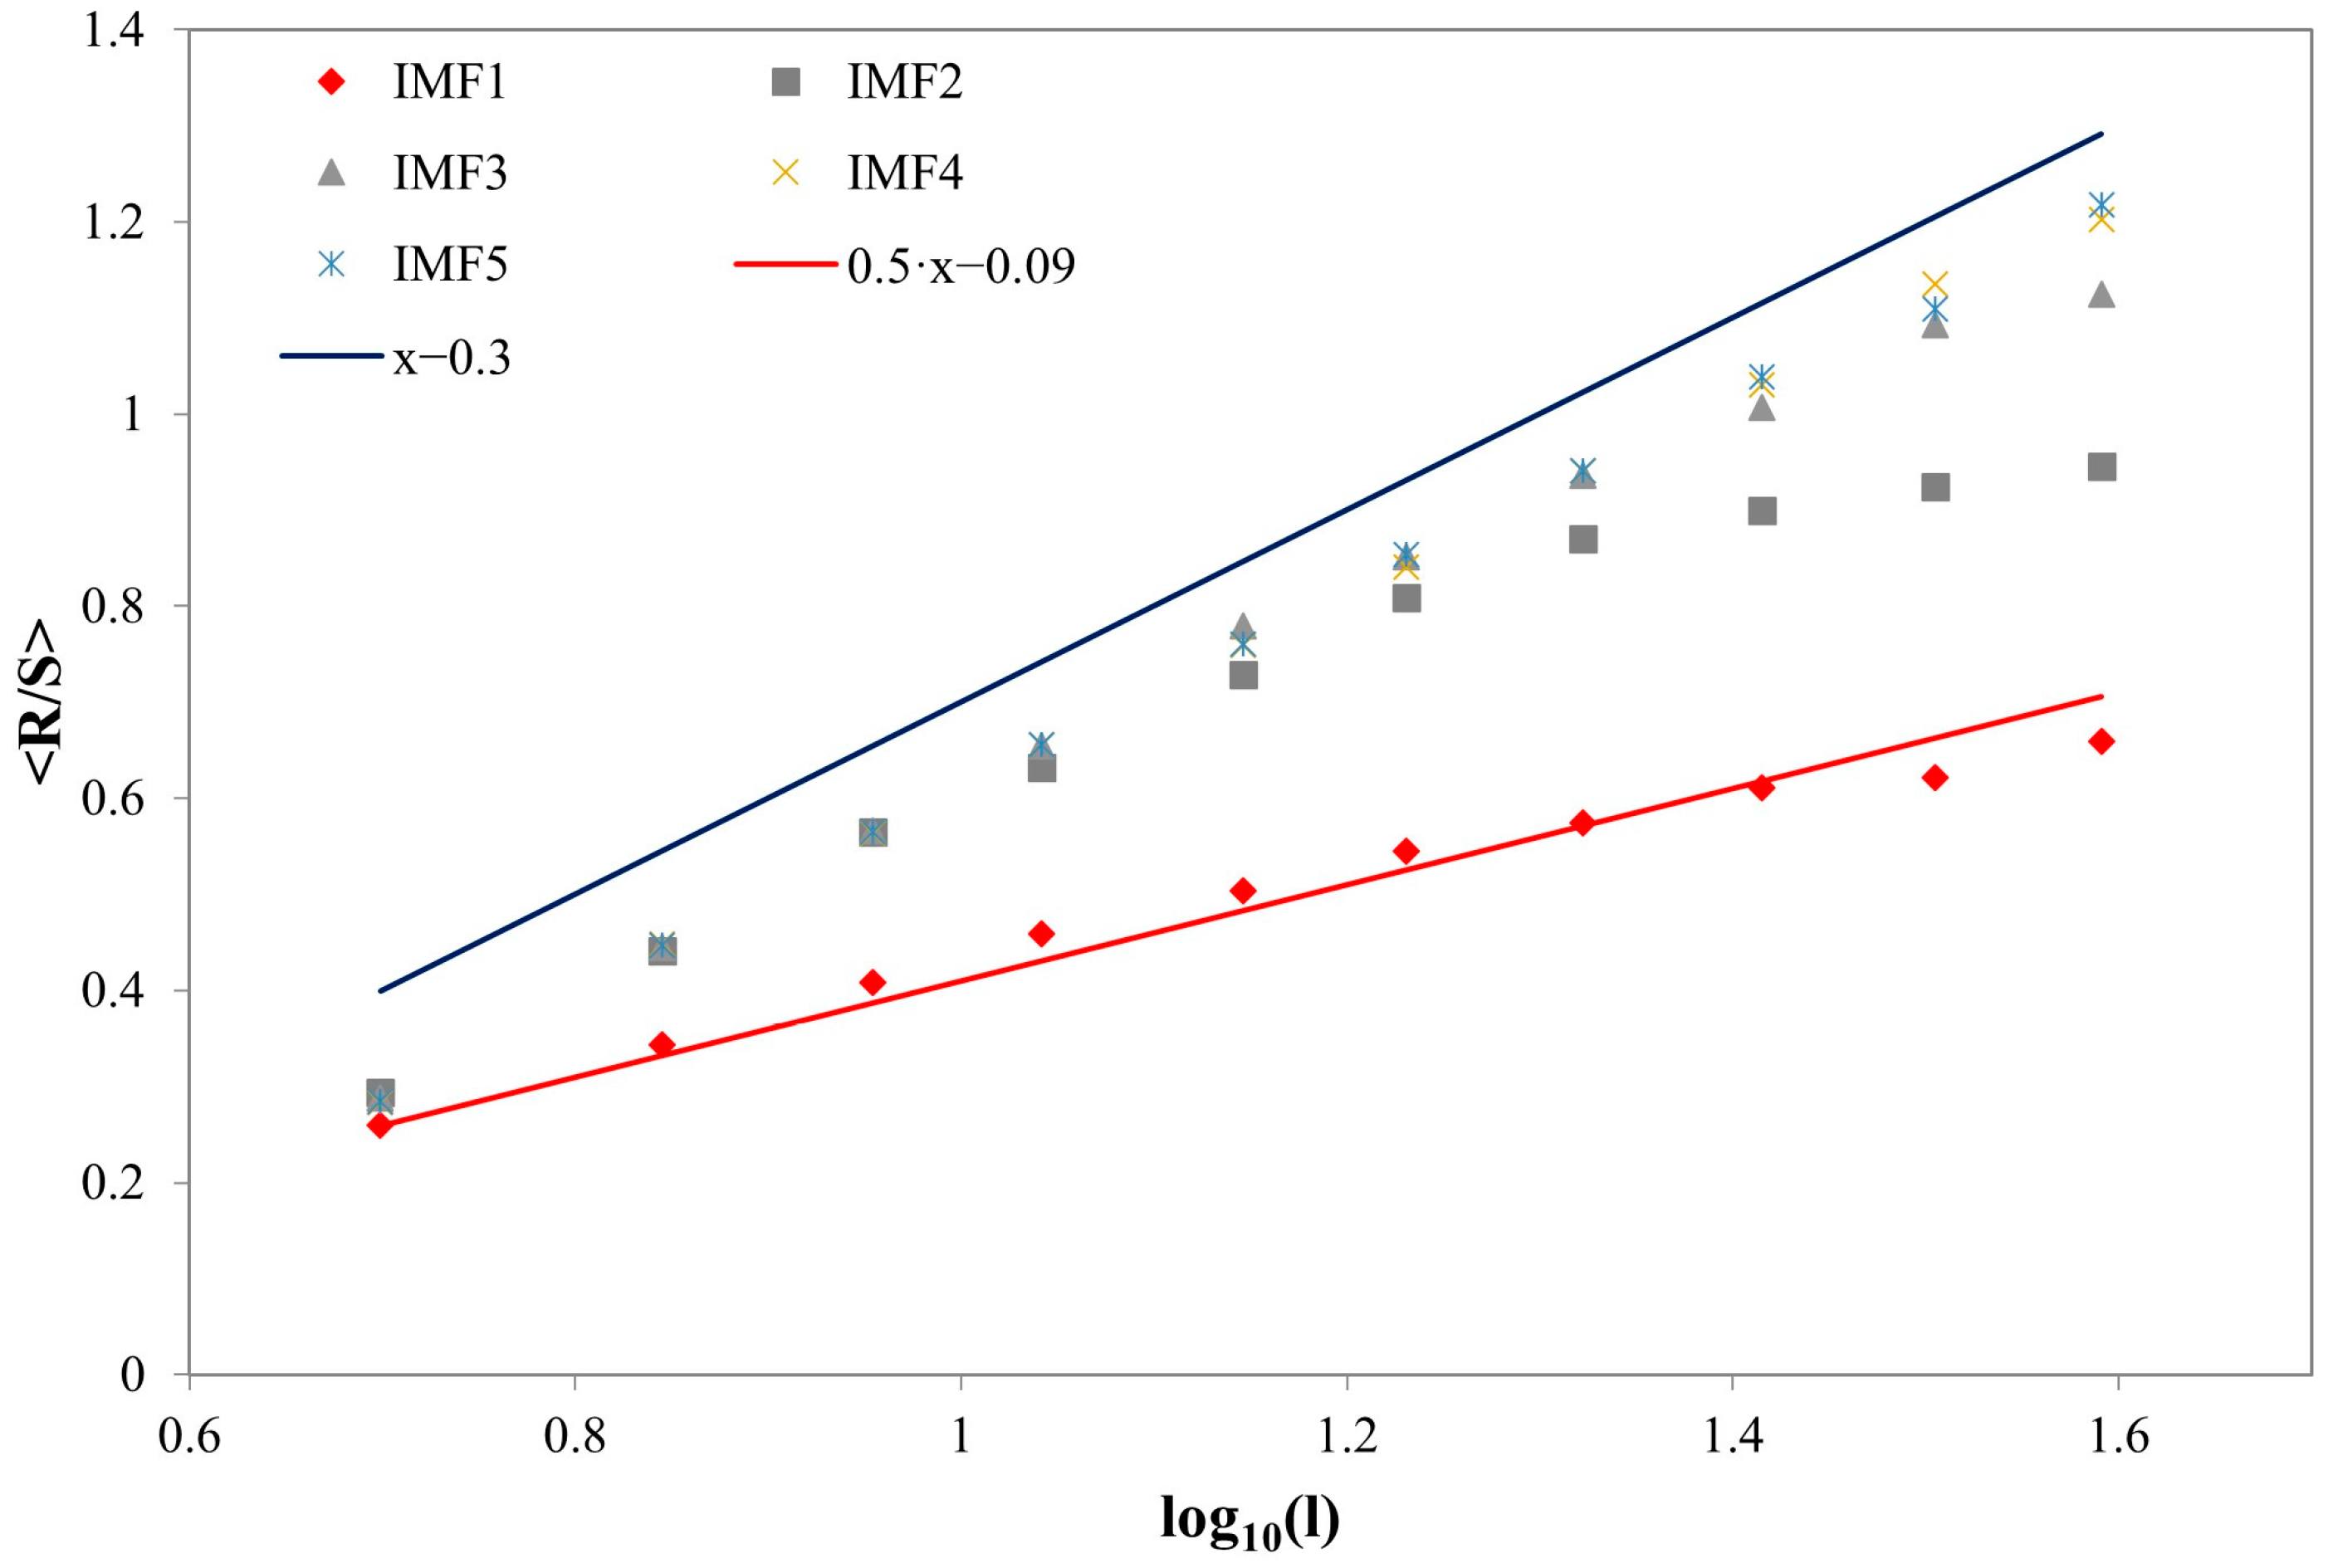
The water table depth in peatlands is closely related to the physical properties of peat, such as density, peat composition and humification, hydraulic conductivity, and specific yield. In addition, depth-to-water table and peat temperature are two key environmental parameters that play a pivotal role in soil carbon balance and methane emissions from peatlands [42]. Peatlands’ response to climate parameter changes is affected by numerous internal feedbacks that are complex and operate at various time scales [43]. Furthermore, according to future climate change scenarios, areas with high latitudes will be characterized by higher average precipitation [44]. Results such as those found here help us to understand the hydrological and ecological mechanisms that control the response of peatlands to changes in water–climate balance, which is vital for predicting possible feedback for C and N global cycles [45,46]. Due to the importance of the peatland–atmosphere exchange, the embodiment of peatlands within global climate models can be beneficial to further understand peatland–climate feedback [47,48]. EEMD analysis [49,50] was also performed on the deseasonalized and detrended reconstructed water table depth timeseries. As a result, five IMFs (IMF1–IMF5) and a trend emerged (Figure 12). This can be explained by the smaller number of datapoints present in the water table depth timeseries. The results of the Hurst analysis of the deseasonalized and detrended reconstructed water table depth timeseries (Figure 13) show that IMF1 can be considered as the micro-scale, while solely IMF2 corresponds to the mid-scale. IMF3 to IMF5 show a slope close to unity, so they belong to the macro-scale.
Finally, Figure 14 shows the results of the EEMD analysis performed at the deseasonalized and detrended reconstructed mean July air temperatures timeseries. Six IMFs (IMF1–IMF6) and a trend were obtained. This can, again, be explained by the number of datapoints available in the analyzed timeseries. The results of the Hurst analysis of the deseasonalized and detrended reconstructed mean July air temperatures timeseries (Figure 15) show that while IMF1 is definitely the micro-scale, IMF2 and IMF3 belong to the mid-scale, exhibiting two different slopes for small and large scales, respectively. IMF4 to IMF6 exhibit a unity slope and therefore belong to the macro-scale.
The DFA is fine for a nonintermittent, quasi-Gaussian case, but in the general multifractal case, the Haar fluctuations method (HFM) developed by Lovejoy and Schertzer [49,50] would give more accurate results. An example of applying both DFA and HFM for the detection of 1/f noise (as is our case here) was presented by Varotsos et al. [16]. The EEMD resolved the problem of mode-mixing caused by intermittent signals, while although EEMD derives from EMD, it still suffers from the limitation of frequency resolution, i.e., a relatively low and a relatively high frequency cannot be separated for a reasonable number of iterations. Finally, the results of EEMD are influenced by the sampling frequency in the sense that if the sampling frequency is not high enough, the extreme values of the signal affect the envelope calculation employed in the EEMD algorithm [51]. The abovementioned limitations may affect the relevant results of the present study in a way that will be considered in our future research on this subject. However, these limitations are expected to leave the main conclusion on the 1/f behavior and the presence of an almost 6000-year periodicity in the reconstructed peat humification timeseries more or less unaltered. Future research on the application of FHM using the present data may also reveal additional interesting dynamics.

4. Conclusions

This study attempts to further understand the dynamics of humification, water table depth and mean July air temperature data. After transforming the original data using the interpolation technique, the DFA method was applied to the new timeseries and its detrended version. According to the analyses, the temporal variability of the humification, water table depth and temperature showed persistent long-range correlations with an exponent α close to 1. This indicates that a slight fluctuation in each of these parameters in the past is very likely to be followed by an even smaller one in the future (or, similarly, a large fluctuation in these parameters in the past tends to be followed by an even larger one in the future). In addition, the time fluctuations in humification, water table depth and temperature are consistent with noise 1/f, which, although widely occurs in nature, no generally recognized physical explanation has been proposed for this. It is considered that the 1/f noise in a system implies the existence of a special structure such as SOC, which is crucial for the development of advanced modeling tools related to the past and future parameters and ecological patterns. Finally, the abovementioned analysis indicated the presence of a ≈6000-year long-term cycle in the reconstructed humification timeseries.

Author Contributions

Conceptualization, E.-F.F. and C.V.; methodology, C.V. and M.E.; formal analysis, E.-F.F., T.V. and C.V.; resources, A.N.T., Y.M., N.G.M. and D.S.; data curation, E.-F.F., J.C., N.V.S. and M.E.; writing—original draft preparation, E.-F.F., J.C. and C.V.; writing—review and editing, T.V., A.N.T., Y.M., N.G.M. and N.V.S.; visualization, E.-F.F., J.C., N.V.S. and M.E.; supervision, C.V.; project administration, C.V. All authors have read and agreed to the published version of the manuscript.

Funding

Some of the authors (A.N.T., Y.M., N.G.M. and D.S.) were supported by the Russian Science Foundation (grant No 19-14-00102). The research was performed according to the Development program of the Interdisciplinary Scientific and Educational School of Lomonosov, Moscow State University: “The future of the planet and global environmental change”.

Institutional Review Board Statement

Not applicable.

Informed Consent Statement

Not applicable.

Data Availability Statement

The data presented in this study are available on request from the corresponding author. The data are not publicly available due to privacy restrictions.

Conflicts of Interest

The authors declare no conflict of interest.

References

  1. Fordham, D.A.; Jackson, S.T.; Brown, S.C.; Huntley, B.; Brook, B.W.; Dahl-Jensen, D.; Gilbert, M.T.P.; Otto-Bliesner, B.L.; Svensson, A.; Theodoridis, S.; et al. Using Paleo-Archives to Safeguard Biodiversity under Climate Change. Science 2020, 369, eabc5654. [Google Scholar] [CrossRef]
  2. Varotsos, C.; Mazei, Y.; Efstathiou, M. Paleoecological and Recent Data Show a Steady Temporal Evolution of Carbon Dioxide and Temperature. Atmos. Pollut. Res. 2020, 11, 714–722. [Google Scholar] [CrossRef]
  3. Black, B.A.; Andersson, C.; Butler, P.G.; Carroll, M.L.; DeLong, K.L.; Reynolds, D.J.; Schöne, B.R.; Scourse, J.; van der Sleen, P.; Wanamaker, A.D.; et al. The Revolution of Crossdating in Marine Palaeoecology and Palaeoclimatology. Biol. Lett. 2019, 15, 20180665. [Google Scholar] [CrossRef] [PubMed]
  4. Christodoulakis, J. Paleoenvironmental Reconstruction of Southwestern Peloponnesus Using Luminescence Dating Techniques. Anc. TL 2018, 36, 12. [Google Scholar]
  5. Tsakalos, E.; Athanassas, C.; Tsipas, P.; Triantaphyllou, M.; Geraga, M.; Papatheodorou, G.; Filippaki, E.; Christodoulakis, J.; Kazantzaki, M. Luminescence Geochronology and Paleoenvironmental Implications of Coastal Deposits of Southeast Cyprus. Archaeol. Anthr. Sci. 2018, 10, 41–60. [Google Scholar] [CrossRef]
  6. Cracknell, A.P.; Varotsos, C.A. New Aspects of Global Climate-Dynamics Research and Remote Sensing. Int. J. Remote Sens. 2011, 32, 579–600. [Google Scholar] [CrossRef]
  7. Mazei, Y.A.; Tsyganov, A.N.; Bobrovsky, M.V.; Mazei, N.G.; Kupriyanov, D.A.; Gałka, M.; Rostanets, D.V.; Khazanova, K.P.; Stoiko, T.G.; Pastukhova, Y.A.; et al. Peatland Development, Vegetation History, Climate Change and Human Activity in the Valdai Uplands (Central European Russia) during the Holocene: A Multi-Proxy Palaeoecological Study. Diversity 2020, 12, 462. [Google Scholar] [CrossRef]
  8. Bourgault, M.-A.; Larocque, M.; Garneau, M.; Roux, M. Quantifying Peat Hydrodynamic Properties and Their Influence on Water Table Depths in Peatlands of Southern Quebec (Canada): Hydrodynamic Properties of Peatlands and Their Influence on Water Table Depths. Ecohydrology 2018, 11, e1976. [Google Scholar] [CrossRef]
  9. Taufik, M.; Veldhuizen, A.A.; Wösten, J.H.M.; van Lanen, H.A.J. Exploration of the Importance of Physical Properties of Indonesian Peatlands to Assess Critical Groundwater Table Depths, Associated Drought and Fire Hazard. Geoderma 2019, 347, 160–169. [Google Scholar] [CrossRef]
  10. Mahdiyasa, A.W.; Large, D.J.; Muljadi, B.P.; Icardi, M.; Triantafyllou, S. MPeat—A Fully Coupled Mechanical-ecohydrological Model of Peatland Development. Ecohydrology 2022, 15, e2361. [Google Scholar] [CrossRef]
  11. Payne, R.J.; Blackford, J.J. Peat Humification and Climate Change: A Multi-Site Comparison from Mires in South-East Alaska. Mires Peat 2008, 11, 1–11. [Google Scholar]
  12. Tfaily, M.M.; Cooper, W.T.; Kostka, J.E.; Chanton, P.R.; Schadt, C.W.; Hanson, P.J.; Iversen, C.M.; Chanton, J.P. Organic Matter Transformation in the Peat Column at Marcell Experimental Forest: Humification and Vertical Stratification: Organic Matter Dynamics. J. Geophys. Res. Biogeosci. 2014, 119, 661–675. [Google Scholar] [CrossRef]
  13. Efstathiou, M.N.; Varotsos, C.A. Intrinsic Properties of Sahel Precipitation Anomalies and Rainfall. Appl. Clim. 2012, 109, 627–633. [Google Scholar] [CrossRef]
  14. Snyder, C.W. Evolution of Global Temperature over the Past Two Million Years. Nature 2016, 538, 226–228. [Google Scholar] [CrossRef] [PubMed]
  15. Varotsos, C.; Efstathiou, M.; Tzanis, C. Scaling Behaviour of the Global Tropopause. Atmos. Chem. Phys. 2009, 7, 677–683. [Google Scholar] [CrossRef] [Green Version]
  16. Varotsos, C.A.; Lovejoy, S.; Sarlis, N.V.; Tzanis, C.G.; Efstathiou, M.N. On the Scaling of the Solar Incident Flux. Atmos. Chem. Phys. 2015, 15, 7301–7306. [Google Scholar] [CrossRef] [Green Version]
  17. Varotsos, C.A.; Mazei, Y.A.; Burkovsky, I.; Efstathiou, M.N.; Tzanis, C.G. Climate Scaling Behaviour in the Dynamics of the Marine Interstitial Ciliate Community. Appl. Clim. 2016, 125, 439–447. [Google Scholar] [CrossRef]
  18. Varotsos, C.A.; Sarlis, N.V.; Efstathiou, M. On the Association between the Recent Episode of the Quasi-Biennial Oscillation and the Strong El Niño Event. Appl. Clim. 2018, 133, 569–577. [Google Scholar] [CrossRef]
  19. Varotsos, C.; Mazei, Y.; Novenko, E.; Tsyganov, A.N.; Olchev, A.; Pampura, T.; Mazei, N.; Fatynina, Y.; Saldaev, D.; Efstathiou, M. A New Climate Nowcasting Tool Based on Paleoclimatic Data. Sustainability 2020, 12, 5546. [Google Scholar] [CrossRef]
  20. Varotsos, C.A.; Mazei, Y.; Saldaev, D.; Efstathiou, M.; Voronova, T.; Xue, Y. Nowcasting of Air Pollution Episodes in Megacities: A Case Study for Athens, Greece. Atmos. Pollut. Res. 2021, 12, 101099. [Google Scholar] [CrossRef]
  21. Blaauw, M.; Christen, J.A. Rbacon: Age-Depth Modelling Using Bayesian Statistics; R Package Version 2.3.5; R Foundation for Statistical Computing: Vienna, Austria, 2020; Available online: https://CRAN.R-project.org/package=rbacon (accessed on 28 October 2020).
  22. Chambers, F.M.; Beilman, D.W.; Yu, Z. Methods for Determining Peat Humification and for Quantifying Peat Bulk Density. Org. Matter Carbon Content Palaeostudies Clim. Peatl. Carbon Dyn. 2011, 7, 1–10. [Google Scholar]
  23. Tsyganov, A.N.; Babeshko, K.V.; Novenko, E.Y.; Malysheva, E.A.; Payne, R.J.; Mazei, Y.A. Quantitative Reconstruction of Peatland Hydrological Regime with Fossil Testate Amoebae Communities. Russ. J. Ecol. 2017, 48, 191–198. [Google Scholar] [CrossRef]
  24. Salonen, J.S.; Korpela, M.; Williams, J.W.; Luoto, M. Machine-Learning Based Reconstructions of Primary and Secondary Climate Variables from North American and European Fossil Pollen Data. Sci. Rep. 2019, 9, 15805. [Google Scholar] [CrossRef] [PubMed]
  25. Helske, J.; Luukko, P. R Package ‘Rlibeemd’; R Foundation for Statistical Computing: Vienna, Austria, 2021. [Google Scholar]
  26. Wiener, N. Extrapolation, Interpolation and Smoothing of Stationary Time Series; John Wiley: New York, NY, USA, 1949; pp. 1–163. ISBN 978-0-262-23002-5. [Google Scholar]
  27. Weber, R.O.; Talkner, P. Spectra and Correlations of Climate Data from Days to Decades. J. Geophys. Res. 2001, 106, 20131–20144. [Google Scholar] [CrossRef] [Green Version]
  28. Wu, Z.; Huang, N.E. Ensemble empirical mode decomposition: A noise-assisted data analysis method. Adv. Adapt. Data Anal. 2009, 1, 1–41. [Google Scholar] [CrossRef]
  29. Huang, N.E.; Shen, Z.; Long, S.R.; Wu, M.C.; Shih, H.H.; Zheng, Q.; Yen, N.-C.; Tung, C.C.; Liu, H.H. The Empirical Mode Decomposition and the Hilbert Spectrum for Nonlinear and Non-Stationary Time Series Analysis. Proc. R. Soc. Lond. A 1998, 454, 903–995. [Google Scholar] [CrossRef]
  30. Huang, N.E.; Wu, M.-L.; Qu, W.; Long, S.R.; Shen, S.S.P. Applications of Hilbert-Huang Transform to Non-Stationary Financial Time Series Analysis. Appl. Stoch. Models Bus. Ind. 2003, 19, 245–268. [Google Scholar] [CrossRef]
  31. Yang, J.N.; Lei, Y.; Lin, S.; Huang, N. Hilbert-Huang Based Approach for Structural Damage Detection. J. Eng. Mech. 2004, 130, 85–95. [Google Scholar] [CrossRef]
  32. Xie, H.; Wang, Z. Mean Frequency Derived via Hilbert-Huang Transform with Application to Fatigue EMG Signal Analysis. Comput. Methods Programs Biomed. 2006, 82, 114–120. [Google Scholar] [CrossRef]
  33. Bowman, D.C.; Lees, J.M. The Hilbert-Huang Transform: A High Resolution Spectral Method for Nonlinear and Nonstationary Time Series. Seismol. Res. Lett. 2013, 84, 1074–1080. [Google Scholar] [CrossRef]
  34. Wang, Y.-H.; Yeh, C.-H.; Young, H.-W.V.; Hu, K.; Lo, M.-T. On the Computational Complexity of the Empirical Mode Decomposition Algorithm. Phys. A Stat. Mech. Appl. 2014, 400, 159–167. [Google Scholar] [CrossRef]
  35. Sarlis, N.V.; Skordas, E.S.; Mintzelas, A.; Papadopoulou, K.A. Micro-Scale, Mid-Scale, and Macro-Scale in Global Seismicity Identified by Empirical Mode Decomposition and Their Multifractal Characteristics. Sci. Rep. 2018, 8, 9206. [Google Scholar] [CrossRef]
  36. Luukko, P.J.J.; Helske, J.; Räsänen, E. Introducing Libeemd: A Program Package for Performing the Ensemble Empirical Mode Decomposition. Comput. Stat. 2016, 31, 545–557. [Google Scholar] [CrossRef] [Green Version]
  37. Maraun, D.; Rust, H.W.; Timmer, J. Tempting Long-Memory—on the Interpretation of DFA Results. Nonlin. Process. Geophys. 2004, 11, 495–503. [Google Scholar] [CrossRef] [Green Version]
  38. Xapsos, M.A.; Burke, E.A. Evidence of 6 000-Year Periodicity in Reconstructed Sunspot Numbers. Sol. Phys. 2009, 257, 363–369. [Google Scholar] [CrossRef] [Green Version]
  39. Johnson, J.B. The Schottky Effect in Low Frequency Circuits. Phys. Rev. 1925, 26, 71–85. [Google Scholar] [CrossRef]
  40. Bak, P.; Tang, C.; Wiesenfeld, K. Self-Organized Criticality: An Explanation of the 1/f Noise. Phys. Rev. Lett. 1987, 59, 381–384. [Google Scholar] [CrossRef]
  41. Bak, P.; Tang, C.; Wiesenfeld, K. Self-Organized Criticality. Phys. Rev. A 1988, 38, 364–374. [Google Scholar] [CrossRef]
  42. Alm, J. CO2 and CH4 Fluxes and Carbon Balance in the Atmospheric Interaction of Boreal Peatlands. Ph.D. Thesis, Yliopiston Luonnontieteellisiä Julkaisuja, University of Joensuu, Joensuu, Finland, 15 December 1997. [Google Scholar]
  43. Belyea, L.R. Nonlinear dynamics of peatlands and potential feedbacks on the climate system. In Geophysical Monograph Series; Baird, A.J., Belyea, L.R., Comas, X., Reeve, A.S., Slater, L.D., Eds.; American Geophysical Union: Washington, DC, USA, 2013; pp. 5–18. ISBN 978-1-118-66666-1. [Google Scholar]
  44. Allan, R.P.; Cassou, C.; Chen, D.; Cherchi, A.; Connors, L.; Doblas-Reyes, F.J.; Douville, H.; Driouech, F.; Edwards, T.L.; Fischer, E.; et al. Summary for policymakers. In Climate Change 2021: The Physical Science Basis. Contribution of Working Group I to the Sixth Assessment Report of the Intergovernmental Panel on Climate Change; Cambridge University Press: Cambridge, UK, 2021; p. 32. [Google Scholar]
  45. Ratcliffe, J.L.; Campbell, D.I.; Schipper, L.A.; Wall, A.M.; Clarkson, B.R. Recovery of the CO2 Sink in a Remnant Peatland Following Water Table Lowering. Sci. Total Environ. 2020, 718, 134613. [Google Scholar] [CrossRef]
  46. Weiss, R.; Shurpali, N.J.; Sallantaus, T.; Laiho, R.; Laine, J.; Alm, J. Simulation of Water Table Level and Peat Temperatures in Boreal Peatlands. Ecol. Model. 2006, 192, 441–456. [Google Scholar] [CrossRef]
  47. Waddington, J.M.; Morris, P.J.; Kettridge, N.; Granath, G.; Thompson, D.K.; Moore, P.A. Hydrological Feedbacks in Northern Peatlands: Hydrological feedbacks in northern peatlands. Ecohydrology 2015, 8, 113–127. [Google Scholar] [CrossRef]
  48. Frolking, S.; Roulet, N.T.; Tuittila, E.; Bubier, J.L.; Quillet, A.; Talbot, J.; Richard, P.J.H. A New Model of Holocene Peatland Net Primary Production, Decomposition, Water Balance, and Peat Accumulation. Earth Syst. Dynam. 2010, 1, 1–21. [Google Scholar] [CrossRef] [Green Version]
  49. Lovejoy, S.; Schertzer, D. Haar Wavelets, Fluctuations and Structure Functions: Convenient Choices for Geophysics. Nonlin. Process. Geophys. 2012, 19, 513–527. [Google Scholar] [CrossRef] [Green Version]
  50. Lovejoy, S.; Schertzer, D. Stochastic and Scaling Climate Sensitivities: Solar, Volcanic and Orbital Forcings: Stochastic climate sensitivities. Geophys. Res. Lett. 2012, 39, L051871. [Google Scholar] [CrossRef] [Green Version]
  51. Liu, T.; Luo, Z.; Huang, J.; Yan, S. A Comparative Study of Four Kinds of Adaptive Decomposition Algorithms and Their Applications. Sensors 2018, 18, 2120. [Google Scholar] [CrossRef] [Green Version]
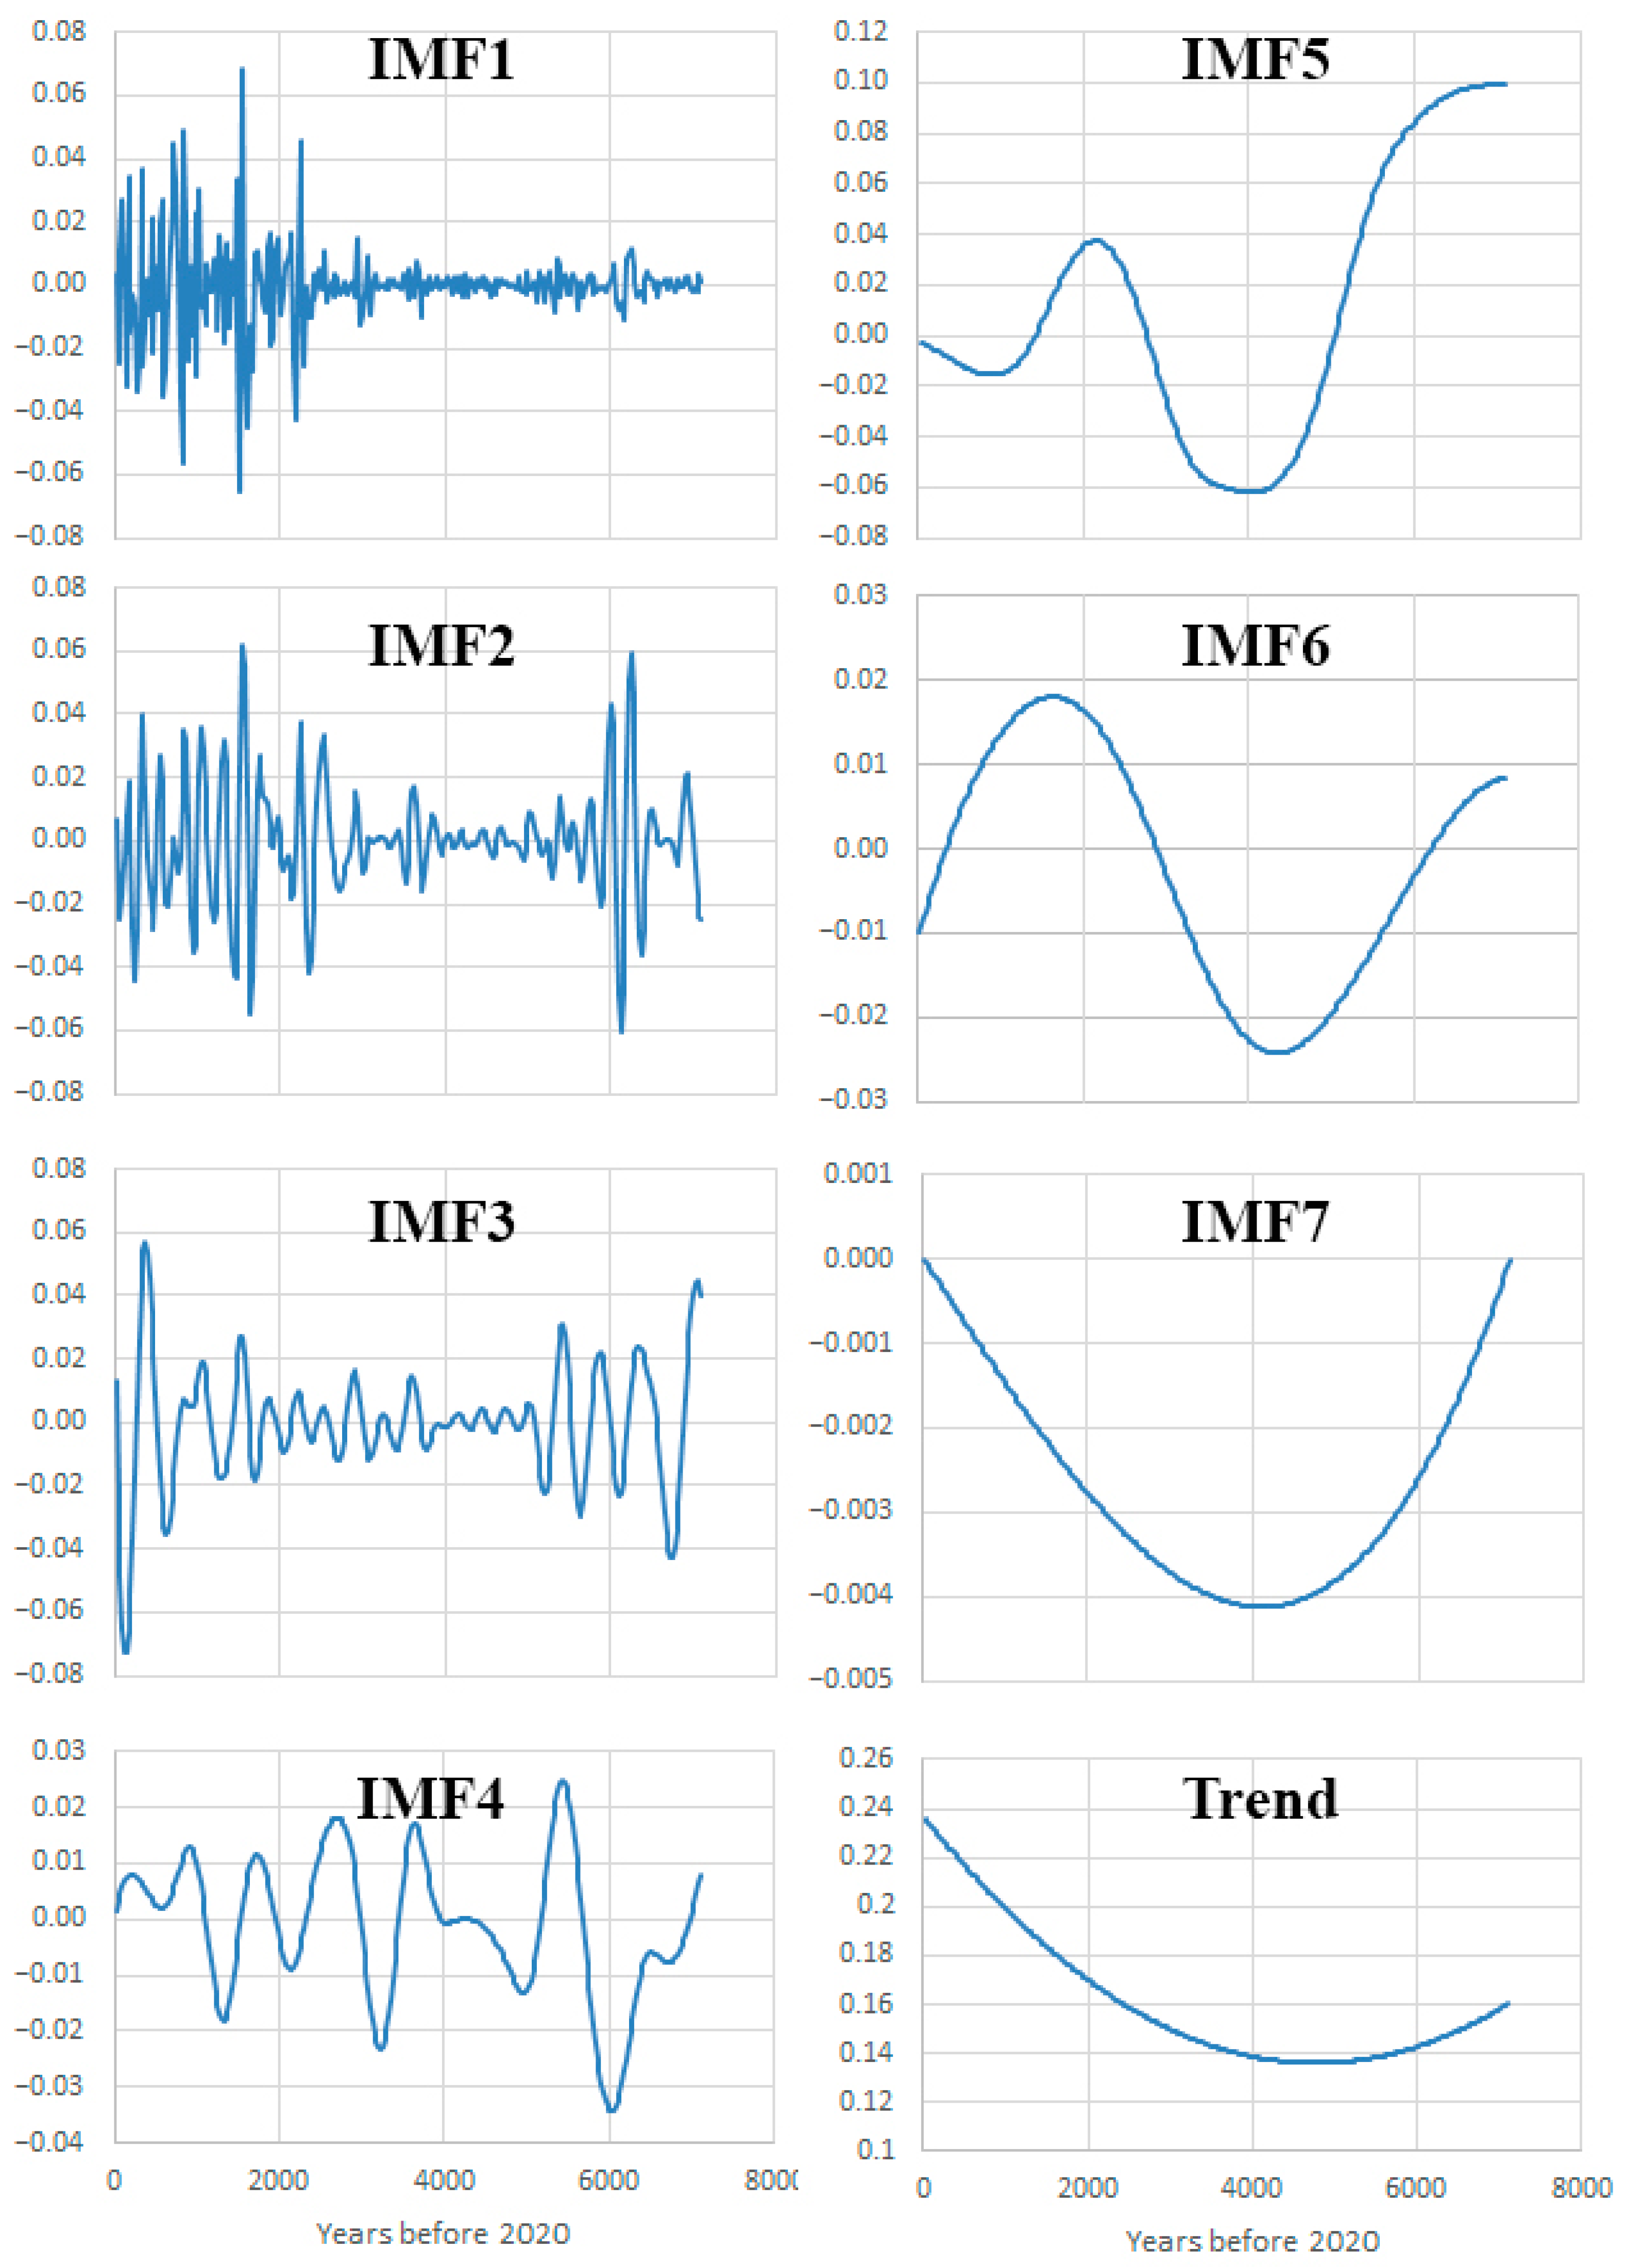
Figure 4. EEMD of the reconstructed humification timeseries in seven IMFs and a trend.
Land 11 00862 g004
Figure 5. Hurst analysis for the reconstructed humification timeseries.
Land 11 00862 g005
Figure 8. Hurst analysis for the detrended reconstructed humification timeseries.
Land 11 00862 g008
Figure 10. Graph log–log plot of the square root mean fluctuation function, Fd, for the detrended and deseasonalized timeseries of (a) WTD vs. time interval τ (25-year step, with the corresponding linear fit y = 1.02x − 0.64, R2 = 0.98) and (b) temperature vs. time interval τ (50-year step, with the corresponding linear fit y = 0.92x − 1.31, R2 = 0.96).
Land 11 00862 g010
Figure 11. Power spectral density for the detrended and deseasonalized timeseries (dashed black line) of (a) WTD and (b) mean July air temperature, with the corresponding power-law (black solid line) and exponential (gray solid line) fit (for WTD: y = 2.07·10−4·x−3.08 with R2 = 0.54, y = 0.28e−10.8x with R2 = 0.52 and for temperature: y = 3.89·10−4·x−2.45 with R2 = 0.43, y = 0.19e−9.89x with R2 = 0.40). Local slope stability of logFd vs. logτ, calculated for an 8-point window (red crosses) and a 9-point window (black circles) for the detrended and deseasonalized timeseries of (c) WTD and (d) mean July air temperature. The dashed gray line represents the corresponding 2σ range, derived from the 500 fractional noise simulations.
Land 11 00862 g011
Figure 12. EEMD of the deseasonalized and detrended reconstructed water table depth timeseries in five IMFs and a trend.
Land 11 00862 g012
Figure 13. Hurst analysis for the deseasonalized and detrended reconstructed water table depth timeseries.
Land 11 00862 g013
Figure 14. EEMD of the deseasonalized and detrended reconstructed mean July air temperatures timeseries in six IMFs and a trend.
Land 11 00862 g014
Figure 15. Hurst analysis for the deseasonalized and detrended reconstructed mean July air temperatures timeseries.
Land 11 00862 g015
Publisher’s Note: MDPI stays neutral with regard to jurisdictional claims in published maps and institutional affiliations.