
A Literature Review of Big Data-Based Urban Park Research in Visitor Dimension

Abstract
:1. Introduction
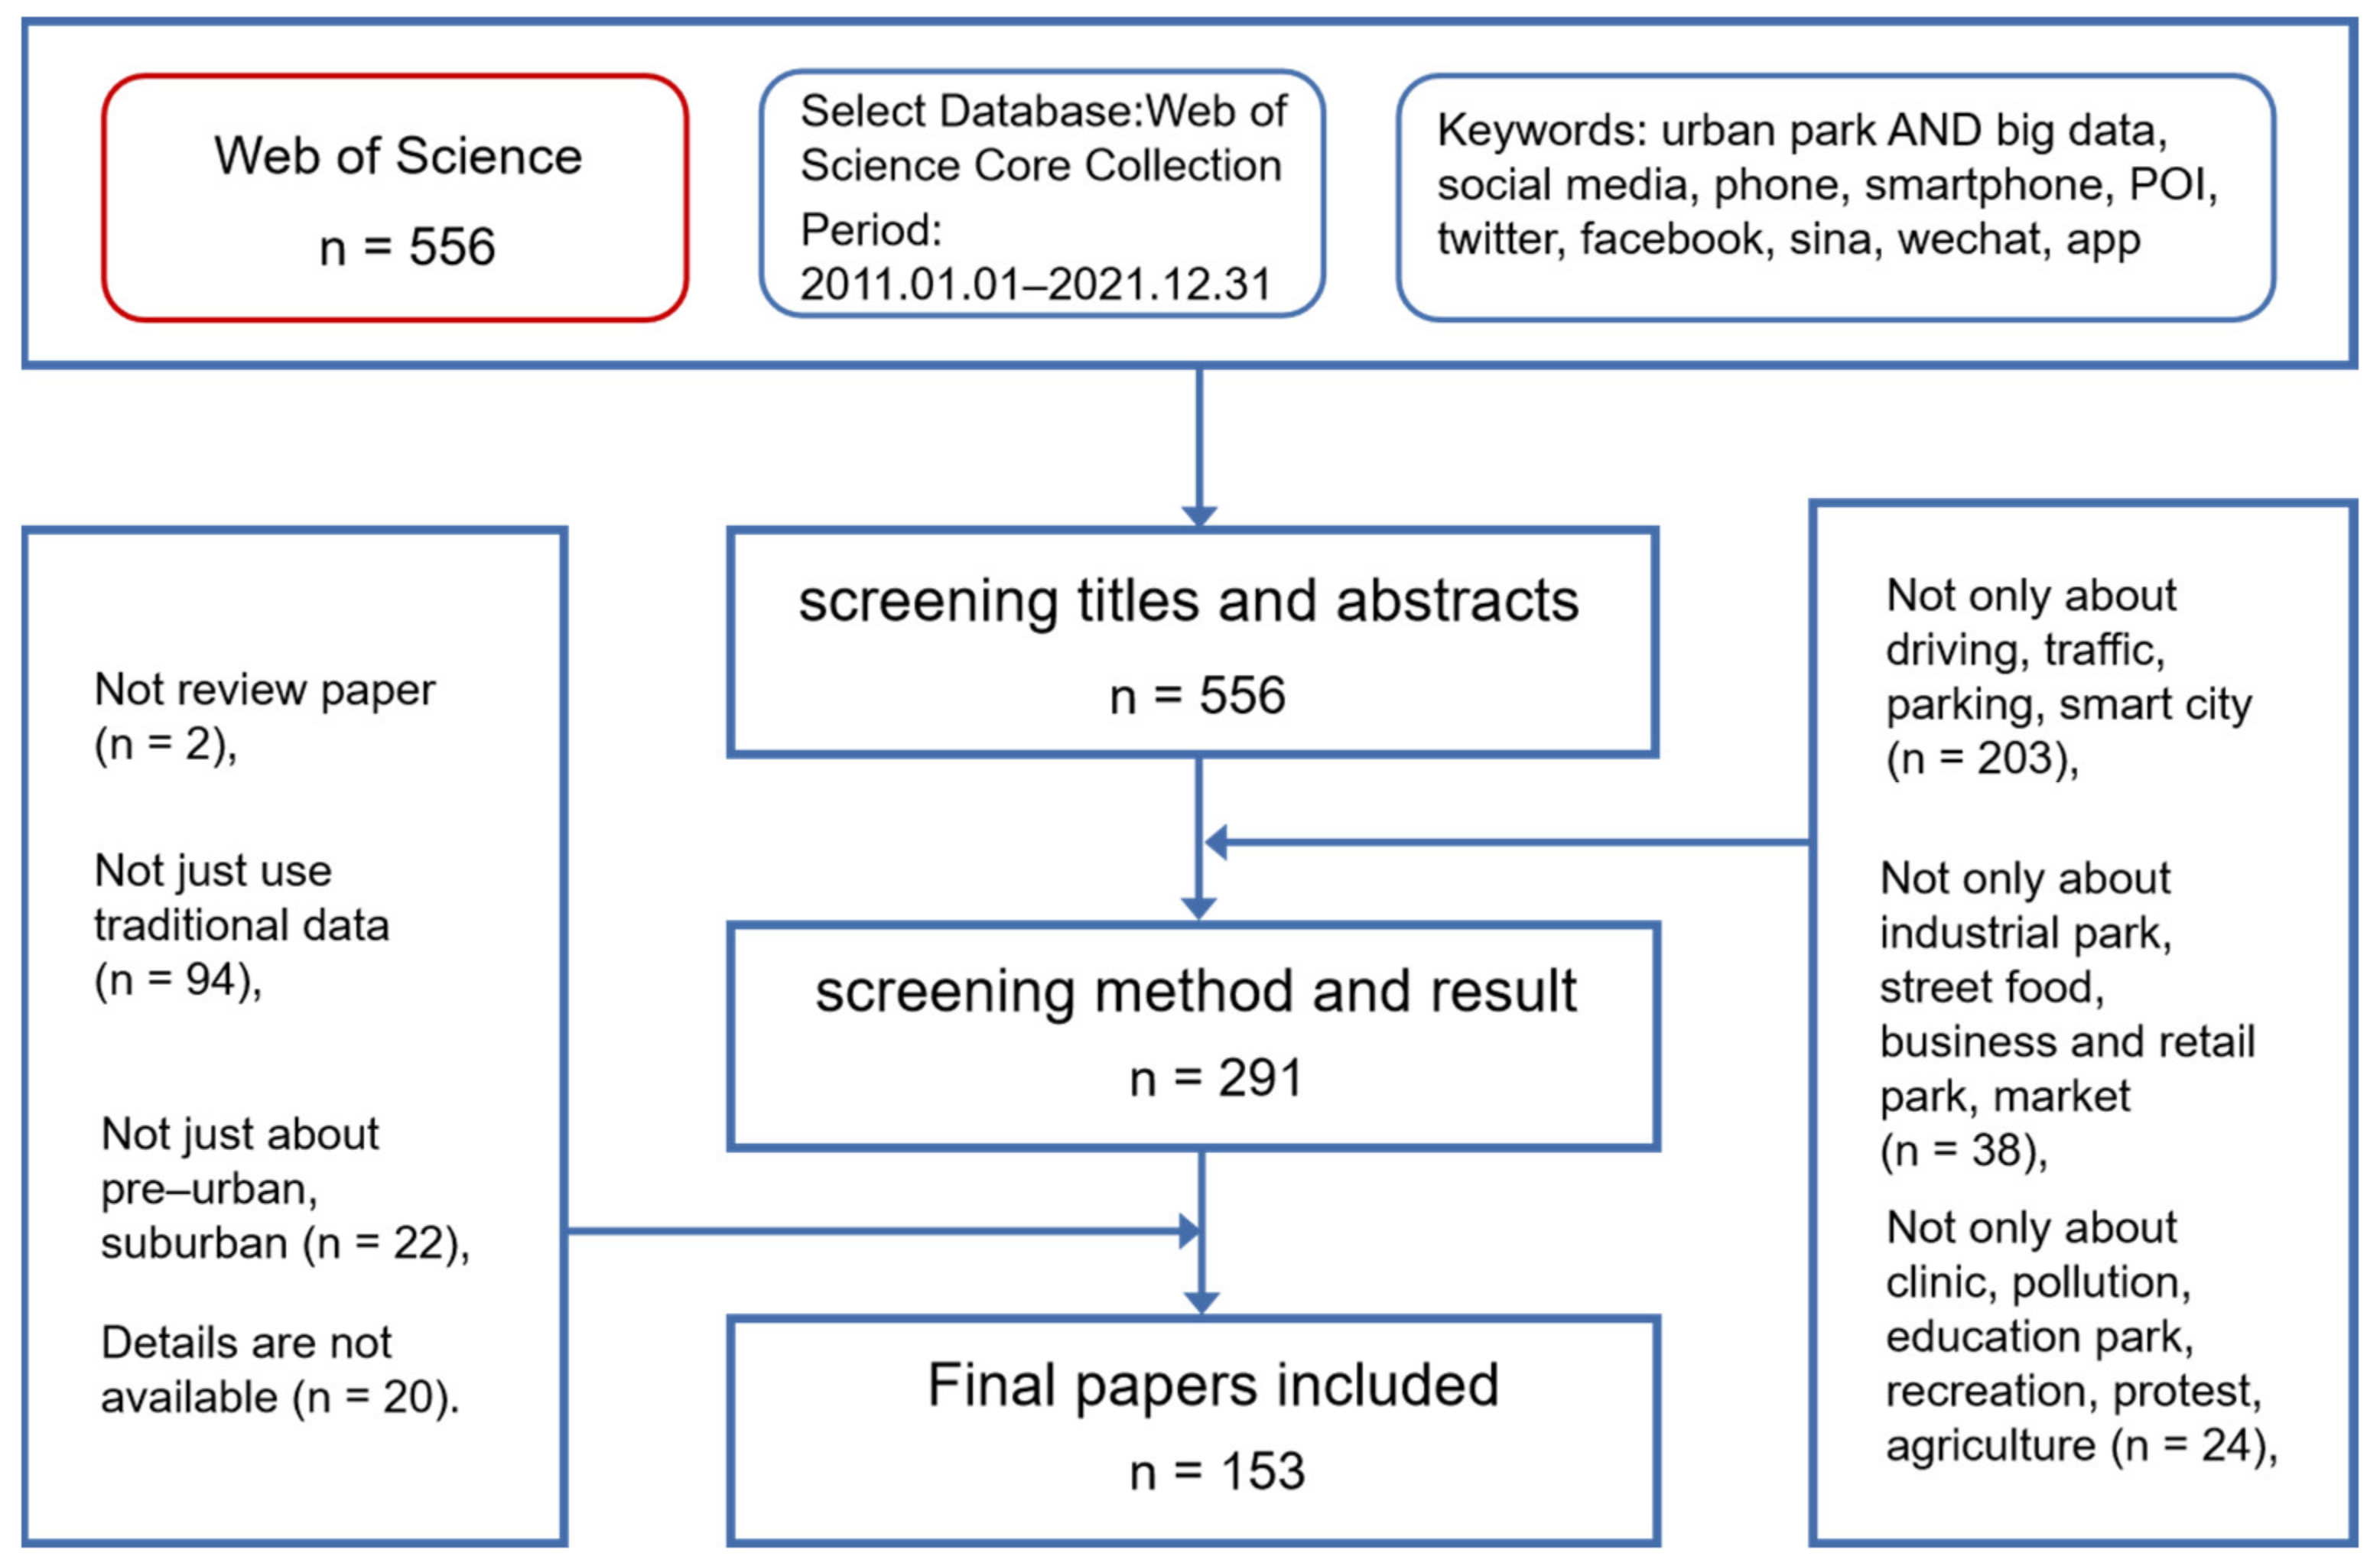
2. Method
3. Results
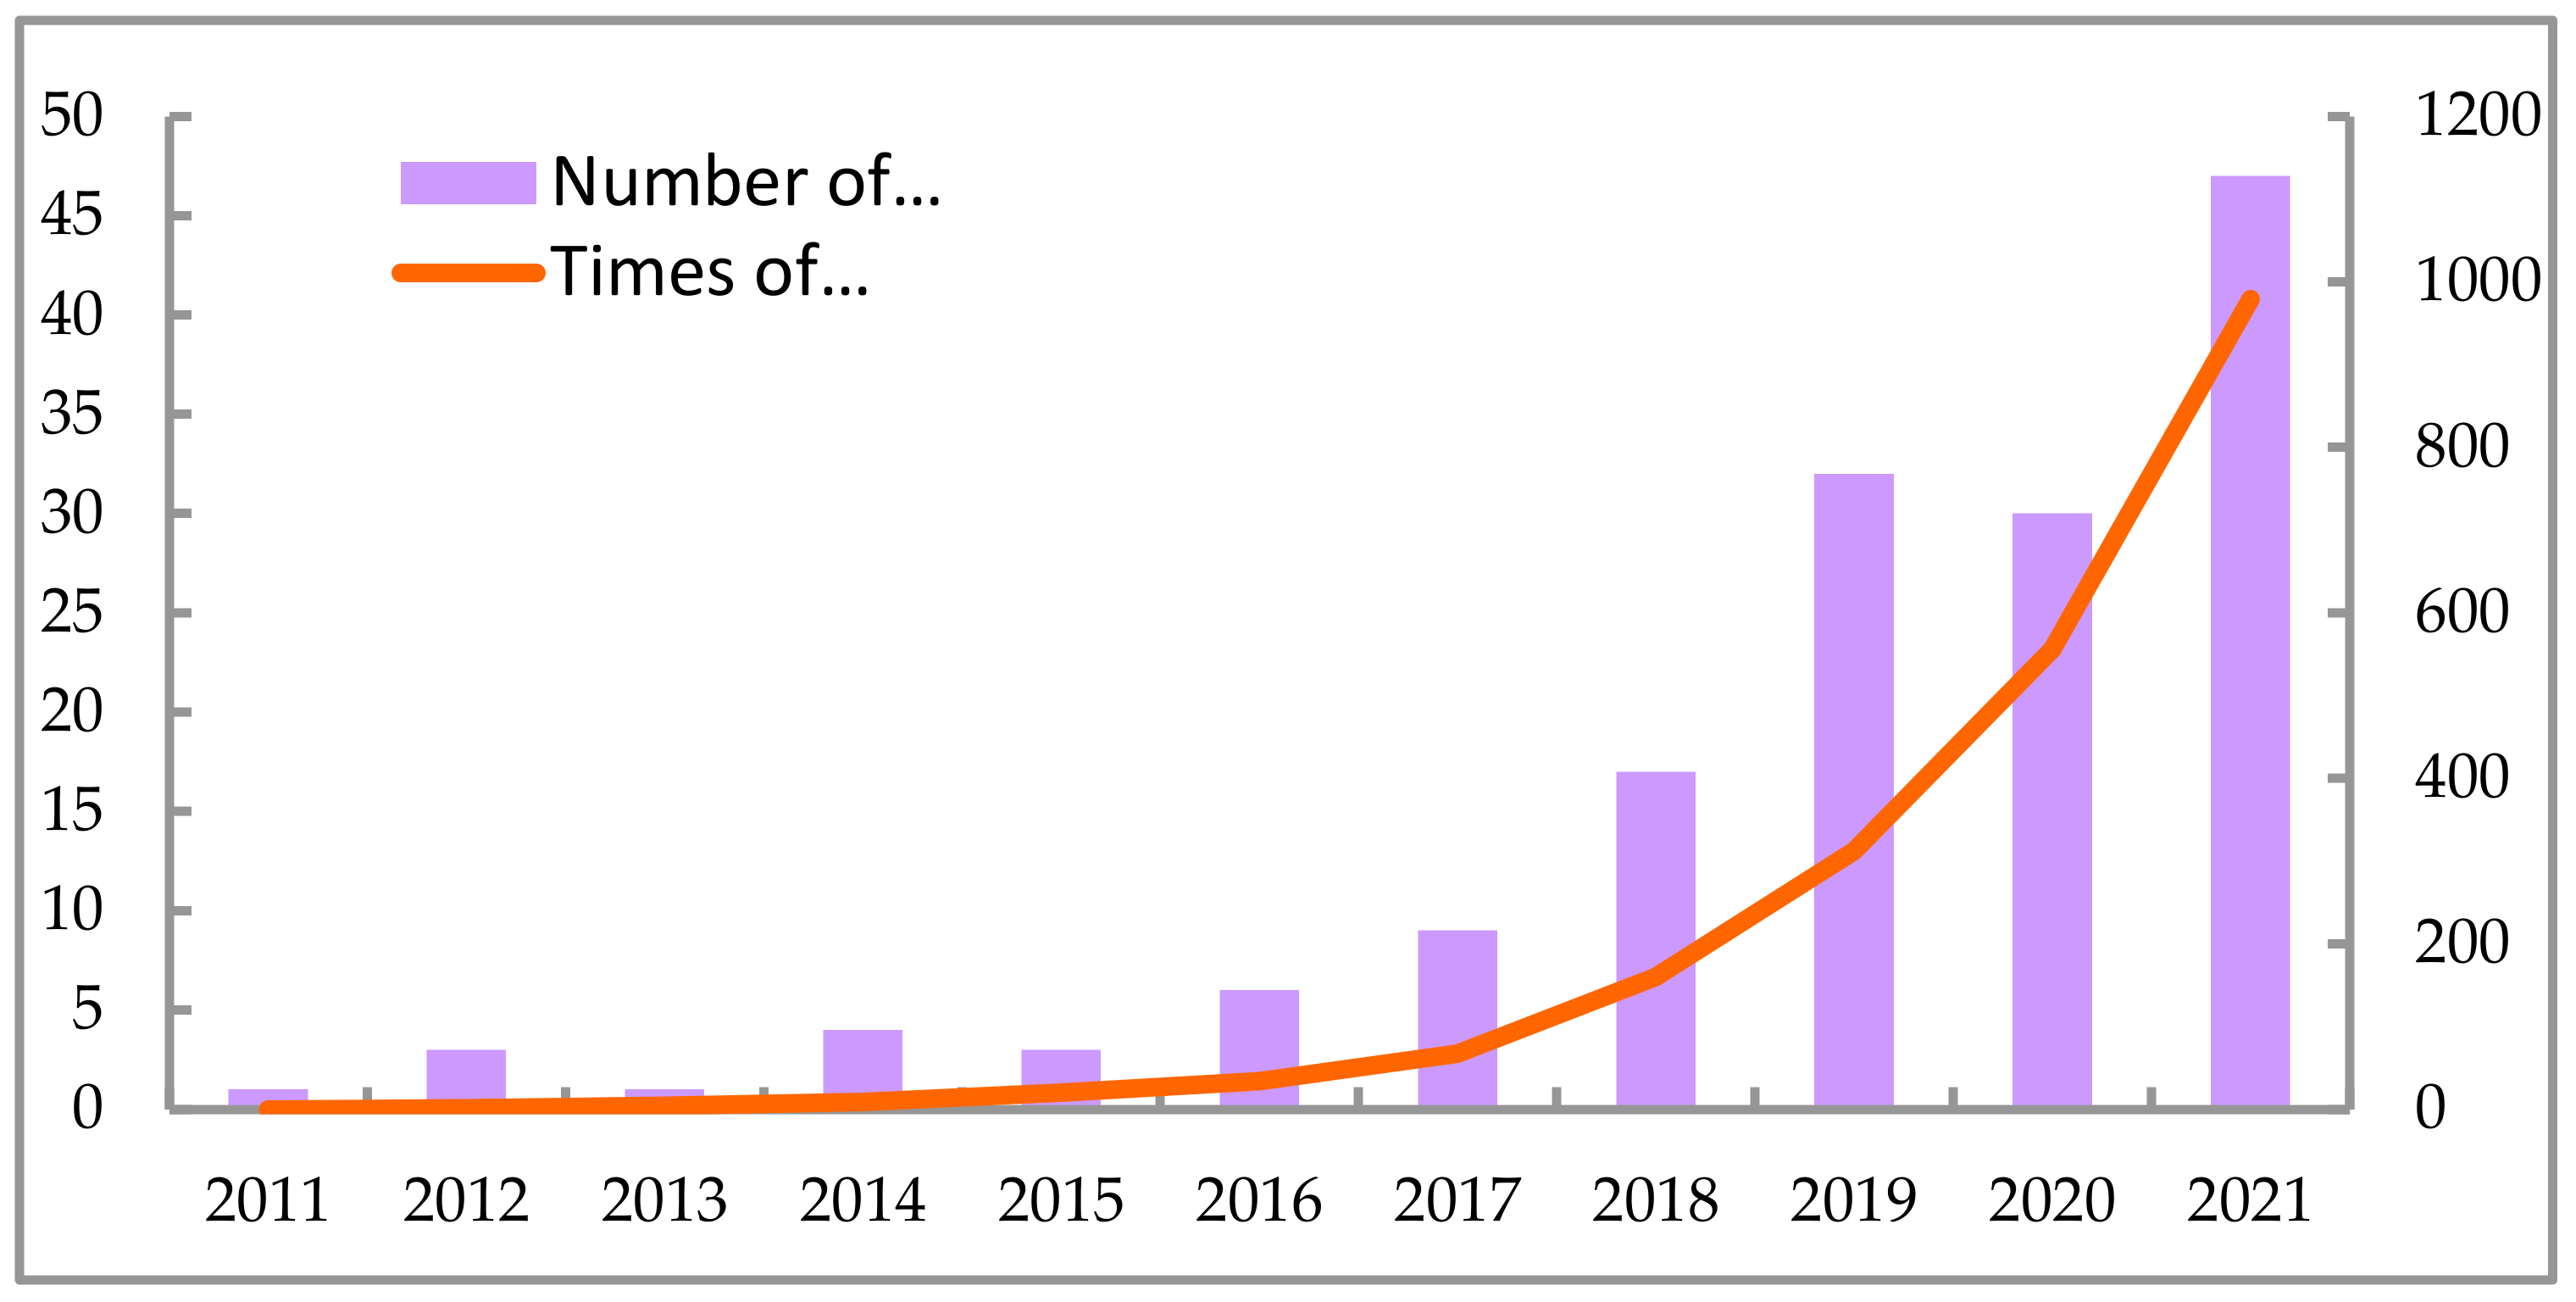
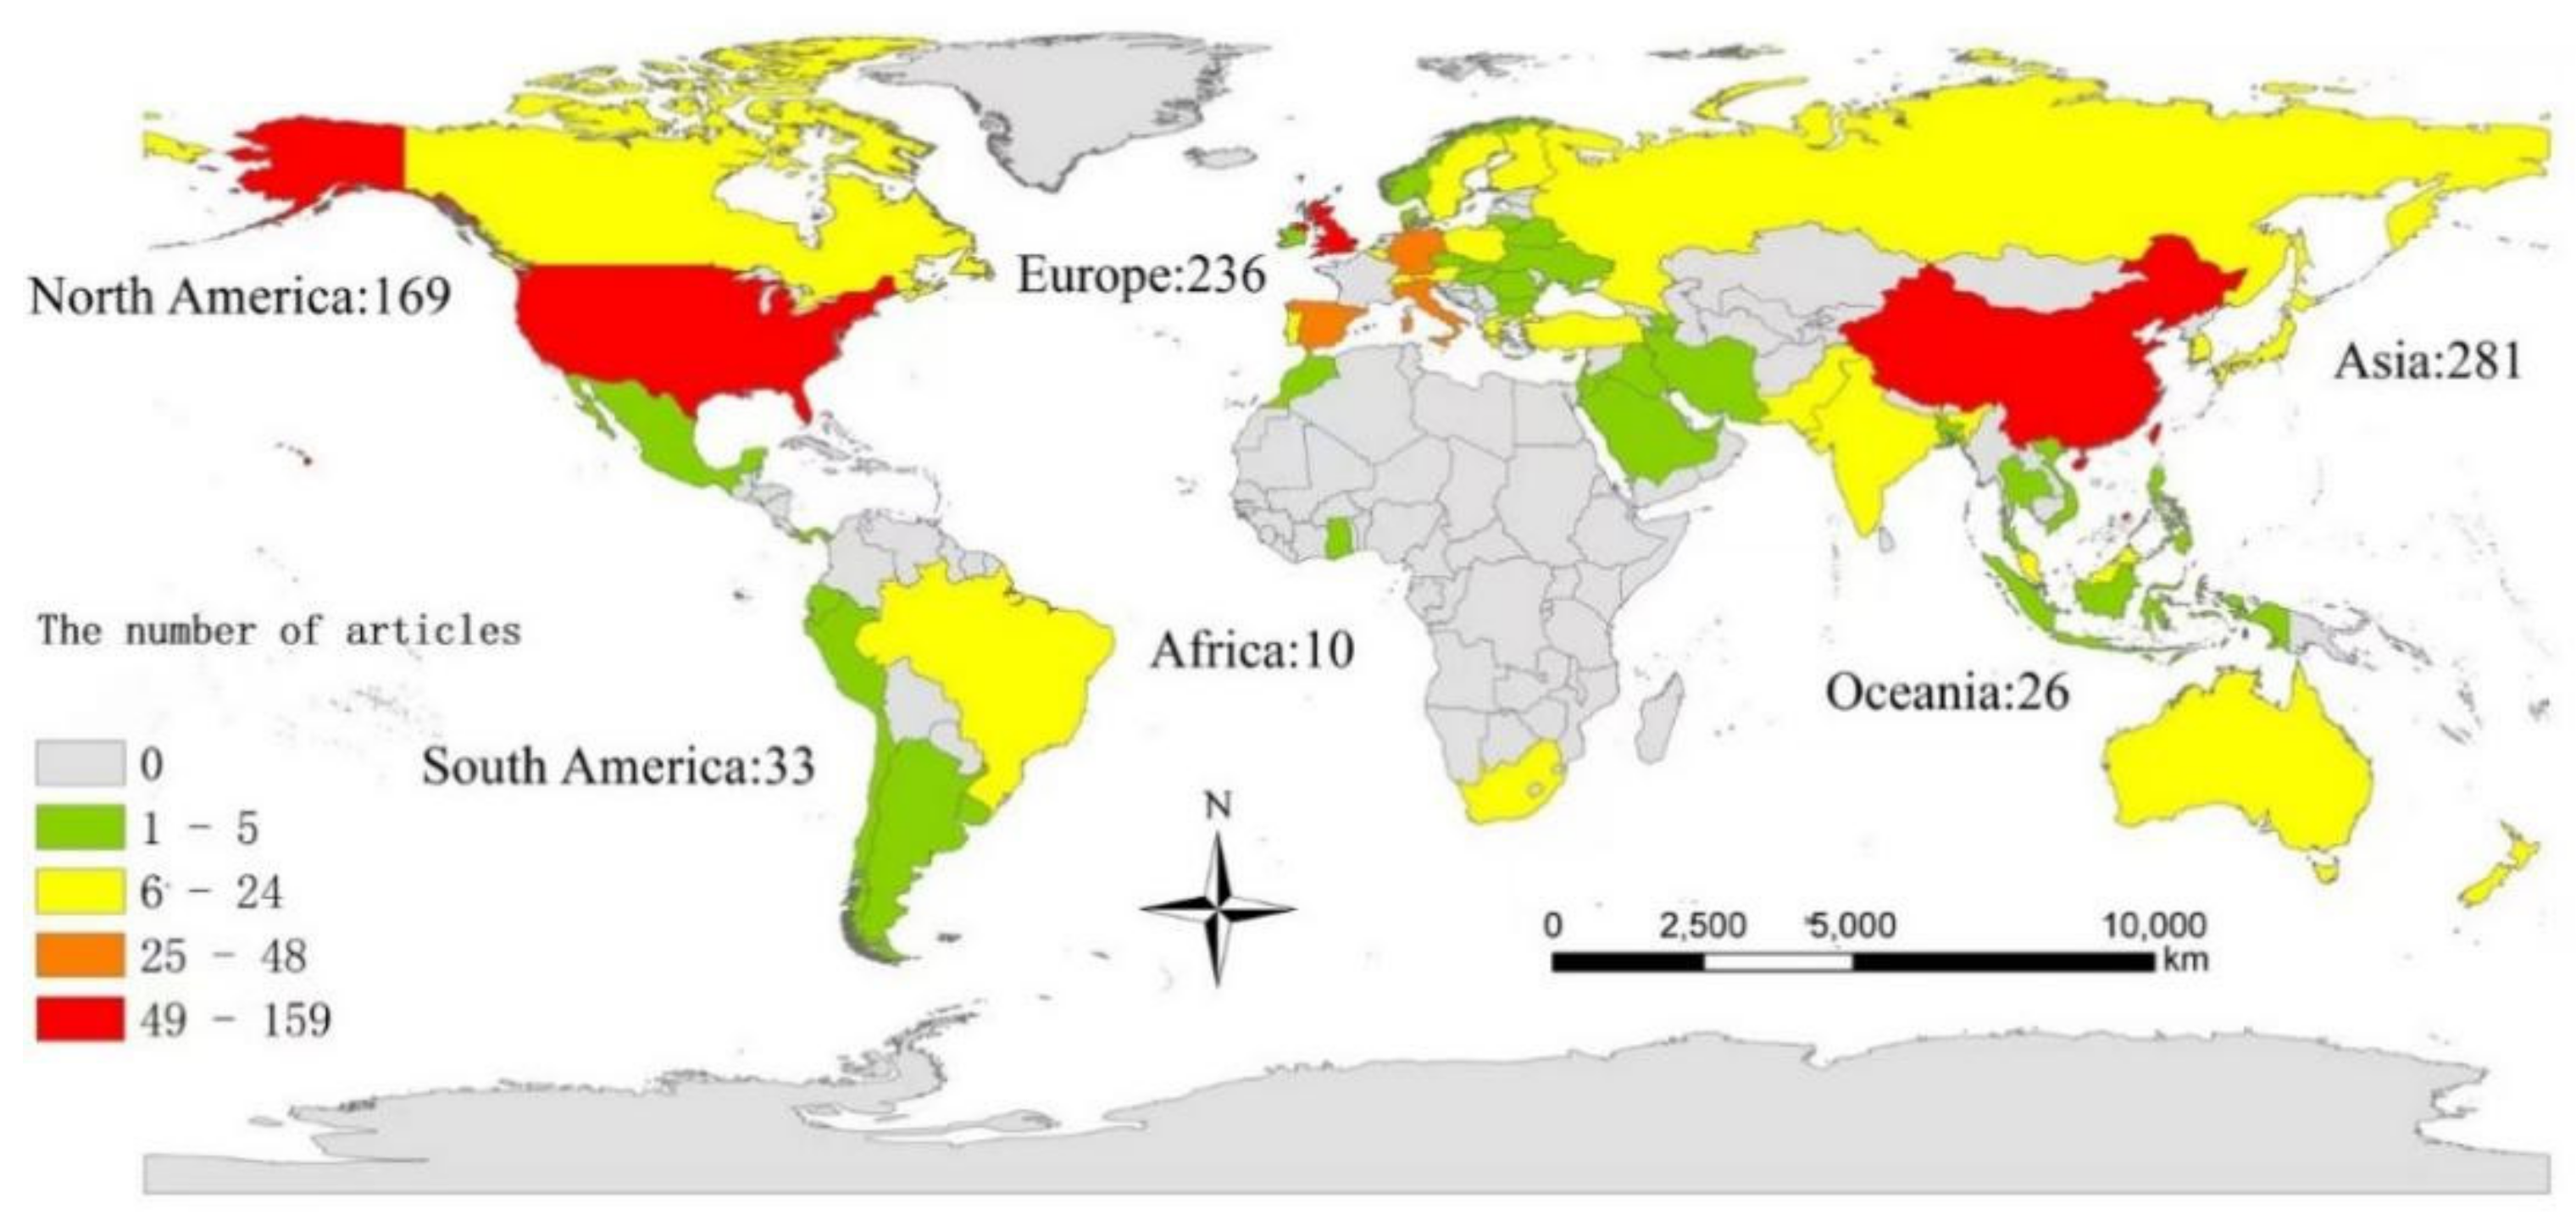
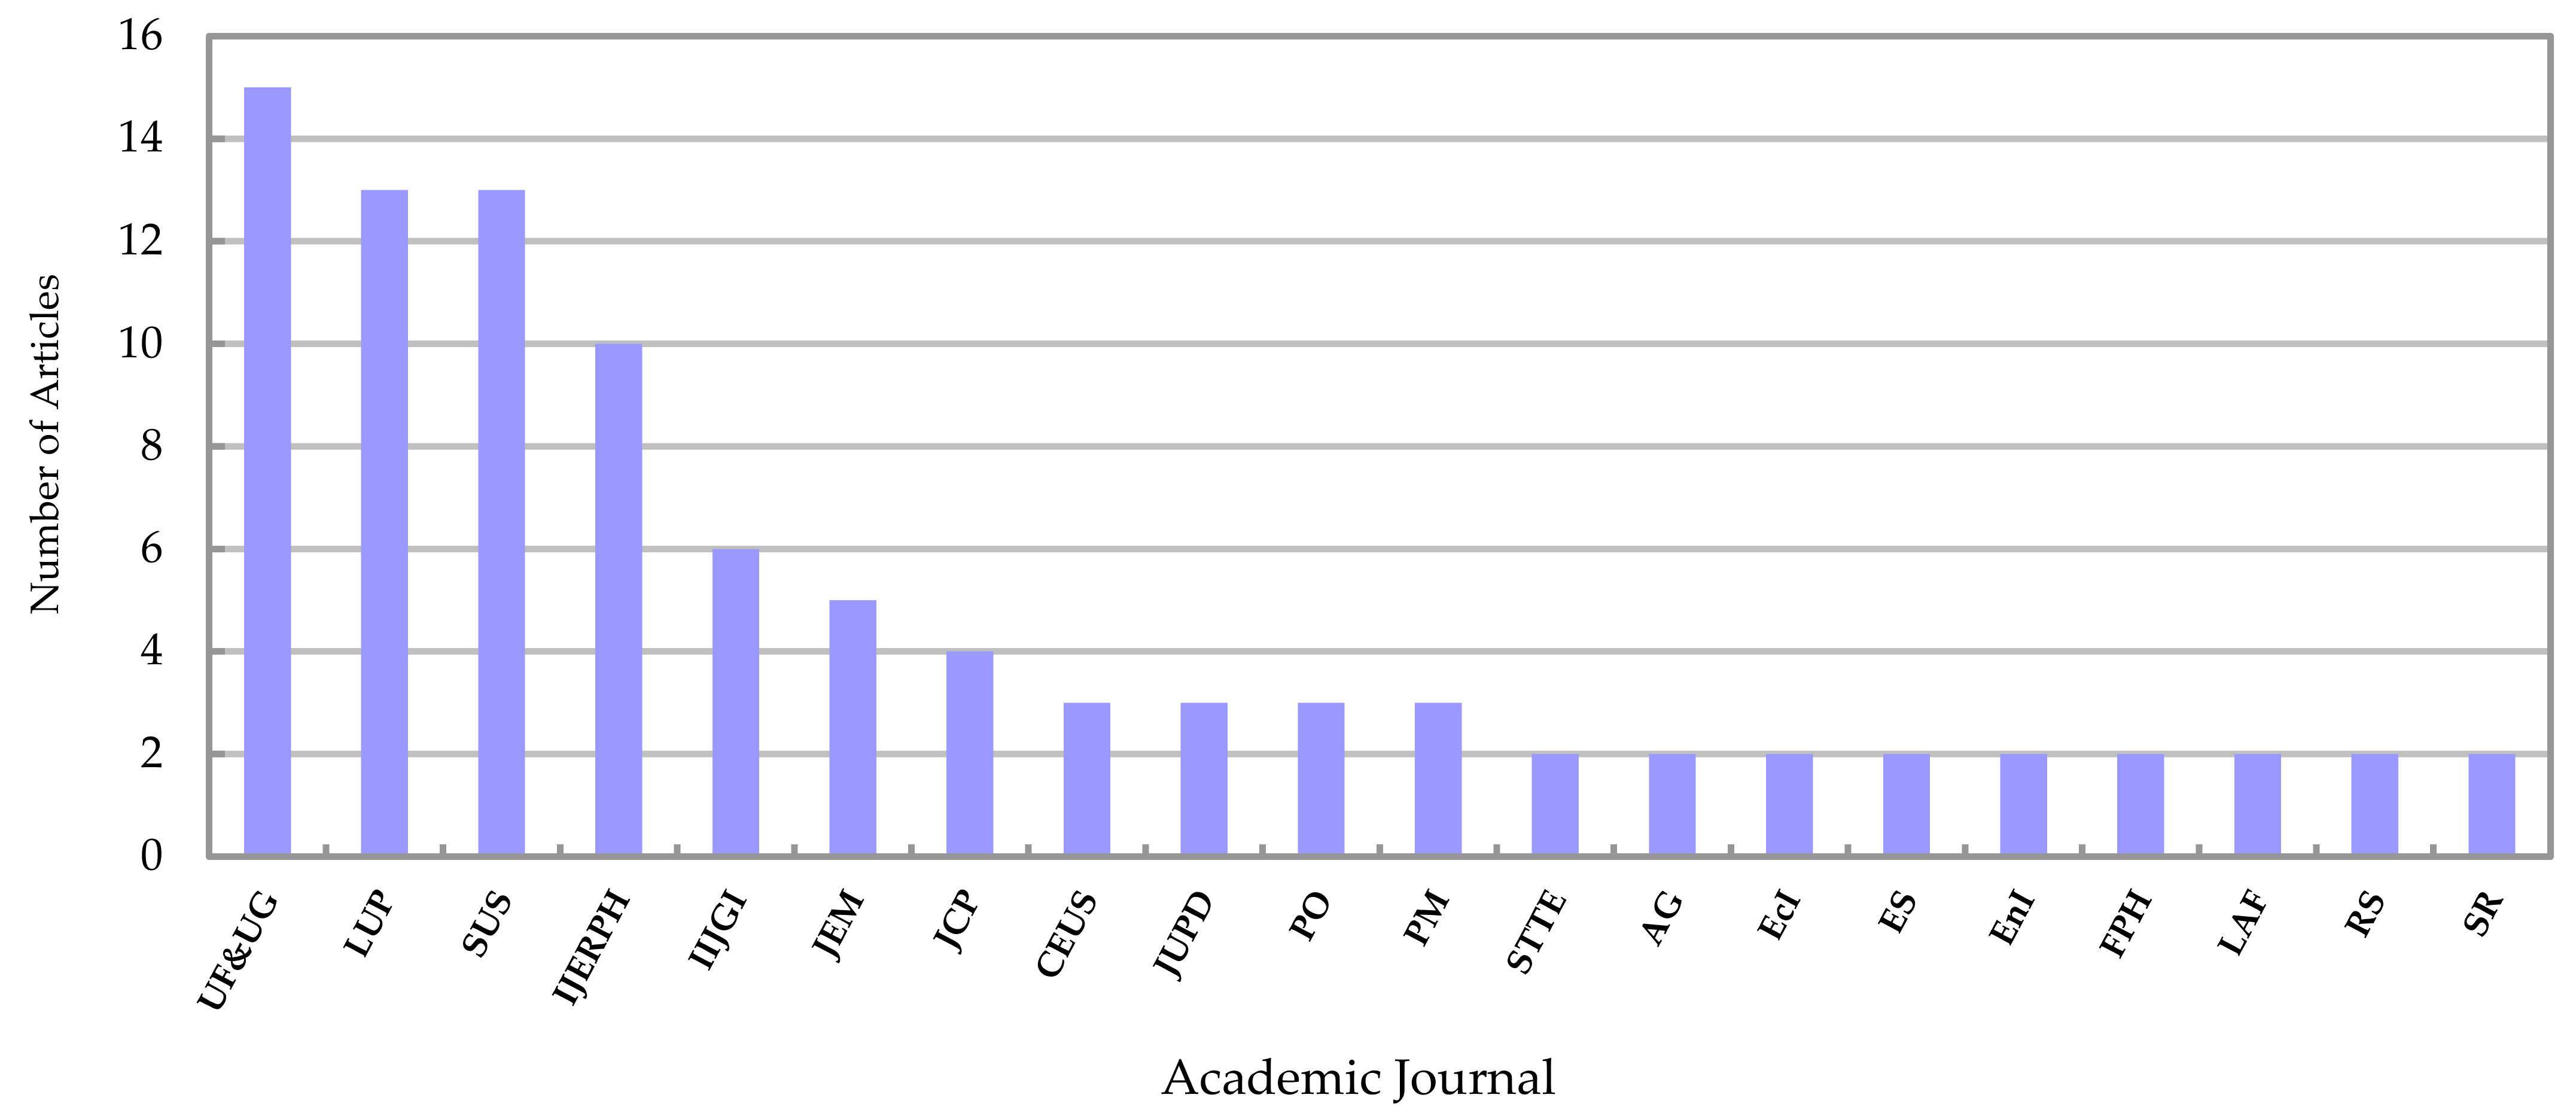
3.1. Urban Park Research by the Numbers
3.2. Types of Big Data Used in Urban Park Research
3.3. Main Methods for Analyzing Big Data in Urban Park Research

| Type | Data Source | Characteristic | Advantage | Disadvantage | Data PreProcessing Method | Data Processing Method |
|---|---|---|---|---|---|---|
| User days data | Twitter allows user to use brief words, sentences, emoji, videos and photos to share feelings in daily life [33]. The location and tag can be gained [34]. | Research can access full information of visitors in their timeframe [35]; user days data can discover new insight in public investigate [34]; many people choose user days data as it owns a huge volume of global data [33]. | Flickr data is limited by forested urban parks while Twitter is more diverse [33]; users in user days data are only the wealth young [34]; user days data will be out of data when users do not tweet or upload photos [33]; the locations user days data provide are not accurate enough [36]. | Python [30], JSON [37], GooSeeker [38], Java [39] | Amazon’s Mechanical Turk [28], NRC Emolex [40], Moran’s I [41], t-test [30], logistic regression model [42] | |
| Flickr | User in Flickr can post their photo and their location [23]. | |||||
| Comment data | Tripadvisor | Tripadvisor has user reviews which researchers can collect the titles, bodies, rate-values and dates [24]. | The satisfaction of park users can be easily accessed and the reason of their favor can be known [43]. | It is difficult to access the gender, age, occupation and income of users; the keywords in the comments may not convenient for assessing cultural service’s type and value in park; only get comments from young people [44]. | Python [43], GooSeeker [44] | LDA [24], ROST CM [44], word2vec model [43], multiple regression model [45] |
| Dianping | Dianping is a popular social media platform in China that can provide the image and textual review [43]. | |||||
| Map data | Baidu | Baidu Map can be divided into two types, Baidu heat map and POI. Baidu heat map can show the density and flow of people [46]. Generally, POI data contains spatial features of name, category, longitude, latitude, etc. [47]. | Quantitative evaluation provides a relatively objective and visual way to understand park services [32]; it was better than the data obtained from Weibo check-in data in reflecting the real conditions [46]. | It could not estimate the exact number of differences between different urban parks [46]. | API [48] | KDE [49], GWR [50], network analysis and buffer analysis [46] |
| OSM | Route data and public transportation is gotten from OSM [32]. It often combines with other kinds of data. | |||||
| Phone data | Mobile signal | Mobile signal data contains the ID, trajectory, coordinate and time of user that are always gained from companies in different countries [45]. | Mobile signal data can be used to detect the behavior of the elderly; accessibility can be assessed in a new way [51]; Multiple mode of actual travel behavior can be obtained by alleviating the limitations on the lack of human data [10] | The information is limited by the location [52]; they have high measurement error level at border areas [52] | Gaussian-based 2SFCA [26], GWR [26], t-test [53], Mann-Whitney U-test [53] | |
| Phone application | Tencent, MapMyFitness, Stava and Wikiloc are phone applications. These kinds of app often provides the route of users [52,54]. | |||||
| Image data | RS | It shows as an image that is often token by satellite [55] and often combines with other kinds of data. | Easy to operate, as it only needs photo to analyze. | Their consideration is not comprehensive. | ANOVA [56,57], FireFACE software [29], zonal analysis [47] | |
| Video | Video data record the movement and facial expression of visitors, and what visitors see. Eye-tracking imitates the eye-movements by using video to record what people see [58]. | |||||
| Other data | Transaction | This kind of data collect the transaction of visitors. It would collect sales information based on gender, age, time, day, and business types [59]. | It is a new way to judge visitors’ effect. These kinds of data is used in interdisciplinary research, such as collecting the sound of animal and analyzing the interaction between human and animal. | They are not easy to use, especially acoustic. The data is lack of samples, and they are limited by the high cost. | Mann–Whitney test [60], Zonal Statistics tool [61] | |
| Acoustic | It collects the sound inside parks and finds whether the noise of visitors would influence the nature [60]. |
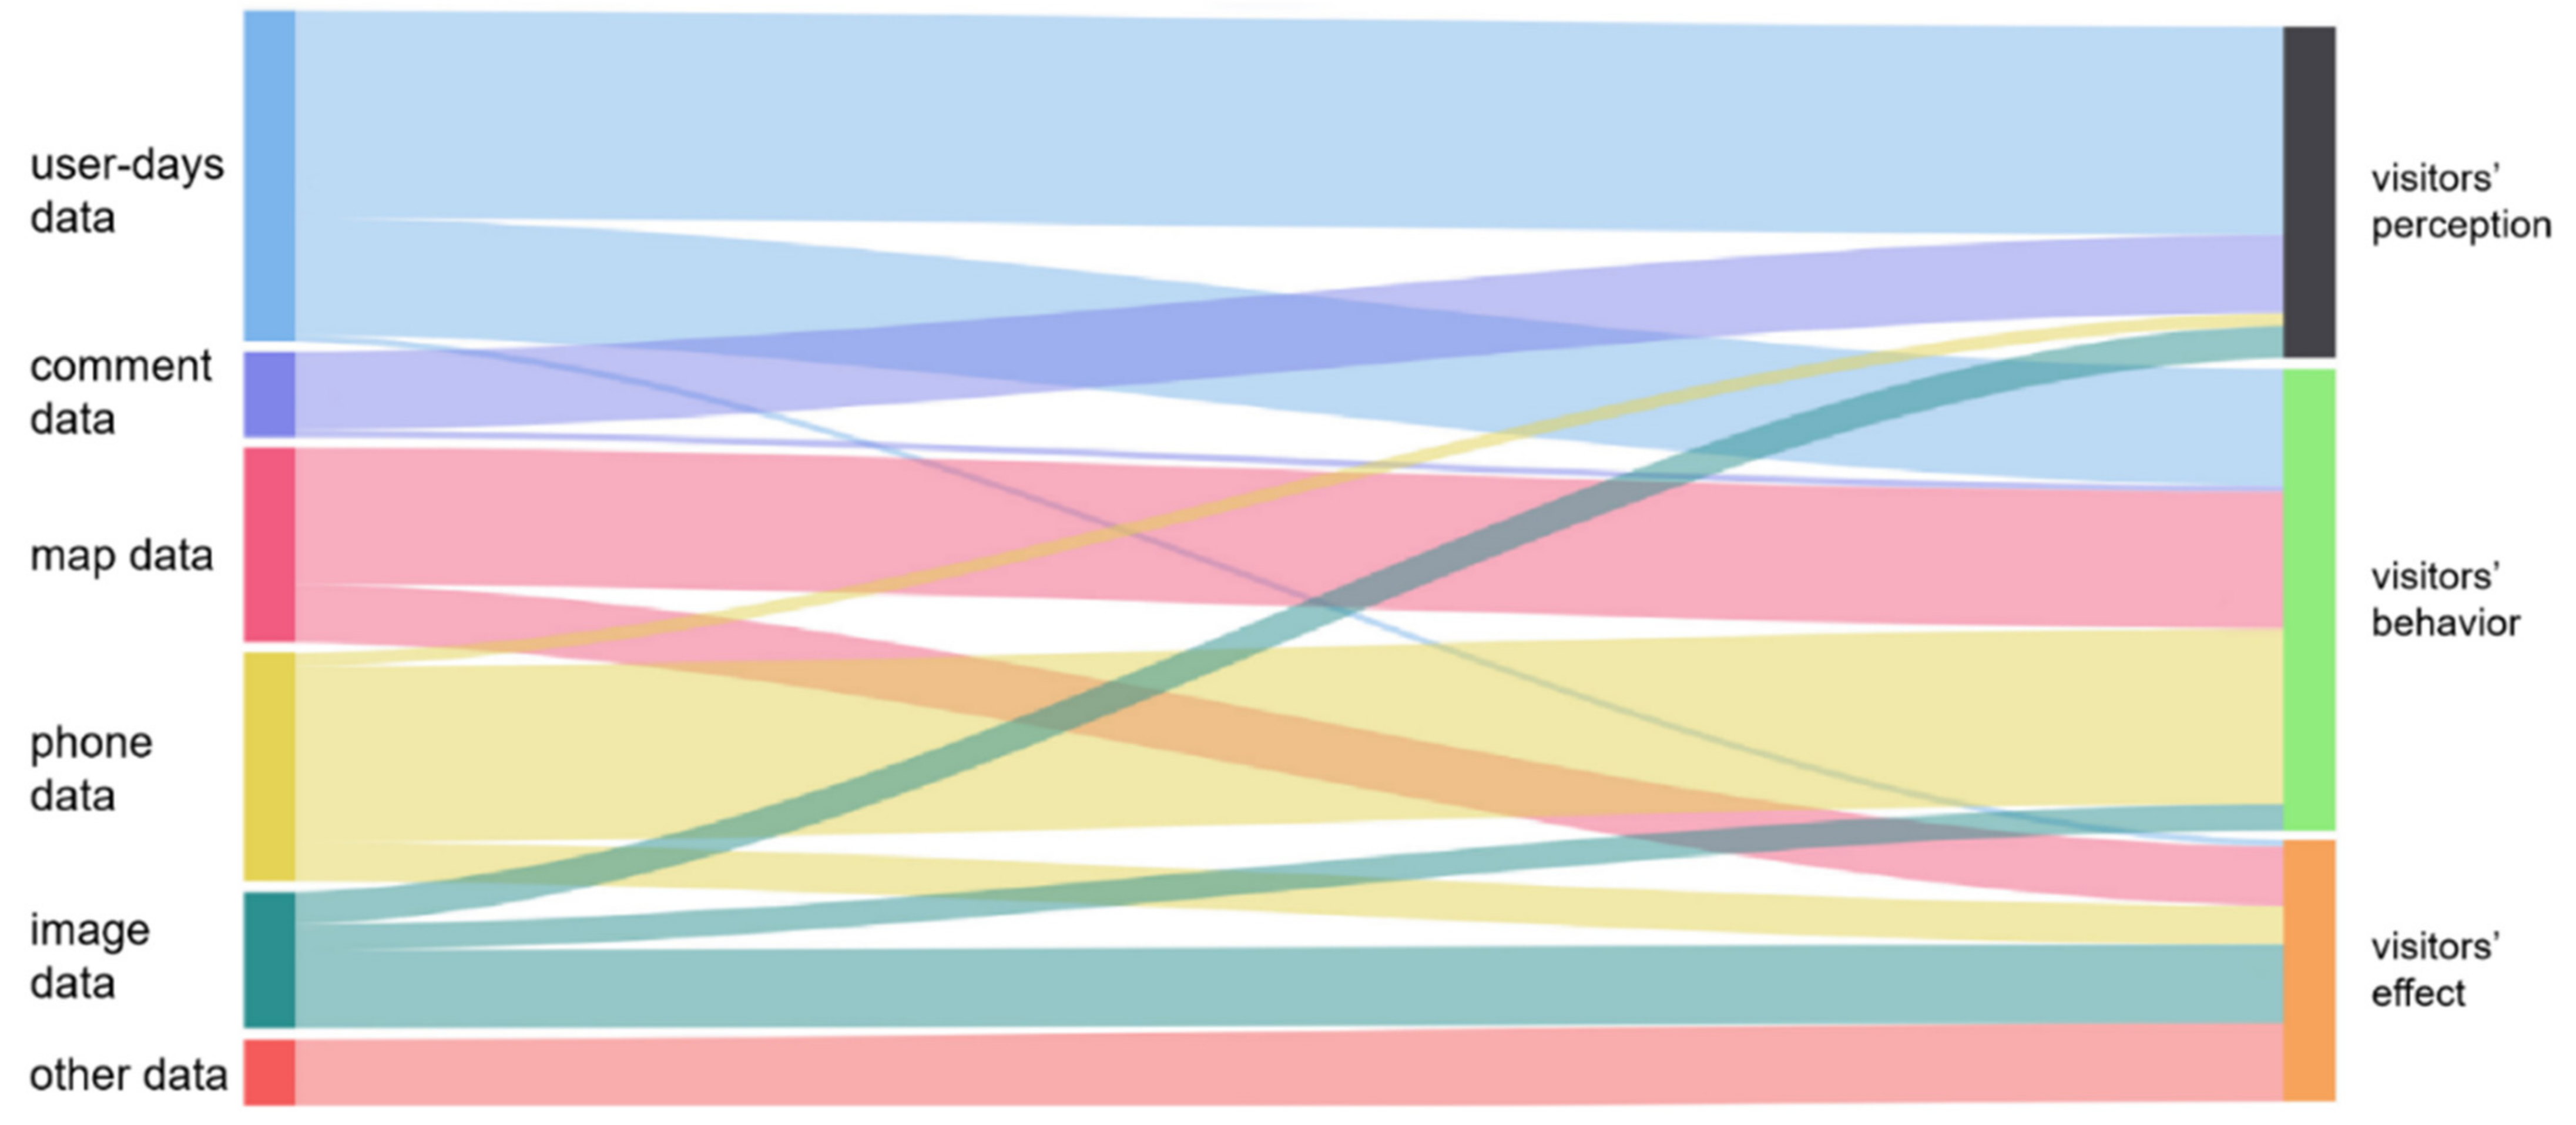
3.4. Key Themes in Big Data-Based Urban Park Research in Visitor Dimension
3.4.1. Visitors’ Behavior
3.4.2. Visitors’ Perception
3.4.3. Visitors’ Effect
4. Discussion
4.1. Advantages
4.2. Limitations
4.3. Future Directions
4.3.1. Integrating Different Types of Big Data and Traditional Data
4.3.2. Extending the Application Domain of Big Data
4.3.3. Facing the Emergency of Pandemic
5. Conclusions
Author Contributions
Funding
Institutional Review Board Statement
Informed Consent Statement
Data Availability Statement
Conflicts of Interest
References
- Bigne, J.E.; Andreu, L.; Gnoth, J. The Theme Park Experience: An Analysis of Pleasure, Arousal and Satisfaction. Tour. Manag. 2005, 26, 833–844. [Google Scholar] [CrossRef]
- Ramkissoon, H.; Weiler, B.; Smith, L.D.G. Place Attachment and Pro-Environmental Behaviour in National Parks: The Development of a Conceptual Framework. J. Sustain. Tour. 2012, 20, 257–276. [Google Scholar] [CrossRef] [Green Version]
- Jim, C.Y.; Shan, X. Socioeconomic Effect on Perception of Urban Green Spaces in Guangzhou, China. Cities 2013, 31, 123–131. [Google Scholar] [CrossRef]
- Sanesi, G.; Chiarello, F. Residents and Urban Green Spaces: The Case of Bari. Urban For. Urban Green. 2006, 4, 125–134. [Google Scholar] [CrossRef]
- Wright Wendel, H.E.; Zarger, R.K.; Mihelcic, J.R. Accessibility and Usability: Green Space Preferences, Perceptions, and Barriers in a Rapidly Urbanizing City in Latin America. Landsc. Urban Plan. 2012, 107, 272–282. [Google Scholar] [CrossRef]
- Chen, B.; Song, Y.; Jiang, T.; Chen, Z.; Huang, B.; Xu, B. Real-Time Estimation of Population Exposure to PM2.5 Using Mobile- and Station-Based Big Data. Int. J. Environ. Res. Public Health 2018, 15, 573. [Google Scholar] [CrossRef] [PubMed] [Green Version]
- Maxwell, J. Qualitative Research Design: An Interactive Approach; Sage: New York, NY, USA, 2012. [Google Scholar]
- Shahriari, B.; Swersky, K.; Wang, Z.; Adams, R.P.; Freitas, N. de Taking the Human Out of the Loop: A Review of Bayesian Optimization. Proc. IEEE 2016, 104, 148–175. [Google Scholar] [CrossRef] [Green Version]
- Jiayi, J.; Ming, C.; Junhua, Z. Analyses of elderly visitors’ behaviors to community parks in shanghai and the impact factors. Landsc. Archit. Front. 2020, 8, 94–109. [Google Scholar] [CrossRef]
- Guo, S.H.; Song, C.; Pei, T.; Liu, Y.X.; Ma, T.; Du, Y.Y.; Chen, J.; Fan, Z.D.; Tang, X.L.; Peng, Y.; et al. Accessibility to Urban Parks for Elderly Residents: Perspectives from Mobile Phone Data. Landsc. Urban Plan. 2019, 191, 103642. [Google Scholar] [CrossRef]
- Xiao, Y.; Wang, D.; Fang, J. Exploring the Disparities in Park Access through Mobile Phone Data: Evidence from Shanghai, China. Landsc. Urban Plan. 2019, 181, 80–91. [Google Scholar] [CrossRef]
- Sangzhaxi, L.; Feng, Z. How to Evaluate Public Space Vitality Based on Mobile Phone Data: An Empirical Analysis of Nanjing’s Parks. Geogr. Res. 2019, 38, 1594–1608. [Google Scholar]
- Gao, S.; Liu, Y.; Wang, Y.; Ma, X. Discovering Spatial Interaction Communities from Mobile Phone Data. Trans. GIS 2013, 17, 463–481. [Google Scholar] [CrossRef] [Green Version]
- Khoury, M. Big Data Meets Public Health. Science 2014, 346, 1054–1055. [Google Scholar] [CrossRef] [Green Version]
- Lenhart, A.; Purcell, K.; Smith, A.; Zickuhr, K. Social Media & Mobile Internet Use Among Teens and Young Adults. Pew Internet Am. Life Proj. 2010, 6, 1–28. [Google Scholar]
- Di Minin, E.; Tenkanen, H.; Toivonen, T. Prospects and Challenges for Social Media Data in Conservation Science. Front. Environ. Sci. 2015, 3, 63. [Google Scholar] [CrossRef] [Green Version]
- Hobbs, M.; Griffiths, C.; Green, M.A.; Jordan, H.; Saunders, J.; McKenna, J. Neighbourhood Typologies and Associations with Body Mass Index and Obesity: A Cross-Sectional Study. Prev. Med. 2018, 111, 351–357. [Google Scholar] [CrossRef]
- Kong, L.Q.; Liu, Z.F.; Wu, J.G. A Systematic Review of Big Data-Based Urban Sustainability Research: State-of-the-Science and Future Directions. J. Clean. Prod. 2020, 273, 123142. [Google Scholar] [CrossRef]
- Wilkins, E.J.; Wood, S.A.; Smith, J.W. Uses and Limitations of Social Media to Inform Visitor Use Management in Parks and Protected Areas: A Systematic Review. Environ. Manag. 2021, 67, 120–132. [Google Scholar] [CrossRef]
- Cui, N.; Malleson, N.; Houlden, V.; Comber, A. Using VGI and Social Media Data to Understand Urban Green Space: A Narrative Literature Review. ISPRS Int. J. Geo-Inf. 2021, 10, 425. [Google Scholar] [CrossRef]
- Liberati, A.; Altman, D.G.; Tetzlaff, J.; Mulrow, C.; Gotzsche, P.C.; Ioannidis, J.P.A.; Clarke, M.; Devereaux, P.J.; Kleijnen, J.; Moher, D. The PRISMA Statement for Reporting Systematic Reviews and Meta-Analyses of Studies That Evaluate Health Care Interventions: Explanation and Elaboration. PLoS Med. 2009, 6, e1–e34. [Google Scholar] [CrossRef]
- Khan, K.S.; Kunz, R.; Kleijnen, J.; Antes, G. Five Steps to Conducting a Systematic Review. J. R. Soc. Med. 2003, 96, 118–121. [Google Scholar] [CrossRef]
- Song, X.P.; Richards, D.R.; He, P.J.; Tan, P.Y. Does Geo-Located Social Media Reflect the Visit Frequency of Urban Parks? A City-Wide Analysis Using the Count and Content of Photographs. Landsc. Urban Plan. 2020, 203, 103908. [Google Scholar] [CrossRef]
- Ghahramani, M.; Galle, N.J.; Ratti, C.; Pilla, F. Tales of a City: Sentiment Analysis of Urban Green Space in Dublin. Cities 2021, 119, 103395. [Google Scholar] [CrossRef]
- Hassani, H.; Huang, X.; Silva, E.S.; Ghodsi, M. A Review of Data Mining Applications in Crime. Stat. Anal. Data Min. ASA Data Sci. J. 2016, 9, 139–154. [Google Scholar] [CrossRef]
- Lin, Y.Y.; Zhou, Y.H.; Lin, M.S.; Wu, S.D.; Li, B.Y. Exploring the Disparities in Park Accessibility through Mobile Phone Data: Evidence from Fuzhou of China. J. Environ. Manag. 2021, 281, 111849. [Google Scholar] [CrossRef] [PubMed]
- Osaba, E.; Pierdicca, R.; Malinverni, E.S.; Khromova, A.; Alvarez, F.J.; Bahillo, A. A Smartphone-Based System for Outdoor Data Gathering Using a Wireless Beacon Network and GPS Data: From Cyber Spaces to Senseable Spaces. ISPRS Int. J. Geo-Inf. 2018, 7, 190. [Google Scholar] [CrossRef] [Green Version]
- Schwartz, A.J.; Dodds, P.S.; O’Neil-Dunne, J.P.M.; Danforth, C.M.; Ricketts, T.H. Visitors to Urban Greenspace Have Higher Sentiment and Lower Negativity on Twitter. People Nat. 2019, 1, 476–485. [Google Scholar] [CrossRef]
- Liu, P.; Liu, M.N.; Xia, T.T.; Wang, Y.T.; Wei, H.X. Can Urban Forest Settings Evoke Positive Emotion? Evidence on Facial Expressions and Detection of Driving Factors. Sustainability 2021, 13, 8687. [Google Scholar] [CrossRef]
- Cheng, Y.Y.; Zhang, J.G.; Wei, W.; Zhao, B. Effects of Urban Parks on Residents’ Expressed Happiness before and during the COVID-19 Pandemic. Landsc. Urban Plan. 2021, 212, 104118. [Google Scholar] [CrossRef]
- Zhai, Y.J.; Wu, H.B.; Fan, H.C.; Wang, D. Using Mobile Signaling Data to Exam Urban Park Service Radius in Shanghai: Methods and Limitations. Comput. Environ. Urban Syst. 2018, 71, 27–40. [Google Scholar] [CrossRef]
- Liu, Z.H.; Huang, Q.D.; Yang, H.Y. Supply-Demand Spatial Patterns of Park Cultural Services in Megalopolis Area of Shenzhen, China. Ecol. Indic. 2021, 121, 107066. [Google Scholar] [CrossRef]
- Donahue, M.L.; Keeler, B.L.; Wood, S.A.; Fisher, D.M.; Hamstead, Z.A.; McPhearson, T. Using Social Media to Understand Drivers of Urban Park Visitation in the Twin Cities, MN. Landsc. Urban Plan. 2018, 175, 1–10. [Google Scholar] [CrossRef]
- Hamstead, Z.A.; Fisher, D.; Ilieva, R.T.; Wood, S.A.; McPhearson, T.; Kremer, P. Geolocated Social Media as a Rapid Indicator of Park Visitation and Equitable Park Access. Comput. Environ. Urban Syst. 2018, 72, 38–50. [Google Scholar] [CrossRef]
- Shen, Y.A.; Sun, F.; Che, Y.Y. Public Green Spaces and Human Wellbeing: Mapping the Spatial Inequity and Mismatching Status of Public Green Space in the Central City of Shanghai. Urban For. Urban Green. 2017, 27, 59–68. [Google Scholar] [CrossRef]
- Plunz, R.A.; Zhou, Y.J.; Vintimilla, M.I.C.; Mckeown, K.; Yu, T.; Uguccioni, L.; Sutto, M.P. Twitter Sentiment in New York City Parks as Measure of Well-Being. Landsc. Urban Plan. 2019, 189, 235–246. [Google Scholar] [CrossRef]
- Liu, Q.; Ullah, H.; Wan, W.G.; Peng, Z.Y.; Hou, L.; Rizvi, S.S.; Haidery, S.A.; Qu, T.; Muzahid, A.A.M. Categorization of Green Spaces for a Sustainable Environment and Smart City Architecture by Utilizing Big Data. Electronics 2020, 9, 1028. [Google Scholar] [CrossRef]
- Zhai, X.Z.; Lange, E. Using social media to explore perceptions of ecosystem services by nature-based solution projects. Landsc. Archit. Front. 2020, 8, 58–77. [Google Scholar] [CrossRef]
- Roberts, H.; Sadler, J.; Chapman, L. Using Twitter to Investigate Seasonal Variation in Physical Activity in Urban Green Space. Geo-Geogr. Environ. 2017, 4, e00041. [Google Scholar] [CrossRef]
- Kovacs-Gyori, A.; Ristea, A.; Kolcsar, R.; Resch, B.; Crivellari, A.; Blaschke, T. Beyond Spatial Proximity-Classifying Parks and Their Visitors in London Based on Spatiotemporal and Sentiment Analysis of Twitter Data. ISPRS Int. J. Geo-Inf. 2018, 7, 378. [Google Scholar] [CrossRef] [Green Version]
- Fang, L.; Zhang, D.; Liu, T.; Yao, S.; Fan, Z.; Xie, Y.; Wang, X.; Li, X. A Multi-Level Investigation of Environmental Justice on Cultural Ecosystem Services at a National Scale Based on Social Media Data: A Case of Accessibility to Five-A Ecological Attractions in China. J. Clean. Prod. 2021, 286, 124923. [Google Scholar] [CrossRef]
- Lu, Y.; Zhao, J.T.; Wu, X.Y.; Lo, S.M. Escaping to Nature during a Pandemic: A Natural Experiment in Asian Cities during the COVID-19 Pandemic with Big Social Media Data. Sci. Total Environ. 2021, 777, 146092. [Google Scholar] [CrossRef]
- Wang, Z.F.; Zhu, Z.W.; Xu, M.; Qureshi, S. Fine-Grained Assessment of Greenspace Satisfaction at Regional Scale Using Content Analysis of Social Media and Machine Learning. Sci. Total Environ. 2021, 776, 145908. [Google Scholar] [CrossRef] [PubMed]
- Dai, P.C.; Zhang, S.L.; Chen, Z.X.; Gong, Y.L.; Hou, H.P. Perceptions of Cultural Ecosystem Services in Urban Parks Based on Social Network Data. Sustainability 2019, 11, 5386. [Google Scholar] [CrossRef] [Green Version]
- Guo, S.H.; Yang, G.G.; Pei, T.; Ma, T.; Song, C.; Shu, H.; Du, Y.Y.; Zhou, C.H. Analysis of Factors Affecting Urban Park Service Area in Beijing: Perspectives from Multi-Source Geographic Data. Landsc. Urban Plan. 2019, 181, 103–117. [Google Scholar] [CrossRef]
- Lyu, F.N.; Zhang, L. Using Multi-Source Big Data to Understand the Factors Affecting Urban Park Use in Wuhan. Urban For. Urban Green. 2019, 43, 126367. [Google Scholar] [CrossRef]
- Dong, Y.P.; Liu, H.L.; Zheng, T.M. Does the Connectivity of Urban Public Green Space Promote Its Use? An Empirical Study of Wuhan. Int. J. Environ. Res. Public Health 2020, 17, 297. [Google Scholar] [CrossRef] [Green Version]
- Chen, Y.; Yue, W.Z.; La Rosa, D. Which Communities Have Better Accessibility to Green Space? An Investigation into Environmental Inequality Using Big Data. Landsc. Urban Plan. 2020, 204, 103919. [Google Scholar] [CrossRef]
- Li, Q.; Peng, K.L.; Cheng, P. Community-Level Urban Green Space Equity Evaluation Based on Spatial Design Network Analysis (SDNA): A Case Study of Central Wuhan, China. Int. J. Environ. Res. Public Health 2021, 18, 10174. [Google Scholar] [CrossRef]
- Zhang, S.M.; Zhang, W.S.; Wang, Y.; Zhao, X.Y.; Song, P.H.; Tian, G.H.; Mayer, A.L. Comparing Human Activity Density and Green Space Supply Using the Baidu Heat Map in Zhengzhou, China. Sustainability 2020, 12, 7075. [Google Scholar] [CrossRef]
- Bu, J.T.; Yin, J.; Yu, Y.F.; Zhan, Y. Identifying the Daily Activity Spaces of Older Adults Living in a High-Density Urban Area: A Study Using the Smartphone-Based Global Positioning System Trajectory in Shanghai. Sustainability 2021, 13, 5003. [Google Scholar] [CrossRef]
- Chen, Y.Y.; Liu, X.P.; Gao, W.X.; Wang, R.Y.; Li, Y.; Tu, W. Emerging Social Media Data on Measuring Urban Park Use. Urban For. Urban Green. 2018, 31, 130–141. [Google Scholar] [CrossRef]
- Vich, G.; Marquet, O.; Miralles-Guasch, C. Green Exposure of Walking Routes and Residential Areas Using Smartphone Tracking Data and GIS in a Mediterranean City. Urban For. Urban Green. 2019, 40, 275–285. [Google Scholar] [CrossRef]
- Norman, P.; Pickering, C.M. Factors Influencing Park Popularity for Mountain Bikers, Walkers and Runners as Indicated by Social Media Route Data. J. Environ. Manag. 2019, 249, 109413. [Google Scholar] [CrossRef]
- Rotem-Mindali, O.; Michael, Y.; Helman, D.; Lensky, I.M. The Role of Local Land-Use on the Urban Heat Island Effect of Tel Aviv as Assessed from Satellite Remote Sensing. Appl. Geogr. 2015, 56, 145–153. [Google Scholar] [CrossRef]
- Baran, P.K.; Tabrizian, P.; Zhai, Y.J.; Smith, J.W.; Floyd, M.F. An Exploratory Study of Perceived Safety in a Neighborhood Park Using Immersive Virtual Environments. Urban For. Urban Green. 2018, 35, 72–81. [Google Scholar] [CrossRef]
- Liu, Y.P.; Hu, M.J.; Zhao, B. Audio-Visual Interactive Evaluation of the Forest Landscape Based on Eye-Tracking Experiments. Urban For. Urban Green. 2019, 46, 126476. [Google Scholar] [CrossRef]
- Amati, M.; Parmehr, E.G.; McCarthy, C.; Sita, J. How Eye-Catching Are Natural Features When Walking through a Park? Eye-Tracking Responses to Videos of Walks. Urban For. Urban Green. 2018, 31, 67–78. [Google Scholar] [CrossRef]
- Park, J.; Kim, J. Economic Impacts of a Linear Urban Park on Local Businesses: The Case of Gyeongui Line Forest Park in Seoul. Landsc. Urban Plan. 2019, 181, 139–147. [Google Scholar] [CrossRef]
- Paton, D.; Romero, F.; Cuenca, J.; Escudero, J.C. Tolerance to Noise in 91 Bird Species from 27 Urban Gardens of Iberian Peninsula. Landsc. Urban Plan. 2012, 104, 1–8. [Google Scholar] [CrossRef]
- Kwon, Y.; Joo, S.; Han, S.; Park, C. Mapping the Distribution Pattern of Gentrification near Urban Parks in the Case of Gyeongui Line Forest Park, Seoul, Korea. Sustainability 2017, 9, 231. [Google Scholar] [CrossRef] [Green Version]
- Guan, C.; Song, J.; Keith, M.; Zhang, B.; Akiyama, Y.; Da, L.J.; Shibasaki, R.; Sato, T. Seasonal Variations of Park Visitor Volume and Park Service Area in Tokyo: A Mixed-Method Approach Combining Big Data and Field Observations. Urban For. Urban Green. 2021, 58, 126973. [Google Scholar] [CrossRef]
- Korpilo, S.; Virtanen, T.; Lehvavirta, S. Smartphone GPS Tracking-Inexpensive and Efficient Data Collection on Recreational Movement. Landsc. Urban Plan. 2017, 157, 608–617. [Google Scholar] [CrossRef] [Green Version]
- Li, F.Z.; Li, F.Y.; Li, S.J.; Long, Y. Deciphering the Recreational Use of Urban Parks: Experiments Using Multi-Source Big Data for All Chinese Cities. Sci. Total Environ. 2020, 701, 134896. [Google Scholar] [CrossRef]
- Gu, Z.H.; Zhang, Y.; Chen, Y.; Chang, X.M. Analysis of Attraction Features of Tourism Destinations in a Mega-City Based on Check-in Data MiningA Case Study of Shenzhen, China. ISPRS Int. J. Geo-Inf. 2016, 5, 210. [Google Scholar] [CrossRef] [Green Version]
- Richards, D.R.; Tuncer, B. Using Image Recognition to Automate Assessment of Cultural Ecosystem Services from Social Media Photographs. Ecosyst. Serv. 2018, 31, 318–325. [Google Scholar] [CrossRef]
- Song, Y.; Fernandez, J.; Wang, T. Understanding Perceived Site Qualities and Experiences of Urban Public Spaces: A Case Study of Social Media Reviews in Bryant Park, New York City. Sustainability 2020, 12, 8036. [Google Scholar] [CrossRef]
- Van den Bosch, M.A.; Mudu, P.; Uscila, V.; Barrdahl, M.; Kulinkina, A.; Staatsen, B.; Swart, W.; Kruize, H.; Zurlyte, I.; Egorov, A.I. Development of an Urban Green Space Indicator and the Public Health Rationale. Scand. J. Public Health 2016, 44, 159–167. [Google Scholar] [CrossRef]
- Kulhavy, D.L.; Unger, D.R.; Hung, I.K.; Zhang, Y.L. Comparison of AR.Drone Quadricopter Video and the Visual CTLA Method for Urban Tree Hazard Rating. J. For. 2016, 114, 517–523. [Google Scholar] [CrossRef] [Green Version]
- Song, Y.; Huang, B.; Cai, J.; Chen, B. Dynamic Assessments of Population Exposure to Urban Greenspace Using Multi-Source Big Data. Sci. Total Environ. 2018, 634, 1315–1325. [Google Scholar] [CrossRef] [PubMed]
- Kubo, T.; Uryu, S.; Yamano, H.; Tsuge, T.; Yamakita, T.; Shirayama, Y. Mobile Phone Network Data Reveal Nationwide Economic Value of Coastal Tourism under Climate Change. Tour. Manag. 2020, 77, 104010. [Google Scholar] [CrossRef]
- Neutens, T.; Schwanen, T.; Witlox, F.; De Maeyer, P. Equity of Urban Service Delivery: A Comparison of Different Accessibility Measures. Environ. Plan. A 2010, 42, 1613–1635. [Google Scholar] [CrossRef]
- Sim, J.; Miller, P. Understanding an Urban Park through Big Data. Int. J. Environ. Res. Public Health 2019, 16, 3816. [Google Scholar] [CrossRef] [Green Version]
- Batty, M. Big Data, Smart Cities and City Planning. Dialogues Hum. Geogr. 2013, 3, 274–279. [Google Scholar] [CrossRef]
- Yao, L.; Chen, L.; Wei, W.; Sun, R. Potential Reduction in Urban Runoff by Green Spaces in Beijing: A Scenario Analysis. Urban For. Urban Green. 2015, 14, 300–308. [Google Scholar] [CrossRef]
- Li, F.Z.; Guo, S.Y.; Li, D.; Li, X.; Li, J.; Xie, S. A Multi-Criteria Spatial Approach for Mapping Urban Ecosystem Services Demand. Ecol. Indic. 2020, 112, 106119. [Google Scholar] [CrossRef]
- Ahas, R.; Silm, S.; Järv, O.; Saluveer, E.; Tiru, M. Using Mobile Positioning Data to Model Locations Meaningful to Users of Mobile Phones. J. Urban Technol. 2010, 17, 3–27. [Google Scholar] [CrossRef]
- Brown, G. An Empirical Evaluation of the Spatial Accuracy of Public Participation GIS (PPGIS) Data. Appl. Geogr. 2012, 34, 289–294. [Google Scholar] [CrossRef]
- Heikinheimo, V.; Tenkanen, H.; Bergroth, C.; Jarv, O.; Hiippala, T.; Toivonen, T. Understanding the Use of Urban Green Spaces from User-Generated Geographic Information. Landsc. Urban Plan. 2020, 201, 103845. [Google Scholar] [CrossRef]
- Song, X.P.; Richards, D.R.; Tan, P.Y. Using Social Media User Attributes to Understand Human-Environment Interactions at Urban Parks. Sci. Rep. 2020, 10, 808. [Google Scholar] [CrossRef] [PubMed] [Green Version]
- Castanho, R.A.; Naranjo Gomez, J.M.; Vulevic, A.; Couto, G. The Land-Use Change Dynamics Based on the CORINE Data in the Period 1990–2018 in the European Archipelagos of the Macaronesia Region: Azores, Canary Islands, and Madeira. ISPRS Int. J. Geo-Inf. 2021, 10, 342. [Google Scholar] [CrossRef]
- Sharifi, A.; Khavarian-Garmsir, A.R. The COVID-19 Pandemic: Impacts on Cities and Major Lessons for Urban Planning, Design, and Management. Sci. Total Environ. 2020, 749, 142391. [Google Scholar] [CrossRef] [PubMed]
- Jiang, B.; Schmillen, R.; Sullivan, W.C. How to Waste a Break: Using Portable Electronic Devices Substantially Counteracts Attention Enhancement Effects of Green Spaces. Environ. Behav. 2018, 51, 1133–1160. [Google Scholar] [CrossRef]
- Zhu, J.Y.; Xu, C.Y. Sina Microblog Sentiment in Beijing City Parks as Measure of Demand for Urban Green Space during the COVID-19. Urban For. Urban Green. 2021, 58, 126913. [Google Scholar] [CrossRef]
- Herman, K.; Drozda, L. Green Infrastructure in the Time of Social Distancing: Urban Policy and the Tactical Pandemic Urbanism. Sustainability 2021, 13, 1632. [Google Scholar] [CrossRef]


Publisher’s Note: MDPI stays neutral with regard to jurisdictional claims in published maps and institutional affiliations. |
© 2022 by the authors. Licensee MDPI, Basel, Switzerland. This article is an open access article distributed under the terms and conditions of the Creative Commons Attribution (CC BY) license (https://creativecommons.org/licenses/by/4.0/).
Share and Cite
Guo, H.; Luo, Z.; Li, M.; Kong, S.; Jiang, H. A Literature Review of Big Data-Based Urban Park Research in Visitor Dimension. Land 2022, 11, 864. https://doi.org/10.3390/land11060864
Guo H, Luo Z, Li M, Kong S, Jiang H. A Literature Review of Big Data-Based Urban Park Research in Visitor Dimension. Land. 2022; 11(6):864. https://doi.org/10.3390/land11060864
Chicago/Turabian StyleGuo, Hongxu, Zhuoqiao Luo, Mengtian Li, Shumin Kong, and Haiyan Jiang. 2022. "A Literature Review of Big Data-Based Urban Park Research in Visitor Dimension" Land 11, no. 6: 864. https://doi.org/10.3390/land11060864
APA StyleGuo, H., Luo, Z., Li, M., Kong, S., & Jiang, H. (2022). A Literature Review of Big Data-Based Urban Park Research in Visitor Dimension. Land, 11(6), 864. https://doi.org/10.3390/land11060864