Article

Spatial–Temporal Characteristics and Driving Mechanisms of Land–Use Transition from the Perspective of Urban–Rural Transformation Development: A Case Study of the Yangtze River Delta

1
School of Social and Public Administration, East China University of Science and Technology, Shanghai 200237, China
2
School of Management, Shanghai University, Shanghai 200444, China
*
Author to whom correspondence should be addressed.
Land 2022, 11(5), 631; https://doi.org/10.3390/land11050631
Submission received: 18 March 2022 / Revised: 22 April 2022 / Accepted: 23 April 2022 / Published: 25 April 2022

Abstract

:
Urban–rural transformation development is the key to resolving the imbalance in the dual structure of urban and rural areas. However, the transformation of the urban–rural relationship will also affect the structure and spatial distribution of land use. This paper measured the spatial–temporal characteristics of land–use transition in the Yangtze River Delta from 1990 to 2018 by using a geo–information Tupu method and explored the driving mechanism of land–use transition under the background of urban–rural transformation development by using a spatial regression analysis method. The results showed the following: (1) The transition from cultivated land to urban construction land, from rural residential land to cultivated land, and from rural residential land to urban construction land were the three main types of land–use transition in the Yangtze River Delta during urban–rural transformation development. (2) The transition from cultivated land to urban construction land was always the most important type of land–use transition. It expanded from the central area to the surrounding cities. The transition of rural residential land to cultivated land and urban construction land began to increase significantly after the year 2010, which was the urban–rural integration development period. (3) The urban–rural land–use transition was driven by government policies, industrial restructuring, population urbanization and migration. During the urban–rural integration development period, secondary industry and tertiary industry were the main driving factors of the transition from cultivated land to urban construction land. The number of policies, the primary industry, the total population, and the urbanization rate were the main driving factors of the transition from rural residential land to cultivated land. Primary industry, secondary industry, and tertiary industry were the main driving factors of the transition from rural residential land to urban construction land. Finally, the study provided some suggestions for policy, industry, and population driving forces.

1. Introduction

Land–use transition is an important component of global land use and sustainability research [1,2]. Since land–use transition was first proposed by Grainger in the study of forestland change [3], its research fields have gradually expanded to cultivated land transition [4,5,6] and construction land transition [7,8,9,10]. Much relevant research has concentrated on theories related to land–use transition [11,12], characteristics of land–use transition [13,14,15,16], and the driving forces of land–use transition [17,18,19]. The concept of land–use transition may be further developed with socio–economic development [20]. It is now generally accepted that land–use transition refers to the spatial–temporal trend of long–term land–use change in a certain region in accordance to the stage of socio–economic development [3,21]. Land–use transition includes cultivated land, forest land, urban land, rural land, and other individual types of land use, as well as the overall land use of the region. Different from land–use change, which simply represents the conversion of land use in a short time, land–use transition usually corresponds to the stage of socio–economic development. Land–use transition is also the result of the interaction between the land–use behavior of different groups and the regulatory actions of the government.
As a result of accelerated urbanization and increased human activities, the transformation of the urban–rural relationship has become an important socioeconomic phenomenon in the world [22,23]. Further changes of the relationship between urban and rural areas have brought about a dramatic change in global land use. China, as one of the largest developing countries, has experienced dramatic shifts in the relationship between urban and rural areas in a very short period [24,25]. From the 1990s until the beginning of the 21st century, China implemented a development strategy that focused on urban areas, rather than rural ones. Many resources were primarily unidirectional flows from rural to urban areas, widening the gap between urban and rural areas. At the same time, land–use transition was mainly from cultivated land in urban–rural fringe areas to construction land in urban areas. Some land–use conflicts have emerged at the regional level, such as the disordered expansion of urban construction land, the inefficient use of rural construction land, and the occupation and pollution of cultivated land. The unidirectional transition from cultivated land to urban construction land is significant, which further aggravates city–biased development and is not conducive to the rational use of land resources and the sustainable development of urban and rural areas.
Fortunately, the government is aware of how serious these issues are. In the 21st century, the 16th National Congress of the Communist Party of China (CPC) put forward the “coordination of urban–rural economic development” and began to promote the reform of urban–rural relations. Policies to support “agriculture, rural and farmers” fostered the free movement of labor, land, capital, and other factors between urban and rural areas [26]. Land–use policies such as “the pothook policy of urban construction land increase and rural residential land decrease” and the “cultivated land balance policy” have been introduced. In 2017, the 19th National Congress of the CPC made a significant decision to support “rural revitalization” and put forward the concept of “urban–rural integration development” for the first time. In 2020, the Chinese government put forward a new urban–rural relationship with complementary development of urban and rural areas, coordinated development, and shared prosperity. The land–use transition is moving in a diverse direction and from unsustainable to sustainable development.
As an important resource element and spatial carrier of urban and rural development [27], land–use transition plays an essential role in the interaction between urban and rural areas. Currently, China has stepped into an important period of urban–rural transformation development, facing severe challenges from economic growth mode and industrial structure adjustments. Particularly in coastal cities and regions of the Yangtze River Delta, many land–use transition issues are worth exploring.
Because of the special relationship between urban and rural areas in China, the research on land–use transition has made some progress in recent years. It is mainly reflected in the relationship between land–use transition and urban–rural development [28,29,30], the impact of land–use transition on urban–rural spatial transition [31,32], and the spatial–temporal and correlation characteristics of urban–rural construction land transition [33,34,35,36].
This paper focuses on the characteristics and driving mechanisms of land–use transition in the Yangtze River Delta within the context of urban–rural transformation development, aiming to explain the interaction between human activities and land–use change. The spatial–temporal characteristics of land–use transitions can identify the main changes of land use in quantity and space at different periods from a regional perspective, determine whether there are regular patterns of land–use change in a specific region, and help local governments think about what type of land–use transition is detrimental to sustainable development in urban–rural transformation to advance future land–use transitions towards multiple sustainable development goals. The driving mechanism can reveal the profound reasons for land–use transition in the process of urban–rural transformation. It can also help local governments explore whether there are irrational human activities and development practices that lead to unsustainable land use, so as to adapt rural and urbanization strategies and optimize the land resource allocation efficiency. Although different countries and regions have different contexts of land–use transition, it is even more important to adapt urban–rural relationship to local and regional circumstances. This study can also provide a reference for other developing countries and other regions of the world experiencing various periods of urban–rural development and promote the organic integration of urban–rural transformation and land–use transition.
The structure of this paper is as follows: Section 2 analyzes the driving mechanisms of land–use transition at different stages of urban and rural development. Section 3 introduces the study area, data sources, and research methods. Section 4 analyzes the overall land–use transition, spatial–temporal pattern, and the effect of driving factors on urban–rural land–use transition. Section 5 discusses the empirical results. Section 6 draws the main conclusions and policy implications.

2. Theoretical Analysis of Driving Mechanism

The urban–rural development of China has undergone different stages, which are closely connected with land–use transition in urban and rural areas [25]. Based on existing research and land–use management practices [27,37,38], this paper divides urban–rural transformation development into three stages: urban–rural interaction development, urban–rural coordinating development, and urban–rural integration development. Meanwhile, this paper classifies the driving mechanisms of land–use transition into the following three items: government policy, industrial restructuring, and population urbanization and migration.
As the main body for macro–planning and land–use management, the government often restricts the behavior of land–use subjects through the formulation of policies. These policies can guide land–use transition in a reasonable direction, so as to implement effective regulation [39]. Agricultural support systems and cultivated land protection policy can effectively restrain the transition of cultivated land to other land types and slow down the occupation of cultivated land resources by urban expansion. Through the reform of cultivated land and rural residential land, land acquisition is regulated and the rural construction land efficiency is improved. The pothook policy of urban construction land increase and rural residential land decrease is akin to the transferable development rights policy in the United States. Rural residential land is reclaimed as cultivated land, and reduced rural residential land can be replaced with new urban construction land quotas in a urban–rural project area [40]. This is reflected in land–use transition as an increase in cultivated land and a balance of urban–rural construction land. Therefore, the regional urban and rural land policies are associated with the area of each type of land–use transition to different degrees. This is particularly apparent in the pilot reform regions of the Yangtze River Delta (e.g., Songjiang, Shanghai and Yiwu, Zhejiang).
The various functions of land constitute the basis of industrial structure, restructuring, and evolution of regional industry and can be reflected in the land–use transition. It is also the redistribution and combining of land resources across different industries and departments [41]. China’s industrial structure is characterized by a high proportion of low value–added revenue, high consumption, and high pollution–emitting industries [42], which leads to over–dependence on land resources. The characteristics of the urban–rural industrial dual economic structure in the Yangtze River Delta are more obvious. The structural imbalance between the three industries and the lack of urban–rural industrial integration are major problems. It is an important objective in the Yangtze River Delta to build a platform of coordinated development of urban–rural industries and innovate new industries and new forms of business in rural areas. The modernization of rural industries directly affects the amount of cultivated land. Changes in production values and the efficiency of primary, secondary and tertiary industries directly affect the changes in cultivated land, urban construction land, and their mutual transition.
Migration and population growth are closely connected to the transition of land use [43,44,45]. Generally speaking, population agglomeration is positively correlated with growing industrial land and urban areas. The population flow from rural areas to urban areas also drives urban land expansion in urbanization development. Population migration in the Yangtze River Delta has two significant characteristics: villages gathering to cities and surrounding cities gathering to central cities. These trends lead to the rural residential land in the outer suburbs being reclaimed for cultivated land and the cultivated land and residential land in the near suburbs being transformed into urban construction land; thus, the construction land in cities is expanded.

3. Materials and Methods
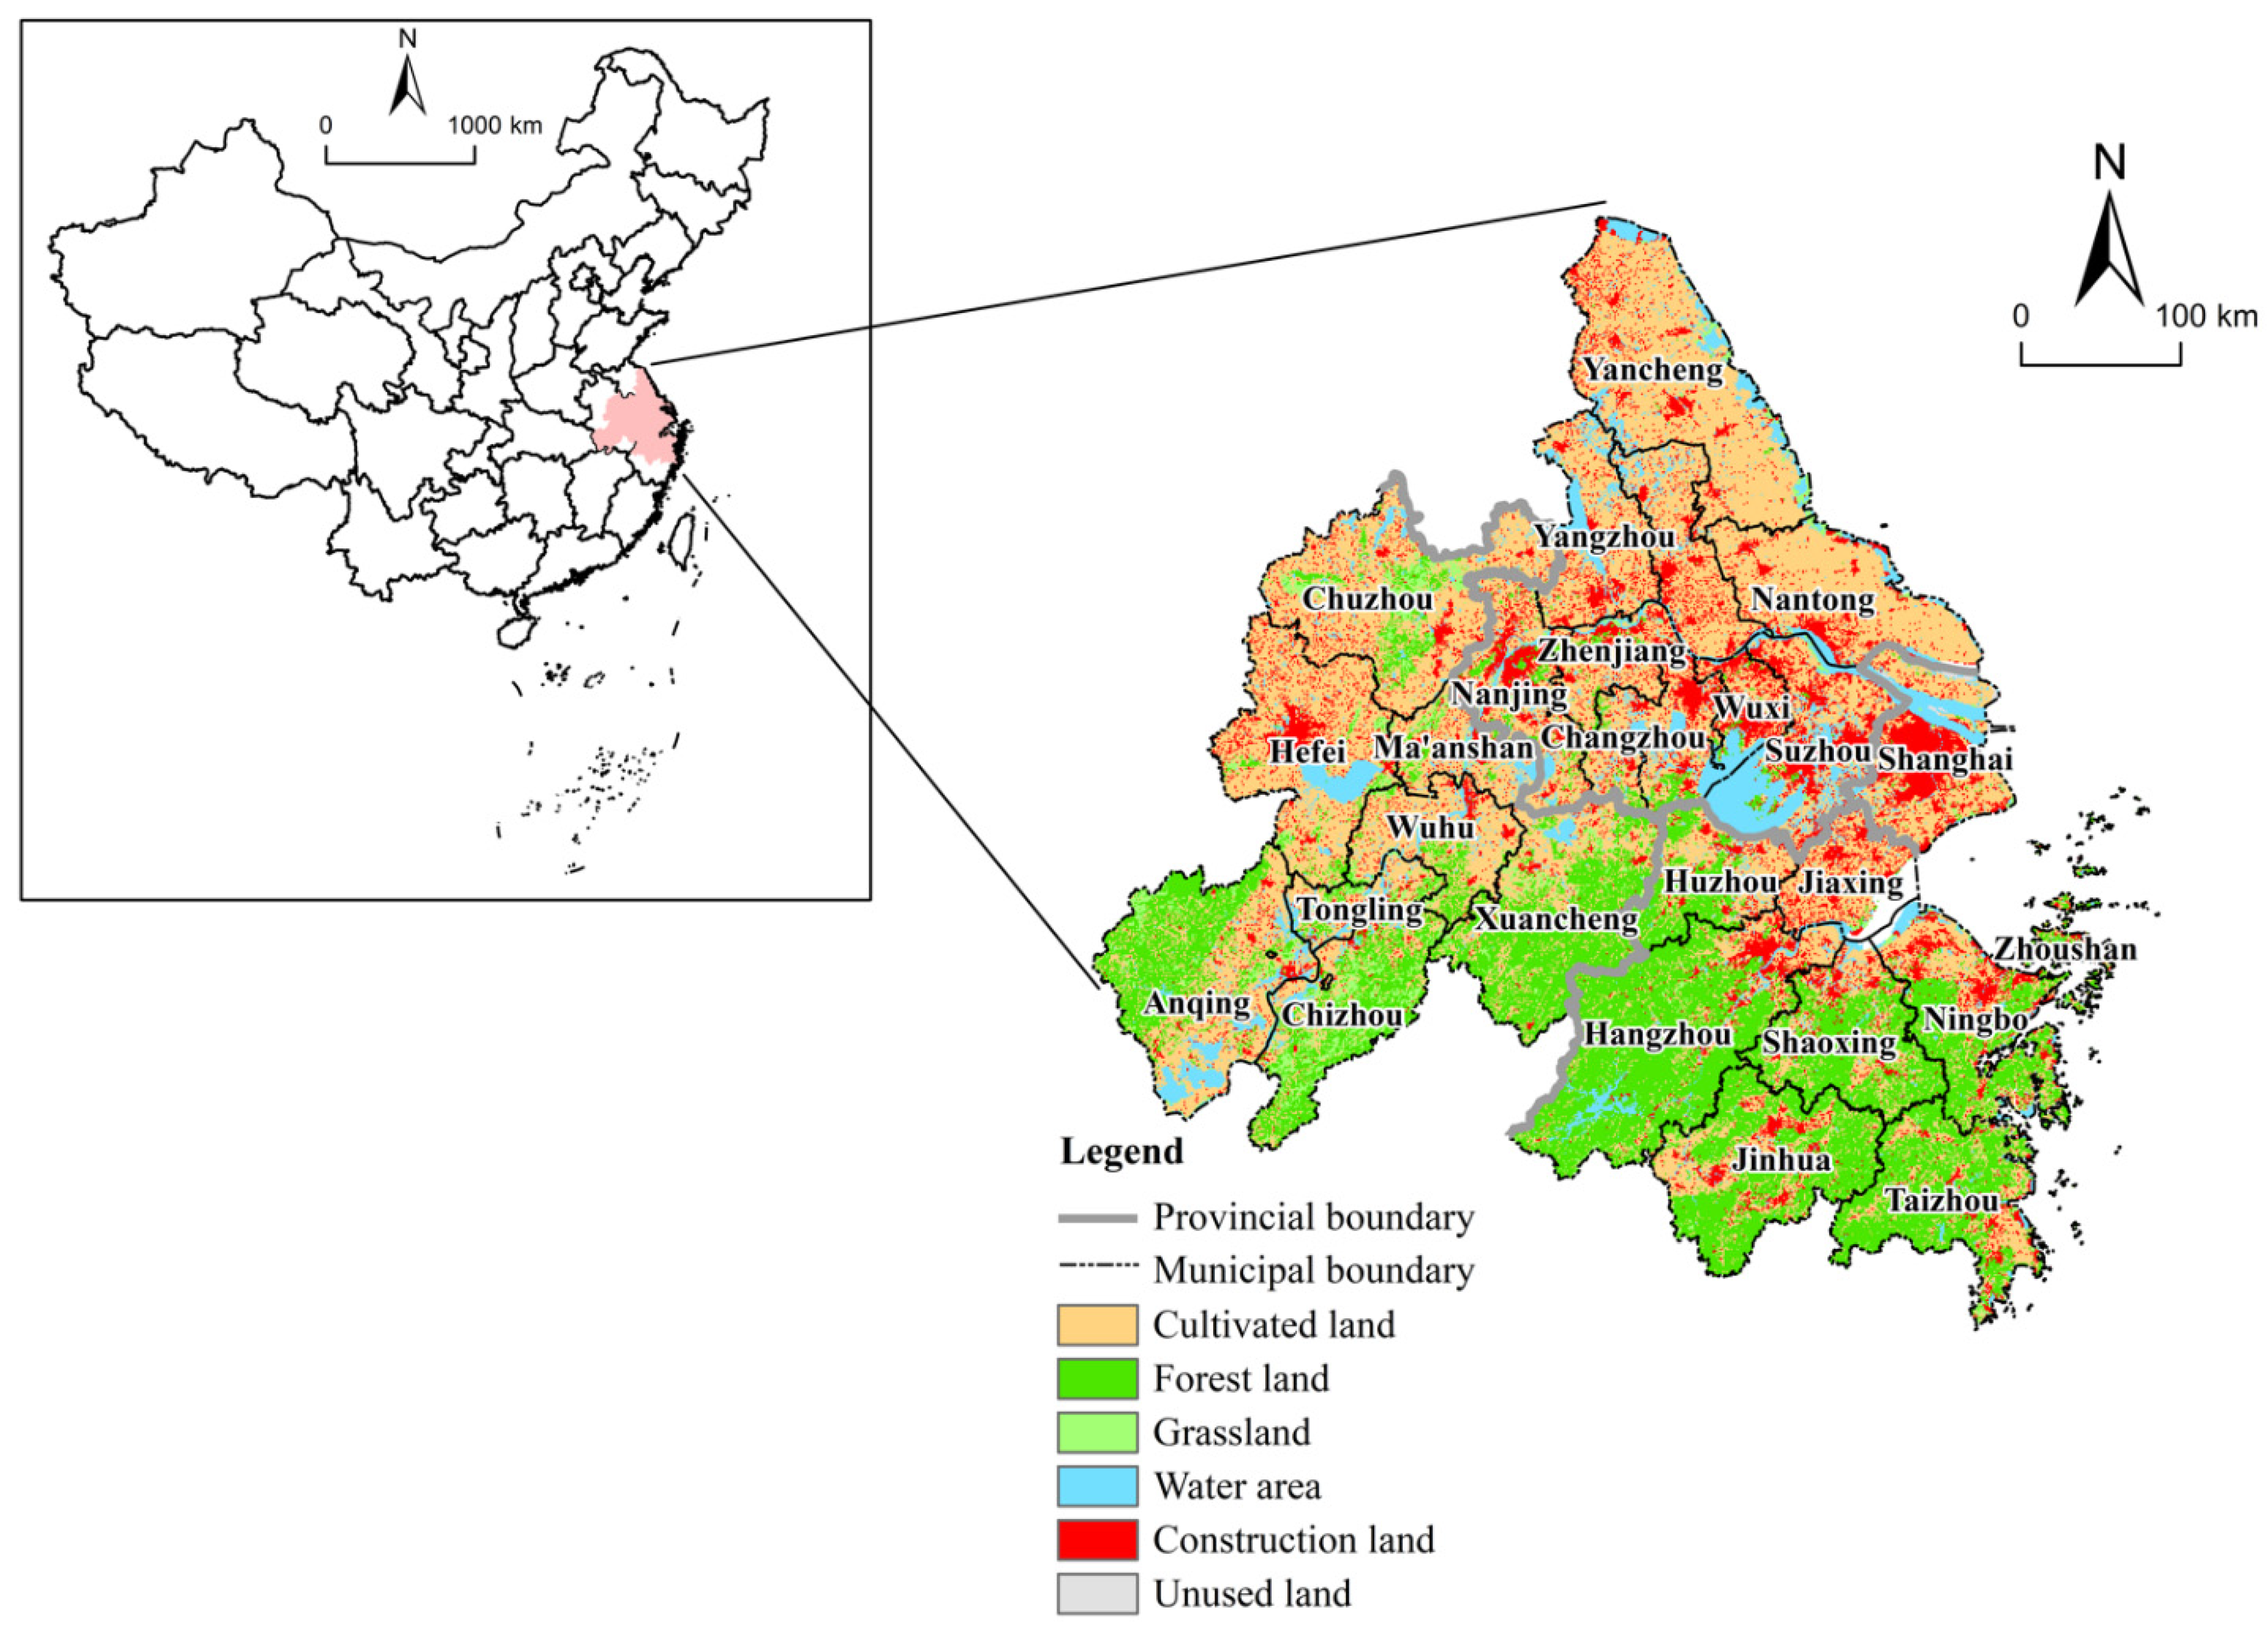
3.1. Study Area

The Yangtze River Delta is an important engine of China’s economic development, contributing roughly a quarter of the country’s GDP. According to the Development Plan for Urban Agglomeration in the Yangtze River Delta (2016–2020), approved by China’s State Council, the Yangtze River Delta includes 26 cities (9 cities in Jiangsu province, 8 cities in Zhejiang province, 8 cities in Anhui province, and the city of Shanghai). The total city area reaches 21.17 × 10⁴ km2. The level of urban–rural transformation development in the Yangtze River Delta may reflect the future direction of urban–rural relationships in China and has become a national strategy. The land resources in the Yangtze River Delta are strongly affected by human activities between urban areas and rural areas, so the regional land–use transition is active. The Yangtze River Delta has also exposed some land–use problems, such as insufficient development potential, the uncontrolled expansion of construction land, massive occupation of cultivated land resources, and low efficiency of rural residential land [46]. The pattern of land–use transition in the study area can reflect the characteristics of land–use transition in the high–level areas of socio–economic development and urbanization in China. Therefore, we take the Yangtze River Delta as an example to explore land–use transition and its driving mechanisms under urban–rural transformation development.

3.2. Methods

We first analyzed the spatial–temporal pattern of the overall land–use transition in the Yangtze River Delta using the geo–information Tupu method. The geo–information Tupu method can sequentially overlay two annual land–use raster maps to obtain land–use transition maps. We were able to select data based on the stage of urban–rural transformation development and data availability.
Then, based on the transition area calculated using the Tupu method, the impact of each driving factor on the transition between urban and rural areas can be measured by the spatial lag model (SLM) and the spatial error model (SEM).

3.2.1. Geo–Information Tupu Method

As a method of processing and displaying information, the geo–information Tupu method is capable of reflecting the spatial structure and the spatial–temporal rule of change by analyzing maps and images. It introduces the brevity of landscape maps and the abstraction of mathematical models [47]. In order to better reveal the development and change rule of geographic areas, the model units are “Tu”, representing the space unit characteristics, and “Pu”, expressing the starting point and process of events as one [48].
Based on the land–use data of four periods in the Yangtze River Delta, this paper employs a raster calculator to conduct map algebraic operations and build Tupu series models for land–use transition using ArcGIS software. Tupu unit codes for cultivated land, forest land, grassland, water areas, construction land, and unused land were set as 1, 2, 3, 4, 5, and 6, respectively. The synthesis formula of atlas coding is as follows:
C = 10A + B
where C represents the Tupu unit codes of land–use transition; and A and B represent the Tupu unit codes of land use at the beginning and end of the period, respectively. Thus, the land–use transition Tupu of the Yangtze River Delta can be obtained.
Furthermore, the change rate of each type of land–use transition can be calculated according to the Tupu produced by map algebraic operation. It can show the quantitative and structural characteristics of land–use transition in different time periods. The formula is as follows:
R AB = S AB   ×   100 % / A = 1 q B = 1 q S AB ( A     B ,   q = 6 )
where RAB represents the change rate of a certain type of land–use transition, SAB represents the transition area from land–use type A at the initial stage to land–use type B at the late stage, and q represents the number of land–use types.

3.2.2. Driving Force Indicators Selection

Following the principles of science, comparability, representativeness, and data availability, this paper constructed a preliminary driving force index system on the basis of the framework of the driving mechanism and previous literature [15,38]. After consulting relevant experts, 13 indicators were eventually selected for the paper.
Government policy driving force can be measured by the number of policy texts related to urban–rural land use issued by each city (X1).
The industrial restructuring driving force can be measured by the changes in output value of primary industry (X2), secondary industry (X3), and tertiary industry (X4) [32].
The population urbanization and migration driving force can be measured by the change in total population at the end of the year (X5) and the change in the population urbanization rate (X6).
The elevation (X7), annual average precipitation (X8), change in GDP per capita (X9), change in local fiscal revenue (X10), change in fixed–asset investment (X11), change in per–capita disposable income of urban population (X12), and change in per–capita disposable income of rural population (X13) were selected as the other driving factors for natural and economic development.
The descriptions of the independent variables are shown in Table 1.

3.2.3. Spatial Regression Analysis Methods

Spatial econometric models can be seen as extensions of conventional regression models by incorporating spatial effects [49]. As the land–use transition is typically self–corrected in space [15], the spatial lag model (SLM) and spatial error model (SEM) were used for spatial regression analysis in this study. SLM is applicable to express the spatial dispersion of each factor variable with spatial correlation and quantitatively shows the degree of influence of dependent variables by independent variables on adjacent space units. Its mathematical expression is as follows:
y = ρWy + βX + ε
where y represents the dependent variables, such as the area of land–use transition type; Wy represents the spatial lag independent variable of the spatial weight matrix W; X represents the matrix of observed values of independent variables, such as the type of driving force; ρ represents the parameter of Wy, which reflects the degree of spatial correlation between values; β represents the regression coefficient of X; and ε represents the error term vector.
SEM describes the spatial disturbance correlation and spatial overall autocorrelation between variables through the correlation of error terms, and its mathematical expression is as follows:
y = Xβ + ε
ε = λWε + μ
where y represents the dependent variable, such as the area of land–use transition type; X represents the matrix of observed values of independent variables, such as the type of driving force; β represents the regression residual vector; ε represents the error term vector; λ represents the autoregressive coefficient, which reflects the direction and degree of influence of the observed values in the neighboring region; Wε represents the weight matrix of space disturbance term; and μ represents the normal distribution error vector.
Based on the main types of urban–rural land–use transition derived from spatial–temporal characteristics analysis, the area of the main types and total area of urban–rural land–use transition are selected as dependent variables yi (i = 1,2, …, m), respectively. All the selected driving force indicators are independent variables Xj (j = 1,2, …, n).

3.3. Data Sources

In accordance with data availability and research requirements, land–use data for the study area consisted of four raster data periods (1990, 2000, 2010, and 2018) in the Yangtze River Delta. The periods of 1990–2000, 2000–2010, and 2010–2018 may also be regarded as the urban–rural interaction development period, coordinating development period, and integration development period, respectively. These raster data were obtained from the Center for Resources and Environmental Sciences and Data, Chinese Academy of Sciences (http://www.resdc.cn/, accessed on 15 December 2020). The comprehensive accuracy of the data reached 94.3% [50], with high credibility and a resolution of 1 km. According to the actual situation of the study area, the land–use types were divided into six categories: cultivated land, grassland, forest land, water area, construction land, and unused land.
Socioeconomic data were obtained from the statistical yearbooks of each city from 2010 to 2018. Elevation data were derived from DEM raster data of Geospatial Data Cloud (http://www.gscloud.cn/, accessed on 15 December 2020). The annual average precipitation data came from the data of various stations and statistical yearbooks of various cities. The data on the quantity of policies were collected from the Peking University Magic Weapon database (http://www.pkulaw.cn/, accessed on 15 December 2020). Keywords such as “cultivated land protection”, “balance between occupation and supplement”, “pothook policy of urban construction land increase and rural residential land decrease”, and “urban–rural land use” were selected from the policy texts of each city, then the quantity was counted.
Figure 1 shows the location and land–use status in 2018. Cultivated land, forest land, and construction land are the main land–use types in the Yangtze River Delta, accounting for 46.52%, 26.92%, and 13.73%, respectively.

4. Results

4.1. Overall Land–Use Transition in the Yangtze River Delta

The structure of land use in the study area changed significantly from 1990 to 2018, and there were significant temporal and spatial changes in the area of each land–use type. The cultivated land area was decreased gradually and the reduction rate was increased. Cultivated land area accounted for 54.38%, 52.75%, 50.12%, and 46.52% in 1990, 2000, 2010, and 2018, respectively. The total change in the cultivated land area was 15659 km2, and the average dynamic land use index was −0.49%. The proportion of construction land area gradually increased to 6.22%, 7.56%, 10.11%, and 13.73%, for 1990, 2000, 2010, and 2018, respectively. The total change in construction land area was 15,964 km2 and the average dynamic land use index was 4.37%, which was the highest among all land–use types. In addition, changes in the amount of forest land, grassland, and water were relatively stable. The grassland area initially declined and then tended to be stable. The water area showed a slight increasing trend, especially the water area around the Taihu Lake basin.
There were 29 types of Tupu units with spatial–temporal heterogeneity in the study period (Figure 2), and the main types were listed by area (Table 2). From 1990 to 2000, “cultivated land to construction land” and “grassland to forest land” were the most significant transition units, with change rates of 37.07% and 30.17%, respectively. The “cultivated land to construction land” was mainly distributed in the central cities around the Yangtze River basin (Shanghai, Suzhou, Hefei, etc.). From 2000 to 2010, the transition from cultivated land to construction land was more drastic, and the change rate reached 74.11%. The “grassland to forest land” was concentrated in the hilly areas of Zhejiang Province (Shaoxing, Jinhua, Taizhou, and other cities). This is mainly because part of the slope with poor water conservation conditions was transformed into forest land. This is also linked to the adjustment of the regional agricultural structure (the development of economic forest planting) [51].
The transition from cultivated land to water area was 695 km2, mainly distributed around the Taihu Lake basin. The area of mutual transition between forest land and construction land, water area, and other land types was small.
The total area of the transitional Tupu units from 2010 to 2018 increased significantly compared with the previous periods, and the mutual transition between cultivated land and construction land was the most significant, mainly distributed in Shanghai, southern Jiangsu province, and central Anhui province. At the same time, the mutual transitions between cultivated land and forest land, and cultivated land and water area were relatively significant.
In general, the land–use transition from 1990 to 2018 was dominated by the mutual transition between cultivated land and construction land, cultivated land and forest land, and cultivated land and water area. This showed obvious regional development differences and policy characteristics in spatial distribution. The land–use transition in the later period was more intense: not only did the area increase obviously but the spatial distribution also became more extensive.

4.2. Spatial–Temporal Characteristics Analysis of Urban–Rural Land–Use Transition in the Yangtze River Delta

In the context of urban–rural information development, the most significant response is the mutual transition of cultivated land and construction land among many transition types. In fact, construction land contains two main types: one is urban construction land, and the other is rural residential land.
The rapid development of urbanization and industrialization will inevitably lead to the expansion of cities and the transition of cultivated land to urban construction land in the urban–rural fringe. At the same time, the implementation of cultivated land balance policies and the pothook policy of urban construction land increase and rural residential land decrease can drive the transition of rural residential land to cultivated land and urban construction land. The transition from rural residential land to cultivated land can relieve the pressure of cultivated land into urban construction land; it is also the reservoir and regulator of urban–rural land integration transition.
Therefore, the transition of cultivated land to urban construction land, rural residential land to cultivated land, and rural residential land to urban construction land can jointly constitute a cycle of urban–rural land use and integrated development.

4.2.1. Temporal Analysis of Urban–Rural Land–Use Transition in the Yangtze River Delta

Three main types of transition are shown in Table 3: from cultivated land to urban construction land, rural residential land to urban construction land, and rural residential land to cultivated land. It should be noted that since the change rate is the proportion of one type of transition in all types of transition in a period, it can occur that the changed area is large, but the change rate is not high. For example, the area of cultivated land to urban construction land was 6600 km2 in 2010–2018, but the change rate was only 10.06%; the change rate was lower than 48.30% in the years 2000–2010.
In the urban–rural interaction development period (1990–2000), the urban–rural land–use transition was mainly exhibited through urban expansion occupying cultivated land. The change rate from cultivated land to urban construction land was 18.03%, accounting for the largest proportion of the subtotal change rate of three types of transition (18.33%). The changed area from rural residential land to urban construction land and to cultivated land were 16 km2 and 5 km2, respectively. The characteristics of “rural supports urban” were very evident.
In the stage of the urban–rural coordinating development period (2000–2010), the area of rural residential land transformed into urban construction land had a significant increase, reaching 209 km2; the change rate also increased to 2.98%. However, there was more area growth from cultivated land to urban construction land; the changed area and change rate were 3388 km2 and 48.3%, respectively. Due to this asymmetric symbiotic relationship between urban and rural areas, the urban–rural land–use transition still reflected city–biased characteristics.
In the stage of urban–rural integration development (2010–2018), the transition of rural residential land to cultivated land became the main type. The total changed area of three types of land–use transition was 15727 km2, while the area of rural residential land transformed into cultivated land became the largest, at 7451 km2. The area of cultivated land to urban construction land transition continued to increase to 6660 km2. The area of rural residential land transformed into urban construction land decreased to 1676 km2. Land elements could flow adequately between urban and rural, and the land–use transition exhibited a trend of diversification.
In general, the urban–rural land–use transition from 1990 to 2018 was dominated by the transition of cultivated land to urban construction land. The change area increased gradually, but the change proportion increased first and then decreased. After 2010, the transition area from rural residential land to cultivated land also accounted for a certain proportion, which was mainly caused by the implementation of stricter cultivated land–protection policies. The transition area from rural residential land to urban construction land was relatively small, mainly in the last two periods.

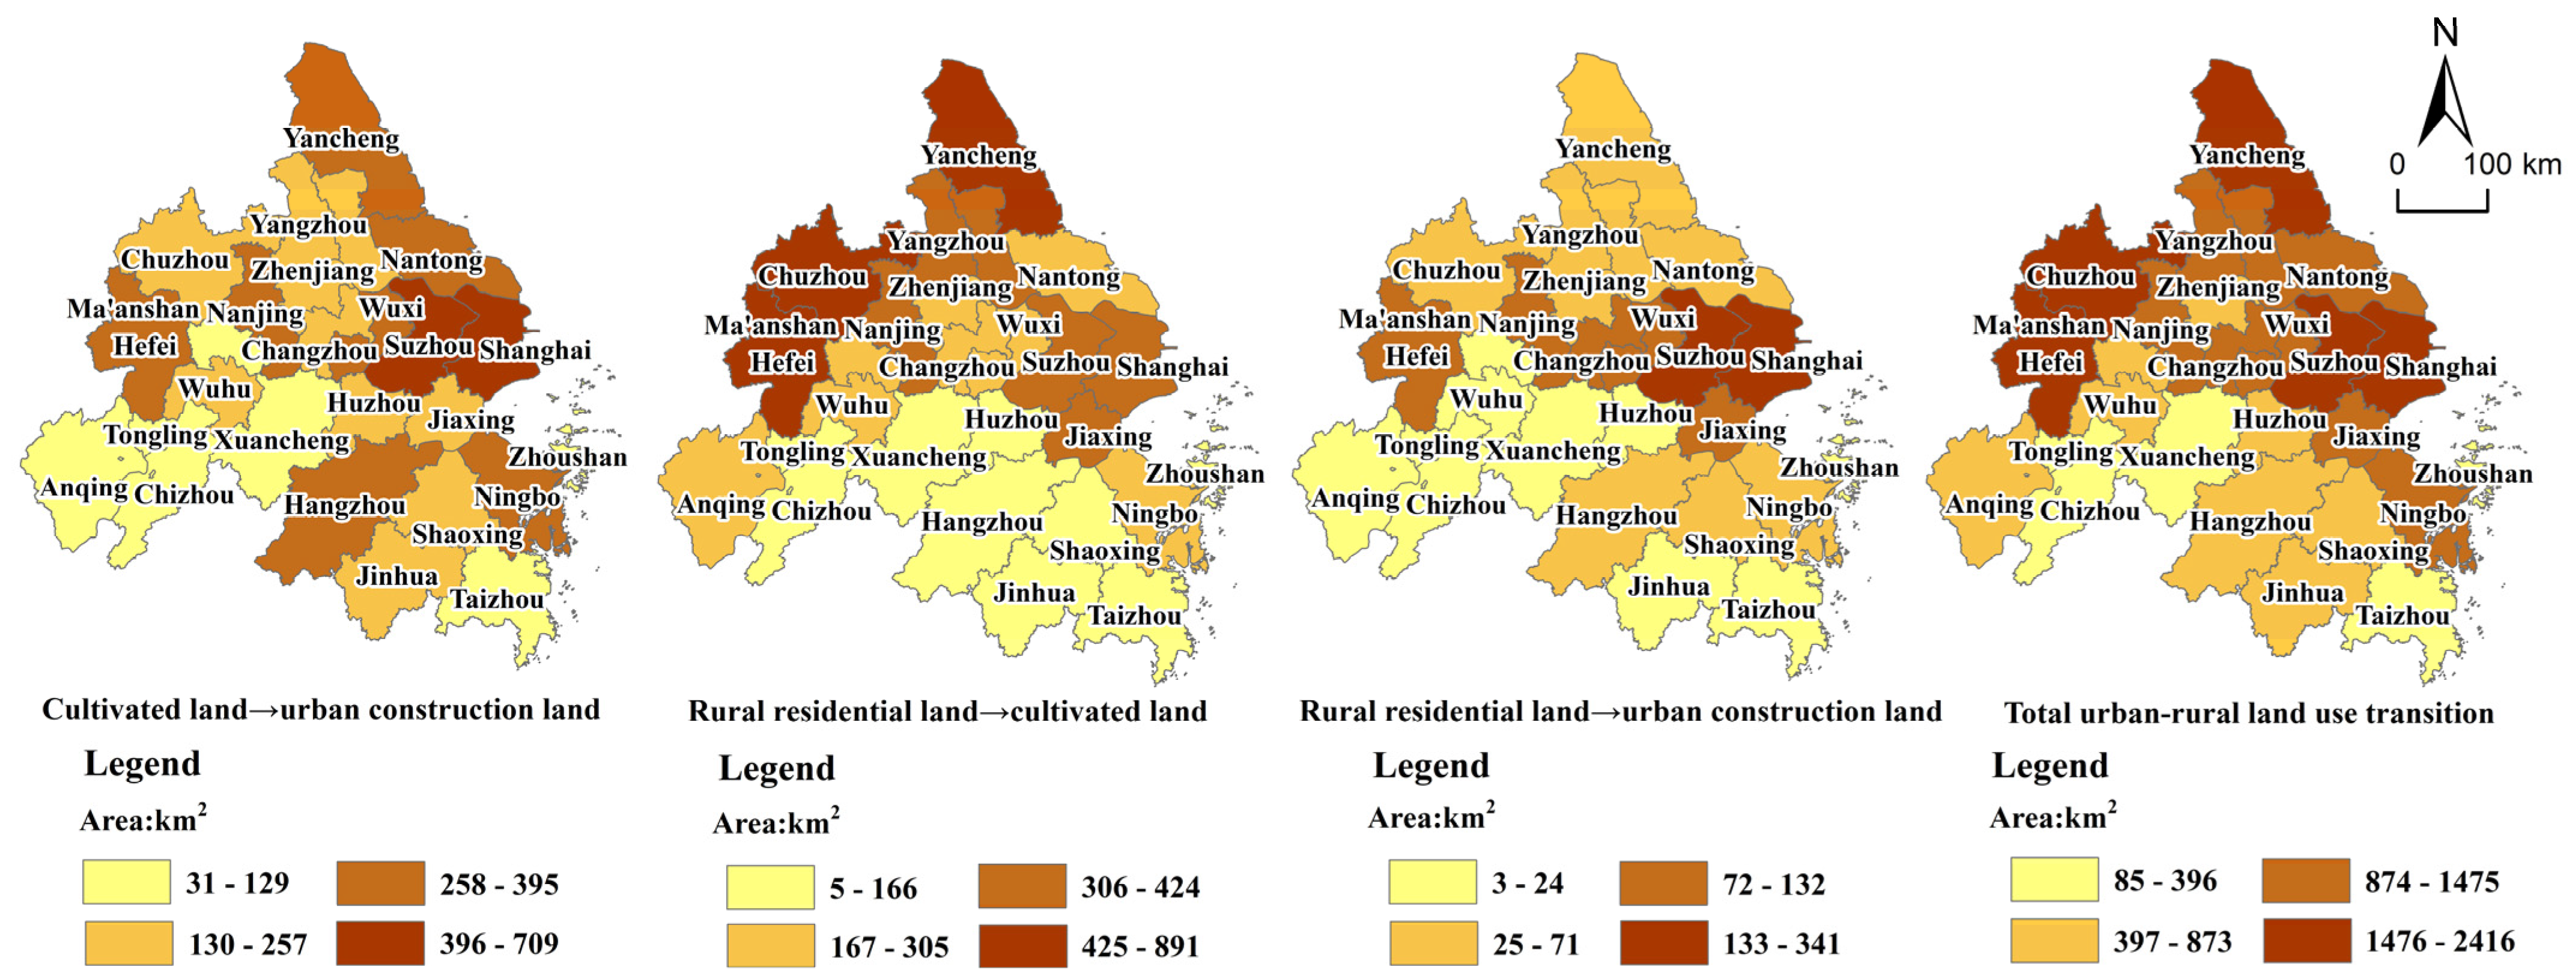
4.2.2. Spatial Analysis of Urban–Rural Land–Use Transition in the Yangtze River Delta

As shown in Figure 3, urban–rural land–use transition had significant spatial characteristics during the study period. In the early stage, the transition from cultivated land to urban construction land was mainly distributed in the core area of the Yangtze River Delta (Shanghai, Suzhou, Nanjing, Hefei, etc.), and then expanded to the surrounding cities (Jiaxing, Zhenjiang, Ma’anshan, etc.). However, the expansion of urban construction land was restricted, and the transition speed slowed down in the later stage. In general, the transition from cultivated land to urban construction land was concentrated in the surrounding areas of the Yangtze River basin and several cities with a high development level in the southeast, such as Suzhou, Shanghai.
The transition from rural residential land to cultivated land was mainly distributed at the edge of the Yangtze River Delta, especially in the Jiangsu and Anhui provinces. This is mainly because of the relatively low level of economic development in these areas, and the transfer of a large number of the rural labor force to central cities, resulting in idle rural residential land. Later, the implementation of policies such as cultivated land balance and pothook policies led to the restoration of inefficient rural residential land in these areas to cultivated land.
The transition from rural residential land to urban construction land was mainly distributed in regional central cities such as Shanghai, Suzhou, and Hefei. This showed obvious distribution characteristics around the central city. These cities have a higher level of economic and urban development and a stronger demand for urban construction land.

4.3. Driving Mechanism Analysis of Urban–Rural Land–Use Transition in the Yangtze River Delta

Because the impacts of the three main types of urban–rural land–use transition and their driving force have begun to diversify since the period of urban–rural integration, this paper focuses on the driving mechanism analysis from 2010 to 2018.
Based on the natural breakpoint classification method (NBC), the areas and change rates of cultivated land to urban construction land, rural residential land to urban construction land, rural residential land to cultivated land, and total urban–rural land–use transition were divided into four levels. As visualized in Figure 4 and Figure 5, there were obvious regional differences in the areas and change rates of urban–rural land–use transition.
This paper employed a spatial econometric model to analyze the driving mechanisms of urban–rural land–use transition in the Yangtze River Delta from 2010 to 2018 by using GeoDa software. SLM and SEM were used to measure the effect of each driving factor on the main types of urban–rural land–use transition. The variable name is the same as the definition of research method. Variables X1–X6 are the main driving forces, such as the policy driving force, industrial driving force, and population driving force. Variables X7–X13 are other driving forces. Before the spatial regression analysis, the multicollinearity diagnostic of the independent variables was conducted. The variance inflation factor (VIF) of each independent variable was less than 10, and the mean VIF of all independent variables was 5.00, indicating the inexistence of potential multicollinearity.
The fitting indexes of SLM and SEM are the fitting coefficient R2, natural log likelihood function (LogL), Akaike information criterion (AIC) and Schwartz criterion (SC). The larger the LogL, the smaller the AIC and SC and the better the fitting effect of the model [10]. The specific regression analysis results are shown in Table 4. By comparing the fitting indexes of the two models, SEM with a better effect was selected to analyze the driving mechanism of the urban–rural land–use transition.
  • X3, X4, X5, X8, and X9 are the main driving factors of the transition from cultivated land to urban construction land. The coefficient of the secondary industry (X3) is 0.16 with a statistical significance of 1%. The coefficient of the tertiary industry (X4) is 0.046 with a statistical significance of 1%. The coefficient of the change in total population at the end of the year (X5) is −0.38 with a statistical significance of 10%. The impacts of policy driving force and population driving factors are not so apparent.
  • X1, X2, X5, X6, and X13 are the main driving factors of the transition from rural residential land to cultivated land. The number of policies (X1), change in the output value of the primary industry (X2), change in the total population at the end of the year (X5), and the urbanization rate (X6) have a positive impact. Their coefficients, respectively, are 5.21, 1.71, 1.53, and 17.54, all with a statistical significance of 1%.
  • X2, X3, X4, X7, X9, and X10 have a significant impact on the transition from rural residential land to urban construction land. The impact of the primary industry (X2) on the transition to urban construction land is negative. The coefficient is −0.37 with a statistical significance of 1%. While the secondary industry (X3) and the tertiary industry (X4) have a positive impact on this type of transition, the coefficients of the two indicators are 0.063 and 0.044, respectively.
  • X1, X2, X6, X8, and X9 are the main driving factors of the total area of urban–rural land–use transition. The specific influencing degree and direction of each driving factor is similar to the above. It also indirectly demonstrates the robustness of the above results.
Table 4. Spatial regression analysis results of urban–rural land–use transition and the driving factors in the Yangtze River Delta from 2010 to 2018.
Driving FactorsTransition Area from Cultivated Land to Urban Construction Land (y1)Transition Area from Rural Residential Land to Cultivated Land (y2)Transition Area from Rural Residential Land to Urban Construction Land (y3)Total Area of Urban–Rural Land–Use Transition (y4)
SLMSEMSLMSEMSLMSEMSLMSEM
X1−1.00−1.035.70 ***5.21 ***−0.35−0.577.96 *8.02 *
X20.0520.0261.83 ***1.71 ***−0.47 ***−0.37 ***3.67 **3.95 ***
X30.15 ***0.16 ***−0.034−0.0390.056 ***0.063 ***0.280.25
X40.048 ***0.046 ***−0.040−0.0290.04 ***0.044 ***0.0030.019
X5−0.36 *−0.38 *1.56 ***1.53 ***−0.27 ***−0.191.941.61
X61.661.9818.11 ***17.54 ***0.621.4137.57 ***33.90 ***
X70.210.21−0.69−0.64−0.15 *−0.19 *−1.19−1.03
X8−0.22 **−0.25 ***−0.30−0.20−0.0390.011−1.02 *−0.90 *
X9−0.003 ***−0.003 ***−0.004 *−0.0033−0.0014 ***−0.0023 ***−0.015 **−0.013 **
X10−0.012−0.005−0.093−0.098−0.044 **−0.045 **−0.12−0.12
X11−0.017−0.0190.17 *0.14−0.013−0.00040.210.16
X120.0020.0030.0050.0040.00110.00030.0210.013
X130.004−0.003−0.027 **−0.022 **0.00040.0005−0.043−0.029
W–Y0.09 −0.31 −0.20 −0.11
Lambda 0.09 −0.01 1.43 *** −0.29
R20.930.930.810.800.950.930.820.82
Log L−134.97−133.68−159.70−155.33−110.68−107.48−182.62−182.62
AIC299.93295.35339.40338.66251.36242.97395.25393.23
SC318.80312.96358.27356.28270.23260.58414.20410.85
Note: ***, **, and * indicate statistical significance at 1%, 5% and 10% levels, respectively.

5. Discussion

5.1. Spatial–Temporal Characteristics

As a region with a high level of socio–economic development in China, urban–rural transformation development in the Yangtze River Delta has been steadily improving in recent years [52]. The land–use transition characteristics of each period in the Yangtze River Delta can reflect the future development direction in China or other developing countries to a certain extent.
In the urban–rural interaction development period, the liberalization of rural economic power (such as the reform of the dual–level management system for agricultural land and the policy of “three permissions” for non–agricultural land) led to the development of rural productivity and township enterprises [53]. However, the historical transition of industrialization and urbanization still cannot be halted. Various city–biased fiscal, taxation, and land policies have led to unidirectional flow from rural areas to urban areas of rural labor, land, fiscal, and tax funds as well as other elements [54].
In the urban–rural coordinating development period, the urbanization process in the Yangtze River Delta has accelerated because of the strategy of the coastal cities opening up. However, the contradiction between economic development, urban expansion, and cultivated land resources has deepened. At the same time, the restrictions on labor mobility continue to be relaxed [55]. A large number of the second generation of farmers migrate out of the village, especially to the east, resulting in the “hollow village” phenomenon.
In urban–rural integration development, in order to solve the problems of the unbalanced flow of elements and unreasonable allocation of public resources, some new policies are put forward, such as the reform of the unified urban–rural construction land market system and rural revitalization. Their purpose is to break down the barriers of urban–rural duality and realize the transition from giving priority to industrial and urban development to giving priority to agricultural and rural development. In addition, the reform of “three pieces of land” in rural areas also provides an institutional guarantee for revitalizing the efficiency of rural land use.
In this context, the urban–rural land–use transition in the Yangtze River Delta has become increasingly diversified. However, the transition from cultivated land to urban construction land was no longer without restriction. In particular, idle rural residential land was reclaimed for cultivated land, which not only provided a construction land index for urban development but also improved the efficiency of rural land use.
Meanwhile, urban and rural development mainly involves the surrounding areas undertaking the industrial transfer from the central cities and accelerating local urbanization and industrialization. The same is true for land–use transition. Many central cities in the Yangtze River Delta have started to take the path of intensive development, focusing on protecting cultivated land, exploiting the potential of existing urban construction land, and improving the efficiency of rural residential land use. Other neighboring cities have started to follow this trend. Therefore, the analysis of the driving mechanisms can also help cities make the land–use transition in urban and rural development more rational and sustainable.

5.2. Driving Mechanism

The transition from cultivated land to urban construction land mainly occurred in cities with a rapid development of construction and service industries. This also reflects the demand for land for urban–rural development and industrial upgrading. The impact of the secondary industry (X3) is greater than that of the tertiary industry (X4), which is perhaps due to the high construction land requirements of the secondary industry. The impact of the total population (X5) is also obvious, but it has a negative impact on the transition from cultivated land to urban construction land, perhaps because the implementation of cultivated land protection policy limits the expansion of construction land. It also can explain the mismatch between population mobility and economic agglomeration.
The transition from rural residential land to cultivated land mainly occurred in cities with rapid population growth, rapid urbanization, agricultural development, and more proactive rural residential land reform policies. On the one hand, the population gathering to the city freely in the stage of urban–rural integration development will increase the demand for urban housing and urban construction land. The expansion of urban construction land will inevitably lead to the occupation of cultivated land. On the other hand, the pothook policy of rural residential land decrease will lead to the transition of rural residential land to cultivated land. As agricultural modernization increases, there will be a need for more cultivated land to increase the scale of farming operation, which leads to the transition from rural residential land to cultivated land. In addition, to help ensure food security, the continuous promotion of cultivated land balance policy also promotes the increase in cultivated land through this type of transition. As such, the number of policy texts (X1) has a significant positive impact. The impact of the total population (X5) and the change in the population urbanization rate (X6) also reflect changes in rural residential land use caused by population, land, and industrial concentration.
The transition from rural residential land to urban construction land mainly occurred in cities with a relatively rapid development of secondary and tertiary industries. The increase in the output value of the secondary industry (X3) and tertiary industry (X4) may increase the demand for urban construction land. In cities where the stock of construction land is relatively saturated, rural residential land is often exchanged for the increase in urban construction land quotas. However, the increase in the output value of the primary industry (X2) may decrease the transition from rural residential land to urban construction land. The main reason for this may be that with the rise in the level of agricultural modernization, the production scale is expanding and more farmers are employed in agricultural production. Rural revitalization also attracts more labor and enterprises to rural areas. Farmers prefer to reclaim their residential land as farmland rather than it being acquired for urban construction.
Land policies had no significant impact on this type of transition, indicating that the operating mechanism of the rural construction land market is not sufficient. As a key component of integrated urban and rural development, a unified market for urban–rural construction land is helpful to protect the interests of farmers and to achieve equal rights and opportunities for both urban and rural residents.

6. Conclusions, Policy Implications, and Future Work

6.1. Conclusions

Different from the traditional research on the land–use transition and its driving mechanism, this study focuses on the driving mechanism of urban–rural land–use transition under the background of urban–rural transformation development and analyzes land–use–transition characteristics in different urban–rural development stages. The main conclusions of this study are as follows:
(1) In terms of the development of urban and rural transformation, the land–use transition in the Yangtze River Delta was mainly concentrated in three types: from cultivated land to urban construction land, from rural residential land to urban construction land, and from rural residential land to cultivated land. In different stages of urban–rural development, the three types of land–use transition showed different spatial–temporal characteristics. Overall, the transition of urban–rural land use in the Yangtze River Delta became more and more intense, shifting from simple transition to diversified transition.
(2) The spatial transition of urban–rural land use in the Yangtze River Delta reflected the stage characteristics of the emphasis on urban towards rural development. The transition from cultivated land to urban construction land was the main type. The changed area kept increasing, but the proportion first increased and then decreased. The spatial distribution expanded outward from the core area to the surrounding cities. The transition from rural residential land to cultivated land mainly occurred after 2010 and was distributed at the edge of the Yangtze River Delta urban agglomeration. The transition from rural residential land to urban construction land mainly occurred after 2000, and the distribution was concentrated in Shanghai, Suzhou, Hefei, and other regional central cities.
(3) The driving forces of policy, industry, and population had different effects on the area of three main types of transition and the total area of transition. In general, the transition towards urban construction land was mainly affected by the secondary industry and tertiary industry. The transition towards cultivated land was mainly affected by the primary industry, related land policies, and urbanized migration of population.

6.2. Policy Implications

Urban–rural integration development is not to pursue the spatial parity but rather an effort to achieve a reasonable flow and efficient allocation of production factors between urban and rural areas and to improve the living standards of residents. China has been carrying out a strategy of city–biased development for a long time, and it is the same in the Yangtze River Delta. The distribution of land value–added revenue that resulted from urban–rural land–use transition still favors urban areas more, resulting in impaired rural development rights. Although the development of agricultural modernization has improved the efficiency of cultivated land use in the Yangtze River Delta, farmers will still be influenced by comparative interests and choose to go to cities to engage in secondary and tertiary industries, thus further driving the development of the urban–rural land–use transition.
Based on this study, land–use transition in the process of urban–rural integration development reflects the flow of land resources between urban and rural areas and the evolution of the spatial pattern. The transition among cultivated land, rural residential land, and urban construction land in the Yangtze River Delta has different evolutionary characteristics at various stages, and there are regional differences. The urban–rural land–use transition is mainly driven by factors such as regional policies, industrial development, and population migration. This will promote the development of the non–agricultural economy to an extent and increase the value of the land and economic benefits, but this will cause the loss of cultivated land and the waste of rural residential land, resulting in the decline of the countryside.
Local governments should continue to improve the policy of linking the scale of new construction land in cities and the citizenship of the migrant agricultural population according to the functional positions of cities and the stage of urban and rural development. The transition in urban and rural land use should be regulated through market mechanisms to adapt industry restructuring and changes in the population size and structure.
The unified urban–rural construction land market should continue to be improved. It is necessary to strengthen the normalized market for rural residential land and cultivated land, improve farmers’ land property income; narrow the income and consumption gaps between urban and rural residents; minimize the amount of land acquisition and protect cultivated land; strengthen the special protection system for high–quality cultivated land, particularly permanent basic farmland; improve the rural land–use efficiency; strengthen the production and ecological functions of cultivated land; and implement inefficient construction land reduction projects in rural areas, further promoting the intensive use of rural construction land. Local government should strictly control the construction of new towns and districts, reduce the proportion of industrial land, encourage the implementation of urban regeneration, and promote the urban construction land–use transition from incremental to stock–oriented. In addition, local governments and relevant departments should break administrative borders in policies to form an effective regional linkage mechanism by establishing inter–regional cooperation entities to integrate regional resources and optimize the land–use structure.
Combined with a regional development strategy of the Yangtze River Delta, the urban–rural industrial integration development should be promoted through land–use transition. Regional collaboration should be carried out to form urban–rural industrial restructuring with complementary advantages and mutual support, promoting the coordinated development of large, medium, and small cities and towns with urban agglomerations to strengthen the population carrying capacity and attractiveness of small and medium cities. A land–use structure that is constantly optimized based on urban–rural transition plays a key role in supporting industrial integration development. Therefore, policies of land use for industrial integration need to be made. Particularly, the planning of rural industrial land and its integration and development should be heavily focused on. It is necessary to enhance the role of cities and towns in radiating and driving the development of rural industries and improve the innovative power of agricultural development. At the same time, it will be needed to focus on the industrial convergence between urban and rural areas, so as to extend the industrial chain and value chain and ultimately achieve the high–quality development of new rural industries.
Given the high level of population urbanization in the Yangtze River Delta, a large amount of farmers flow into cities to engage in secondary and tertiary industries. It is important to strengthen the supply of housing resources for this group to meet their needs, such as public rental housing, shared ownership housing, and other subsidized housing resources. It is essential to further improve the quality of public services for the migrant population by adjusting the financial transfer payment system; improve the housing security and public service supply system for urban migrant workers and to strengthen their social integration; optimize the production, life, and ecological space in the countryside through the comprehensive improvement of land space; focus on rural public infrastructure construction and promote the development of rural public services; attract capital, technology, talent, and other factors to rural regions; strengthen the impetus and vitality of rural development; and promote the development of rural revitalization.

6.3. Future Work

Based on the availability of data, this study was carried out in the Yangtze River Delta agglomerations. Future research should further consider the relationship between urban–rural transformation and land–use transition in urban agglomerations with different functional orientations, different industrial structures, and even different numbers of central cities. More consistent development patterns and differentiated mechanisms can be analyzed and used as a reference for other countries and regions.

Author Contributions

Conceptualization, X.N. and F.L.; methodology, X.N., Z.L. and F.L.; software, F.L.; validation, X.N. and G.W.; formal analysis, X.N., G.W. and Z.L.; investigation, F.L.; data curation, F.L.; writing—original draft preparation, X.N. and F.L.; writing—review and editing, X.N., F.L. and G.W.; visualization, F.L; supervision, X.N. and G.W.; project administration, X.N. and G.W.; funding acquisition, X.N and G.W. All authors have read and agreed to the published version of the manuscript.

Funding

This research was funded by National Social Science Foundation Key Program of China (grant number 21AZD036), Ministry of Education of Humanities and Social Science Youth Project of China (grant number 20YJC630108), Philosophy and Social Science Planning Project of Shanghai City (grant numbers 2019BCK002), and Fundamental Research Funds for the Central Universities of China (grant number JKE022023004).

Institutional Review Board Statement

Not applicable.

Informed Consent Statement

Not applicable.

Data Availability Statement

Not applicable.

Acknowledgments

The authors are grateful to the editor and reviewers for their valuable comments and suggestions.

Conflicts of Interest

The authors declare no conflict of interest.

References

  1. Song, X.Q. Discussion on land use transition research framework. Acta Geogr. Sin. 2017, 72, 471–487. [Google Scholar]
  2. Turner, B.L.; Lambin, E.F.; Reenberg, A. The emergence of land change science for global environmental change and sustainability. Proc. Natl. Acad. Sci. USA 2007, 104, 20666–20671. [Google Scholar] [CrossRef] [PubMed] [Green Version]
  3. Grainger, A. National land use morphology: Patterns and possibilities. Geography 1995, 80, 235–245. [Google Scholar]
  4. Ge, D.Z.; Long, H.L.; Zhang, Y.G.; Ma, L.; Li, T.T. Farmland transition and its influences on grain production in China. Land Use Policy 2018, 70, 94–105. [Google Scholar] [CrossRef]
  5. Jiang, G.H.; Zhang, R.J.; Ma, W.Q.; Zhou, D.Y.; Wang, X.P.; He, X. Cultivated land productivity potential improvement in land consolidation schemes in Shenyang, China: Assessment and policy implications. Land Use Policy 2017, 68, 80–88. [Google Scholar] [CrossRef]
  6. Njoh, A.J. Municipal councils, international NGOs and citizen participation in public infrastructure development in rural settlements in Cameroon. Habitat Int. 2011, 35, 101–110. [Google Scholar] [CrossRef]
  7. Li, Y.R.; Liu, Y.S.; Long, H.L.; Cui, W.G. Community-based rural residential land consolidation and allocation can help to revitalize hollowed villages in traditional agricultural areas of China: Evidence from Dancheng County, Henan Province. Land Use Policy 2014, 39, 188–198. [Google Scholar] [CrossRef]
  8. Gu, C.L.; Li, Y.; Han, S.S. Development and transition of small towns in rural China. Habitat Int. 2015, 50, 110–119. [Google Scholar] [CrossRef]
  9. Zhu, F.K.; Zhang, F.R.; Li, C.; Zhu, T.F. Functional transition of the rural settlement: Analysis of land-use differentiation in a transect of Beijing, China. Habitat Int. 2014, 41, 262–271. [Google Scholar] [CrossRef]
  10. Li, T.T.; Long, H.L.; Liu, Y.Q.; Tu, S.S. Multi-scale analysis of rural housing land transition under China’s rapid urbanization: The case of Bohai Rim. Habitat Int. 2015, 48, 227–238. [Google Scholar] [CrossRef]
  11. Hu, S.G.; Tong, L.Y.; Long, H.L. Land use transition potential and its assessment framework. Geogr. Res. 2019, 38, 1367–1377. [Google Scholar]
  12. Walker, R.T. Land Use Transition and Deforestation in Developing Countries. Geogr. Anal. 1987, 19, 18–30. [Google Scholar] [CrossRef]
  13. Qin, W.S.; Zhang, Y.F.; Li, G.D. Driving mechanism of cultivated land transition in Yantai Proper, Shandong Province, China. Chin. Geogr. Sci. 2015, 25, 337–349. [Google Scholar] [CrossRef] [Green Version]
  14. Drummond, M.A.; Loveland, T.R. Land-use Pressure and a Transition to Forest-cover Loss in the Eastern United States. Bioscience 2010, 60, 286–298. [Google Scholar] [CrossRef]
  15. Tian, J.F.; Wang, B.Y.; Zhang, C.R.; Li, W.D.; Wang, S.J. Mechanism of regional land use transition in underdeveloped areas of China: A case study of northeast China. Land Use Policy 2020, 94, 16. [Google Scholar] [CrossRef]
  16. Yu, Y.H.; Li, Z.J.; Lin, J.K.; Liu, J.Y.; Wang, S. TUPU characteristics of spatiotemporal variation for land use in the Yihe River Basin. J. Nat. Resour. 2019, 34, 975–988. [Google Scholar] [CrossRef]
  17. Huang, H.; Zhou, Y.; Qian, M.J.; Zeng, Z.Q. Land Use Transition and Driving Forces in Chinese Loess Plateau: A Case Study from Pu County, Shanxi Province. Land 2021, 10, 67. [Google Scholar] [CrossRef]
  18. Li, P.; Li, X.B.; Liu, X.J. Macro-analysis on the driving forces of the land-use change in China. Geogr. Res. 2001, 20, 129–138. [Google Scholar]
  19. Nourqolipour, R.; Shariff, A.; Balasundram, S.K.; Ahmad, N.B.; Sood, A.M.; Buyong, T. Predicting the Effects of Urban Development on Land Transition and Spatial Patterns of Land Use in Western Peninsular Malaysia. Appl. Spat. Anal. Policy 2016, 9, 1–19. [Google Scholar] [CrossRef]
  20. Long, H.; Qu, Y.; Tu, S.; Zhang, Y.; Jiang, Y. Development of land use transitions research in China. J. Geogr. Sci. 2020, 30, 1195–1214. [Google Scholar] [CrossRef]
  21. Lambin, E.F.; Meyfroidt, P. Land use transitions: Socio-ecological feedback versus socio-economic change. Land Use Policy 2010, 27, 108–118. [Google Scholar] [CrossRef]
  22. Liu, Y.S.; Li, Y.H. Revitalize the world’s countryside. Nature 2017, 548, 275–277. [Google Scholar] [CrossRef] [PubMed]
  23. Tu, S.S.; Long, H.L. Rural restructuring in China: Theory, approaches and research prospect. J. Geogr. Sci. 2017, 27, 1169–1184. [Google Scholar] [CrossRef]
  24. Chen, W.X.; Chi, G.Q.; Li, J.F. The spatial association of ecosystem services with land use and land cover change at the county level in China, 1995–2015. Sci. Total Environ. 2019, 669, 459–470. [Google Scholar] [CrossRef] [PubMed]
  25. Li, Y.H.; Li, Y.R.; Westlund, H.; Liu, Y.S. Urban-rural transformation in relation to cultivated land conversion in China: Implications for optimizing land use and balanced regional development. Land Use Policy 2015, 47, 218–224. [Google Scholar] [CrossRef]
  26. Xue, Y.L. National policy adjustment and evolution of urban-rural relations in China. Acad. Search Truth Real. 2020, 33, 94–103. [Google Scholar]
  27. Long, H.L.; Qu, Y. Land use transitions and land management: A mutual feedback perspective. Land Use Policy 2018, 74, 111–120. [Google Scholar] [CrossRef]
  28. Long, H.L.; Chen, K.Q. Urban-rural integrated development and land use transitions: A perspective of land system science. Acta Geogr. Sin. 2021, 76, 295–309. [Google Scholar]
  29. Serra, P.; Vera, A.; Tulla, A.F.; Salvati, L. Beyond urban-rural dichotomy: Exploring socioeconomic and land-use processes of change in Spain (1991–2011). Appl. Geogr. 2014, 55, 71–81. [Google Scholar] [CrossRef]
  30. Yang, Z.H.; Shen, N.N.; Qu, Y.B.; Zhang, B.L. Association between Rural Land Use Transition and Urban-Rural Integration Development: From 2009 to 2018 Based on County-Level Data in Shandong Province, China. Land 2021, 10, 1228. [Google Scholar] [CrossRef]
  31. Liu, Y.S.; Hu, Z.C.; Li, Y.H. Process and cause of urban-rural development transformation in the Bohai Rim Region, China. J. Geogr. Sci. 2014, 24, 1147–1160. [Google Scholar] [CrossRef] [Green Version]
  32. Yang, R.; Xu, Q.; Li, L.T. Spatial urban-rural transformation and its driving factors in the Pearl River Delta region. Geogr. Res. 2016, 35, 2261–2272. [Google Scholar]
  33. Cai, E.X.; Liu, Y.L.; Li, J.W.; Chen, W.Q. Spatiotemporal Characteristics of Urban-Rural Construction Land Transition and Rural-Urban Migrants in Rapid-Urbanization Areas of Central China. J. Urban Plan. Dev. 2020, 146, 05019023. [Google Scholar] [CrossRef]
  34. Qu, Y.B.; Jiang, G.H.; Tian, Y.Y.; Shang, R.; Wei, S.W.; Li, Y.L. Urban-Rural construction land Transition(URCLT) in Shandong Province of China: Features measurement and mechanism exploration. Habitat Int. 2019, 86, 101–115. [Google Scholar]
  35. Xu, F.J.; Lv, X.; Chen, C.L. Spatial-temporal pattern of urban-rural construction land transition in Shandong province. J. Geogr. Sci. 2017, 32, 1554–1567. [Google Scholar]
  36. Wei, C.; Zhang, Z.; Ye, S.; Hong, M.; Wang, W. Spatial-Temporal Divergence and Driving Mechanisms of Urban-Rural Sustainable Development: An Empirical Study Based on Provincial Panel Data in China. Land 2021, 10, 1027. [Google Scholar] [CrossRef]
  37. Chen, M.; Zhou, Y.; Huang, X.; Ye, C. The Integration of New-Type Urbanization and Rural Revitalization Strategies in China: Origin, Reality and Future Trends. Land 2021, 10, 207. [Google Scholar] [CrossRef]
  38. Yang, R.; Zhang, J.; Xu, Q.; Luo, X.L. Urban-rural spatial transformation process and influences from the perspective of land use: A case study of the Pearl River Delta Region. Habitat Int. 2020, 104, 102234. [Google Scholar] [CrossRef]
  39. Wang, L.Z.; Pijanowski, B.; Yang, W.S.; Zhai, R.X.; Omrani, H.; Li, K. Predicting multiple land use transitions under rapid urbanization and implications for land management and urban planning: The case of Zhanggong District in central China. Habitat Int. 2018, 82, 48–61. [Google Scholar] [CrossRef]
  40. Cao, F. New urbanization from the perspective of urban and rural land use: Institutional shackles and collaborative model. Reform Econ. Syst. 2019, 37, 27–32. [Google Scholar]
  41. Kong, X.B.; Zhang, F.R.; Li, Y.L.; Jiang, G.H.; Yan, G.Q.; Xu, Y. Interactive relationship between land use change and industrial change. Resour. Sci. 2005, 27, 59–64. [Google Scholar]
  42. He, H.J.; Peng, C. The spatial-temporal evolution and the interactive effect between urban industrial structure transformation and land use efficiency. Geogr. Res. 2017, 36, 1271–1282. [Google Scholar]
  43. Chen, L.; Zhou, S.L.; Zhou, B.B. Characteristics and driving forces of regional land use transition based on the leading function classification: A case study of Jiangsu province. Econ. Geogr. 2015, 35, 155–162. [Google Scholar]
  44. Zhu, C.M.; Zhang, X.L.; Wang, K.; Yuan, S.F.; Yang, L.X.; Skitmore, M. Urban-rural construction land transition and its coupling relationship with population flow in China’s urban agglomeration region. Cities 2020, 101, 102701. [Google Scholar] [CrossRef]
  45. Chen, R.S.; Ye, C.; Cai, Y.L.; Xing, X.S.; Chen, Q. The impact of rural out-migration on land use transition in China: Past, present and trend. Land Use Policy 2014, 40, 101–110. [Google Scholar] [CrossRef]
  46. Lv, X.; Shi, Y.Y. Spatial-temporal pattern and dynamic evolution of the economic density of urban-rural construction land in Jiangsu province. China Land Sci. 2018, 32, 27–33. [Google Scholar]
  47. Chen, S.P.; Yue, T.X.; Li, H.G. Studies on Geo-Informatic Tupu and its application. Geogr. Res. 2000, 19, 337–343. [Google Scholar]
  48. Lu, X.; Shi, Y.; Chen, C.; Yu, M. Monitoring cropland transition and its impact on ecosystem services value in developed regions of China: A case study of Jiangsu Province. Land Use Policy 2017, 69, 25–40. [Google Scholar] [CrossRef]
  49. Hao, Y.; Liu, Y.M. The influential factors of urban PM2.5 concentrations in China: A spatial econometric analysis. J. Clean. Prod. 2016, 112, 1443–1453. [Google Scholar] [CrossRef]
  50. Liu, J.Y.; Zhang, Z.X.; Xu, X.L.; Kuang, W.H.; Zhou, W.C.; Zhang, S.W.; Li, R.D.; Yan, C.Z.; Yu, D.S.; Wu, S.X.; et al. Spatial Patterns and Driving Forces of Land Use Change in China in the Early 21st Century. Acta Geogr. Sin. 2009, 64, 1411–1420. [Google Scholar] [CrossRef]
  51. Zhao, Z.Y.; Ma, Q.; Hua, Y.C.; Jiang, M.L. Analysis on land use changes from 1996 to 2005 in Zhejiang province. China Land Sci. 2009, 23, 54–60. [Google Scholar]
  52. Shi, J.G.; Duan, K.F.; Wu, G.D.; Li, J.J.; Xu, K. Efficiency of urban-rural integration development in the Yangtze River Delta under the background of carbon emission constraint. Econ. Geogr. 2021, 41, 57–67. [Google Scholar]
  53. Liu, S.Y.; Wang, Y.G. From native rural China to urban-rural China: The rural transition perspective of China transformation. Manag. World 2018, 34, 128–146, 232. [Google Scholar]
  54. Zhang, Z.; Lu, Y. China’s urban-rural relationship: Evolution and prospects. China Agric. Econ. Rev. 2018, 10, 260–276. [Google Scholar] [CrossRef]
  55. Chen, C.; LeGates, R.; Fang, C.H. From coordinated to integrated urban and rural development in China’s megacity regions. J. Urban Aff. 2019, 41, 150–169. [Google Scholar] [CrossRef]
Figure 1. Location and land–use status in 2018 of the Yangtze River Delta.
Land 11 00631 g001
Figure 2. Tupu of land–use transition in the Yangtze River Delta from 1990 to 2018. Notes: Tupu unit codes 1–6 represent cultivated land, forest land, grassland, water area, construction land, and unused land. Legend 12 represents cultivated land converted to forest land, and the other legends follow the same rule.
Land 11 00631 g002
Figure 3. Tupu of urban–rural land–use transition in the Yangtze River Delta from 1990 to 2018.
Land 11 00631 g003
Figure 4. Distribution of urban–rural land–use transition areas in the Yangtze River Delta from 2010 to 2018.
Land 11 00631 g004
Figure 5. Distribution of change rates of urban–rural land–use transition in the Yangtze River Delta from 2010 to 2018.
Land 11 00631 g005
Table 1. Descriptions of the driving force indicators.
VariablesMeasurement IndicatorUnit
X1Number of policy texts related to urban–rural land usePCS
X2Change in output value of primary industry108 CNY
X3Change in output value of secondary industry 108 CNY
X4Change in output value of tertiary industry108 CNY
X5Change in total population at the end of the year104 person
X6Change in population urbanization rate%
X7Average elevationm
X8Annual average precipitationmm
X9Change in GDP per capita1 CNY
X10Change in local fiscal revenue108 CNY
X11Change in fixed–asset investment108 CNY
X12Change in per–capita disposable income of urban population1 CNY
X13Change in per–capita disposable income of rural population1 CNY
Table 2. Statistics of main Tupu units of land–use transition in the Yangtze River Delta from 1990 to 2018.
YearRankTypes of Land–Use TransitionTransition Code
(C)
Area (km2)
(SAB)
Change Rate (%)
(RAB)
1990–20001Cultivated land → construction land15265637.07
2Grassland → forest land32216230.17
3Cultivated land → forest land1291712.80
4Cultivated land → water area143484.86
5Grassland → cultivated land312483.46
6Forest land → cultivated land211912.67
Subtotal652291.03
Total of this period7165100
2000–20101Cultivated land → construction land15519874.11
2Cultivated land → water area146959.91
3Forest land → construction land252703.85
4Water area → cultivated land411992.84
5Water area → construction land451972.81
6Grassland → water area34821.17
Subtotal664194.69
Total of this period7013100
2010–20181Cultivated land → construction land1515,77224.04
2Construction land → cultivated land51933914.24
3Cultivated land → forest land12843712.86
4Forest land → cultivated land21816512.45
5Cultivated land → water area1447167.19
6Water area → cultivated land4144796.83
Subtotal50,90877.61
Total of this period65,595100
1990–20181Cultivated land → construction land1520,61329.31
2Cultivated land → forest land12930913.12
3Forest land → cultivated land21805111.45
4Construction land → cultivated land5166389.44
5Cultivated land → water area1452077.40
6Water area → cultivated land4140435.75
Subtotal53,86176.47
Total of this period70,434100
Notes: “subtotal” is the amount of the top six types of land–use transition in each period. “Total of this period” is the amount of all types of land–use transition in each period.
Table 3. Characteristics of urban–rural land–use transition and urban–rural development stages in the Yangtze River Delta from 1990 to 2018.
YearCharacteristics of Urban–Rural DevelopmentStages of Urban–Rural DevelopmentTypes of Urban–Rural Land–Use TransitionArea (km2)Change Rate (%)
1990–2000One–way flow from rural to urban of labor, land, capital, and other elements; imbalanced relationship between industry and agriculture, between urban and rural areas, and between man and landUrban–rural interaction developmentCultivated land → Urban construction land129218.03
Rural residential land → Urban construction land160.22
Rural residential land → Cultivated land50.07
Subtotal
Total of this period
1313
7165
18.33
100
2000–2010Asymmetric mutualistic symbiosis, large–scale migration of farmers and accelerated urbanization, trends of industry nurturing agriculture and urban areas supporting rural areas started to take shapeUrban–rural coordinating developmentCultivated land → urban construction land338848.30
Rural residential land → urban construction land2092.98
Rural residential land → cultivated land40.06
Subtotal
Total of this period
3601
7013
51.34
100
2010–2018Priority given to the development of agriculture and rural districts, free flow of all elements of “labor–land–finance” between urban and rural areasUrban–rural integration developmentRural residential land → cultivated land745111.36
Cultivated land → urban construction land660010.06
Rural residential land → urban construction land16762.55
Subtotal
Total of this period
15,727
65,595
23.97
100
1990–2018Focus shifting from urban support to rural revitalization and gradually implementing urban–rural integrated developmentUrban–rural interaction
Urban–rural coordinating
Urban–rural integration
Cultivated land → urban construction land10,62515.11
Rural residential land → cultivated land58968.38
Rural residential land → urban construction land9741.38
Subtotal
Total of this period
17,495
70,434
24.87
100
Note: “subtotal” is the amount of three types of land–use transition in each period. “Total of this period” is the amount of all types of land–use transition in each period.
Publisher’s Note: MDPI stays neutral with regard to jurisdictional claims in published maps and institutional affiliations.

