
Spatiotemporal Evolution and Relationship between Night Time Light and Land Surface Temperature: A Case Study of Beijing, China


Abstract
:1. Introduction
2. Materials and Methods
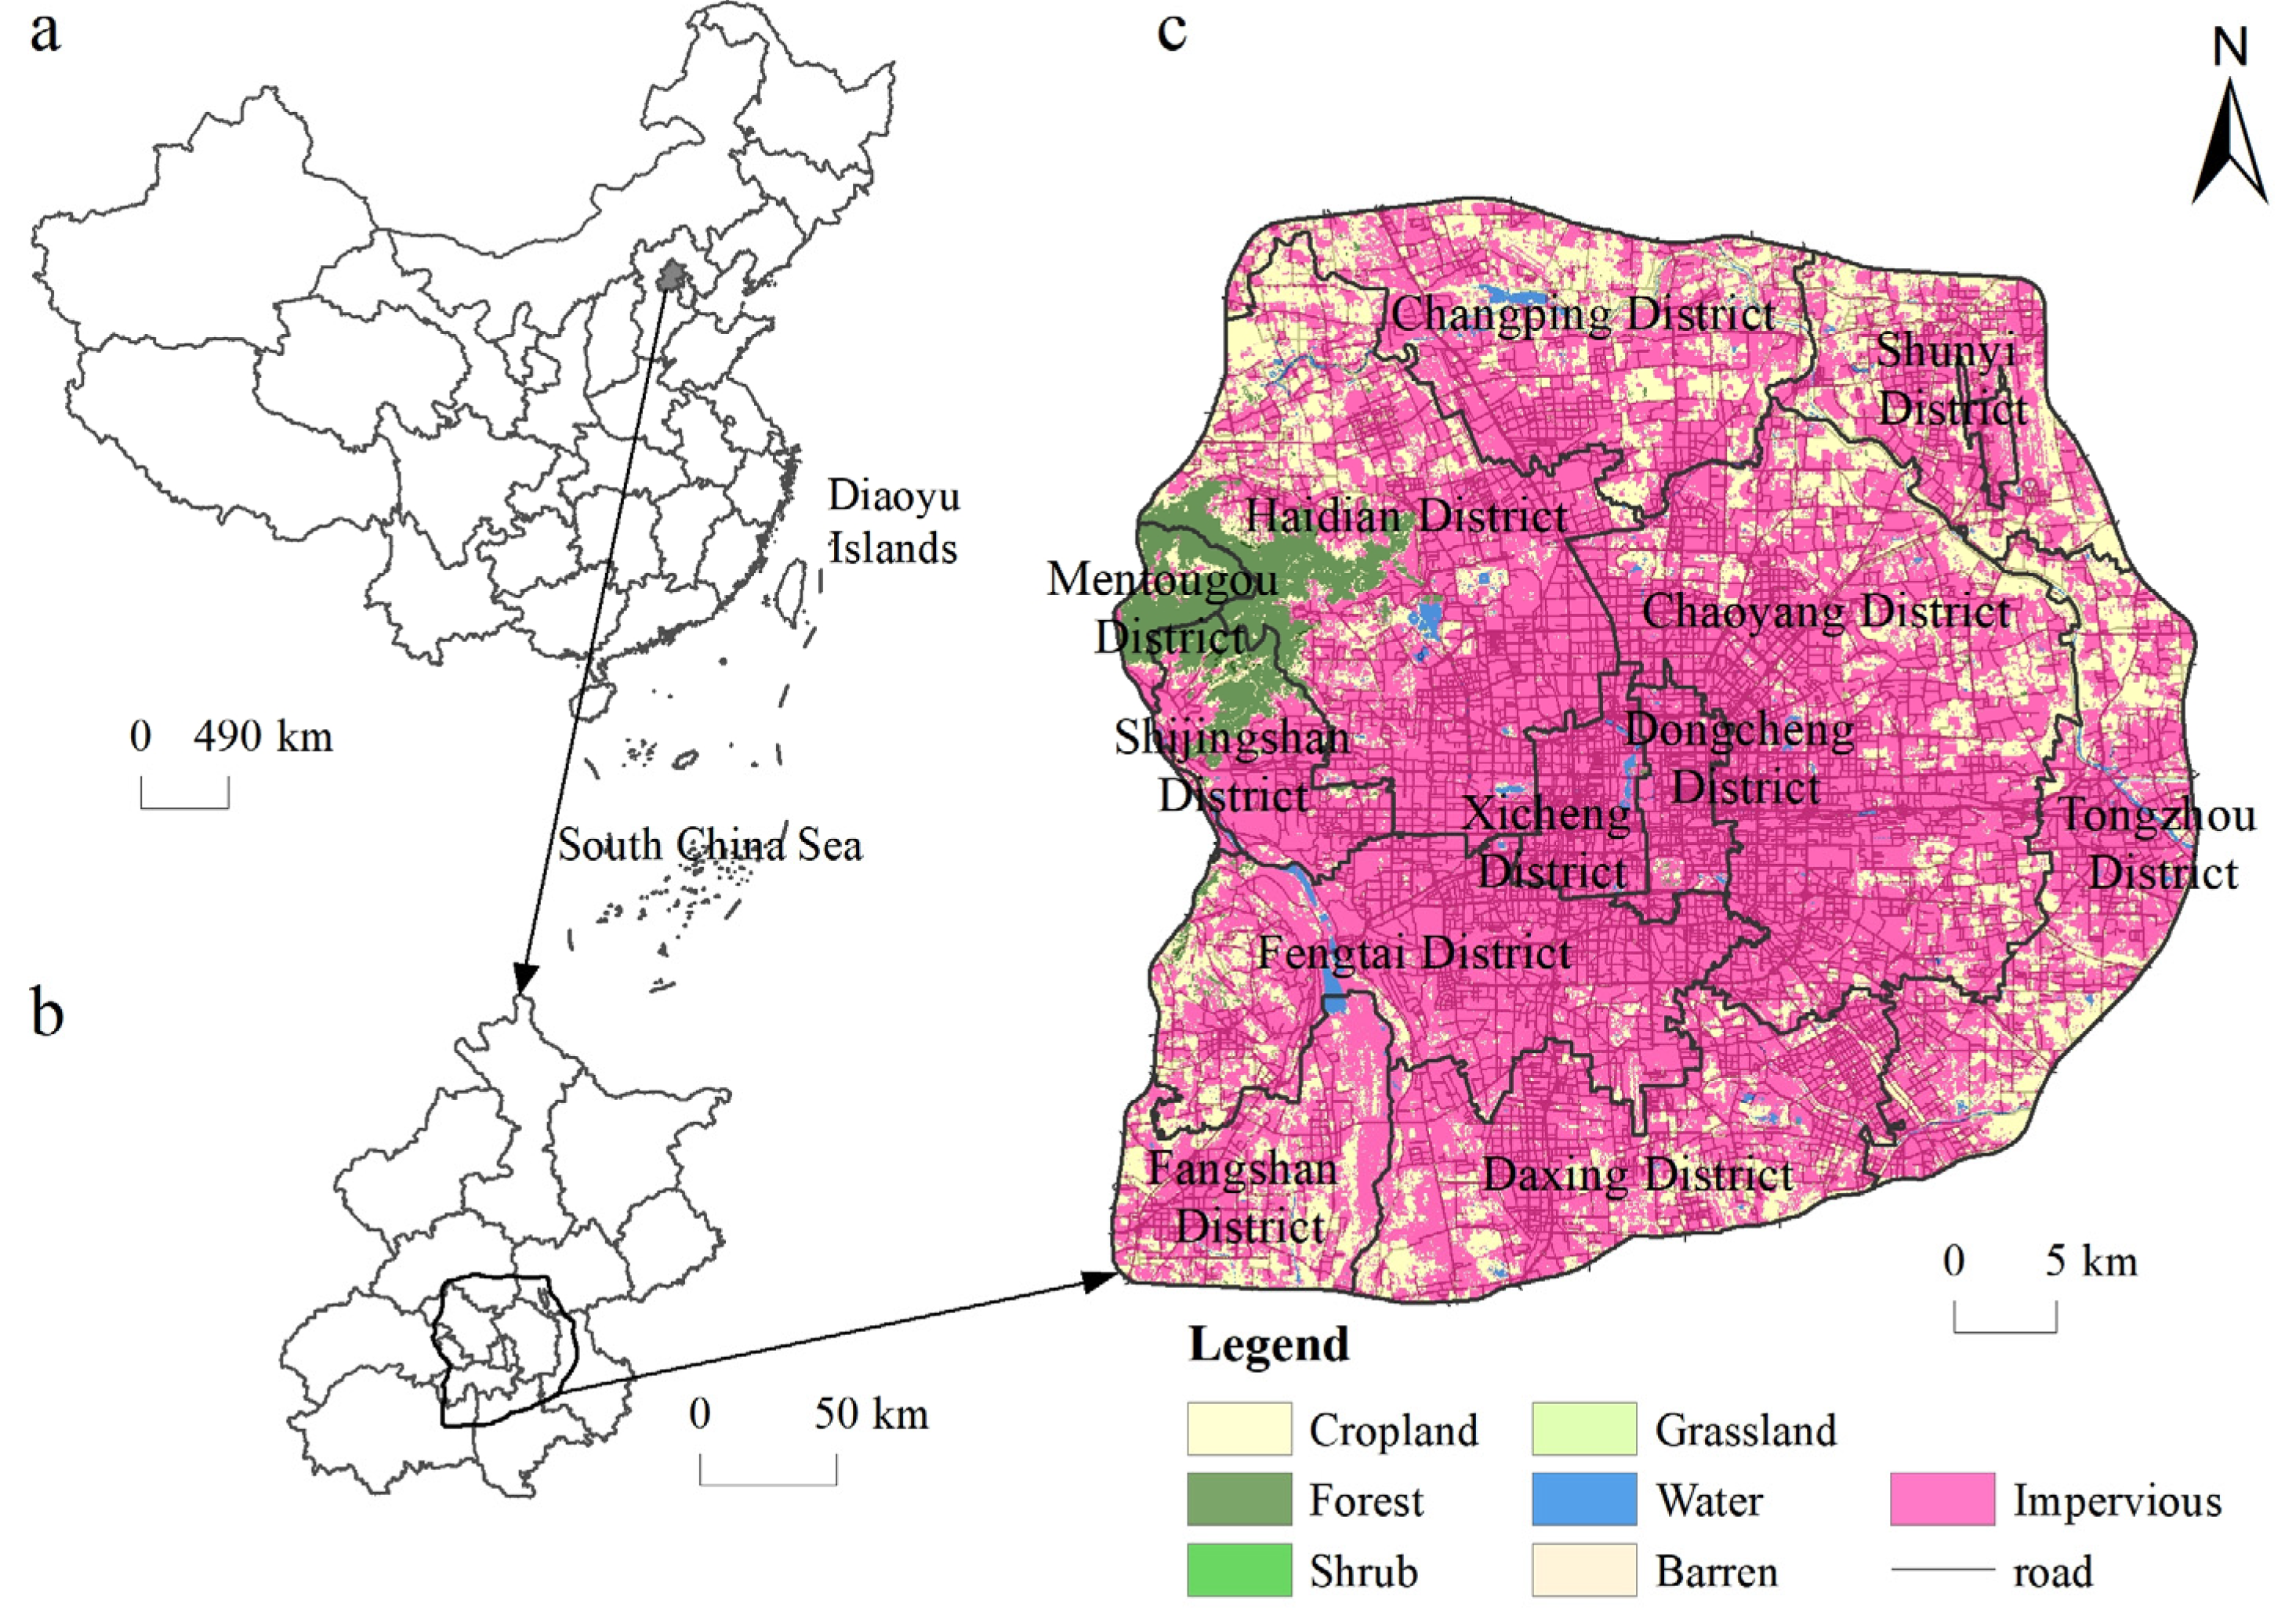
2.1. Study Area
2.2. Data Sources
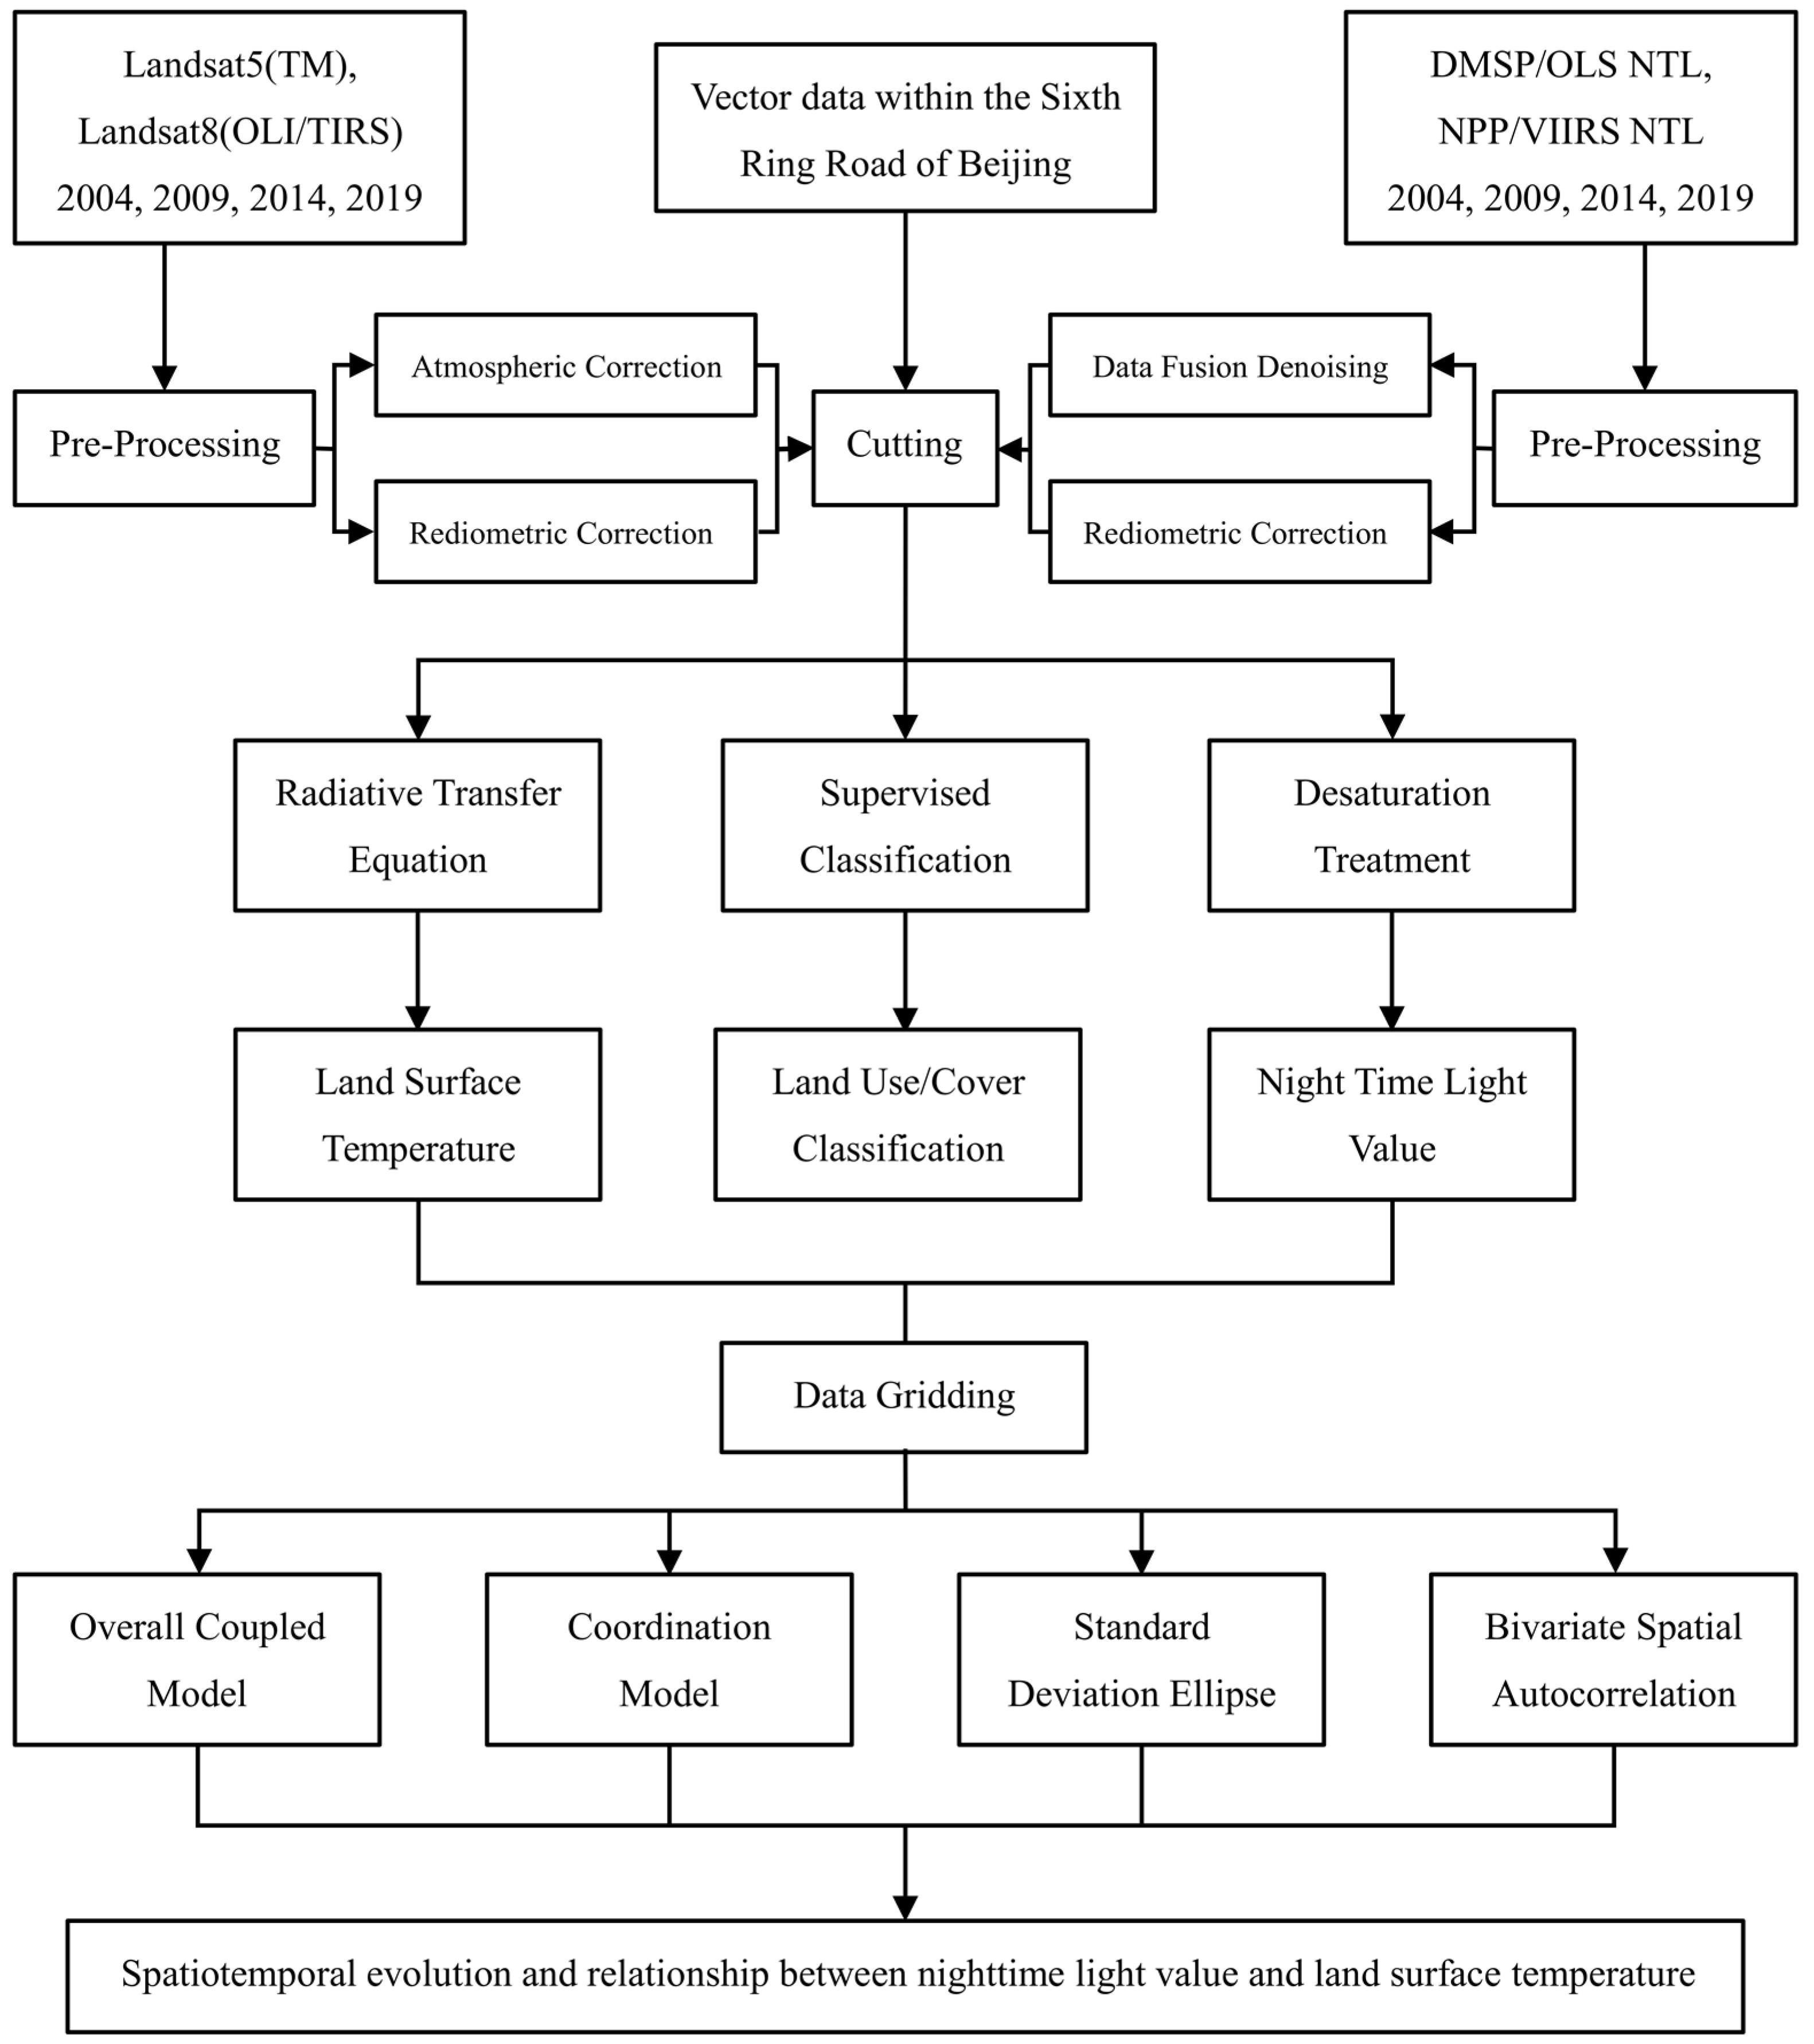
2.3. Methods
2.3.1. Retrieval of LST
2.3.2. Data Gridding
2.3.3. Overall Coupling Model
2.3.4. Coordination Model
2.3.5. Standard Deviation Ellipse (SDE)
2.3.6. Bivariate Spatial Autocorrelation
3. Results
3.1. Spatiotemporal Coupling Correlation between Urban Development and the LST
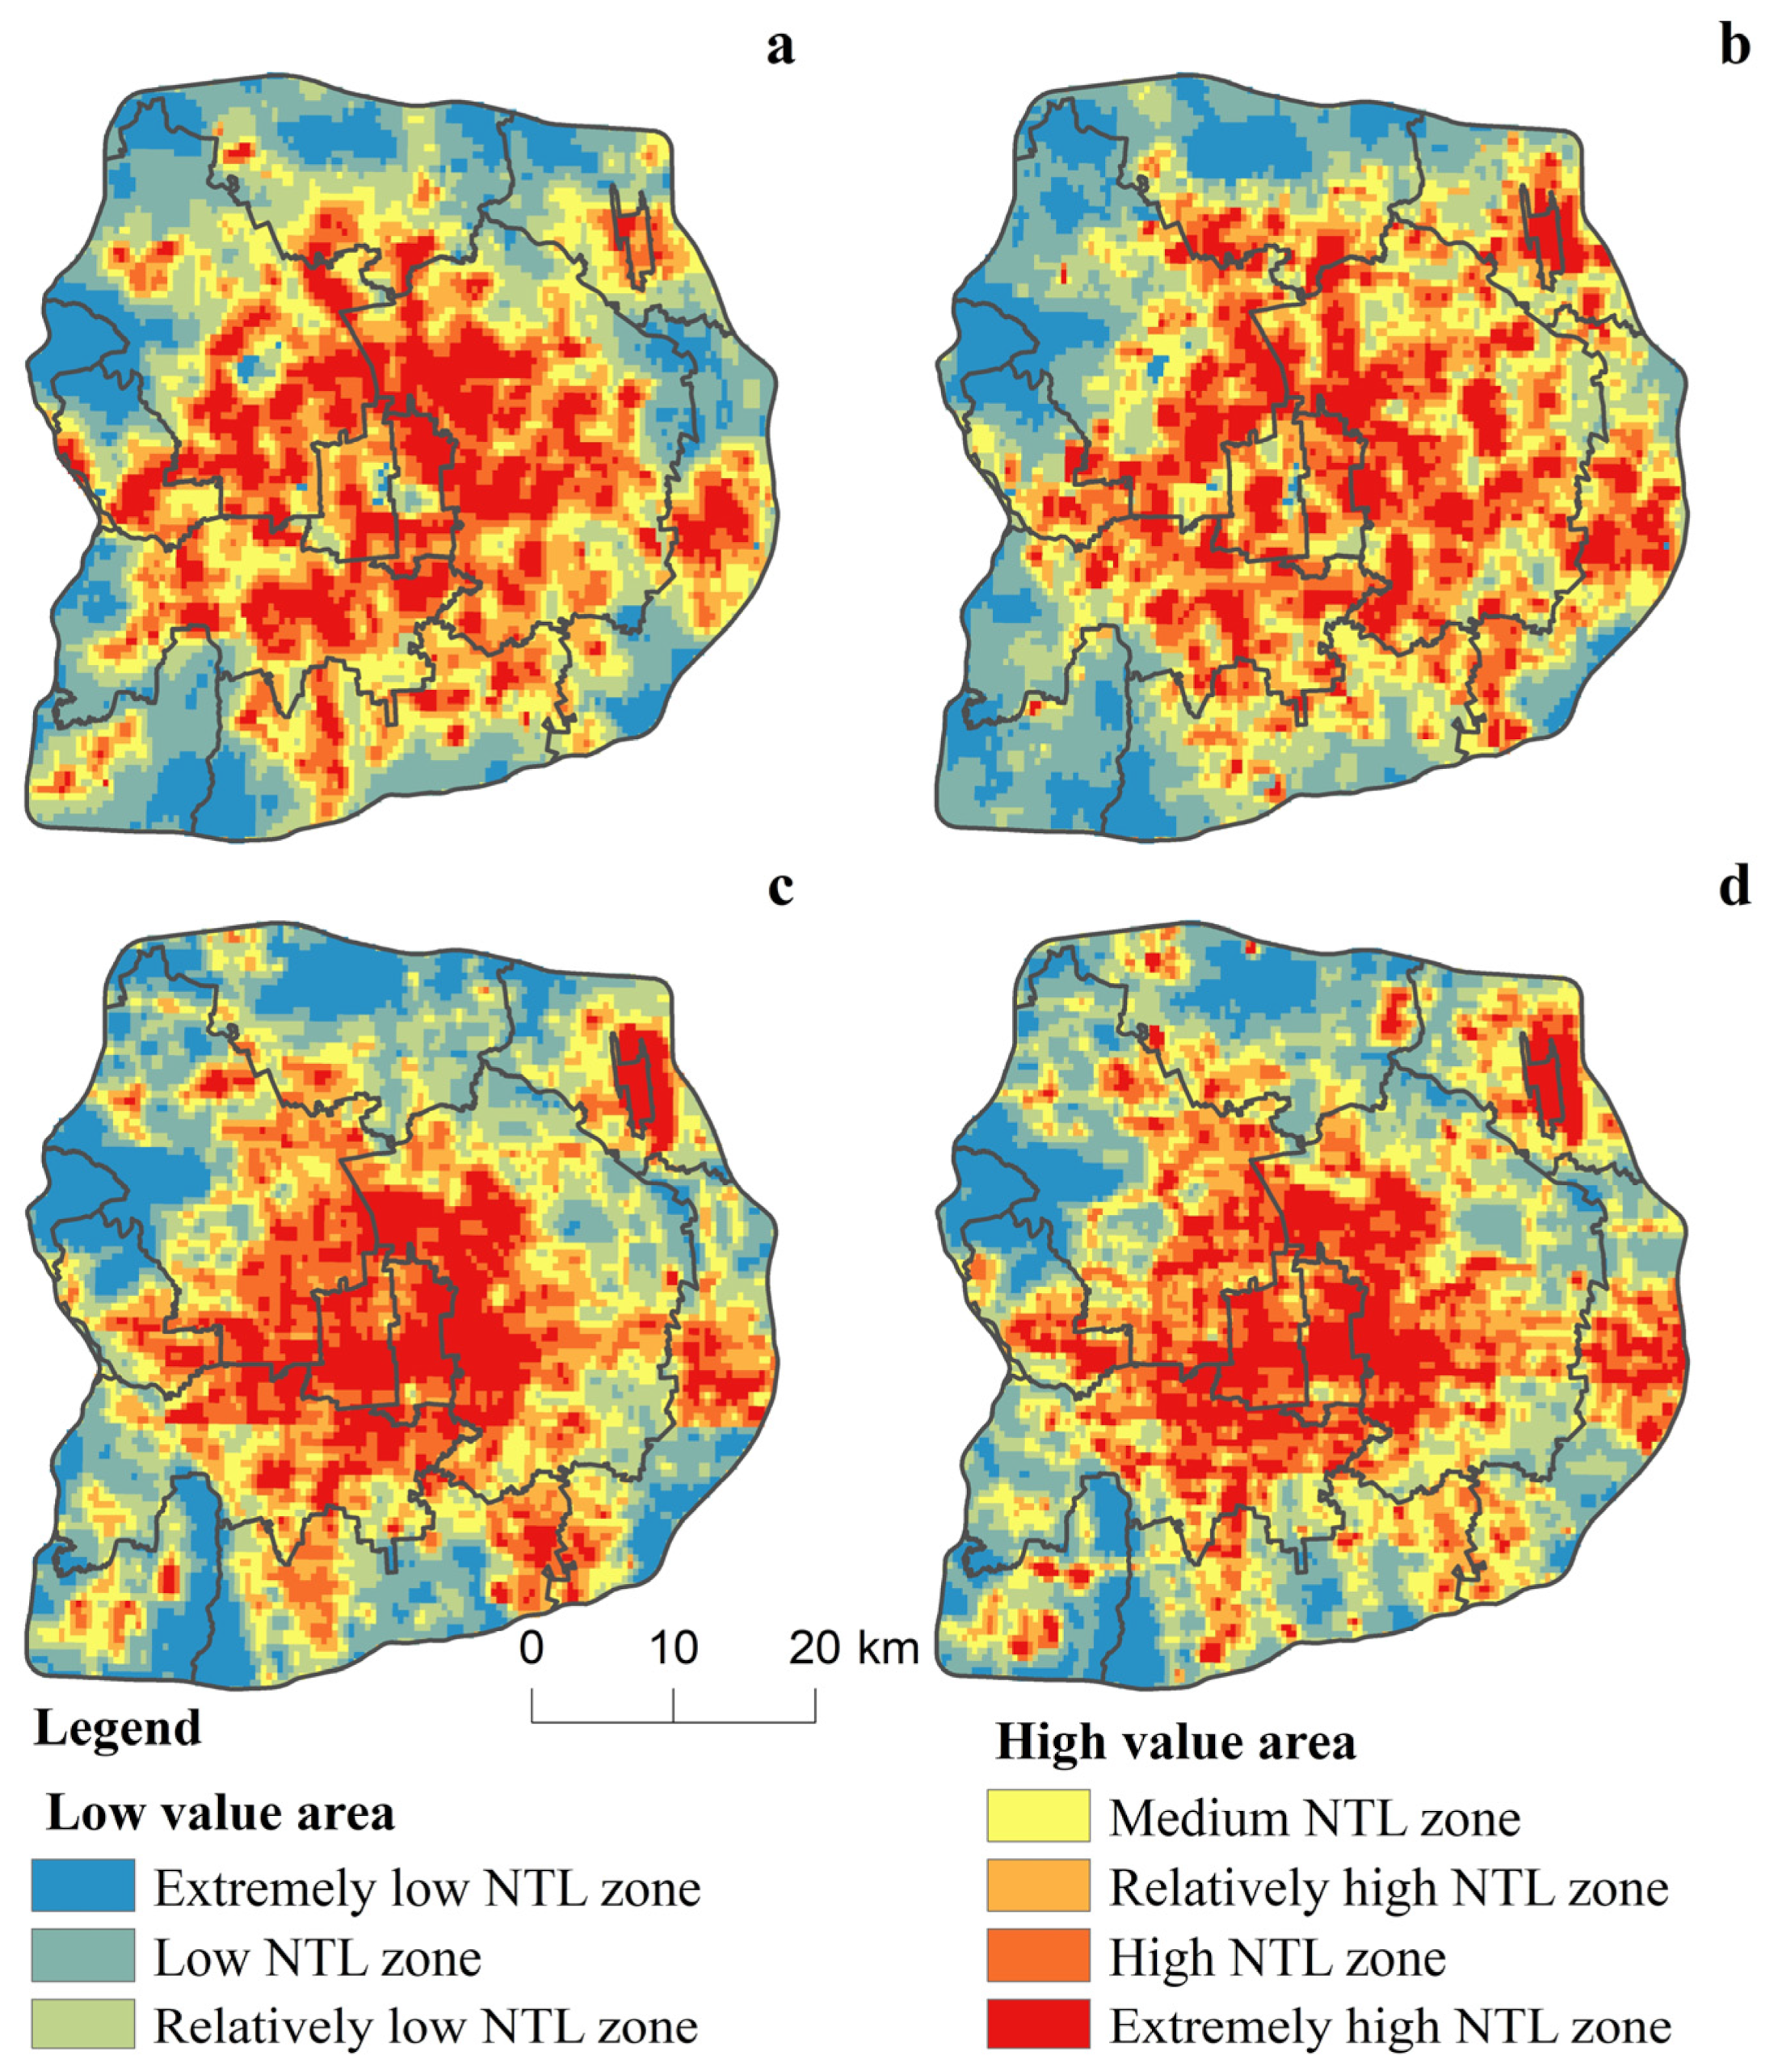
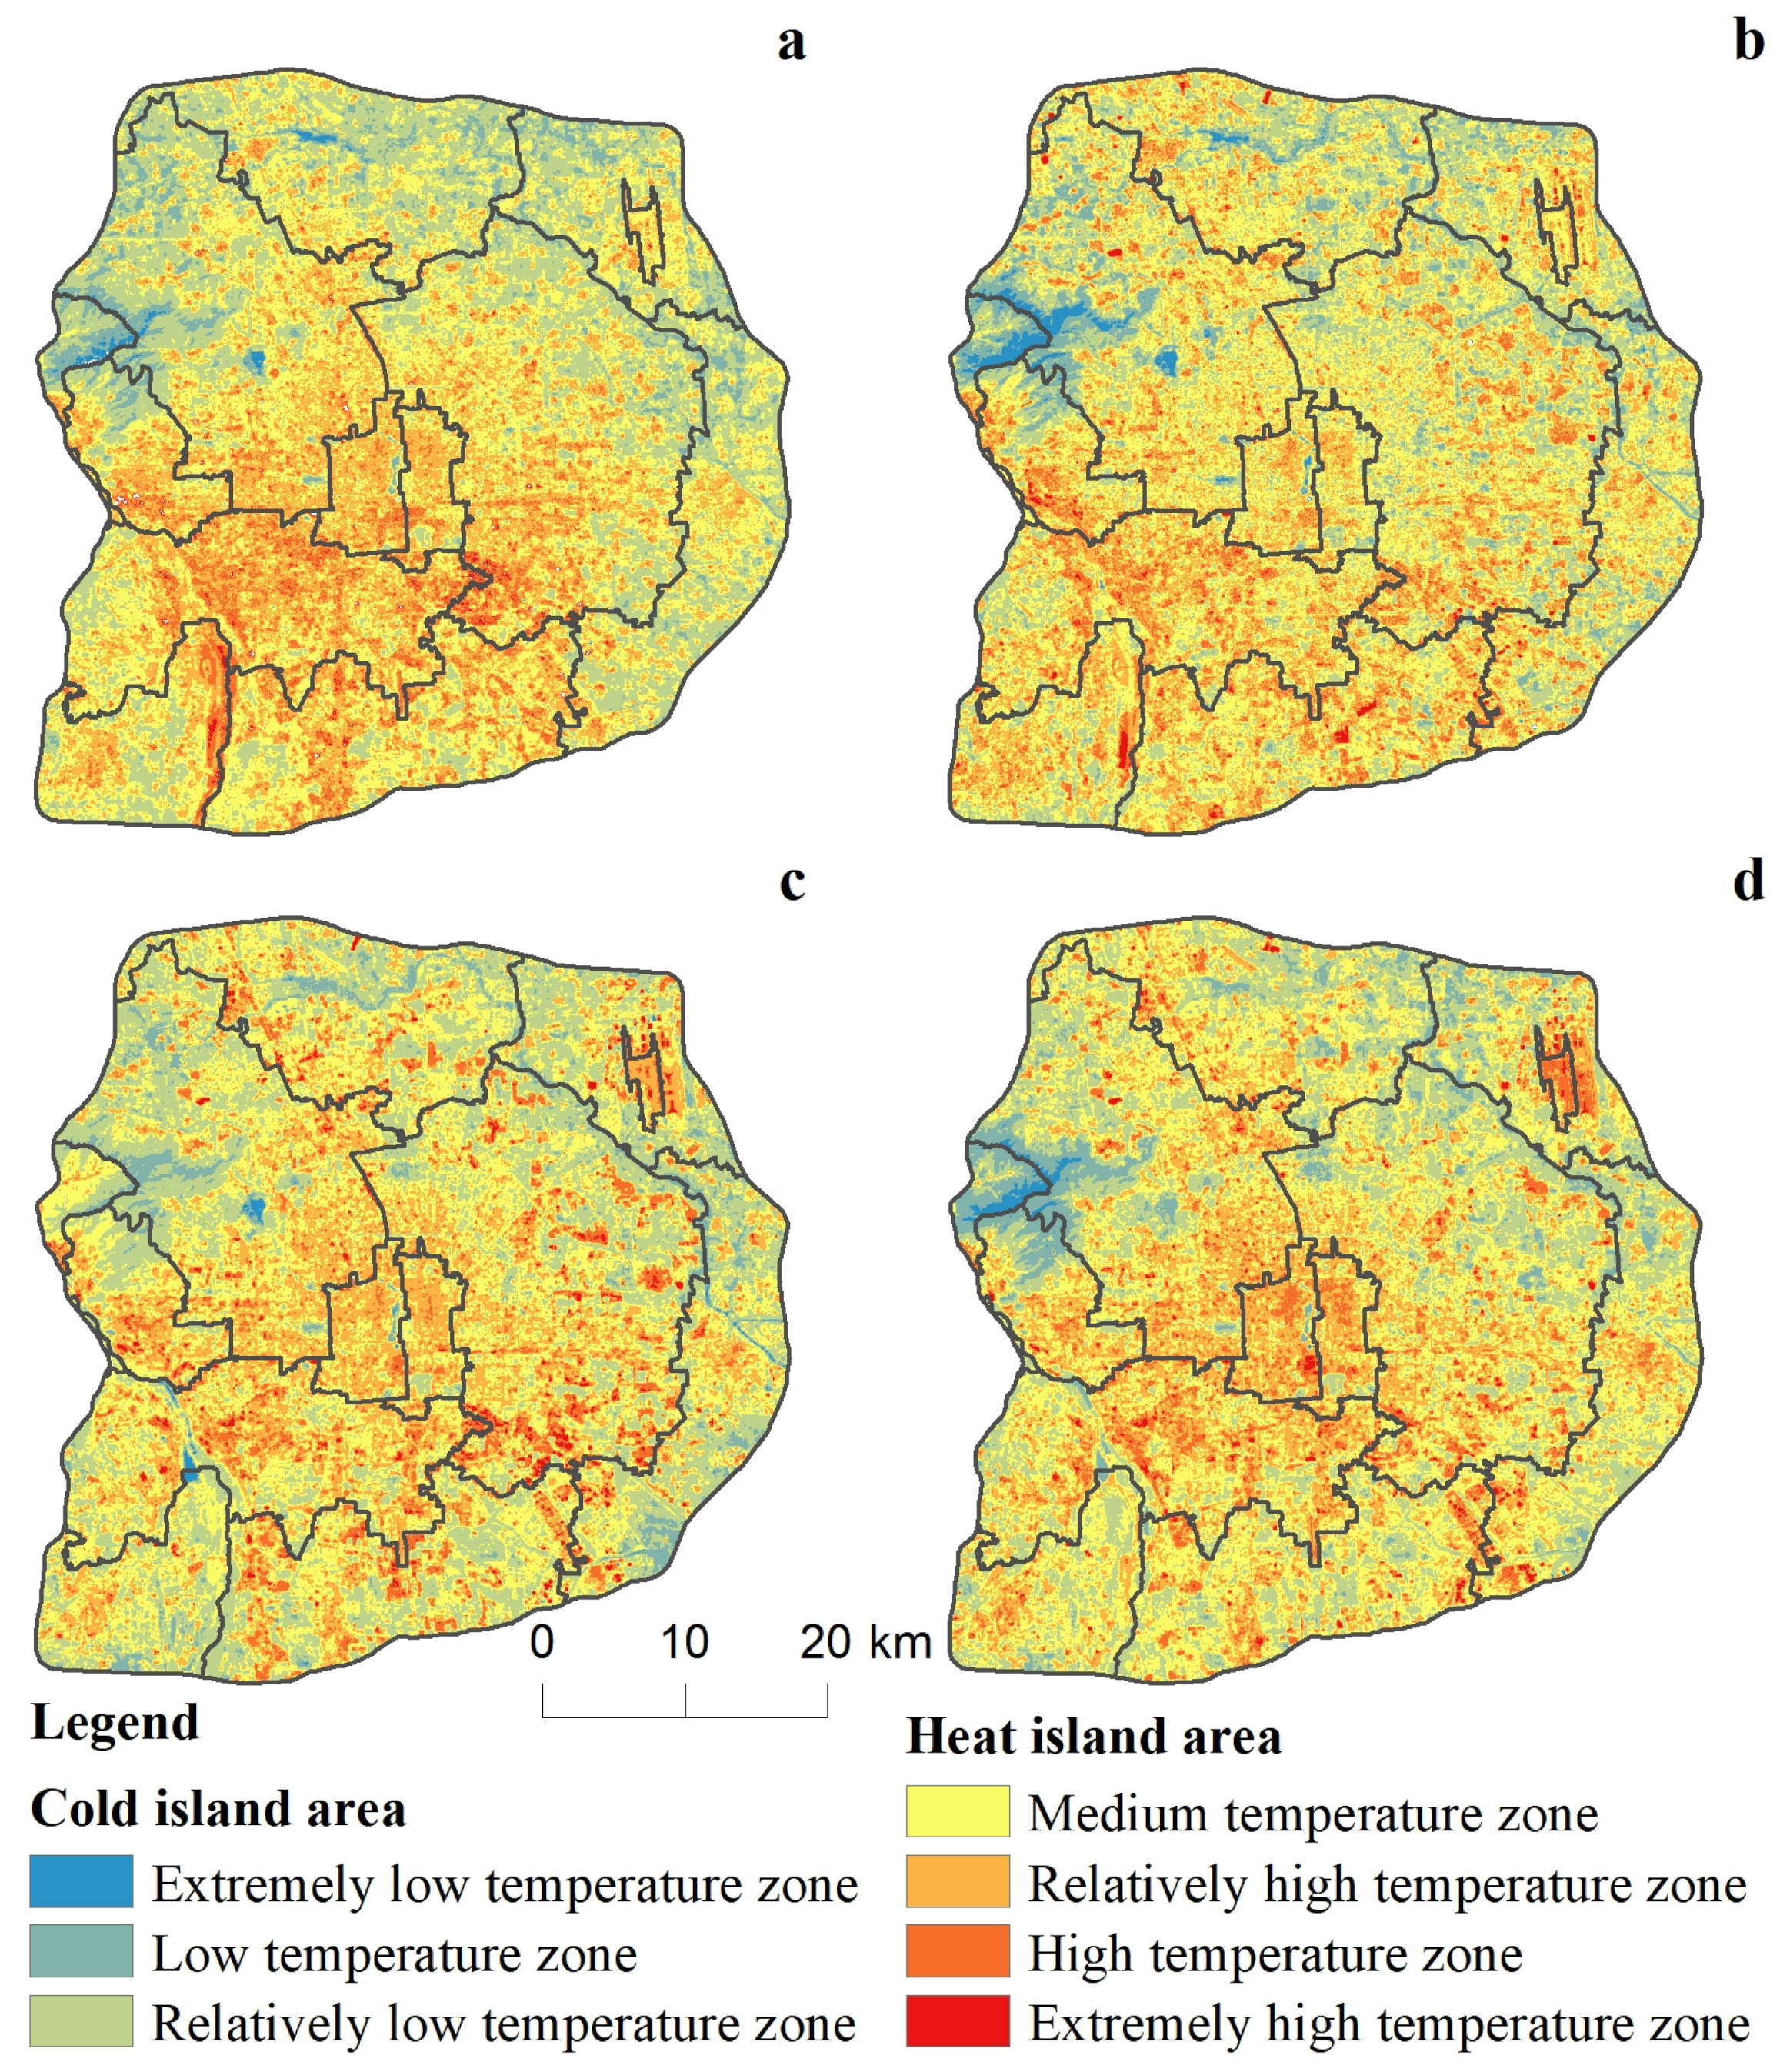
3.1.1. Urban Development and Spatial Distribution Pattern of the Thermal Environment
3.1.2. Spatiotemporal Coupling of the NTL and LST
3.1.3. Spatial Coordination Characteristics of the NTL and LST
3.2. Influence Mechanism of NTL on LST
3.2.1. Correlation between NTL and LST
3.2.2. Spatial Correlation between NTL and LST
4. Discussion
4.1. Correlation between NTL and LST
4.2. Recommendations for Sustainable Development
4.3. Limitations
5. Conclusions
- (1)
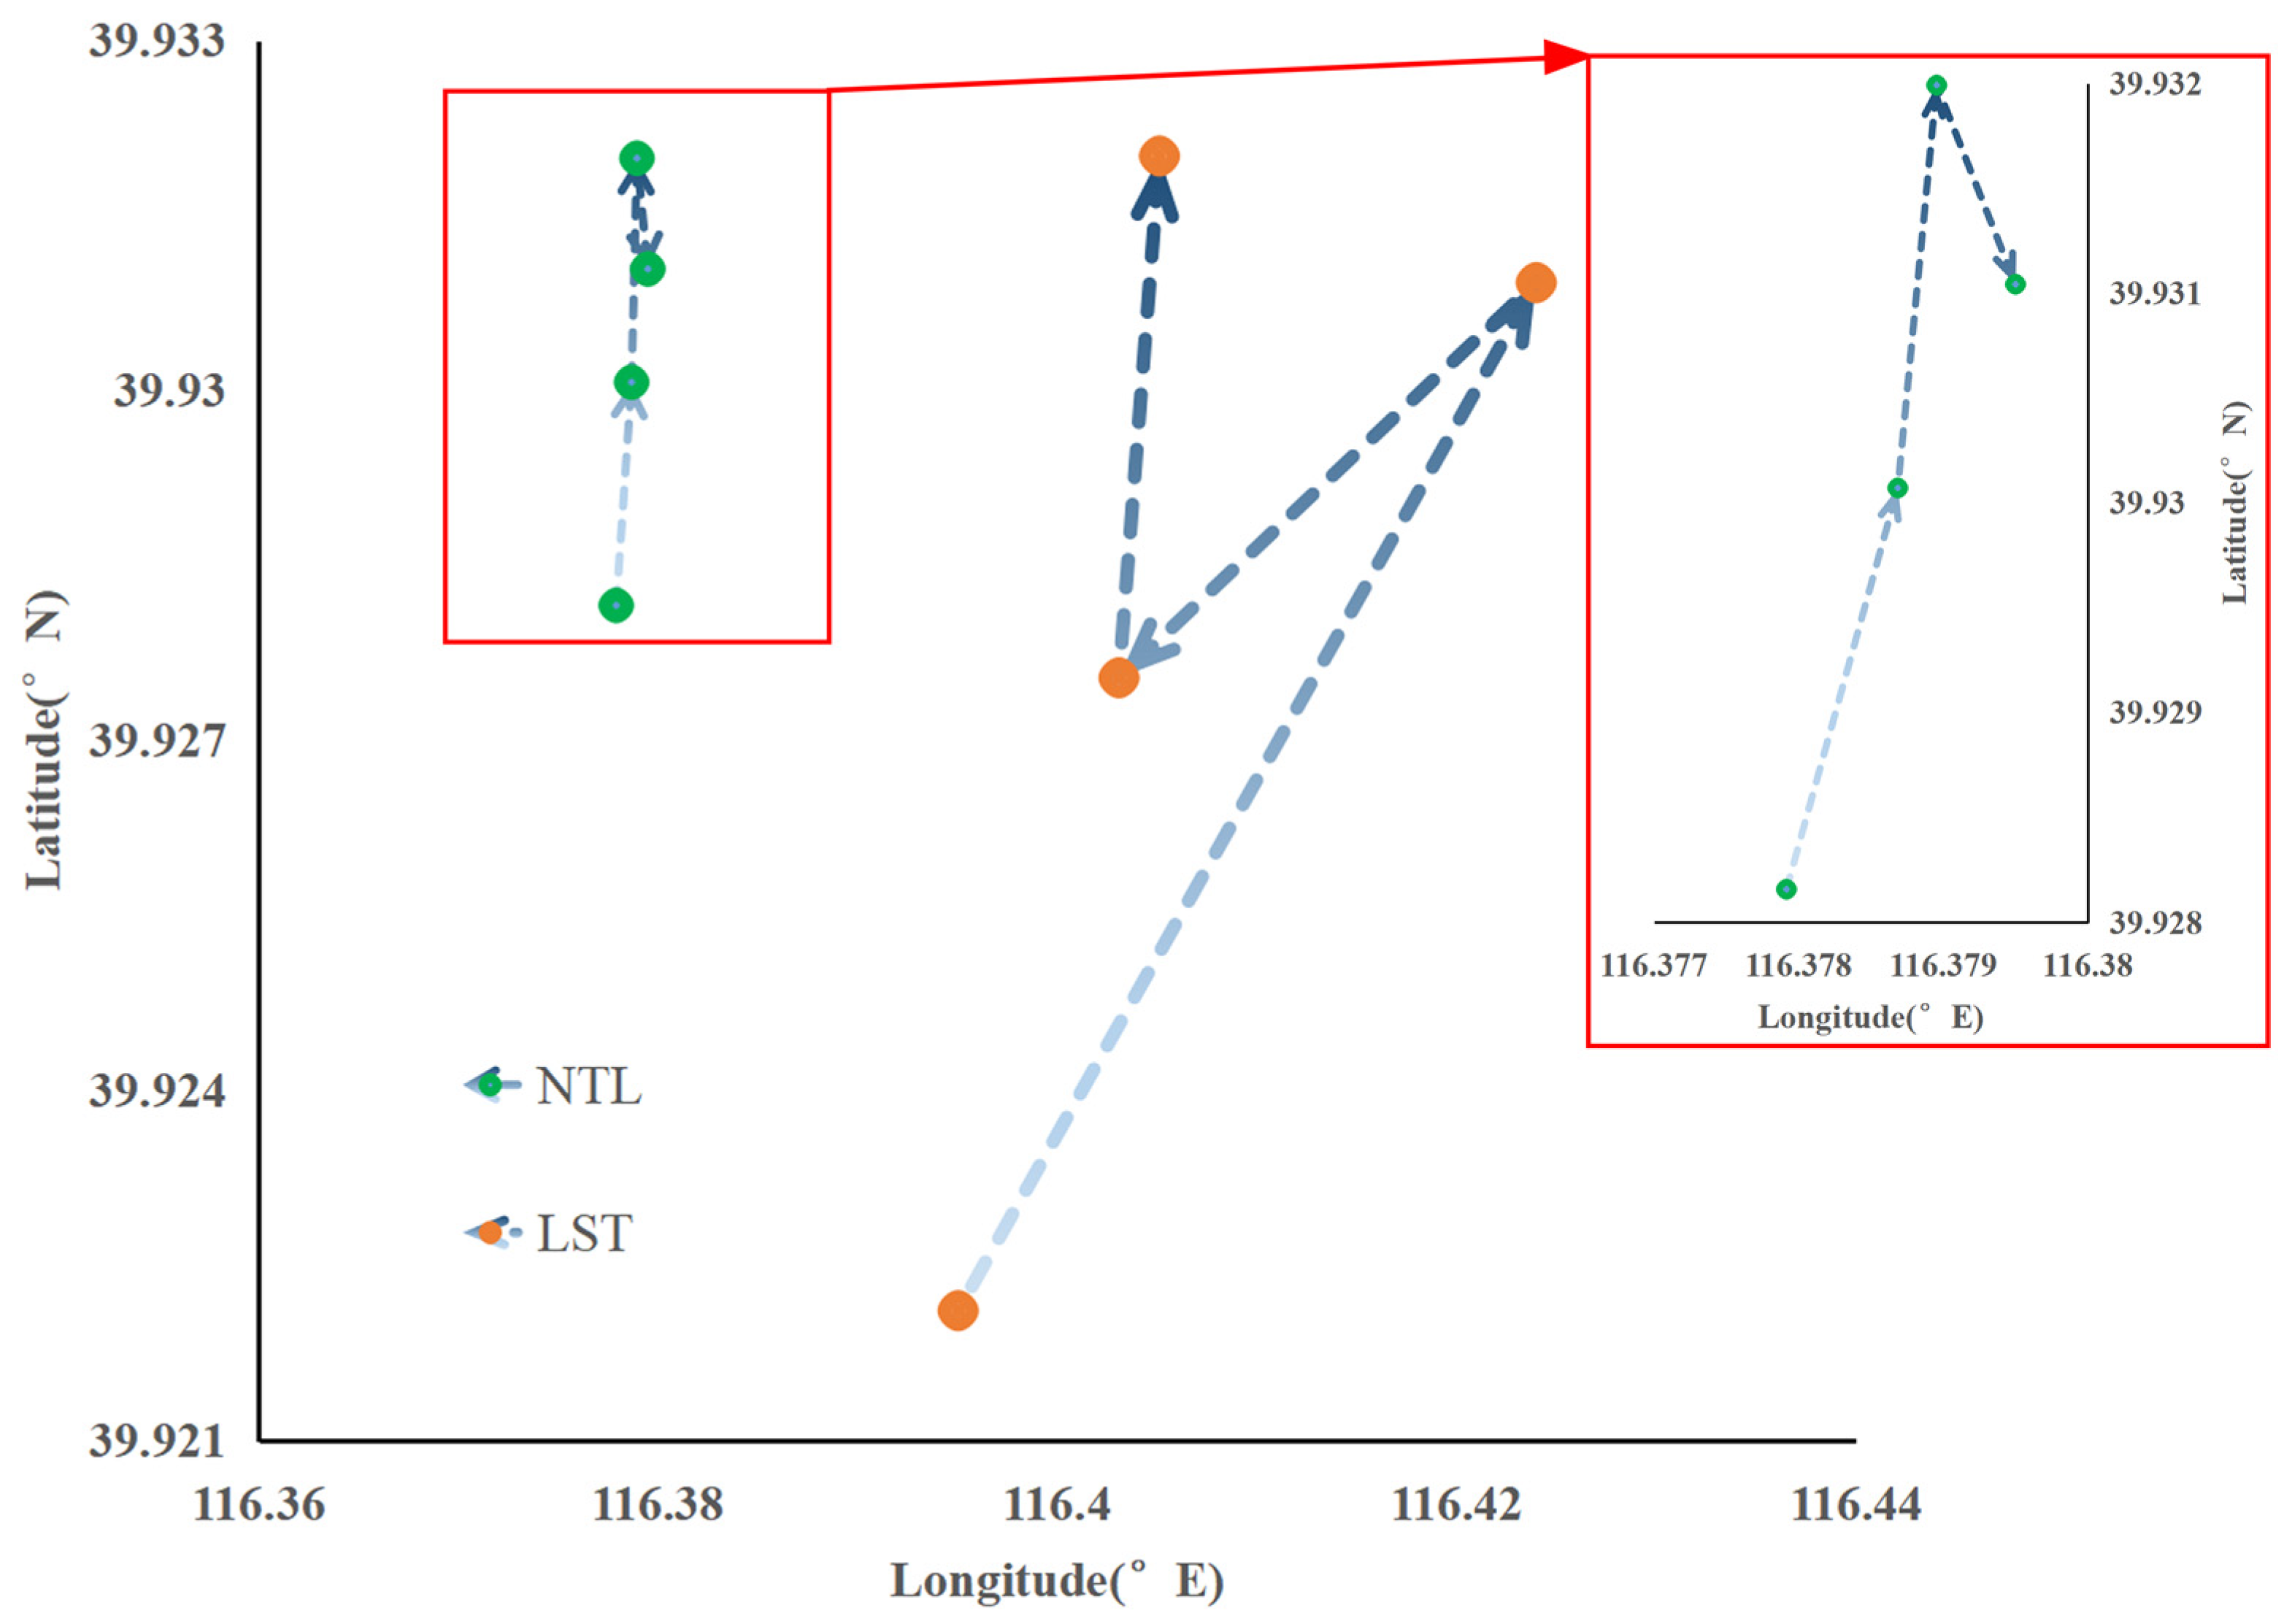
- From the perspective of spatiotemporal evolution, the spatial distribution of NTL and LST within the sixth ring road of Beijing from 2004 to 2019 was closely related. High temperatures mainly occurred in urban development zones with high NTL values, and low temperatures mainly occurred in less-developed areas with low NTL values. From 2004 to 2019, the overall coupling of NTL and LST first significantly weakened and then continuously strengthened. The moving directions of the weighted centers of the NTL and LST were the same in the early stage, then opposite in the late stage; however, overall, they were the same.
- (2)
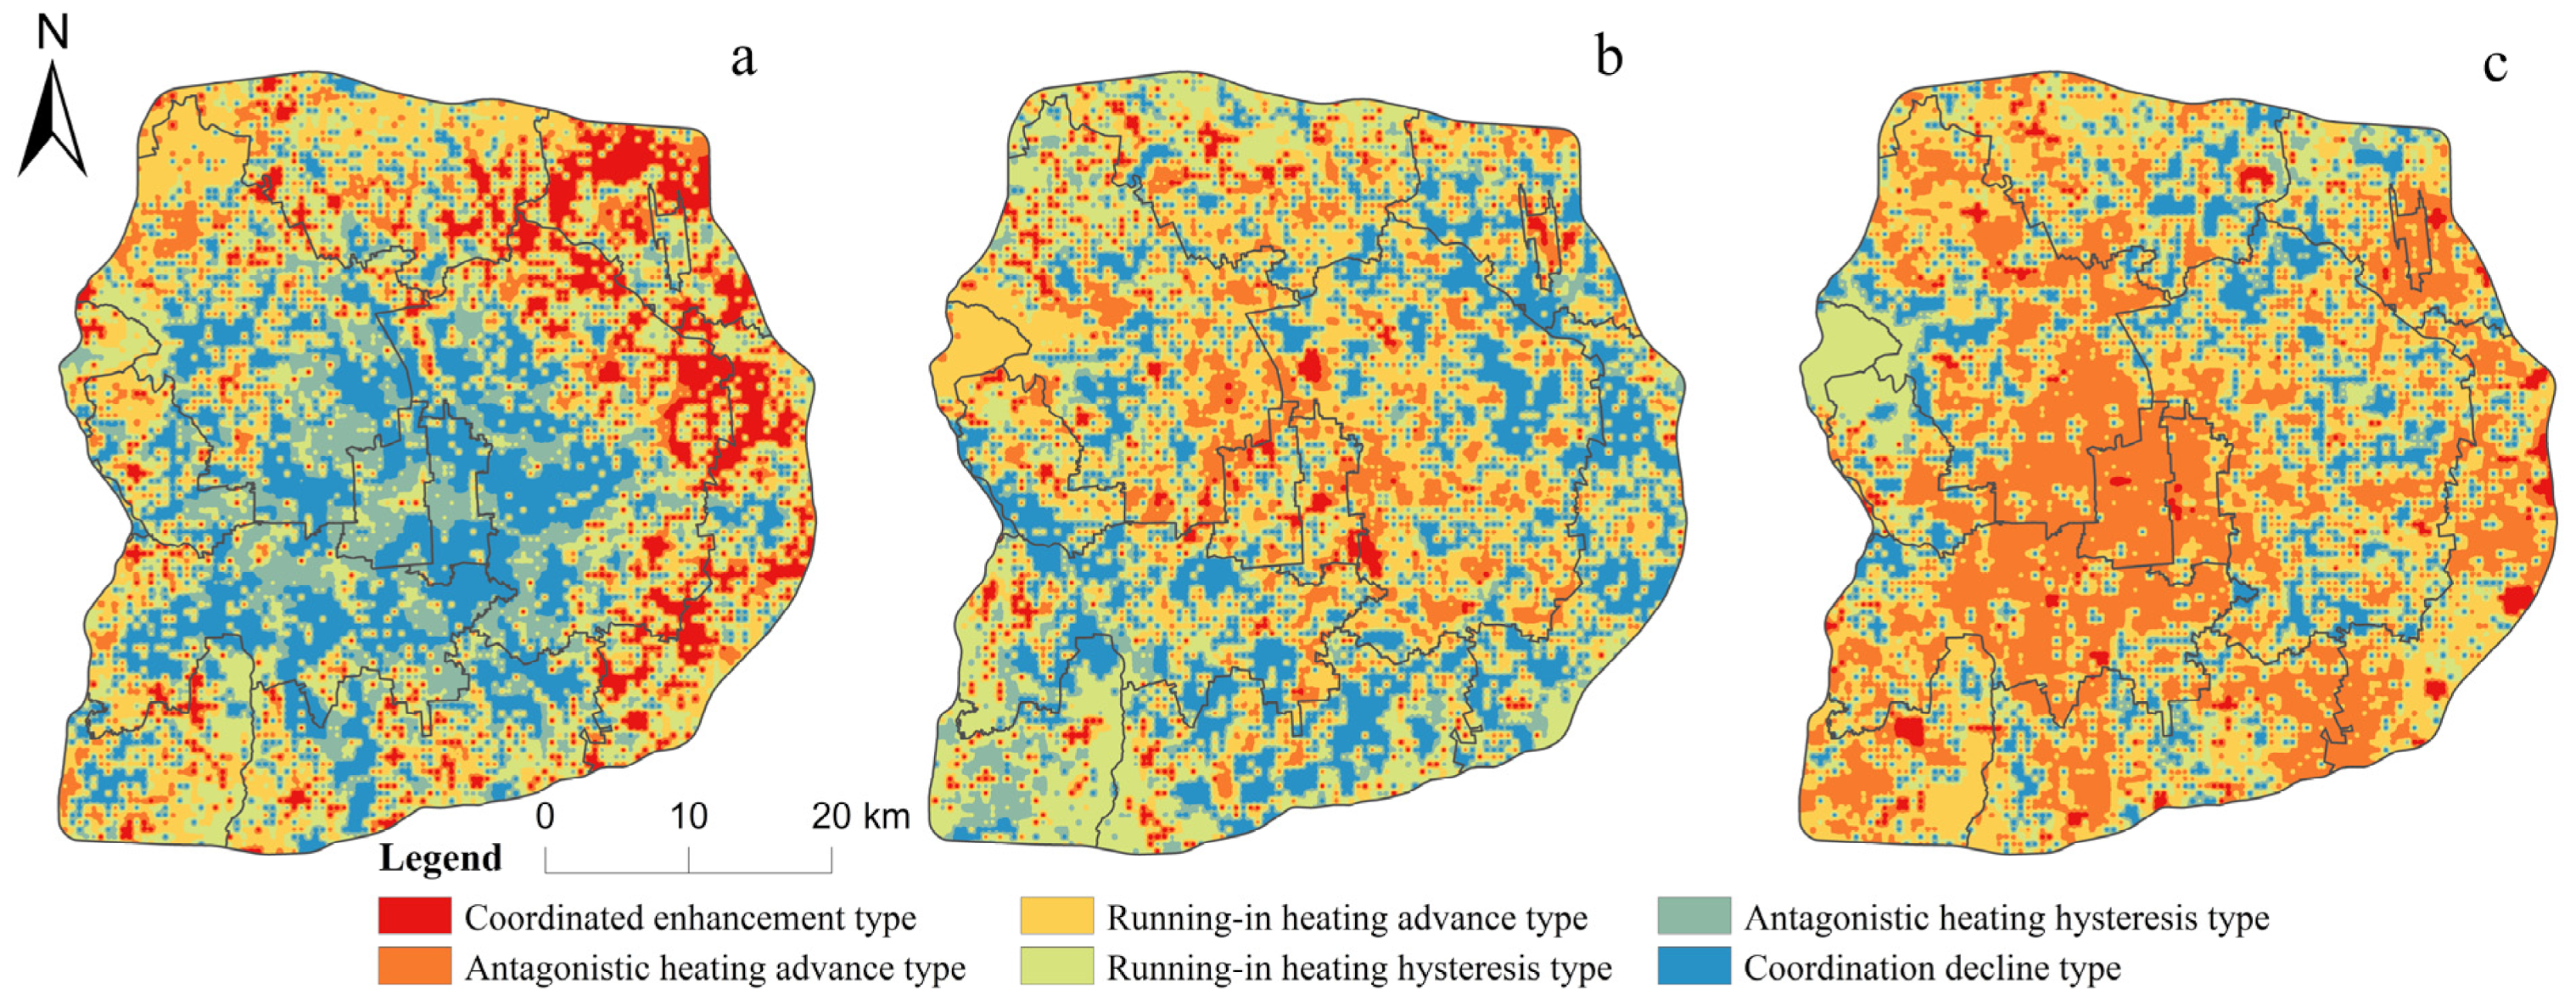
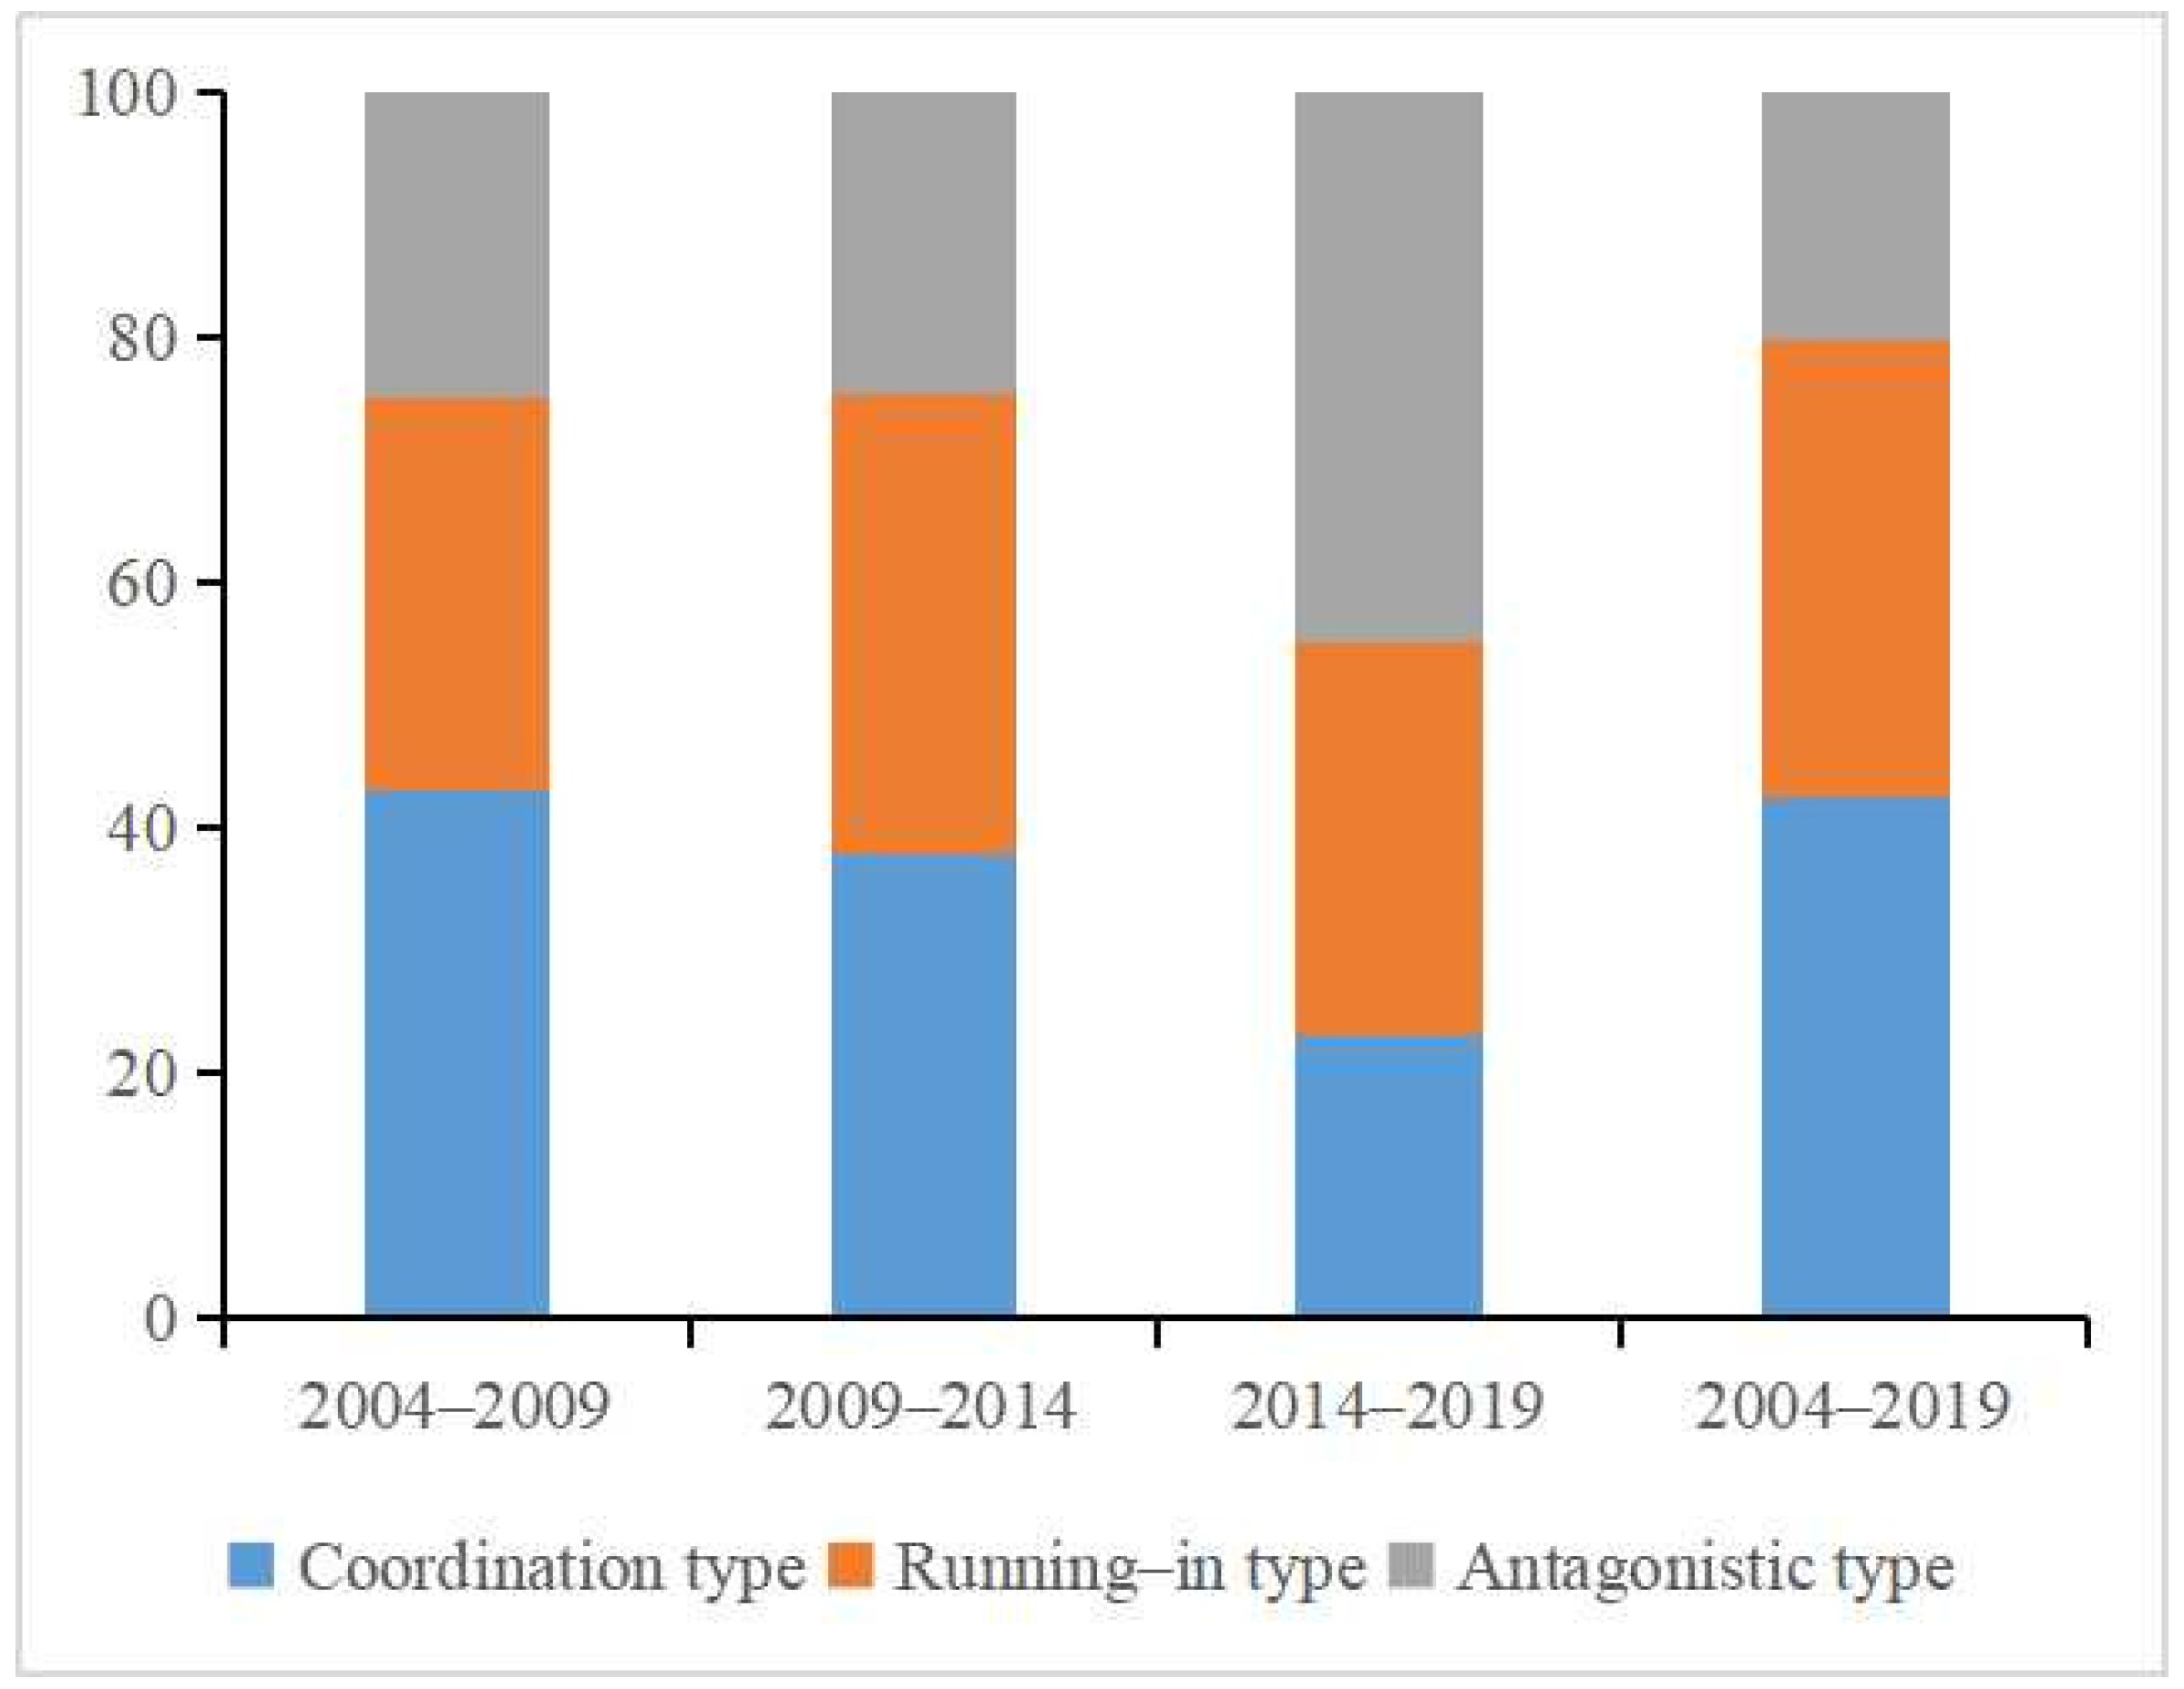
- From the perspective of coordination types, it was mainly heating hysteresis within the sixth ring road of Beijing from 2004 to 2009, accounting for 45.38% of the study area; from 2009 to 2014, it was mainly the running-in, accounting for 50.58% of the study area; from 2014 to 2019, it was mainly the heating advance, accounting for 64.35% of the study area. This shows that the main types of coordination between NTL and LST within the sixth ring road of Beijing deteriorated over time, with LST increased lagged behind NTL from 2004 to 2009 (heating hysteresis type) and LST increased ahead of NTL from 2014 to 2019 (heating advance type). This suggests that urban development became less efficient and LST increases became more significant.
- (3)
- In terms of correlation, from 2004–2019, the correlation coefficients of NTL and LST and the bivariate Moran’s I within the sixth ring road of Beijing are positive and significant. This shows that there is a significant positive correlation and spatial positive correlation between them. From 2004 to 2009, the temperature increase caused by urbanization was suppressed due to the 2008 Beijing Olympics and related ecological protection policies, resulting in a significant decrease in the correlation coefficient between NTL and LST. From 2009 to 2019, some short-term measures taken by Beijing during the Olympic Games were no longer effective, and the opposition between urban development and related policies made the policies increasingly less effective. The efficient ecological policies in the early period were unable to suppress the LST increase triggered by rapid urbanization in the later period, leading to the correlation coefficient between NTL and LST continued to increase, and the correlation coefficient value in 2019 was higher than that in 2004. The increase in the LST was more significant, which will greatly affect the urban ecological environment and residents’ health, making the previous government investment to suppress the temperature increase all in vain.
Author Contributions
Funding
Data Availability Statement
Acknowledgments
Conflicts of Interest
References
- Kuang, W.; Chi, W.; Lu, D.; Dou, Y. A Comparative Analysis of Megacity Expansions in China and the U.S.: Patterns, Rates and Driving Forces. Landsc. Urban Plan. 2014, 132, 121–135. [Google Scholar] [CrossRef]
- Luo, X.; Yang, J.; Sun, W.; He, B. Suitability of Human Settlements in Mountainous Areas from the Perspective of Ventilation: A Case Study of the Main Urban Area of Chongqing. J. Clean. Prod. 2021, 310, 127467. [Google Scholar] [CrossRef]
- Lai, L.W.; Cheng, W.L. Air Quality Influenced by Urban Heat Island Coupled with Synoptic Weather Patterns. Sci. Total Environ. 2009, 407, 2724–2733. [Google Scholar] [CrossRef] [PubMed]
- Zhao, C.; Jensen, J.L.R.; Weng, Q.; Currit, N.; Weaver, R. Use of Local Climate Zones to Investigate Surface Urban Heat Islands in Texas. GIScience Remote Sens. 2020, 57, 1083–1101. [Google Scholar] [CrossRef]
- Liu, Y.; Li, Q.; Yang, L.; Mu, K.; Liu, J. Urban Heat Island Effects of Various Urban Morphologies under Regional Climate Conditions. Sci. Total Environ. 2020, 743, 140589. [Google Scholar] [CrossRef]
- Zhao, Z.; Sharifi, A.; Dong, X.; Shen, L.; He, B.-J. Spatial Variability and Temporal Heterogeneity of Surface Urban Heat Island Patterns and the Suitability of Local Climate Zones for Land Surface Temperature Characterization. Remote Sens. 2021, 13, 4338. [Google Scholar] [CrossRef]
- Yang, X.; Peng, L.L.H.; Jiang, Z.; Chen, Y.; Yao, L.; He, Y.; Xu, T. Impact of Urban Heat Island on Energy Demand in Buildings: Local Climate Zones in Nanjing. Appl. Energy 2020, 260, 114279. [Google Scholar] [CrossRef]
- Ren, J.; Yang, J.; Zhang, Y.; Xiao, X.; Xia, J.C.; Li, X.; Wang, S. Exploring Thermal Comfort of Urban Buildings Based on Local Climate Zones. J. Clean. Prod. 2022, 340, 130744. [Google Scholar] [CrossRef]
- Chen, Y.; Yang, J.; Yang, R.; Xiao, X.; Xia, J. Contribution of Urban Functional Zones to the Spatial Distribution of Urban Thermal Environment. Build. Environ. 2022, 216, 109000. [Google Scholar] [CrossRef]
- Liu, M.; Zhang, D.; Pietzarka, U.; Roloff, A. Assessing the Adaptability of Urban Tree Species to Climate Change Impacts: A Case Study in Shanghai. Urban For. Urban Green. 2021, 62, 127186. [Google Scholar] [CrossRef]
- Nasrollahi, N.; Ghosouri, A.; Khodakarami, J.; Taleghani, M. Heat-Mitigation Strategies to Improve Pedestrian Thermal Comfort in Urban Environments: A Review. Sustainability 2020, 12, 10000. [Google Scholar] [CrossRef]
- Yang, J.; Wang, Y.; Xiu, C.; Xiao, X.; Jin, C. Optimizing Local Climate Zones to Mitigate Urban Heat Island Effect in Human Settlements. J. Clean. Prod. 2020, 275, 123767. [Google Scholar] [CrossRef]
- Biardeau, L.T.; Davis, L.W.; Gertler, P.; Wolfram, C. Heat Exposure and Global Air Conditioning. Nat Sustain. 2020, 3, 25–28. [Google Scholar] [CrossRef]
- Yu, H.; Yang, J.; Li, T.; Jin, Y.; Sun, D. Morphological and Functional Polycentric Structure Assessment of Megacity: An Integrated Approach with Spatial Distribution and Interaction. Sustain. Cities Soc. 2022, 80, 103800. [Google Scholar] [CrossRef]
- Imhoff, M.L.; Zhang, P.; Wolfe, R.E.; Bounoua, L. Remote Sensing of the Urban Heat Island Effect across Biomes in the Continental USA. Remote Sens. Environ. 2010, 114, 504–513. [Google Scholar] [CrossRef] [Green Version]
- Estoque, R.C.; Murayama, Y.; Myint, S.W. Effects of Landscape Composition and Pattern on Land Surface Temperature: An Urban Heat Island Study in the Megacities of Southeast Asia. Sci. Total Environ. 2017, 577, 349–359. [Google Scholar] [CrossRef]
- Yao, R.; Wang, L.; Huang, X.; Niu, Z.; Liu, F.; Wang, Q. Temporal Trends of Surface Urban Heat Islands and Associated Determinants in Major Chinese Cities. Sci. Total Environ. 2017, 609, 742–754. [Google Scholar] [CrossRef]
- Yang, J.; Yang, Y.; Sun, D.; Jin, C.; Xiao, X. Influence of Urban Morphological Characteristics on Thermal Environment. Sustain. Cities Soc. 2021, 72, 103045. [Google Scholar] [CrossRef]
- Sultana, S.; Satyanarayana, A.N.V. Assessment of Urbanisation and Urban Heat Island Intensities Using Landsat Imageries during 2000–2018 over a Sub-Tropical Indian City. Sustain. Cities Soc. 2020, 52, 101846. [Google Scholar] [CrossRef]
- El Kenawy, A.M.; Hereher, M.; Robaa, S.M.; McCabe, M.F.; Lopez-Moreno, J.I.; Domínguez-Castro, F.; Gaber, I.M.; Al-Awadhi, T.; Al-Buloshi, A.; Al Nasiri, N.; et al. Nocturnal Surface Urban Heat Island over Greater Cairo: Spatial Morphology, Temporal Trends and Links to Land-Atmosphere Influences. Remote Sens. 2020, 12, 3889. [Google Scholar] [CrossRef]
- Mohammad, P.; Goswami, A.; Bonafoni, S. The Impact of the Land Cover Dynamics on Surface Urban Heat Island Variations in Semi-Arid Cities: A Case Study in Ahmedabad City, India, Using Multi-Sensor/Source Data. Sensors 2019, 19, 3701. [Google Scholar] [CrossRef] [PubMed] [Green Version]
- Haashemi, S.; Weng, Q.; Darvishi, A.; Alavipanah, S. Seasonal Variations of the Surface Urban Heat Island in a Semi-Arid City. Remote Sens. 2016, 8, 352. [Google Scholar] [CrossRef] [Green Version]
- Yang, J.; Wang, Y.; Xiao, X.; Jin, C.; Xia, J.; Li, X. Spatial Differentiation of Urban Wind and Thermal Environment in Different Grid Sizes. Urban Clim. 2019, 28, 100458. [Google Scholar] [CrossRef]
- Liu, W.; Meng, Q.; Allam, M.; Zhang, L.; Hu, D.; Menenti, M. Driving Factors of Land Surface Temperature in Urban Agglomerations: A Case Study in the Pearl River Delta, China. Remote Sens. 2021, 13, 2858. [Google Scholar] [CrossRef]
- Chen, X.-L.; Zhao, H.-M.; Li, P.-X.; Yin, Z.-Y. Remote Sensing Image-Based Analysis of the Relationship between Urban Heat Island and Land Use/Cover Changes. Remote Sens. Environ. 2006, 104, 133–146. [Google Scholar] [CrossRef]
- Tariq, A.; Shu, H.; Siddiqui, S.; Imran, M.; Farhan, M. Monitoring Land Use And Land Cover Changes Using Geospatial Techniques, A Case Study Of Fateh Jang, Attock, Pakistan. GES 2021, 14, 41–52. [Google Scholar] [CrossRef]
- Tariq, A.; Shu, H. CA-Markov Chain Analysis of Seasonal Land Surface Temperature and Land Use Land Cover Change Using Optical Multi-Temporal Satellite Data of Faisalabad, Pakistan. Remote Sens. 2020, 12, 3402. [Google Scholar] [CrossRef]
- Yao, L.; Li, T.; Xu, M.; Xu, Y. How the Landscape Features of Urban Green Space Impact Seasonal Land Surface Temperatures at a City-Block-Scale: An Urban Heat Island Study in Beijing, China. Urban For. Urban Green. 2020, 52, 126704. [Google Scholar] [CrossRef]
- Singh, P.; Kikon, N.; Verma, P. Impact of Land Use Change and Urbanization on Urban Heat Island in Lucknow City, Central India. A Remote Sensing Based Estimate. Sustain. Cities Soc. 2017, 32, 100–114. [Google Scholar] [CrossRef]
- Majeed, M.; Tariq, A.; Anwar, M.M.; Khan, A.M.; Arshad, F.; Mumtaz, F.; Farhan, M.; Zhang, L.; Zafar, A.; Aziz, M.; et al. Monitoring of Land Use–Land Cover Change and Potential Causal Factors of Climate Change in Jhelum District, Punjab, Pakistan, through GIS and Multi-Temporal Satellite Data. Land 2021, 10, 1026. [Google Scholar] [CrossRef]
- Dai, Z.; Guldmann, J.-M.; Hu, Y. Spatial Regression Models of Park and Land-Use Impacts on the Urban Heat Island in Central Beijing. Sci. Total Environ. 2018, 626, 1136–1147. [Google Scholar] [CrossRef] [PubMed]
- Morabito, M.; Crisci, A.; Guerri, G.; Messeri, A.; Congedo, L.; Munafò, M. Surface Urban Heat Islands in Italian Metropolitan Cities: Tree Cover and Impervious Surface Influences. Sci. Total Environ. 2021, 751, 142334. [Google Scholar] [CrossRef] [PubMed]
- Meng, Q.; Zhang, L.; Sun, Z.; Meng, F.; Wang, L.; Sun, Y. Characterizing Spatial and Temporal Trends of Surface Urban Heat Island Effect in an Urban Main Built-up Area: A 12-Year Case Study in Beijing, China. Remote Sens. Environ. 2018, 204, 826–837. [Google Scholar] [CrossRef]
- Yuan, F.; Bauer, M.E. Comparison of Impervious Surface Area and Normalized Difference Vegetation Index as Indicators of Surface Urban Heat Island Effects in Landsat Imagery. Remote Sens. Environ. 2007, 106, 375–386. [Google Scholar] [CrossRef]
- Li, Y.; Sun, Y.; Li, J.; Gao, C. Socioeconomic Drivers of Urban Heat Island Effect: Empirical Evidence from Major Chinese Cities. Sustain. Cities Soc. 2020, 63, 102425. [Google Scholar] [CrossRef]
- Peng, J.; Jia, J.; Liu, Y.; Li, H.; Wu, J. Seasonal Contrast of the Dominant Factors for Spatial Distribution of Land Surface Temperature in Urban Areas. Remote Sens. Environ. 2018, 215, 255–267. [Google Scholar] [CrossRef]
- Dewan, A.; Kiselev, G.; Botje, D.; Mahmud, G.I.; Bhuian, M.H.; Hassan, Q.K. Surface Urban Heat Island Intensity in Five Major Cities of Bangladesh: Patterns, Drivers and Trends. Sustain. Cities Soc. 2021, 71, 102926. [Google Scholar] [CrossRef]
- Portela, C.I.; Massi, K.G.; Rodrigues, T.; Alcântara, E. Impact of Urban and Industrial Features on Land Surface Temperature: Evidences from Satellite Thermal Indices. Sustain. Cities Soc. 2020, 56, 102100. [Google Scholar] [CrossRef]
- Zhou, W.; Huang, G.; Cadenasso, M.L. Does Spatial Configuration Matter? Understanding the Effects of Land Cover Pattern on Land Surface Temperature in Urban Landscapes. Landsc. Urban Plan. 2011, 102, 54–63. [Google Scholar] [CrossRef]
- Maimaitiyiming, M.; Ghulam, A.; Tiyip, T.; Pla, F.; Latorre-Carmona, P.; Halik, Ü.; Sawut, M.; Caetano, M. Effects of Green Space Spatial Pattern on Land Surface Temperature: Implications for Sustainable Urban Planning and Climate Change Adaptation. ISPRS J. Photogramm. Remote Sens. 2014, 89, 59–66. [Google Scholar] [CrossRef] [Green Version]
- Tariq, A.; Riaz, I.; Ahmad, Z.; Yang, B.; Amin, M.; Kausar, R.; Andleeb, S.; Farooqi, M.A.; Rafiq, M. Land Surface Temperature Relation with Normalized Satellite Indices for the Estimation of Spatio-Temporal Trends in Temperature among Various Land Use Land Cover Classes of an Arid Potohar Region Using Landsat Data. Env. Earth Sci 2020, 79, 40. [Google Scholar] [CrossRef]
- Du, Z.W.; Li, X. Growth or shrinkage: New phenomena of regional development in the rapidly-urbanising Pearl River Delta. Acta Geogr. Sin. 2017, 72, 1800–1811. [Google Scholar] [CrossRef]
- Elvidge, C.D.; Baugh, K.E.; Kihn, E.A.; Kroehl, H.W.; Davis, E.R. Mapping City Lights with Nighttime Data from the DMSP Operational Linescan System. Eng Remote Sens 1997, 63, 727–734. [Google Scholar] [CrossRef]
- Sutton, P.C. A Scale-Adjusted Measure of “Urban Sprawl” Using Nighttime Satellite Imagery. Remote Sens. Environ. 2003, 86, 353–369. [Google Scholar] [CrossRef]
- Sutton, P.; Roberts, D.; Elvidge, C.; Melj, H. A Comparison of Nighttime Satellite Imagery and Population Density for the Continental United States. Photogramm. Eng. Remote Sens. 1997, 63, 1303–1313. [Google Scholar] [CrossRef]
- Sutton, P.C.; Costanza, R. Global Estimates of Market and Non-Market Values Derived from Nighttime Satellite Imagery, Land Cover, and Ecosystem Service Valuation. Ecol. Econ. 2002, 41, 509–527. [Google Scholar] [CrossRef]
- He, C.; Ma, Q.; Liu, Z.; Zhang, Q. Modeling the Spatiotemporal Dynamics of Electric Power Consumption in Mainland China Using Saturation-Corrected DMSP/OLS Nighttime Stable Light Data. Int. J. Digit. Earth 2014, 7, 993–1014. [Google Scholar] [CrossRef]
- Doll, C.H.; Muller, J.P.; Elvidge, C.D. Night-Time Imagery as a Tool for Global Mapping of Socioeconomic Parameters and Greenhouse Gas Emissions. Ambio A J. Hum. Environ. 2000, 29, 157–162. [Google Scholar] [CrossRef]
- Li, J.; Wang, F.; Fu, Y.; Guo, B.; Zhao, Y.; Yu, H. A Novel SUHI Referenced Estimation Method for Multicenters Urban Agglomeration Using DMSP/OLS Nighttime Light Data. IEEE J. Sel. Top. Appl. Earth Obs. Remote Sens. 2020, 13, 1416–1425. [Google Scholar] [CrossRef]
- Stathakis, D.; Baltas, P. Seasonal Population Estimates Based on Night-Time Lights. Comput. Environ. Urban Syst. 2018, 68, 133–141. [Google Scholar] [CrossRef]
- Ma, T.; Zhou, Y.K.; Zhou, C.H. Night-Time Light Derived Estimation of Spatio-Temporal Characteristics of Urbanization Dynamics Using DMSP/OLS Satellite Data. Remote Sens. Environ. 2015, 158, 453–464. [Google Scholar] [CrossRef]
- Sun, Y.; Wang, S.; Zhang, X.; Chan, T.O.; Wu, W. Estimating Local-Scale Domestic Electricity Energy Consumption Using Demographic, Nighttime Light Imagery and Twitter Data. Energy 2021, 120–351. [Google Scholar] [CrossRef]
- Huang, X.; Wang, Y. Investigating the Effects of 3D Urban Morphology on the Surface Urban Heat Island Effect in Urban Functional Zones by Using High-Resolution Remote Sensing Data: A Case Study of Wuhan, Central China. ISPRS J. Photogramm. Remote Sens. 2019, 152, 119–131. [Google Scholar] [CrossRef]
- Li, W.; Han, C.; Li, W.; Zhou, W.; Han, L. Multi-Scale Effects of Urban Agglomeration on Thermal Environment: A Case of the Yangtze River Delta Megaregion, China. Sci. Total Environ. 2020, 713, 136556. [Google Scholar] [CrossRef] [PubMed]
- Zhou, D.; Bonafoni, S.; Zhang, L.; Wang, R. Remote Sensing of the Urban Heat Island Effect in a Highly Populated Urban Agglomeration Area in East China. Sci. Total Environ. 2018, 628–629, 415–429. [Google Scholar] [CrossRef] [PubMed]
- Yang, C.; Zhan, Q.; Gao, S.; Liu, H. How Do the Multi-Temporal Centroid Trajectories of Urban Heat Island Correspond to Impervious Surface Changes: A Case Study in Wuhan, China. Int. J. Environ. Res. Public Health 2019, 16, 3865. [Google Scholar] [CrossRef] [Green Version]
- Yang, Z.W.; Chen, Y.B.; Qian, Q.L.; Wu, Z.F.; Zheng, Z.H.; Huang, Q.Y. The Coupling Relationship between Construction Land Expansion and High-Temperature Area Expansion in China’s Three Major Urban Agglomerations. Int. J. Remote Sens. 2019, 40, 6680–6699. [Google Scholar] [CrossRef]
- Liu, N.; Liu, C.; Xia, Y.; Da, B. Examining the Coordination between Urbanization and Eco-Environment Using Coupling and Spatial Analyses: A Case Study in China. Ecol. Indic. 2018, 93, 1163–1175. [Google Scholar] [CrossRef]
- Lefever, D.W. Measuring Geographic Concentration by Means of the Standard Deviational Ellipse. Am. J. Sociol. 1926, 32, 88–94. [Google Scholar] [CrossRef]
- Zhao, Y.; Luo, Z.J.; Li, Y.T.; Guo, J.Y.; Lai, X.H.; Song, J. Study of the spatial-temporal variation of landscape ecological risk in the upper reaches of the Ganjiang River Basin based on the“production-living-ecological space”. Acta Ecol. Sin. 2019, 39, 4676–4686. [Google Scholar] [CrossRef]
- He, B.-J.; Wang, J.; Zhu, J.; Qi, J. Beating the Urban Heat: Situation, Background, Impacts and the Way Forward in China. Renew. Sustain. Energy Rev. 2022, 161, 112350. [Google Scholar] [CrossRef]
- Piantek, M.; Miguel, J.; Kruger, A.; NaviO, C.; Bernien, M.; Ball, D.K.; Hermann, K.; Kuch, W. Temperature, Surface, and Coverage-Induced Conformational Changes of Azobenzene Derivatives on Cu(001). J. Phys. Chem. C 2009, 113, 20307–20315. [Google Scholar] [CrossRef]
- Xiong, Y.; Zhang, F. Effect of Human Settlements on Urban Thermal Environment and Factor Analysis Based on Multi-Source Data: A Case Study of Changsha City. J. Geogr. Sci. 2021, 31, 819–838. [Google Scholar] [CrossRef]
- Shen, Z.J.; Zeng, J. Spatial relationship of urban development to land surface temperature in three cities of southern Fujian. Acta Geogr. Sin. 2021, 76, 566–583. [Google Scholar] [CrossRef]
- Yao, L.; Xu, Y.; Zhang, B. Effect of Urban Function and Landscape Structure on the Urban Heat Island Phenomenon in Beijing, China. Landsc. Ecol. Eng. 2019, 15, 379–390. [Google Scholar] [CrossRef]
- Yu, Z.; Yao, Y.; Yang, G.; Wang, X.; Vejre, H. Spatiotemporal Patterns and Characteristics of Remotely Sensed Region Heat Islands during the Rapid Urbanization (1995–2015) of Southern China. Sci. Total Environ. 2019, 674, 242–254. [Google Scholar] [CrossRef]
- Min, M.; Lin, C.; Duan, X.; Jin, Z.; Zhang, L. Spatial Distribution and Driving Force Analysis of Urban Heat Island Effect Based on Raster Data: A Case Study of the Nanjing Metropolitan Area, China. Sustain. Cities Soc. 2019, 50, 101637. [Google Scholar] [CrossRef]
- Liu, G.; Zhang, Q.; Li, G.; Doronzo, D.M. Response of Land Cover Types to Land Surface Temperature Derived from Landsat-5 TM in Nanjing Metropolitan Region, China. Env. Earth Sci. 2016, 75, 1386. [Google Scholar] [CrossRef]
- Yue, W.; Qiu, S.; Xu, H.; Xu, L.; Zhang, L. Polycentric Urban Development and Urban Thermal Environment: A Case of Hangzhou, China. Landsc. Urban Plan. 2019, 189, 58–70. [Google Scholar] [CrossRef]
- Chen, S.; Hu, D.; Wong, M.S.; Ren, H.; Cao, S.; Yu, C.; Ho, H.C. Characterizing Spatiotemporal Dynamics of Anthropogenic Heat Fluxes: A 20-Year Case Study in Beijing–Tianjin–Hebei Region in China. Environ. Pollut. 2019, 249, 923–931. [Google Scholar] [CrossRef]
- Zhao, Z.Q. Global Statistics of Spatial Distribution: A Literature Review. Prog. Geogr. 2009, 28, 1–8. [Google Scholar] [CrossRef]
- Yang, Y.; Ma, M.; Zhu, X.; Ge, W. Research on Spatial Characteristics of Metropolis Development Using Nighttime Light Data: NTL Based Spatial Characteristics of Beijing. PLoS ONE 2020, 15, e0242663. [Google Scholar] [CrossRef] [PubMed]
- Sun, Y.; Wang, S.; Wang, Y. Estimating Local-Scale Urban Heat Island Intensity Using Nighttime Light Satellite Imageries. Sustain. Cities Soc. 2020, 57, 102125. [Google Scholar] [CrossRef]
- Chen, W.; Zhang, Y.; Pengwang, C.; Gao, W. Evaluation of Urbanization Dynamics and Its Impacts on Surface Heat Islands: A Case Study of Beijing, China. Remote Sens. 2017, 9, 453. [Google Scholar] [CrossRef] [Green Version]
- Chen, W.; Zhang, Y.; Gao, W.; Zhou, D. The Investigation of Urbanization and Urban Heat Island in Beijing Based on Remote Sensing. Procedia—Soc. Behav. Sci. 2016, 216, 141–150. [Google Scholar] [CrossRef] [Green Version]
- Dong, X.; Meng, Z.; Wang, Y.; Zhang, Y.; Sun, H.; Wang, Q. Monitoring Spatiotemporal Changes of Impervious Surfaces in Beijing City Using Random Forest Algorithm and Textural Features. Remote Sens. 2021, 13, 153. [Google Scholar] [CrossRef]
- Xie, P.; Yang, J.; Sun, W.; Xiao, X.; Cecilia Xia, J. Urban Scale Ventilation Analysis Based on Neighborhood Normalized Current Model. Sustain. Cities Soc. 2022, 80, 103746. [Google Scholar] [CrossRef]
- Ye, H.; Li, Z.; Zhang, N.; Leng, X.; Meng, D.; Zheng, J.; Li, Y. Variations in the Effects of Landscape Patterns on the Urban Thermal Environment during Rapid Urbanization (1990–2020) in Megacities. Remote Sens. 2021, 13, 3415. [Google Scholar] [CrossRef]
- Chen, L.; Wang, X.; Cai, X.; Yang, C.; Lu, X. Combined Effects of Artificial Surface and Urban Blue-Green Space on Land Surface Temperature in 28 Major Cities in China. Remote Sens. 2022, 14, 448. [Google Scholar] [CrossRef]
- Kyriakodis, G.-E.; Santamouris, M. Using Reflective Pavements to Mitigate Urban Heat Island in Warm Climates—Results from a Large Scale Urban Mitigation Project. Urban Clim. 2018, 24, 326–339. [Google Scholar] [CrossRef]
- Middel, A.; Turner, V.K.; Schneider, F.A.; Zhang, Y.; Stiller, M. Solar Reflective Pavements—A Policy Panacea to Heat Mitigation? Environ. Res. Lett. 2020, 15, 064016. [Google Scholar] [CrossRef]
- Kousis, I.; Fabiani, C.; Gobbi, L.; Pisello, A.L. Phosphorescent-Based Pavements for Counteracting Urban Overheating—A Proof of Concept. Sol. Energy 2020, 202, 540–552. [Google Scholar] [CrossRef]
- Susca, T.; Gaffin, S.R.; Dell’Osso, G.R. Positive Effects of Vegetation: Urban Heat Island and Green Roofs. Environ. Pollut. 2011, 159, 2119–2126. [Google Scholar] [CrossRef] [PubMed]
- Dong, J.; Lin, M.; Zuo, J.; Lin, T.; Liu, J.; Sun, C.; Luo, J. Quantitative Study on the Cooling Effect of Green Roofs in a High-Density Urban Area—A Case Study of Xiamen, China. J. Clean. Prod. 2020, 255, 120152. [Google Scholar] [CrossRef]
- Doulos, L.; Santamouris, M.; Livada, I. Passive Cooling of Outdoor Urban Spaces. The Role of Materials. Sol. Energy 2004, 77, 231–249. [Google Scholar] [CrossRef]
- Lei, J.; Kumarasamy, K.; Zingre, K.T.; Yang, J.; Wan, M.P.; Yang, E.-H. Cool Colored Coating and Phase Change Materials as Complementary Cooling Strategies for Building Cooling Load Reduction in Tropics. Appl. Energy 2017, 190, 57–63. [Google Scholar] [CrossRef]
- Yang, L.; Yu, K.; Ai, J.; Liu, Y.; Yang, W.; Liu, J. Dominant Factors and Spatial Heterogeneity of Land Surface Temperatures in Urban Areas: A Case Study in Fuzhou, China. Remote Sens. 2022, 14, 1266. [Google Scholar] [CrossRef]
- Azhdari, A.; Soltani, A.; Alidadi, M. Urban Morphology and Landscape Structure Effect on Land Surface Temperature: Evidence from Shiraz, a Semi-Arid City. Sustain. Cities Soc. 2018, 41, 853–864. [Google Scholar] [CrossRef]
- Chen, M.; Dai, F.; Yang, B.; Zhu, S. Effects of Neighborhood Green Space on PM2.5 Mitigation: Evidence from Five Megacities in China. Build. Environ. 2019, 156, 33–45. [Google Scholar] [CrossRef]
- Yao, X.; Yu, K.; Zeng, X.; Lin, Y.; Ye, B.; Shen, X.; Liu, J. How Can Urban Parks Be Planned to Mitigate Urban Heat Island Effect in “Furnace Cities” ? An Accumulation Perspective. J. Clean. Prod. 2022, 330, 129852. [Google Scholar] [CrossRef]
- Marković, M.; Cheema, J.; Teofilović, A.; Čepić, S.; Popović, Z.; Tomićević-Dubljević, J.; Pause, M. Monitoring of Spatiotemporal Change of Green Spaces in Relation to the Land Surface Temperature: A Case Study of Belgrade, Serbia. Remote Sens. 2021, 13, 3846. [Google Scholar] [CrossRef]
- Amir Siddique, M.; Wang, Y.; Xu, N.; Ullah, N.; Zeng, P. The Spatiotemporal Implications of Urbanization for Urban Heat Islands in Beijing: A Predictive Approach Based on CA–Markov Modeling (2004–2050). Remote Sens. 2021, 13, 4697. [Google Scholar] [CrossRef]
- Yang, Y.M.; Park, J.H.; An, S.I.; Wang, B.; Luo, X. Mean Sea Surface Temperature Changes Influence ENSO-Related Precipitation Changes in the Mid-Latitudes. Nat. Commun. 2021, 12, 1495. [Google Scholar] [CrossRef] [PubMed]


| Data | Data Identification | Time | Data Source |
|---|---|---|---|
| Landsat4-5 TM | LT51230322004252BJC00 | 8 September 2004 | http://www.gscloud.cn/, (accessed on 3 October 2021). |
| Landsat4-5 TM | LT51230322009265IKR00 | 22 September 2009 | |
| Landsat8 OLI_TIRS | LC81230322014247LGN01 | 4 September 2014 | |
| Landsat8 OLI_TIRS | LC81230322019261LGN00 | 18 September 2019 | |
| DEM | ASTGTM_N39E116 | - | |
| Road network | - | 2020 | https://www.openstreetmap.org/, (accessed on 3 October 2021). |
| POI | - | 2020 | https://map.baidu.com/, (accessed on 3 October 2021). |
| DMSP/OLS NTL | - | - | http://www.ngdc.noaa.gov/, (accessed on 3 October 2021). |
| NPP/VIIRS NTL | - | - |
| Category | Formation Conditions | Meaning |
|---|---|---|
| Coordinated enhancement type | 0.8 < O ≤ 1.0, UR ≈ TR > 0 | The coordination degree of NTL and LST is high, urban development and LST are coordinated enhanced |
| Antagonistic heating advance type | 0 ≤ O < 0.5, TR > UR | The coordination degree of NTL and LST is low, LST increases ahead of urban development |
| Running-in heating advance type | 0.5 ≤ O < 0.8, TR > UR | NTL and LST are barely coordinated, LST increases ahead of urban development |
| Running-in heating hysteresis type | 0.5 ≤ O < 0.8, TR < UR | NTL and LST are barely coordinated, and LST increase lags behind urban development |
| Antagonistic heating hysteresis type | 0 ≤ O < 0.5, TR < UR | The coordination degree between NTL and LST is low, and LST increase lags behind urban development |
| Coordinated decline type | 0.8 < O ≤ 1.0, UR ≈ TR < 0 | The coordination degree of NTL and LST is high, urban development, and LST decrease in coordination |
| Type | 2004 | 2009 | 2014 | 2019 | ||||
|---|---|---|---|---|---|---|---|---|
| Low Value Area | High Value Area | Low Value Area | High Value Area | Low Value Area | High Value Area | Low Value Area | High Value Area | |
| Changping | 13.18 | 3.60 | 13.08 | 4.58 | 13.91 | 1.30 | 13.01 | 2.75 |
| Chaoyang | 15.19 | 34.52 | 13.72 | 36.52 | 17.65 | 28.42 | 17.74 | 29.31 |
| Daxing | 11.89 | 7.24 | 13.14 | 4.66 | 11.9 | 7.06 | 12.76 | 3.81 |
| Dongcheng | 0.82 | 4.74 | 1.16 | 3.64 | 0.30 | 6.29 | 0.68 | 5.75 |
| Fangshan | 7.46 | 1.08 | 8.08 | 0.11 | 7.33 | 1.24 | 6.98 | 1.66 |
| Fengtai | 10.17 | 15.68 | 10.74 | 13.91 | 10.51 | 14.91 | 10.19 | 16.40 |
| Haidian | 15.55 | 19.37 | 17.33 | 14.88 | 15.85 | 18.66 | 16.9 | 15.66 |
| Mentougou | 1.77 | 0.06 | 1.85 | 0.00 | 1.77 | 0.00 | 1.71 | 0.00 |
| Shijingshan | 3.80 | 3.39 | 4.07 | 2.76 | 3.98 | 2.86 | 3.71 | 3.60 |
| Shunyi | 7.70 | 1.51 | 6.46 | 4.89 | 6.61 | 4.29 | 6.12 | 5.57 |
| Tongzhou | 10.67 | 5.39 | 8.82 | 10.15 | 9.94 | 7.25 | 9.56 | 8.15 |
| Xicheng | 1.80 | 3.42 | 1.55 | 3.90 | 0.25 | 7.72 | 0.64 | 7.34 |
| Sum | 100.00 | 100.00 | 100.00 | 100.00 | 100.00 | 100.00 | 100.00 | 100.00 |
| Type | 2004 | 2009 | 2014 | 2019 | ||||
|---|---|---|---|---|---|---|---|---|
| Cold Island Area | Heat Island Area | Cold Island Area | Heat Island Area | Cold Island Area | Heat Island Area | Cold Island Area | Heat Island Area | |
| Changping | 18.07 | 7.04 | 14.72 | 8.85 | 12.20 | 9.84 | 13.01 | 9.51 |
| Chaoyang | 18.45 | 21.44 | 21.13 | 20.17 | 17.06 | 22.25 | 20.05 | 20.67 |
| Daxing | 3.98 | 13.99 | 5.24 | 13.12 | 10.06 | 11.06 | 8.75 | 11.65 |
| Dongcheng | 0.41 | 2.55 | 1.19 | 2.15 | 0.53 | 2.54 | 0.49 | 2.51 |
| Fangshan | 4.13 | 6.53 | 3.85 | 6.58 | 7.17 | 5.00 | 5.78 | 5.73 |
| Fengtai | 2.98 | 15.97 | 5.36 | 14.52 | 6.49 | 14.44 | 6.19 | 14.37 |
| Haidian | 20.39 | 14.34 | 20.64 | 14.42 | 18.72 | 15.07 | 18.35 | 15.35 |
| Mentougou | 3.28 | 0.41 | 3.38 | 0.45 | 1.71 | 1.16 | 3.55 | 0.29 |
| Shijingshan | 3.27 | 3.92 | 3.52 | 3.79 | 2.92 | 4.11 | 4.10 | 3.51 |
| Shunyi | 10.90 | 3.57 | 8.96 | 4.65 | 8.91 | 4.43 | 8.50 | 4.75 |
| Tongzhou | 13.78 | 7.11 | 10.96 | 8.55 | 13.74 | 6.96 | 10.81 | 8.56 |
| Xicheng | 0.36 | 3.13 | 1.05 | 2.75 | 0.49 | 3.14 | 0.42 | 3.10 |
| Sum | 100.00 | 100.00 | 100.00 | 100.00 | 100.00 | 100.00 | 100.00 | 100.00 |
| Year | Distance between Weighted Centers (km) | Period | Angle of the Moving Direction of the Weighted Center (°) |
|---|---|---|---|
| 2004 | 1.609 | 2004–2009 | 47.498 |
| 2009 | 3.872 | 2009–2014 | 160.812 |
| 2014 | 2.119 | 2014–2019 | 159.678 |
| 2019 | 2.190 | 2004–2019 | 70.305 |
| Year | Coordinated Enhancement Type | Antagonistic Heating Advance Type | Running-In Heating Advance Type | Running-In Heating Hysteresis Type | Antagonistic Heating Hysteresis Type | Coordination Decline Type | ||||||
|---|---|---|---|---|---|---|---|---|---|---|---|---|
| Area (km2) | Proportion (%) | Area (km2) | Proportion (%) | Area (km2) | Proportion (%) | Area (km2) | Proportion (%) | Area (km2) | Proportion (%) | Area (km2) | Proportion (%) | |
| 2004–2009 | 207.06 | 9.13 | 217.81 | 9.60 | 432.16 | 19.06 | 514.87 | 22.70 | 514.49 | 22.68 | 381.69 | 16.83 |
| 2009–2014 | 40.68 | 1.79 | 320.67 | 14.14 | 583.57 | 25.73 | 563.61 | 24.85 | 392.63 | 17.31 | 366.92 | 16.18 |
| 2014–2019 | 36.27 | 1.60 | 782.77 | 34.51 | 676.84 | 29.84 | 366.34 | 16.15 | 218.00 | 9.61 | 187.87 | 8.29 |
| Types | Coordinated Enhancement Type | Antagonistic Heating Advance Type | Running-In Heating Advance Type | ||||||
|---|---|---|---|---|---|---|---|---|---|
| 04–09 | 09–14 | 14–19 | 04–09 | 09–14 | 14–19 | 04–09 | 09–14 | 14–19 | |
| Changping | 10.19 | 23.11 | 12.7 | 16.92 | 11.61 | 6.57 | 20.12 | 12.04 | 12.02 |
| Chaoyang | 31.14 | 25.94 | 6.35 | 20.97 | 31.12 | 16.08 | 12.39 | 24.79 | 21.27 |
| Daxing | 1.48 | 0.47 | 4.23 | 8.99 | 5.21 | 9.68 | 11.41 | 6.51 | 11.14 |
| Dongcheng | 0.00 | 8.96 | 2.65 | 0.00 | 3.23 | 3.87 | 0.13 | 2.66 | 1.36 |
| Fangshan | 1.67 | 6.13 | 12.17 | 7.84 | 1.92 | 4.34 | 8.21 | 1.48 | 9.05 |
| Fengtai | 0.84 | 9.44 | 6.88 | 5.55 | 6.82 | 16.45 | 7.28 | 7.40 | 10.60 |
| Haidian | 1.76 | 7.55 | 4.23 | 12.16 | 21.24 | 18.83 | 19.23 | 20.95 | 15.17 |
| Mentougou | 0.28 | 0.00 | 1.06 | 1.58 | 0.42 | 0.10 | 2.00 | 4.21 | 0.20 |
| Shijingshan | 0.37 | 1.89 | 1.06 | 2.73 | 3.59 | 2.04 | 4.80 | 4.24 | 2.55 |
| Shunyi | 24.19 | 8.49 | 11.64 | 11.28 | 6.22 | 5.20 | 4.31 | 5.95 | 5.87 |
| Tongzhou | 28.08 | 4.25 | 33.86 | 11.89 | 4.61 | 11.08 | 9.86 | 7.14 | 10.29 |
| Xicheng | 0.00 | 3.77 | 3.17 | 0.09 | 4.01 | 5.76 | 0.26 | 2.63 | 0.48 |
| Types | Running-in Heating Hysteresis Type | Antagonistic Heating Hysteresis Type | Coordination Decline Type | ||||||
| 04–09 | 09–14 | 14–19 | 04–09 | 09–14 | 14–19 | 04–09 | 09–14 | 14–19 | |
| Changping | 9.77 | 12.84 | 12.47 | 5.97 | 7.97 | 12.68 | 4.07 | 5.7 | 16.34 |
| Chaoyang | 16.32 | 8.78 | 16.08 | 20.18 | 14.57 | 22.18 | 29.46 | 27.88 | 45.05 |
| Daxing | 14.16 | 14.74 | 12.68 | 11.04 | 14.61 | 15.85 | 10.11 | 12.24 | 3.47 |
| Dongcheng | 0.82 | 1.06 | 0.47 | 3.02 | 1.66 | 0.35 | 5.93 | 0.26 | 0.00 |
| Fangshan | 7.72 | 11.34 | 3.98 | 3.54 | 9.09 | 5.19 | 3.87 | 3.24 | 1.74 |
| Fengtai | 10.62 | 15.02 | 9.06 | 17.57 | 18.08 | 9.86 | 19.66 | 11.14 | 4.09 |
| Haidian | 18.82 | 19.2 | 17.60 | 20.36 | 14.47 | 18.40 | 15.84 | 4.60 | 10.21 |
| Mentougou | 2.39 | 0.24 | 7.23 | 0.75 | 0.15 | 0.35 | 0.25 | 0.52 | 0.00 |
| Shijingshan | 4.03 | 3.95 | 9.22 | 5.00 | 2.83 | 5.28 | 2.46 | 3.50 | 2.35 |
| Shunyi | 4.58 | 3.47 | 6.29 | 3.10 | 5.23 | 5.19 | 0.91 | 10.36 | 9.19 |
| Tongzhou | 9.06 | 7.25 | 4.56 | 4.47 | 9.19 | 4.67 | 3.52 | 20.35 | 7.56 |
| Xicheng | 1.71 | 2.11 | 0.36 | 5.00 | 2.15 | 0.00 | 3.92 | 0.21 | 0.00 |
| Year | Correlation Coefficient 1 | Standard Deviation Elliptic Parameter | ||
|---|---|---|---|---|
| Center of Inertia (NTL, LST) | Azimuth (°) | Oblateness | ||
| 2004 | 0.425 ** | (0.199, 0.478) | 50.531 | 0.370 |
| 2009 | 0.211 ** | (0.265, 0.498) | 75.837 | 0.357 |
| 2014 | 0.354 ** | (0.231, 0.443) | 48.094 | 0.311 |
| 2019 | 0.427 ** | (0.264, 0.453) | 59.444 | 0.403 |
| Year | Bivariate Autocorrelation 2 |
|---|---|
| 2004 | 0.403 (100.9594) *** |
| 2009 | 0.192 (50.6277) *** |
| 2014 | 0.321 (82.8475) *** |
| 2019 | 0.354 (92.3110) *** |
Publisher’s Note: MDPI stays neutral with regard to jurisdictional claims in published maps and institutional affiliations. |
© 2022 by the authors. Licensee MDPI, Basel, Switzerland. This article is an open access article distributed under the terms and conditions of the Creative Commons Attribution (CC BY) license (https://creativecommons.org/licenses/by/4.0/).
Share and Cite
Li, Z.; Wu, F.; Ma, H.; Xu, Z.; Wang, S. Spatiotemporal Evolution and Relationship between Night Time Light and Land Surface Temperature: A Case Study of Beijing, China. Land 2022, 11, 548. https://doi.org/10.3390/land11040548
Li Z, Wu F, Ma H, Xu Z, Wang S. Spatiotemporal Evolution and Relationship between Night Time Light and Land Surface Temperature: A Case Study of Beijing, China. Land. 2022; 11(4):548. https://doi.org/10.3390/land11040548
Chicago/Turabian StyleLi, Zhe, Feng Wu, Huiqiang Ma, Zhanjun Xu, and Shaohua Wang. 2022. "Spatiotemporal Evolution and Relationship between Night Time Light and Land Surface Temperature: A Case Study of Beijing, China" Land 11, no. 4: 548. https://doi.org/10.3390/land11040548
APA StyleLi, Z., Wu, F., Ma, H., Xu, Z., & Wang, S. (2022). Spatiotemporal Evolution and Relationship between Night Time Light and Land Surface Temperature: A Case Study of Beijing, China. Land, 11(4), 548. https://doi.org/10.3390/land11040548