Abstract
Enhanced soil’s magnetic susceptibility reflects particles of anthropogenic/natural origin; therefore, it can be utilized as an indication of soil contamination. A total of 51 different land-use soil samples collected from Greater Cairo, Egypt, were assessed integrally using potentially toxic elements content (PTEs), magnetic susceptibility, and statistical and spatial analysis. PTE concentrations were compared to the world average, threshold, and screening values set by literature. Various environmental indices were estimated to assess soil contamination with these elements. Spatial distribution maps of PTEs and environmental indices were constructed to provide decision makers with a certain identification of riskier areas. In general, the concentrations of the analyzed PTEs showed variation with land-use types and follows a pattern of: Industrial > Agricultural > Urban. The distribution of PTEs in Greater Cairo was influenced by several anthropogenic sources, including traffic emission, industrial activity, and agricultural practices. The measured magnetic susceptibility values indicate magnetically enhanced soil signals dominated by multi-domain or pseudo-single-domain superparamagnetic particles of anthropogenic origin. A significant association was observed between magnetic susceptibility values and Co, Cr, Cu, Ni, and V, and the calculated environmental indices. It can be concluded that magnetic susceptibility is of proven effectivity in the assessment of soil contamination.
1. Introduction
Soil represents the ultimate target and sinks for possible contaminants such as potentially toxic elements (PTEs) dispersed in various environmental compartments by human activities [1,2]. Soil contamination with PTEs is significantly increasing over the world and associated with massive urbanization and uncontrolled agricultural and intensive industrial activities [3,4,5,6,7,8]. Recently, assessment of PTE contamination in the soil of different land-use types has received growing attention since it has been related to several serious environmental problems [9,10,11,12]. Moreover, transfer and bioaccumulation of soil PTEs to cultivated crops can pose a frightening risk to human health through the food chain [13,14,15,16]. Many health-related problems were linked to overexposure to PTEs [10,17,18].
Remediation of contaminated soils is crucial, and research is continuing to develop novel, science-based remediation techniques. Chemical, physical, thermal remediation, and bioremediation (phytoremediation and microbial degradation) have been examined and recommended [19,20,21]. Monitoring and risk-assessment approaches are comparable worldwide and are intended to help identify and evaluate whether natural or anthropogenic inputs are responsible for soil contamination, and the extent to which that contamination is posing a risk to the environment and to human health [1,22]. Many effective integrated monitoring strategies have been used in assessment of soil contamination with PTEs, such as chemical measurements, magnetic susceptibility, multivariate analysis, geostatistical treatment, remote sensing, geographic information system (GIS), chemometric tools for data interpretation, and geographical detector methods [23,24].
Easily measured and cost-effective magnetic properties (susceptibility) are extensively used to identify and trace pollution of anthropogenic origin in various environmental samples including soils, dust, and sediments [25,26,27,28,29,30], and biomass such as tree leaves, bark, moss, and lichens [31,32,33,34,35]. A clear relationship between the soil magnetic susceptibility and the contents of PTEs is observed and provides evidence in regions influenced by industrial emissions or close to urban centers [27,29,36,37].
In Egypt, like in most developing African countries, environmental management legislation often lags behind uncontrolled human activity. Continuous urbanization and industrial development of the Nile Delta region have caused a considerable increase in PTE contamination of the limited fertile soil, creating a potential health risk of vast proportions [6,38]. To alleviate the stress on limited soil resources, considerable Egyptian efforts have been made in the field of improvement of soil fertility [39] and soil remediation [40,41,42]. There are few studies in Egypt using magnetic and chemical analysis techniques as parameters for assessment of soil contamination [43,44]. Therefore, the aims of the present study are to: (1) delineate the relative degree of contamination of different land-use soil in the study area to help identify potential sources of PTE contaminations; (2) investigate the soil magnetic susceptibility; (3) explore the relationship between soil contamination and magnetic susceptibility, and; (4) provide sustainable management suggestions to decision makers.
2. Materials and Methods
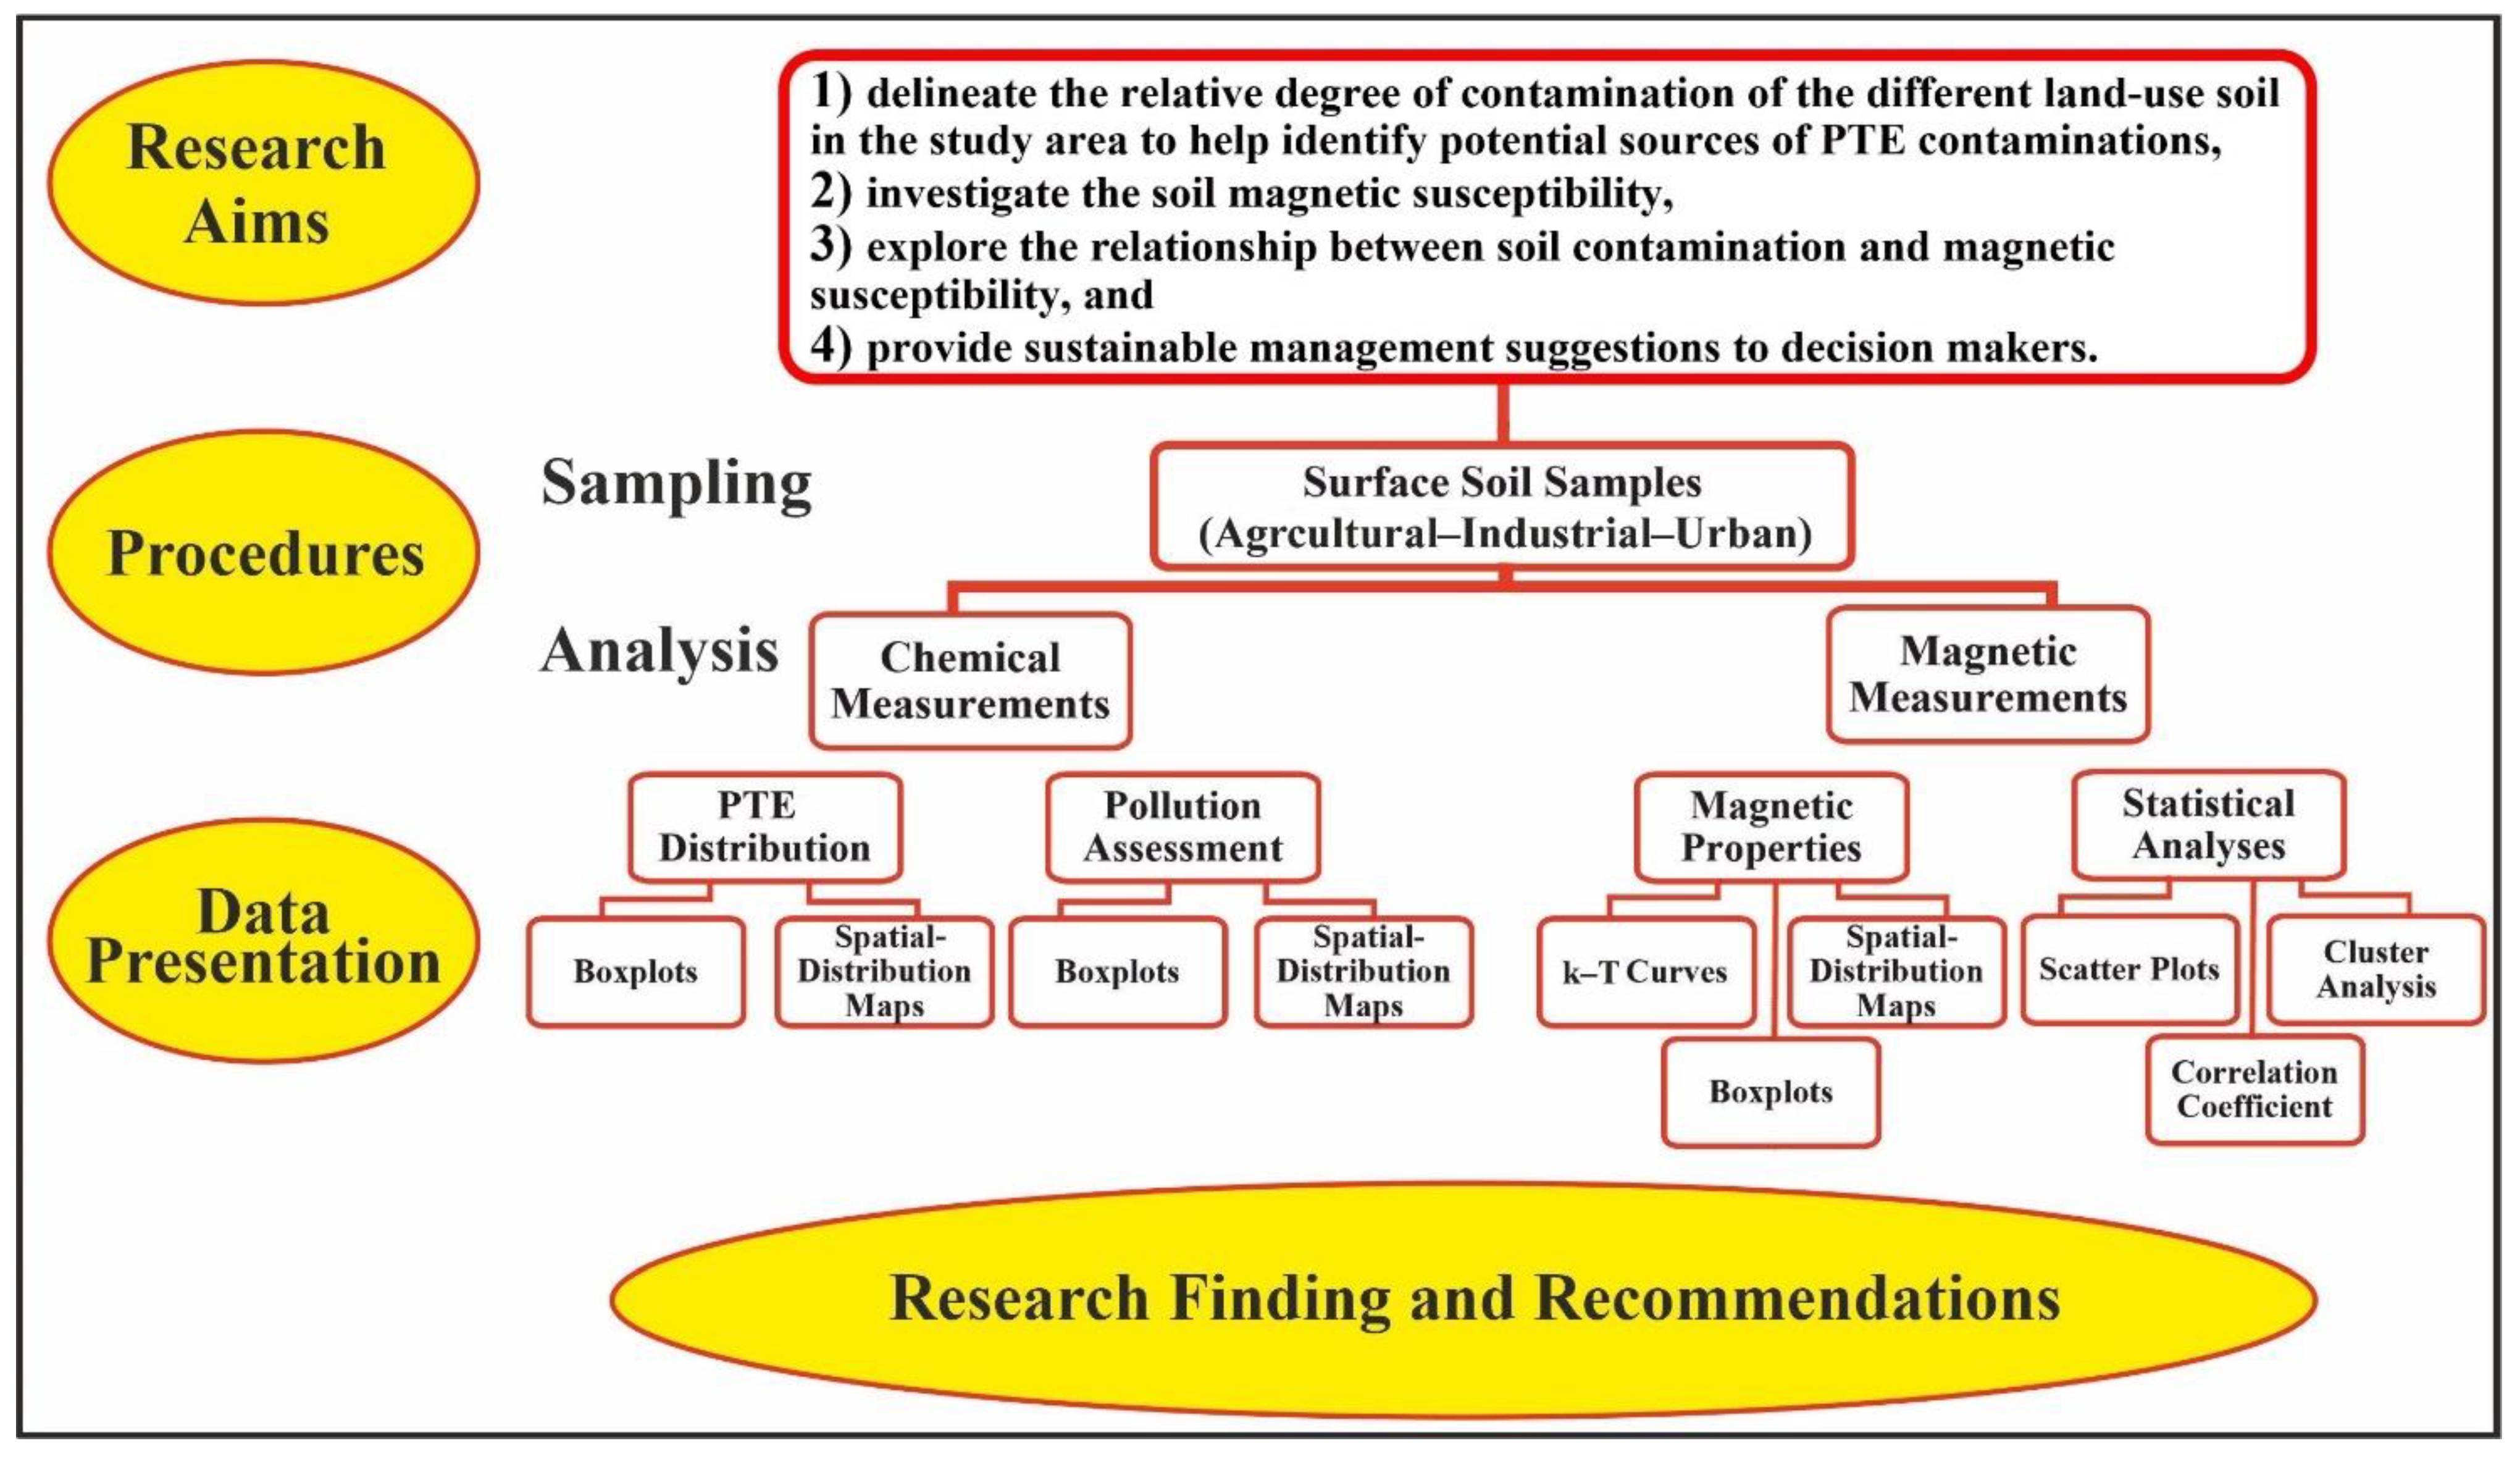
To specify and sketch out research aims, procedures, and the approach, a conceptual model is designed as a guide to the main steps outlined in this study (Figure 1).
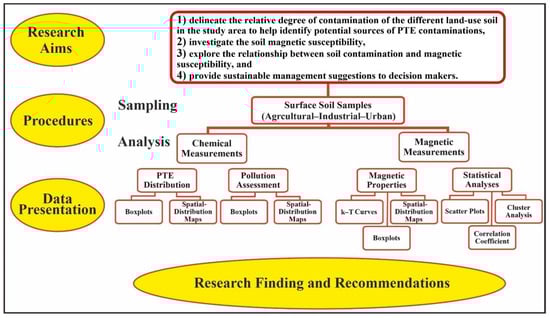
Figure 1.
A conceptual model representing research aims and main steps.
2.1. The Study Area
The study area is located in the southern part of the Nile Delta (Figure 2). The area is located between 29.8° and 30.35° N and between 31.16° and 31.46° E, and represents about 1925 km2 including Cairo city and its vicinities. The study area has a typical Mediterranean climate (arid to semi-arid), which is characterized by hot dry summers and warm winters, with scarce rainfall.
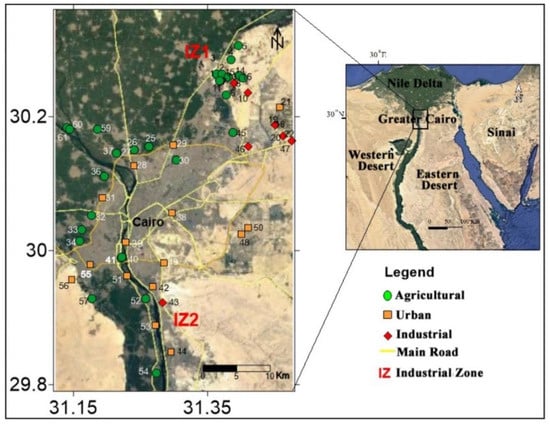
Figure 2.
Map displaying the study area and sampling sites.
In addition to agricultural and urban areas, this area contains two major industrial zones, IZ1 and IZ2 (Figure 1). These zones contain numerous factories including a lead factory, porcelain factory, fertilizer factory, iron smoker, and metallurgical industries (IZ1), and a cement factory, chemical industries factory, engineering industries factory, and machinery equipment factory (IZ2). Moreover, it has been an important transportation hub with a lot of the densest highway networks in Egypt.
Farmers in several sections of the Nile Delta apply excessive amounts of agrochemicals (pesticides and fertilizers) to help maximize crop yields without regard to the risks that may arise from these practices [45]. Major types of applied fertilizers in Egypt include urea, ammonium sulphate, ammonium nitrate, calcium nitrate, single and concentrated superphosphate, potassium sulphate, and potassium chloride [46,47]. Furthermore, farmers employ drainage water (agricultural drainage, industrial, and household wastewater) to overcome the scarcity of clean water resources [48].
As a part of the Nile Delta, the study area was completely covered with Quaternary sediments that typically comprise alluvium deposits (Aridisol and Entisol) formed through sedimentation processes by the Nile River as a result of repeated flooding through geologic time. Different weathering processes (physical, chemical, and biological) played a key role in forming the present Nile Delta alluvium deposits from the hard rocks of the Ethiopian Highlands [49]. The Nile Delta is marked by moderately alkaline deposits rich with organic matter, nutrients, clay, and silt, and usually classified as silty clay and clayey soil [49,50,51].
2.2. Sampling and Samples Preparation
A total of 51 sites were selected to obtain surface soil samples (0–5 cm) (Figure 2), representing different land uses in Greater Cairo; agricultural, urban, and industrial. The sample’s locations were determined using a Garmin GPS instrument. Samples were collected in the summer of 2020 and compiled in the winter of 2021, avoiding places with macro-magnetic objects, such as iron debris (nails, wires, etc.) and waste material. Soil samples were air-dried, carefully mixed, homogenized, and divided into smaller amounts to be representative for further chemical analysis, and magnetic measurements.
2.3. Chemical Analyses
The absence of international consensus on a unique digestion method prevent us to interpret the data in the same way all over the world. The accurate method of characterizing soil contamination in common is to determine total PTE concentrations (using strong acids, HNO3, HClO4, and HF), especially when the analyzed elements are critically compared to international standards such as background values used in different pollution indices and human health risk-assessment methodology, which are based on total PTE concentrations [2,3,4,9,11,12,13,14,52,53,54].
The chemical analyses were performed using the ICP-MS technique in ACME Lab, Vancouver, Canada (ISO 17025 and ISO/IEC 17025). The PTE concentrations were determined as total concentrations after acid digestion. Pulverized samples (0.25 g) were digested in open vessels on a hot plate using a combination of HNO3, HClO4, and HF to dissolve the silicate minerals. Samples were heated to fuming and taken to dryness and the residue was dissolved in HCl [55].
2.4. Magnetic Measurements
Samples for laboratory magnetic measurements were wrapped in a 10 cm3 cylindrical plastic vessel. Volume-specific (k) mass-specific (χ) magnetic susceptibility measurements were performed using an Agico MFK1-FA Kappabridge device at room temperature at Geomagnetism Laboratory, National Research Institute of Astronomy and Geophysics (NRIAG), Helwan, Cairo, Egypt. Magnetic susceptibility was measured at low field (200 A/m) applying two frequencies (976 and 15,616 Hz).
Variation of the magnetic susceptibility (k) as a function of temperature (T °C) was measured using an Agico MFK1-FA Kappabridge device with a CS4 temperature furnace for continuous heating from room temperature to 700 °C in an air atmosphere. These variations were presented in k–T curves to check possible changes in magneto-mineralogy in the analyzed samples.
The percentage frequency-dependent susceptibility values were calculated using Equation (1) [56].
2.5. Pollution Assessment
Single pollution indices such as Enrichment Factor (EF) [57] and Geo-accumulation index (Igeo) [58,59] were calculated to quantify anthropogenic inputs of each element above its natural levels in the study-area soils. Furthermore, integrated pollution indices such as Improved Nemerow’s Pollution Index (Pn) [60], Pollution Load Index (PLI) [61,62], and Potential Ecological Risk Index (PERI) [61] were calculated to conduct an integrative assessment of soil ecosystem quality in every sampling site and evaluate the potential ecological risks posed by the PTE contamination considering multi-element contamination. The formulae used for calculating the various single and integrated indices are summarized in Table S1 (in Supplementary Materials).
Background values usually represent the basis for precisely differentiating between the natural concentration of chemical elements and their elevated concentrations with an anthropogenic impact. Dealing with soil contamination with PTEs, researchers have usually employed several background values such as national background values [2,7,8,14], world average shale [4,15,57,60], and average concentration in the earth’s crust [1,5,6,51,63].
A national Egyptian background concentration for PTEs in soil and soil quality guidelines has yet been unestablished. Due to the long-time duration of anthropogenic activities in the Nile Valley and its Delta, it is injudicious to consider the soils of any part of the Nile Valley as virgin with respect to soil pollution. The Quaternary sediments covering the Nile Delta originated from the weathering of different rock types. Therefore, the average composition of the upper continental crust [64] will be correctly taken as the background value. Worldwide average soil [65] and the European Union maximum Pollution Limit (MPL) of PTEs in agricultural soil [66] will be considered as threshold and screening values.
2.6. Statistical Treatment
Sampling locations and spatial distribution maps of PTEs in the study area were presented using Google Earth and Surfer software (version 13). Descriptive statistics and boxplots were presented by OriginLab (version OriginPro 2021). Bivariate X–Y plots with the coefficient of determination R2 of linear fit were calculated and illustrated by OriginLab. Multivariate statistical analyses such as Pearson Correlation Coefficient (PCC) and R mode Hierarchical Cluster Analysis (HCA) were determined by using SPSS (version 21). Bivariate and multivariate statistical analyses were calculated to define the correlations between assorted PTE pairs and interrelationship between PTE levels and major elements (Al, Fe, Mn, Ti), and measured magnetic susceptibility in the considered soil samples.
3. Results
3.1. PTE Distribution
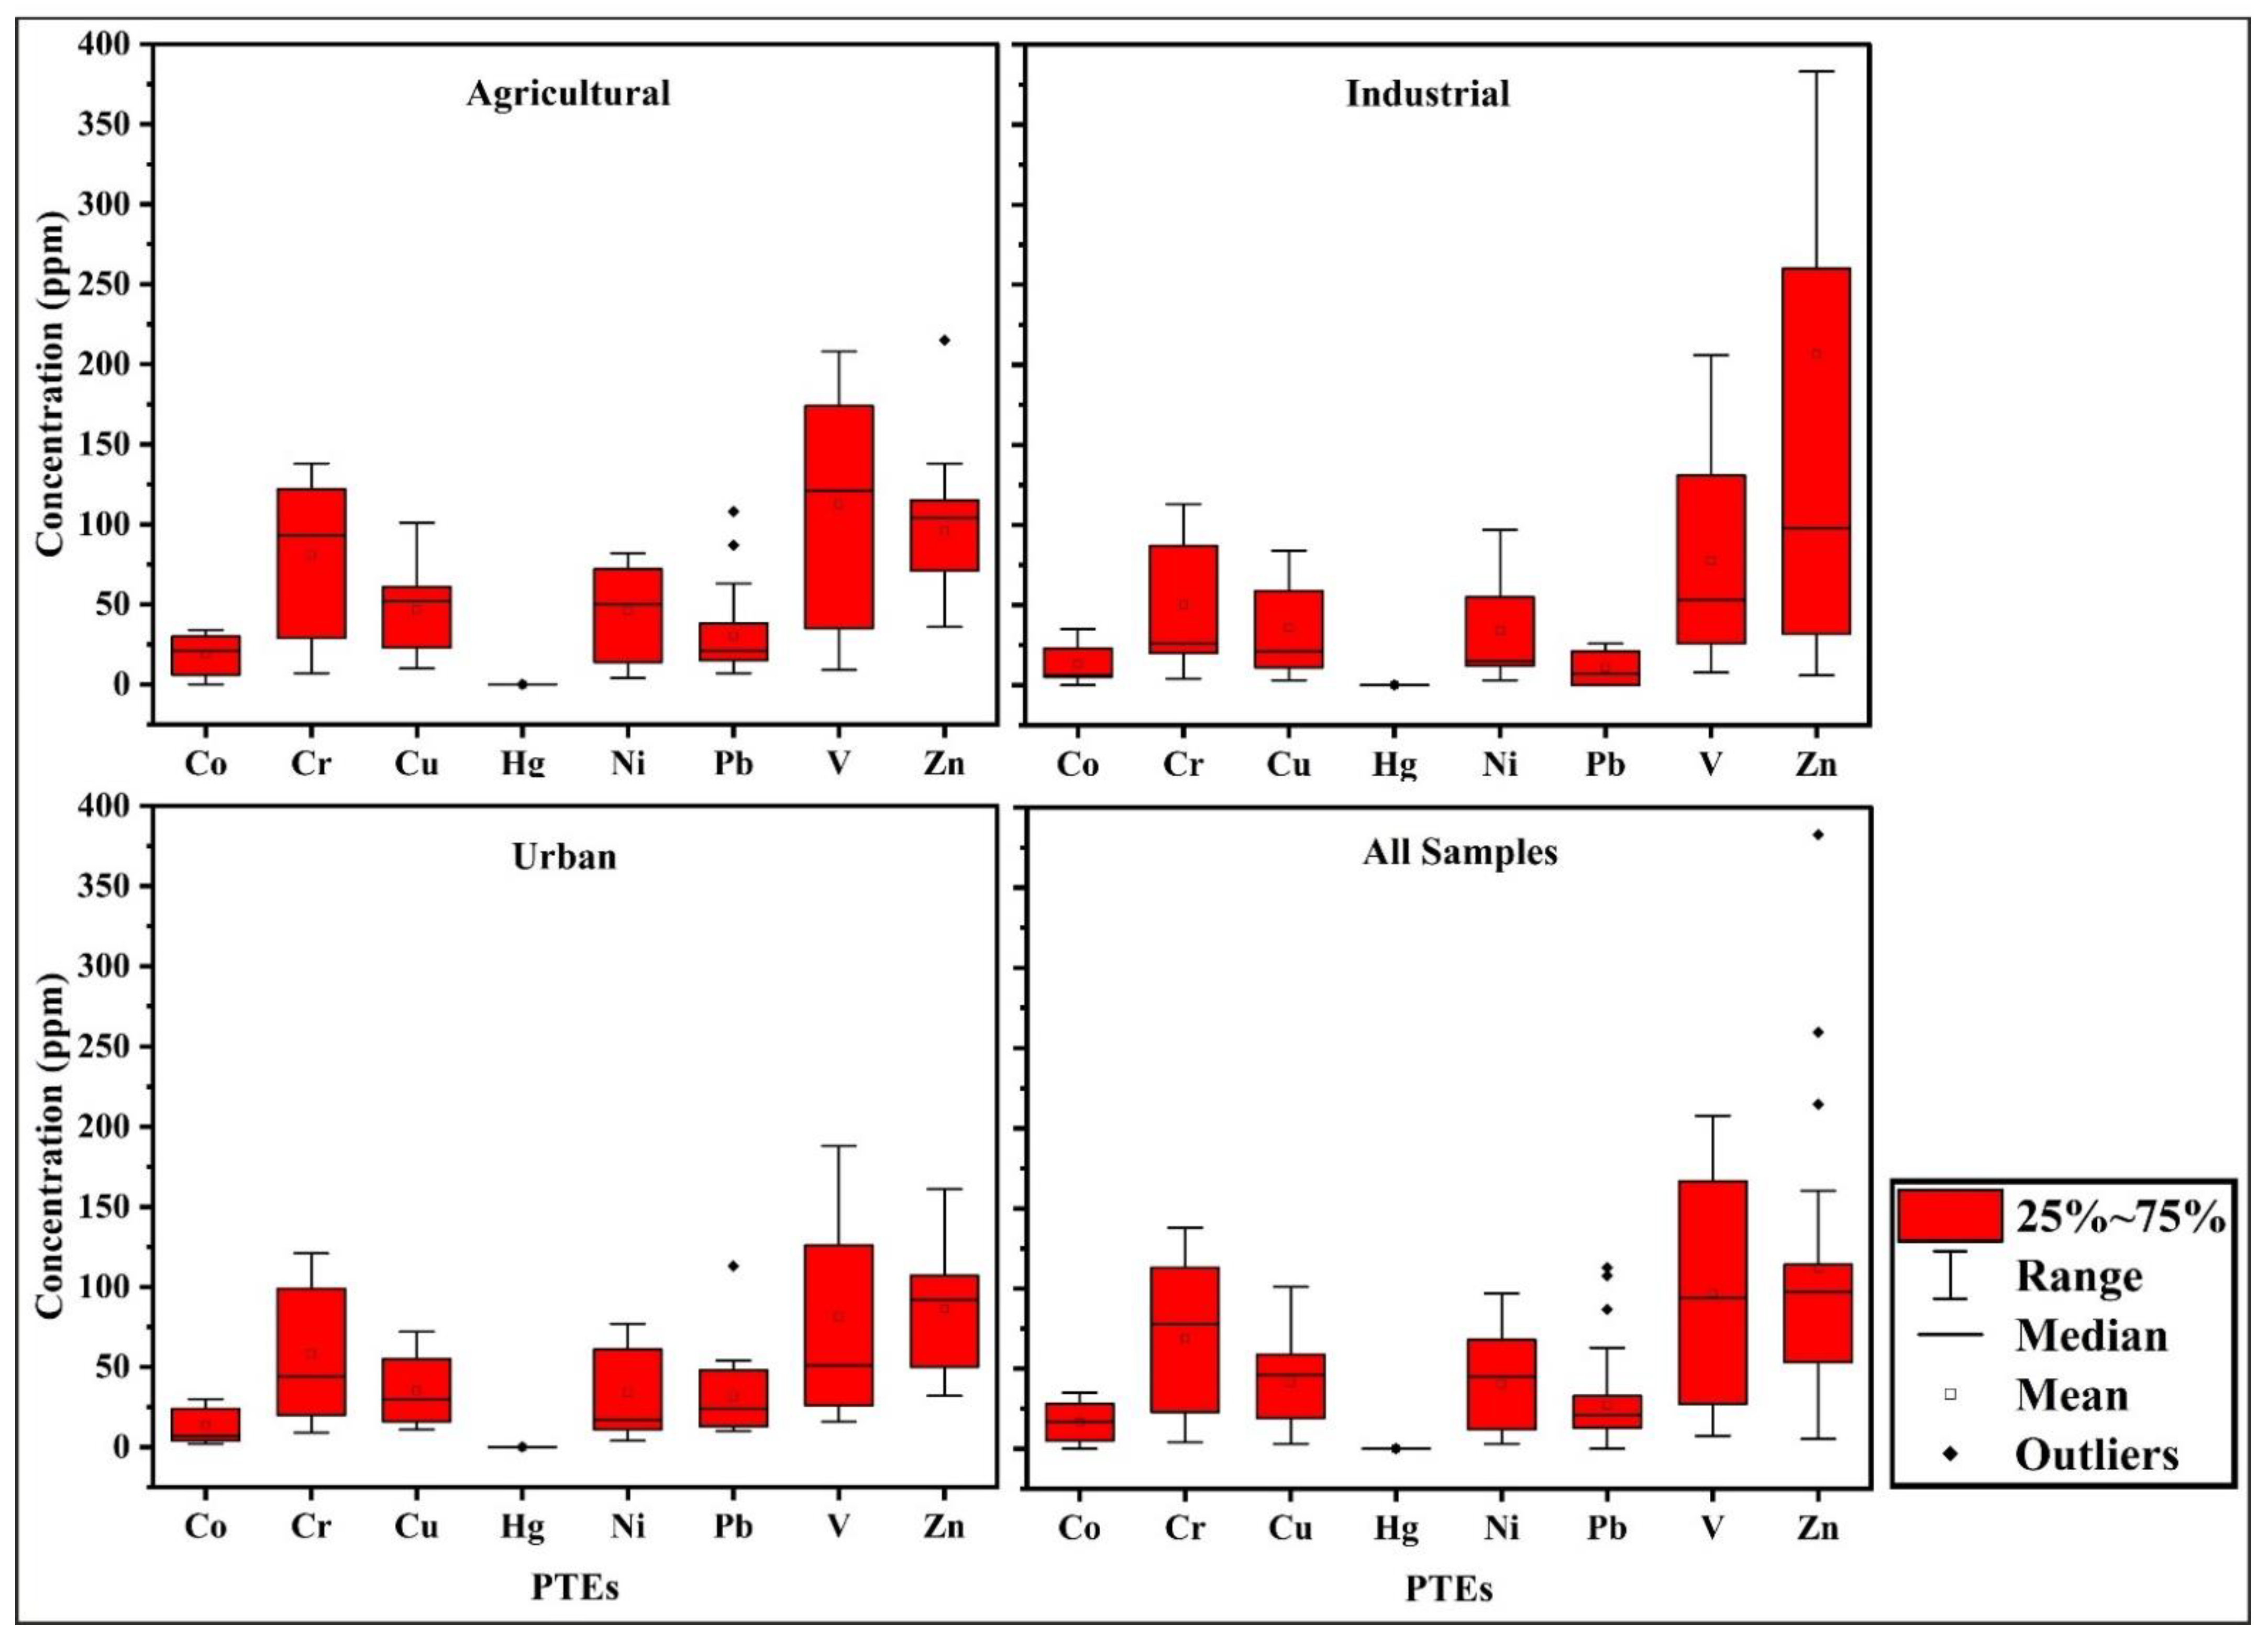
The concentrations and descriptive statistical parameters (minimum, maximum, mean, and standard deviation) of the measured PTEs and some major elements (Al, Fe, and Mn) in the analyzed samples are summarized in Table 1. V and Zn were recorded in the highest concentrations, and at the same time Hg had the lowest concentrations in all land-use soil samples. In general, the concentrations of Co, Cr, Cu, Hg, Ni, Pb, V, and Zn ranged from 0.0 to 35, 4–138, 3–101, 0.0–0.19, 3–97, 0–113, 8–208, and 6–899 ppm, respectively. The mean concentrations of these PTEs followed the order V > Zn > Cr > Cu > Ni > Pb > Co > Hg, Zn > V > Cr > Cu > Ni > Co > Pb > Hg, and Zn > V > Cr > Cu > Ni > Pb > Co > Hg in agricultural, industrial, and urban soil, respectively (Table 1 and Figure 3).

Table 1.
Descriptive statistics of PTEs (ppm) in different land-use soil.

Figure 3.
Boxplots of PTE concentrations in different land-use soil.
Comparing the obtained results with the world soil average [65] (Table 1), Co, Cr, Cu, Ni, Pb, V, and Zn concentrations surpassed this average in 56.8%, 56.8%, 50.9%, 56.8%, 25.5%, 35.3%, and 64.7% of the considered samples, respectively. This indicates that the PTE distribution may be adversely affected by anthropogenic activities in varying degrees. Comparing with the threshold values for soil quality [66] (Table 1), Co, Cr, Cu, Ni, Pb, V, and Zn indicated elevated levels above these values in 45.1%, 29.4%, 2.0%, 43.1%, 7.8%, 49.0%, and 7.8% of the considered samples, respectively. This indicates a potential contamination risk relating to soil quality and demands urgent consideration in future in this area. Concerning MPL in agricultural soil [66] (Table 1), all values collected in this study for the measured PTEs were less than the MPL, except for V and Zn, which surpassed that level in 27.5% and 5.8% of the considered samples, respectively.
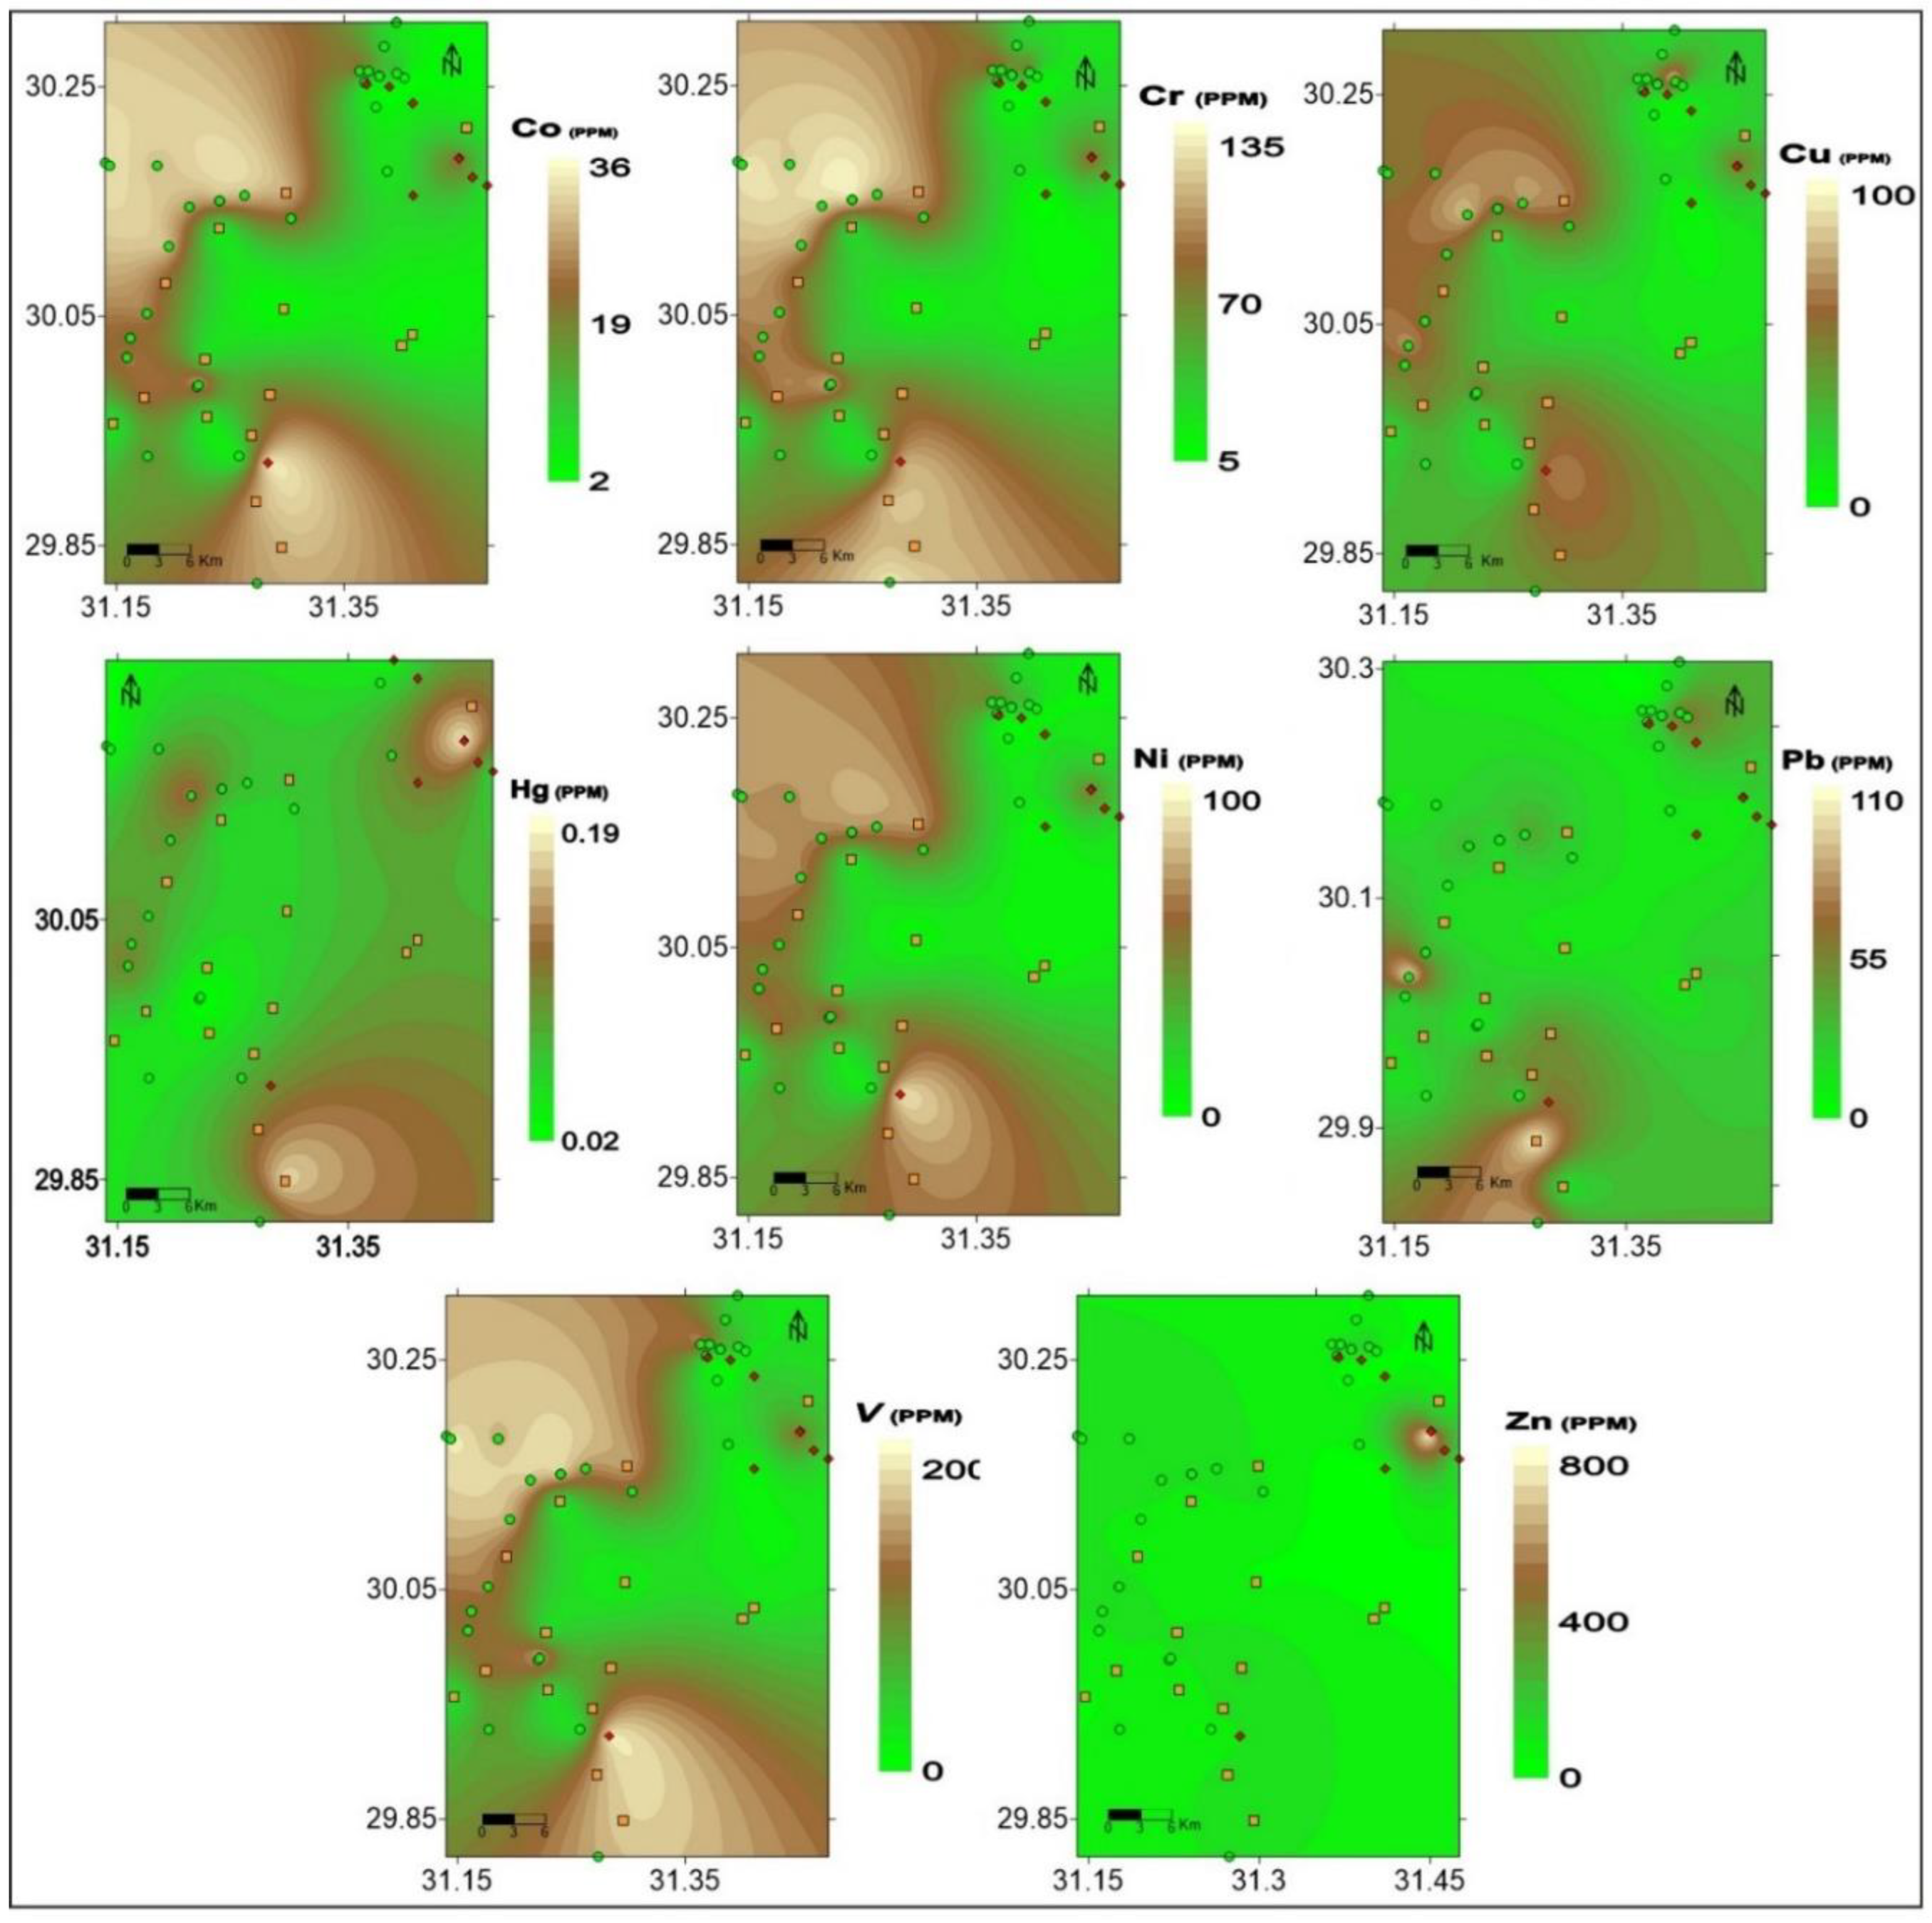
Spatial distribution maps presented in Figure 4 provide a comprehensive illustration of the concerned PTE distribution over the study area. These maps clearly indicate that the PTEs’ intensive concentrations are recorded around or near industrial zones (Figure 1). These results obviously indicate an influence of anthropogenic activities on PTEs (Co, Cr, Cu, Ni, Pb, V, and Zn) contamination in the study area. Such influence is most likely associated with industrial activities, intensive urbanization, and agricultural activity. The Co, Cr, Ni, Pb, and Zn enhanced concentrations in soil may be mainly derived from traffic congestion, fuel consumption, and coal combustion [8,13,15,67,68]. Equally, soil can be contaminated with Co, Cr, Cu, Ni, Pb, V, and Zn from industrial activity via atmospheric deposition [3,4,6,8,20,68]. Agricultural soils can be contaminated with Co, Cr, Cu, Ni, Pb, and Zn through misuse of pesticide (herbicides, insecticides, and fungicides), intensive surface application and spraying of chemical fertilizer, organic manure, the reuse of agricultural drainage water, discharging of industrial effluents into irrigation waterways, and reuse of treated wastewater [11,19,51,65,68,69,70,71].

Figure 4.
Spatial distribution of PTEs.
3.2. Metals Contamination and Ecological Risk
The EF values have been calculated to assess the anthropogenic impacts on the PTEs in the considered soil samples and presented in Figure 5. The majority of EF values of the measured PTEs have shown moderate enrichment (EF = 2–5). Some samples recorded high EF values (5–20) for Cr, Cu, Hg, Pb, and Zn, showing significant enrichment, suggesting that these elements are probably enriched through anthropogenic activities.
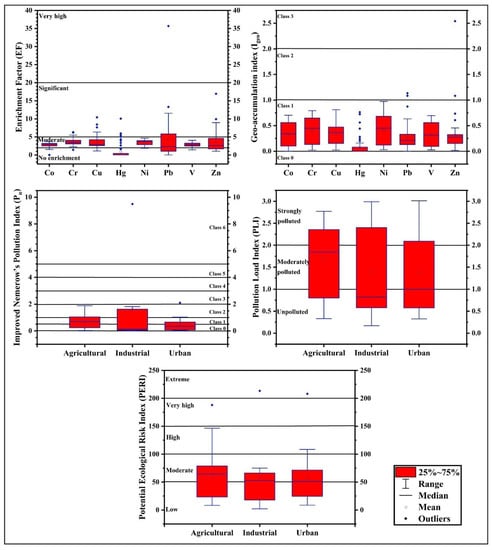
Figure 5.
Boxplots of EF, Igeo, Pn, PLI, and PERI values.
Igeo values are shown in Figure 5. In the current study, most of the calculated Igeo values were found between 0 and 1 (class 1) [59], which indicates almost uncontaminated to moderately contaminated soil. Igeo values of Pb in some soil samples were between 1 and 2 (class 2), indicative of moderately contaminated soil. Igeo values of Zn in one sample were found between 2 and 3 (class 3), which indicates moderately to heavily contaminated soil.
However, the EF and Igeo are considered as single-element contamination indices and fail to accurately reflect the comprehensive contamination for all PTEs of each sampling site. In this regard, integrated multi-element contamination indices such as Pn, PLI, and PERI were required in order to adequately evaluate the PTEs-contamination level over the investigated area [51,60,72].
The calculated values of Pn for each land use are presented in Table 2 and Figure 5. Pn values for agricultural and urban samples are between 0 and 1 (class 0 and 1) [60], which means that these soils are practically uncontaminated and uncontaminated to moderately contaminated, except for one urban soil sample of moderately contaminated class. On the other hand, Pn values for industrial soil show a broad range of contamination from 0 to > 5 (class 1 to 7).
Table 2.
Descriptive statistics of Pn, PLI, and PERI values in different land-use soil.
The calculated Cf-based PLI values for the three land-use soil samples (Table 2; Figure 5) show a wide range of contamination from unpolluted to strongly polluted. The results of PERI and risk levels for the measured PTEs in different land uses are shown in Table 2 and Figure 5. In terms of PERI, the agricultural, industrial, and urban soil samples were a low and moderate risk. Some samples of different land uses recorded high risk levels. As expected, the areas of high PTEs-contamination levels also show elevated PERI level.
The spatial distributions maps of Pn, PLI, and PERI in Greater Cairo soil samples are shown in Figure 6. These maps are of profound importance, providing decision makers a certain identification of riskier areas.
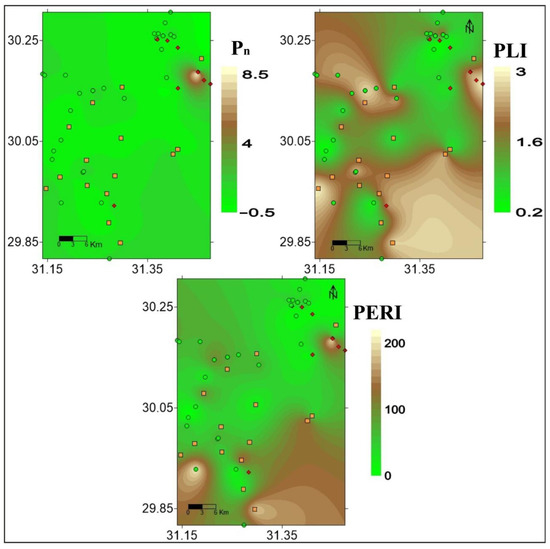
Figure 6.
Spatial distribution of Pn, PLI, and PERI values.
3.3. Magnetic Properties
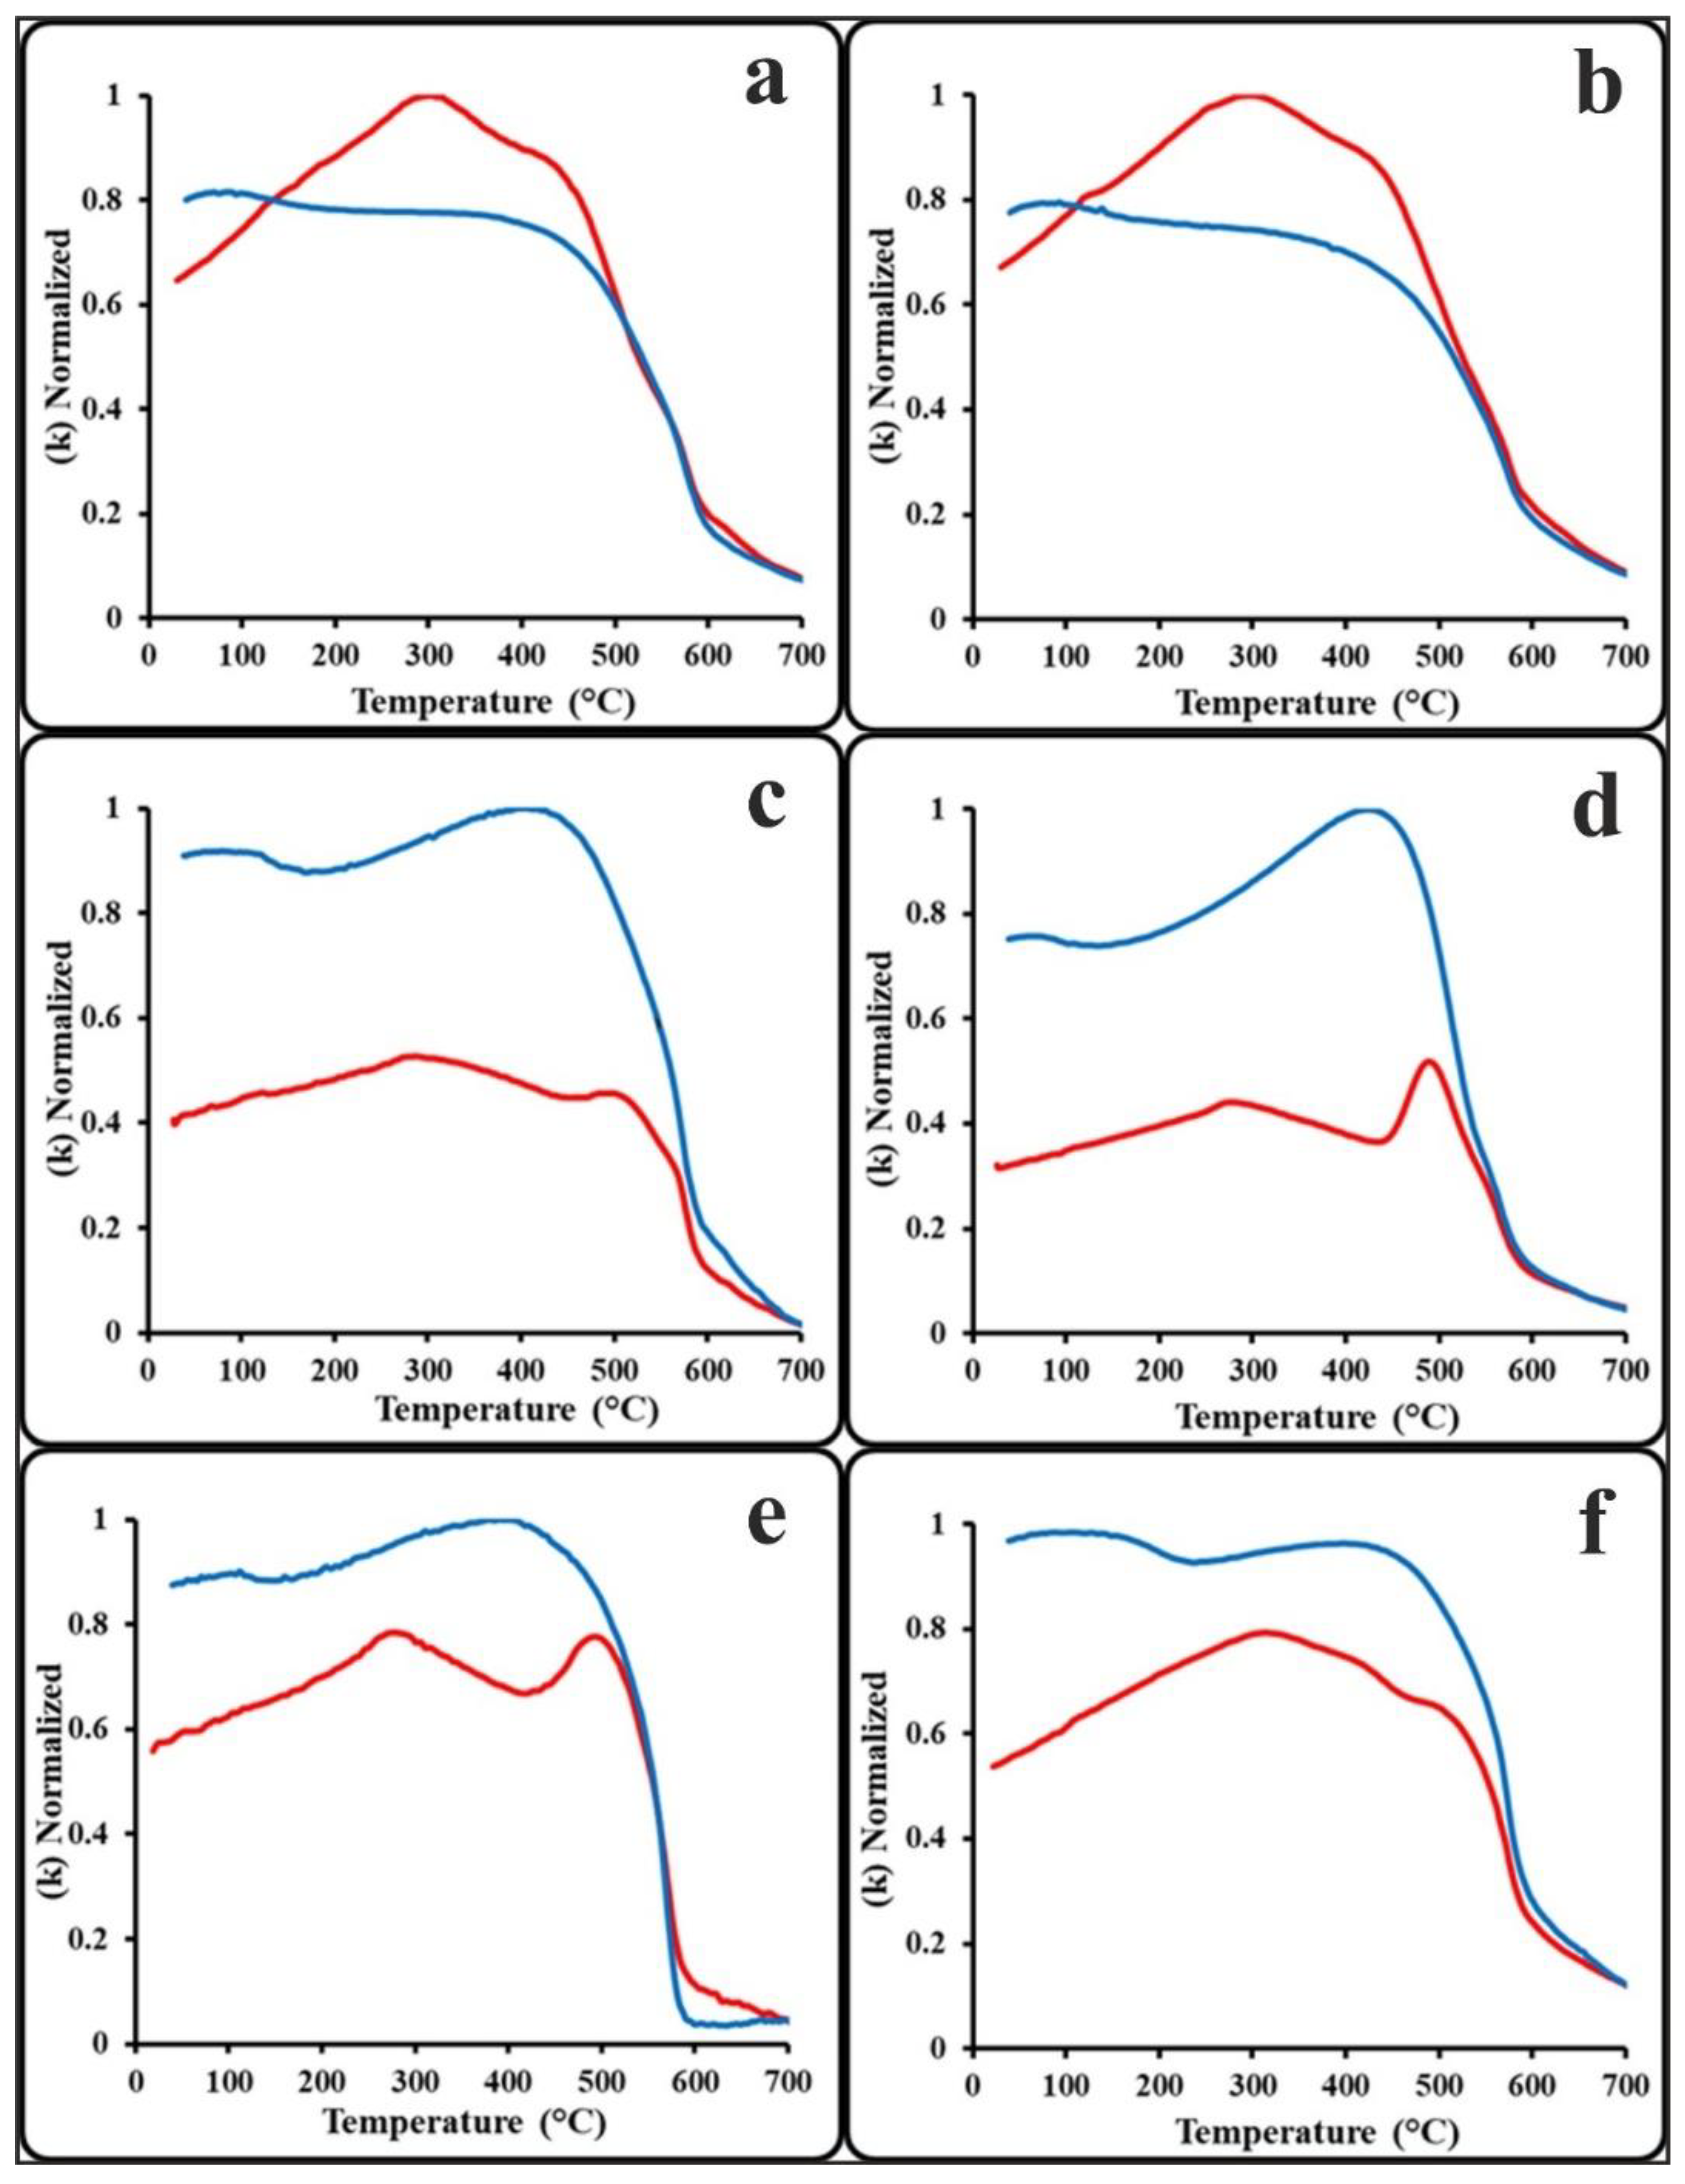
Magnetic susceptibility of soils is due almost solely to Fe (and Ti-substituted) oxides. Investigated soil samples exhibited clear differences regarding the concentration of magnetic carriers between the different land-use soil. Agriculture soil samples were characterized by fairly reversible heating and cooling curves during thermomagnetic susceptibility (k–T) cycles indicating titanomagnetite (Fe2+(Fe3+,Ti)2O4) as the main carrier of magnetization in these soils (Figure 7a,b). The thermomagnetic susceptibility curves of these soil samples showed three Tc of 350 °C, 580 °C, and 680 °C, indicating that titanomagnetite, magnetite (Fe3O4), and hematite (α-Fe2O3) dominate their magnetic properties. On the other hand, industrial and urban soil samples were characterized by strong reversible heating and cooling cycles (k–T curves) (Figure 7c–f) typical for multi-domain (MD) magnetite, which, despite the masking effect of newly formed magnetite, confirms the existence of magnetite in the original samples.
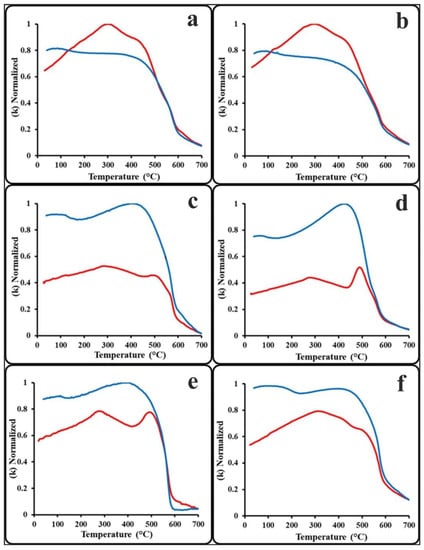
Figure 7.
Thermomagnetic analysis (k–T curves) of representative soil sample for different land uses: agricultural (a,b), industrial (c,d), and urban (e,f); heating curve (red), cooling curve (blue).
The bulk magnetic susceptibility values (k) range between 0.15 and 3.56 × 10⁻³, 0.21–3.42 × 10⁻³, and 0.15–3.56 × 10⁻³ for agricultural, industrial, and urban soil samples, respectively. Likewise, the mass-specific magnetic susceptibility (χ) ranges between 0.17 and 6.18 × 10⁻⁶, 0.24–6.12 × 10⁻⁶, and 0.17–6.18 × 10⁻⁶ m3/kg for agricultural, industrial, and urban soil samples, respectively (Table 3; Figure 8a). The measured magnetic susceptibility values indicate magnetically enhanced soil signals. k and χ show nearly the same distribution over Greater Cairo (Figure 8b).
Table 3.
Descriptive statistics of k, χ, and χfd% values in different land-use soil.
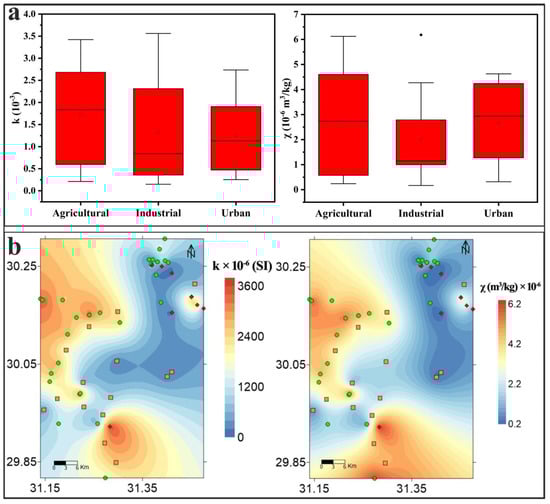
Figure 8.
Boxplots of k and χ values (a); Spatial distribution of k and χ values (b).
Most of the investigated samples (92%) exhibited χfd% values < 5%, suggesting that the multi-domain or pseudo-single-domain superparamagnetic particles were dominant, and the absence of ultra-fine superparamagnetic particles (several to tens of nanometers) of pedogenic origin [56]. However, some samples of agricultural and urban soil exhibited χfd% > 5%. Pedogenic influence of superparamagnetic particles should not be excluded in these samples [56,73].
3.4. Statistical Analyses
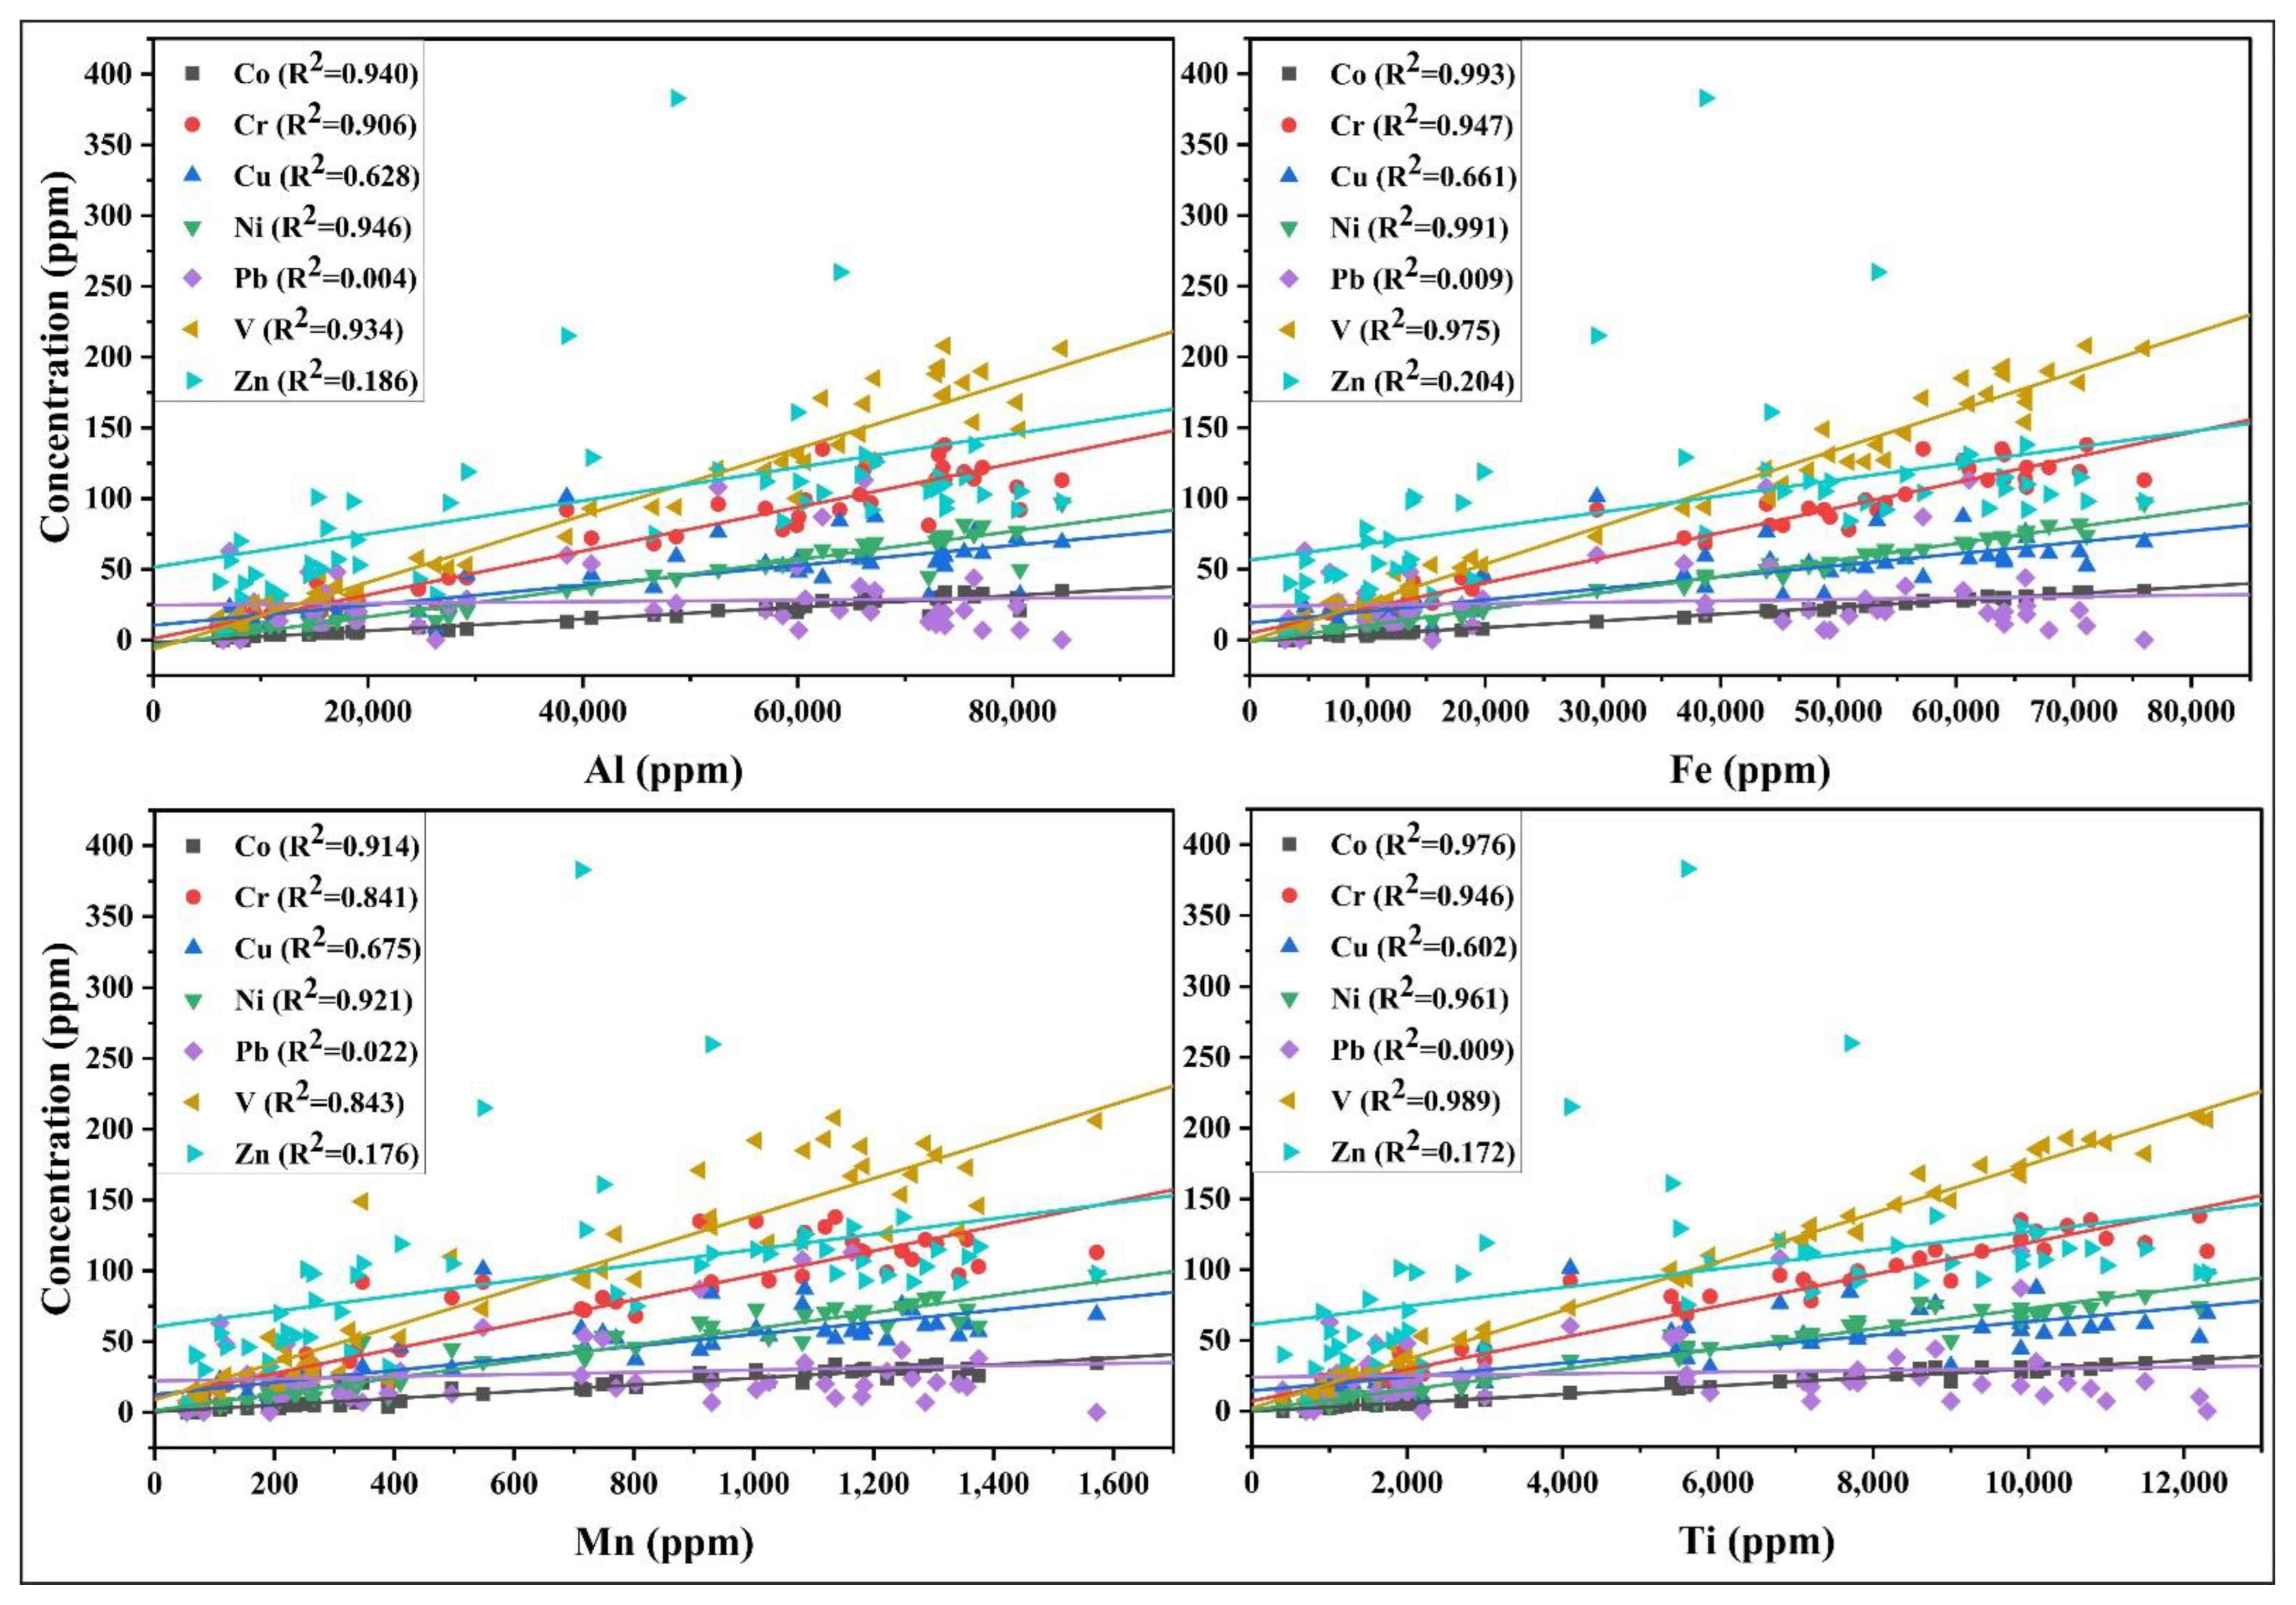
Bivariate regression fitted scatter plots between the major and minor elements (Al, Fe, Mn, and Ti) and the PTEs are illustrated in Figure 9. As it turned out, there were significant positive linear relationships between Al and each of Co (R2 = 0.940), Cr (R2 = 0.905), Cu (R2 = 0.628), Ni (R2 = 0.946), and V (R2 = 0.934). Next to silicon, aluminum represents the main element in clay minerals. The observed association between Co, Cr, Cu, Ni, and V with Al indicates that clay minerals play a significant role in the distribution of these PTEs [51]. Al-oxides and Al-bearing phyllosilicates have high affinities for some PTEs such as Co, Cu, Cr, Ni, Pb, and Zn [74,75,76]. Findings using in situ molecular-scale technique indicate that Co, Cu, Ni, Pb, and Zn in soil may be strongly adsorbed on the edge sites of phyllosilicates minerals due to the presence of −SiOH or −AlOH groups [75,76]. Furthermore, other positive linear relationships existed between Co, Cr Cu, Ni, and V and Fe, Mn, and Ti, indicating the effect of these scavenger major elements in their distribution. In addition, there were weak positive linear relationships between Zn and Al, Fe, Mn, and Ti. Furthermore, there were unusually weak linear relationships between Pb and Al, Fe, Mn, and Ti. Fe/Mn oxides (hydroxides and oxyhydroxides) are ubiquitous mineral particles in soil. Sufficient evidence was recorded for an intimate association of several PTEs with Fe/Mn oxides in soil assuming that these oxides act as main reservoirs for PTEs and affect their dynamics in soils. For example, the average proportions of Co, Cu, Ni, Pb, and Zn occluded in Mn/Fe oxides in soils are 55, 58, 55, 43, and 57%, respectively, as indicated by a sequential extraction procedure [77]. Palumbo et al. [78], Tan et al. [79], and Gasparatos [80] demonstrated that in Fe-Mn nodules from different soils, Co, Cr, Cu, Ni, Pb, V, and Zn are considerably enriched with respect to the surrounding soils. Sipos et al. [81] have found a close association of Co, Cr, Cu, Pb, and Zn concentrations to Fe fractionation in Hungarian metal-contaminated soils.
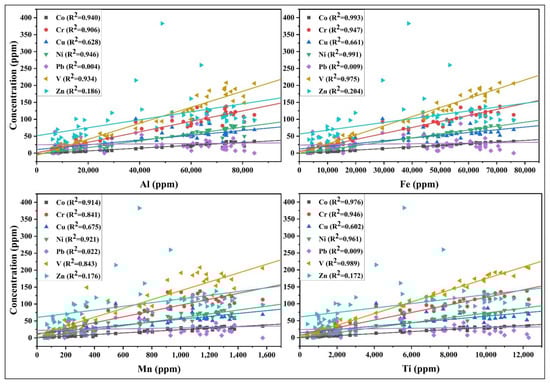
Figure 9.
Scatter plot of PTEs with Al, Fe, Mn, and Ti.
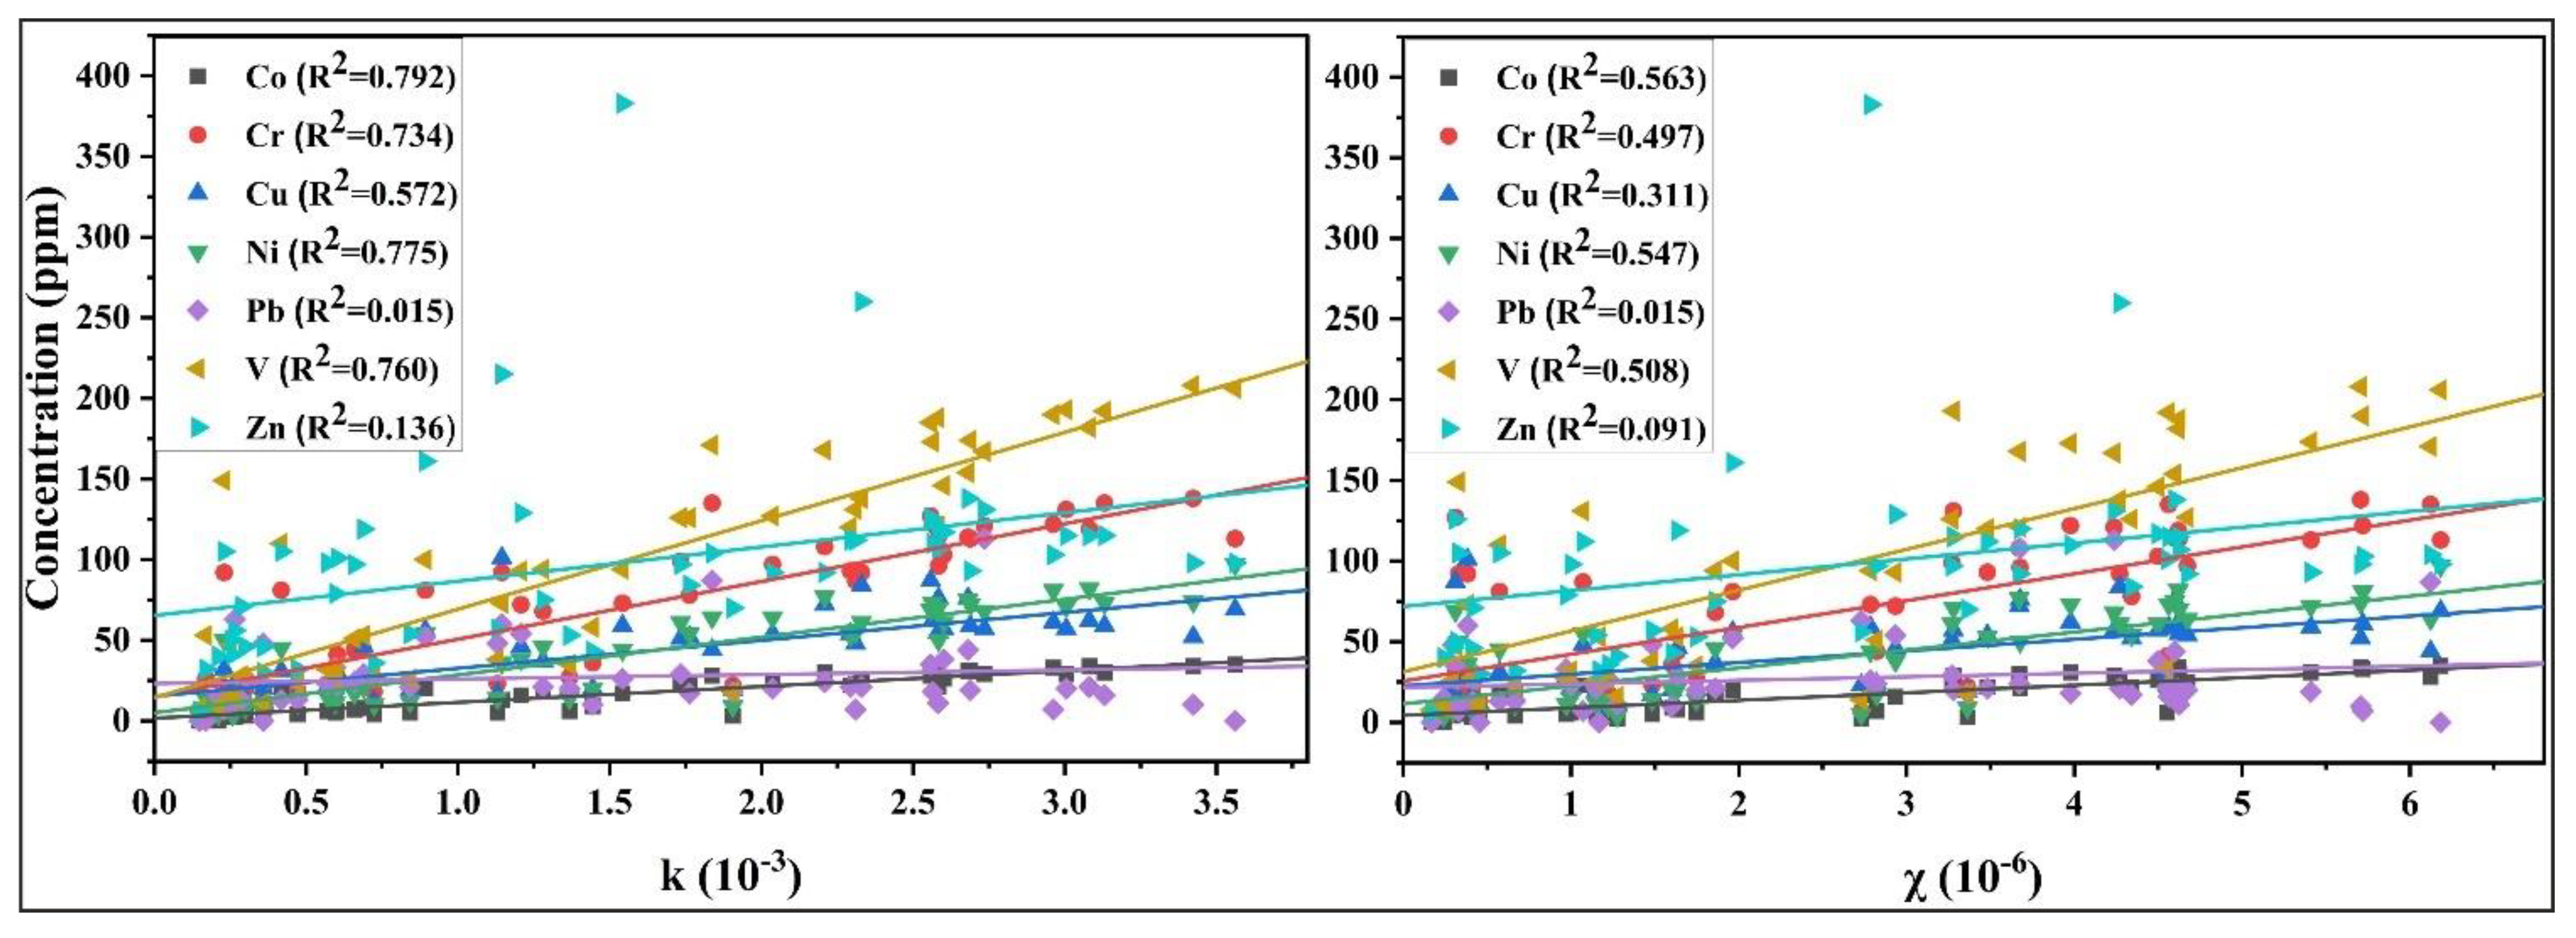
Figure 10 represents the scatter plots between magnetic susceptibility values (k and χ) and the PTEs. Co, Cr Cu, Ni, and V showed significant positive linear relationships with magnetic susceptibility values. Interestingly, the observed positive relations of these PTEs with k were more significant than those of χ.
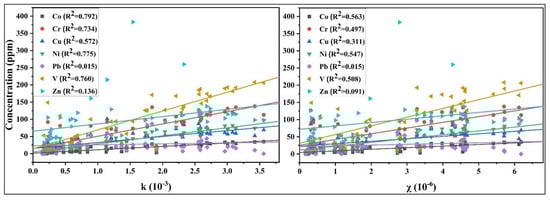
Figure 10.
Scatter plot of PTEs with k and χ values.
PCC analysis was conducted to clearly reveal the correlation between all the considered variables. As can be observed from Table 4, the associations between Co, Cr, Cu, Ni, and V and major elements were confirmed by PCC analysis. Likewise, the association between these PTEs and magnetic susceptibility values was also confirmed. Zn exhibited a positive correlation with Al, Fe, Mn, Ti, and magnetic susceptibility values. Furthermore, significant positive correlations were noted between magnetic susceptibility values and the calculated pollution indices.
Table 4.
Pearson’s correlation coefficient for all variables (n = 51).
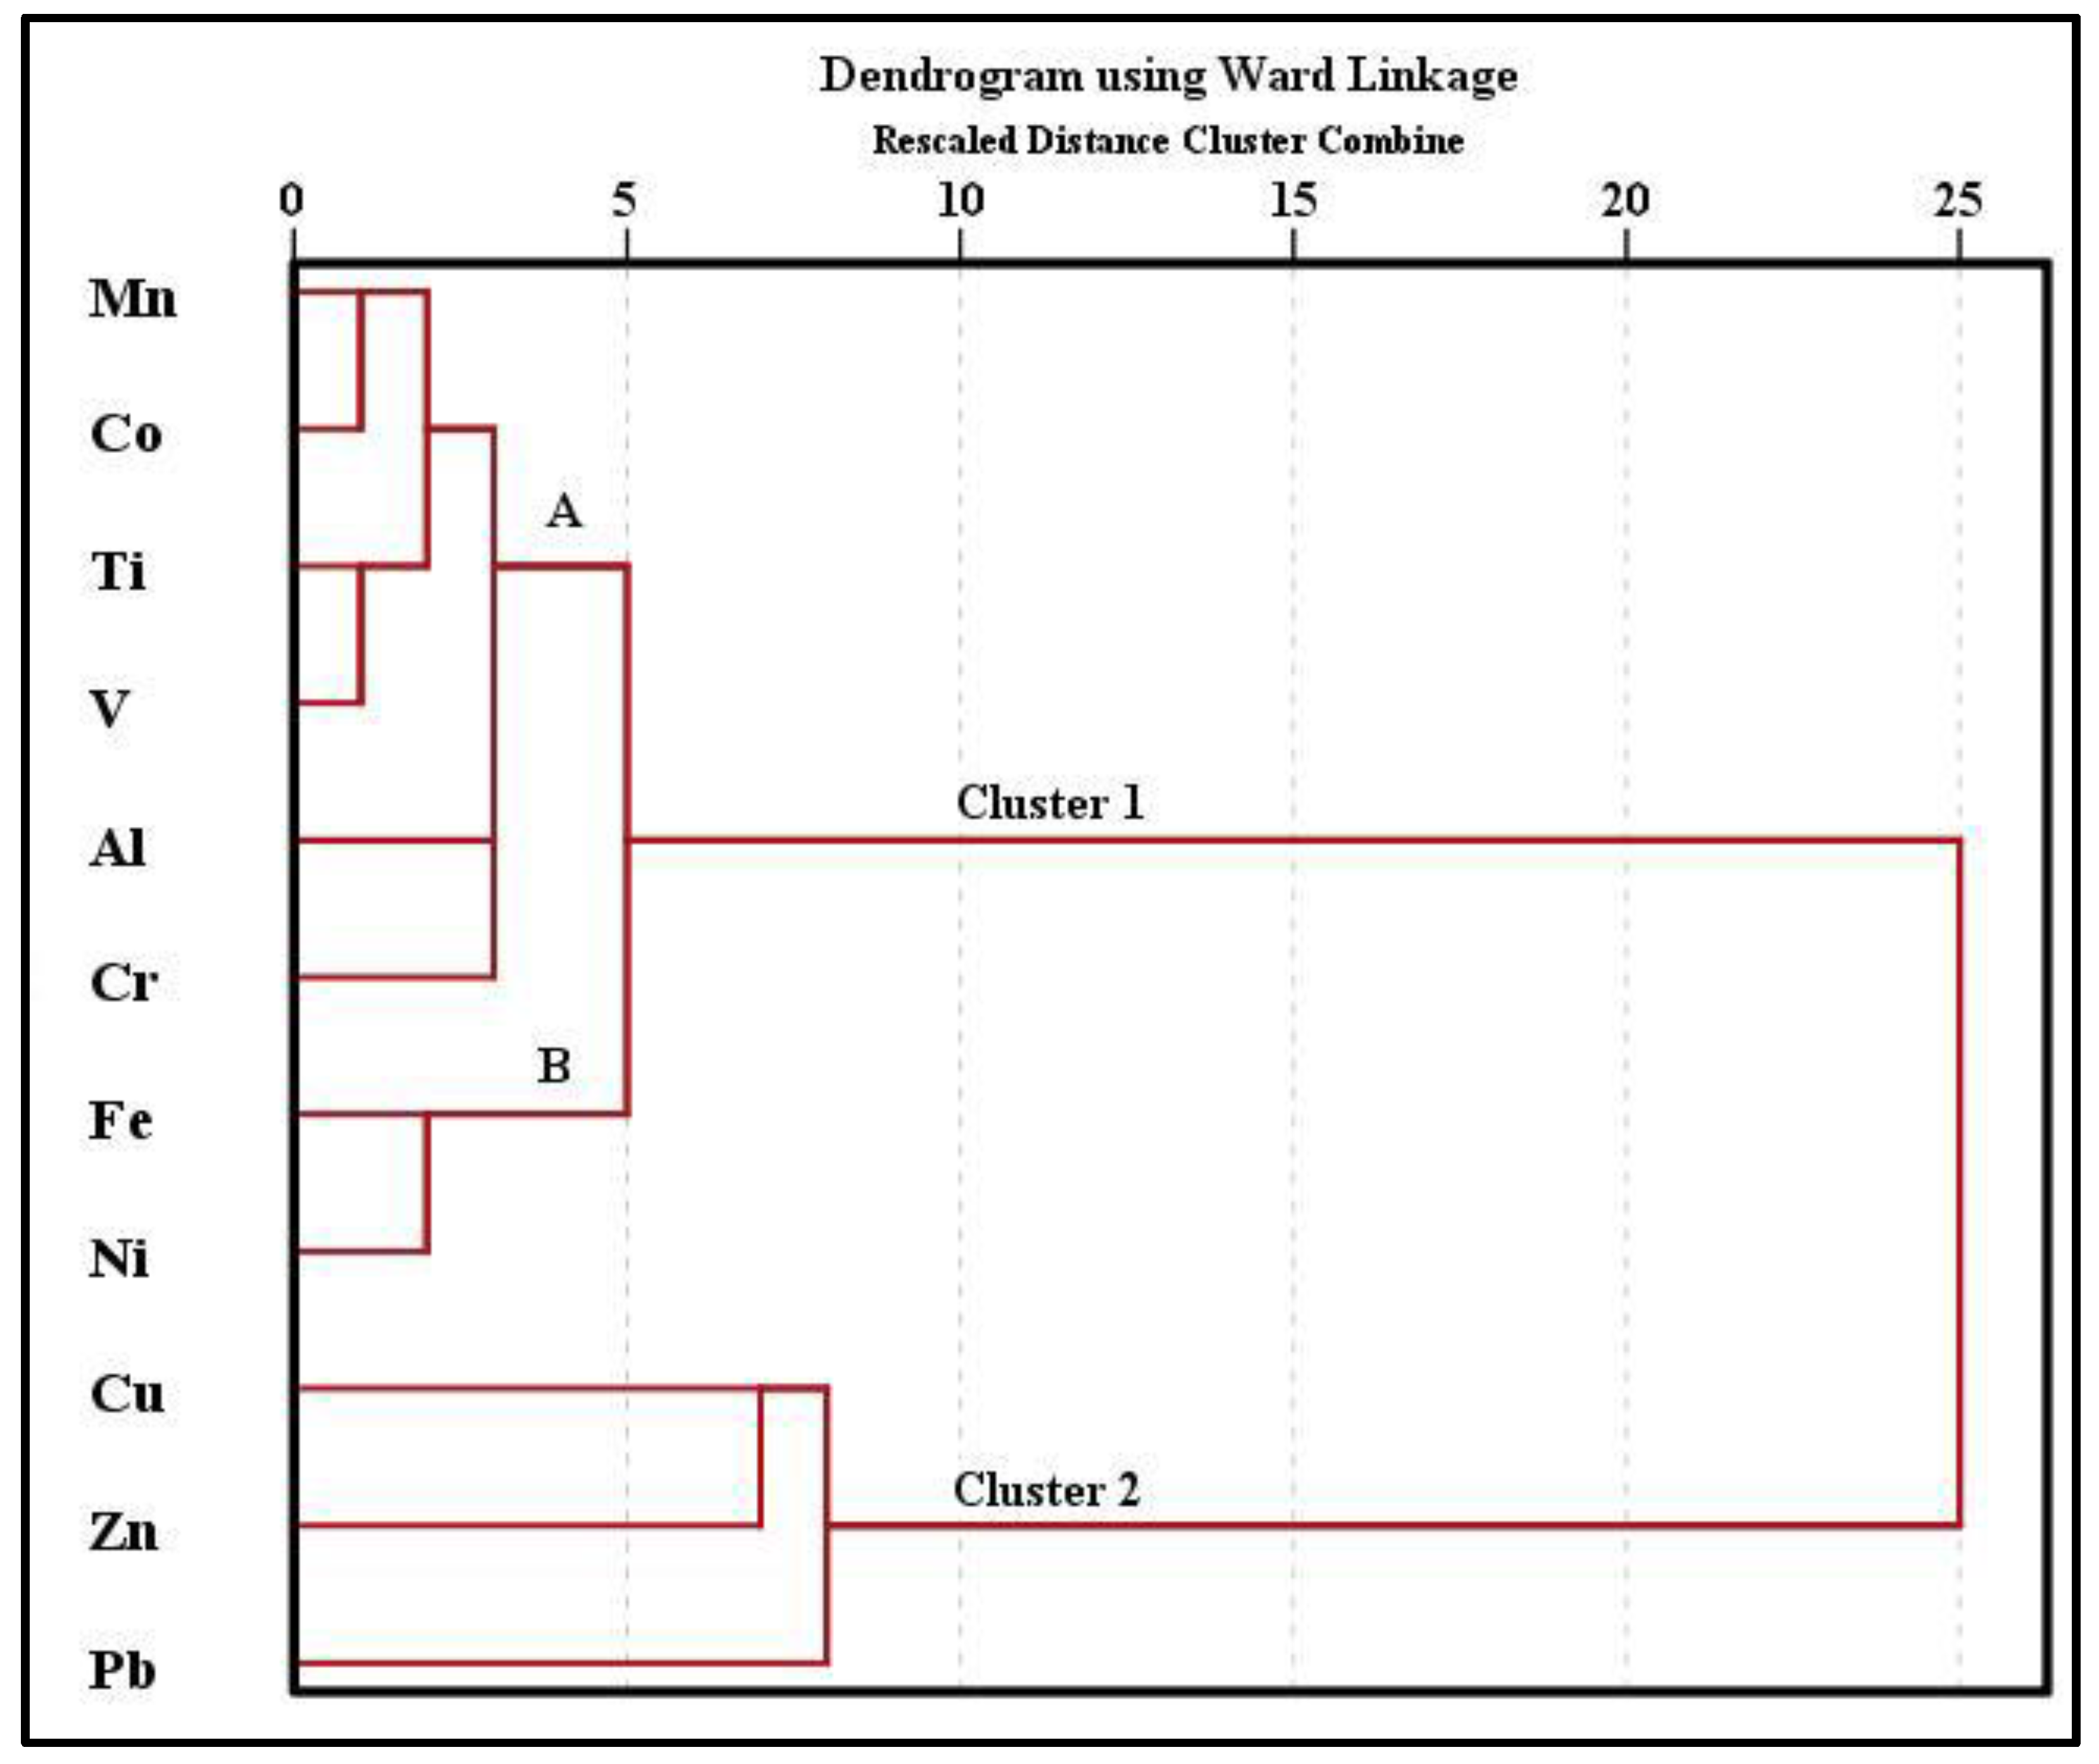
The output of HCA is a dendrogram connecting variables with a significant degree of similarities. The results of HCA (Figure 11) show that there are two main distinctive clusters among the considered variables. Cluster (1) splits into two subclusters: A (Mn, Co, Ti, V, Al, and Cr) and B (Fe and Ni). This confirms the significant role played by major ions in the distribution of Co, Cr, Ni, and V. The confirmed association between Co, Cr, Ni, and V suggests these elements have mixed anthropogenic sources of industrial, agriculture, and transportation. Cluster (2) is related to Cu, Zn, and Pb, which are frequently associated elements and are normally detected in industrial effluents [60], suggesting these elements have multiple anthropogenic/lithogenic sources in the studied soil.
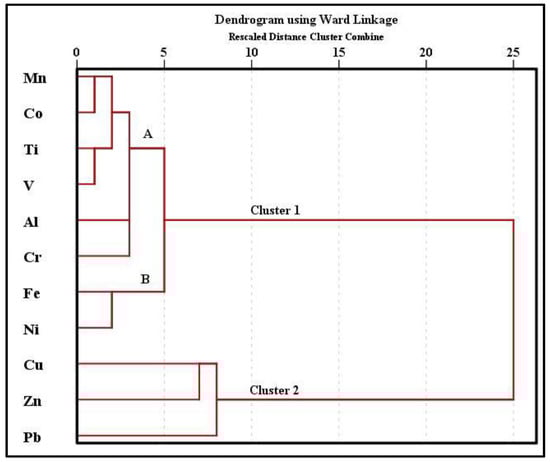
Figure 11.
Dendrograms of PTEs and major elements using Ward’s method.
A very important question arises here about the notable absence of any association of Pb, and the weak association of Zn, with the major elements or magnetic susceptibility values, despite associations being well-documented in previous research [27,82]. This may be attributed to the very high spatial variability of Pb and Zn existence from one site to another, which is reflected in the calculated high standard deviation values. This question motivates further research concerning the fractionation of Pb and Zn in the investigated samples.
4. Conclusions and Recommendations
Obvious accumulation of soil PTEs was detected in different land uses in Greater Cairo. In general, the concentrations of Co, Cr, Cu, Hg, Ni, Pb, V, and Zn range from 0.0 to 35, 4–138, 3–101, 0.0–0.19, 3–97, 0–113, 8–208, and 6–899 ppm, respectively. Co, Cr, Cu, Ni, Pb, V, and Zn concentrations surpass world soil average and threshold values for soil quality in many sampling sites. The majority of EF and Igeo values have shown moderate enrichment and uncontaminated to moderately contaminated soil. PLI values show a wide range of contamination from unpolluted to strongly polluted, while PERI values are in a low- and moderate-risk classes.
The distribution of the soil PTEs in Greater Cairo was influenced by several anthropogenic sources including traffic emission, industrial activity, and agricultural practices. The measured magnetic susceptibility values indicate magnetically enhanced soil signals dominated by multi-domain or pseudo-single-domain superparamagnetic particles of anthropogenic origin. The observed association between Co, Cr, Cu, Ni, and V with Al, Fe, Mn, and Ti indicates that clay minerals and scavenger major elements play significant roles in the distribution of these PTEs. The confirmed association between Co, Cr, Ni, V suggests these elements have mixed anthropogenic sources of industrial, agriculture, and transportation. Association between Cu, Zn, and Pb suggests these elements are derived from multiple anthropogenic/lithogenic sources in the study area. A significant association was observed between magnetic susceptibility values and Co, Cr, Cu, Ni, and V, and the calculated environmental indices. Soil-quality assessment can benefit enormously from usage of magnetic susceptibility measurements. Based on the proposed approach and according to the results of this study, performing these measurements prior to geochemical investigation reduces the collected number of samples and the cost of chemical analyses. Therefore, this approach could be used in regional studies utilizing field magnetic measurements as a reconnaissance study, followed up by collecting samples for geochemical analyses from the highly magnetic anomaly zones.
Based on the obtained results, the following recommendations could be given for the best management of soil quality:
- Treat wastewater in order to limit toxic heavy-metal contamination from this source.
- Carefully manage fertilizer and pesticide use and educate farmers about the side-effects of fertilizers and pesticides.
- Use the applicable method for remediation and cleaning soil that suffers from contamination.
- Factory sites should have environment-friendly plants through the effective use of resources and implementation of environmental management to conserve biodiversity through the appropriate management of chemicals and cooperation with local communities.
- Monitor the contaminated soil periodically.
Supplementary Materials
The following supporting information can be downloaded at: https://www.mdpi.com/article/10.3390/land11030319/s1, Table S1. Summary of the formulae used to calculate the single and integrated indices, References [51,57,58,59,60,61,62,72,83,84].
Author Contributions
Conceptualization, A.S., Y.H.D. and A.G.; methodology, A.S. and A.G.; software, A.S. and A.G.; validation, A.S. and A.G.; formal analysis, A.S. and A.G.; investigation, A.S. and A.G.; resources, A.S. and A.G.; data curation, A.S. and A.G.; writing—original draft preparation, A.S. and A.G.; writing—review and editing, Y.H.D.; A.S. and A.G.; supervision, A.S. and Y.H.D.; project administration, A.S.; funding acquisition, A.S. All authors have read and agreed to the published version of the manuscript.
Funding
This paper is passed upon work supported by the Science, Technology & Innovation Funding Authority (STDF), Egypt, Under Grant Number: 41628.
Institutional Review Board Statement
Not applicable.
Informed Consent Statement
Not applicable.
Data Availability Statement
Not applicable.
Acknowledgments
This paper is passed upon work supported by Science, Technology & Innovation Funding Authority (STDF), Egypt, under Grant Number: 41628. The authors would like to acknowledge the laboratory facilities offered by National Research Institute for Astronomy and Geophysics, Cairo, Egypt.
Conflicts of Interest
The authors declare no conflict of interest. The funders had no role in the design of the study; in the collection, analyses, or interpretation of data; in the writing of the manuscript, or in the decision to publish the results.
References
- Turhan, S.; Garad, A.M.K.; Hançerlioğulları, A.; Kurnaz, A.; Gören, E.; Duran, C.; Karataşlı, M.; Altıkulaç, A.; Savaci, G.; Aydın, A. Ecological assessment of heavy metals in soil around a coal-fired thermal power plant in Turkey. Environ. Earth Sci. 2020, 79, 134. [Google Scholar] [CrossRef]
- Tan, L.; Yang, B.; Xue, Z.; Wang, Z. Assessing Heavy Metal Contamination Risk in Soil and Water in the Core Water Source Area of the Middle Route of the South-to-NorthWater Diversion Project, China. Land 2021, 10, 934. [Google Scholar] [CrossRef]
- Baghdady, A.; Awad, S.; Gad, A. Assessment of metal contamination and natural radiation hazards in different soil types near iron ore mines, Bahariya Oasis, Egypt. Arab. J. Geosci. 2018, 11, 506. [Google Scholar] [CrossRef]
- Yakovlev, E.U.; Zykova, E.N.; Zykov, S.B.; Malkov, A.V.; Bazhenov, A.V. Heavy metals and radionuclides distribution and environmental risk assessment in soils of the Severodvinsk industrial district, NW Russia. Environ. Earth Sci. 2020, 79, 218. [Google Scholar] [CrossRef]
- Ogundele, L.T.; Oluwajana, O.A.; Ogunyele, A.C.; Inuyomi, S.O. Heavy metals, radionuclides activity and mineralogy of soil samples from an artisanal gold mining site in Ile-Ife, Nigeria: Implications on human and environmental health. Environ. Earth Sci. 2021, 80, 202. [Google Scholar] [CrossRef]
- Osman, R.; Melegy, A.; Dawood, Y.; Gad, A. Distribution of some potentially toxic heavy metals in the soil of Shoubra El Kheima, Egypt. Egypt. J. Chem. 2021, 64, 1965–1980. [Google Scholar] [CrossRef]
- Fazekašová, D.; Petrovič, F.; Fazekaš, J.; Štofejová, L.; Baláž, I.; Tulis, F.; Tóth, T. Soil Contamination in the Problem Areas of Agrarian Slovakia. Land 2021, 10, 1248. [Google Scholar] [CrossRef]
- Xia, F.; Zhu, Y.; Hu, B.; Chen, X.; Li, H.; Shi, K.; Xu, L. Pollution Characteristics, Spatial Patterns, and Sources of Toxic Elements in Soils from a Typical Industrial City of Eastern China. Land 2021, 10, 1126. [Google Scholar] [CrossRef]
- Jain, C.K.; Vaid, U.; Sharma, S.K.; Singh, S. Assessment of potentially toxic elements’ contamination in surface soils of Kulsi River Basin in NorthEast India. SN Appl. Sci. 2020, 1, 673. [Google Scholar] [CrossRef] [Green Version]
- Ilechukwu, I.; Osuji, L.C.; Okoli, C.P.; Onyema, M.O.; Ndukwe, G.I. Assessment of heavy metal pollution in soils and health risk consequences of human exposure within the vicinity of hot mix asphalt plants in Rivers State, Nigeria. Environ. Monit. Assess. 2021, 193, 461. [Google Scholar] [CrossRef]
- Moghtaderi, T.; Shakeri, A.; Rodríguez-Seijo, A. Potentially toxic element content in arid agricultural soils in south Iran. Agronomy 2020, 10, 564. [Google Scholar] [CrossRef]
- Yassine, A.; Taoufik, E.; Rachid, H.; Driss, D.; Mohamed, N.; Abdelmajid, H.; Hanane, H. Assessing the contamination of trace toxic elements in the soils of sugar beet field (Beni-Mellal, Morocco). Arab. J. Geosci. 2021, 14, 822. [Google Scholar] [CrossRef]
- Wiseman, C.L.S.; Zereini, F.; Püttmann, W. Traffic-related trace element fate and uptake by plants cultivated in roadside soils in Toronto, Canada. Sci. Total Environ. 2013, 442, 86–95. [Google Scholar] [CrossRef] [PubMed]
- Sardar, S.W.; Ur Rehman, S.A.; Nawab, J.; Khan, S.; Ali, A.; Ur Rahman, Z.; Baig, S.A.; Khan, M. Quantification of potentially toxic elements in degraded mining soils and medicinal plants: A case study of Indus Kohistan region Northern Pakistan. Environ. Earth Sci. 2021, 80, 641. [Google Scholar] [CrossRef]
- Alexakis, D.E. Multielement Contamination of Land in the Margin of Highways. Land 2021, 10, 230. [Google Scholar] [CrossRef]
- Golui, D.; Datta, S.P.; Dwivedi, B.S.; Meena, M.C.; Ray, P.; Trivedi, V.K. A new approach to establish safe levels of available metals in soil with respect to potential health hazard of human. Environ. Earth Sci. 2021, 80, 667. [Google Scholar] [CrossRef]
- Anyanwu, B.O.; Ezejiofor, A.N.; Igweze, Z.N.; Orisakwe, O. Heavy metal mixture exposure and effects in developing nations: An update. Toxics 2018, 6, 65. [Google Scholar] [CrossRef] [Green Version]
- Gad, A.; Abd El Bakey, S.M.; Sakr, S. Concentrations of heavy metals and associated human health risk in unrefined salts of inland hypersaline lakes, Egypt. Int. J. Environ. Anal. Chem. 2020. [Google Scholar] [CrossRef]
- Sebastian, A.; Nangia, A.; Prasad, M.N.V. Advances in agrochemical remediation using nanoparticles. In Agrochemicals Detection, Treatment and Remediation; Prasad, M.N.V., Ed.; Butterworth-Heinemann, Elsevier: Chennai, India, 2020; pp. 465–485. [Google Scholar] [CrossRef]
- Vallero, D.A. Hazardous Wastes. In Waste, 2nd ed.; Letcher, T.M., Vallero, D.A., Eds.; Academic Press: Cambridge, MA, USA, 2019; pp. 585–630. [Google Scholar] [CrossRef]
- Bilias, F.; Nikoli, T.; Kalderis, D.; Gasparatos, D. Towards a soil remediation strategy using biochar: Effects on soil chemical properties and bioavailability of potentially toxic elements. Toxics 2021, 9, 184. [Google Scholar] [CrossRef]
- Rodríguez-Eugenio, N.; McLaughlin, M.; Pennock, D. Soil Pollution: A Hidden Reality; FAO: Rome, Italy, 2018; 142p. [Google Scholar]
- Dong, S.; Pan, Y.; Guo, H.; Gao, B.; Li, M. Identifying Influencing Factors of Agricultural Soil Heavy Metals Using a Geographical Detector: A Case Study in Shunyi District, China. Land 2021, 10, 1010. [Google Scholar] [CrossRef]
- Zhao, H.; Liu, P.; Qiao, B.; Wu, K. The Spatial Distribution and Prediction of Soil Heavy Metals Based on Measured Samples and Multi-Spectral Images in Tai Lake of China. Land 2021, 10, 1227. [Google Scholar] [CrossRef]
- Boar, R.R.; Harper, D.M. Magnetic susceptibilities of lake sediment and soils on the shoreline of Lake Naivasha, Kenya. In Lake Naivasha, Kenya; Harper, D.M., Boar, R.R., Everard, M., Hickley, P., Eds.; Springer: Dordrecht, The Netherlands, 2002; pp. 81–88. [Google Scholar] [CrossRef]
- Petrovský, E.; Hulka, Z.; Kapicka, A. A new tool for in situ measurements of the vertical distribution of magnetic susceptibility in soils as basis for mapping deposited dust. Environ. Technol. 2004, 25, 1021–1029. [Google Scholar] [CrossRef] [PubMed]
- Attoucheik, L.; Jordanova, N.; Bayou, B.; Lagroix, F.; Jordanova, D.; Maouche, S.; Henry, B.; Boutaleb, A. Soil metal pollution from former Zn–Pb mining assessed by geochemical and magnetic investigations: Case study of the Bou Caid area (Tissemsilt, Algeria). Environ. Earth Sci. 2017, 76, 298. [Google Scholar] [CrossRef]
- Li, M.; Zhu, S.; Ouyang, T.; Tang, J.; Tang, Z. Magnetic properties of the surface sediments in the Yellow River Estuary and Laizhou Bay, Bohai Sea, China: Implications for monitoring heavy metals. J. Hazard. Mater. 2021, 410, 124579. [Google Scholar] [CrossRef] [PubMed]
- Menshov, O.; Spassov, S.; Camps, P.; Vyzhva, S.; Pereira, P.; Pastushenko, T.; Demidov, V. Soil and dust magnetism in semi-urban area Truskavets, Ukraine. Environ. Earth Sci. 2020, 79, 182. [Google Scholar] [CrossRef]
- Wang, B.; Zhang, X.; Zhao, Y.; Zhang, M.; Jia, J. Spatial and temporal distribution of pollution based on magnetic analysis of soil and atmospheric Dustfall in Baiyin City, Northwestern China. Int. J. Environ. Res. Public Health 2021, 18, 1681. [Google Scholar] [CrossRef]
- Kletetschka, G.; Žila, V.; Wasilewski, P.J. Magnetic anomalies on the tree trunks. Studia Geophys. Geod. 2003, 47, 371–379. [Google Scholar] [CrossRef]
- Hu, S.Y.; Duan, X.M.; Shen, J.M.; Blaha, U.; Roesler, W.; Yan, H.T.; Appel, E.; Hoffmann, V. Magnetic response to atmospheric heavy metal pollution recorded by dust-loaded leaves in Shougang industrial area, western Beijing, China. Chin. Sci. Bull. 2008, 53, 1555–1564. [Google Scholar] [CrossRef] [Green Version]
- Salo, H.; Bućko, M.S.; Vaahtovuo, E.; Limo, J.; Mäkinen, J.; Pesonen, L.J. Biomonitoring of air pollution in SW Finland by magnetic and chemical measurements of moss bags and lichens. J Geochem. Explor. 2012, 115, 69–81. [Google Scholar] [CrossRef]
- Hofman, J.; Stokkaer, I.; Snauwaert, L.; Samson, R. Spatial distribution assessment of particulate matter in an urban street canyon using biomagnetic leaf monitoring of tree crown deposited particles. Environ. Pollut. 2013, 183, 123–132. [Google Scholar] [CrossRef]
- Rea-Downing, G.; Quirk, B.J.; Wagner, C.L.; Lippert, P.C. Evergreen needle magnetization as a proxy for particulate matter pollution in urban environments. GeoHealth 2020, 4, e2020GH000286. [Google Scholar] [CrossRef]
- Strzyszcz, Z.; Magiera, T. Magnetic susceptibility and heavy metals contamination in soils of Southern Poland. Phys. Chem. Earth 1998, 23, 1127–1131. [Google Scholar] [CrossRef]
- Spiteri, C.; Kalinski, V.; Rösler, W.; Hoffmann, V.; Appel, E.; MAGPROX team. Magnetic screening of pollution hotspots in the Lausitz Area, Eastern Germany: Correlation analysis between magnetic proxies and heavy metal concentration in soil. Environ. Geol. 2000, 49, 1. [Google Scholar] [CrossRef]
- Osman, R.; Dawood, Y.H.; Melegy, A.; El-Bady, M.S.; Saleh, A.; Gad, A. Distributions and Risk Assessment of the Natural Radionuclides in the Soil of Shoubra El Kheima, South Nile Delta, Egypt. Atmosphere 2022, 13, 98. [Google Scholar] [CrossRef]
- Abd-Elmabod, S.K.; Fitch, A.C.; Zhang, Z.; Ali, R.R. Rapid urbanisation threatens fertile agricultural land and soil carbon in the Nile delta. J. Environ. Manag. 2019, 252, 109668. [Google Scholar] [CrossRef] [PubMed]
- Elshamy, M.M.; Heikal, Y.M.; Bonanomi, G. Phytoremediation efficiency of Portulaca oleracea L. naturally growing in some industrial sites, Dakahlia District, Egypt. Chemosphere 2019, 225, 678–687. [Google Scholar] [CrossRef]
- Eltaher, G.T.; Ahmed, D.A.; El-Beheiry, M.; Sharaf El-Din, A. Biomass estimation and heavy metal accumulation by Pluchea dioscoridis (L.) DC. in the Middle Nile Delta, (Egypt): Perspectives for phytoremediation. S. Afr. J. Bot. 2019, 127, 153–166. [Google Scholar] [CrossRef]
- El-Nagar, D.A.; Abdel-Halim, K.Y. Remediation of heavy metals in contaminated soil by using nano-bentonite, nano-hydroxyapatite, and nano-composite. Land Degrad. Dev. 2021, 32, 4562–4573. [Google Scholar] [CrossRef]
- Abu Khatita, A.M.; Koch, R.; Bamousa, A.O. Sources identification and contamination assessment of heavy metals in soil of Middle Nile Delta, Egypt. J. Taibah Univ. Sci. 2020, 14, 750–761. [Google Scholar] [CrossRef]
- Guda, A.M.; El-Hemaly, I.A.; Abdel Aal, E.M.; Odah, H.; Appel, E.; El Kammar, A.M.; Abu Khatita, A.M.; Abu Salem, H.S.; Awad, A. Suitability of magnetic proxies to reflect complex anthropogenic spatial and historical soil heavy metal pollution in the southeast Nile delta. Catena 2020, 191, 104552. [Google Scholar] [CrossRef]
- Shaddad, S.M.; Buttafuoco, G.; Castrignanò, A. Assessment and mapping of soil salinization risk in an Egyptian field using a probabilistic approach. Agronomy 2020, 10, 85. [Google Scholar] [CrossRef] [Green Version]
- FAO, Food and Agriculture Organization. Fertilizer Use by Crop in Egypt; FAO: Rome, Italy, 2005; 50p. [Google Scholar]
- Elbana, T.; Gaber, H.M.; Kishk, F.M. Soil Chemical Pollution and Sustainable Agriculture. In Soils of Egypt; El-Ramady, H., Alshaal, T., Bakr, N., Elbana, T., Mohamed, E., Belal, A.A., Eds.; World Soils Book Series; Springer: Cham, Switzerland, 2019; pp. 187–200. [Google Scholar] [CrossRef]
- El-Amier, Y.A.; Bessa, A.Z.E.; Elsayed, A.; El-Esawi, M.A.; AL-Harbi, M.S.; Samra, B.N.; Kotb, W.K. Assessment of the heavy metals pollution and ecological risk in sediments of Mediterranean Sea drain estuaries in Egypt and phytoremediation potential of two emergent plants. Sustainability 2021, 13, 12244. [Google Scholar] [CrossRef]
- Elbasiouny, H.; Elbehiry, F. Geology. In The Soils of Egypt; World Soils Book Series; El-Ramady, H., Alshaal, T., Bakr, N., Elbana, T., Mohamed, E., Belal, A.A., Eds.; Springer: Cham, Switzerland, 2019; pp. 93–109. [Google Scholar] [CrossRef]
- Gad, A.; Saleh, A.; Khalifa, M. Assessment of natural radionuclides and related occupational risk in agricultural soil, southeastern Nile Delta, Egypt. Arab. J. Geosci. 2019, 12, 188. [Google Scholar] [CrossRef]
- Khalifa, M.; Gad, A. Assessment of heavy metals contamination in agricultural soil of southwestern Nile Delta, Egypt. Soil. Sediment. Contam. 2018, 27, 619–642. [Google Scholar] [CrossRef]
- Alsafran, M.; Usman, K.; Al Jabri, H.; Rizwan, M. Ecological and Health Risks Assessment of Potentially Toxic Metals and Metalloids Contaminants: A Case Study of Agricultural Soils in Qatar. Toxics 2021, 9, 35. [Google Scholar] [CrossRef] [PubMed]
- Liu, C.; Yi, L.; Lu, A.; Xie, B.; Peng, H. Evaluating Metal(loid)s Contamination in Soil of a Typical In-Dustry Smelting Site in South Central China: Levels, Possible Sources and Human Health Risk Analysis. Sustainability 2021, 13, 11294. [Google Scholar] [CrossRef]
- Obiri-Nyarko, F.; Duah, A.A.; Karikari, A.Y.; Agyekum, W.A.; Manu, E.; Tagoe, R. Assessment of heavy metal contamination in soils at the Kpone landfill site, Ghana: Implication for ecological and health risk assessment. Chemosphere 2021, 282, 131007. [Google Scholar] [CrossRef]
- ISO 14869-1. Soil Quality—Dissolution for the Determination of Total Element Content—Part 1: Dissolution with Hydrofluoric and Perchloric Acids; ISO: Geneva, Switzerland, 2001; pp. 1–5. [Google Scholar]
- Dearing, J.A.; Dann, R.J.L.; Hay, K.; Lees, J.A.; Loveland, P.J.; Maher, B.A.; O’Grady, K. Frequency-dependent susceptibility measurements of environmental materials. Geophys. J. Int. 1996, 124, 228–240. [Google Scholar] [CrossRef] [Green Version]
- Loska, K.; Wiechula, D.; Korus, I. Metal contamination of farming soils affected by industry. Environ. Int. 2004, 30, 159–165. [Google Scholar] [CrossRef]
- Müller, G. Index of geoaccumulation in sediments of the Rhine River. Geo. J. 1969, 2, 108–118. [Google Scholar]
- Förstner, U. Contaminated Sediments; Lecture Notes in Earth Science, 21; Springer: Berlin, Germany, 1990. [Google Scholar]
- Guan, Y.; Shao, C.; Ju, M. Heavy metal contamination assessment and partition for industrial and mining gathering areas. Int. J. Environ. Res. Public Health 2014, 11, 7286–7303. [Google Scholar] [CrossRef] [PubMed] [Green Version]
- Hakanson, L. An ecological risk index for aquatic pollution control: A sedimentological approach. Water Res. 1980, 14, 975–1001. [Google Scholar] [CrossRef]
- Tomlinson, D.C.; Wilson, D.J.; Harris, C.R.; Jeffrey, D.W. Problem in heavy metals in estuaries and the formation of pollution index. Helgol. Meeresunters 1980, 33, 566–575. [Google Scholar] [CrossRef] [Green Version]
- Arab, L.H.; Boutaleb, A.; Berdous, D. Environmental assessment of heavy metal pollution in the polymetallic district of Kef Oum Teboul (El Kala, Northeast Algeria). Environ. Earth Sci. 2021, 80, 277. [Google Scholar] [CrossRef]
- Taylor, S.R.; McLennan, S.M. The geochemical evolution of the continental crust. Rev. Geophys. 1995, 33, 241–265. [Google Scholar] [CrossRef]
- Kabata-Pendias, A. Trace Elements in Soils and Plants, 4th ed.; CRC Press: New York, NY, USA, 2011. [Google Scholar]
- Tóth, G.; Hermann, T.; Da Silva, M.R.; Montanarella, L. Heavy metals in agricultural soils of the European Union with implications for food safety. Environ. Int. 2016, 88, 299–309. [Google Scholar] [CrossRef]
- Romic, M.; Romic, D. Heavy metals distribution in agricultural topsoils in urban area. Environ. Geol. 2003, 43, 795–805. [Google Scholar] [CrossRef]
- Zhang, Y.; Wang, S.; Gao, Z.; Zhang, H.; Zhu, Z.; Jiang, B.; Liu, J.; Dong, H. Contamination characteristics, source analysis and health risk assessment of heavy metals in the soil in Shi River Basin in China based on high density sampling. Ecotoxicol. Environ. Saf. 2021, 227, 112926. [Google Scholar] [CrossRef]
- Sungur, A.; Soylak, M.; Yilmaz, S.; Ozcan, H. Heavy metal mobility and potential availability in animal manure: Using a sequential extraction procedure. J. Mater. Cycles Waste Manag. 2016, 18, 563–572. [Google Scholar] [CrossRef]
- Kong, F.; Chen, Y.; Huang, L.; Yang, Z. Human health risk visualization of potentially toxic elements in farmland soil: A combined method of source and probability. Ecotoxicol. Environ. Saf. 2021, 211, 111922. [Google Scholar] [CrossRef]
- Elbana, T.A.; Ramadan, M.A.; Gaber, H.M.; Bahnassy, M.H.; Kishk, F.M.; Selim, H.M. Heavy metals accumulation and spatial distribution in long term wastewater irrigated soils. J. Environ. Chem. Eng. 2013, 1, 925–933. [Google Scholar] [CrossRef]
- Saha, J.K.; Selladurai, R.; Coumar, M.V.; Dotaniya, M.L.; Kundu, S.; Patra, A.K. Soil Pollution—An Emerging Threat to Agriculture; Springer Nature: Singapore, 2017. [Google Scholar]
- Thompson, R.; Oldfield, F. Environmental Magnetism; Allen and Unwin: London, UK, 1986. [Google Scholar]
- Borda, M.J.; Sparks, D.L. Mobility of trace elements in soil environments. In Biophysicochemical Processes of Metals and Metalloids in Soil Environments; Violante, A., Huang, P.M., Gadd, G.M., Eds.; Wiley: Hoboken, NJ, USA, 2008; pp. 97–168. [Google Scholar]
- Sparks, D.L.; Ginder-Vogel, M. The role of synchrotron radiation in elucidating the biogeochemistry of metal(loids) and nutrients at critical zone interfaces. In Handbook of Soil Sciences; Resource Management and Environmental Impact; Huang, P.M., Li, Y., Sumner, M.E., Eds.; HCRC Press, Taylor and Francis Group: Boca Raton, FL, USA, 2012; pp. 1–17. [Google Scholar]
- Sparks, D.L. Advances in the use of synchrotron radiation to elucidate environmental interfacial reaction processes and mechanisms in the earth’ critical zone. In Molecular Environmental Soil Science; Xu, J., Sparks, D.L., Eds.; Springer: Dordrecht, The Netherlands, 2013; pp. 93–114. [Google Scholar] [CrossRef]
- Hall, G.E.M.; Gauthier, G.; Pelchat, J.C.; Pelchat, P.; Vaive, J.E. Application of a sequential extraction scheme to ten geological certified reference materials for the determination of 20 elements. J. Anal. At. Spectrom. 1996, 11, 787. [Google Scholar] [CrossRef]
- Palumbo, B.; Bellanca, A.; Neri, R.; Roe, M.J. Trace metal partitioning in Fe-Mn nodules from Sicilian soils, Italy. Chem. Geol. 2001, 173, 257–269. [Google Scholar] [CrossRef]
- Tan, W.; Liu, F.; Feng, X.H.; Huang, Q.; Li, X. Adsorption and redox reactions of heavy metals on Fe–Mn nodules from Chinese soils. J. Colloid Interface Sci. 2005, 284, 600–605. [Google Scholar] [CrossRef]
- Gasparatos, D. Sequestration of heavy metals from soil with Fe–Mn concretions and nodules. Environ. Chem. Lett. 2013, 11, 1–9. [Google Scholar] [CrossRef]
- Sipos, P.; Choi, C.; Németh, T.; Szalai, Z.; Póka, T. Relationship between iron and trace metal fractionation in soils. Chem. Speciat. Bioavail. 2014, 26, 21–30. [Google Scholar] [CrossRef]
- Fialova, H.; Maier, G.; Petrovsky, E.; Kapicka, A.; Boyko, T.; Scholger, R. Magnetic properties of soils from sites with different geological and environmental settings. J. Appl. Geophys. 2006, 59, 273–283. [Google Scholar] [CrossRef]
- Chai, L.; Li, H.; Yang, Z.; Min, X.; Liao, Q.; Liu, Y.; Men, S.; Yan, Y.; Xu, J. Heavy metals and metalloids in the surface sediments of the Xiangjiang River, Hunan, China: distribution, contamination, and ecological risk assessment. Environ. Sci. Pollut. Res. 2017, 24, 874–885. [Google Scholar] [CrossRef]
- Chon, H.T.; Cho, C.H.; Kim, K.W.; Moon, H.S. The occurrence and dispersion of potentially toxic elements in areas covered with black shale’s and slates in Korea. Appl. Geochem. 1996, 11, 69–76. [Google Scholar] [CrossRef]


Publisher’s Note: MDPI stays neutral with regard to jurisdictional claims in published maps and institutional affiliations. |
© 2022 by the authors. Licensee MDPI, Basel, Switzerland. This article is an open access article distributed under the terms and conditions of the Creative Commons Attribution (CC BY) license (https://creativecommons.org/licenses/by/4.0/).