Article

Soil Quality Assessment Using Multivariate Approaches: A Case Study of the Dakhla Oasis Arid Lands

by
Salman A. H. Selmy
1,*,
Salah H. Abd Al-Aziz
1,
Raimundo Jiménez-Ballesta
2,
Francisco Jesús García-Navarro
3 and
Mohamed E. Fadl
4
1
Department of Soils and Water, Faculty of Agriculture, Assiut University, Assiut 71526, Egypt
2
Department of Geology and Geochemistry, Autonomuos University of Madrid, 28019 Madrid, Spain
3
Higth Technical School of Agricultural Engineers, University of Castilla-La Mancha, 13007 Ciudad Real, Spain
4
Division of Scientific Training and Continuous Studies, National Authority for Remote Sensing and Space Sciences (NARSS), Cairo 11769, Egypt
*
Author to whom correspondence should be addressed.
Land 2021, 10(10), 1074; https://doi.org/10.3390/land10101074
Submission received: 22 September 2021 / Revised: 9 October 2021 / Accepted: 11 October 2021 / Published: 12 October 2021

Abstract

:
A precise evaluation of soil quality (SQ) is important for sustainable land use planning. This study was conducted to assess soil quality using multivariate approaches. An assessment of SQ was carried out in an area of Dakhla Oasis using two methods of indicator selection, i.e., total data set (TDS) and minimum data set (MDS), and three soil quality indices (SQIs), i.e., additive quality index (AQI), weighted quality index (WQI), and Nemoro quality index (NQI). Fifty-five soil profiles were dug and samples were collected and analyzed. A total of 16 soil physicochemical parameters were selected for their sensitivity in SQ appraising to represent the TDS. The principal component analysis (PCA) was employed to establish the MDS. Statistical analyses were performed to test the accuracy and validation of each model, as well as to understand the relationship between the used methods and indices. The results of principal component analysis (PCA) showed that soil depth, gravel content, sand fraction, and exchangeable sodium percentage (ESP) were included in the MDS. High positive correlations (r ≥ 0.9) occurred between SQIs calculated using TDS and/or MDS under the three models. Moreover, the findings showed highly significant differences (p < 0.001) among SQIs within and between TDS and MDS. Approximately 80 to 85% of the total study area based on TDS, as well as 70 to 75%, according to MDS, were identified as suitable soils with slight limitations on soil quality grade (Q3, Q2, and Q1), while the remaining 20 to 30% had high to severe limitations (Q4 and Q5). The highest sensitivity (SI = 2.9) occurred by applying WQI using MDS and indicator weights based on the variance of PCA. Furthermore, the highest linear regression value (R2 = 0.88) between TDS and MDS was recorded using the same model. Because of its high sensitivity, such a model could be used for monitoring SQ changes caused by agricultural practices and environmental factors. The findings of this study have significant guiding implications and practical value in assessing the soil quality using TDS and MDS in arid areas critically and accurately.

1. Introduction

Since the beginning of the twentieth century, attempts to establish new settlements outside the Nile Valley in the Western Desert have emerged [1]. The southern oases (Dakhla and Kharga) could have potential in such expansion [2,3], especially Dakhla Oasis, where highly fertile soils and high amounts of groundwater are present in the Nubian Sandstone Aquifer [4,5]. However, soils in this area exhibit a wide range of soil types, as evidenced by variability in depth, texture, mineral content, and morpho-pedological features, such as salt accumulation, shales, gypsum, lime, and iron oxides [6]. Hamdi and Abdelhafez [7] reported that, according to US Soil Taxonomy, three soil orders, namely Entisols, Aridisols, and Vertisols, can be observed in Egyptian soils. Furthermore, soils of the study area (Dakhla Oasis) are classified into Entisols, Aridisols, and Vertisols [8,9].
Karlen et al. [10] and a committee for the Soil Science Society of America defined soil quality (SQ) as “the fitness of a specific kind of soil to function within its capacity and within natural or managed ecosystem boundaries, to sustain plant and animal productivity, maintain or enhance water and air quality, and support human health and habitation”. The process of predicting the capacity of soil for performing a certain function is known as SQ evaluation [11]. This is a valuable decision-making tool to grade croplands, adopt suitable management, conserve resources, and establish an early alarming system for the potential decline in soil multi-functionality [12]. Surface soil samples are used for assessing SQ; however, soil environment functionality is affected by inherent as well as anthropic aspects [13]. Thus, assessing SQ using surface soil solely gives an incomplete vision, since crop yield is affected by surface and subsurface soil properties [14].
Quantitative assessment of SQ includes three steps: (i) selecting soil properties known as indicators; (ii) scoring; and (iii) integrating the scores into a single index [15]. Soil quality indicators, in particular, are physical, chemical, and biological soil properties that change rapidly in response to variations in soil conditions [16,17]. Total data set (TDS) and minimum data set (MDS) are two indicators selection approaches that have been widely used in the assessment of soil quality [15,18,19,20,21,22]. Total dataset (TDS) and minimum dataset (MDS) are used for indicator selection; the former is a variety of indicators chosen based on specific soil properties, while the latter is a collection of indicators chosen based on correlations among indicators [23]. Scoring functions (linear and nonlinear scoring) are used to normalize data in order to eliminate the bias caused by the use of different indicators expressed on different numerical scales [24,25]. The scores are finally combined into an index using various models including additive (AQI), weighted additive (WQI), and Nemoro index (NQI), [15,19,20]. The AQI is calculated by adding the scores of various indicators [26]. WQI, on the other hand, employs an equation to combine the weighted values of all selected indicators into an index [18]. The NQI model is based on the mean and minimum indicator scores, without regard for their weight [18]. Selecting the appropriate index is based on sensitivity, and the model with the highest sensitivity would be more accurate [27,28].
A high number of soil physicochemical properties are included in quality indexing. However, as measurements of indicators are time-consuming, developing simple and effective indices based on the most informative and reliable indicators are of great importance [29]. Multivariate analysis, such as principal component analysis (PCA), is a data reduction tool used for reducing indicator loads and avoiding data redundancy [30]. It uses TDS of an indicator to extract the appropriate ones in the form of MDS to be included in SQ indexing. The MDS is site-specific, which the applicability to certain soil type, region, and land use should be appraised before recommendations [31].
Soil mapping improves estimates of spatial variability in soil development and properties as a function of various environmental factors (i.e., parent material, climate, topography, and vegetation). Mapping soil quality is particularly important for determining among others where soil quality is poor or good for agricultural use. Understanding the spatial variability of soil quality is necessary for risk assessment and decision-making [32]. Geostatistical approaches have a well-established capacity to map and model spatial variability of soil resources for the sustainable management of agricultural lands on a field or regional scale [33,34,35]. By using interpolation methods, such as inverse distance weighting (IDW), ordinary kriging (OK), log-kriging (LOK), and co-kriging (COK), several researchers have predicted and mapped the spatial distribution of soil chemical, physical, and biological properties on-field and regional scales [36,37,38,39,40].
Although many previous studies have assessed soil quality, there is a severe lack of information on soil quality assessment using multivariate approaches in arid lands, particularly those in desert environments (Oases). Considering that Dakhla Oasis is one of the desert arid environment with a scarcity of information on soil quality, it was chosen as a representative site for the current study to provide such necessary information. Moreover, Dakhla Oasis has arable land and good groundwater quality in the Nubian Sandstone Aquifer. A precise assessment of soil quality (SQ) is required for long-term land-use planning and the establishment of new settlements outside the limited Nile Valley soils. Since the study area is desert arid lands with extremely low organic matter content and thus low biological and biochemical activity, we focused on physicochemical attributes as selected soil quality parameters. We hypothesized that the assessment accuracy of the soil quality indices based on the minimum dataset (MDS) outperforms or is equivalent to the total dataset (TDS). Using a minimum dataset (MDS) to assess soil quality reduces the need to determine a large number of indicators. A relationship between TDS and MDS under the different quantitative indices can also be expected. Furthermore, using quantitative indices, the minimum dataset (MDS) is expected to identify the most sensitive and representative indicators of soil quality in arid lands from a larger dataset of physicochemical parameters. This is due to the MDS retaining only highly weighted factors within each principal component (PC). Quantitative-based indices of soil quality assessment (SQIs) in arid lands provide the necessary information to prevent soil degradation, facilitate adaptive management practices, and make informed decisions. Under this perspective, the current study aimed to (i) assess and map the soil quality in a typical desert region as Dakhla Oasis, using two indicator selection methods (TDS and MDS) and three indexing models: additive quality index (AQI), weighted quality index (WQI), and Nemoro quality index (NQI); (ii) determine the minimum dataset of soil quality indicators; (iii) investigate the capability and accuracy of using MDS in expressing soil quality in arid lands rather than TDS; and (iv) identify the best model for this arid region employing a statistical approach and linear relationships.

2. Materials and Methods

2.1. Site Description

The study area is located in Dakhla Oasis of Western Desert, between 28°19′3.4″–29° 34′00″ E and 25°20′00″–25°60′00″ N (Figure 1) with a total area of 1461.6 km2 (146,160.25 ha). Embabi [1] reported that the area is underlain by sediments of Cretaceous and Lower Tertiary era, which are arranged from the oldest to the youngest as follows: Precambrian rocks, Jurassic to Cretaceous formations, and Quaternary sediments. According to EMA [41], the total annual rainfall is <1 mm, the mean annual temperature is 24 °C, the minimum is 6 °C in January, and the maximum is 41 °C in July. The soil temperature regime is Hyperthermic while the moisture regime is Torric [42]. The land use/land cover of Dakhla Oasis is divided into seven categories: (a) urban areas; (b) cultivated areas (e.g., Palm date trees, Maize, Sorghum, Sunflower, Wheat, Barley, Alfalfa, Citrus, and Olive); (c) rocky land; (d) sand dunes; (e) sand sheets; (f) water bodies (ponds); and (h) playas.

2.2. Soil Sampling and Analysis

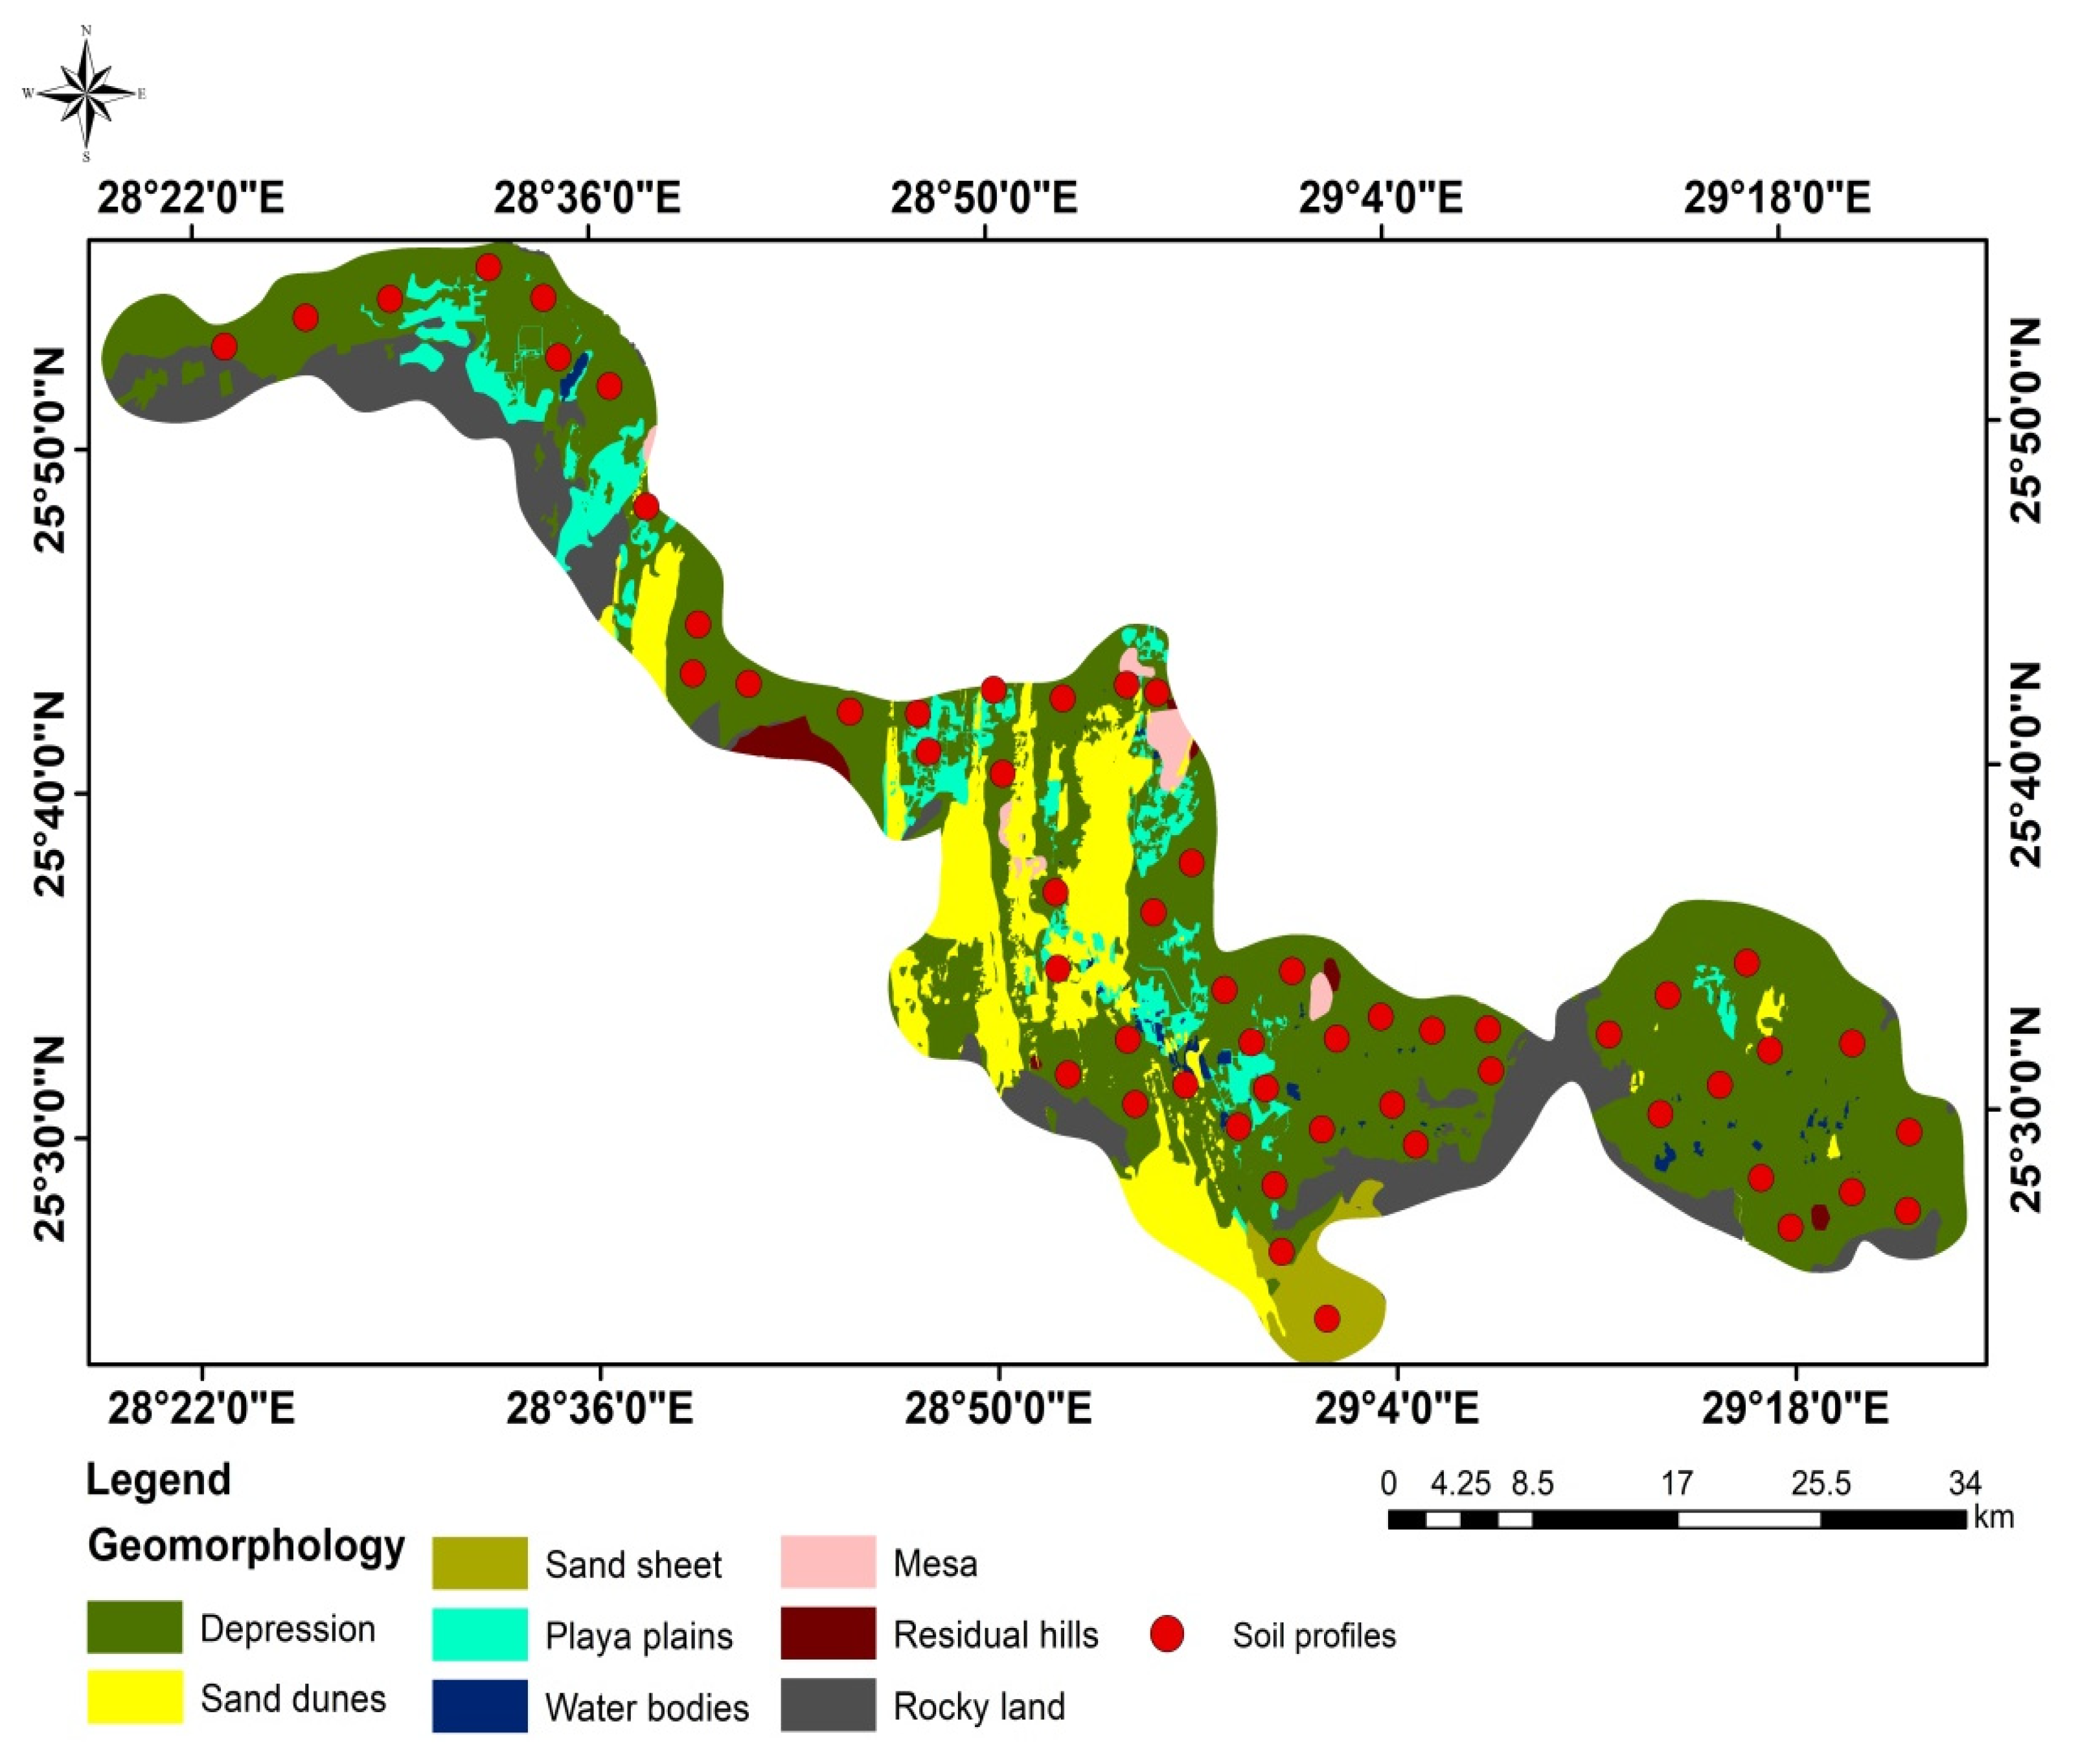
Fifty-five soil profiles were geo-referenced using the Global Positioning System (GPS) and were carried out based on the geomorphological map of the study area (Figure 2). The soil profiles were dug to a depth of 150 cm or until they reached the parent rock, and then they were described in accordance with FAO standards [43]. Disturbed and undisturbed soil samples (n = 211) were collected from the horizons of the investigated soil profiles in October 2019. Soil chemical analyses, i.e., the electrical conductivity of saturated soil extract (ECe), pH (1:1), cation exchange capacity (CEC), exchangeable sodium percentage (ESP), CaCO3, gypsum, and organic matter (OM), were performed according to Sparks et al. [44]. According to Flint [45], soil physical analyses, i.e., soil texture, total porosity (TP), bulk density (BD), infiltration rate (IR), and water holding capacity (WHC), were determined (Table 1).

2.3. Soil Quality (SQ) Appraisal

2.3.1. Indicator Selection

  • Total Data Set (TDS);
Sixteen parameters representing some measurable soil attribute that influence the capacity of soil to perform crop production or environmental functions were selected in TDS (Table 1). These parameters were used as a dataset for soil quality assessment due to their sensitivity in SQ appraising. For obtaining a unique value for the whole soil profile, the depth-weighted average value for each indicator (property) based on the thickness of each horizon to the whole depth of soil profile was calculated. Before calculations, soil pH values were converted to hydrogen ion concentrations and were then transformed back into pH values.
2.
Minimum Data et (MDS).
The MDS was established through the PCA. Only the factors with eigenvalues of >1 and those that explained at least 5% of the variation in the dataset were chosen. For each PC, only highly loaded variables (having absolute values within 10% of the highest factor loading) were retained for the MDS since they are the most representative of SQ [31]. If more than one variable was retained under a PC, a multi-variate correlation was used to decide which was included. Well-correlated variables were considered redundant, and thus highest loaded was only included in the MDS. When the highly weighted variables were uncorrelated, each was considered important and was selected in the MDS [15].

2.3.2. Indicator Scoring

A score ranging from zero to one was assigned to each indicator through the linear scoring function [24,50] using three standard scoring functions: low is better (Equation (1)), more is better (Equation (2)), and optimal range (Table 1).
LS = X min X
LS = X X max
where LS is the linear score, X is the indicator value, and Xmin and Xmax are the minimum and maximum value, respectively, of each indicator inside the current database. The more is better function was applied to indicators preferred when in high values, while the low is better function was applied to indicators which restrict good soil functionality when in high values. For optimum range function, indicators were scored as more is better up to a threshold value then scored as less is better above this threshold.

2.3.3. Developing Soil Quality Indices (SQIs)

  • Additive quality index (AQI);
This index was calculated according to Nabiollahi et al. [20] using the following equation:
A Q I = i = 0 n S n
where S is the score of the indicator and n is the number of indicators used in the index.
2.
Weighted additive quality index (WQI);
In this approach, each indicator was assigned a weight value by means of PCA using two ways: (i) variation score of PCA that refers to a continuously indexed set of vectors or functions that are centered at a mean and are used to depict the variation in a sample [19]; and (ii) communality score of the PCA (the sum of squared loadings across components) that refers to what proportion of the variance in the variable is due to the principal components, or the correlations between each variable and each individual factor [15,51]. For the TDS, weights were calculated using communality as the quotient of the communality of an indicator divided by the sum of the communality of all indicators. For the MDS, weights were calculated based on the two methods. The weights derived from variance were calculated as the variation of each respective PC (%) divided by the total percentage of variation of all PCs with eigenvectors > 1. To calculate weights derived from communality, the MDS was subjected to another PCA to extract communalities, thereby weights were calculated. The WQI was calculated according to Raiesi [24] as follows:
W Q I = i = 0 n W i × S i
where W is the weight value of the indicator and S is the PCA score of the indicator.
3.
Nemoro quality index (NQI).
This index evaluates soil quality based on the minimum and average scores of indicator [15,20], as follows:
N Q I = P a v e r 2 + P m i n 2 2 × n 1 n
where Paver and Pmin are the average and minimum of indicator scores, and n is the number of indicators included in calculations.

2.3.4. Soil Quality Classes

For each soil quality index (SQI), five grades were considered: very high (Q1), high (Q2), moderate (Q3), low (Q4), and very low (Q5). The range of values for each SQI was divided by the number of desired intervals (5). The division product was then used as the width for each interval. Adding this value to the lowest value of each SQI, the upper limit of the first interval was reached, and so on, successively, until the upper range of the SQI was reached [52].

2.4. Comparison between Indexing Models

A one-way ANOVA test was used to examine significant differences among indicators and indices methods. Furthermore, correlations among indices and regression between indicator methods were computed for a better examination of the relationship. Sensitivity analysis is a mathematical technique for determining which model parameters contribute to high variation in model predictions by investigating how variations in model parameters affect model outputs [53]. The sensitivity analysis was performed to identify the indicators that have the greatest influence on soil quality index model [54]. Sensitivity analysis investigates how the variation in the output of a numerical model can be attributed to variations of its input factors. For testing the accuracy and validation of each model, the sensitivity index (SI) was calculated as follows [27]:
S I = S Q I m a x S Q I m i n
where SQImax and SQImin are the maximum and minimum soil quality values, respectively, of the index observed under each indexing model. High sensitivity to a parameter indicates high accuracy of its optimal estimate, while low sensitivity suggests that the parameter is poorly identified and uncertainty is large [55]. So, the model with higher sensitivity indicates more accuracy due to being sensitive to soil management practices such as tillage and reconsolidation; no-tillage and surface residues; plants and crop rotations; irrigation, manure, and fertilization practices; and grazing management.

2.5. Statistical Analysis and Spatial Interpolation

The statistical analyses included descriptive statistics, analysis of variance (ANOVA), principal component analysis (PCA), correlation coefficients, and linear regressions were carried out using IBM SPSS 19.0 software and Microsoft Excel. The spatial interpolation of SQIs was executed using ArcGIS 10.2.2., and was performed using inverse distance weighting (IDW).

3. Results

3.1. Descriptive Statistics of Soil Indicators

A total of 16 soil parameters were analyzed as potential soil quality indicators. Descriptive statistics based on the weighted mean of the studied soil profile properties are shown in Table 2. The results indicated that the soils had a slope range of 0–2.2% with a mean of 0.4% and a depth range of 80–150 cm with an average of 130 cm. The studied soils had values of pH that ranged from 7.1 to 8.6 with a mean of 7.6, with a slight variation in the pH values. While the electrical conductivity of the saturated soil extract (ECe) varied from 2.3 to 165.8 dSm−1, with an average of 27.1 dSm−1 showed a big variation in ECe values. Exchangeable sodium percentage (ESP) ranged from 2.3 to 34.6% with a mean of 15.6% (Table 2).
Gravel content values indicated none to abundant gravel content in the investigated soil, as it ranged from 0.0 to 12.4%, with an average of 3.4%. In contrast to the soil pH, the particle size distribution (PSD) showed a wide variation in the fine earth (<2 mm diameter) with ranges of 18.9 to 72.0% with a mean of 48.7% for sand, 12.3 to 46.6% with a mean of 23% for silt, and 5.3 to 58.7% with a mean of 28.3% for clay (Table 2). The gypsum content did not exceed 100 g kg−1, and ranged from 19.2 to 91.3 g kg−1 with an average of 41.6 g kg−1. The soils showed a wide variation in CaCO3 (lime content) ranging from 53.1 to 548.6 g kg−1. In addition, cation exchange capacity (CEC) varied from very low to very high, as it ranged from 3.4 to 47.2 Cmol(+) kg−1 (Table 2). Soil water holding capacity (WHC) varied from 15.3 to 39.2% with an average of 26.9%. The infiltration rate (IR) was low to high as it varied from 0.08 to 2.13 in h−1 with an average of 0.5 in h−1. Bulk density (BD) varied from low to high, as it ranged from 1.1 to 1.8 Mg m−3 with a mean of 1.5 Mg m−3. The total porosity (TP) of the soil varied between 12.4 and 72.3%. Soil organic matter (OM) contents were very low to moderate and ranged from 1.0 to 20.4 g kg−1 with an average of 6.4 g kg−1 (Table 2).

3.2. Correlations among Soil Physicochemical Indicators

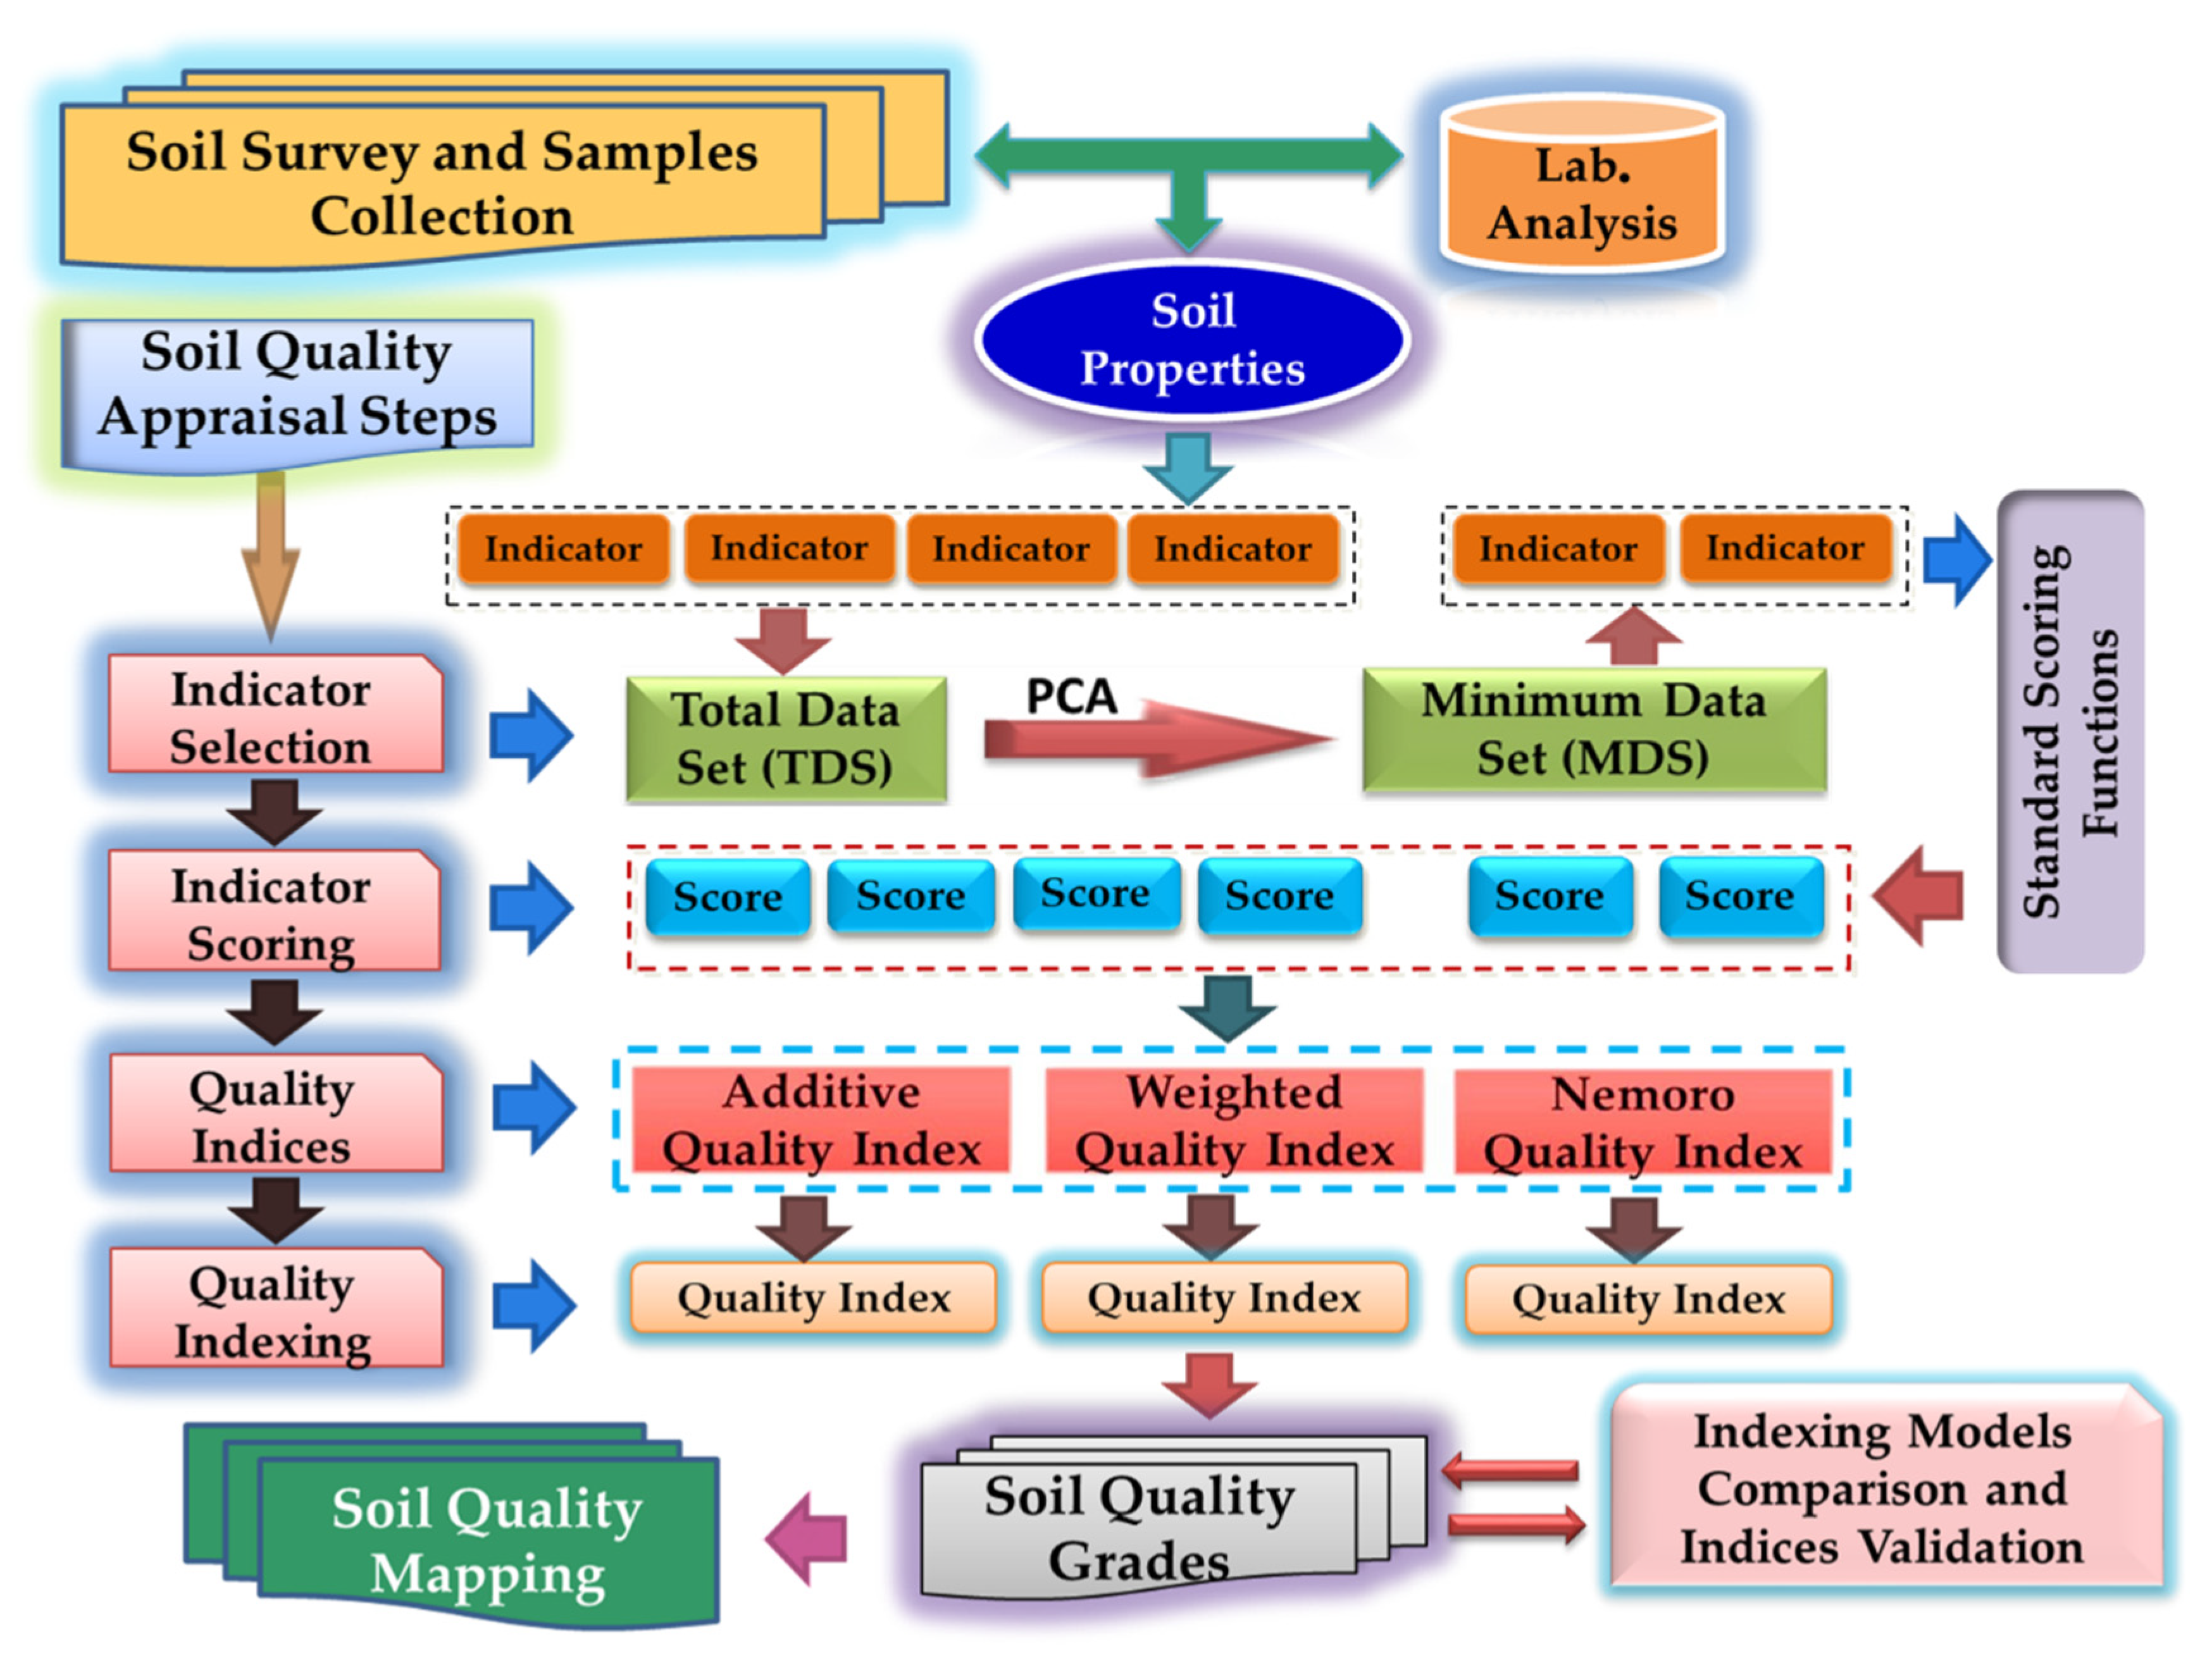
Correlation coefficients showed that there was a positive or negative correlation at p < 0.01 and/or p < 0.05 (Table 3). The result indicated that the clay had a moderate to strong positive correlation (r = 0.519 and 0.883, at p < 0.01) with WHC and CEC, respectively. While it had a strong to moderate negative correlation (r = −0.828, −0.525, and −0.558 at p < 0.01) with sand, IR, and CaCO3. Additionally, clay showed a negative correlation (p < 0.05) with gravel. The soil CEC showed a moderate to strong positive correlation (r = 0.688 and 0.823 at p < 0.01) with WHC and OM, respectively. While it had a low to moderate negative correlation (r = −0.756, −0.452, and −0.531, at p < 0.01) with sand, IR, and CaCO3, as well as negative correlation (p < 0.05) with depth and gravel. The parameter of CaCO3 showed a moderate positive correlation (p < 0.01) with gravel, sand, and IR but it showed a moderate negative correlation (p < 0.01) with OM and a negative correlation (p < 0.05) with WHC. Additionally, there was a moderate positive correlation (p < 0.01) between silt and porosity; OM and WHC; ECe and pH, and a moderate negative correlation (p < 0.01) between silt and sand. These findings revealed that the selected parameters had interrelationships and were correlated with each other. Figure 3 shows a summary of the methodology used to assess soil quality in the current study.

3.3. Principal Component Analysis (PCA) and MDS Selection Establishment

The first four PCs were chosen with eigenvalues ≥ 1 and explained 81.88% of the variance of the original data of soil indicators (Table 4). The variance contributions from the first, second, third, and fourth principal components (PCs) were 44.05%, 15.63%, 12.435%, and 9.85%, respectively (Table 4). The eigenvectors after VARIMAX rotation indicated that sand, clay, WHC, BD, and TP possessed the high loadings for the first principal component (PC1). These parameters were significantly correlated with sand (Table 3), therefore; sand with the highest loading value was selected to reflect the PC1. Gravel and ESP had the highest loadings under PC2 and PC4, respectively, thus they were considered. Concerning PC3, the depth, ECe, and gypsum content were high weighted, but the depth had the highest value, hence it was selected to represent the PC3. Accordingly, the PCA analysis reduced a total of 16 physicochemical parameters into four, which included sand, gravel, depth, and ESP in order to establish the MDS. According to the weighting method, weights based on the variation that had a large range of 0.120–0.538 compared with communality with a range of 0.222–0.273 (Table 4).

3.4. Soil Quality Assessment

Soil quality indices, including additive quality index (AQI), weighted quality index (WQI), and Nemoro quality index, were determined using the TDS and MDS approaches, which categorized the soil quality of the study area into five classes (Table 5).

3.4.1. According to TDS

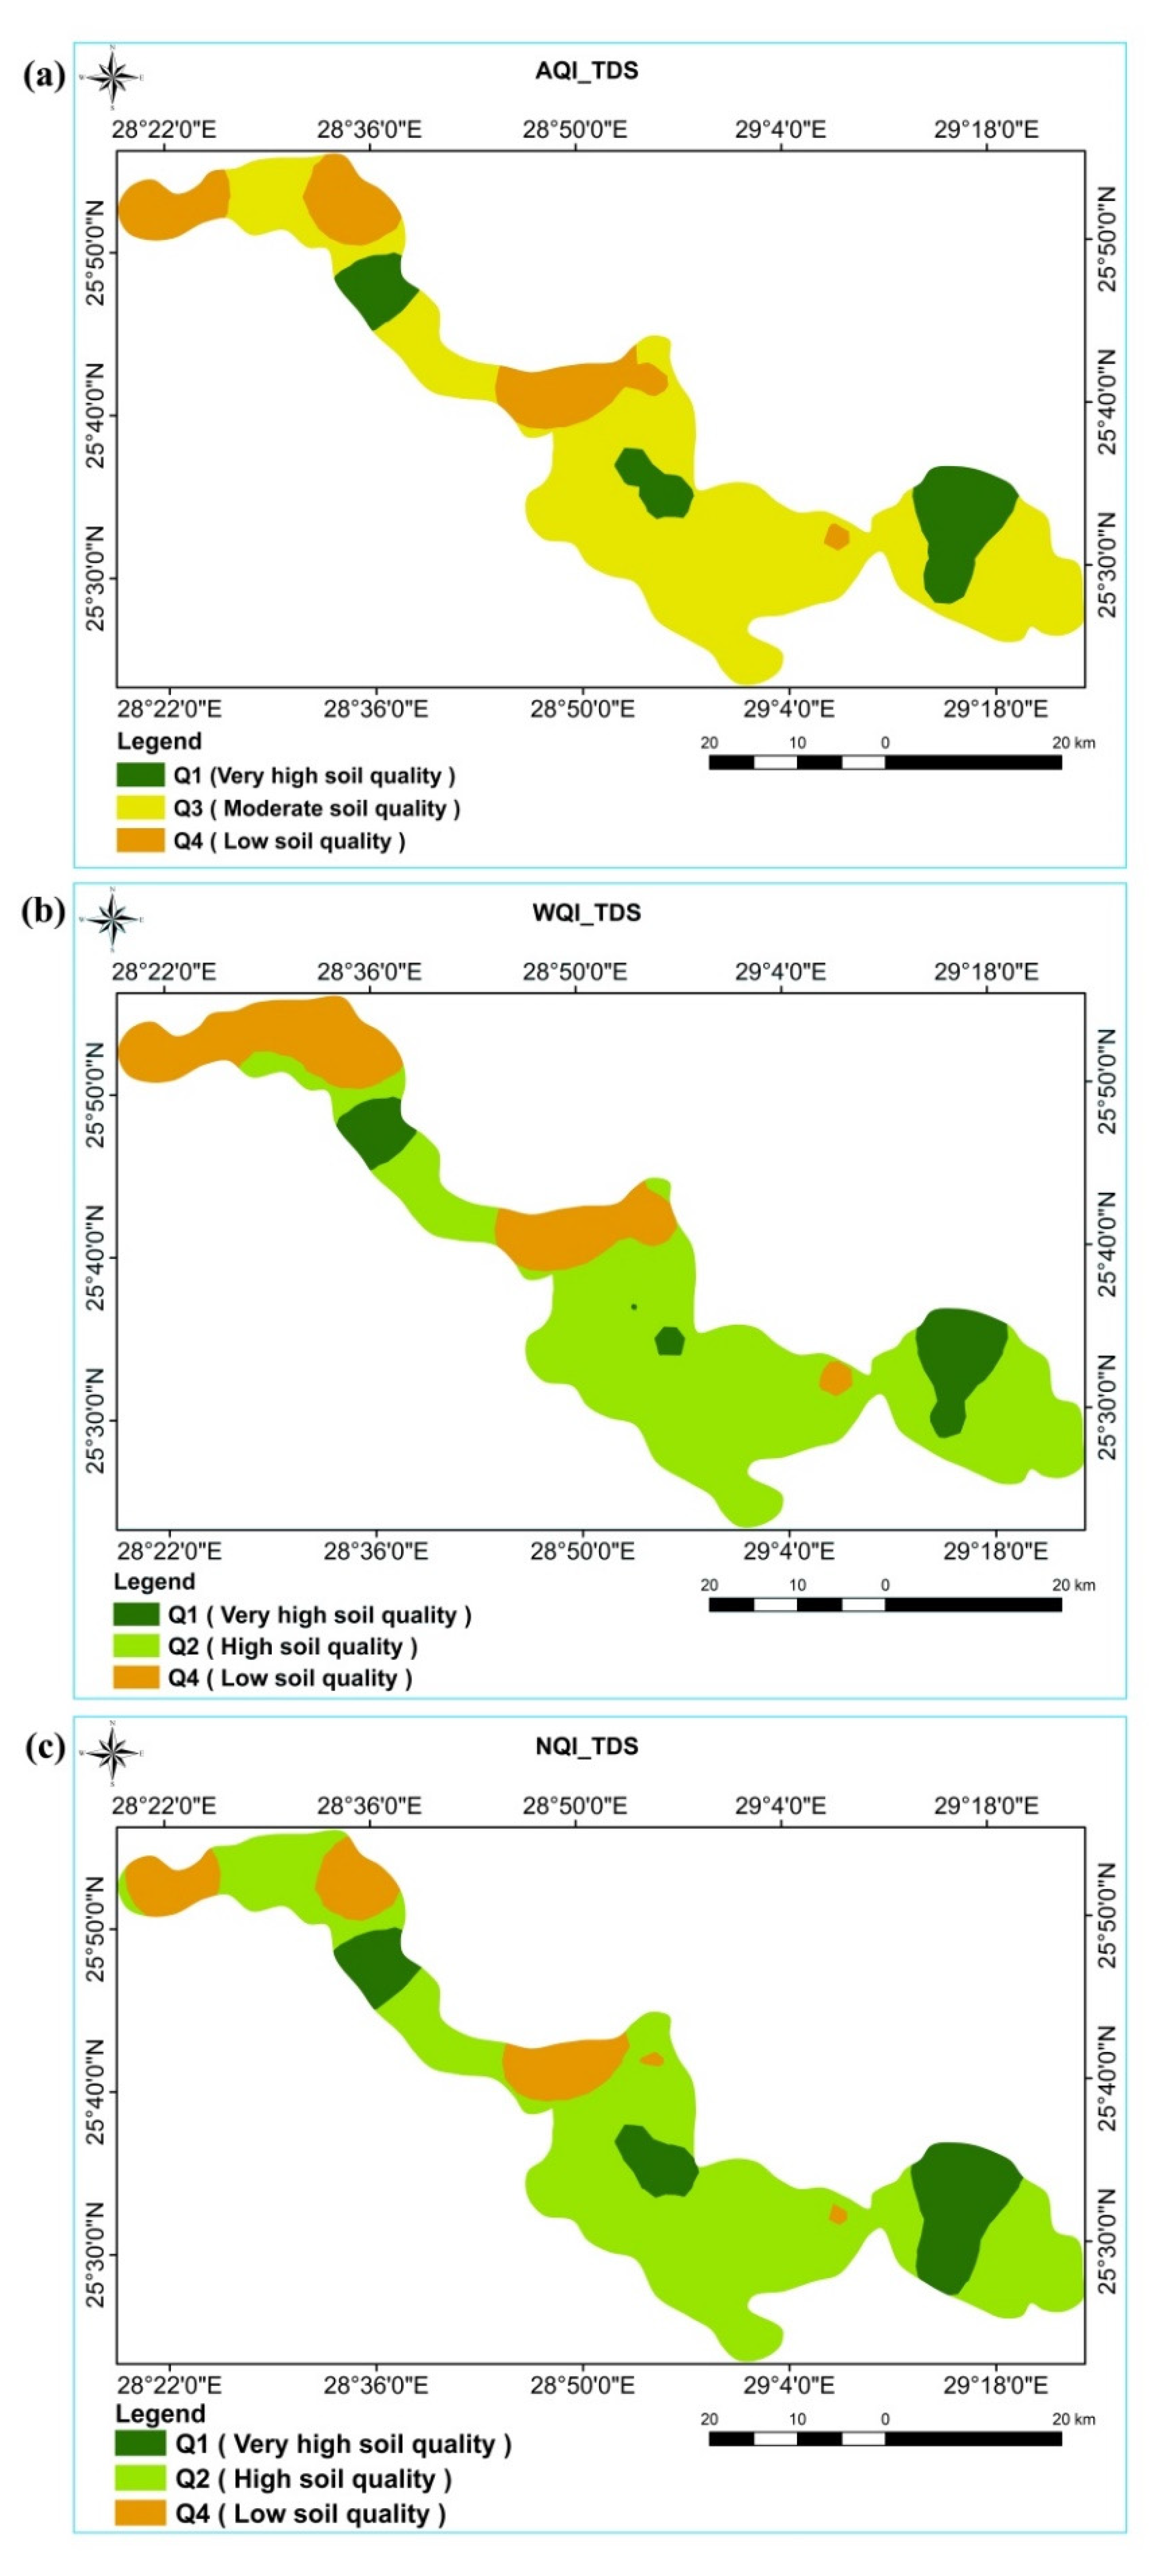
The results in Table 6 showed that the SQIs using the TDS ranged from 0.48 to 0.80, 0.46 to 0.78, and 0.32 to 0.55 for AQI, WQI, and NQI, respectively, with averages of 0.61 (Q3), 0.60 (Q2), and 0.42 (Q2) respectively. The spatial distribution of the SQ grades under various indicators and indices using the TDS (Table 6 and Figure 4) revealed that the high quality (Q2) was the predominant SQ grade when applying the NQI and WQI indices, while the moderate quality (Q3) was the predominant one when following the AQI index.
Based on the AQI model, the moderate soil quality (Q3) has occupied about two-thirds (67.3%) of the total investigated area and represented 984.0 km2, while the remaining area was belonged to the very high (Q1) and low (Q4) soil quality grades with an area of 200.0 km2 (13.7%) and 277.6 km2 (19.0%), respectively (Table 6). Regarding the WQI, the weights of indicators were extracted using PCA (Table 4) by following the communality method to calculate WQI based on TDS. When applying this model, the high soil quality (Q2) occupied about two-thirds (67.4%) of the total investigated area, while the rest of the area belonged to the very high (Q1) and low (Q4) soil quality grades by 7.9% and 24.7%, respectively (Table 6). Similarly, according to the NQI, the high soil quality (Q2) has occupied more than two-thirds (69.3%) of the total studied area, while the rest area was belonged to the very high (Q1) and low (Q4) soil qualities by 16.2% and 14.5%, respectively (Table 6).

3.4.2. According to MDS

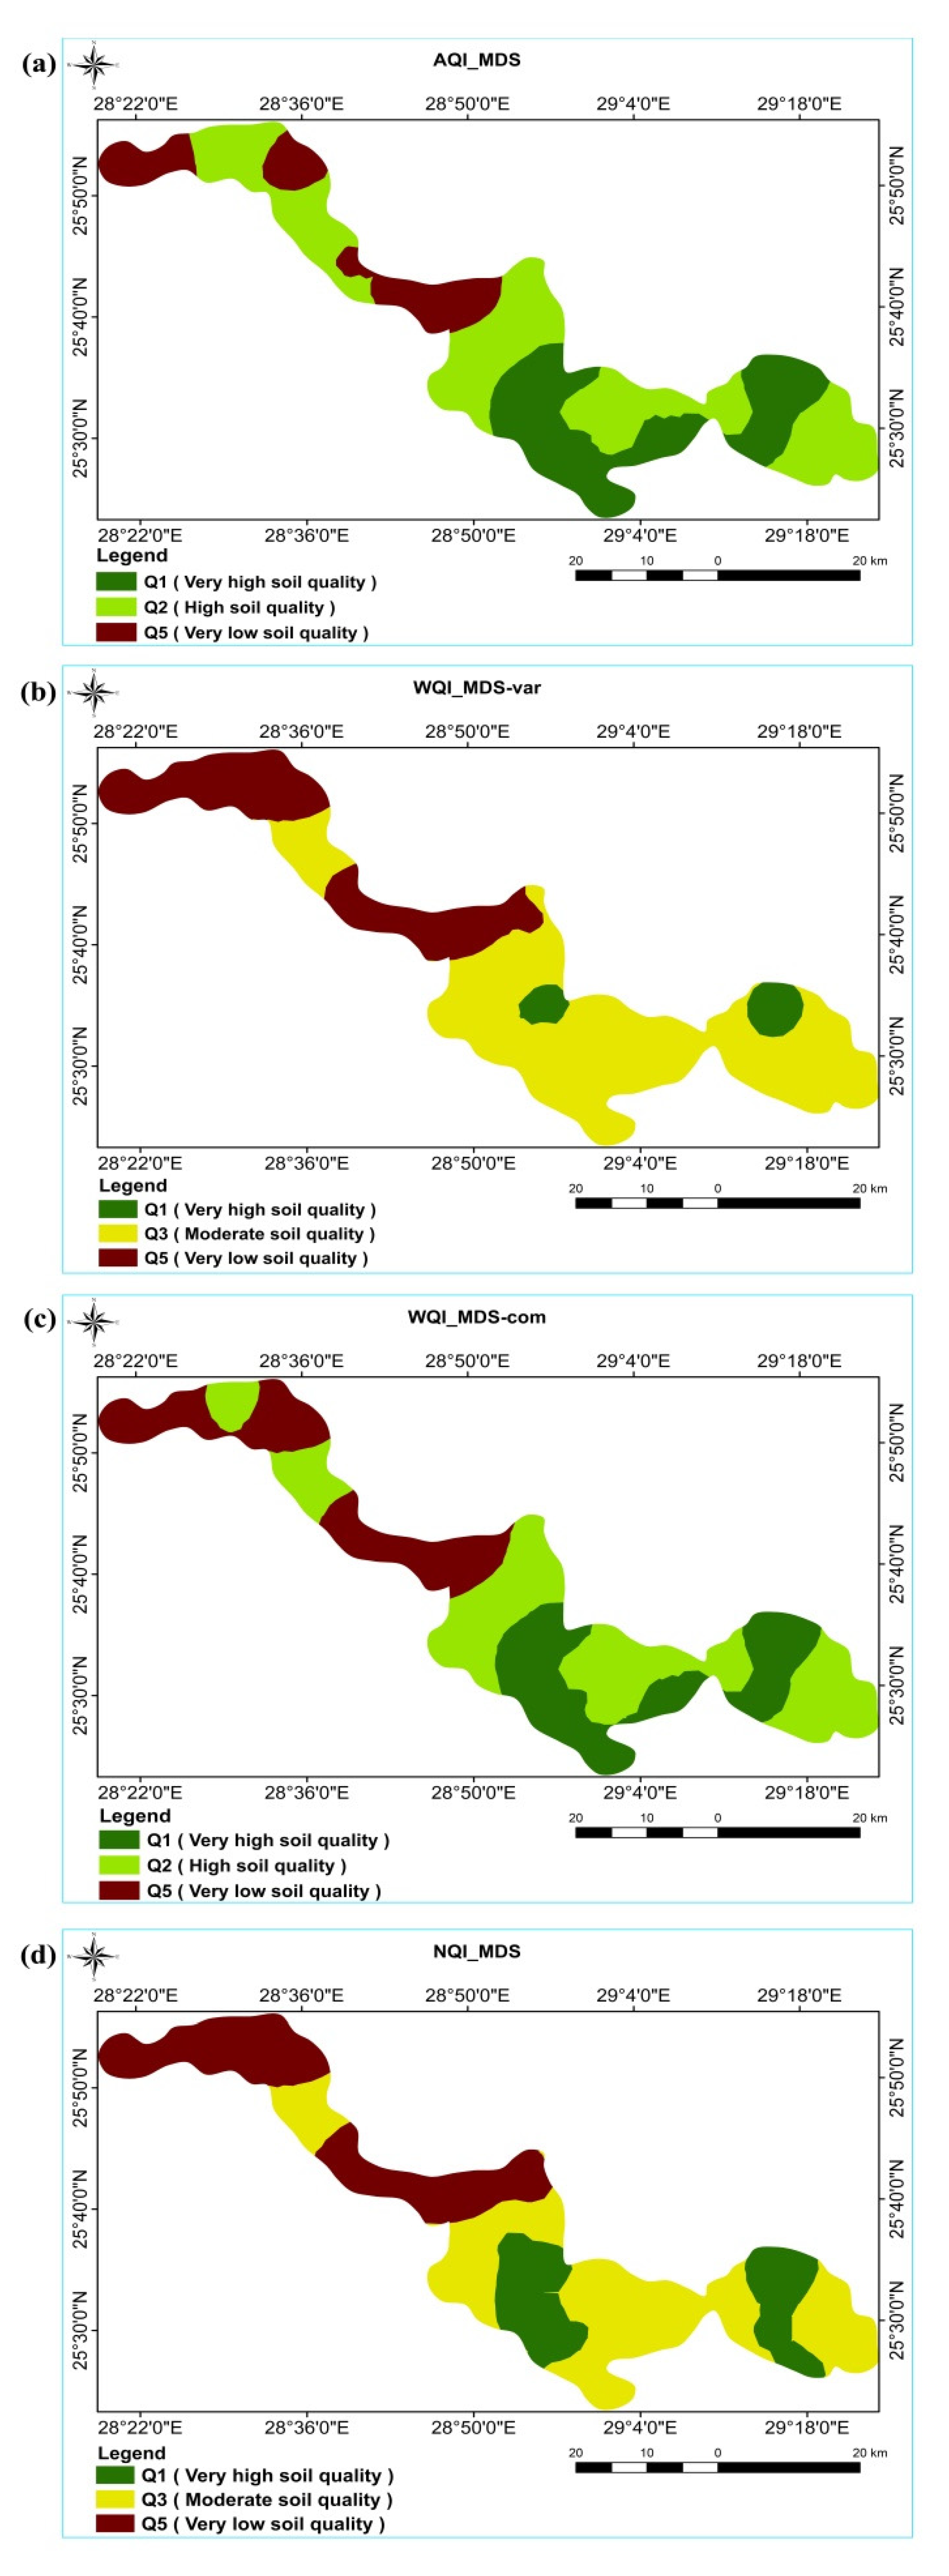
Factor analysis can help in reducing the number of indicators analyzed needed for indexing by identifying components that best account for the variability, thus minimizing data redundancy. The 16 SQ indicators were analyzed using a PCA. The first four PCs explained 81.9% of the variance of the original data (Table 4). Based on the results of PCA, sand, gravel, ESP, and depth were chosen as the key indicators to establish MDS for soil assessment (Table 4). The ranges of SQIs based on MDS were 0.28 to 0.76 with an average of 0.54 (Q2) for AQI; 0.27 to 0.78 with a mean of 0.48 (Q3) for WQIcom; 0.28 to 0.75 with an average of 0.53 (Q2) for WQIvar; and 0.11 to 0.41 with a mean of 0.28 (Q3) for NQI (Table 6). The high soil quality grade (Q2) was dominated when applying the AQI and WQIvar indices, while the moderate soil quality (Q3) was dominant by following the WQIcom and NQI indices (Table 6 and Figure 5).
Regarding the AQI model, soil quality grades were in the following order: Q2 > Q1 > Q5 by 56.0%, 26.5%, and 17.5%, respectively (Table 6). Under the WQIvar model, around two-thirds (66.1%) belonged to the moderate soil quality (Q3), followed by Q5 (29.0%) then Q1 (4.9%). On the other hand, results of the WQIcom index showed that soils of Q2 occupied 52.3% of the total investigated area, while the rest area belonged to Q1 (23.0%) and Q5 (24.7%), as shown in Table 6. Concerning the results of the NQI model based on MDS (Table 6), soil quality grades were allocated as follows: Q1 (18.7%), Q3 (50.8%), and Q5 (30.5%). The spatial distribution of soil quality grades was nearly similar among all indices within the TDS and between AQI and WQIcom with in the MDS. It also illustrated that good soil quality is located in the southeastern part of the study area and the majority of the center, while poor soil quality is found in the northwestern part and some parts of the center. In general, and based on the spatial distribution maps, in both cases (TDS and MDS) and under all indices, the soil quality decreased from the southeast to northwest of the map (Figure 4 and Figure 5).

3.5. Comparison of Indices

Analysis of variance (ANOVA), linear regression, and Pearson’s correlations were employed to compare the different indices. Analysis of variance (ANOVA) showed highly significant differences (p < 0.001) among SQIs within and between groups (TDS and MDS) (Table 7). Moreover, the linear regression and Pearson’s correlations showed significant correlations between SQIs calculated using MDS and TDS with different models. The linear regression coefficients (R2) between TDS and MDS were 0.75, 0.88, 0.74, and 0.77 for AQI, WQIvar, WQIcom, and NQI, respectively (Table 7). Similarly, Pearson’s correlation coefficients (p < 0.01) revealed significant correlations between SQIs calculated using MDS and TDS with all the different models (Table 7). There was a very strong correlation (r ≥ 0.9) between the WQIvar model based on MDS and all models that used TDS. While the moderate correlation (r = 0.5 or 0.6) was found among the other models that used MDS and all models in TDS (Table 7). Furthermore, there was a nearly perfect correlation (r ≥ 0.99) between all indices within TDS, as well as between AQI and WQIcom within MDS (Table 7). The highest correlation (r ≥ 0.9) and the most accurate predictions between MDS and TDS were obtained when applying the WQIvar. Results of the sensitivity index (SI) analysis (Table 7) revealed that SQIs could be arranged as follow: WQI-MDSvar (2.9) > AQI-MDS (2.7) = WQI-MDScom (2.7) > NQI-TDS (1.8) > AQI-TDS (1.7). = WQI-TDS (1.7) > NQI-MDS (1.6). The WQI-MDSvar model produced the highest sensitivity index value (2.9), while the NQI-MDS model produced the lowest one (1.6). Except for the NQI model, all soil quality indices based on the minimum dataset (MDS) gave higher sensitivity index values than their counterparts based on the total dataset (TDS) (Table 7).

4. Discussion

4.1. Soil Physicochemical Indicators Characterization

According to the results (Table 2), the studied soils were flat to gently undulating, and moderately deep to very deep. These findings indicate that the soil utilization in the study area was not restricted by slope or soil depth. The soil depths in Dakhla Oasis ranged from 70 to more than 150 cm [56]. According to Soil Science Division Staff [57], the soils were neutral to moderately alkaline, and slightly to extremely saline. Previous literature described the studied soils as neutral to slightly and/or moderately alkaline, with pH values ranging from 7.08 to 8.9 [9,56]. Exchangeable sodium percentage (ESP) indicate none to very high sodicity (alkalinity) hazards [58]. In arid and semi-arid regions, salinization and alkalinization prevail due to low rainfall and high temperature that aggravate the evaporation rate which is responsible for salt accumulate [59].
According to the USDA soil texture triangle classification, the soil texture of soils in the study area was classified into five dominated classes: sandy loam (coarse-textured soils), sandy clay loam, silt loam, loam (medium-textured soils), and clay (fine-textured soils), as shown in Table 2. According to Hamed and Khalafallah [56], soil texture classes ranged from loamy sand to clay texture, which is consistent with the current study findings. Soil texture is an inherent soil property that is primarily controlled by soil formation processes [16]. Furthermore, it is not considerably changed by land-use types or soil management in a short period of time. Due to the occurrence of a wide range of soil textures in the study area, it can be a substantial source of soil diversity. Soil texture is the major intrinsic factor that affects other soil properties [60]. In general, due to the dominance of medium-textured soils; the soils in the study area are suitable for cultivation without limitations regard to the texture if irrigation conditions are favorable [9].
Soil gypsum content is considered low in the study area [50], which could be attributed to a lack of gypsum application to the studied soils, and weakness in the pedogenic gypsum formation [9,61]. The studied soils showed a wide variation in CaCO3 due to the variation in soil types. Spatial variability of particle size distribution and CaCO3 among soils could be attributed to multi-origin parent materials of soils [1]. Soils under this study had cation exchange capacity (CEC) varied from very low to very high [62]. The high variability in CEC could be attributed to clay content and clay minerals type. According to Selmy [9], the dominated clay minerals were kaolinite, smectite, illite, and mixed phases (illite–smectite and vermiculite–chlorite). As a result, soils containing large amounts of clay minerals with a high specific surface (smectite and/or vermiculite) had a high cation exchange capacity and vice versa (kaolinite).
Soil water holding capacity (WHC) was varied with soil texture and was related to fine soil particles; the higher the percentages of silt and clay of the soil, the greater the WHC. It is a function of a variety of soil properties, such as texture, organic matter content, and soil aggregation [63,64]. The bulk density (BD) values ranged from low to high, with an average of 1.5 Mg m−3 [62]. These values are appropriate for crop root growth in the study area. Hamed and Khalafallah [56] found similar findings regarding BD values ranged from 1.22 to 1.73 Mg m−3 with a mean of 1.42 Mg m−3. Obviously, the soil texture had a large influence on the variation of soil bulk density values due to its effects on average pore size and mechanical resistance, as well as the decrease in soil organic matter content in the study area [65]. The infiltration rate (IR) ranged from low to high and was influenced by soil texture [47]. The findings revealed that coarse-textured soils (sandy loam) had the highest infiltration rates, while fine-textured soils (clay) had the lowest. The majority of the investigated soil profiles recorded infiltration rates that were close to the average (0.5 in h−1) which is within the optimum range (0.4 to 0.8 in h−1), indicating that water storage in the soil profile is not hampered by soil infiltration.
The total porosity of soils had a mean value of 35.3% (Table 2), and it varied with soil texture, increasing as the medium-sized particles (silt fraction) increased. Soil porosity is determined by the texture, arrangement of soil particles, and management practices [66,67]. The porosity of sandy surface soil can range from 35% to 50%, while fine-textured soil typically ranges from 40% to 60%. Compact subsoil may have as little as 25%–30% total pore space [66]. According to Hazelton and Murphy [62], soil organic matter content (OM) ranged from very low to moderate. However, the majority of the soils had very low organic matter content; this could be due to the sparse vegetation cover, high temperature, and a lack of organic fertilizer application in the study area [59]. The main issues limiting crop production in these soils are water availability, salinity, sodicity, and nutrient deficiency, and these can be addressed via attention to soil drainage, using modern irrigation methods, such as drip irrigation, and applying organic matter to increase water use efficiency.

4.2. Soil Indicators Relationships

Correlation matrix among soil indicators showed that there was a positive or negative correlation at p < 0.01 and/or p < 0.05 (Table 3). The positive correlation between clay and WHC, CEC; CEC and WHC, OM; silt and porosity; OM and WHC and the negative correlation between CEC and sand, indicating that the fine particles of clay, silt, and OM, unlike coarse ones of gravel and sand, have a higher specific surface area per unit, thereby increasing soil sorption, exchangeable capacities [68], and water retention [69]. Additionally, fine particles have the higher pore space compared with coarse one and thus increase soil porosity [69]. The fine fractions also induce decreases in water movement and infiltration by blocking the effective pores due to their small sizes, and bulk density for their relatively lower density of 1.0–1.6 Mg m−3 compared with 1.4–1.8 Mg m−3 for sands [70].
Regarding the action of CaCO3 content, it usually occurs in soils when in the size of sand, clay, and slit [71,72]; the more weathered the soil, the lower the CaCO3 content, and the larger the specific surface area [73]. As aridity conditions in the area are unfavorable for weathering, CaCO3 occurs in the sand-size fraction and thus had the same trend as coarse particles. According to Selmy [9], a microscopic examination of the sand fraction in the study area soils reveals that the minerals of the light fraction are dominated by quartz followed by calcite (CaCO3). The presence of carbonate sands (calcium carbonates in sand size) in the studied soils can explain the positive correlation between sand and CaCO3 [9]. The lime has been reported to be key factors for controlling soil functionality in arid and semi-arid regions [71,72].

4.3. Soil Quality

Soil quality assessment can provide the planners and decision makers with the necessary information they need to make informed decisions about soil quality degradation and the implementation of appropriate interventions. The AQI, WQI, and NQI determined using the TDS and MDS approaches categorized the soil quality of the study area into five classes according to the soil quality grades (Table 5). The five soil quality grades (Q1 to Q5) were recorded in the study area using the chosen methods and indices (Table 6).
According to the TDS, results of soil quality assessment revealed that the high quality (Q2) was the predominant SQ grade (67 to 69% of the total area) when applying the NQI and WQI indices. While, the moderate quality (Q3) was the predominant one (67% of the study area) when following the AQI index. The high correlation (r = 0.99) between the different indices within the TDS explains the similarity in the represented area of soil quality grades (the close percentages). Similarly, the spatial distribution of soil grades among indices is close to each other within the TDS. The TDS refers to common indicators collection based on correlations in between [23]. The MDS findings showed that the high soil quality grade (Q2) was dominated (50 to 56% of the total area) when applying the AQI and WQIcom indices, while the moderate soil quality (Q3) was dominant (51 to 66%) by following the WQIvar and NQI indices. For all the indices, moderate soil quality (Q3) and high soil quality (Q2) were identified as dominant classes in the study area.
The SQIs were calculated using three established indices, which were all significantly correlated within the two methods (TDS and MDS), indicating that any of them can be used to assess the soil quality of the study area. These findings are consistent with those of other authors [19], who used the same indices to compare soil quality index and found that all indices were correlated. Overall, the spatial distribution patterns of soil quality derived from the three indices were nearly similar among all indices within the TDS and between AQI and WQIcom within the MDS [15]. Furthermore, it illustrated that soil type (sand fraction) has an effect on the poor soil quality which is found in the northwestern part and some parts of the center, as well as the good one which is located in the southeastern part, and the majority of the center of the study area [15,19]. Moreover, based on TDS, approximately 80 to 85% of the total study area, as well as 70 to 75%, according to MDS, were identified as suitable soils or have slight limitations ranging from moderate to very high quality. The remaining 20 to 30% had high to severe limitations due to being classified as low or very low quality, necessitating appropriate management practices. The sand fraction with high weight was the chosen indicator of PC1 which considered in MDS; this confirms that, using quantitative indices, the minimum dataset (MDS) is expected to identify the most sensitive and representative indicators of soil quality.
According to the statistical analyses, the matching between TDS and MDS indicated that there was a moderate to the strong relationship between TDS and MDS with all three indices, as we expected [15,19,20]. Furthermore, MDS had the highest sensitivity of the indices, indicating that it accurately represented TDS, as well as the soil quality in the study area, as we had hypothesized. A precise assessment of soil quality (SQ) is required for sustainable land use planning, the application of appropriate agricultural management practices, and the establishment of new settlements, particularly in arid lands to accommodate population growth. The WQIvar was the best performing model in assessing soil quality in the study area due to its highest sensitivity. Thus, this model among all the used quantitative indices could be used to track temporal changes in SQ in the study area (as arid lands) in response to management practices (e.g., tillage and reconsolidation; no-tillage and surface residues; plants and crop rotations; irrigation, manure, and fertilization practices; and grazing management) and environmental risks (e.g., water deficiency and drought conditions, climate change, salinization, desertification, soil erosion, soil nutrient deficiency, high evaporation, sand drifting, and dune movement).

4.4. Indices Validation

Using MDS will provide many benefits. such as lower data storage costs, efficient data management, faster data analysis, less time consuming, and more reliable decision making. According to the statistical analysis, which included analysis of variance (ANOVA), linear regression, Pearson’s correlations, and sensitivity index analysis [27], there was a moderate to a strong relationship between TDS and MDS with all the three indices as we expected. The linear regression coefficients (R2) values between TDS and MDS using the selected indices revealed that 72 to 87% of the variation in TDS is due to variation in MDS and vice versa (Table 7). The highest value of R2 between TDS and MDS was recorded when the WQIvar model was applied. Similarly, the highest correlation (r = 0.9) and the most accurate predictions between MDS and TDS were obtained when applying the WQIvar. In terms of sensitivity index values, it was confirmed that the WQIvar is the best model to represent soil quality in the study area, with the highest value (Table 7). The high sensitivity of the model indicates high accuracy of its optimal estimate, while low sensitivity suggests poorly identified and uncertainty is large [55].
Consequently, the WQIvar was determined to be the best model for representing soil quality in the study area. These findings indicated that the MDS accurately represented TDS in the study area when WQIvar applied, and could be used to track temporal changes in soil quality [15,18]. It also demonstrated that the PCA is a powerful tool to establish the MDS for different soil types [30,31]. These findings are consistent with previous studies on arid and semi-arid agricultural lands. Rahmanipour et al. [23] mentioned that a strong correlation was obtained between MDS and TDS when employing WQI compared with NQI. Furthermore, Nabiollahi et al. [20] found that the WQI and MDS approaches can accurately represent the TDS rather than AQI or NQI.
The use of indicator weights, which differentiate the importance of each soil property independently, could explain this trend. For the WQI, all selected indicators are considered, but their relative importance is prioritized, with highly weighted parameters serving as key factors [18]. According to the weighting method, weight based on the variation approach was superior compared with communality. This is due to weights based on the variation that had a large range of 0.120–0.538 compared with communality with a range of 0.222–0.273 (Table 4). This agrees with Chen et al. [27] who found a higher correlation between MDS and TDS when weights based on variation compared with communality. For the NQI model, in contrast, indicator with the lowest score is added to the average of the scores, assigning it preferential importance. In other words, NQI gives more importance to the lowest score parameter, without considering its weight [15,18]. Similar to NQI, the AQI is determined without considering the relative weights of indicators. Moreover, AQI is easier to implement rather than other models, whereas SQI can be assessed after measuring any number of soil parameters. Furthermore, when compared to other methods, this procedure is relatively simple, as scoring requires only a review of the literature and expert opinion based on the local and regional conditions [19,20]. Hence, selecting the MDS generated from a large dataset of soil quality indicators is a critical step in soil quality assessment due to financial and time constraints, as well as to avoid collinearity.

5. Conclusions

The current study compared two methods of indicator selections (TDS and MDS) and three different indices (AQI, WQI, and NQI) to evaluate soil quality in a typical desert region of the Dakhla Oasis. A total of 16 soil physicochemical parameters were used as soil quality indicators. This study employed the principal component analysis (PCA) to establish the minimum dataset (MDS) required for assessing the soil quality in the study area. The results clearly demonstrated that, among a total of 16 soil physicochemical properties, only soil depth, sand fraction, gravel content, and exchangeable sodium percentage (ESP) were considered in the MDS approach. Furthermore, based on the TDS, Q2 (high quality) was the predominant grade in the study area when WQI and NQI models were used, while Q3 (moderate quality) was the predominated one when AQI was applied. Furthermore, for the MDS, Q2 (high quality) dominated when applying AQI and WQIvar, while Q3 (moderate quality) dominated using WQIcom and NQI. In general, based on TDS, approximately 80 to 85% of the total study area, as well as 70 to 75%, according to MDS, were identified as suitable soils or have slight limitations ranging from moderate to very high quality. The remaining 20 to 30% had high to severe limitations due to being classified as low or very low quality.
This study provided evidence that there is a moderate to strong positive correlation and linear relationship between TDS and MDS under all the selected indices. So, it is recommended that the MDS could be used to assess soil quality rather than TDS in arid lands. According to indices validation results, the best performing index was weighted quality index (WQI) when calculated using the MDS approach as well as weights based on the variance of PCA. Thus, this model among all the used quantitative indices could be used to track temporal changes in SQ in the study area (as arid lands) in response to management practices (e.g., tillage and reconsolidation; no-tillage and surface residues; plants and crop rotations; irrigation, manure, and fertilization practices; and grazing management) and environmental risks (e.g., water deficiency and drought conditions, climate change, salinization, desertification, soil erosion, soil nutrient deficiency, high evaporation, sand drifting, and dune movement). However, indicators (soil parameters) included in the MDS should be assessed over time because they are changeable variables influenced by agricultural practices and environmental conditions.

Author Contributions

Conceptualization, S.A.H.S., S.H.A.A.-A. and M.E.F.; methodology, S.A.H.S., S.H.A.A.-A., M.E.F.; software, S.A.H.S. and M.E.F.; validation, S.A.H.S., S.H.A.A.-A., R.J.-B., F.J.G.-N. and M.E.F.; formal analysis, S.A.H.S. and M.E.F.; investigation, S.A.H.S., S.H.A.A.-A. and M.E.F.; resources, S.A.H.S., S.H.A.A.-A., R.J.-B., F.J.G.-N. and M.E.F.; data curation, S.A.H.S., S.H.A.A.-A., R.J.-B., F.J.G.-N. and M.E.F.; writing—original draft preparation, S.A.H.S., S.H.A.A.-A., M.E.F. and R.J.-B.; writing—review and editing, S.A.H.S., S.H.A.A.-A., R.J.-B., F.J.G.-N. and M.E.F.; visualization, S.A.H.S., S.H.A.A.-A., F.J.G.-N. and M.E.F.; supervision, S.H.A.A.-A., R.J.-B. and F.J.G.-N. All authors have read and agreed to the published version of the manuscript.

Funding

This research received no external funding.

Institutional Review Board Statement

Not applicable.

Informed Consent Statement

Not applicable.

Data Availability Statement

Data available on request from the authors.

Conflicts of Interest

The authors declare no conflict of interest.

References

  1. Embabi, N.S. The karstified carbonate platforms in the Western Desert. In Landscapes and Landforms of Egypt: Landforms and Evolution, 1st ed.; Embabi, N.S., Ed.; Springer: Cham, Switzerland, 2018; pp. 85–104. [Google Scholar]
  2. Gad, A.A. Land capability classification of some western desert Oases, Egypt, using remote sensing and GIS. Egypt. J. Remote Sens. Space Sci. 2015, 18, 9–18. [Google Scholar] [CrossRef] [Green Version]
  3. Abd El-Ghani, M.M.; Huerta-Martínez, F.M.; Hongyan, L.; Qureshi, R. The desert of Egypt. In Plant Responses to Hyperarid Desert Environments, 1st ed.; Abd El-Ghani, M.M., Huerta-Martínez, F.M., Hongyan, L., Qureshi, R., Eds.; Springer: Cham, Switzerland, 2017; pp. 11–20. [Google Scholar]
  4. Kato, H.; Kimura, R.; Elbeih, S.F.; Iwasaki, E.; Zaghloul, E.A. Land use change and crop rotation analysis of a government well district in Rashda village—Dakhla Oasis, Egypt based on satellite data. Egypt. J. Remote Sens. Space Sci. 2012, 15, 185–195. [Google Scholar] [CrossRef] [Green Version]
  5. Abdel Meguid, M. Key features of the Egypt’s water and agricultural resources. In Conventional Water Resources and Agriculture in Egypt, 1st ed.; Negm, A.M., Ed.; Springer: Berlin/Heidelberg, Germany, 2017; pp. 39–99. [Google Scholar] [CrossRef]
  6. Khalifa, H.E.; Moussa, H.A. Soil and agriculture after the Aswan High Dam. In Irrigated Agriculture in Egypt: Past, Present and Future, 1st ed.; Satoh, M., Aboulroos, S., Eds.; Springer: Cham, Switzerland, 2017; pp. 81–124. [Google Scholar]
  7. Hamdi, H.; Abdelhafez, S. Agriculture and soil survey in Egypt. In Soil Resources of Southern and Eastern Mediterranean Countries; Zdruli, P., Steduto, P., Lacirignola, C., Montanarella, L., Eds.; CIHEAM-IAMB: Bari, Italy, 2001; pp. 111–130. [Google Scholar]
  8. Hussein, A.M. Characterization of some soil families in Dakhla Oasis. Azhar J. Agric. Res. 1993, 18, 339–352. [Google Scholar]
  9. Selmy, S.A.H. Studies on some Shale-Derived Soils in the New Valley, Egypt. Master’s Thesis, Assiut University, Assiut, Egypt, 2005. [Google Scholar]
  10. Karlen, D.L.; Mausbach, M.J.; Doran, J.W.; Kline, R.G.; Harris, R.F.; Schuman, G.E. Soil quality: A concept, definition, and framework for evaluation. Soil Sci. Soc. Am. J. 1997, 61, 4–10. [Google Scholar] [CrossRef] [Green Version]
  11. De La Rosa, D. Soil quality evaluation and monitoring based on land evaluation. Land Degrad. Dev. 2005, 16, 551–559. [Google Scholar] [CrossRef]
  12. Schloter, M.; Nannipieri, P.; Sørensen, S.J.; Elsas, J.D. Microbial indicators for soil quality. Biol. Fertil. Soils 2018, 54, 1–10. [Google Scholar] [CrossRef] [Green Version]
  13. Karlen, D.L.; Cambardella, C.A.; Kovar, J.L.; Colvin, T.S. Soil quality response to long-term tillage and crop rotation practices. Soil Tillage Res. 2013, 133, 54–64. [Google Scholar] [CrossRef] [Green Version]
  14. Vasu, D.; Singh, S.K.; Ray, S.K.; Duraisami, V.P.; Tiwary, P.; Chandran, P.; Nimkar, A.M.; Anantwar, S.G. Soil quality index (SQI) as a tool to evaluate crop productivity in semi-arid Deccan plateau, India. Geoderma 2016, 282, 70–79. [Google Scholar] [CrossRef]
  15. Guo, L.L.; Sun, Z.G.; Ouyang, Z.; Han, D.R.; Li, F.D. A comparison of soil quality evaluation methods for Fluvisol along the lower Yellow River. Catena 2017, 152, 135–143. [Google Scholar] [CrossRef]
  16. Brejda, J.; Moorman, T.; Karlen, B.; Dao, T. Identification of regional soil quality factors and indicators: I. Central and southern high plains. Soil Sci. Soc. Am. J. 2000, l64, 2115–2124. [Google Scholar] [CrossRef]
  17. Marzaioli, R.; D’Ascoli, R.; De Pascale, R.A.; Rutigliano, F.A. Soil quality in a Mediterranean area of Southern Italy as related to different land use types. Appl. Soil Ecol. 2010, 44, 205–212. [Google Scholar] [CrossRef]
  18. Qi, Y.; Darilek, J.L.; Huang, B.; Zhao, Y.; Sun, W.; Gu, Z. Evaluating soil quality indices in an agricultural region of Jiangsu Province, China. Geoderma 2009, 149, 325–334. [Google Scholar] [CrossRef]
  19. Mukherjee, A.; Lal, R. Comparison of soil quality index using three methods. PLoS ONE 2014, 9, 1–15. [Google Scholar] [CrossRef] [Green Version]
  20. Nabiollahi, K.; Taghizadeh-Mehrjardi, R.; Kerry, R.; Moradian, S. Assessment of soil quality indices for salt-affected agricultural land in Kurdistan Province, Iran. Ecol. Indic. 2017, 83, 482–494. [Google Scholar] [CrossRef]
  21. Zhou, M.; Xiao, Y.; Li, Y.; Zhang, X.; Wang, G.; Jin, J.; Ding, G.; Liu, X. Soil quality index evaluation model in responses to six-year fertilization practices in Mollisols. Arch. Agron. Soil Sci. 2020. [Google Scholar] [CrossRef]
  22. Karaca, S.; Dengiz, O.; Demirağ Turan, I.; Özkan, B.; Dedeoğlu, M.; Gülser, F.; Sarging, B.; Demirkaya, S.; Ay, A. An assessment of pasture soils quality based on multi-indicator weighting approaches in semi-arid ecosystem. Ecol. Indic. 2021, 121. [Google Scholar] [CrossRef]
  23. Rahmanipour, F.; Marzaioli, R.; Bahrami, H.A.; Fereidouni, Z.; Bandarabadi, S.R. Assessment of soil quality indices in agricultural lands of Qazvin Province, Iran. Ecol. Indic. 2014, 40, 19–26. [Google Scholar] [CrossRef]
  24. Raiesi, F. A minimum data set and soil quality index to quantify the effect of land use conversion on soil quality and degradation in native rangelands of upland arid and semiarid regions. Ecol. Indic. 2017, 75, 307–320. [Google Scholar] [CrossRef]
  25. Rezaee, L.; Moosavi, A.A.; Davatgar, N.; Sepaskhah, A.R. Soil quality indices of paddy soils in Guilan province of northern Iran: Spatial variability and their influential parameters. Ecol. Indic. 2020, 117, 106566. [Google Scholar] [CrossRef]
  26. Doran, J.W.; Parkin, B.T. Defining and assessing soil quality. In Defining Soil Quality for a Sustainable Environment; Doran, J.W., Coleman, D.C., Bezdicek, D.F., Stewart, B.A., Eds.; Soil Science Society of America: Madison, WI, USA, 1994; Volume 35, pp. 1–21. [Google Scholar]
  27. Chen, Y.D.; Wang, H.Y.; Zhou, J.M.; Xing, L.; Zhu, B.S.; Zhao, Y.C.; Chen, X.Q. Minimum data set for assessing soil quality in farmland of Northeast China. Pedosphere 2013, 23, 564–576. [Google Scholar] [CrossRef]
  28. Bo, Y.J.; Zhu, Q.K.; Bao, Y.X.; Zhao, W.J.; Zhao, Y.M.; Zhang, H.Z. A comparative study on three methods of soil quality evaluation of microtopography in the semi-arid Loess Plateau, China. J. Environ. Biol. 2015, 36, 325–330. [Google Scholar] [PubMed]
  29. Pascazioa, S.; Crecchioa, C.; Scagliolaa, M.; Mininnib, A.N.; Dichiob, B.; Xiloyannisb, C.; Sofoc, A. Microbial-based soil quality indicators in irrigated and rainfed soilportions of Mediterranean olive and peach orchards undersustainable management. Agric. Water Manag. 2018, 195, 172–179. [Google Scholar] [CrossRef]
  30. Armenise, E.; Redmile-Gordon, M.A.; Stellacci, A.M.; Ciccarese, A.; Rubino, P. Developing a soil quality index to compare soil fitness for agricultural use under different managements in the Mediterranean environment. Soil Tillage Res. 2013, 130, 91–98. [Google Scholar] [CrossRef]
  31. Biswas, S.; Hazra, G.C.; Purakayastha, T.J.; Saha, N.; Mitran, T.; Roy, S.S.; Basak, N.; Mandal, B. Establishment of critical limits of indicators and indices of soil quality in rice-rice cropping systems under different soil orders. Geoderma 2017, 292, 34–48. [Google Scholar] [CrossRef]
  32. Reeves, D.W. The role of soil organic matter in maintaining soil quality in continuous cropping systems. Soil Tillage Res. 1997, 43, 131–167. [Google Scholar] [CrossRef]
  33. Goovaerts, P. Geostatistics in soil science: State of the art and perspectives. Geoderma 1999, 89, 1–45. [Google Scholar] [CrossRef]
  34. Delbari, M.; Afrasiab, P.; Loiskandl, W. Using sequential Gaussian simulation to assess the field-scale spatial uncertainty of soil water content. Catena 2009, 79, 163–169. [Google Scholar] [CrossRef]
  35. Delbari, M.; Loiskandl, W.; Afrasiab, P. Uncertainty assessment of soil organic carbon content spatial distribution using geostatistical stochastic simulation. Soil Res. 2010, 48, 27–35. [Google Scholar] [CrossRef]
  36. Kravchenko, A.; Bullock, D.G. A comparative study of interpolation methods for mapping soil properties. Agronomy 1999, 91, 393–400. [Google Scholar] [CrossRef]
  37. Delbari, M.; Afrasiab, P.; Loiskandl, W. Geostatistical analysis of soil texture fractions on the field scale. Soil Water Res. 2011, 6, 173–189. [Google Scholar] [CrossRef] [Green Version]
  38. Robinson, T.P.; Metternicht, G. Testing the performance of spatial interpolation techniques for mapping soil properties. Comput. Electron. Agric. 2006, 50, 97–108. [Google Scholar] [CrossRef]
  39. Bogunovic, I.; Trevisani, S.; Seput, M.; Juzbasic, D.; Durdevic, B. Short-range and regional spatial variability of soil chemical properties in an agro-ecosystem in eastern Croatia. Catena 2017, 154, 50–62. [Google Scholar] [CrossRef]
  40. Rosemary, F.; Indraratne, S.P.; Weerasooriya, R.; Mishra, U. Exploring the spatial variability of soil properties in an Alfisol soil catena. Catena 2017, 150, 53–61. [Google Scholar] [CrossRef]
  41. Egyptian Meteorological Authority (EMA). The Normals for Dakhla Station, (1960–2010); Ministry of Civil Aviation: Cairo, Egypt, 2011.
  42. Soil Survey Staff. Keys to Soil Taxonomy, 12th ed.; USDA-Natural Resources Conservation Service: Washington, DC, USA, 2014; p. 360. [Google Scholar]
  43. FAO. Guidelines for Soil Description, 4th ed.; Food and Agriculture Organization of the United Nation: Rome, Italy, 2006; p. 97. [Google Scholar]
  44. Sparks, D.L.; Page, A.L.; Helmke, P.A.; Loeppert, R.H. Methods of Soil Analysis: Part. 3-Chemical Methods; Sparks, D.L., Page, A.L., Helmke, P.A., Loeppert, R.H., Soltanpour, P.N., Tabatabai, M.A., Johnston, C.T., Sumner, M.E., Eds.; Soil Science Society of America and American Society of Agronomy: Madison, WI, USA, 1996; p. 1390. [Google Scholar]
  45. Jacob, H.D.; Clarke, G.T. Methods of Soil Analysis: Part 4 Physical Methods; Jacob, H.D., Clarke, G.T., Eds.; Soil Science Society of America: Madison, WI, USA, 2002; p. 1692. [Google Scholar]
  46. FAO. Irrigation Water Management. Training Manual No. 1—Introduction to Irrigation; Brouwer, C., Goffeau, A., Heibloem, M., Eds.; Food and Agriculture Organization of the United Nation: Rome, Italy, 1985. [Google Scholar]
  47. Karlen, D.; Wollenhaupt, N.C.; Erbach, D.C.; Berry, E.C.; Swan, J.B.; Eash, N.S.; Jordahl, J.L. Crop residue effects on soil quality following 10-years of no-till corn. Soil Tillage Res. 1994, 31, 149–167. [Google Scholar] [CrossRef]
  48. Karlen, D.; Wollenhaupt, N.C.; Berry, E.C.; Swan, J.B.; Eash, N.S.; Jordahl, J.L. 1994b. Long-term tillage effects on soil quality. Soil Tillage Res. 1994, 32, 313–327. [Google Scholar] [CrossRef]
  49. FAO. Management of gypsiferous soils. In Soils Bulletin 62; Food and Agriculture Organization of the United Nation: Rome, Italy, 1990. [Google Scholar]
  50. Yu, P.; Liu, S.; Zhang, L.; Li, Q.; Zhou, D. Selecting the minimum data set and quantitative soil quality indexing of alkaline soils under different land uses in northeastern China. Sci. Total Environ. 2018, 616–617, 564–571. [Google Scholar] [CrossRef] [PubMed]
  51. McGarigal, K.; Cushman, S.A.; Stafford, S. Multivariate Statistics for Wildlife and Ecology Research, 1st ed.; McGarigal, K., Cushman, S.A., Stafford, S., Eds.; Springer: New York, NY, USA, 2013; p. 233. [Google Scholar]
  52. Sánchez-Navarro, A.; Gil-Vázquez, J.M.; Delgado-Iniesta, M.J.; Marín-Sanleandro, P.; Blanco-Bernardeau, A.; Ortiz-Silla, R. Establishing an index and identification of limiting parameters for characterizing soil quality in Mediterranean ecosystems. Catena 2015, 131, 35–45. [Google Scholar] [CrossRef]
  53. Ferretti, F.; Saltelli, A.; Tarantola, S. Trends in sensitivity analysis practice in the last decade. Sci. Total Environ. 2016, 568, 666–670. [Google Scholar] [CrossRef] [PubMed]
  54. Cude, C.G. Oregon Water Quality Index: A Tool for Evaluating Water Quality Management Effectiveness. J. Am. Water Resour. Assoc. 2001, 37, 125–137. [Google Scholar] [CrossRef]
  55. Pianosi, F.; Beven, K.; Freer, J.; Hall, J.W.; Rougier, J.; Stephenson, D.B.; Wagener, T. Sensitivity analysis of environmental models: A systematic review with practica workflow. Environ. Model. Softw. 2016, 79, 214–223. [Google Scholar] [CrossRef]
  56. Hamed, M.H.; Khalafallh, M.Y. Available nutrients and some soil properties of El-Qasr soils, El-Dakhla Oasis, Egypt. Int. J. Environ. Agric. Biotechnol. 2017, 2, 3243–3249. [Google Scholar] [CrossRef] [Green Version]
  57. Soil Science Division Staff. Soil Survey Manual; Ditzler, C., Scheffe, K., Monger, H.C., Eds.; Government Printing Office: Washington, DC, USA, 2017; p. 587.
  58. FAO. Salt-affected soils and their management. In Soils Bulletin 39; Food and Agriculture Organization of the United Nation: Rome, Italy, 1988. [Google Scholar]
  59. Jafari, M.; Tavili, A.; Panahi, F.; Zandi Esfahan, E.; Ghorbani, M. Characteristics of arid and desert ecosystems. In Reclamation of Arid Lands, 1st ed.; Jafari, M., Tavili, A., Panahi, F., Zandi Esfahan, E., Ghorbani, M., Eds.; Springer: Cham, Switzerland, 2018; pp. 21–91. [Google Scholar]
  60. Schoenholtz, S.H.; Van Miegroet, H.; Burger, J.A. A review of chemical and physical properties as indicators of forest soil quality: Challenges and opportunities. For. Ecol. Manag. 2001, 138, 335–356. [Google Scholar] [CrossRef]
  61. Hashemi, S.S.; Baghernejad, M.; Khademi, H. Micromorphology of gypsum crystals in southern Iranian soils under different moisture regimes. J. Agric. Sci. Technol. 2011, 13, 273–288. [Google Scholar]
  62. Hazelton, P.; Murphy, B. Interpreting Soil Test Results: What Do All the Numbers Mean? 3rd ed.; Hazelton, P., Murphy, B., Eds.; CSIRO Publishing: Victoria, Australia, 2017; p. 200. [Google Scholar]
  63. Hudson, B.D. Soil organic-matter and available water capacity. J. Soil Water Conserv. 1994, 49, 189–194. [Google Scholar]
  64. Saxton, K.E.; Rawl, W.J.; Romberger, J.S.; Papendick, R.I. Estimating generalized soil-water characteristics from texture. Soil Sci. Soc. Am. J. 1986, 50, 1031–1036. [Google Scholar] [CrossRef]
  65. Naghdi, R.; Solgi, A.; Labelle, E.R.; Nikooy, M. Combined effects of soil texture and machine operating trail gradient on changes in forest soil physical properties during ground-based skidding. Pedosphere 2020, 30, 508–516. [Google Scholar] [CrossRef]
  66. Hao, X.; Ball, B.C.; Culley, J.L.B.; Carter, M.R.; Parkin, G.W. Soil density and porosity. In Soil Sampling and Methods of Analysis, 2nd ed.; Carter, M.R., Gregorichpp, E.G., Eds.; CRC Press, Taylor & Francis Group: Boca Raton, FL, USA, 2006; pp. 743–760. [Google Scholar]
  67. Chang, Y.; Rossi, L.; Zotarelli, L.; Gao, B.; Shahid, M.; Sarkhosh, A. Biochar improves soil physical characteristics and strengthens root architecture in Muscadine grape (Vitis rotundifolia L.). Chem. Biol. Technol. Agric. 2021, 8, 7. [Google Scholar] [CrossRef]
  68. Blume, H.P.; Brümme, G.W.; Fleige, H.; Horn, R.; Kandeler, E.; Kögel-Knabner, I.; Kretzschmar, R.; Stahr, K.; Wilke, B.M. Chemical properties and processes. In Scheffer/Schachtschabel Soil Science, 1st ed.; Springer: Berlin/Heidelberg, Germany, 2016; pp. 123–174. [Google Scholar]
  69. Blume, H.P.; Brümme, G.W.; Fleige, H.; Horn, R.; Kandeler, E.; Kögel-Knabner, I.; Kretzschmar, R.; Stahr, K.; Wilke, B.M. Physical properties and processes. In Scheffer/Schachtschabel Soil Science, 1st ed.; Springer: Berlin/Heidelberg, Germany, 2016; pp. 175–283. [Google Scholar]
  70. McCarty, L.B.; Hubbard, L.R.; Quisenberry, V. Soil physical and moisture properties. In Applied Soil Physical Properties, Drainage and Irrigation Strategies, 1st ed.; McCarty, L.B., Hubbard, L.R., Quisenberry, V., Eds.; Springer: Cham, Switzerland, 2016; pp. 1–72. [Google Scholar]
  71. Saedi, T.; Shorafa, M.; Gorji, M.; Khalili Moghadam, B. Indirect and direct effects of soil properties on soil splash erosion rate in calcareous soils of the central Zagross, Iran: A laboratory study. Geoderma 2016, 271, 1–9. [Google Scholar] [CrossRef]
  72. Khaledian, Y.; Brevik, E.C.; Pereira, P.; Cerda, A.; Fattah, M.A.; Tazikeh, H. Modeling soil cation exchange capacity in multiple countries. Catena 2017, 158, 194–200. [Google Scholar] [CrossRef] [Green Version]
  73. Zech, W. Geology and soils. In Tropical Forestry Handbook, 2nd ed.; Pancel, L., Köhl, M., Eds.; Springer: Berlin/Heidelberg, Germany, 2016; pp. 93–283. [Google Scholar]
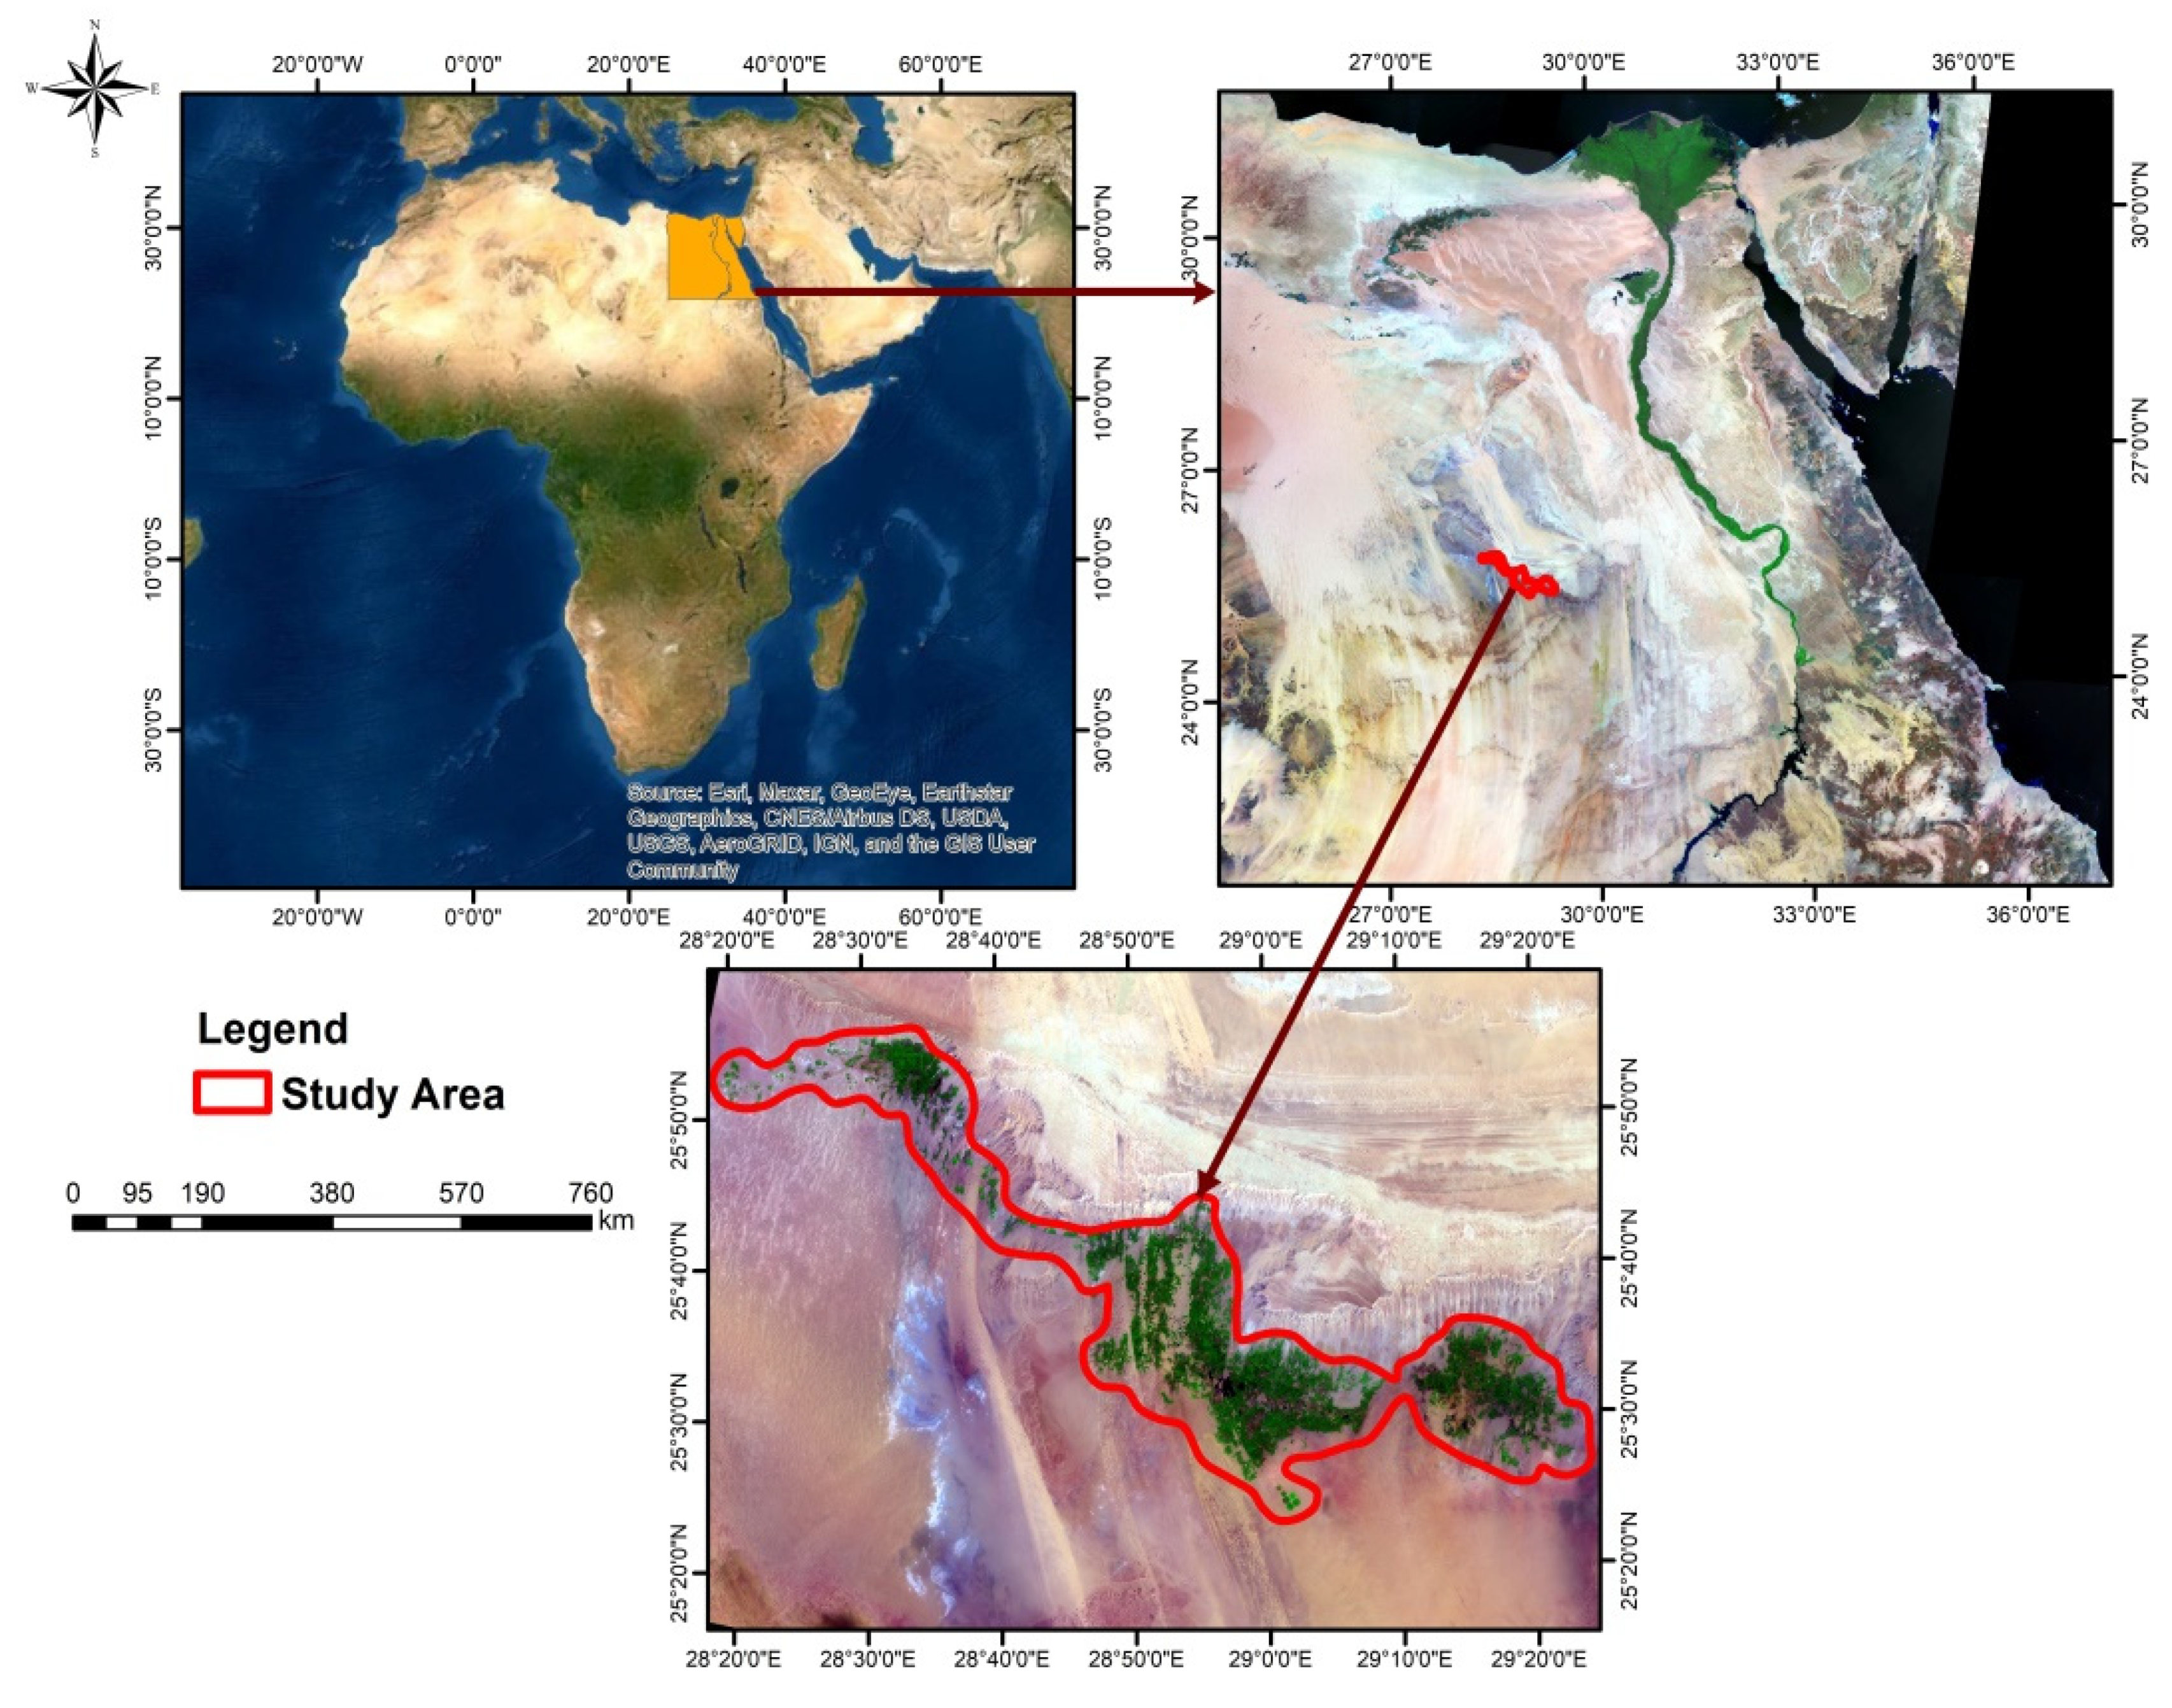
Figure 1. Location map of the study area relative to maps of Egypt (top right) and the Middle East and Africa (top left).
Land 10 01074 g001
Figure 2. Geomorphological map of the study area and soil sampling site.
Land 10 01074 g002
Figure 3. Methodology flowchart for soil quality assessment.
Land 10 01074 g003
Figure 4. Soil quality grades based on total data set (TDS): (a) Additive quality index (AQI); (b) Weighted quality index (WQI); and (c) Nemoro quality index (NQI).
Land 10 01074 g004
Figure 5. Soil quality grades based on minimum data set (MDS): (a) additive quality index (AQI); (b) weighted quality index-variation of PCA score (WQI-var); (c) weighted quality index- communality of the PCA score (WQI-com); and (d) Nemoro quality index (NQI).
Land 10 01074 g005
Table 1. Standard scoring function (SSF) of physicochemical indicators to assess soil quality.
IndicatorAssociated Soil FunctionSSFOptimal RangeLimits
References
DepthRooting relations and erosionMB
GravelFertility, structure, erosion & water retentionLB
SandLB [27]
SiltMB
ClayOR15–45%[30]
OMMB
WHCWater storage and availabilityMB
IROR0.4–0.8 in h−1[46]
BDSoil structureLB
TPWater and air movementOR40–60%[47,48]
ECeMicrobial activity and plant growthOR0.2–2 dS m−1[23]
pHNutrients and rooting relationsOR6.5–7.5[20]
CECNutrient retentionMB
ESPWater infiltration and movementLB
CaCO3
Gypsum
Root penetration and water relationsOR10–100 g kg−1[49]
OR30–100 g kg−1[49]
OM = organic matter; WHC = water holding capacity; IR = infiltration rate; BD = bulk density; TP = total porosity; ECe = electrical conductivity of the soil saturation extract; CEC = cation exchange capacity; ESP = exchangeable sodium percentage; MB = more is better; LB = low is better; OR = optimum range.
Table 2. Descriptive statistics of the weighted mean of the studied soil profiles properties (n = 211).
PropertyRangeMinimumMaximumMeanSDCV%SkewnessKurtosis
Slope (%)2.20.02.20.40.6148.02.35.0
Profile depth (cm)70.080.0150.013019.015.3−0.5−0.5
Gravel (%)12.40.012.43.43.4100.01.10.7
Sand (%)53.118.972.048.715.632.1−0.3−0.8
Silt (%)34.312.346.623.08.838.31.21.0
Clay (%)53.45.358.728.314.049.60.5−0.5
WHC (%)23.915.339.226.97.628.10.3−1.3
IR (in h−1)2.10.082.130.51.292.22.04.7
BD (Mg m−3)0.71.11.81.50.426.10.5−0.2
Porosity (%)70.112.472.335.317.649.80.5−0.5
ESP (%)32.32.334.615.67.950.80.30.2
CaCO3 (g kg−1)495.553.1548.6156.1112.271.92.25.5
Gypsum (g kg−1)72.119.291.341.620.850.11.30.8
pH (1:1)1.57.18.67.60.45.20.5−0.5
ECe (dSm−1)163.52.3165.827.138.7142.82.56.5
OM (g kg−1)19.41.020.46.45.280.91.62.2
CEC (Cmol(+)kg−1)43.83.447.219.913.065.40.8−0.4
Texture classC; SCL; SiL; L; SL
n = number of soil samples; SD = standard deviation; CV = coefficient of variation; WHC = water holding capacity; IR = infiltration rate; BD = bulk density; ECe = electrical conductivity of the soil saturation extract; CEC = cation exchange capacity; ESP = exchangeable sodium percentage; OM = organic matter; soil texture grade: C = clay; SCL = sandy clay loam; SL = sandy loam; SiL = silt loam; L = loam.
Table 3. Correlation matrix among soil indicators (n = 211).
IndicatorSlopeDepthGravelSandSiltClayWHCIRBdPorosityECepHCECESPCaCO3GypsumOM
Slope1.000
Depth−0.1781.000
Gravel−0.369 *0.0041.000
Sand−0.351 *0.1070.402 *1.000
Silt−0.0130.252−0.156−0.452 **1.000
Clay0.399 *−0.278−0.349 *−0.828 **−0.1261.000
WHC0.388 *−0.129−0.205−0.387 *−0.1420.519 **1.000
IR−0.1050.0370.0200.338 *0.236−0.525 **−0.1421.000
BD−0.0360.0570.2830.118−0.175−0.021−0.307−0.1131.000
Porosity−0.1410.1300.100−0.2040.506 **−0.0910.2020.162−0.1841.000
ECe−0.260−0.0790.2710.254−0.275−0.109−0.089−0.252−0.369 *−0.1611.000
pH−0.417 *−0.0080.2390.300 *−0.216−0.199−0.229−0.230−0.213−0.1020.780 **1.000
CEC0.628 **−0.300 *−0.340 *−0.756 **−0.0680.883 **0.688 **−0.452 −0.0780.095−0.144−0.2361.000
ESP−0.0780.133−0.120−0.1810.488 **−0.106−0.274−0.188−0.2740.425 *0.1330.2510.0001.000
CaCO3−0.2730.1870.506 **0.558 **−0.100−0.558 **−0.305 *0.511 **0.231−0.043−0.031−0.030−0.531 **−0.2721.000
Gypsum−0.068−0.0960.307 *−0.211−0.0010.2350.177−0.0830.0550.1590.307 *0.0780.267−0.004−0.0731.000
OM0.629 **−0.245−0.400 *−0.614 **−0.0250.698 **0.603 **−0.279−0.064−0.080−0.188−0.1400.823 **−0.002−0.454 **−0.0291.000
n = Number of soil samples; * = Correlation is significant at the level 0.05; ** = Correlation is significant at the level 0.01.
Table 4. Results of the principal component analysis (PCA) for soil indicators in Dakhla Oasis.
Principal ComponentPC1PC2PC3PC4CommunalitiesIndicator Weight
Eigenvalue7.052.501.981.58 Total datasetMinimum dataset
Variance (%)44.0515.6312.359.85
Cumulative (%)44.0559.6872.0381.88
IndicatorEigenvectorsCommunalityVarianceCommunality
Depth0.0870.030−0.7470.2680.6390.0490.1510.222
Gravel−0.2680.8020.0790.0880.7290.0560.1910.273
Sand−0.9710.1170.150−0.0670.9840.0750.5380.242
Silt0.8130.419−0.260−0.1210.9180.070
Clay0.887−0.3640.0290.1580.9450.072
WHC0.936−0.254−0.0400.1600.9680.074
IR−0.7380.434−0.0530.3040.8280.063
BD−0.9280.3490.035−0.0090.9850.075
TP0.928−0.349−0.0360.0090.9850.075
ECe−0.1660.1140.729−0.4380.7640.058
pH−0.2470.5720.2790.0600.4690.036
CEC0.810−0.3240.1140.2150.8210.063
ESP−0.066−0.1980.208−0.9150.9240.0710.1200.262
CaCO3−0.4750.573−0.1660.1150.5960.045
Gypsum0.1770.0970.7400.2770.7260.055
OM0.654−0.4650.1070.4070.820.063
Boldface factor loading are considered high weighted. Underlined and italic face factor loading is selected as MDS.
Table 5. Soil quality grades classification criteria for indices within indicator methods.
IndexIndicatorSoil Quality Grade
Very LowLowModerateHighVery High
Q5Q4Q3Q2Q1
AQITDS<0.480.48–0.550.55–0.620.62–0.69>0.69
MDS<0.300.30–0.400.40–0.500.50–0.60>0.60
WQITDS<0.460.46–0.530.53–0.600.60–0.67>0.67
MDScom<0.330.33–0.460.46–0.590.59–0.72>0.72
MDSvar<0.290.29–0.390.39–0.490.49–0.59>0.59
NQITDS<0.320.32–0.370.37–0.420.42–0.47>0.47
MDS<0.170.17–0.230.23–0.290.29–0.35>0.35
AQI = additive quality index; WQI = weighted quality index; NQI = Nemoro quality index; TDS = total dataset; MDS = minimum dataset; com = communality; var = variance.
Table 6. Minimum, maximum, mean, and grades of soil quality indices using two indicator approaches.
IndicatorTotal Dataset (TDS)Minimum Dataset (MDS)
IndexAQIWQINQIAQIWQIcomWQIvarNQI
Minimum0.48Q40.46Q40.32Q40.28Q50.27Q50.28Q50.11Q5
Maximum0.80Q10.78Q10.55Q10.76Q10.78Q10.75Q10.41Q1
Mean0.61Q30.60Q20.42Q20.54Q20.48Q30.53Q20.28Q3
Soil Quality GradeArea
km2%km2%km2%km2%km2%km2%km2%
V. high (Q1)200.013.7115.27.9236.016.2387.026.5337.023.072.04.9273.118.7
High (Q2)--985.567.41013.669.3818.856.0764.352.3----
Moderate (Q3)984.067.3--------966.366.1742.350.8
Low (Q4)277.619.0360.924.7212.014.5--------
V. low (Q5------255.217.5360.224.7423.429.0446.230.5
AQI = additive quality index; WQI = weighted quality index; NQI = Nemoro quality index; com = communality; var = variance; V = very.
Table 7. Results of analysis of variance (ANOVA), Pearson correlations, sensitivity analysis, and the linear regression coefficients (R2) for soil quality indices.
Source of VarianceSum of SquaresDfMean SquareFSignificantSIR2
Between Groups2.43460.40625.4390.000
Within Groups3.6842310.016
Total6.118237
IndexAQI-TDSAQI-MDSWQI-TDSWQI-MDS-varWQI-MDS-comNQI-TDSNQI-MDS
AQI-TDS1 1.70.75
AQI-MDS0.609 **1 2.7
WQI-TDS0.997 **0.556 **1 1.70.88
WQI-MDS-var0.917 **0.774 **0.902 **1 2.9
WQI-MDS-com0.595 **0.999 **0.543 **0.766 **1 2.70.74
NQI-TDS0.992 **0.565 **0.992 **0.874 **0.552 **1 1.80.77
NQI-MDS0.588 **−0.1340.632 **0.479 **−0.1420.614 **11.6
AQI = Additive Quality Index; WQI = Weighted Quality Index; NQI = Nemoro Quality Index; TDS = Total Dataset; MDS = Minimum Dataset; com = Communality; var = Variance; SI = Sensitivity Index; ** = Correlation is significant at the level 0.01.
Publisher’s Note: MDPI stays neutral with regard to jurisdictional claims in published maps and institutional affiliations.