Abstract
Industrial transformation and upgrading is a key variable for developing countries to become developed countries. In China’s institutional environment, the central government’s decisions regarding the spatial allocation of land resources cause a differentiation in the evolution of industrial structures and formats among regions, generating significant impacts on urban industrial transformation and upgrading (UITU), with important policy implications. Using panel data from 276 prefecture-level cities in China from 2007 to 2019, this study constructs a spatial panel econometric model and a mediating effect model to reveal how land spatial misallocation (LSM) affects UITU. The results show that, LSM is not conducive to UITU, and this adverse effect is greater in cities with a relative land supply shortage than in cities with a relative land supply surplus. Further research finds that the LSM caused by the relative land supply shortage affects the UITU mainly through intermediate mechanisms that crowd out the investments and financing for real industries and inhibit residents’ demand and innovation, and the LSM caused by the relative land supply surplus affects the UITU mainly through intermediate mechanisms that enhance the survival of low-end industries and disrupt the institutional environment. From these findings, this study not only puts forward specific policy recommendations for optimizing the allocation of land resources in China to promote UITU, but also discusses the implications for related research and practice in other countries.
1. Introduction
Industrial transformation and upgrading are critical to the development of modern society. Many countries in the world adopted various measures to adjust their industrial structure to achieve sustainable development [1,2,3]. As China’s economy gradually shifts from a stage of high-speed growth to a stage of high-quality development, promoting urban industrial transformation and upgrading (UITU) gradually became one of the government’s priorities and a focus of attention for scholars and policymakers [4]. With regard to achieving UITU, development economics argues that the two important driving forces are technological innovation and resource allocation [5]. For example, some studies noted that the main forces driving UITU in developed countries are the allocation of human capital in a market-oriented manner and scientific and technological progress [6], and other studies focused on the influence of factors such as resource endowment [7], marketization level [2], openness to the outside world [8,9], policy environment [10,11], fiscal and financial policies [12,13], and human capital level [14,15] on UITU. UITU is inevitably shaped and promoted by the abovementioned factors. However, the existing research on UITU does not adequately address resource allocation in China’s institutional environment. In particular, research on the impact of land resource allocation on UITU is lacking. In fact, in China’s institutional environment, UITU also cannot be achieved without the optimal allocation of land factors based on the situation by a competent government.
Market-oriented reform in China followed a “progressive” path. Government interventions in and regulation of resource allocation are common, especially in the allocation of land resources. Due to the government’s monopoly on land supply, management based on quota allocations has very obvious nonmarket characteristics [16]. The government’s decisions regarding land resource allocation can drive the evolution of the industrial structure and format and exert an important impact on UITU. Since the turn of the 21st century, as regional “balanced development” is one-sidedly understood as the “uniform distribution” of economic aggregates among regions, the Chinese central government adjusted the spatial allocation of economic resources through the implementation of strategies, such as the development of western China and central China [17]. Regarding land resources, the central government implemented a land supply policy that favors the central and western regions [17,18], in turn leading to the formation of population–land spatial misallocation (LSM) and capital-LSM, triggering a series of economic and social problems. For example, population-LSM increased housing prices in the eastern region, hindered the inflow of labor [18,19], and caused some new cities in the central and western regions to become “empty cities” and “ghost cities” [17]. Capital-LSM led to the failure of the eastern region to make full use of the effect of economies of scale and a significant decline in total factor productivity (TFP) [20], and the central and western regions used land as collateral to build new cities, resulting in a large number of idle industrial parks and high local government debt [21,22]. As a highly comprehensive characterization of the evolution of economic development, the abovementioned problems in multiple dimensions, such as housing prices, labor force, and TFP, are essentially the external manifestation of the hindrance of UITU.
Since the pioneering study of resource misallocation by Hsieh and Klenow [5], the research topic of resource misallocation received increasing attention. For land resources, the existing literature mainly focuses on the analysis of the manifestations and causes of land resource misallocation. Regarding the manifestations of land resource misallocation, existing studies focus on the analysis of the misallocation of construction land between urban and rural areas, between cities, and between different uses and industries [23,24,25]. Regarding the causes of misallocation, existing studies mainly offer explanations from the perspectives of government intervention, government competition, fiscal decentralization, promotion assessments, land systems, and economic development [16,25,26,27,28]. However, the existing literature does not adequately investigate the economic impact of land resource misallocation, with only a small number of studies on this topic [24,29]. Huang and Du, Fan et al. conclude that the misallocation of land resources is manifested as low-price excessive transfer of industrial land and high-price restricted transfer of commercial and residential land by local governments, which significantly inhibits the development of productive and high-end service industries and is an important factor limiting the upgrading of the industrial structure [18,30]; some research finds that local governments’ land supply strategy of transferring industrial land at low prices and commercial land at high prices leads to a misallocation of land resources between industries, which to some extent aggravates environmental pollution, reduces urban innovation capacity and leads to the loss of industrial green total factor productivity [29,31,32].
In general, existing studies conducted useful investigations of the economic impact of land resource misallocation, but there are still some shortcomings. First, the factors (e.g., industrial structure, environmental pollution, innovation, and green development) examined by relevant studies are only related to the driving forces or performance of industrial transformation and upgrading. As a highly comprehensive and critical description of the evolution of urban economic development, industrial transformation and upgrading are more typical. Focusing on the impact of land resource misallocation on industrial transformation and upgrading can provide policy implications more directly and effectively. Second, and more importantly, the misallocation of land resources targeted by existing studies essentially stems from the misallocation of land resources among industries caused by local governments’ distortion of industrial, commercial, and residential land prices under financial and promotion incentives. However, it should be recognized that the misallocation among industries is only one aspect of the misallocation of land resources. Under the institutional policies governing the planned control of construction land quota, the misallocation among industries is, in fact, a local misallocation caused by the distorted land supply behavior of local governments under the condition that the total city-level quota for planned allocation is fixed. Therefore, it is more important to take a higher-level research perspective and study the economic impact of the spatial misallocation of land resources between cities than to study the impact of the misallocation of land resources among industries within cities.
In view of the above deficiencies, the present study focuses on the impact of LSM on UITU and characterizes the specific mechanism of this impact. This study is novel because of the following three aspects: First, this study extends the research perspective of UITU to land resource allocation and, on this basis, enriches the relevant research on resource allocation as an important driving factor for industrial transformation and upgrading while extending resource allocation to the field of government-led land resource allocation with Chinese characteristics. Second, this study enriches the theory of land resource mismatch, divides the spatial mismatch of land resources between cities into two types (areas of excess and areas of shortage), and discusses the effects of each type on industrial transformation and upgrading, respectively. Last, this study investigates the mechanisms of the impacts of differentiated LSM on UITU based on different types of misallocation regions in order to provide practical operational paths and policy implications for the use of land resource allocation policies to promote UITU. Based on the above, this study first establishes a theoretical analysis framework for the impact of land resource spatial misallocation on UITU, then constructs a spatial panel data model and a mediating effect model based on the panel data of 276 prefecture-level cities from 2007 to 2019 in order to analyze impact mechanisms and conduct robustness tests, and finally proposes relevant policy recommendations based on the research results and findings.
2. Theoretical Analysis and Research Hypotheses
Industrial transformation and upgrading is a complex system that addresses the transformation of development driving forces, the optimization of economic structures, and improvements in the quality and efficiency of development results [1,33]. LSM can impact UITU by acting on these three dimensions. Specifically, cities with a relative land supply surplus are mainly concentrated in the central and western regions due to preferential policy arrangements. For cities in these regions, LSM may adversely impact their UITU through mechanisms that enhance the survival of low-end industries and disrupt the institutional environment. In terms of enhancing the survival of low-end industries, the acquisition of sufficient land supply provides a prerequisite for local governments to use land supply as an important policy instrument to promote economic growth. These cities face great difficulties in attracting investments due to disadvantages with respect to geographical location and industrial base. Under pressure to grow economically, “attracting investments with land transfers” became a policy option commonly adopted by local governments, which, based on their monopolistic position, generally tend to adopt strategies such as lowering prices, providing massive and excessive land supply, and subsidizing infrastructure construction to provide numerous favorable conditions for the establishment and survival of enterprises [30]. Under such circumstances, many low-end industries, that should be eliminated, survive due to distorted land prices [34]. More seriously, the too low threshold for attracting investments leads to the repeated construction of low-end industries, which enhances the structural rigidity of low-end urban industries and forms path dependence [34]. In turn, it is difficult to optimize the industrial structure and improve development performance, forming a significant obstacle to UITU. In terms of disrupting the institutional environment, industrial transformation and upgrading are inseparable from the guidance and promotion of resource allocation and technological progress by effective market mechanisms and a good institutional environment [5]. The economic development models of “attracting investments with land transfers” and “seeking development with land transfers,” which are mainly administrative interventions by local governments, weakened the role of the market mechanism and, to a certain extent, shaped an institutional environment that encourages rent-creating and rent-seeking behaviors [16,35]. This institutional environment has an important impact on the choice of business strategies by enterprises, which are faced with a choice regarding how to enhance corporate performance: long-cycle, high-risk innovation, industrial transformation and upgrading, or unproductive rent-seeking behavior. Undoubtedly, some enterprises will choose to improve their performance through rent-seeking behavior under the influence of risk aversion [36]. This situation leads to three adverse consequences [20,34,36,37]. First, the production of innovation outcomes is reduced and delayed accordingly due to a reduction in enterprise innovation activities. Second, the expenditure generated by unproductive rent-seeking activities has a crowding-out effect on expenditures on innovation activities. Third, unproductive rent-seeking activities have a self-reinforcing quality and are obviously path-dependent, and incorrect implementation of rent-seeking activities to improve corporate performance may lead to more widespread rent-seeking activities. Under the combined effect of the above three forces, it is difficult to transform the driving force of regional development and improve development performance, constituting a significant obstacle to UITU.
Cities with a relative land supply shortage are mainly concentrated in the eastern region. For these cities, the relative land supply shortage is attributed to strict control, and LSM may have an adverse impact on UITU through mechanisms that crowd out investments and financing for real industries and inhibit residents’ demand and innovation [4,38,39]. Specifically regarding the crowding out of investments and financing for real industries, cities in the eastern region have strong population attraction, large population inflows, and a strong demand for real estate because of factors such as employment opportunities, income level, consumption diversity, and quality of public services. Against the backdrop of a land supply shortage, there is a serious conflict between supply and demand for real estate, leading to a pronounced trend of increasing real estate prices [4,38,39]. The profit margin for the real estate industry is significantly higher than that for real industries. As a result of the difference in profit margin, a large amount of capital flows into the real estate industry, leading to two adverse consequences [21,22,40]. First, the real estate industry is not a technology-intensive industry, has very limited innovation capacity, and is not a source of technological progress. A large amount of investment into the real estate industry diminishes the innovation capacity and hinders the technological progress of society. Second, financing for the real estate industry is easily favored because reliable and valuable fixed assets are used as collateral. In the case of limited total capital, the increase in real estate financing inevitably crowds out the financing for real industries, causing investment and financing difficulties for real industries, leading to the premature slowdown of the development of real industries, causing the hollowing out of the industrial structure, deteriorating resource allocation for society, and hindering improvements in the TFP. Under the combined effect of the above two forces, it is difficult to optimize the regional industrial structure and improve development performance, which is a significant obstacle to UITU. Regarding the inhibition of residents’ demand and innovation, the high real estate prices caused by LSM change the consumption and investment behavior patterns of residents, leading to two adverse consequences [18,41]. First, as the growth of residents’ income does not match the increase in housing prices, the increase in housing prices leads to a significant increase in urban living costs, which in turn inhibits the demand for goods and services; the sluggish demand will directly affect the development of real industries. Second, in the context of high real estate prices, the inelastic demand for housing forces residents to save for purchasing a home and making mortgage payments, which reduces their willingness to participate (or invest) in high-risk innovation and entrepreneurial activities, thereby affecting the overall urban innovation and entrepreneurial capacity at the aggregate level. Under the combined effect of the above two forces, it is difficult to transform the driving force of regional development and improve development performance, creating a significant obstacle to UITU.
The theoretical analysis framework of this study is provided in Figure 1. LSM can adversely affect UITU through multiple paths, which, however, differ significantly for cities with a relative surplus and relative shortage of land supply. In view of this difference, two research hypotheses are proposed for the impact outcome and impact mechanism dimensions:
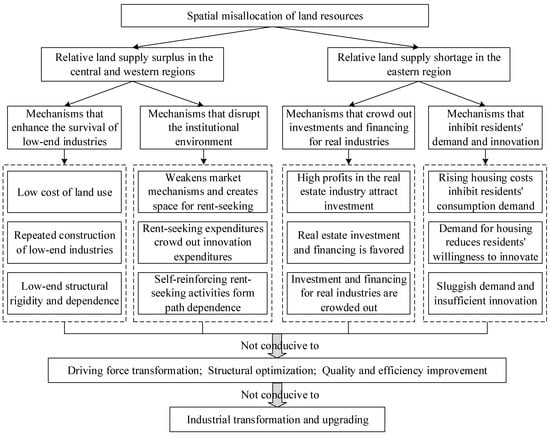
Figure 1.
Theoretical analysis framework.
Hypothesis 1:
In the impact outcome dimension, LSM has a significant negative impact on UITU.
Hypothesis 2:
In the impact mechanism dimension, for cities with a relative land supply surplus, LSM has a negative impact on UITU mainly through intermediate mechanisms that enhance the survival of low-end industries and disrupt the institutional environment; for cities with a relative land supply shortage, LSM has a negative impact on UITU mainly through intermediate mechanisms that crowd out investments and financing for real industries and inhibit residents’ demand and innovation.
3. Model Construction and Data Collection
3.1. Econometric Analysis of the Impact Outcome Dimension: A Spatial Panel Model
The UITU process does not occur and evolve in isolation. Through the industrial transfer and innovation spillover between cities [7,10], the industrial transformation and upgrading of one city will influence that of other cities. In other words, there is an interactive influence on the industrial transformation and upgrading between cities. In view of this interaction, a traditional econometric model based on the premise that individuals are independent of each other is not applicable to the analysis in this study, and a spatial econometric model is needed to include the interactive influence into the range of investigation. According to related research [7,10,42,43], a generalized spatial Durbin model (SDM) is constructed for testing and analysis:
where UITU is the explained variable, which is the UITU index; LSM is the core explanatory variable, which is the degree of LSM; W is the spatial weight matrix, which is used to reflect the mechanism of the interactive influence of industrial transformation and upgrading between cities; controls is a set of control variables, used to control the main influencing factors of UITU; β0 is a constant; β1, β2, and β3 are the coefficient of the spatial lag term of the explained variable, the coefficient of the core explanatory variable, and the coefficient of the spatial lag term of the core explanatory variable, respectively; β4 and β5 are two vectors, which are the coefficients of a series of control variables and the coefficients of the spatial lag term of the control variables, respectively; i and t denote city and year, respectively; and ε is the residual term. Notably, according to the new economic geography theory, the mechanisms of industrial transfer and innovation spillover that lead to the interactive influence of industrial transformation and upgrading between cities are closely related to geographical proximity [42,43]. Therefore, a spatial weight matrix based on queen proximity is constructed with the following rule:
In Equation (2), when the length of the boundary between city i and city j is not 0 (i.e., there is a common boundary or intersection point between the two cities), the two cities are considered adjacent, and the corresponding spatial weight matrix elements (wij and wji) are 1; otherwise, they are 0.
3.2. Econometric Analysis of the Impact Mechanism Dimension: A Mediating Effect Model
The mediating effect model adopted by mainstream economics papers is used for reference [44,45,46], and the mediating influencing factors are analyzed. The model form is shown in Equations (3)–(5). The testing of intermediate mechanisms is carried out using the widely used step-by-step method. Considering the spatial correlation between cities in the transformation and upgrading of urban industries, Equations (3) and (5) are set as the spatial panel model, while Equation (4) does not involve spatial autocorrelation and is set as the ordinary panel data model. The following model is then obtained:
where MV denotes the mediating variables, which are proxy variables that characterize the intermediate mechanisms that enhance the survival of low-end industries, disrupt the institutional environment, crowd out investments and financing for real industries, and inhibit residents’ demand and innovation; all other variables are defined earlier. The analysis is described as follows: The first equation of the mediating effect model is used as the baseline model to examine the total effect of LSM on UITU. The second equation is used to examine the influence of LSM on the mediating variables. Finally, both the spatial misallocation variable and the mediating variables are added to the third equation to examine the mediating effect of the mediating variables and the direct effect of LSM on UITU after the mediating effect is removed.
3.3. Data Collection
(1) Setting the temporal and spatial ranges for the study. Considering the lack of data in some years in the China Land and Resources Statistical Yearbook, the data on construction land area are based on a land transaction database (landchina.com) to ensure the integrity of the data. In view of the low quality of data from landchina.com before 2007, to ensure the accuracy of the data, the temporal range for this study is set to 2007–2019. Most of the studies using this database were conducted starting in 2007 [16,34]. The spatial range for this study is set to the national level to maximize the sample range. Considering data availability, prefecture-level cities are used as the samples, and three types of samples are excluded: ① municipalities, autonomous prefectures, and autonomous leagues with special political and economic status; ② cities with incomplete data; and ③ isolated islands that satisfy the above two criteria but are not geographically adjacent to any other cities. Finally, a total of 276 cities are identified as the sample set for this study (Figure 2).
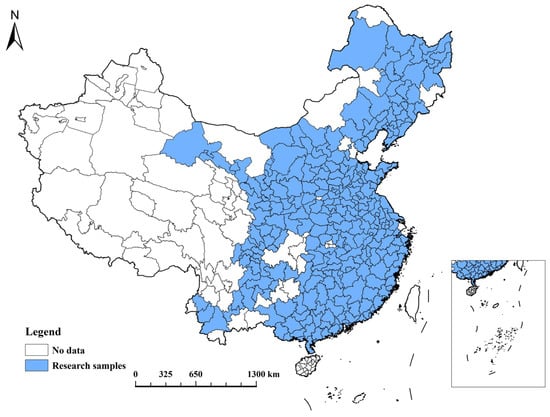
Figure 2.
Distribution of the sample cities.
(2) Explained variable: UITU, referring to the index system proposed in the Research Report on the Evaluation of Guangdong Industrial Transformation and Upgrading compiled by the Guangdong Academy of Social Sciences [47]. This index system is more suitable for analyzing the transformation and upgrading of Chinese cities and corresponds to the logic of the theoretical analysis in Section 2, as shown in Table 1. The measurement indexes and their weighting system are constructed from three dimensions (driving force transformation, structural optimization, and quality and efficiency improvement) and nine indicators. On this basis, the influences of the above indicators in terms of dimension, order of magnitude, and direction of action are eliminated by using range standardization to limit the value of each indicator to the range of 0–100. Then, the city-level industrial transformation and upgrading indicator is obtained by weighted summation, and the relevant data in the measurement process are derived from the China City Statistical Yearbook.

Table 1.
Measurement index system of UITU.
Figure 3 shows the measurement results for UITU indexes of 276 cities in four representative years (2007, 2011, 2015, and 2019); from these results, two basic patterns can be found. First, UITU shows an overall increasing trend. The average UITU of the 276 cities gradually increases from 14.85 in 2007 to 30.87 in 2019. Second, there is a significant difference in the level of industrial transformation and upgrading among cities. The standard deviations of UITU for the 276 cities in 2007, 2011, 2015, and 2019 are 3.71, 5.28, 6.71, and 8.26, respectively, indicating that the notable difference tends to increase further.
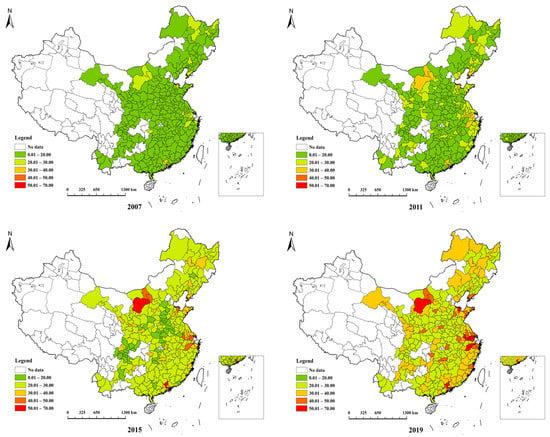
Figure 3.
Measurement results for UITU indexes.
(3) Core explanatory variable: LSM. LSM manifests externally as a spatial imbalance between the supply and demand of land resources. Referring to studies on resource misallocation [48,49], the degree of LSM is defined from the output dimension as (area of construction land supply of a specific city/sum of areas of construction land supply of all cities)/(GDP of a specific city/sum of GDPs of all cities). A value equal to 1 indicates that the supply and demand of land resources are spatially matched; a value less than 1 indicates a relative land supply shortage (the smaller the value, the more serious the relative land supply shortage); and a value greater than 1 indicates that there is a relative land supply surplus (larger values indicate that the relative land supply surplus is more severe). This paper adopts the above index definition method because it has an important advantage, that is, the economic meaning is concise and easy to understand. The specific meaning of this method is as follows: At the current stage of economic development in China, regions with more economic output (GDP) have a higher demand for land resources and should receive more land resource supply, thereby achieving the spatial matching of supply and demand of land resources. Both the cases in which a region with a larger share of economic output receives a smaller share of the supply of land resources and the cases in which regions with a smaller share of economic output obtain a larger share of the supply of land resources, represent the spatial mismatching of the supply and demand of land resources. It should be noted that this indicator definition method has a flaw: when the value is less than 1, i.e., in a state of relative shortage of land supply, a smaller value of the variable indicates a more serious spatial misallocation of land resources; when the value is greater than 1, i.e., in a state of a relative surplus of land supply, a larger value of the variable indicates a more severe spatial misallocation of land resources. This difference in meaning tends to confuse the economic relevance of the sign of the variable coefficient, causing ambiguity, and is not conducive to econometric analysis. For this reason, the definition is slightly modified to develop the following equation:
In Equation (6), LSM, Land, and GDP are the degree of LSM, the construction land supply area, and the sum of the GDP of secondary and tertiary industries, respectively, in a city. Using this measurement method, regardless of the relative shortage or surplus of land supply, a larger LSM value indicates more severe spatially misallocated land resources. In the data compilation, the construction land supply area data are derived from the land transaction database landchina.com and are consistent with the data in the China Land and Resources Statistical Yearbook; i.e., all types of construction land supply are included (allocated, transferred, leased, and other). After eliminating empty records and duplicate records, a total of 986,193 valid records were obtained, and the construction land supply area was obtained for each city and aggregated by year. The GDP data are derived from the China City Statistical Yearbook. The measurement results indicate that on average, among the 276 sample cities, 180 cities (18 in the eastern region and 162 in the central and western regions) have a relative land supply surplus, and 96 cities (77 in the eastern region and 19 in the central and western regions) have a relative land supply shortage. The results indicate that cities with a relative land supply surplus are mainly concentrated in the central and western regions, and that cities with a relative land supply shortage are mainly concentrated in the eastern region, findings that are consistent with the consensus of existing studies on the spatial imbalance characteristics of land supply and demand [17,18], indicating good applicability of the measurement results.
(4) Mediating variables. First, for mechanisms that enhance the survival of low-end industries, referring to the classification method of Schaaper et al. [50], manufacturing industries are divided into high, medium, and low based on their level of technology, and the ratio of the output value of low-end manufacturing industry to the total output value of the manufacturing industries is used as a proxy variable to measure the survival of low-end industries. Second, regarding mechanisms that disrupt the institutional environment, the number of illegal land use cases is used as a proxy variable to measure the degree of disruption of the institutional environment [51]. Third, for mechanisms that crowd out the investments and financing for real industries, referring to relevant studies, the ratio of real estate development investment to the total social fixed asset investment is used as a proxy variable to measure the crowding-out effect of the real estate industry on investments and financing for other real industries [52]. Fourth, regarding mechanisms that inhibit residents’ demand and innovation, referring to relevant studies [53,54], the housing price-to-income ratio (HPIR) is used as a proxy variable to measure the inhibiting effect of high housing prices on residents’ demand and innovation.
(5) Control variables. The control variables are a series of factors that have an important influence on UITU. Referring to relevant studies on the factors that influence UITU, excluding exogenous and universal macro-policy factors, the selected control variables pertain to the levels of economic development, human capital, openness, marketization, and urbanization of a city [2,10,12,55]. There is a close relationship between the level of economic development and industrial development of a city [12]. The level of human capital of a city is an important force driving UITU [10,12]. The degree of openness of a city is highly correlated with the level of integration of the city into the international division of labor and collaboration, and exerts an important influence on the formation and evolution of industry orientation [10,12]. A city’s level of marketization is closely related to the degree of realization of optimal allocation of resources, which determines the ability to allocate resources to boost industrial upgrading and transformation [2,55]. Urbanization of a population in a city is a factor important for modern economic growth, and the increase in population density is also a critical force driving the development of the service industry, which significantly influences UITU [10,12]. Based on the above reasons and with reference to relevant studies [2,10,12,55], the per capita GDP, the ratio of college students to employees, the ratio of foreign direct investment to the total fixed asset investment, 1 minus the proportion of local government budgetary expenditure in GDP, and the urbanization rate of the permanent resident population are selected as control variables. The construction processes, data sources, and descriptive statistics of the above variables are provided in Table 2.
Table 2.
Construction process and descriptive statistics of variables.
4. Empirical Results Analysis
According to the research assumptions and the constructed model, our empirical research is carried out in the following manner; that is, we first analyze whether there is an impact and the degree of impact and then analyze the impact mechanism. Specifically, by distinguishing cities with a relative land supply surplus from cities with a relative land supply shortage, first, a spatial econometric model is used to analyze the impact of LSM on UITU, second, the mediation effect model is used to reveal the mediating transmission mechanism of LSM impacting UITU.
4.1. Results of the Econometric Analysis of the Impact Outcome Dimension
4.1.1. Spatial Panel Model Specification Test
Based on the differences among sample cities, spatial panel models are constructed for all cities, cities with relative land supply surpluses, and cities with relative land supply shortages. To conduct spatial econometric analysis, the appropriate model form is determined through the following three steps: The first step is to perform an applicability test of the spatial panel model. As seen in Table 3, all three models reject the null hypothesis that a nonspatial panel model should be constructed at the 1% significance level, indicating that the use of a spatial panel model is appropriate. The second step is to test the form of the spatial panel model. As seen in Table 3, all three models reject the null hypothesis that a spatial autoregressive model (SAR) or a spatial error model (SEM) should be constructed at the 1% significance level, indicating that an SDM should be used for the econometric analysis. The third step is to test fixed and random effects. As seen in Table 3, all three models reject the null hypothesis of random effects at the 1% significance level using the Hausman test, indicating that the spatial and temporal double fixed effects should be used for the econometric analysis.
Table 3.
Spatial econometric model specification test results.
4.1.2. Results of the Econometric Analysis of the Spatial Panel Model
Based on the test results for the spatial panel model, an econometric analysis is carried out using the panel SDM with double fixed effects to examine the impact of LSM on UITU for all cities, cities with relative land supply surpluses, and cities with relative land supply shortages. For the parameter estimation of the model, the existing studies generally use maximum likelihood estimation based on the centralization of original data. According to Lee’s study [56], for spatial panel models, the results of maximum likelihood estimation based on the centralization of original data may be biased. Therefore, the results of maximum likelihood estimation are corrected for bias using the transformation estimation of Elhorst [57], and the bias-corrected parameter estimation results are presented side by side (Table 4). The initial estimation results are slightly different from and basically consistent with the bias-corrected estimation results, indicating that the parameter estimation results are robust for different estimation methods. The following three findings can be derived from the estimation results (Table 4).
Table 4.
Estimation results for the spatial econometric model.
First, the coefficient of the spatial lag term (W × UITU) of the explained variable passes the test at the 1% significance level in all three models and has a positive sign. Thus, the industrial transformation and upgrading of the cities surrounding a city has a significant positive spillover effect on that of the city, indicating that the interactive influence of UITU is significantly present. Therefore, the objective existence of an interaction between the explained variables leads to inevitable bias in the estimation results of the ordinary panel model, and the estimation results obtained in this study based on the spatial panel model can effectively correct this bias and are more appropriate.
Second, the coefficient of LSM as the core explanatory variable passes the test at the significance levels of 5%, 5%, and 1% in the three models and has a negative sign. This result indicates that even when the main influencing factors and interactive influence of UITU are controlled, LSM still maintains a significant negative impact on UITU, regardless of considering all cities or only cities with relative surpluses or shortages of land supply. In terms of impact sizes, the coefficients of LSM are −0.402, −0.371, and −0.734 for all cities, cities with relative land supply surpluses, and cities with relative land supply shortages, respectively. Therefore, the negative impact of LSM on UITU is greater for cities with a relative land supply shortage than for those with a relative land supply surplus. That is, the unfavorable impact of LSM on UITU is significantly more serious for cities with a relative land supply shortage.
Third, regarding the control variables, the economic development level (PGDP), the human capital level (HC), the openness level (OL), the marketization level (ML), and the urbanization level (UL), the three models show significant positive impacts on UITU, as expected. The only nonsignificant exception is that HC has a nonsignificant positive impact on cities with a relative land supply shortage. This possibly occurs because these are usually small and medium-sized cities in the central and western regions, where HC is low and yet to cross the threshold of providing positive contributions to UITU, thereby not exhibiting a significant positive impact.
In summary, the results of the econometric analysis of the spatial panel model support research hypothesis 1: in the impact outcome dimension, LSM has a significant negative impact on UITU.
4.2. Results of the Econometric Analysis of The Impact Mechanism Dimension
4.2.1. Intermediate Mechanisms of the Impact of LSM on UITU: Cities with a Relative Land Supply Surplus
For cities with a relative land supply surplus, two sets of mediating effect models are constructed based on the model in Equation (3), using LM and ILU cases as mediating variables to test the mediating effect. The following two findings can be derived from the test results in Table 5.
Table 5.
Test results for the mediating effect: cities with a relative land supply surplus.
First, enhancing the survival of low-end industries is an effective intermediate mechanism by which LSM impacts UITU. Columns (1)–(3) in Table 5 provide the estimation results for the three equations used to test the mediating effect of mechanisms that enhance the survival of low-end industries. First, Column (2) contains the estimation results with LM as the explained variable. The coefficient of LSM is 0.036, which is significant at the 1% level, indicating that for cities with a relative land supply surplus, LSM indeed enhances the survival and expands the proportion of low-end industries. As the theoretical analysis suggests, for cities with relative land supply surpluses, local governments “attracting investments with land transfers” tend to adopt a strategy that involves supplying land in large quantities and at low prices, resulting in downward distortion of land factor prices and hence reducing the production costs and enhancing the survival of low-end industries. Second, Column (3) contains the estimation results using UITU as the explained variable. The coefficient of the mediating variable LM is −4.465, which is significant at the 1% level, indicating that mechanisms that enhance the survival of low-end industries have a significant negative impact on UITU. Third, the baseline estimation results reported in Column (1) and the estimation results after adding the mediating variable reported in Column (3), both with UITU as the explained variable, are compared. The coefficients of LSM in both estimation results pass the test at the 5% significance level but differ numerically (−0.371 and −0.219). The mediating variable LM accounts for part of the impact, reducing the total impact of LSM on UITU. In summary, the mediating effect of mechanisms that enhance the survival of low-end industries is significant, as evidenced by LSM enhancing the survival of low-end industries, which in turn inhibits UITU.
Second, disrupting the institutional environment is an effective intermediate mechanism by which LSM impacts UITU. Columns (4)–(6) in Table 5 provide the estimation results for the three equations used to test the mediating effect of mechanisms that disrupt the institutional environment. First, Column (5) reports the estimation results with ILU as the explained variable. The coefficient of LSM is 0.129, which passes the test at the 1% significance level, indicating that for cities with a relative land supply surplus, LSM does have a disrupting effect on the institutional environment. As noted in the theoretical analysis, for cities with a relative land supply surplus, local governments usually use administrative intervention as a means to implement the economic development models of “attracting investments with land transfers” and “seeking development with land transfers,” which weaken the role of the market mechanism and, to a certain extent, stimulate rent-creating and rent-seeking behaviors, which in turn disrupt the institutional environment. Second, Column (6) contains the estimation results using UITU as the explained variable. The coefficient of the mediating variable ILU is −0.552, which passes the test at the 5% significance level. That is, disrupting the institutional environment does have a significant negative impact on UITU. Third, the baseline estimation results reported in Column (4) and the estimation results after adding the intermediate variable reported in Column (6) are compared. The coefficients of LSM in both estimation results pass the test at the 5% significance level but differ numerically (−0.371 and −0.299). The mediating variable ILU accounts for part of the impact, reducing the total impact of LSM on UITU. In summary, the mediating effect of mechanisms that disrupt the institutional environment is significant, specifically through the transmission process, in which LSM disrupts the institutional environment, which in turn inhibits UITU.
4.2.2. Intermediate Mechanisms of the Impact of LSM on UITU: Cities with a Relative Land Supply Shortage
For cities with a relative land supply shortage, the mediating effect is tested using REI and HPIR as mediating variables. The following two findings can be derived based on the test results in Table 6.
Table 6.
Test results for the mediating effect: cities with a relative land supply shortage.
First, crowding out the investments and financing for real industries is an effective intermediate mechanism by which LSM impacts UITU. Columns (1) to (3) in Table 6 provide the estimation results of the three equations of the model for testing the mediating effect of the mechanism of crowding out the investment and financing of real industries. First, Column (2) reports the estimation results with REI as the explained variable. The coefficient of LSM is 0.578, which is significant at the 1% level, indicating that for cities with a relative shortage of land supply, LSM leads to an imbalance between supply and demand for real estate, and the shortfall in supply leads to an increase in housing prices, driving up REI, which in turn produces a crowding-out effect on the investment and financing of real industries. Second, Column (3) reports the estimation results using UITU as the explained variable. The coefficient of REI as the mediating variable is −0.489, which is significant at the 5% level, clearly showing that the mechanism of crowding out the investment and financing of real industries indeed has a significant negative impact on UITU. Of course, the reason is also clear: since the real estate industry is not a source of technological progress, the increase in REI crowds out the investment and financing of real industries, resulting in the hollowing out of the industrial structure, leading to a slowdown in technological progress and a deterioration in the allocation of resources across society, which in turn inhibits UITU. Third, the baseline estimation results reported in Column (1) and the estimation results after adding the mediating variable reported in Column (3) are compared. It is found that the coefficients of LSM in both estimation results are significant at the 1% level but differ numerically (−0.734 and −0.542). Obviously, the mediating variable REI shares part of the impact, reducing the total impact of LSM on UITU. In summary, the mediating effect of the mechanism of crowding out the investment and financing of real industries is significant, acting in a transmission process where LSM crowds out the investment and financing of real industries and the hollowing out of the industrial structure inhibits UITU.
Second, inhibiting residents’ demand and innovation is an effective intermediate mechanism by which LSM affects UITU. Columns (4)–(6) in Table 6 provide the estimation results for the three equations used to test the mediating effect of mechanisms that inhibit residents’ demand and innovation. First, Column (5) contains the estimation results with HPIR as the explained variable. The coefficient of LSM is 0.519, which is significant at the 5% level. For cities with a relative land supply shortage, LSM promotes an increase in housing prices, driving up the HPIR and increasing the cost of living. Second, Column (6) contains the estimation results using UITU as the explained variable. The coefficient of the mediating variable HPIR is −0.531, which is significant at the 1% level, indicating that mechanisms that inhibit residents’ demand and innovation indeed have a significant negative impact on UITU. The reason for this result is clear: the excessive cost of living inevitably changes residents’ consumption and investment behavior patterns, reduces the consumption of goods and services to save for home purchase, and lowers the willingness to engage in high-risk innovation and entrepreneurial investment, and thus, the sluggish demand and insufficient innovation are bound to inhibit UITU. Third, the baseline estimation results reported in Column (4) and the estimation results after adding the intermediate variable reported in Column (6) are compared. The coefficients of LSM for both estimation results are significant at the 1% level, but differ numerically (−0.734 and −0.562). The mediating variable HPIR accounts for part of the impact, reducing the total impact of LSM on UITU. In short, the mediating effect of mechanisms that inhibit residents’ demand and innovation is significant; specifically, LSM drives up the cost of living and inhibits residents’ demand and innovation, and the sluggish demand and insufficient innovation inhibit UITU.
In summary, the test results for the mediating effect support research hypothesis 2: in the impact mechanism dimension, for cities with a relative land supply surplus, LSM has a negative impact on UITU mainly through intermediate mechanisms that enhance the survival of low-end industries and disrupt the institutional environment; for cities with a relative land supply shortage, LSM has a negative impact on UITU, mainly through intermediate mechanisms that crowd out investments and financing for real industries and inhibit residents’ demand and innovation.
5. Robustness Test
5.1. Robustness Test for the Impact Outcome Dimension
To test the robustness of the findings in the impact outcome dimension, the core explanatory variable, i.e., the proxy variable for the degree of LSM, is replaced; for the input dimension, the degree of LSM is measured based on population–LSM and capital–LSM, and the proportion of GDP in Equation (4) is replaced with the proportion of population and the proportion of fixed asset investments, respectively. On this basis, the parameters are estimated with bias-corrected double fixed effects using the panel SDM; the results are provided in Table 7. The coefficients of LSM all pass the test at the 5% significance level and have a negative sign. These results indicate that the findings still hold after replacing the core explanatory variable. LSM has a significant negative impact on UITU, with the magnitude of the impact decreasing in the order of cities with relative land supply shortages, all cities, and cities with relative land supply surpluses.
Table 7.
Estimation results for the spatial econometric model after replacing the core explanatory variable.
5.2. Robustness Test for the Impact Mechanism Dimension
To test the robustness of the findings on the intermediate mechanisms, cross-validation is carried out to examine whether mechanisms that crowd out investments and financing for real industries and mechanisms that inhibit residents’ demand and innovation hold for cities with relative land supply surpluses and to determine whether mechanisms that enhance the survival of low-end industries and mechanisms that disrupt the institutional environment hold for cities with relative land supply shortages. Two findings can be derived from the cross-validation results (Table 8).
Table 8.
Intermediate mechanism cross-validation results.
First, for cities with a relative land supply surplus, as seen from the estimation results using REI and HPIR as explained variables, LSM does not pass the test at the 10% significance level. For cities with a relative land supply surplus, LSM does not significantly drive up REI to crowd out investments and financing for real industries, nor does it significantly increase HPIR to increase the cost of living and inhibit residents’ demand and innovation. The above results clearly show that for cities with a relative land supply surplus, neither mechanisms that crowd out investments and financing for real industries nor mechanisms that inhibit residents’ demand and innovation are effective intermediate mechanisms by which LSM impacts UITU.
Second, for cities with a relative land supply shortage, as seen from the estimation results using LM and ILU as explained variables, LSM does not pass the test at the 10% significance level. This indicates that for cities with a relative land supply shortage, LSM does not significantly enhance the survival of low-end industries to expand the proportion of low-end industries, nor does it significantly promote ILU to disrupt the institutional environment. The above results indicate that for cities with a relative land supply shortage, neither mechanisms that enhance the survival of low-end industries nor mechanisms that disrupt the institutional environment are effective intermediate mechanisms by which LSM impacts UITU.
6. Discussion
The factors driving UITU were long the focus of attention of the academic community and governments, especially those in developing countries [2]. The main novelty of this study is the analysis of the impact of government-led construction land allocation on UITU in the context of China’s institutional arrangements. In terms of UITU, development economics and related disciplines focused on the impact of resource allocation on UITU. However, these studies mainly considered the allocation of resources, such as labor and capital [6,14,15]; relatively few studies focused on the government-led allocation of construction land resources in the Chinese institutional environment. In terms of construction land allocation, existing studies analyzed the impacts of local government-led construction land allocation on housing prices, urban expansion, land use efficiency, and ecological environmental quality [18,24,58,59,60], but studies are lacking that analyze the impact of construction land, as an important basic support element for industrial development, on UITU. This study not only analyzes in an innovative manner the impact of government-led construction land allocation on UITU but also distinguishes between surplus and shortage LSM types. On the basis of different types of LSM, the mechanisms of LSM’s impact on UITU are investigated to enrich the theory of land resource allocation and extend the research perspective of UITU, thereby providing practical operational paths and policy implications for using land resource allocation policies to promote UITU.
In the past, due to the failure to correctly distinguish between balanced development and uniform distribution in regional economies, it was generally assumed that the uniform distribution of interregional economic aggregates through policy arrangements was conducive to achieving the balanced development of a regional economy. In this context, for the allocation of land resources, the central government implemented a clear and strong regional-based policy to relax the urban construction land supply and preferentially allocate resources to the central and western regions while controlling the supply in the eastern region [17]. This LSM gave rise to “two harms”: (1) in the eastern region, as a place with population inflow, the strict control of the supply of land resources resulted in an unreasonable increase in housing prices and a decrease in TFP; and (2) in the central and western regions, where population outflows occur, the relatively loose land supply led to the prevalence of “attracting investments with land transfers,” which deviates from the comparative advantage of the region, resulting in a decrease in the input–output efficiency of investments and an increase in the debt ratio for local governments. Regarding the UITU on which this study focuses, for underdeveloped regions, although the economic scale is expanded in the short term, the upgrading of the industrial structure and the optimization of the institutional environment are hindered, which is not conducive to UITU in the long term. For developed regions, economic growth is constrained by land resources, which is also not conducive to UITU due to the distortion of investment and consumption structures and the lack of willingness to innovate and start businesses. The solution to the abovementioned “two harms” is to change the understanding of balanced regional development. Balanced development should be centered on people first and needs to be measured by the equalization of population utility levels between regions and not by the uniform distribution of economic aggregates between regions. With this goal in mind, the differences in population utility levels between regions should be gradually smoothed by promoting the free flow of populations. Correspondingly, the current LSM situation should be modified to match the allocation of land resources based on population flow, and more land resources should be allocated to key cities and urban agglomerations with large population inflows, thereby improving efficiency at the global level. Furthermore, the government should improve the policy arrangements for fiscal transfer payments, change the structure of fiscal transfer payments, gradually adjust construction-oriented fiscal transfer payments to service-oriented fiscal transfer payments, and enhance the level of public services in underdeveloped regions in order to achieve a balance between efficiency and equity.
7. Conclusions and Implications
Based on systematic measurements of UITU, this study constructed a spatial panel econometric model and a mediating effect model to examine the way in which LSM impacts UITU and intermediate mechanisms for the impact outcome and impact mechanism dimensions. The main conclusions are as follows: LSM has a significant negative impact on UITU, and this adverse effect is greater in cities with a relative land supply shortage than in cities with a relative land supply surplus. Further research finds that for cities with a relative land supply surplus, the negative impact mainly occurs through intermediate mechanisms that enhance the survival of low-end industries and disrupt the institutional environment; for cities with a relative land supply shortage, the negative impact mainly occurs through intermediate mechanisms that crowd out the investments and financing of real industries and inhibit residents’ demand and innovation.
The above conclusions reveal that LSM has a direct negative impact and, through differentiated intermediate mechanisms, also has an indirect negative impact on UITU, both for cities with a relative land supply surplus and for cities with a relative land supply shortage. In the past, because the policy for regional “balanced development” was one-sidedly misunderstood as a “uniform distribution” of economic aggregates among regions, the central government implemented a land supply policy in favor of the central and western regions, which led to a preferential supply of construction land to the central and western regions, artificially resulting in the coexistence of relative land supply surplus and shortages among cities. In fact, this situation is harmful and unfavorable for the UITU of cities with relative land supply surpluses, as well as those with relative land supply shortages. CPC General Secretary Xi Jinping noted in his article “Promoting the formation of a regional economy with complementary advantages and high-quality development,” published in the magazine Qiushi (literally, Seeking Truth), that “imbalance is universal, and relative balance should be promoted in development, that is, the dialectic of coordinated regional development,” and that “the reform of the land management system should be accelerated, and the allocation of construction land resources should be favored toward central cities and key urban agglomerations.” The above statement is an adjustment of the past land resource allocation policy that emphasizes a “regional balance,” reflecting a new strategy of flexibility, pragmatism, and a dynamic balance, and is an attempt to correct LSM. It is of great significance for UITU to promote the abovementioned policy of correcting LSM in a consistent manner. Specifically, it is necessary to adjust the spatial pattern of construction land supply, increase the supply of construction land in cities with a relative shortage of land supply in the eastern region, and control the supply of construction land in cities in the central and western regions with a relative land supply surplus. Furthermore, it is necessary to revitalize stock construction land in cities in the eastern region with relative land supply shortages and, through strict post-approval supervision, effectively solve the problems of approved but unsupplied land and idle land to improve the utilization of stock construction land. Thus, land resource allocation tools can be used to provide a targeted and powerful means for promoting UITU.
This study not only has policy implications for optimizing land resource allocation and promoting UITU in China, but also has good reference significance for other countries to optimize resource allocation and land planning to promote UITU. On the one hand, there are many studies on the topic of resource mismatch in the international literature. The reasons for resource mismatch include excessive administrative intervention and market failure, among others; thus, to what extent this resource mismatch affects UITU and how to optimize resource allocation to promote UITU are topics worthy of in-depth study for both developing and underdeveloped countries. On the other hand, how to optimize land planning and the efficient use of land is an international issue, and from the perspective of land, optimizing land planning and land use to promote UITU provides new ideas for promoting UITU in developing countries or underdeveloped areas, especially countries with public ownership of land.
Author Contributions
Conceptualization, S.P. and J.W.; methodology, S.P.; software, S.P.; formal analysis, S.P. and J.W.; writing—original draft preparation, S.P.; writing—review and editing, S.P., J.W., H.S. and Z.G.; visualization, H.S.; supervision, Z.G.; project administration, S.P. and J.W.; funding acquisition, S.P. and J.W. All authors have read and agreed to the published version of the manuscript.
Funding
This research was funded by the National Natural Science Foundation of China (Grant No. 42101272), the Natural Science Foundation of Shandong Province (Grant No. ZR2021QD085), the Natural Science Foundation of Jiangsu Province (Grant No. BK20221026), the China Postdoctoral Science Foundation (Grant No. 2021M691608), the Postdoctoral Science Foundation of Jiangsu Province (Grant No. 2021K118B), the Fundamental Research Funds for the Central Universities (Grant No. SKYC2021005).
Data Availability Statement
Publicly available datasets were analyzed in this study, including the China Land Market Network (https://www.landchina.com, accessed on 1 July 2022) and the China City Statistical Yearbook (http://www.stats.gov.cn/tjsj/tjcbw/202201/t20220112_1826279.html, accessed on 1 July 2022).
Conflicts of Interest
The authors declare no conflict of interest.
References
- Gereffi, G. Development models and industrial upgrading in China and Mexico. Eur. Sociol. Rev. 2008, 25, 37–51. [Google Scholar] [CrossRef]
- Brandt, L.; Thun, E. Constructing a ladder for growth: Policy, markets, and industrial upgrading in china. World Dev. 2016, 80, 78–95. [Google Scholar] [CrossRef]
- Lee, K.; Qu, D.; Mao, Z. Global value chains, industrial policy, and industrial upgrading: Automotive sectors in Malaysia, Thailand, and china in comparison with Korea. Eur. J. Dev. Res. 2021, 33, 275–303. [Google Scholar] [CrossRef]
- Li, M.; Guan, S. Does China’s state-owned sector lead industrial transformation and upgrading? J. Clean. Prod. 2022, 338, 130412. [Google Scholar] [CrossRef]
- Hsieh, C.T.; Klenow, P.J. Misallocation and manufacturing TFP in China and India. Q. J. Econ. 2009, 124, 1403–1448. [Google Scholar] [CrossRef]
- Wu, N.; Liu, Z. Higher education development, technological innovation and industrial structure upgrade. Technol. Forecast. Soc. Chang. 2021, 162, 120400. [Google Scholar] [CrossRef]
- Wu, L.; Sun, L.; Qi, P.; Ren, X.; Sun, X. Energy endowment, industrial structure upgrading, and co2 emissions in China: Revisiting resource curse in the context of carbon emissions. Resour. Policy 2021, 74, 102329. [Google Scholar] [CrossRef]
- Anwar, S.; Sun, S. Foreign direct investment and export quality upgrading in China’s manufacturing sector. Int. Rev. Econ. Financ. 2018, 54, 289–298. [Google Scholar] [CrossRef]
- Salim, A.; Razavi, M.R.; Afshari-Mofrad, M. Foreign direct investment and technology spillover in iran: The role of technological capabilities of subsidiaries. Technol. Forecast. Soc. Chang. 2017, 122, 207–214. [Google Scholar] [CrossRef]
- Song, Y.; Zhang, X.; Zhang, M. The influence of environmental regulation on industrial structure upgrading: Based on the strategic interaction behavior of environmental regulation among local governments. Technol. Forecast. Soc. Chang. 2021, 170, 120930. [Google Scholar] [CrossRef]
- Du, K.; Cheng, Y.; Yao, X. Environmental regulation, green technology innovation, and industrial structure upgrading: The road to the green transformation of Chinese cities. Energy Econ. 2021, 98, 105247. [Google Scholar] [CrossRef]
- Lin, B.; Zhou, Y. How does vertical fiscal imbalance affect the upgrading of industrial structure? Empirical evidence from China. Technol. Forecast. Soc. Chang. 2021, 170, 120886. [Google Scholar] [CrossRef]
- Wang, X.; Wang, Q. Research on the impact of green finance on the upgrading of China’s regional industrial structure from the perspective of sustainable development. Resour. Policy 2021, 74, 102436. [Google Scholar] [CrossRef]
- García-Vega, M.; Kneller, R.; Stiebale, J. Labor market reform and innovation: Evidence from Spain. Res. Policy 2021, 50, 104213. [Google Scholar] [CrossRef]
- Hu, G. Is knowledge spillover from human capital investment a catalyst for technological innovation? The curious case of fourth industrial revolution in brics economies. Technol. Forecast. Soc. Chang. 2021, 162, 120327. [Google Scholar] [CrossRef]
- Wang, J.; Wu, Q.; Yan, S.; Guo, G.; Peng, S. China’s local governments breaking the land use planning quota: A strategic interaction perspective. Land Use Policy 2020, 92, 104434. [Google Scholar] [CrossRef]
- Han, L.; Lu, M. Housing prices and investment: An assessment of China’s inland-favoring land supply policies. J. Asia Pac. Econ. 2017, 22, 106–121. [Google Scholar] [CrossRef]
- Fan, J.; Zhou, L.; Yu, X.; Zhang, Y. Impact of land quota and land supply structure on China’s housing prices: Quasi-natural experiment based on land quota policy adjustment. Land Use Policy 2021, 106, 105452. [Google Scholar] [CrossRef]
- Glaeser, E.L.; Gyourko, J.; Saks, R.E. Urban growth and housing supply. J. Econ. Geogr. 2006, 6, 71–89. [Google Scholar] [CrossRef]
- Chen, W.; Shen, Y.; Wang, Y. Does industrial land price lead to industrial diffusion in China? An empirical study from a spatial perspective. Sustain. Cities Soc. 2018, 40, 307–316. [Google Scholar] [CrossRef]
- Han, L.; Lu, M.; Xiang, K.; Zhong, H. Density, distance and debt: New-town construction and local-government financial risks in China. J. Asian Econ. 2021, 77, 101376. [Google Scholar] [CrossRef]
- Mo, J. Land financing and economic growth: Evidence from Chinese counties. China Econ. Rev. 2018, 50, 218–239. [Google Scholar] [CrossRef]
- Du, W.; Li, M. The impact of land resource mismatch and land marketization on pollution emissions of industrial enterprises in China. J. Environ. Manag. 2021, 299, 113565. [Google Scholar] [CrossRef] [PubMed]
- Egidi, G.; Cividino, S.; Quaranta, G.; Alhuseen, A.; Salvati, L. Land mismatches, urban growth and spatial planning: A contribution to metropolitan sustainability. Environ. Impact Assess. Rev. 2020, 84, 106439. [Google Scholar] [CrossRef]
- Huang, Z.; Du, X. Government intervention and land misallocation: Evidence from China. Cities 2017, 60, 323–332. [Google Scholar] [CrossRef]
- Ding, C.; Niu, Y.; Lichtenberg, E. Spending preferences of local officials with off-budget land revenues of Chinese cities. China Econ. Rev. 2014, 31, 265–276. [Google Scholar] [CrossRef]
- Wang, J.; Skidmore, M.; Wu, Q.; Wang, S. The impact of a tax cut reform on land finance revenue: Constrained by the binding target of construction land. J. Urban Aff. 2020, 1–30. [Google Scholar] [CrossRef]
- Zhou, J.; Yu, X.; Jin, X.; Mao, N. Government competition, land supply structure and semi-urbanization in China. Land 2021, 10, 1371. [Google Scholar] [CrossRef]
- Ma, A.; He, Y.; Tang, P. Understanding the impact of land resource misallocation on carbon emissions in China. Land 2021, 10, 1188. [Google Scholar] [CrossRef]
- Huang, Z.; Du, X. Strategic interaction in local governments’ industrial land supply: Evidence from China. Urban Stud. 2016, 54, 1328–1346. [Google Scholar] [CrossRef]
- Cheng, J.; Zhao, J.; Zhu, D.; Jiang, X.; Zhang, H.; Zhang, Y. Land marketization and urban innovation capability: Evidence from China. Habitat Int. 2022, 122, 102540. [Google Scholar] [CrossRef]
- Lu, X.; Jiang, X.; Gong, M. How land transfer marketization influence on green total factor productivity from the approach of industrial structure? Evidence from China. Land Use Policy 2020, 95, 104610. [Google Scholar] [CrossRef]
- Cheong, T.S.; Wu, Y. The impacts of structural transformation and industrial upgrading on regional inequality in China. China Econ. Rev. 2014, 31, 339–350. [Google Scholar] [CrossRef]
- Hu, J.; Liang, J.; Fang, J.; He, H.; Chen, F. How do industrial land price and environmental regulations affect spatiotemporal variations of pollution-intensive industries? Regional analysis in China. J. Clean. Prod. 2021, 333, 130035. [Google Scholar] [CrossRef]
- Lin, G.C.S.; Yi, F. Urbanization of capital or capitalization on urban land? Land development and local public finance in urbanizing China. Urban Geogr. 2011, 32, 50–79. [Google Scholar] [CrossRef]
- Zhou, L.; Tian, L.; Cao, Y.; Yang, L. Industrial land supply at different technological intensities and its contribution to economic growth in China: A case study of the Beijing-Tianjin-Hebei region. Land Use Policy 2021, 101, 105087. [Google Scholar] [CrossRef]
- Chen, W.; Shen, Y.; Wang, Y.; Wu, Q. How do industrial land price variations affect industrial diffusion? Evidence from a spatial analysis of China. Land Use Policy 2018, 71, 384–394. [Google Scholar] [CrossRef]
- Mian, A.R.; Sufi, A. House prices, home equity-based borrowing, and the U.S. Household leverage crisis. Am. Econ. Rev. 2011, 101, 32–56. [Google Scholar] [CrossRef]
- Wang, D.; Ren, C.; Zhou, T. Understanding the impact of land finance on industrial structure change in China: Insights from a spatial econometric analysis. Land Use Policy 2021, 103, 105323. [Google Scholar] [CrossRef]
- Cao, G.; Feng, C.; Tao, R. local land finance in China’s urban expansion: Challenges and solutions. China World Econ. 2008, 16, 19–30. [Google Scholar] [CrossRef]
- Yang, Z.; Pan, Y. Human capital, housing prices, and regional economic development: Will “vying for talent” through policy succeed? Cities 2020, 98, 102577. [Google Scholar] [CrossRef]
- Brueckner, J.K. Strategic interaction among governments: An overview of empirical studies. Int. Reg. Sci. Rev. 2003, 26, 175–188. [Google Scholar] [CrossRef]
- Hernandez-Murillo, R. Strategic interaction in tax policies among states. Fed. Reserve Bank St Louis Rev. 2003, 85, 47–56. [Google Scholar] [CrossRef]
- Alesina, A.; Zhuravskaya, E. Segregation and the quality of government in a cross-section of countries. Am. Econ. Rev. 2011, 101, 1872–1911. [Google Scholar] [CrossRef]
- Chen, Y.; Fan, Z.; Gu, X.; Zhou, L. Arrival of young talents: The send-down movement and rural education in China. Am. Econ. Rev. 2020, 110, 3393–3430. [Google Scholar] [CrossRef]
- Hayes, F.A. Beyond baron and kenny: Statistical mediation analysis in the new millennium. Commun. Monogr. 2009, 76, 408–420. [Google Scholar] [CrossRef]
- Guangdong Academy of Social Sciences. Research Report on the Evaluation of Guangdong Industrial Transformation and Upgrading; Guangdong Academy of Social Sciences: Guangzhou, China, 2020. [Google Scholar]
- Chen, B.; Lin, J.Y. Development strategy, resource misallocation and economic performance. Struct. Change Econ. Dyn. 2021, 59, 612–634. [Google Scholar] [CrossRef]
- Hao, Y.; Gai, Z.; Wu, H. How do resource misallocation and government corruption affect green total factor energy efficiency? Evidence from China. Energ. Policy 2020, 143, 111562. [Google Scholar] [CrossRef]
- Schaaper, M. Measuring China’s Innovation System: National Specificities and International Comparisons; OECD Publishing: Paris, France, 2009. [Google Scholar]
- Tang, P.; Feng, Y.; Li, M.; Zhang, Y. Can the performance evaluation change from central government suppress illegal land use in local governments? A new interpretation of Chinese decentralisation. Land Use Policy 2021, 108, 105578. [Google Scholar] [CrossRef]
- Rong, Z.; Wang, W.; Gong, Q. Housing price appreciation, investment opportunity, and firm innovation: Evidence from China. J. Hous. Econ. 2016, 33, 34–58. [Google Scholar] [CrossRef]
- Campbell, J.Y.; Cocco, J.F. How do house prices affect consumption? Evidence from micro data. J. Monet. Econ. 2007, 54, 591–621. [Google Scholar] [CrossRef]
- Li, L.; Wu, X. Housing price and entrepreneurship in China. J. Comp. Econ. 2014, 42, 436–449. [Google Scholar] [CrossRef]
- Geng, Y.; Liu, W.; Wu, Y. How do zombie firms affect China’s industrial upgrading? Econ. Model. 2021, 97, 79–94. [Google Scholar] [CrossRef]
- Lee, L. Asymptotic distributions of quasi-maximum likelihood estimators for spatial autoregressive models. Econometrica 2004, 72, 1899–1925. [Google Scholar] [CrossRef]
- Elhorst, J.P. Spatial Econometrics from Cross Sectional Data to Spatial Panels; Springer: Berlin/Heidelberg, Germany, 2014. [Google Scholar]
- Han, F.; Huang, M. Land misallocation and carbon emissions: Evidence from China. Land 2022, 11, 1189. [Google Scholar] [CrossRef]
- Restuccia, D.; Rogerson, R. Misallocation and productivity. Rev. Econ. Dyn. 2013, 16, 1–10. [Google Scholar] [CrossRef]
- Tong, D.; Chu, J.; Han, Q.; Liu, X. How land finance drives urban expansion under fiscal pressure: Evidence from Chinese cities. Land 2022, 11, 253. [Google Scholar] [CrossRef]
Publisher’s Note: MDPI stays neutral with regard to jurisdictional claims in published maps and institutional affiliations. |
© 2022 by the authors. Licensee MDPI, Basel, Switzerland. This article is an open access article distributed under the terms and conditions of the Creative Commons Attribution (CC BY) license (https://creativecommons.org/licenses/by/4.0/).