


Characteristics and Influencing Factors of Traditional Village Distribution in China


Abstract
:1. Introduction
2. Literature Review
3. Materials and Methods
3.1. Data Sources
3.2. Methods
3.2.1. Imbalance Index
3.2.2. Average Nearest Neighbor Index
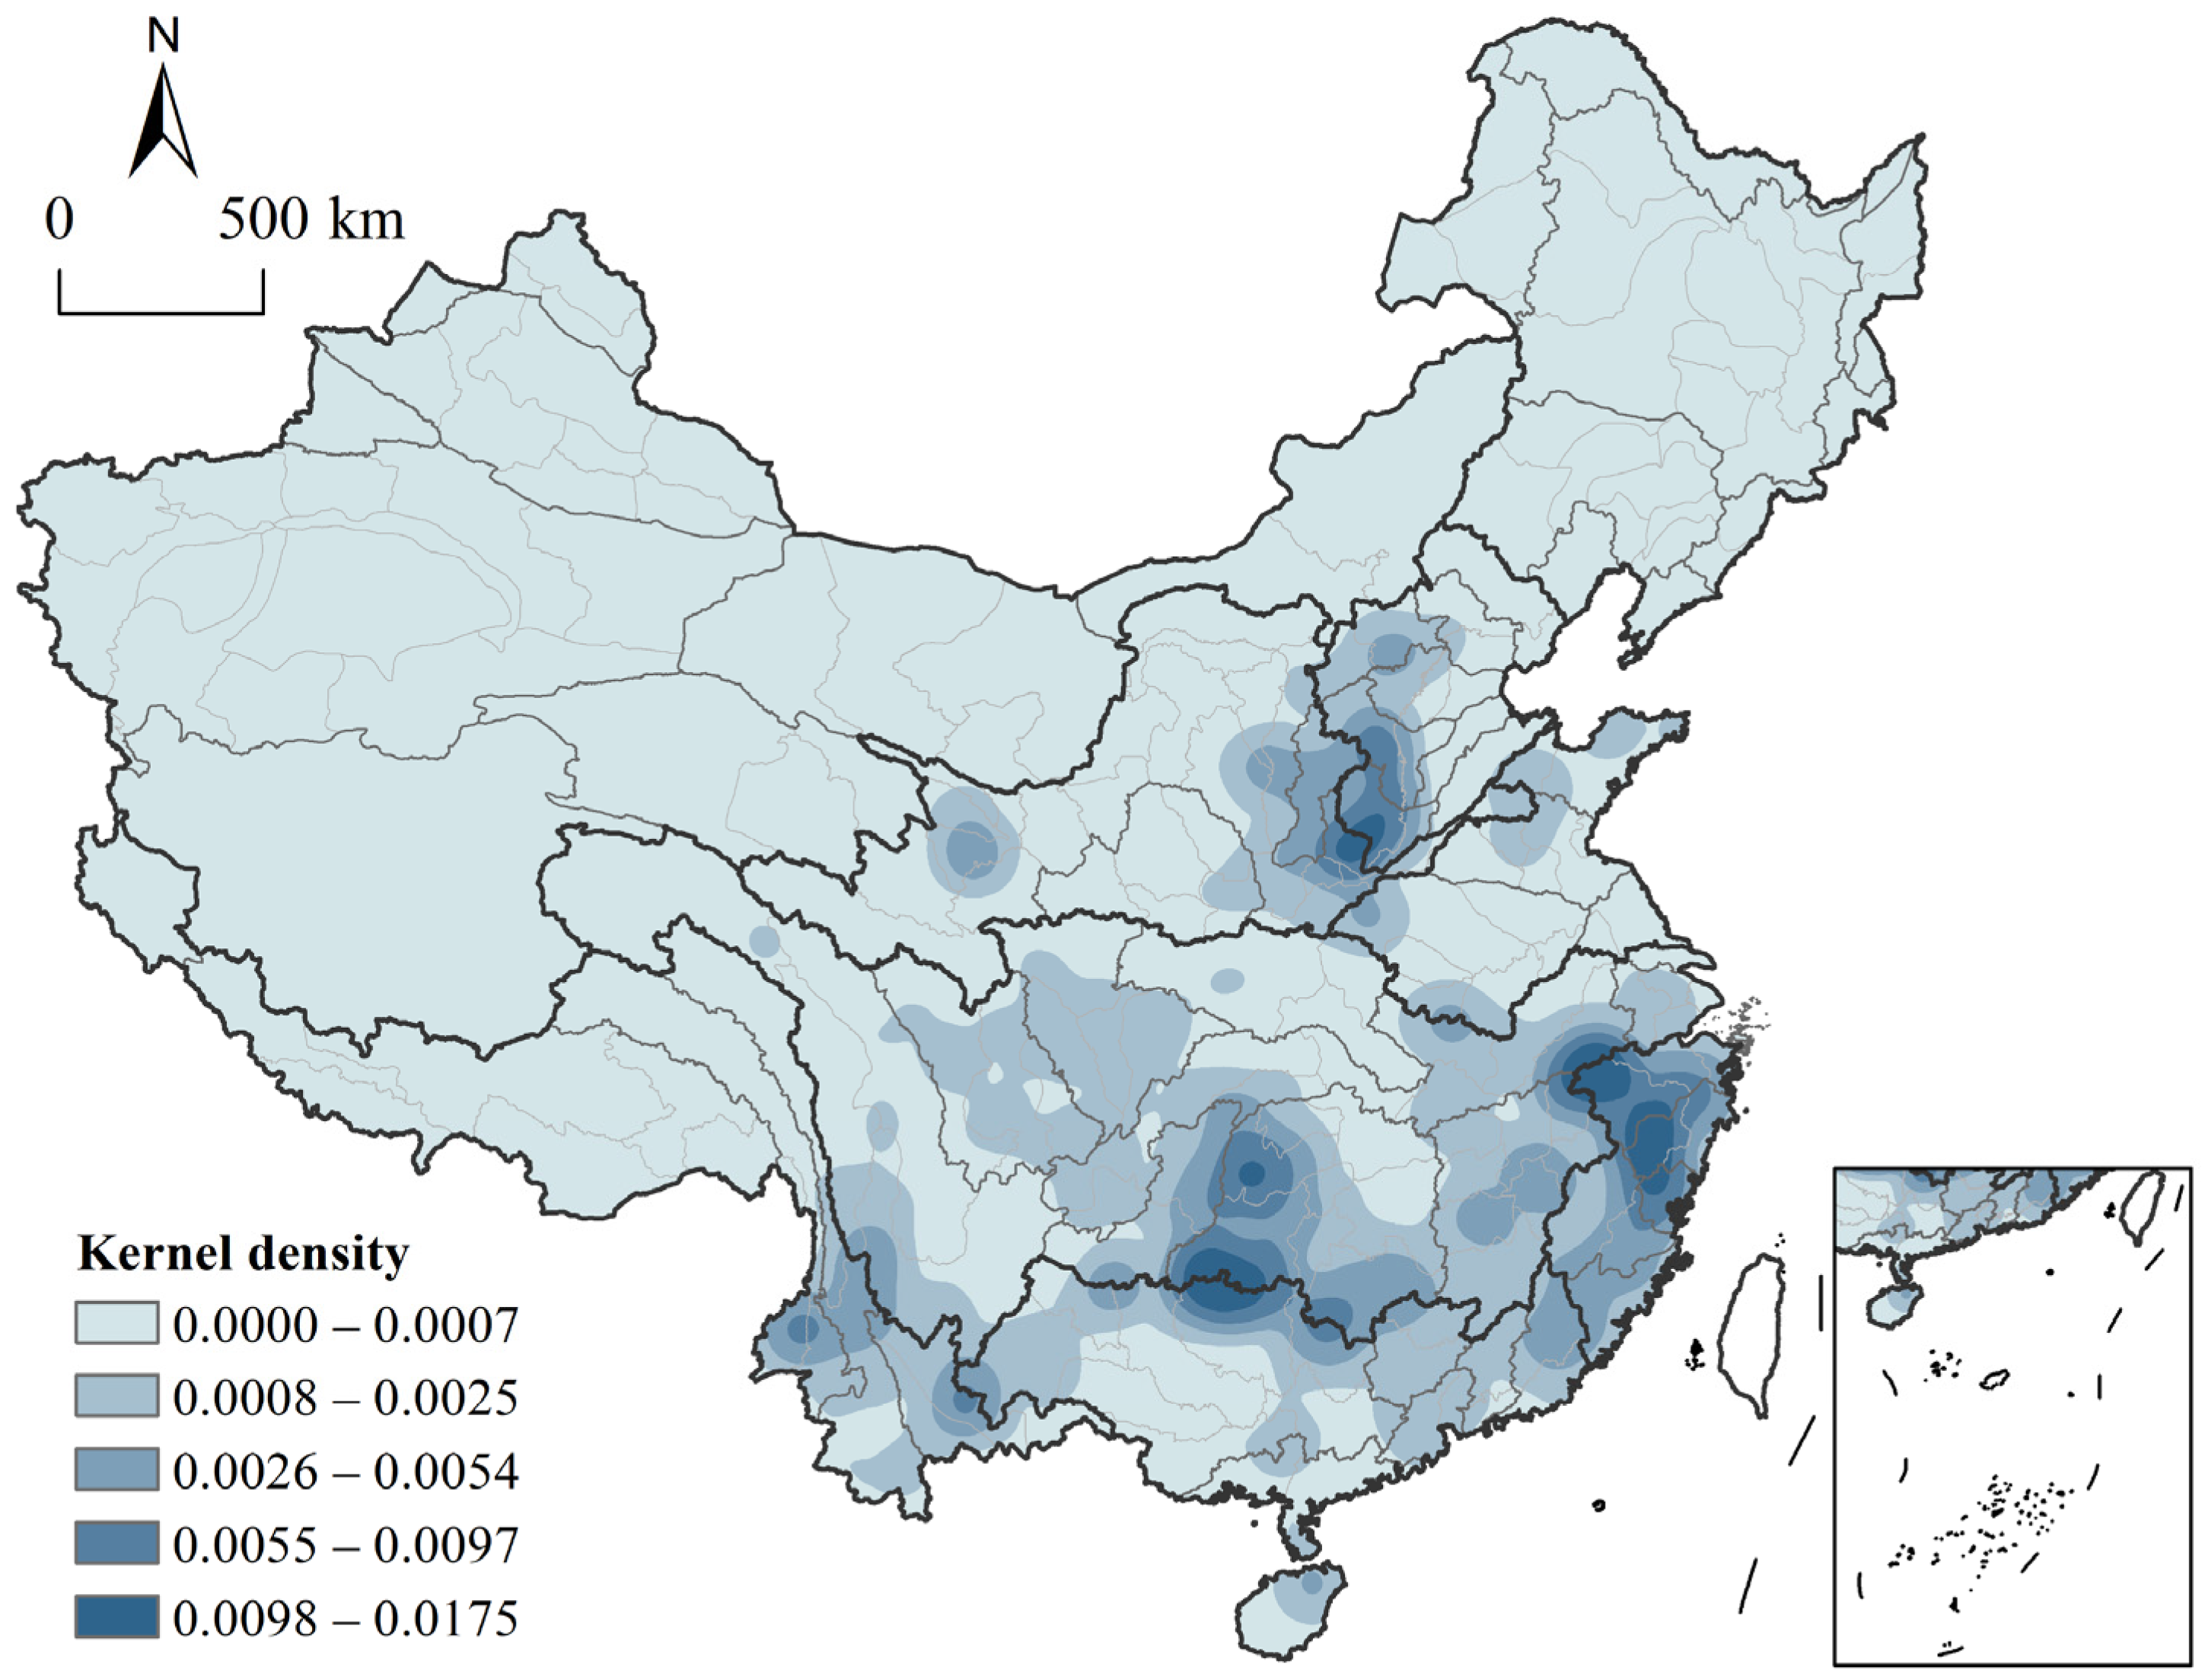
3.2.3. Kernel Density Analysis
3.2.4. Spatial Autocorrelation
3.2.5. Geodetector
4. Results
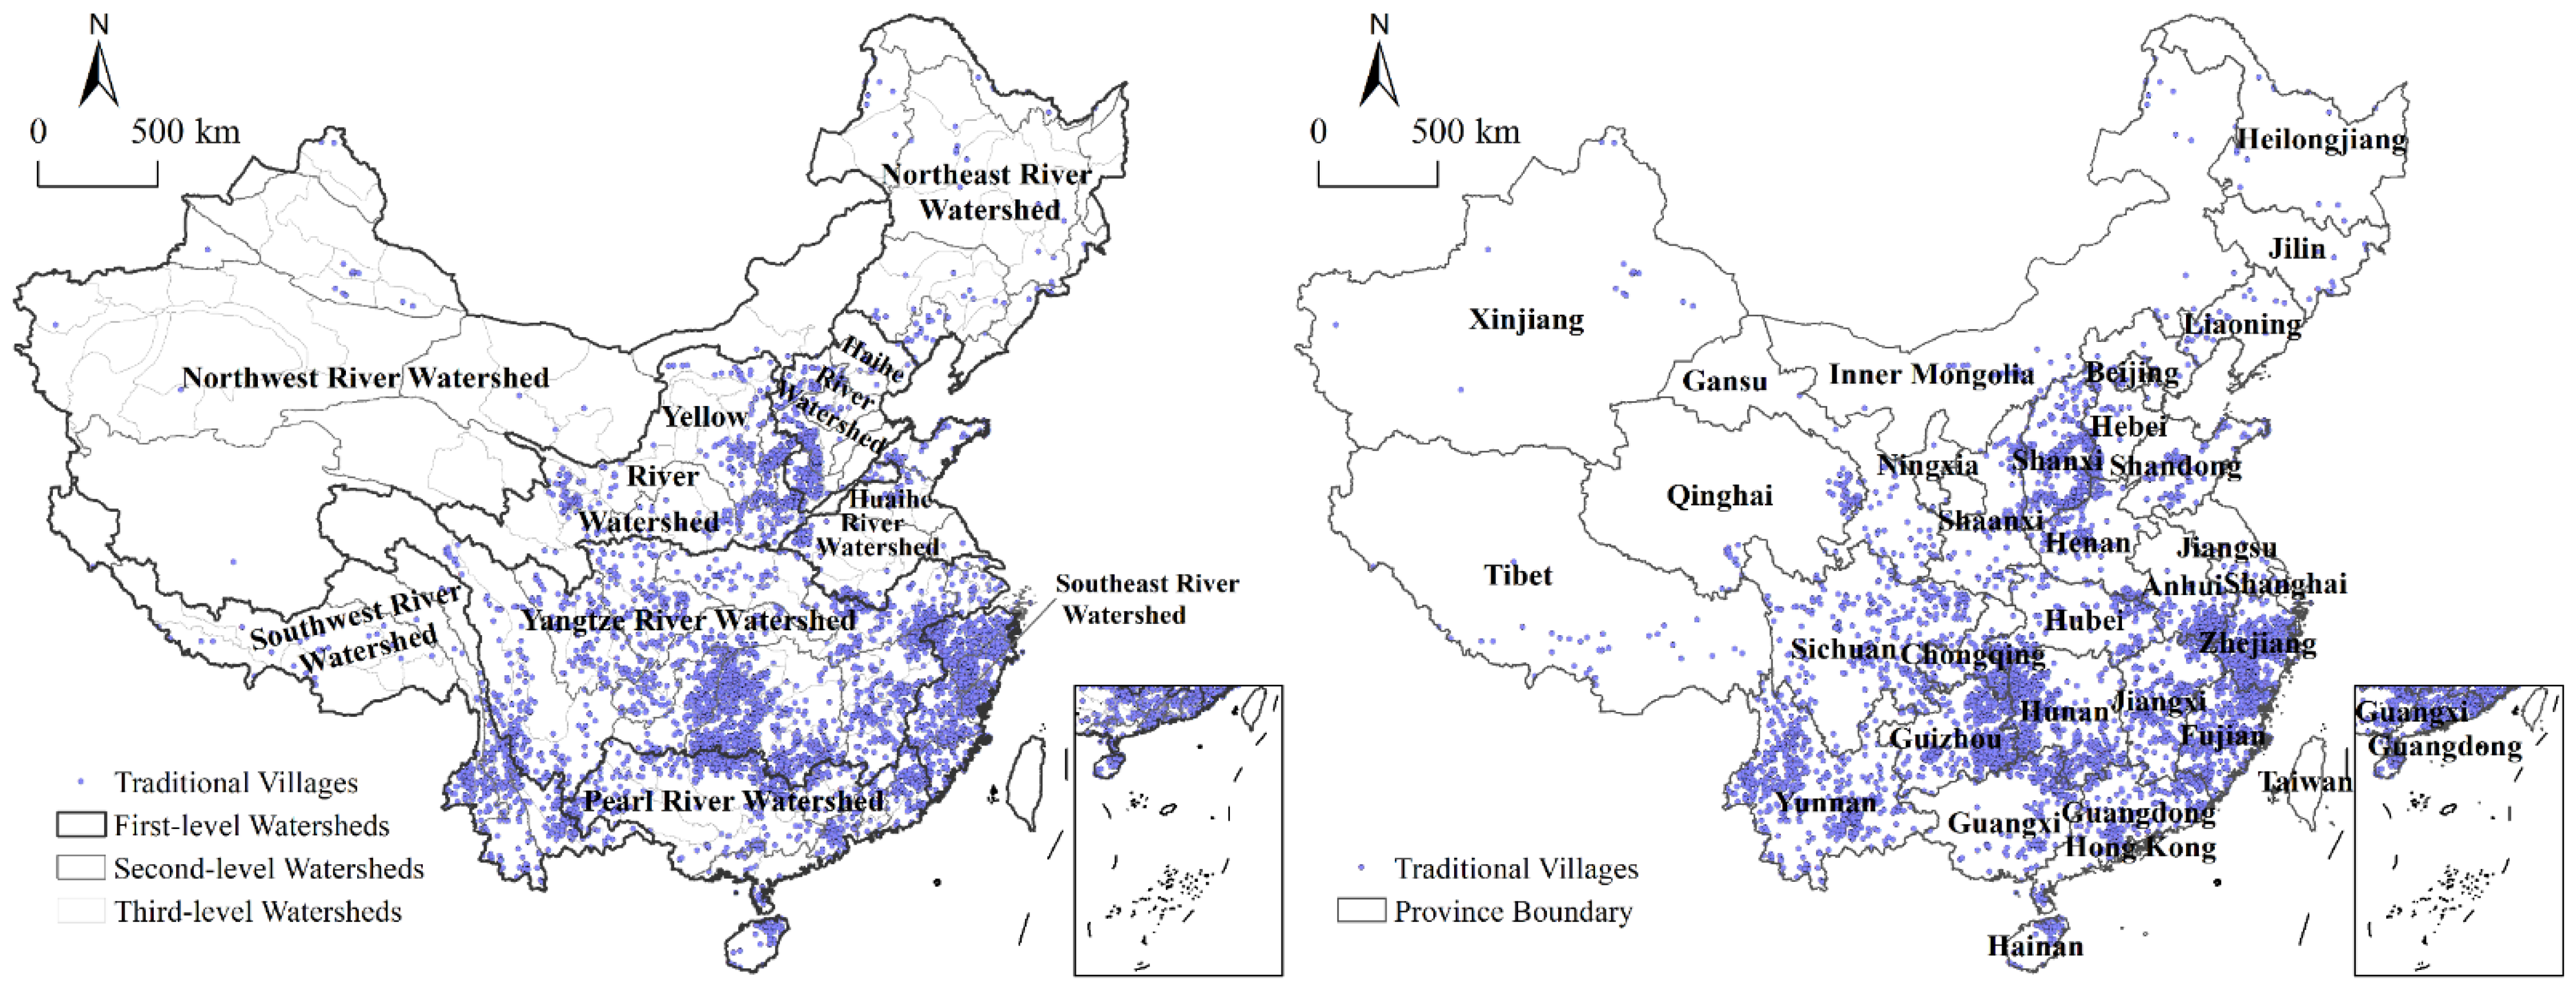
4.1. Watershed Distribution Differences
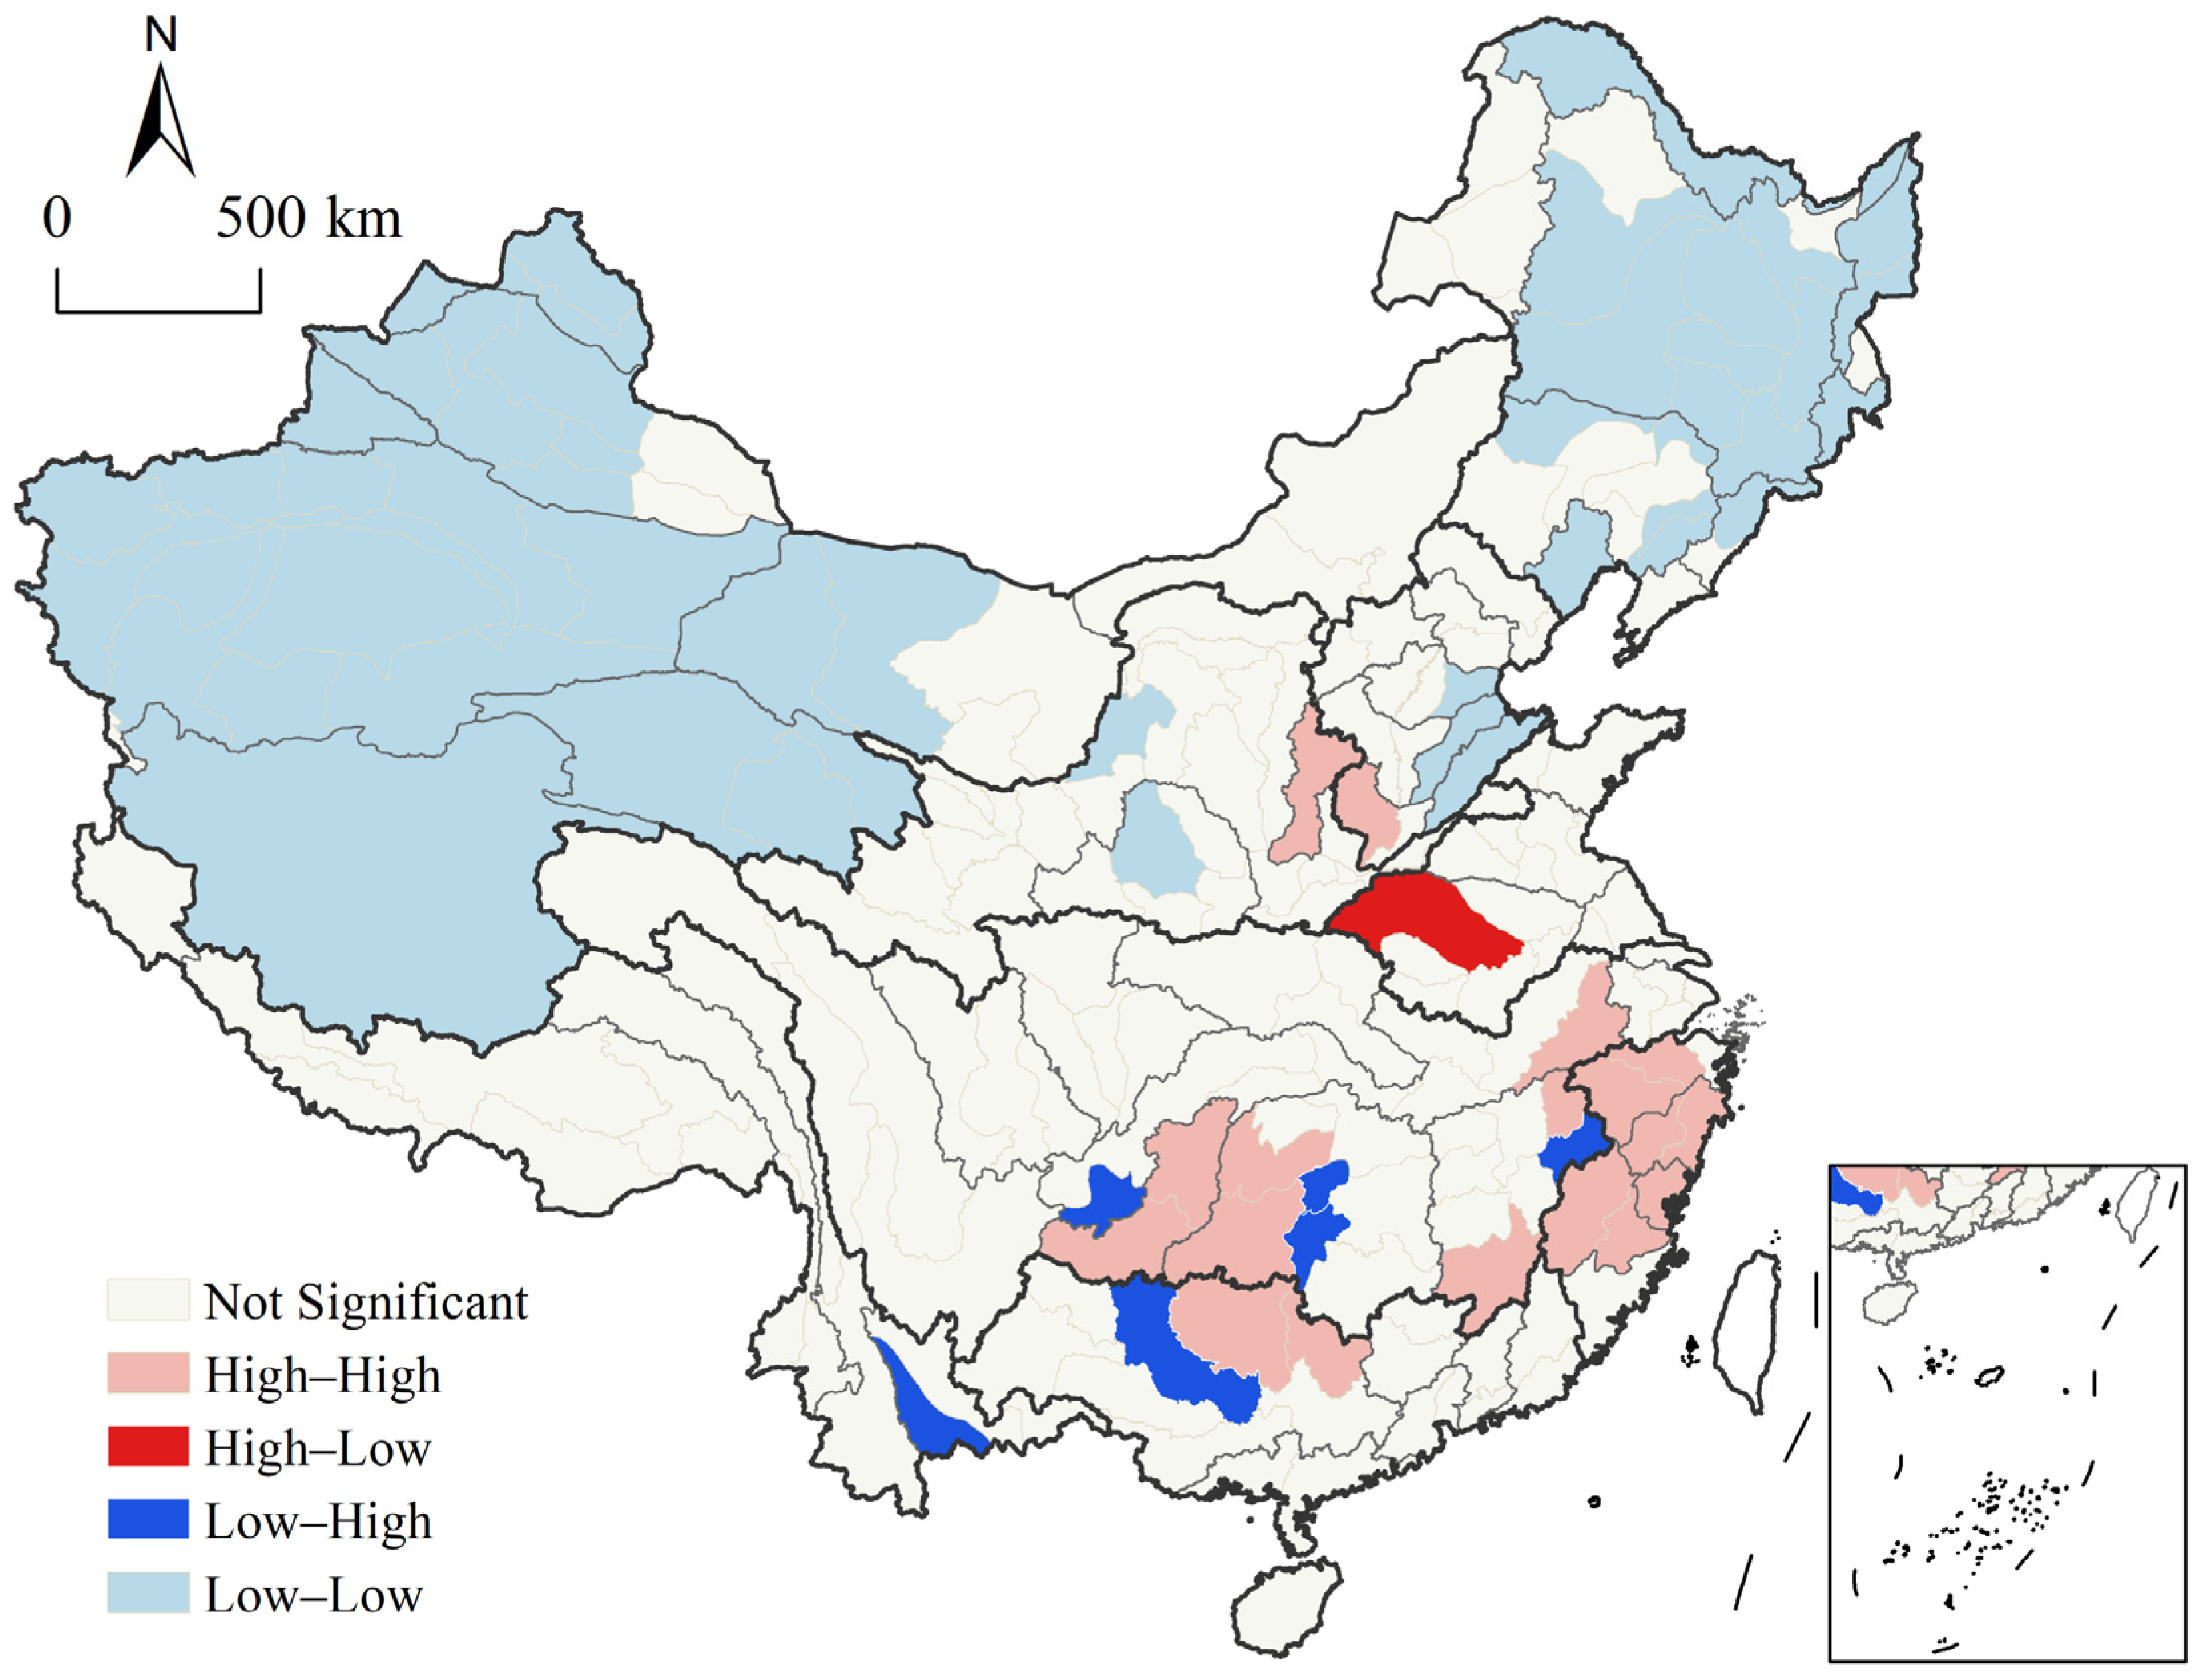
4.2. Spatial Autocorrelation Analysis
4.3. Spatial Agglomeration Characteristics
4.4. Influencing Factors of Traditional Village Distributions
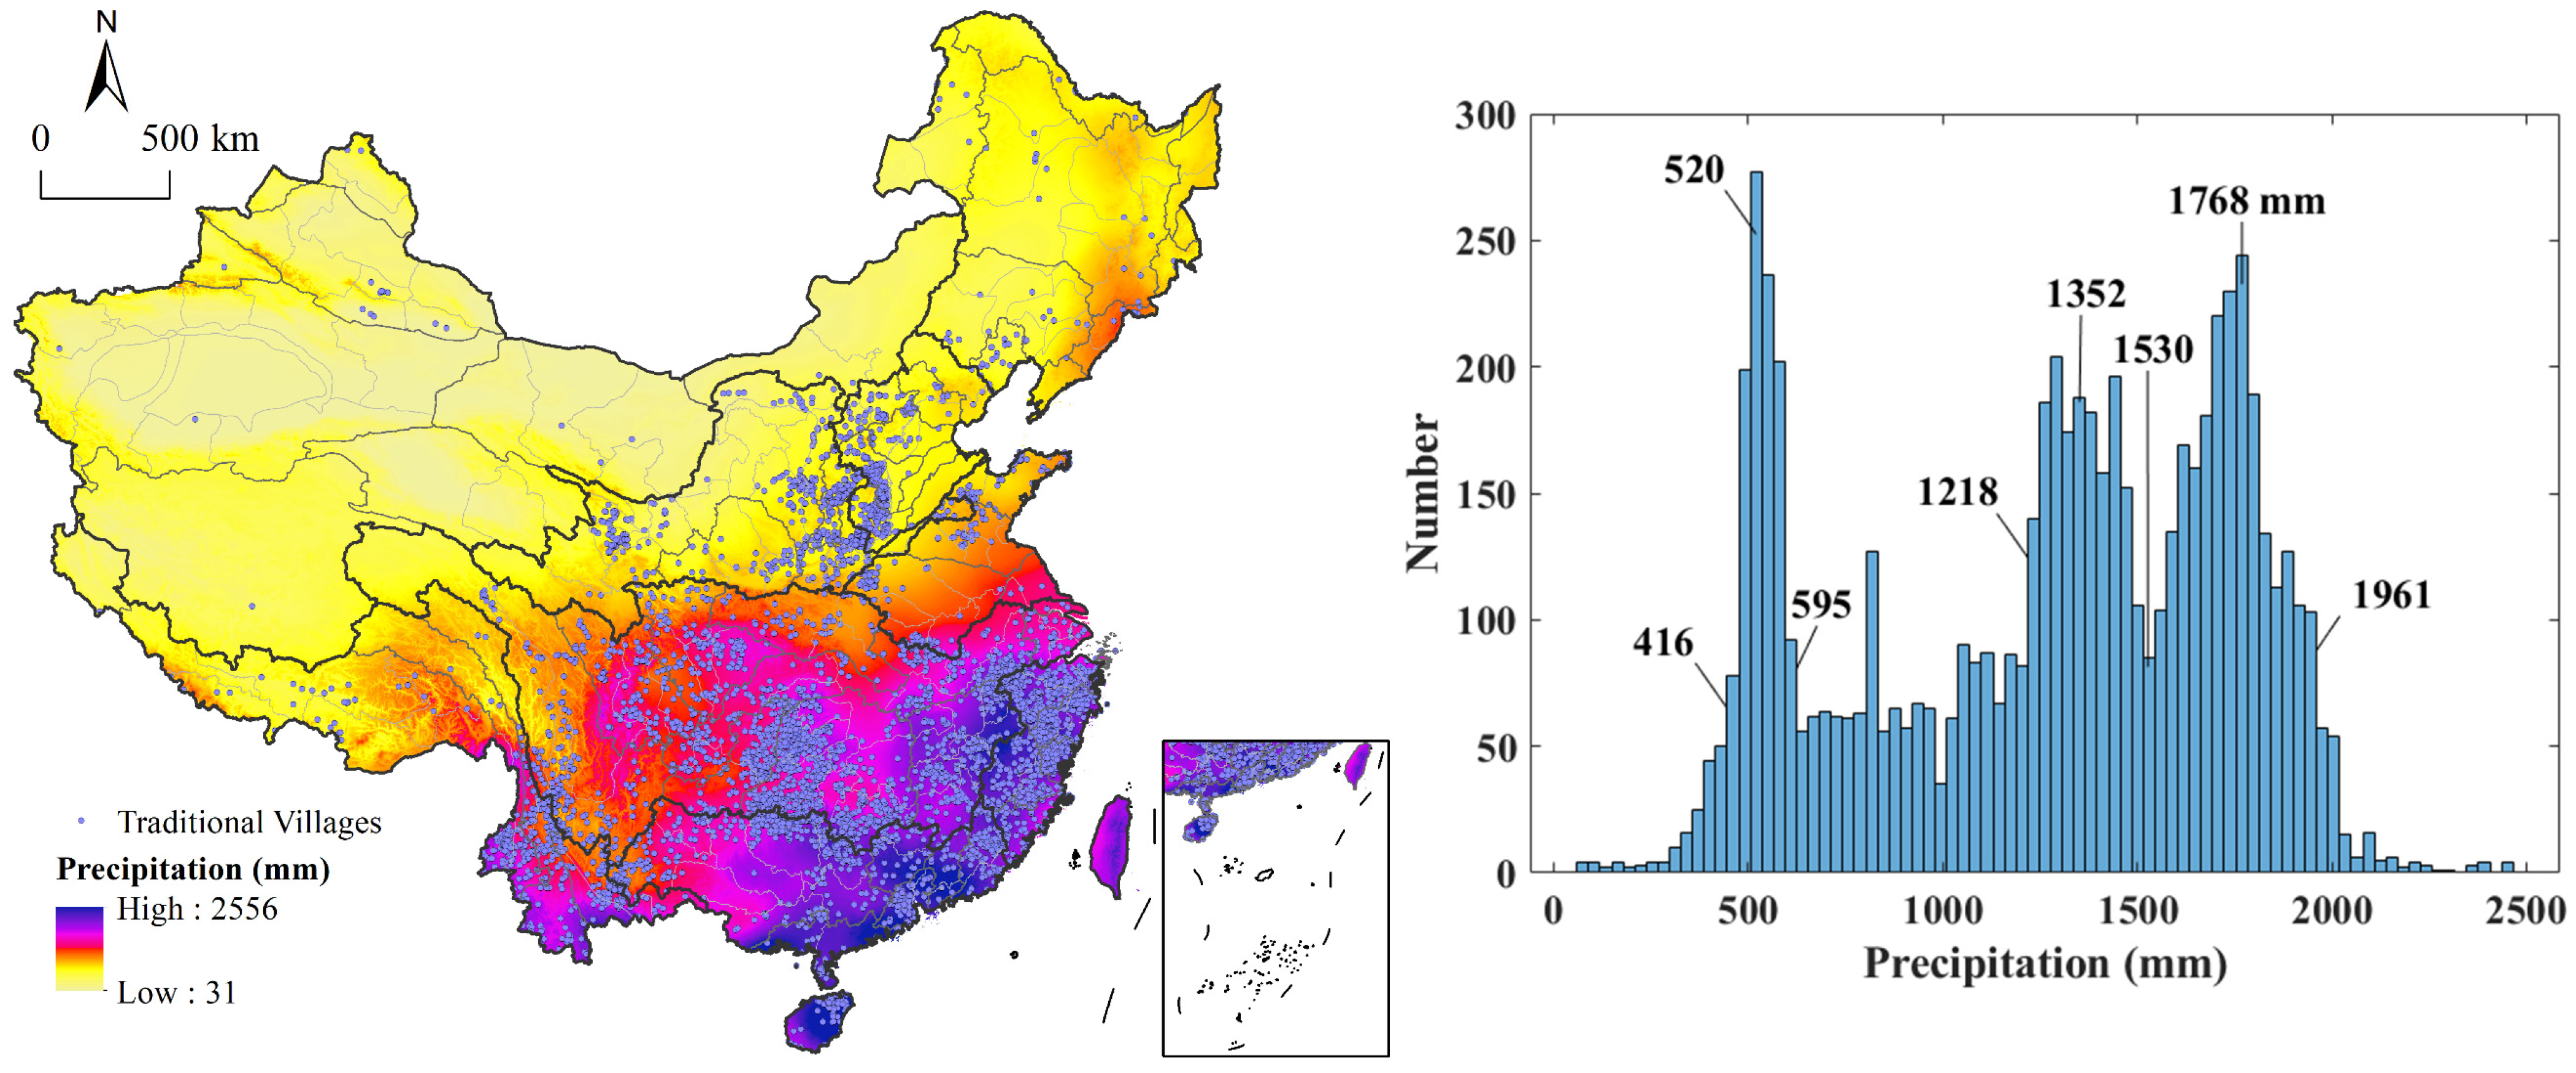
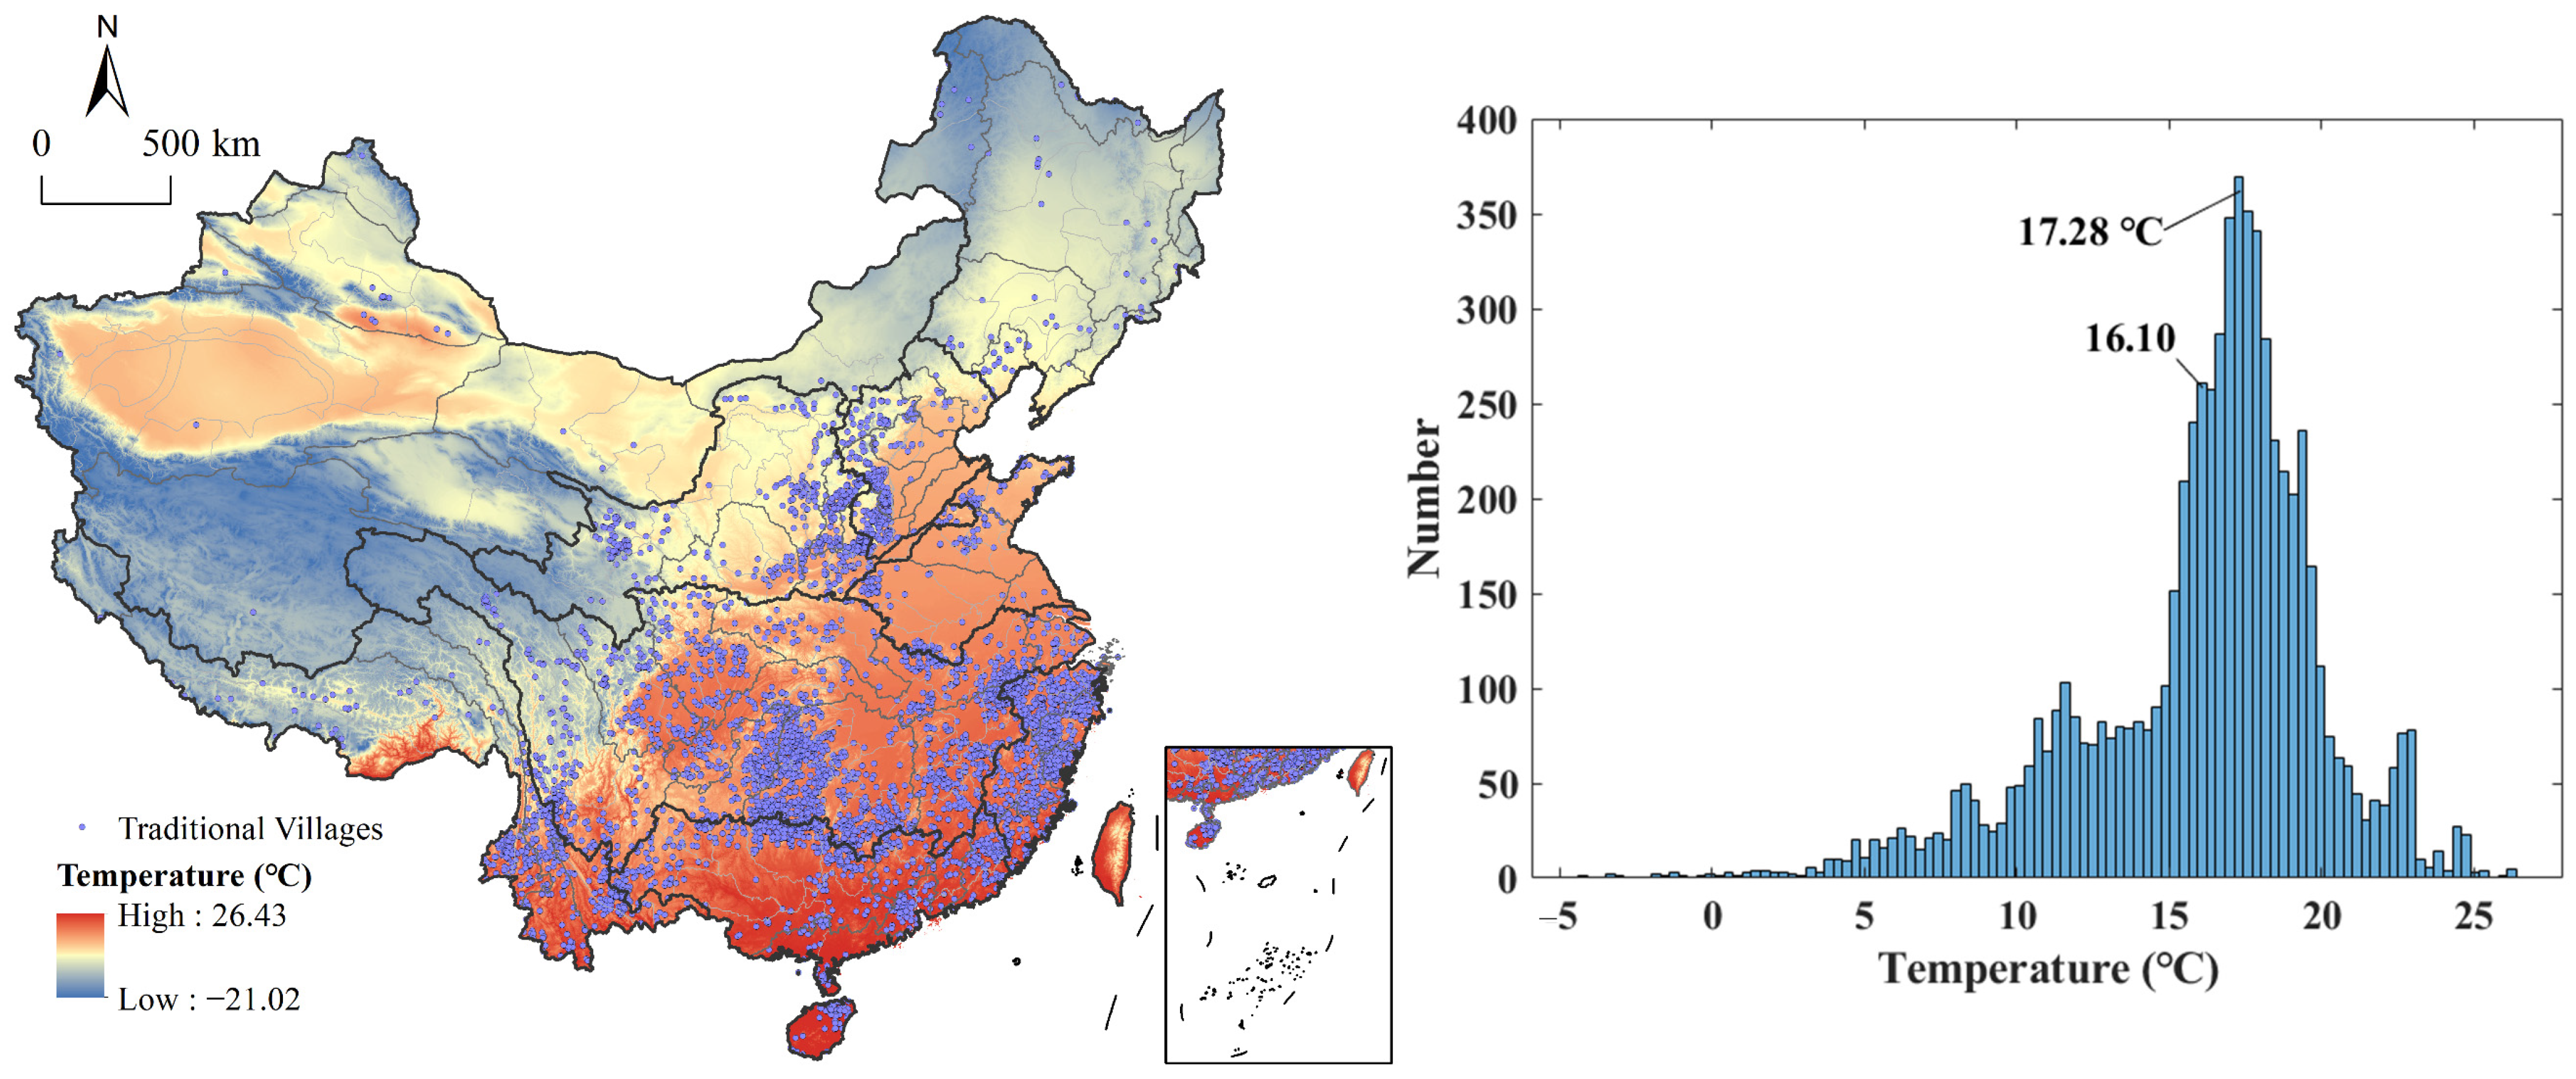
4.4.1. Climate
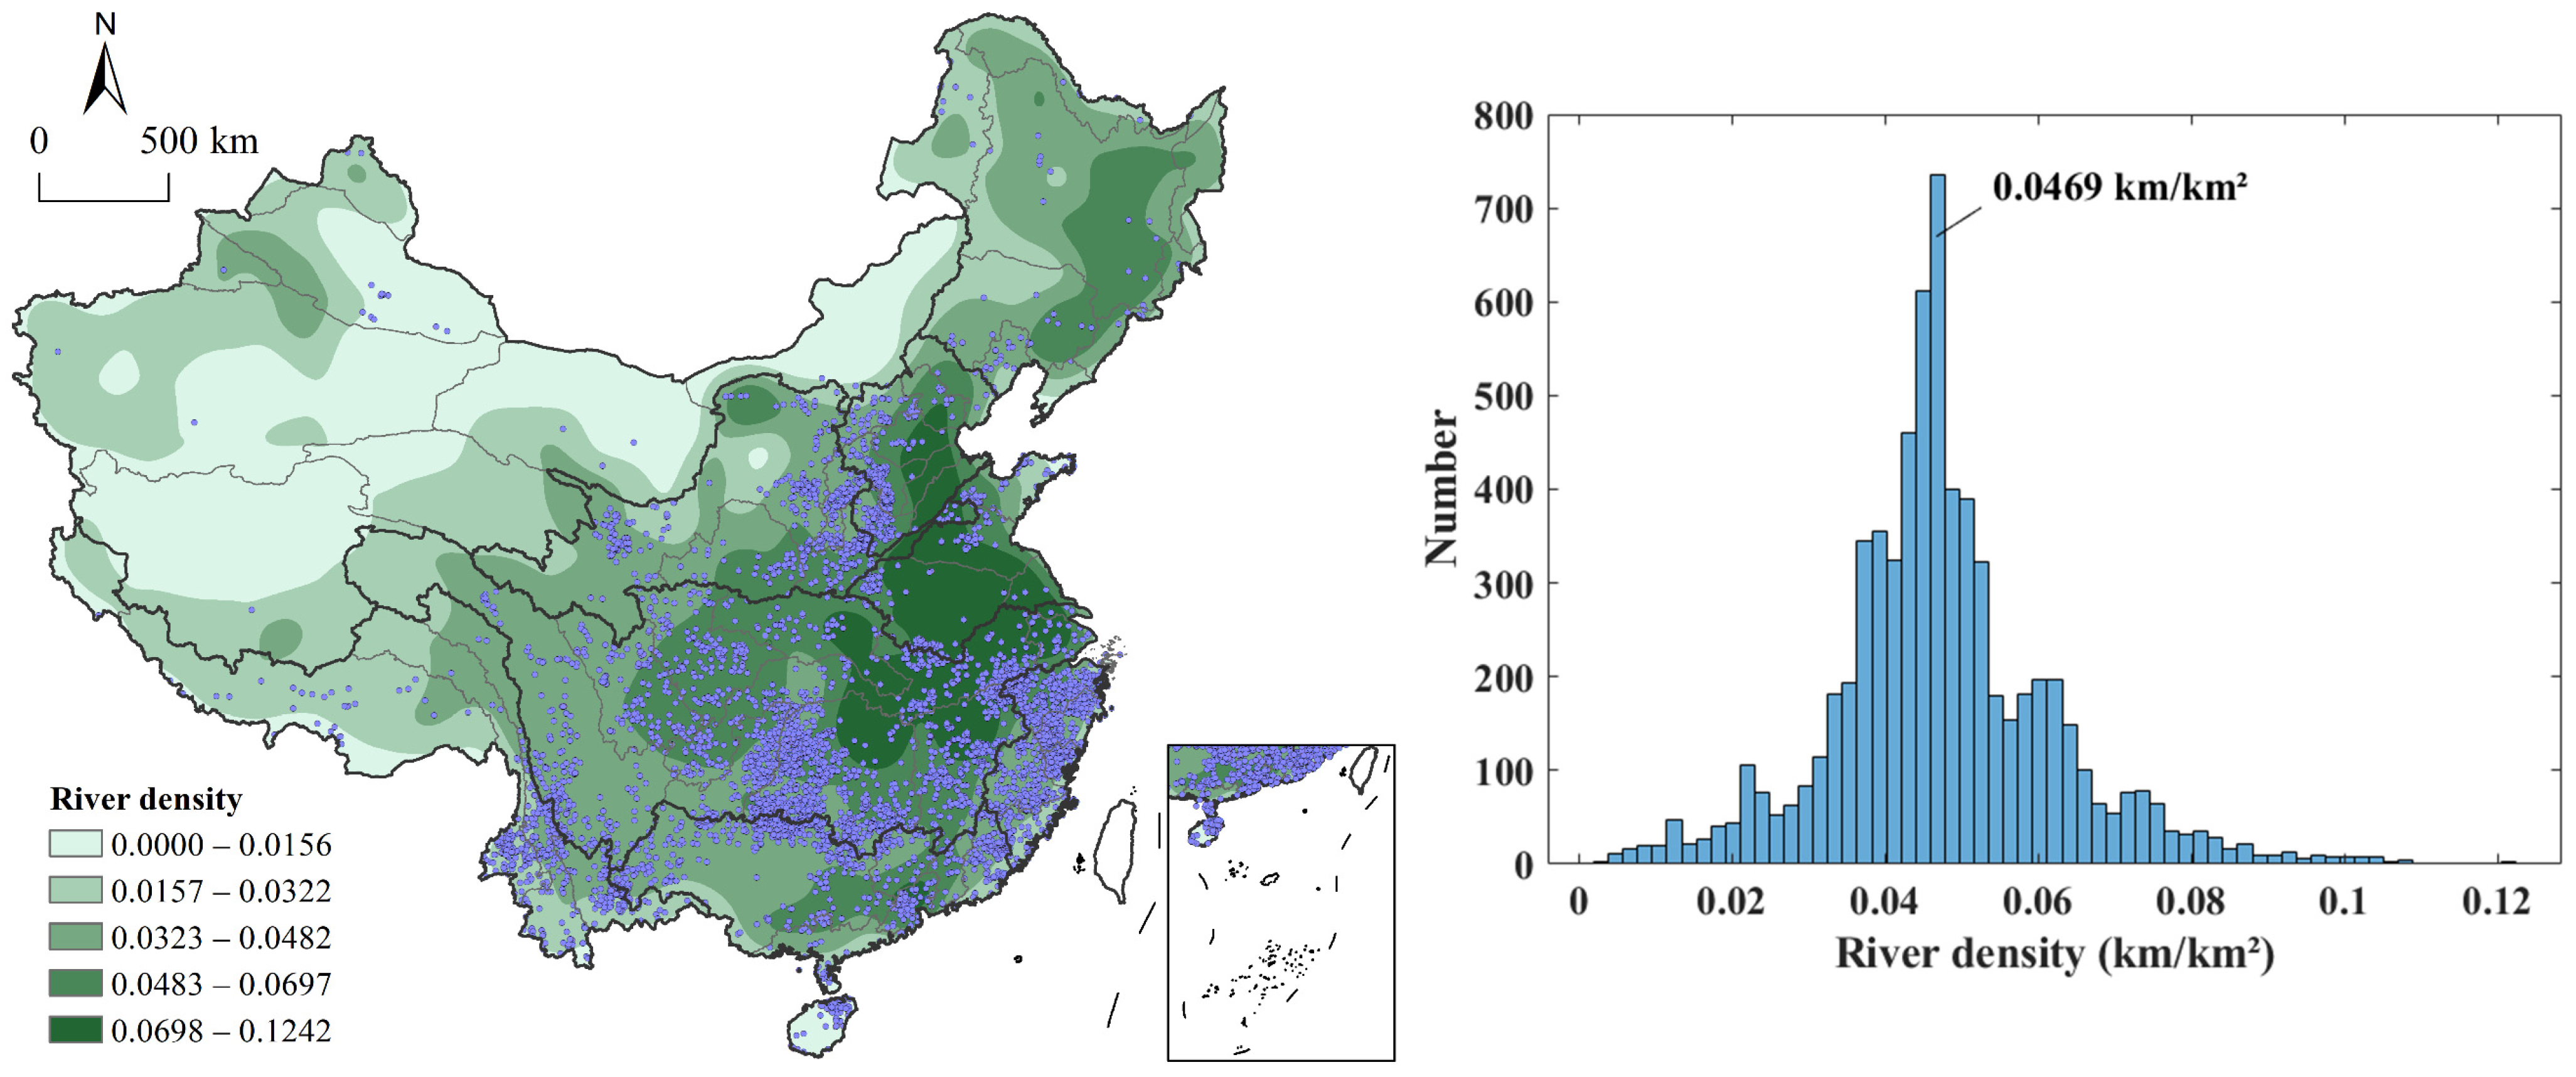
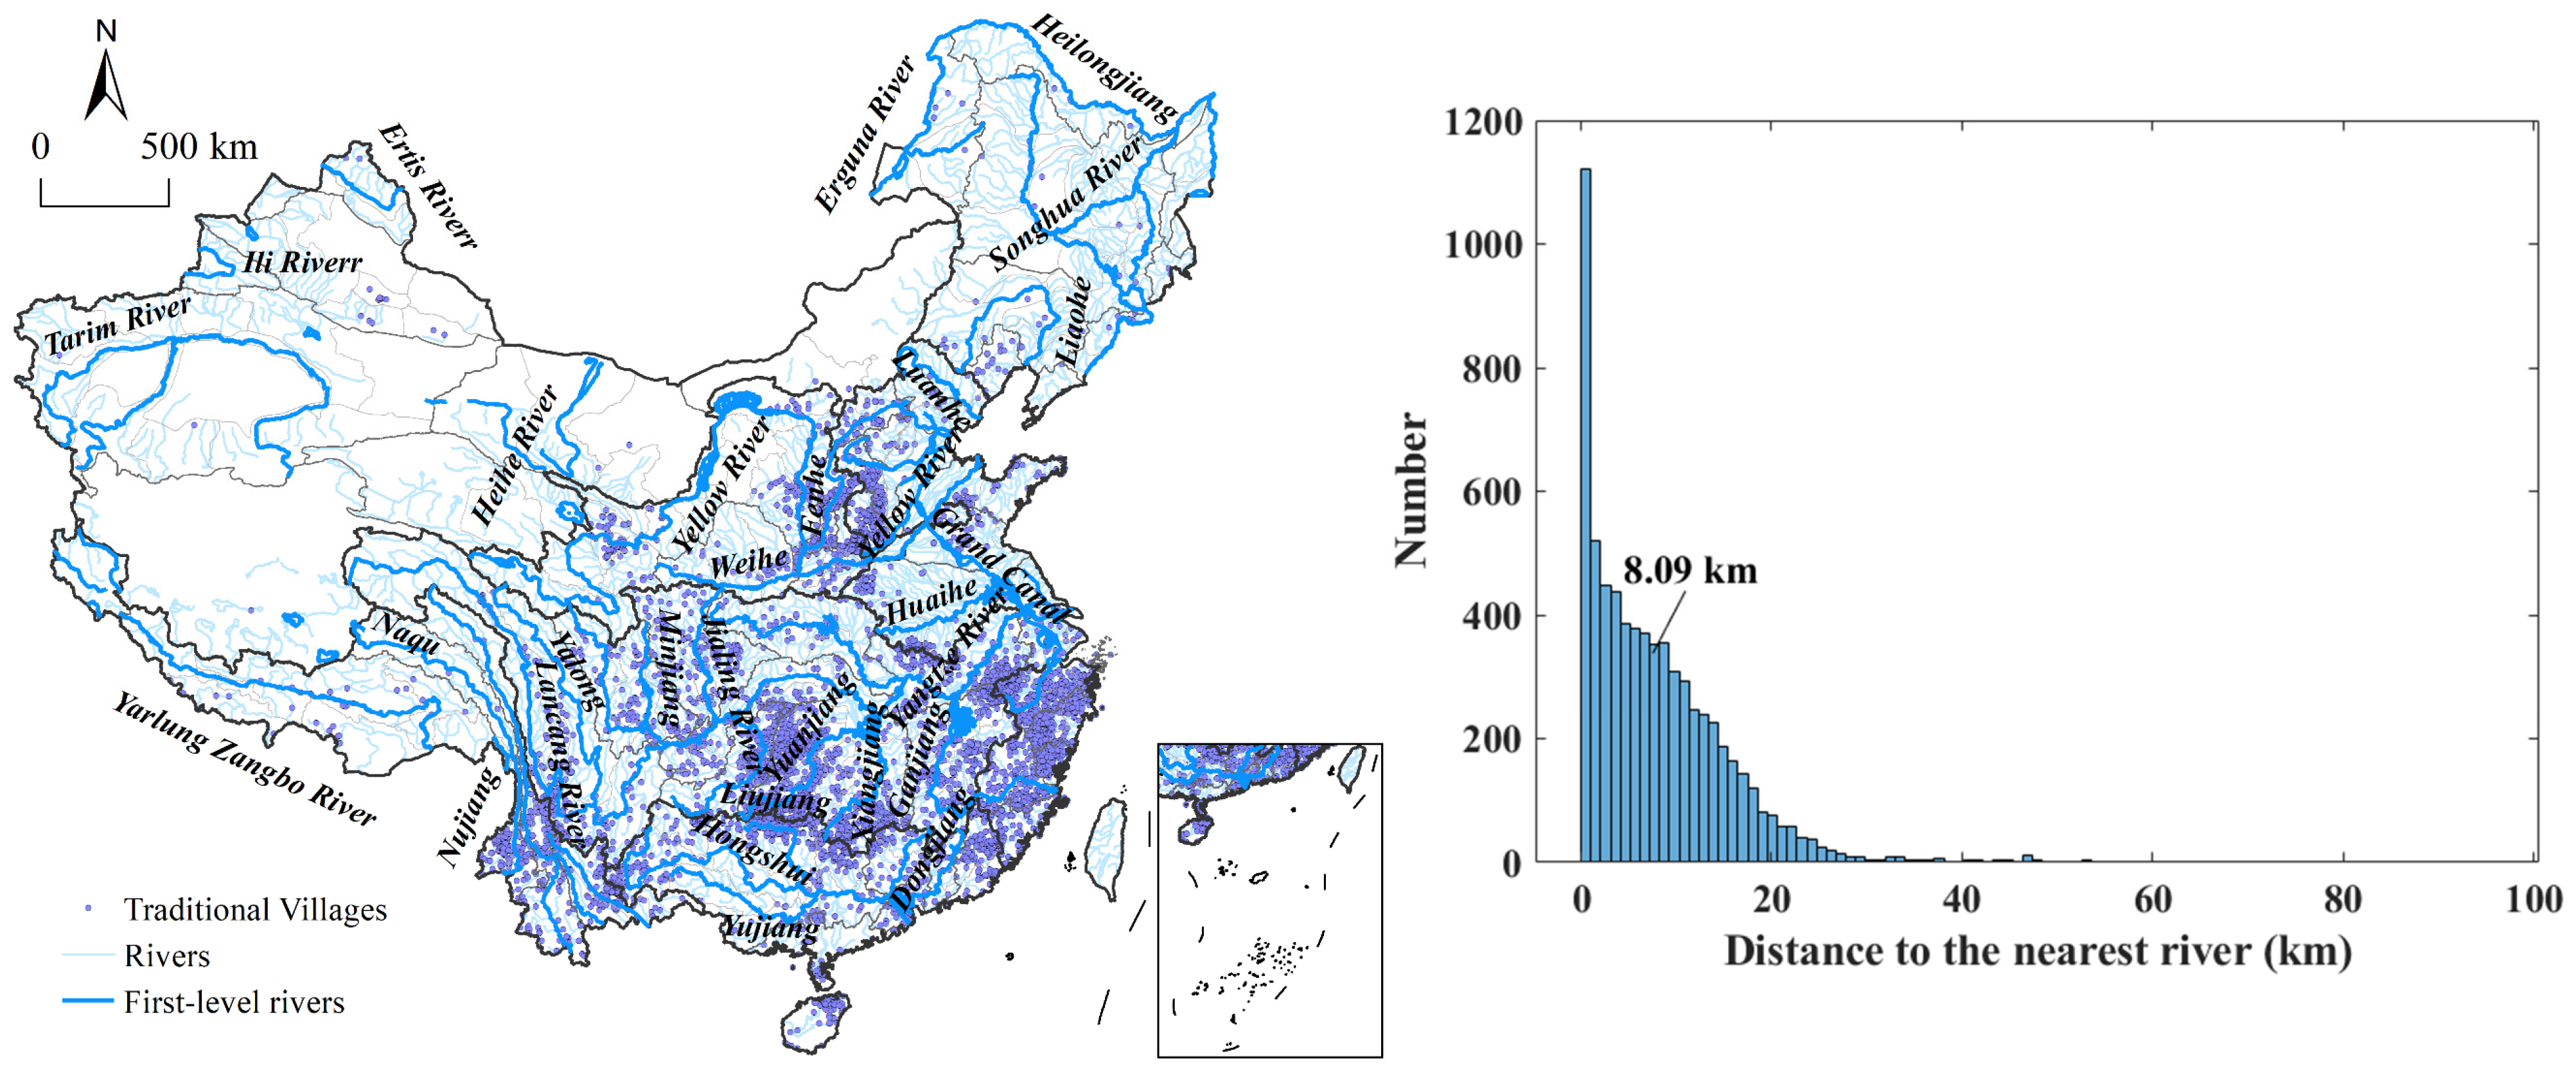
4.4.2. River
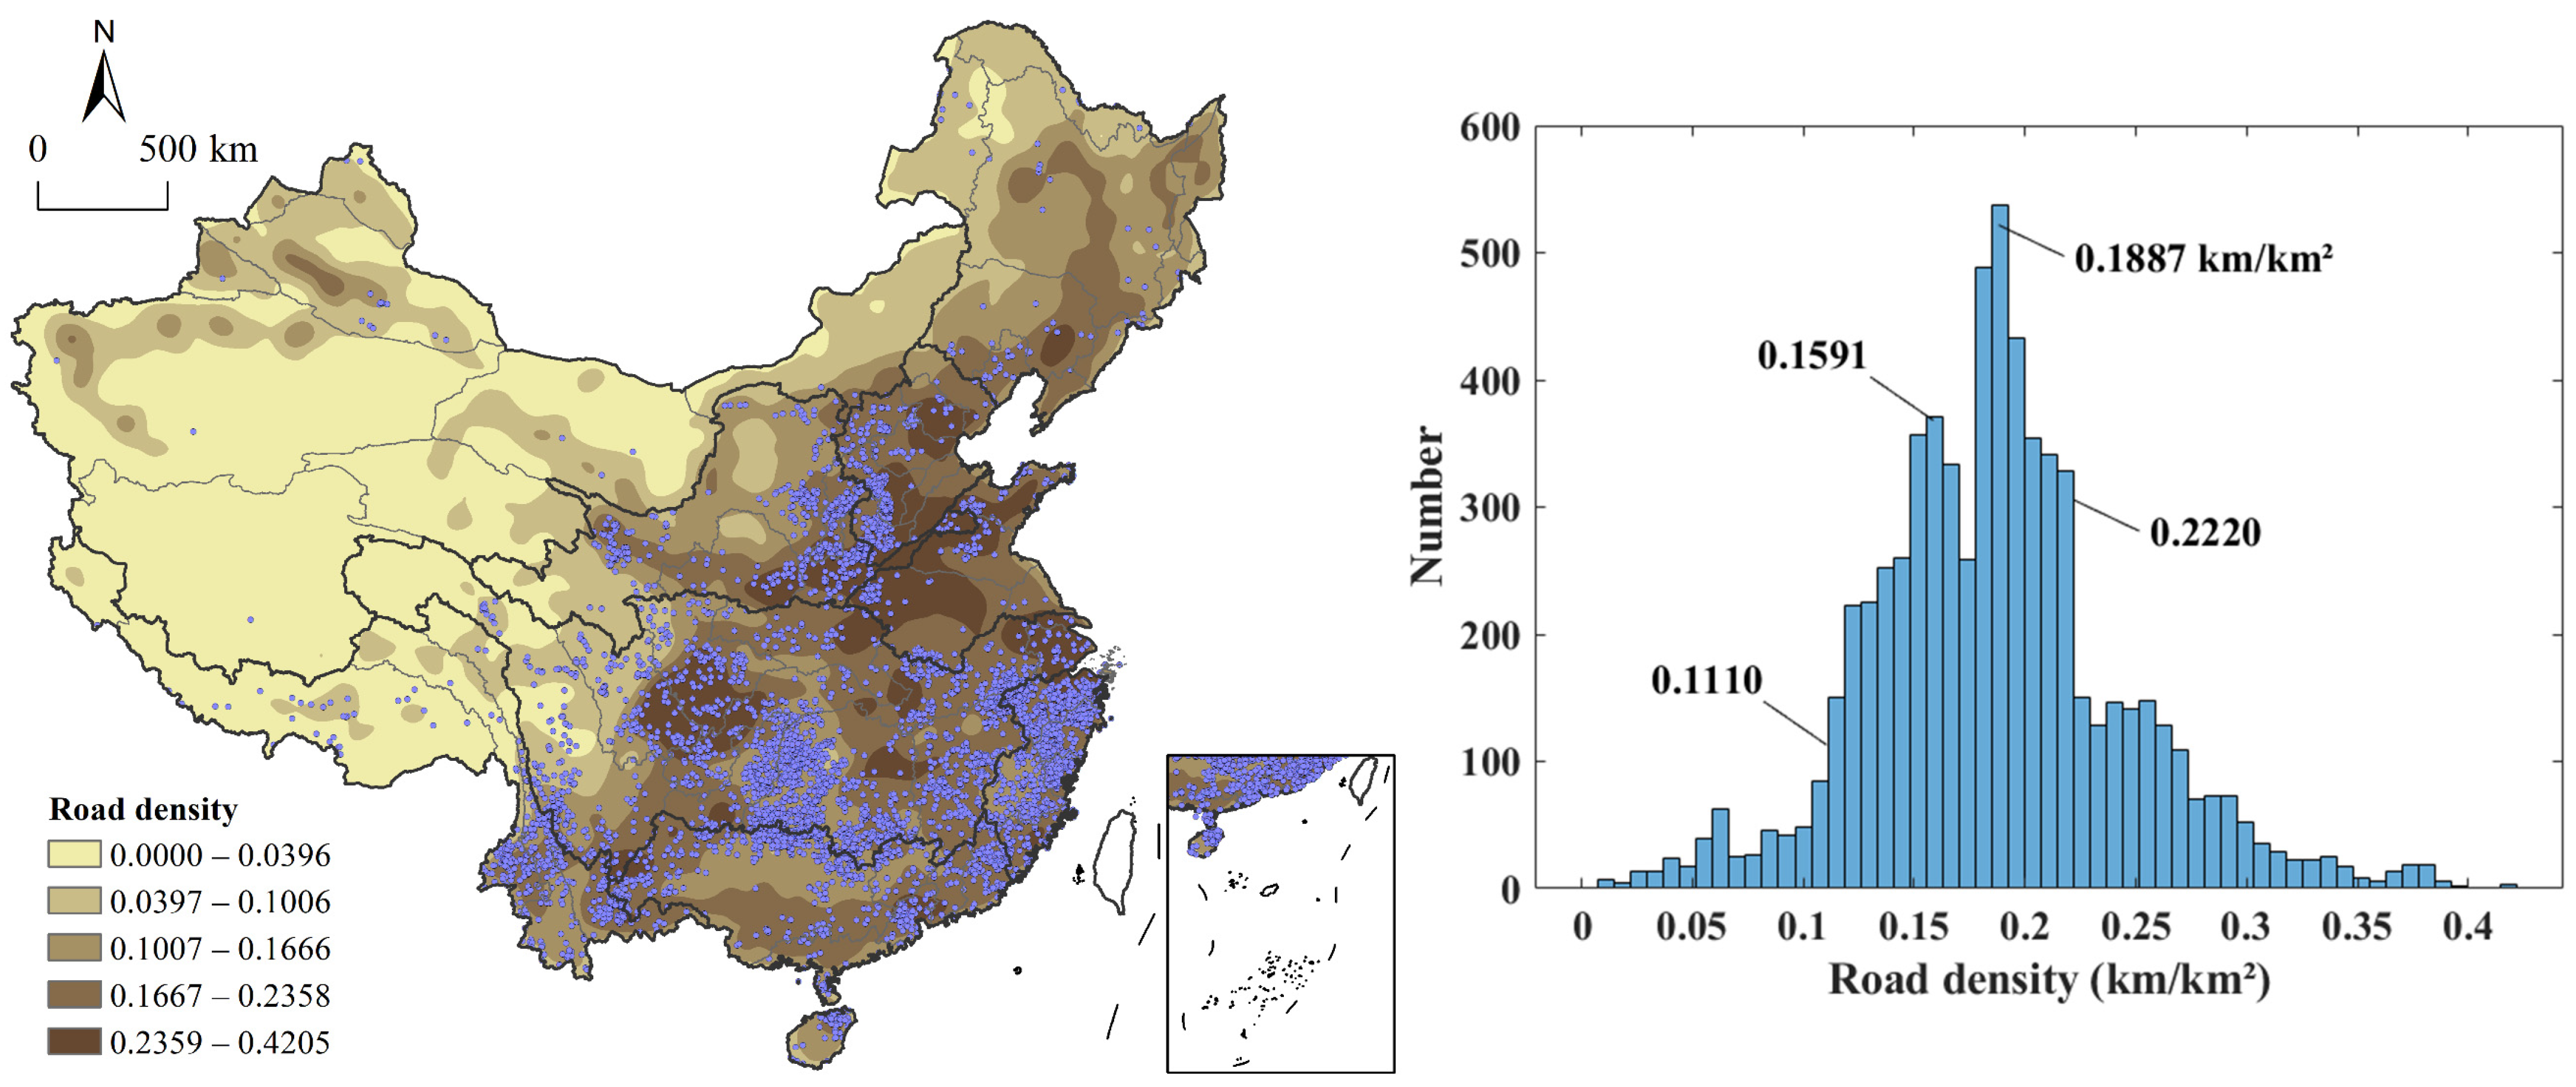
4.4.3. Transportation
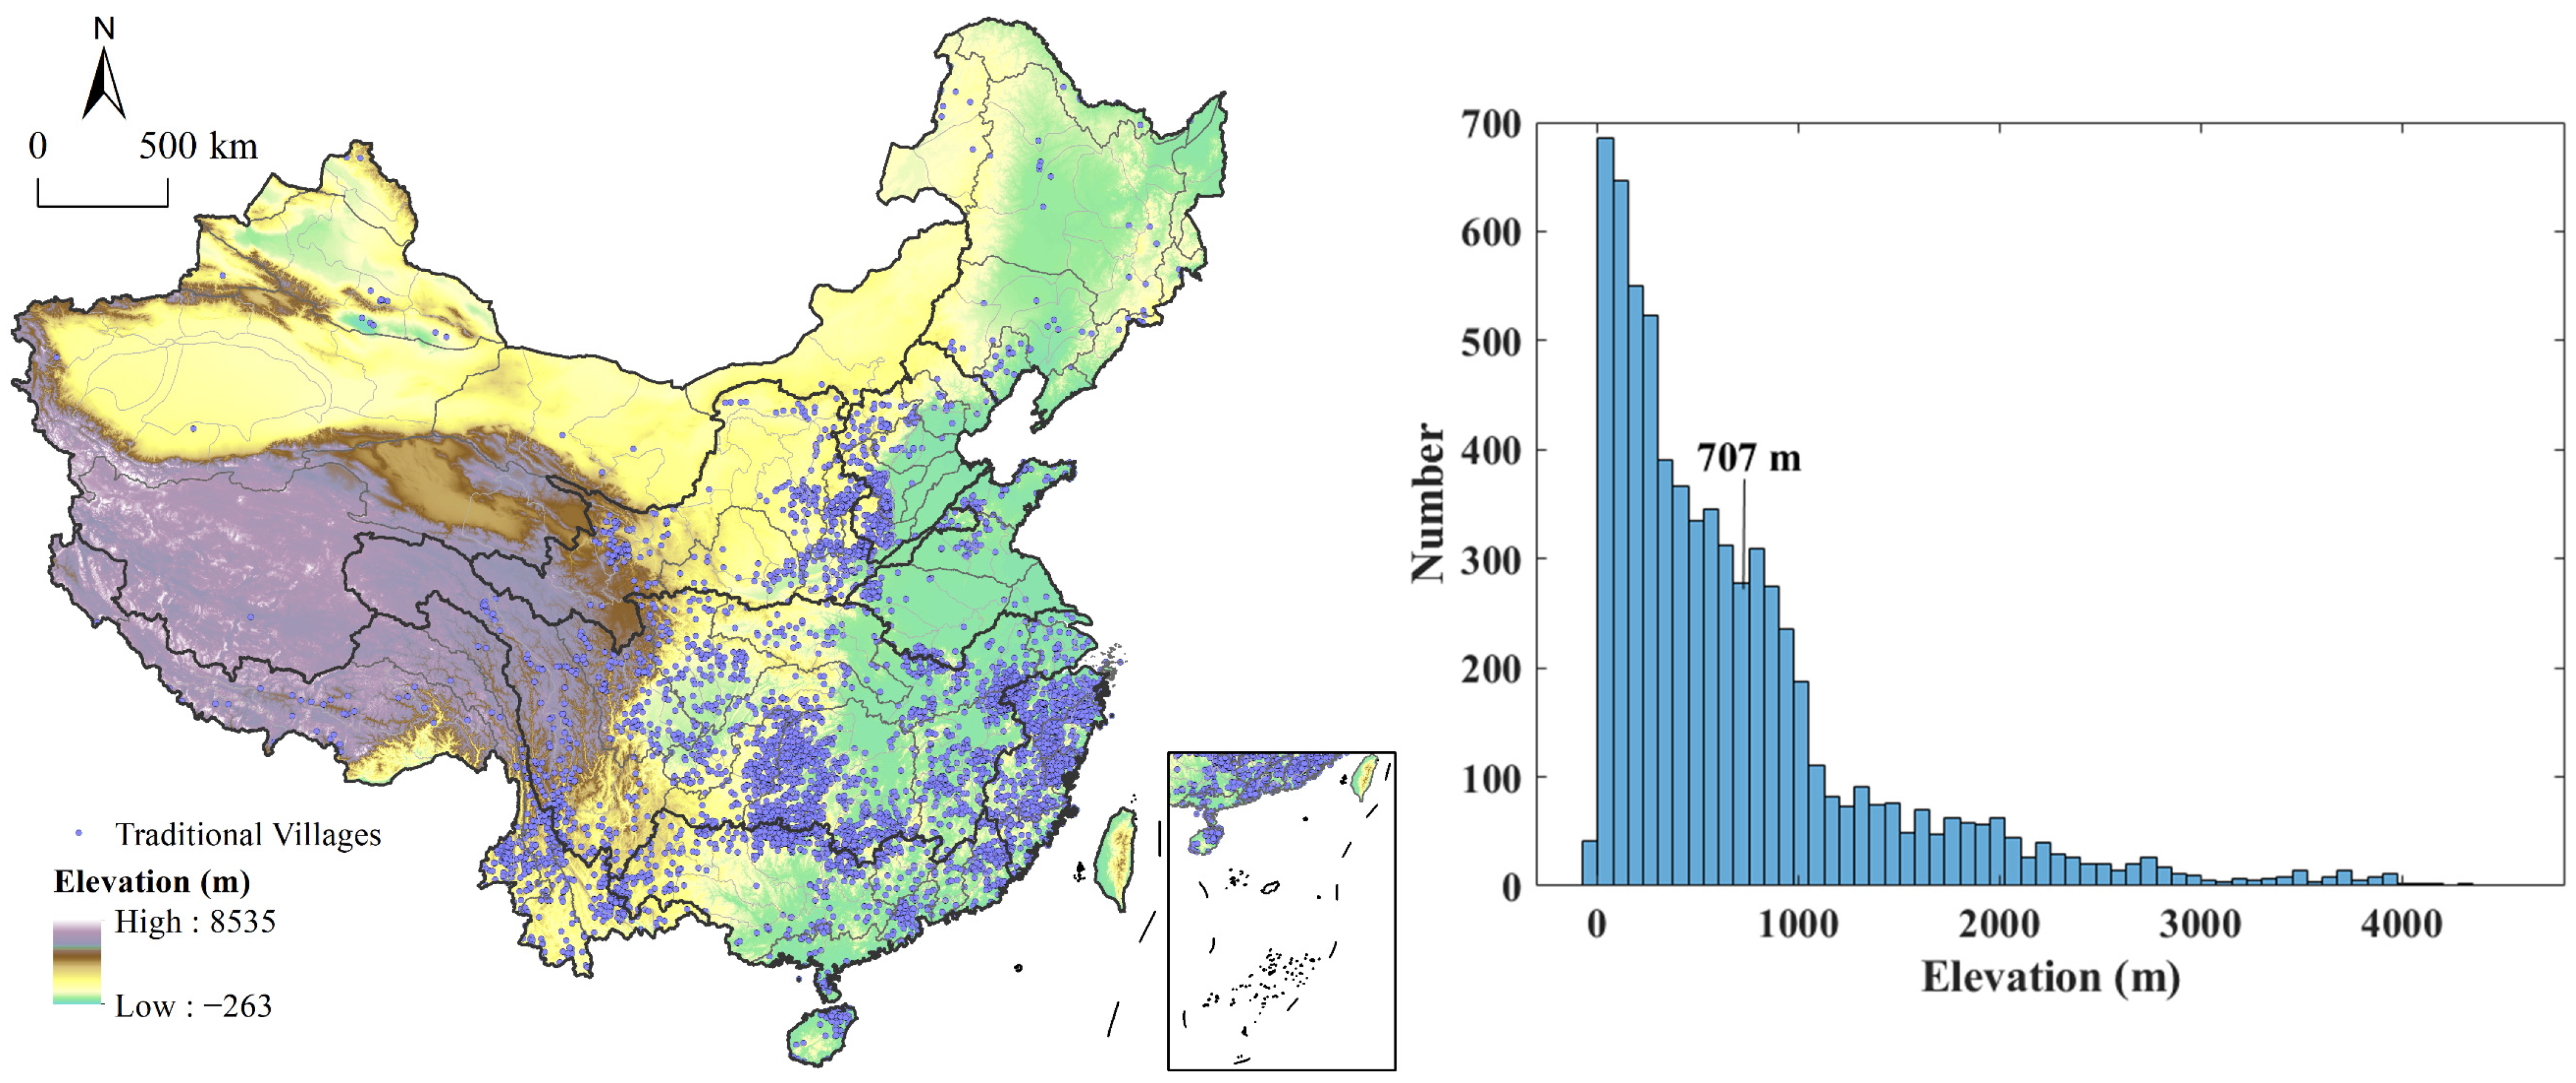
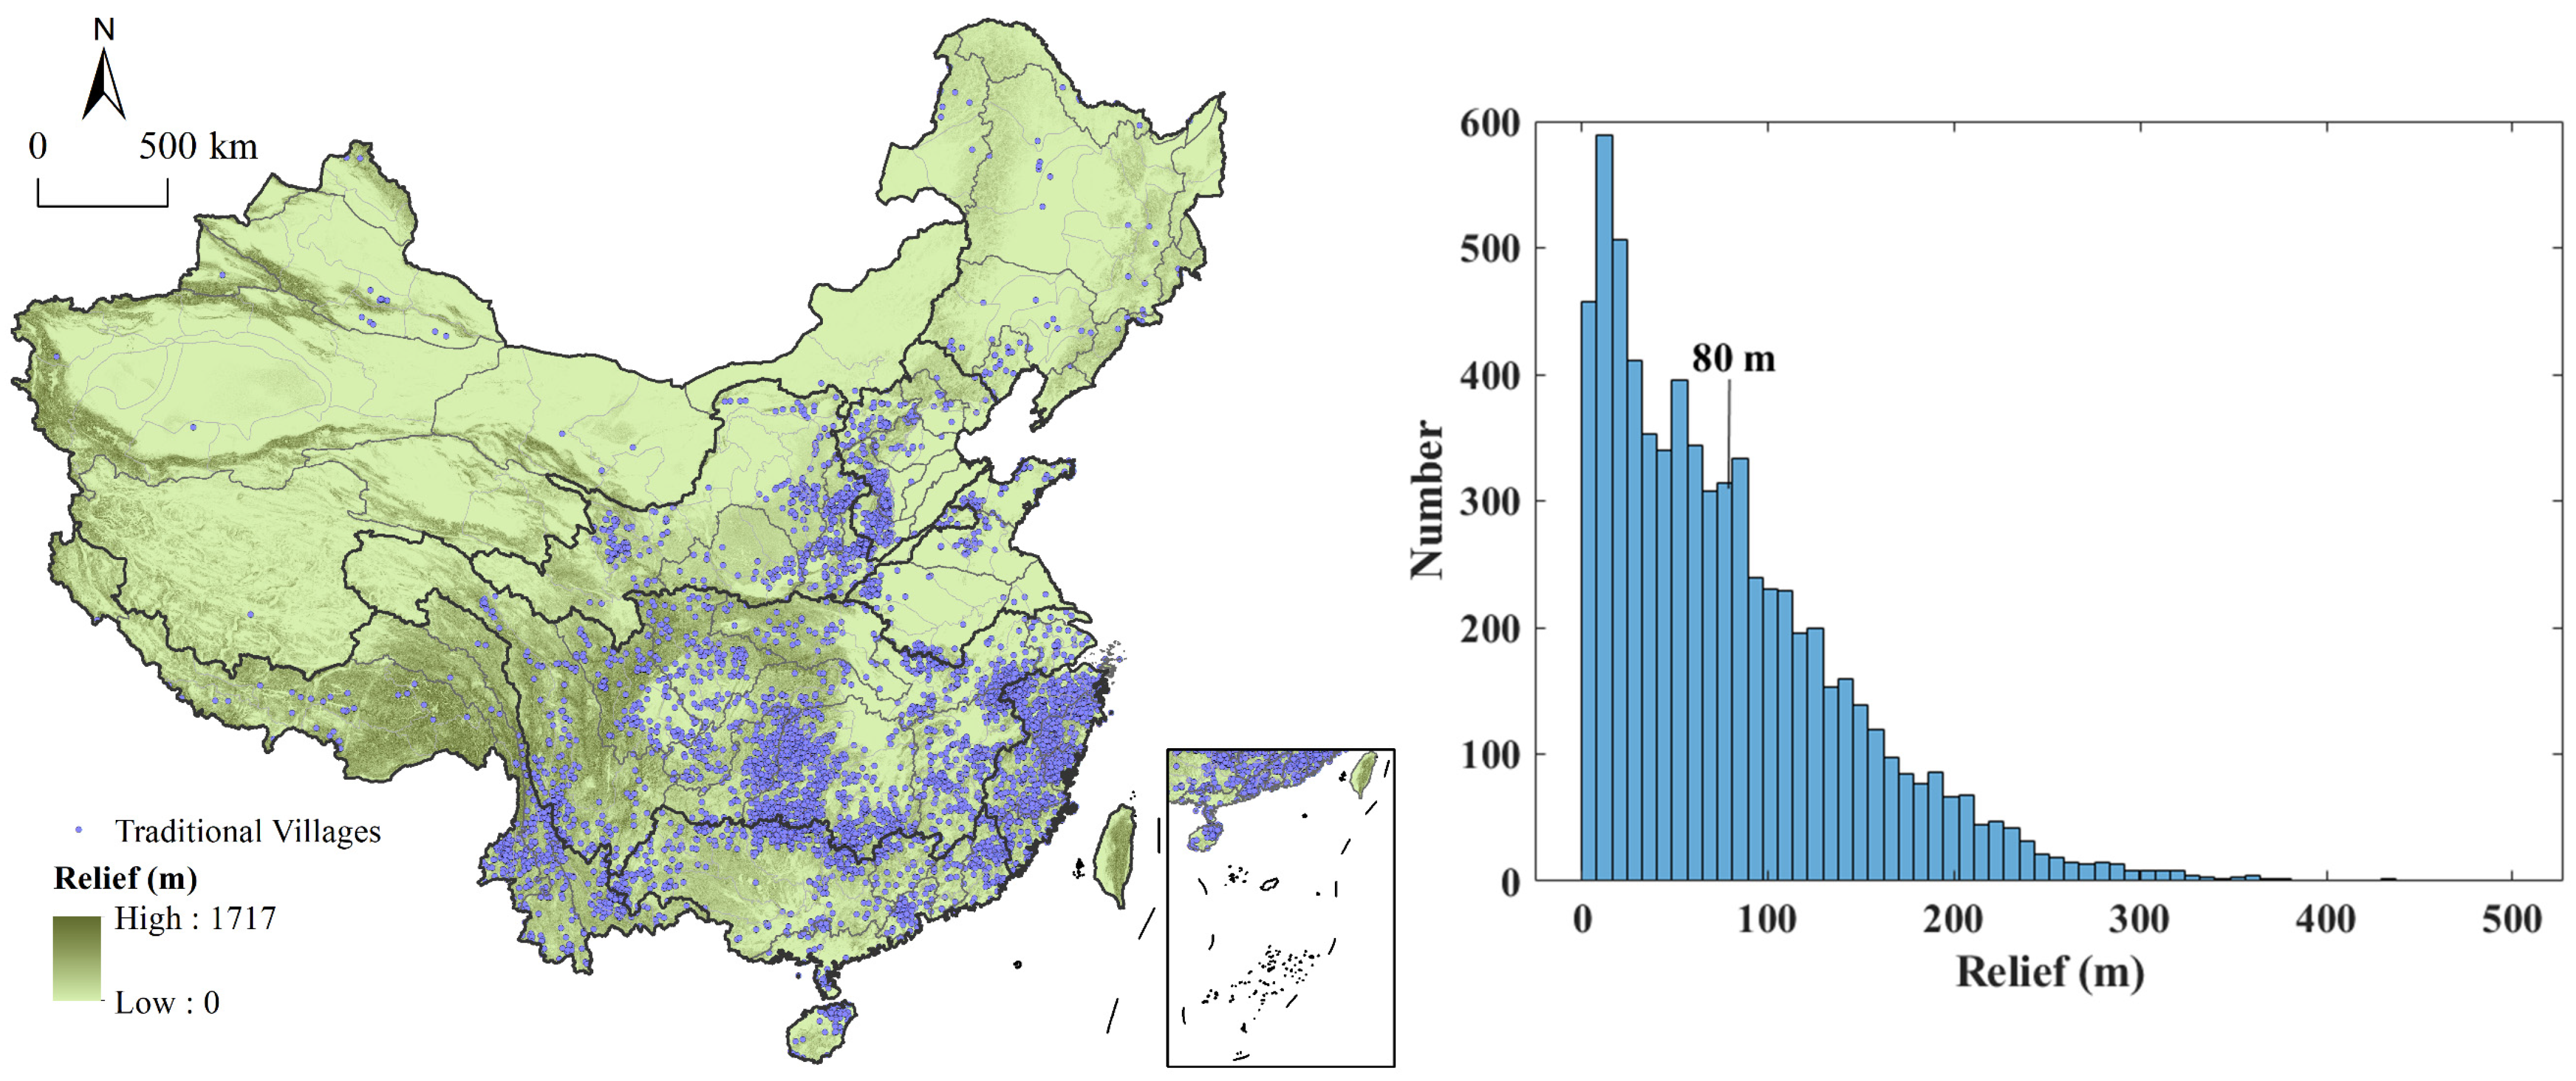
4.4.4. Topography
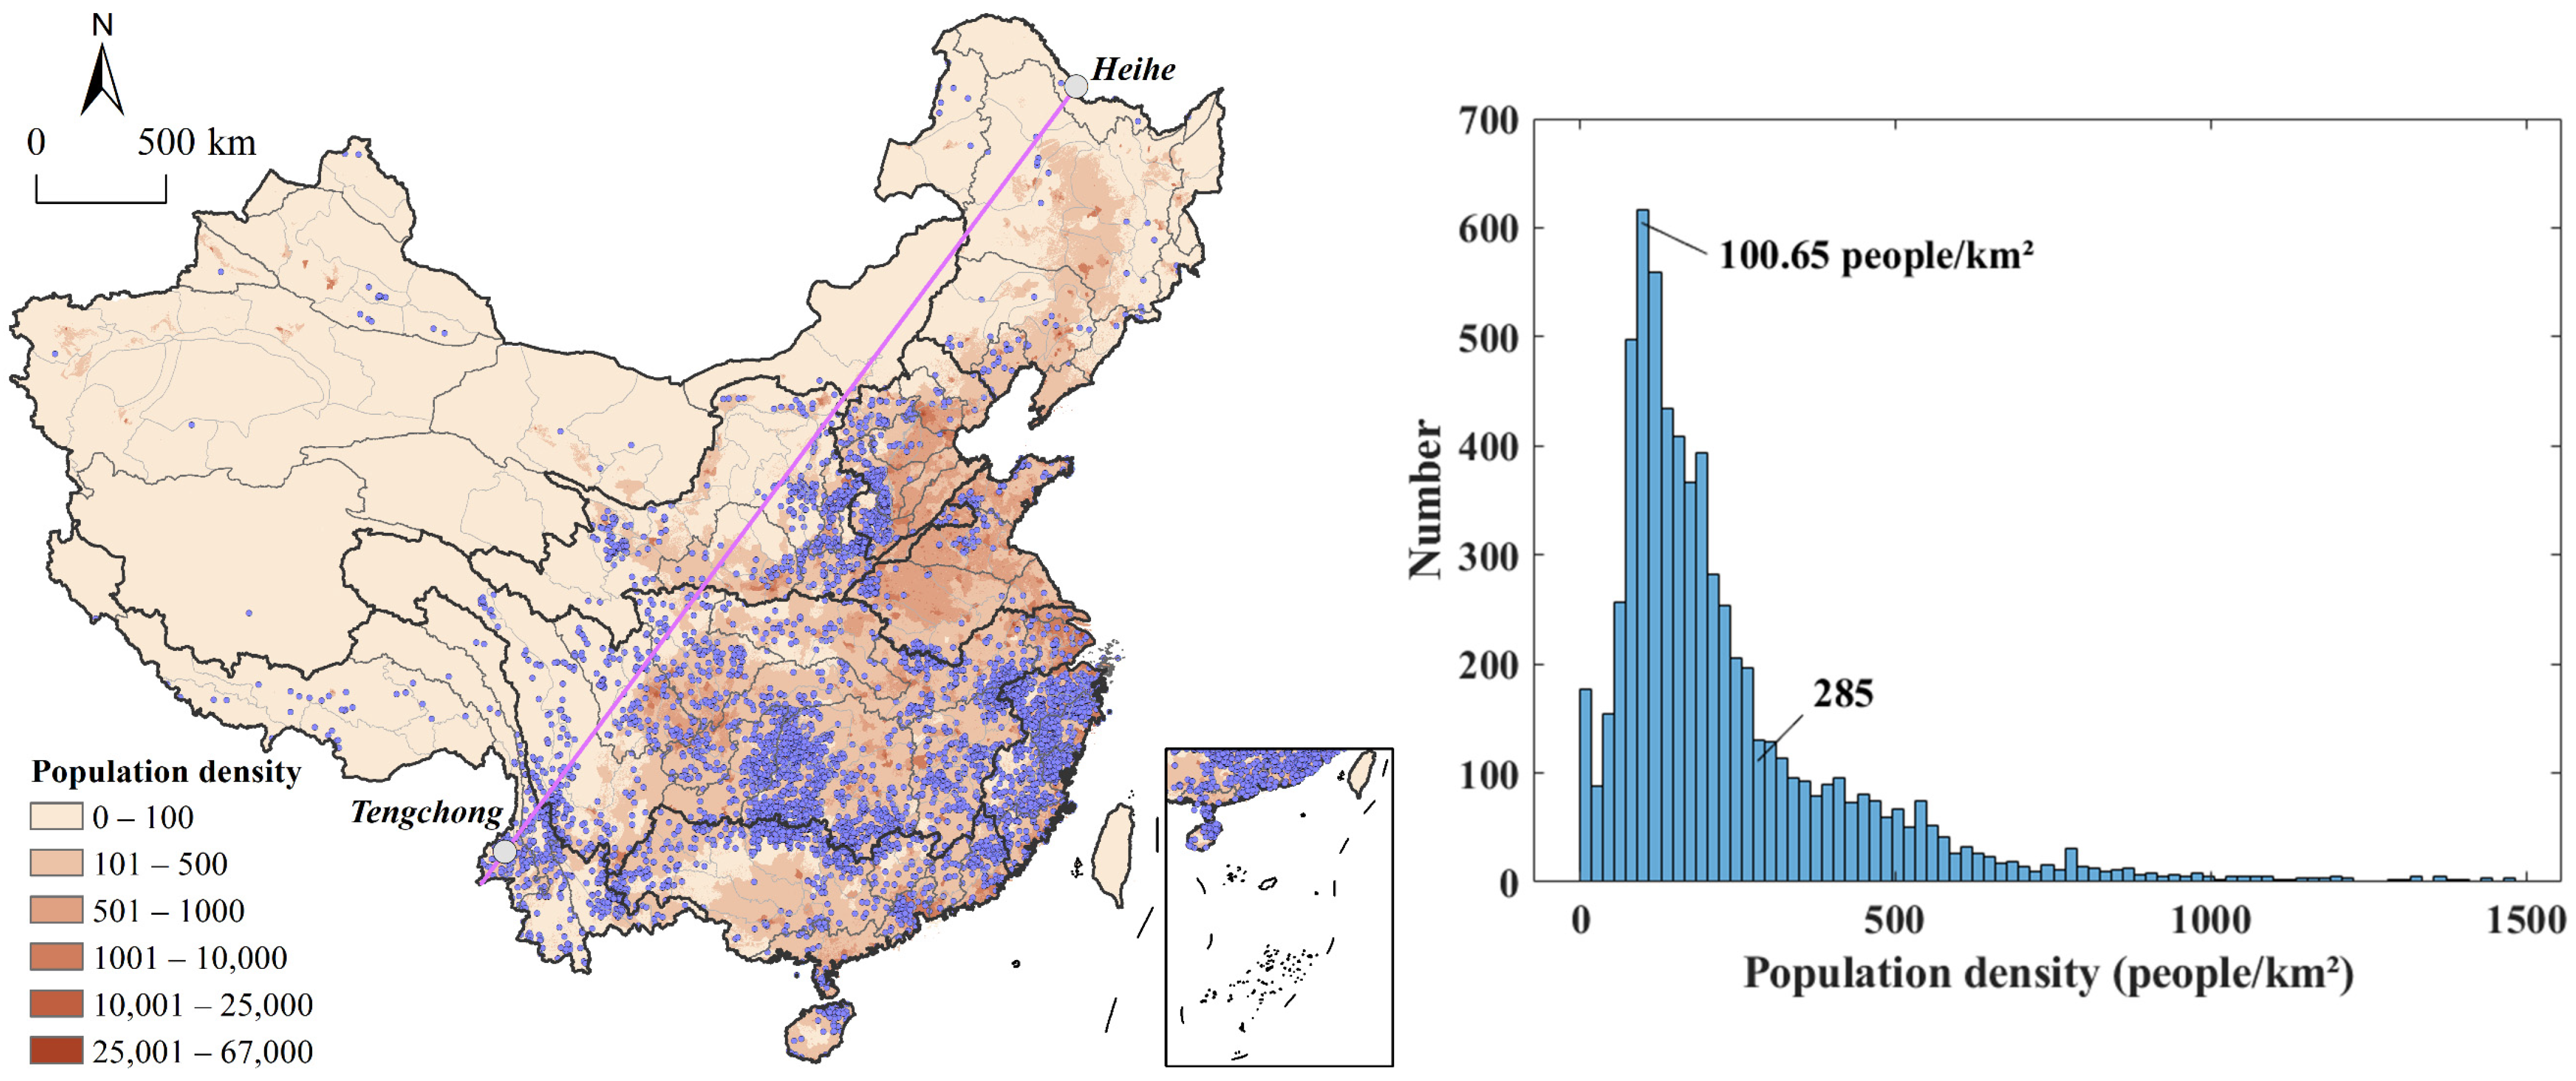
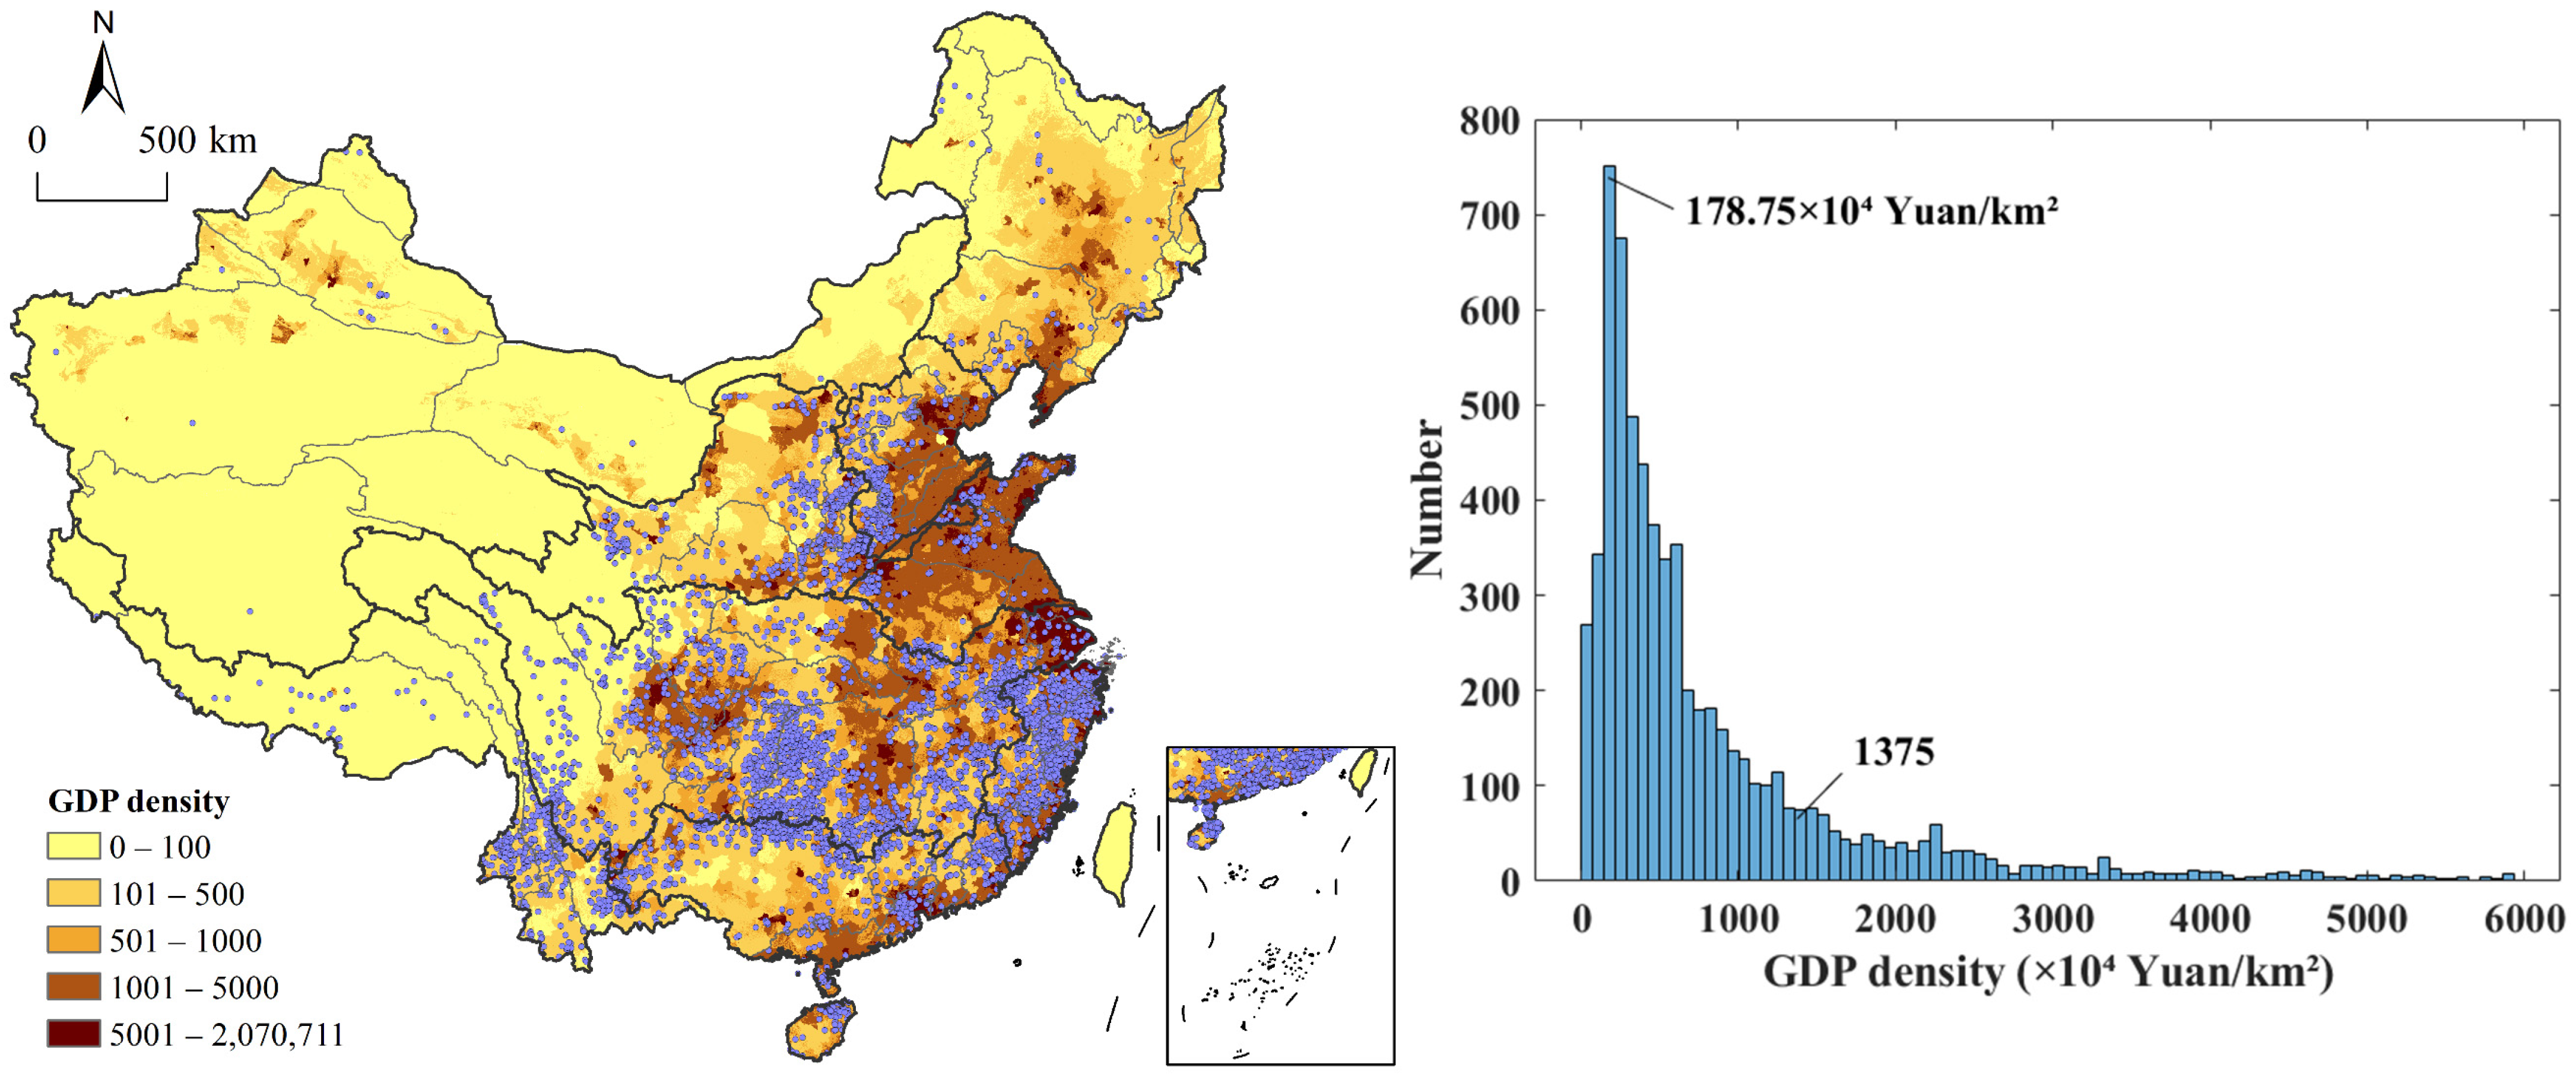
4.4.5. Population and Economy
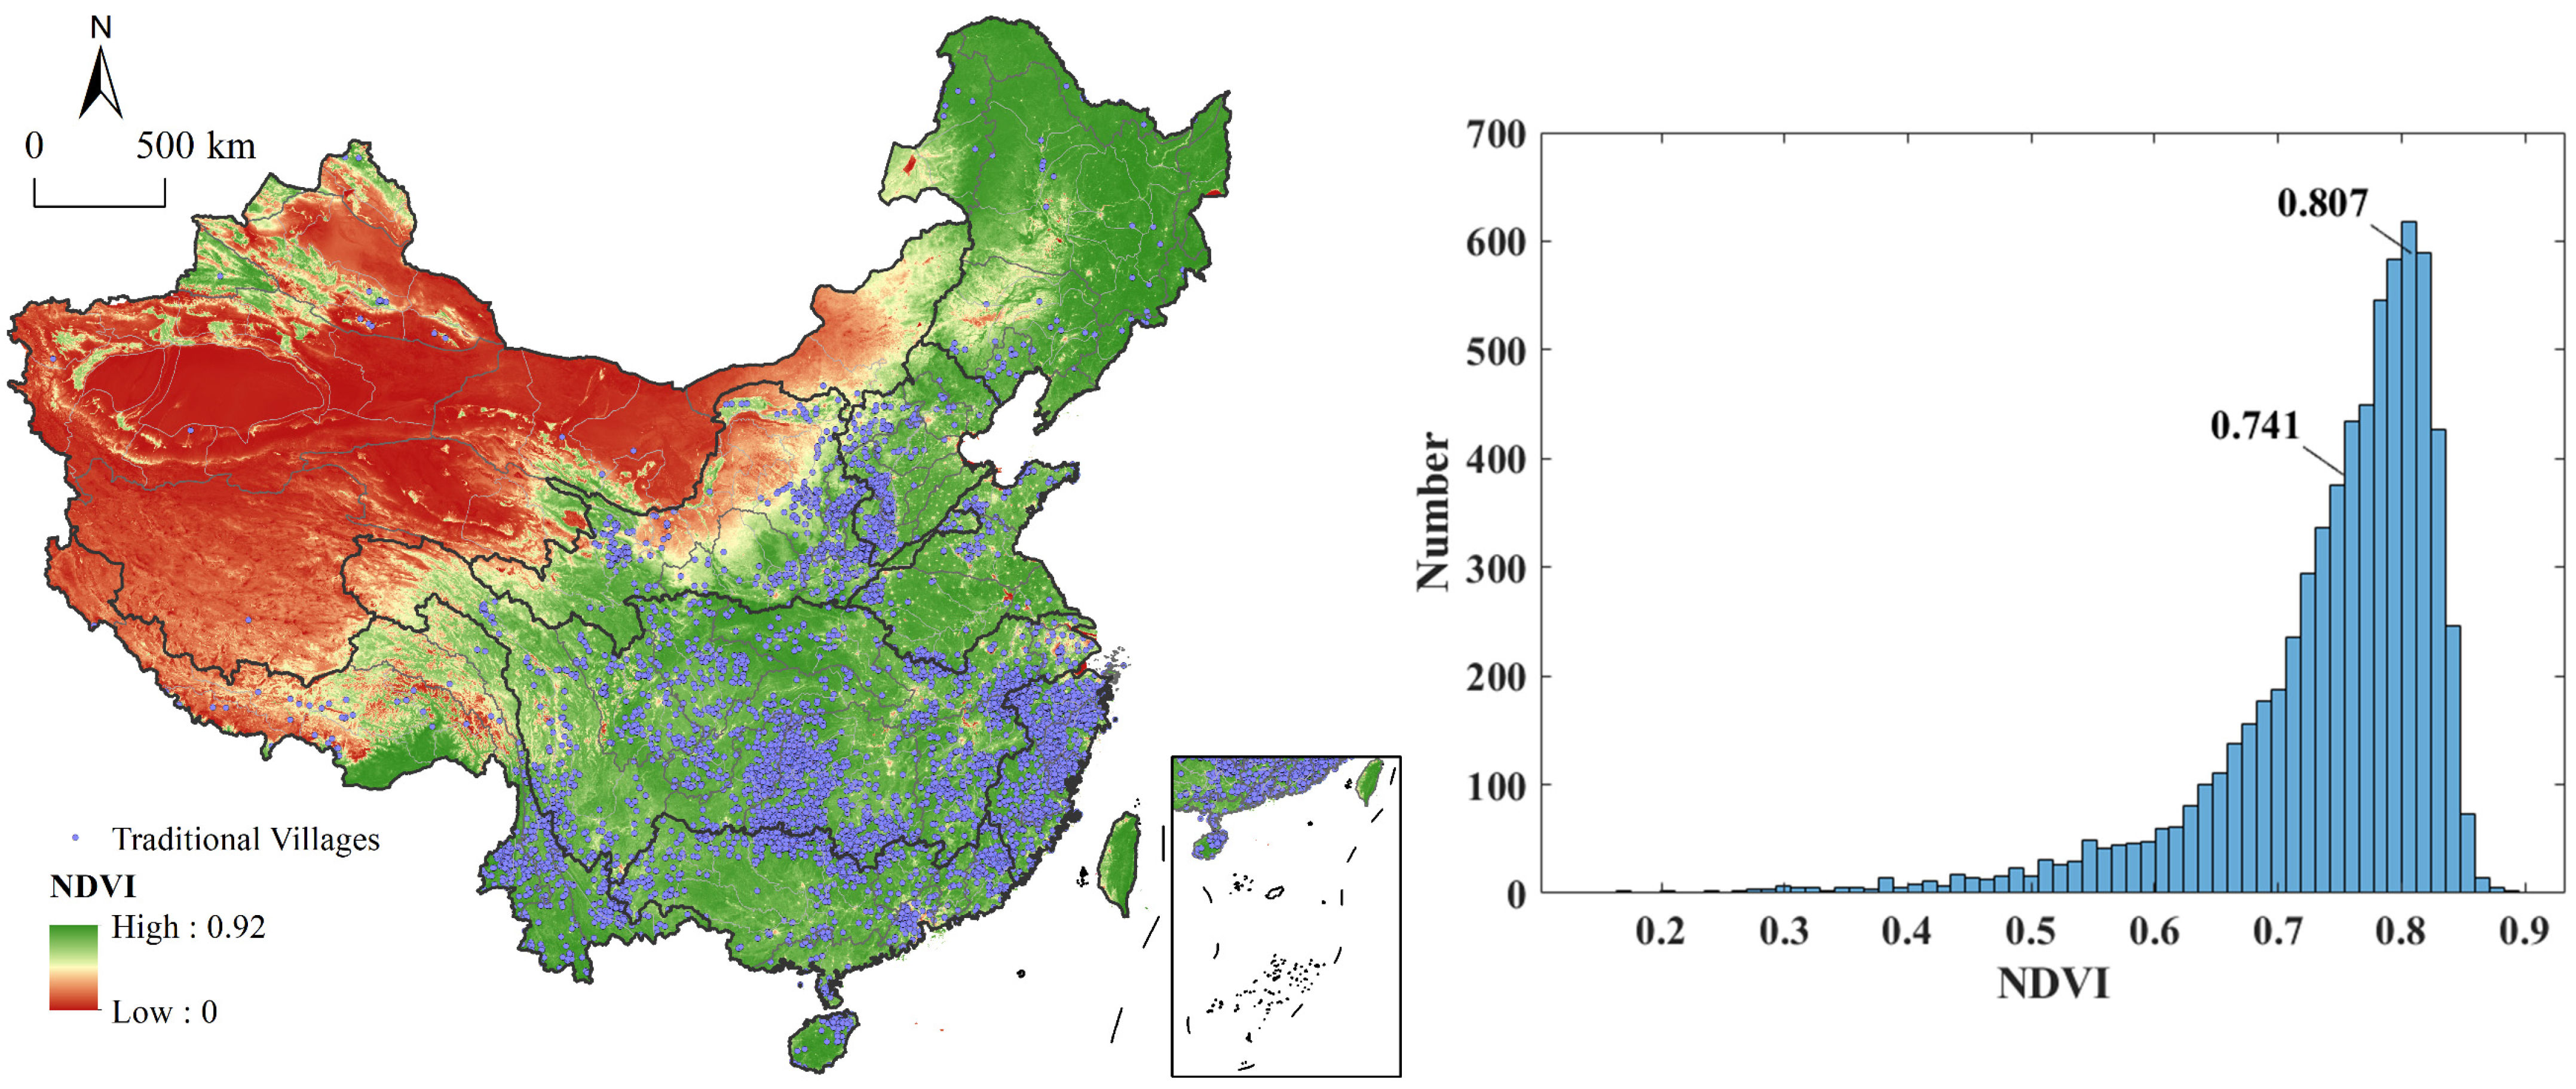
4.4.6. Vegetation Coverage (NDVI)
5. Discussion
5.1. Characteristics of Traditional Village Distributions in China
5.2. Relationship between Traditional Villages and Influencing Factors
5.3. Watershed Management Model
5.4. Advantages and Limitations
6. Conclusions
Author Contributions
Funding
Data Availability Statement
Acknowledgments
Conflicts of Interest
References
- Traditional Village Evaluation and Designation Index System (for Trial Implementation). Available online: https://www.mohurd.gov.cn/gongkai/fdzdgknr/tzgg/201208/20120831_211267.html (accessed on 15 September 2022).
- Notice on the Survey of Traditional Villages. Available online: https://www.mohurd.gov.cn/gongkai/fdzdgknr/tzgg/201204/20120423_209619.html (accessed on 15 September 2022).
- Guidelines on Strengthening the Protection and Development of Traditional Villages. Available online: https://www.mohurd.gov.cn/gongkai/fdzdgknr/tzgg/201404/20140429_217798.html (accessed on 15 September 2022).
- Wu, C.; Chen, M.; Zhou, L.; Liang, X.; Wang, W. Identifying the Spatiotemporal Patterns of Traditional Villages in China: A Multiscale Perspective. Land 2020, 9, 449. [Google Scholar] [CrossRef]
- Zhang, L.; Lu, P.; Lau, R.; Yan, L.; Li, X.; Yang, R.; Leung, H.H.; Chen, P.; Wang, X. Unique traditional villages on the Loess Plateau of China: Historic evolution and challenges to sustainable development of silo-caves. Herit. Sci. 2021, 9, 118. [Google Scholar] [CrossRef]
- Gao, J.; Wu, B. Revitalizing traditional villages through rural tourism: A case study of Yuanjia Village, Shaanxi Province, China. Tour. Manag. 2017, 63, 223–233. [Google Scholar] [CrossRef]
- Bian, J.; Chen, W.; Zeng, J. Spatial Distribution Characteristics and Influencing Factors of Traditional Villages in China. Int. J. Environ. Res. Public Health 2022, 19, 4627. [Google Scholar] [CrossRef]
- Gao, C.; Wu, Y.; Bian, C.; Gao, X. Spatial characteristics and influencing factors of Chinese traditional villages in eight provinces the Yellow River flows through. River Res. Appl. 2021, 1–15. [Google Scholar] [CrossRef]
- Chen, M.; Zhang, H.; Liu, W.; Zhang, W. The Global Pattern of Urbanization and Economic Growth: Evidence from the Last Three Decades. PLoS ONE 2014, 9, e103799. [Google Scholar] [CrossRef]
- Ahmad, M.; Zhao, Z.-Y. Empirics on linkages among industrialization, urbanization, energy consumption, CO2 emissions and economic growth: A heterogeneous panel study of China. Environ. Sci. Pollut. Res. 2018, 25, 30617–30632. [Google Scholar] [CrossRef]
- Liu, C.; Xu, M. Characteristics and Influencing Factors on the Hollowing of Traditional Villages—Taking 2645 Villages from the Chinese Traditional Village Catalogue (Batch 5) as an Example. Int. J. Environ. Res. Public Health 2021, 18, 12759. [Google Scholar] [CrossRef]
- Liu, S.; Bai, M.; Yao, M.; Huang, K. Identifying the natural and anthropogenic factors influencing the spatial disparity of population hollowing in traditional villages within a prefecture-level city. PLoS ONE 2021, 16, e0249448. [Google Scholar] [CrossRef]
- Qin, R.; Leung, H. Becoming a Traditional Village: Heritage Protection and Livelihood Transformation of a Chinese Village. Sustainability 2021, 13, 2331. [Google Scholar] [CrossRef]
- Chen, X.; Xie, W.; Li, H. The spatial evolution process, characteristics and driving factors of traditional villages from the perspective of the cultural ecosystem: A case study of Chengkan Village. Habitat Int. 2020, 104, 102250. [Google Scholar] [CrossRef]
- Xu, J.; Yang, M.; Hou, C.; Lu, Z.; Liu, D. Distribution of rural tourism development in geographical space: A case study of 323 traditional villages in Shaanxi, China. Eur. J. Remote Sens. 2020, 54, 318–333. [Google Scholar] [CrossRef]
- Fu, J.; Zhou, J.; Deng, Y. Heritage values of ancient vernacular residences in traditional villages in Western Hunan, China: Spatial patterns and influencing factors. Build. Environ. 2020, 188, 107473. [Google Scholar] [CrossRef]
- Xu, Q.; Wang, J. Recognition of Values of Traditional Villages in Southwest China for Sustainable Development: A Case Study of Liufang Village. Sustainability 2021, 13, 7569. [Google Scholar] [CrossRef]
- Liu, S.; Ge, J.; Bai, M.; Yao, M.; He, L.; Chen, M. Toward classification-based sustainable revitalization: Assessing the vitality of traditional villages. Land Use Policy 2022, 116, 106060. [Google Scholar] [CrossRef]
- Liu, S.; Ge, J.; Li, W.; Bai, M. Historic Environmental Vulnerability Evaluation of Traditional Villages under Geological Hazards and Influencing Factors of Adaptive Capacity: A District-Level Analysis of Lishui, China. Sustainability 2020, 12, 2223. [Google Scholar] [CrossRef]
- Wang, D.; Zhu, Y.; Zhao, M.; Lv, Q. Multi-dimensional hollowing characteristics of traditional villages and its influence mechanism based on the micro-scale: A case study of Dongcun Village in Suzhou, China. Land Use Policy 2020, 101, 105146. [Google Scholar] [CrossRef]
- Liu, S.; Bai, M.; Yao, M. Integrating Ecosystem Function and Structure to Assess Landscape Ecological Risk in Traditional Village Clustering Areas. Sustainability 2021, 13, 4860. [Google Scholar] [CrossRef]
- Cai, Z.; Li, J.; Wang, J. The Protection and Landscape Characteristics of Traditional Villages in Coastal Areas of SW China. J. Coast. Res. 2020, 111, 331–335. [Google Scholar] [CrossRef]
- Wang, L.; Wen, C. Traditional Villages in Forest Areas: Exploring the Spatiotemporal Dynamics of Land Use and Landscape Patterns in Enshi Prefecture, China. Forests 2021, 12, 65. [Google Scholar] [CrossRef]
- Zheng, X.; Wu, J.; Deng, H. Spatial Distribution and Land Use of Traditional Villages in Southwest China. Sustainability 2021, 13, 6326. [Google Scholar] [CrossRef]
- Kong, L.; Xu, X.; Wang, W.; Wu, J.; Zhang, M. Comprehensive Evaluation and Quantitative Research on the Living Protection of Traditional Villages from the Perspective of “Production–Living–Ecology”. Land 2021, 10, 570. [Google Scholar] [CrossRef]
- Dai, D.; Fu, J.; Zhao, C. A Study on the Protection Strategy of Traditional Villages from the Perspective of Cultural Ecology—Take Wuhe Village, Julong Town, Yanting County, Mianyang City as an Example. Open J. Soc. Sci. 2019, 7, 88–98. [Google Scholar] [CrossRef]
- Zhou, Z.; Zheng, X. A Cultural Route Perspective on Rural Revitalization of Traditional Villages: A Case Study from Chishui, China. Sustainability 2022, 14, 2468. [Google Scholar] [CrossRef]
- Wang, H.-F.; Chiou, S.-C. Study on the Sustainable Development of Human Settlement Space Environment in Traditional Villages. Sustainability 2019, 11, 4186. [Google Scholar] [CrossRef]
- Jin, J.; Yan, H. Analyzing the Causes of Spatial Differentiation of the Traditional Villages in Gansu Province, Western China. J. Geosci. Environ. Prot. 2020, 8, 12–25. [Google Scholar] [CrossRef]
- Li, B.; Yin, S.; Liu, P.; Dou, Y. Spatial Distribution of Traditional Villages and Influence Factors in Hunan Province. J. Landsc. Res. 2016, 8, 63–67. [Google Scholar] [CrossRef]
- Tang, C.; He, S.; Liu, W.; Zhang, W.; Zhang, M. Environmental Study on Differentiation and Influencing Factors of Traditional Village Lands based on GIS. Ekoloji 2019, 107, 4685–4696. [Google Scholar]
- Zhang, Y.; Min, T.; Bai, B.; Yang, Q. Spatial Distribution Characteristics and Influencing Factors of Traditional Villages in Guizhou Province. J. Landsc. Res. 2022, 14, 37–46. [Google Scholar] [CrossRef]
- Ma, H.; Tong, Y. Spatial differentiation of traditional villages using ArcGIS and GeoDa: A case study of Southwest China. Ecol. Inform. 2022, 68, 101416. [Google Scholar] [CrossRef]
- Jones, E.E. An analysis of factors influencing sixteenth and seventeenth century Haudenosaunee (Iroquois) settlement locations. J. Anthr. Archaeol. 2010, 29, 1–14. [Google Scholar] [CrossRef]
- Yang, R.; Xu, Q.; Long, H. Spatial distribution characteristics and optimized reconstruction analysis of China’s rural settlements during the process of rapid urbanization. J. Rural Stud. 2016, 47, 413–424. [Google Scholar] [CrossRef]
- Hu, X.; Li, H.; Zhang, X.; Chen, X.; Yuan, Y. Multi-dimensionality and the totality of rural spatial restructuring from the perspective of the rural space system: A case study of traditional villages in the ancient Huizhou region, China. Habitat Int. 2019, 94, 102062. [Google Scholar] [CrossRef]
- Chen, J.; Lin, W.; Zhang, Y.; Dai, Y.; Chen, B. Village Fengshui Forests as Forms of Cultural and Ecological Heritage: Interpretations and Conservation Policy Implications from Southern China. Forests 2020, 11, 1286. [Google Scholar] [CrossRef]
- Jin, Z.; Juan, Y.-K. Is Fengshui a science or superstition? A new approach combining the physiological and psychological measurement of indoor environments. Build. Environ. 2021, 201, 107992. [Google Scholar] [CrossRef]
- Menárguez, A.B.B.; Holgado, P.M. Assessing the Landscape Value of Public Works: Validation of the Methods in the Lowlands of the Middle Section of the Tajo River, Spain. Landsc. Res. 2012, 39, 305–323. [Google Scholar] [CrossRef]
- Macklin, M.G.; Lewin, J. The rivers of civilization. Quat. Sci. Rev. 2015, 114, 228–244. [Google Scholar] [CrossRef]
- Zhu, L.; Li, Z.; Su, H.; Wang, X. Temporal and spatial distribution of ancient sites in Shaanxi Province using geographic information systems (GIS). Herit. Sci. 2021, 9, 121. [Google Scholar] [CrossRef]
- Zhang, H.; Duan, Y.; Han, Z. Research on Spatial Patterns and Sustainable Development of Rural Tourism Destinations in the Yellow River Basin of China. Land 2021, 10, 849. [Google Scholar] [CrossRef]
- Li, W.; Jiao, J.; Qi, J.; Ma, Y. The spatial and temporal differentiation characteristics of cultural heritage in the Yellow River Basin. PLoS ONE 2022, 17, e0268921. [Google Scholar] [CrossRef]
- Gong, G.; Wei, Z.; Zhang, F.; Li, Y.; An, Y.; Yang, Q.; Wu, J.; Wang, L.; Yu, P. Analysis of the spatial distribution and influencing factors of China national forest villages. Environ. Monit. Assess. 2022, 194, 428. [Google Scholar] [CrossRef] [PubMed]
- Xu, Y.; Yang, X.; Feng, X.; Yan, P.; Shen, Y.; Li, X. Spatial distribution and site selection adaptation mechanism of traditional villages along the Yellow River in Shanxi and Shaanxi. River Res. Appl. 2022, 1–13. [Google Scholar] [CrossRef]
- Omernik, J.M.; Griffith, G.E.; Hughes, R.M.; Glover, J.B.; Weber, M.H. How Misapplication of the Hydrologic Unit Framework Diminishes the Meaning of Watersheds. Environ. Manag. 2017, 60, 1–11. [Google Scholar] [CrossRef] [PubMed]
- Cheng, G.; Li, X. Integrated research methods in watershed science. Sci. China Earth Sci. 2015, 58, 1159–1168. [Google Scholar] [CrossRef]
- Wang, F.; Gao, C. Settlement–river relationship and locality of river-related built environment. Indoor Built Environ. 2020, 29, 1331–1335. [Google Scholar] [CrossRef]
- Wang, F.; Prominski, M. Landscapes with locality in urban or rural areas. Indoor Built Environ. 2020, 29, 1047–1052. [Google Scholar] [CrossRef]
- Zhou, T.; Hu, W.; Yu, S. Characterizing interactions of socioeconomic development and environmental impact at a watershed scale. Environ. Sci. Pollut. Res. 2019, 26, 5680–5692. [Google Scholar] [CrossRef]
- Yang, J.; Xie, B.; Tao, W.; Zhang, D. Ecosystem Services Assessment, Trade-Off, and Bundles in the Yellow River Basin, China. Diversity 2021, 13, 308. [Google Scholar] [CrossRef]
- Deng, F.; Lin, T.; Zhao, Y.; Yuan, Y. Zoning and Analysis of Control Units for Water Pollution Control in the Yangtze River Basin, China. Sustainability 2017, 9, 1374. [Google Scholar] [CrossRef]
- Wang, X.; Zhang, J.; Cenci, J.; Becue, V. Spatial Distribution Characteristics and Influencing Factors of the World Architectural Heritage. Heritage 2021, 4, 2942–2959. [Google Scholar] [CrossRef]
- Xu, X.; Genovese, P.V.; Zhao, Y.; Liu, Y.; Woldesemayat, E.M.; Zoure, A.N. Geographical Distribution Characteristics of Ethnic-Minority Villages in Fujian and Their Relationship with Topographic Factors. Sustainability 2022, 14, 7727. [Google Scholar] [CrossRef]
- Mansour, S. Spatial analysis of public health facilities in Riyadh Governorate, Saudi Arabia: A GIS-based study to assess geographic variations of service provision and accessibility. Geo-Spat. Inf. Sci. 2016, 19, 26–38. [Google Scholar] [CrossRef]
- Sheather, S.J.; Jones, M.C. A Reliable Data-Based Bandwidth Selection Method for Kernel Density Estimation. J. R. Stat. Soc. Ser. B Stat. Methodol. 1991, 53, 683–690. [Google Scholar] [CrossRef]
- Cai, X.; Wu, Z.; Cheng, J. Using kernel density estimation to assess the spatial pattern of road density and its impact on landscape fragmentation. Int. J. Geogr. Inf. Sci. 2013, 27, 222–230. [Google Scholar] [CrossRef]
- Zhang, S.-R.; Wang, Y.-J.; Ju, H.-R.; Zhang, T.-Y.; Li, D.-C.; Fang, L.; Wang, Y. Spatial patterns of interprovincial mountain geographical names in China and implications for regional governance. J. Mt. Sci. 2018, 15, 2517–2530. [Google Scholar] [CrossRef]
- Sokal, R.R.; Oden, N.L. Spatial autocorrelation in biology: 1. Methodology. Biol. J. Linn. Soc. 1978, 10, 199–228. [Google Scholar] [CrossRef]
- Wang, J.-F.; Li, X.-H.; Christakos, G.; Liao, Y.-L.; Zhang, T.; Gu, X.; Zheng, X.-Y. Geographical detectors-based health risk assessment and its application in the neural tube defects study of the Heshun region, China. Int. J. Geogr. Inf. Sci. 2010, 24, 107–127. [Google Scholar] [CrossRef]
- Wang, J.-F.; Zhang, T.-L.; Fu, B.-J. A measure of spatial stratified heterogeneity. Ecol. Indic. 2016, 67, 250–256. [Google Scholar] [CrossRef]
- Li, X.; Sun, W.; Zhang, D.; Huang, J.; Li, D.; Ding, N.; Zhu, J.; Xie, Y.; Wang, X. Evaluating water provision service at the sub-watershed scale by combining supply, demand, and spatial flow. Ecol. Indic. 2021, 127, 107745. [Google Scholar] [CrossRef]
- Ding, Y.; Shi, B.; Su, G.; Li, Q.; Meng, J.; Jiang, Y.; Qin, Y.; Dai, L.; Song, S. Assessing Suitability of Human Settlements in High-Altitude Area Using a Comprehensive Index Method: A Case Study of Tibet, China. Sustainability 2021, 13, 1485. [Google Scholar] [CrossRef]
- Bertuzzo, E.; Maritan, A.; Gatto, M.; Rodriguez-Iturbe, I.; Rinaldo, A. River networks and ecological corridors: Reactive transport on fractals, migration fronts, hydrochory. Water Resour. Res. 2007, 43, W04419. [Google Scholar] [CrossRef]
- Fang, Y.; Ceola, S.; Paik, K.; McGrath, G.; Rao, P.S.C.; Montanari, A.; Jawitz, J.W. Globally Universal Fractal Pattern of Human Settlements in River Networks. Earths Futur. 2018, 6, 1134–1145. [Google Scholar] [CrossRef]
- Zhang, J.; Zhu, W.; Zhu, L.; Cui, Y.; He, S.; Ren, H. Topographical relief characteristics and its impact on population and economy: A case study of the mountainous area in western Henan, China. J. Geogr. Sci. 2019, 29, 598–612. [Google Scholar] [CrossRef]
- Chen, M.; Gong, Y.; Li, Y.; Lu, D.; Zhang, H. Population distribution and urbanization on both sides of the Hu Huanyong Line: Answering the Premier’s question. J. Geogr. Sci. 2016, 26, 1593–1610. [Google Scholar] [CrossRef]
- Yue, W.; Gao, J.; Yang, X. Estimation of Gross Domestic Product Using Multi-Sensor Remote Sensing Data: A Case Study in Zhejiang Province, East China. Remote Sens. 2014, 6, 7260–7275. [Google Scholar] [CrossRef]
- Jiang, L.; Liu, Y.; Wu, S.; Yang, C. Analyzing ecological environment change and associated driving factors in China based on NDVI time series data. Ecol. Indic. 2021, 129, 107933. [Google Scholar] [CrossRef]
- Meng, X.; Gao, X.; Li, S.; Lei, J. Spatial and Temporal Characteristics of Vegetation NDVI Changes and the Driving Forces in Mongolia during 1982–2015. Remote Sens. 2020, 12, 603. [Google Scholar] [CrossRef]
- Hou, W.; Gao, J.; Wu, S.; Dai, E. Interannual Variations in Growing-Season NDVI and Its Correlation with Climate Variables in the Southwestern Karst Region of China. Remote Sens. 2015, 7, 11105–11124. [Google Scholar] [CrossRef]
- Jin, H.; Chen, X.; Wang, Y.; Zhong, R.; Zhao, T.; Liu, Z.; Tu, X. Spatio-temporal distribution of NDVI and its influencing factors in China. J. Hydrol. 2021, 603, 127129. [Google Scholar] [CrossRef]
- Chen, M.; Ye, C.; Lu, D.; Sui, Y.; Guo, S. Cognition and construction of the theoretical connotations of new urbanization with Chinese characteristics. J. Geogr. Sci. 2019, 29, 1681–1698. [Google Scholar] [CrossRef]
- Yang, Y.; Fekete, A.; Tian, G.; Li, H.; Ning, D.; He, R. Comprehensive zoning scheme for vernacular landscapes of China. Acta Hortic. Regiotect. 2022, 25, 8–20. [Google Scholar] [CrossRef]
- Jiang, T.; Su, B.; Huang, J.; Zhai, J.; Xia, J.; Tao, H.; Wang, Y.; Sun, H.; Luo, Y.; Zhang, L.; et al. Each 0.5 °C of Warming Increases Annual Flood Losses in China by More than US$60 Billion. Bull. Am. Meteorol. Soc. 2020, 101, E1464–E1474. [Google Scholar] [CrossRef]
- Zhang, X.; Brandt, M.; Tong, X.; Ciais, P.; Yue, Y.; Xiao, X.; Zhang, W.; Wang, K.; Fensholt, R. A large but transient carbon sink from urbanization and rural depopulation in China. Nat. Sustain. 2022, 5, 321–328. [Google Scholar] [CrossRef]
- Peng, Y.; Wang, Q. Spatial distribution and influencing factors of settlements in the farming–pastoral ecotone of Inner Mongolia, China. Ecosyst. Health Sustain. 2020, 6, 1771213. [Google Scholar] [CrossRef]
- Li, G.; Jiang, G.; Jiang, C.; Bai, J. Differentiation of spatial morphology of rural settlements from an ethnic cultural perspective on the Northeast Tibetan Plateau, China. Habitat Int. 2018, 79, 1–9. [Google Scholar] [CrossRef]


| Influencing Factors | Descriptions | Sources |
|---|---|---|
| Road | It includes China’s primary, secondary, tertiary, and fourth roads | The National Earth System Science Data Center (http://www.geodata.cn, accessed on 5 June 2022) |
| River | It includes first-class rivers and major rivers | Geographic Data Sharing Infrastructure, College of Urban and Environmental Science, Peking University (http://geodata.pku.edu.cn, accessed on 5 June 2022) |
| Elevation | Spatial resolution of 250 m | The Resource and Environmental Science Data Center of the Chinese Academy of Sciences (http://www.resdc.cn, accessed on 5 June 2022) |
| Topography relief | ||
| Population density | The data with a spatial resolution of 1 km in 2015 | |
| Gross Domestic Product (GDP) density | ||
| Annual precipitation | 2006–2015 dataset with a spatial resolution of 1 km | |
| Annual average temperature | ||
| Normalized Difference Vegetation Index (NDVI) |
| Region | Number | Proportion (%) | Imbalance Index |
|---|---|---|---|
| Northwest River watershed | 26 | 0.38 | 0.80 |
| Northeast River watershed | 72 | 1.06 | 0.68 |
| Huaihe River watershed | 211 | 3.09 | 0.11 |
| Haihe River watershed | 472 | 6.92 | 0.82 |
| Southwest River watershed | 525 | 7.70 | 0.64 |
| Yellow River watershed | 681 | 9.99 | 0.73 |
| Pearl River watershed | 1020 | 14.96 | 0.57 |
| Southeast River watershed | 1309 | 19.20 | 0.48 |
| Yangtze River watershed | 2503 | 36.71 | 0.57 |
| Total | 6819 | 100.00 | 0.75 |
| Region | Index Value | Z-Score | Value | Pattern |
|---|---|---|---|---|
| Northwest River watershed | 0.82 | −1.8034 | 0.0071 | Agglomeration |
| Northeast River watershed | 0.63 | −6.0000 | 0.0000 | Agglomeration |
| Huaihe River watershed | 0.56 | −12.3186 | 0.0000 | Agglomeration |
| Haihe River watershed | 0.51 | −20.5218 | 0.0000 | Agglomeration |
| Southwest River watershed | 0.53 | −20.5334 | 0.0000 | Agglomeration |
| Yellow River watershed | 0.48 | −26.0896 | 0.0000 | Agglomeration |
| Pearl River watershed | 0.69 | −18.8834 | 0.0000 | Agglomeration |
| Southeast River watershed | 0.72 | −19.1802 | 0.0000 | Agglomeration |
| Yangtze River watershed | 0.65 | −33.8512 | 0.0000 | Agglomeration |
| Total | 0.46 | −84.5674 | 0.0000 | Agglomeration |
| Influencing Factors | -Statistic | -Value | Influencing Factors | -Statistic | -Value |
|---|---|---|---|---|---|
| Annual precipitation | 0.2606 | 0.0000 | Population density | 0.1880 | 0.0000 |
| Annual average temperature | 0.1950 | 0.0000 | GDP density | 0.1250 | 0.0000 |
| Elevation | 0.1787 | 0.0000 | Road density | 0.1621 | 0.0000 |
| Topography relief | 0.1315 | 0.0000 | River density | 0.1929 | 0.0000 |
| NDVI | 0.1533 | 0.0000 |
Publisher’s Note: MDPI stays neutral with regard to jurisdictional claims in published maps and institutional affiliations. |
© 2022 by the authors. Licensee MDPI, Basel, Switzerland. This article is an open access article distributed under the terms and conditions of the Creative Commons Attribution (CC BY) license (https://creativecommons.org/licenses/by/4.0/).
Share and Cite
Su, H.; Wang, Y.; Zhang, Z.; Dong, W. Characteristics and Influencing Factors of Traditional Village Distribution in China. Land 2022, 11, 1631. https://doi.org/10.3390/land11101631
Su H, Wang Y, Zhang Z, Dong W. Characteristics and Influencing Factors of Traditional Village Distribution in China. Land. 2022; 11(10):1631. https://doi.org/10.3390/land11101631
Chicago/Turabian StyleSu, Haoran, Yaowu Wang, Zhen Zhang, and Wen Dong. 2022. "Characteristics and Influencing Factors of Traditional Village Distribution in China" Land 11, no. 10: 1631. https://doi.org/10.3390/land11101631
APA StyleSu, H., Wang, Y., Zhang, Z., & Dong, W. (2022). Characteristics and Influencing Factors of Traditional Village Distribution in China. Land, 11(10), 1631. https://doi.org/10.3390/land11101631