Article

Ecologically Intermediate and Economically Final: The Role of the Ecosystem Services Framework in Measuring Sustainability in Agri-Food Systems

by
Alessandra La Notte
Joint Research Centre of the European Commission, 21027 Ispra, Italy
Land 2022, 11(1), 84; https://doi.org/10.3390/land11010084
Submission received: 11 November 2021 / Revised: 23 December 2021 / Accepted: 28 December 2021 / Published: 6 January 2022

Abstract

:
Ecosystem services can be defined as the ecosystem’s contribution to human activities. According to recent assessments, the agricultural sector is one of the most important economic users of ecosystem services in Europe. To assess, value, and account for ecosystem services related to the agri-food system offers the possibility to measure and investigate how agricultural management practices together with changing environmental conditions can affect ecological resilience. However, the accounting of ecosystem services’ flows needs to be carefully addressed, because the overlapping of services and benefits and the overlapping of what are considered intermediate and final services could create dangerous misunderstandings about the role and importance of ecosystem services in agriculture. This paper reports on the possible accounting approaches that can be used to assess crop provision, as well as their meanings and implications from an ecological to an economic perspective. The results demonstrate that an economic accounting-based assessment of ecosystem services needs to move from an ecological holistic view to a one-by-one disaggregation of ecosystem services in order to avoid underestimates that would ultimately affect the policy perception of the role of ecosystems with respect to the agri-food systems’ resilience.

1. Introduction

Ecosystem services (ESs) can be defined as the ecosystem’s contribution to human activities, i.e., a range of services that nature provides to the socioeconomic system, in the form of material (e.g., biomass growth) and immaterial (e.g., clear air) flows. The role of ESs in agriculture is multifaceted, because agricultural systems are simultaneously providers and consumers of ecosystem services. From a first general perspective that considers all ESs, agricultural landscapes [1], agricultural systems [2], or cropland as an ecosystem type [3] can provide a variety of ESs, such as crop provision, water purification, carbon sequestration, flood control, and nature-based recreation. From a second, more specific perspective that considers only agriculture-related ESs, some specific services support agricultural production, such as pollination, soil structure and fertility, and pest regulation [4,5,6]. From a third methodological perspective, ESs can play an intermediate role, when they are provided by ecosystems (e.g., rivers and lakes) to ecosystems (e.g., cropland); or ESs can play a final role when they are provided by ecosystems (e.g., cropland) to the agricultural sector for the generation of crop yields [7].
ES classification systems have been evolving over time:
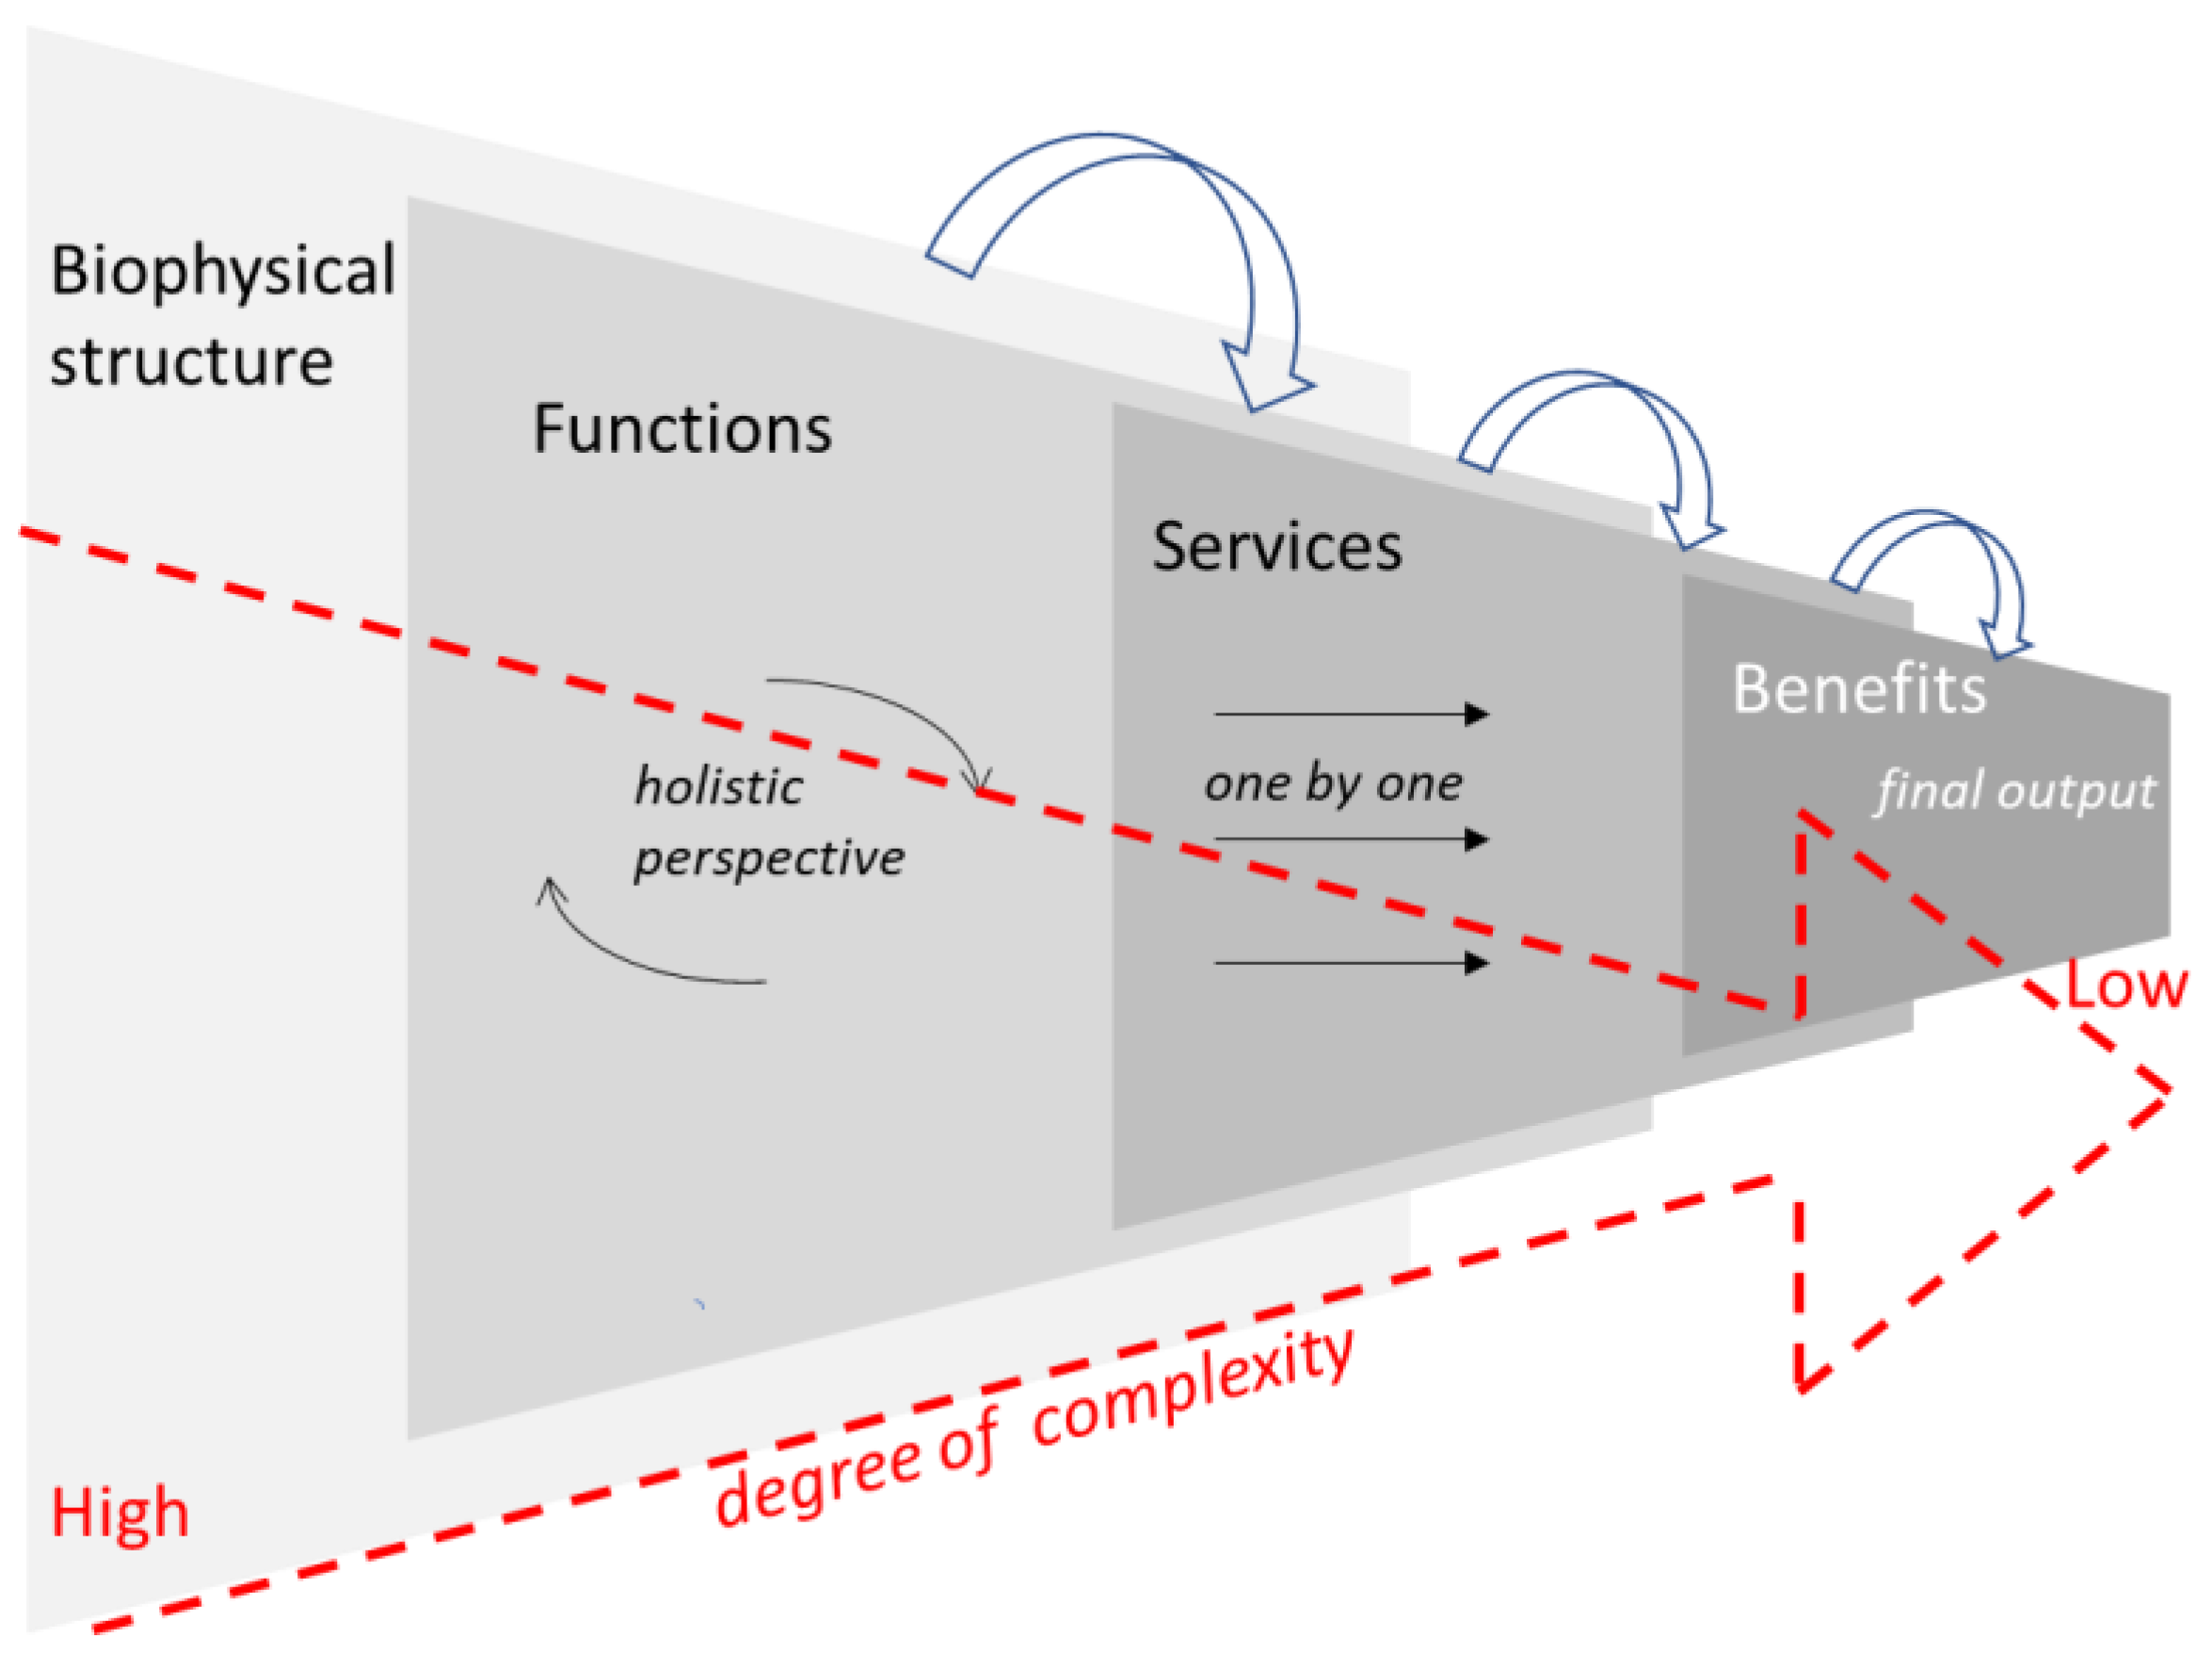
  • The Millennium Ecosystem Assessment [8] defines ESs as benefits people obtain from ecosystems. There are four groups of services (provisioning, regulating, supporting, and cultural), and one group of these services (supporting) is intermediate to the others;
  • The Economics of Ecosystems and Biodiversity [9] defines ESs as the direct and indirect contributions of ecosystems to human wellbeing. There are four groups of ESs (provisioning, regulating, habitat, and cultural) that are all considered as final with respect to use and non-use values expressed by economy and society;
  • The Common International Classification of Ecosystem Services (CICES) [10] defines ESs as the contributions that ecosystems make to human wellbeing, and as distinct from the goods and benefits that people subsequently derive from them. There are three groups of services (provision, regulation and maintenance, and cultural) set for multidisciplinary uses. Some of them can be considered intermediate or final, depending on the context.
The CICES specifies that ESs differ from “benefits”. In fact, ESs as ecosystem contributions relate to the ecological process that generates an outcome, rather than the outcome itself. For example, cubic meters of timber that are harvested (the benefit) are generated by the natural annual increase in wood biomass (the service). This difference becomes particularly critical in the case of crop provision, because not only ecological inputs but also human inputs are necessary to generate agricultural production. To mix ESs with benefits could generate remarkable misunderstanding, as explained by the following examples: some applications use gross agro biomass harvest as a proxy to account for the crop provisioning service (e.g., [11,12]). In this case, intensive monoculture systems record higher ES flow compared to organic farming or extensive agricultural systems, even if the ecological inputs (i.e., the ecosystem contribution) are larger in the latter. Vallecillo et al. [13], by applying an energy ratio [14], disentangled ecosystem contributions from anthropogenic inputs. The crop provision ES is here considered as the ecosystem contribution disentangled from human inputs.
However, to disentangle human inputs does not solve the issue concerning the role of each individual ES flow that acts as an ecological input. From an ecological perspective, the separation of ecological processes is not correct; the system works as a whole, and this holistic view expresses the strength of the system. Several mechanisms explain, for example, why the diversity of organisms is key to the delivery of multiple services. Hooper et al. [15] list functional complementarity, functional redundancy, sampling effect, and facilitation. What makes the ecological system resilient are the interactions between ecological processes, not each individual process on its own.
To move from the ecological to the economic perspective may imply changing the approach to address ecosystems and their services. There is a linkage between ecosystems and humans. Figure 1 presents the cascade model initially proposed by Potschin and Haines-Young [16] to explain how ecosystems are linked to human activities through a sequence of steps; it was then re-interpreted with respect not only to the sequence of steps, but also to the complexity embedded in each step [17]. Complexity is in fact higher when the ecocentric interpretation of ecosystems and their functioning is considered as “a whole” (biophysical structure and functions), and becomes lower when the anthropocentric interpretation forces a “one-by-one” identification procedure (services and benefits), as further explained in the next paragraphs.
As graphically simplified by Figure 1, while the ecological holistic view can be represented by the “function” step (where ecological cycles interact as a whole system), the economic perception is represented by the “benefit” step (where only the final output is received by the socioeconomic system). In fact, what humans perceive are the material (e.g., wood extracted from forests) and immaterial (e.g., trekking in nature) outcomes generated by ESs, without caring about the ecological process(es) that generated them. To measure the cubic meters of wood harvested cannot be used to represent the complexity of a forest ecosystem. This kind of measurement can be misleading and dangerous. For example, a planted forest would generate a higher amount of wood compared to a natural or semi-natural forest. The contrast between the holistic function and a simplistic benefit summarizes the hidden paradox underpinning the debate on what ecologists think is correct versus what economists think is feasible.
The “service” step represents a sort of compromise to avoid the oversimplification (and eventual underestimation) brought by the “benefits” economic view. In fact, this step is meant to move from the “holistic” functioning of the system to the “one-by-one” transaction from ecosystem to society. It remains a simplification, but at least it still enables the assessment of the ecological processing within each ES flow.
In this paper, the focus is on the assessment of the crop provision service, which is quite peculiar for a number of reasons. First, human activity is substantial in the provision of crops; this is not the case for other ESs, where ecological processes do not need to be highly complemented by human input. Second, many ecological processes interact to generate crops, e.g., from the water, to the nutrient cycles in the soil, to the action of pollinators. For these reasons, crop provision (more than other ESs) represents an example of how ecological processing could be represented as one integrated flow or as many individual flows, and eventually show the differences between the two approaches. Specifically, this assessment is placed within a natural capital accounting system, compliant with the United Nations (UN) System of integrated Environmental and Economic Accounting – Ecosystem Accounts (SEEA EA) standards [7]. In fact, accounting for ESs is increasingly becoming a common framework that will enable a coherent and consistent mainstreaming of ecological content into the economic context [7,18,19].
The following questions are addressed in this paper: (1) how to deal with ecological processes that contribute to crop provision (before this ES interacts with human input to generate crop production), (2) whether these ecological processes should be considered as intermediate or as final, and (3) what would work better to promote a resilient food system.
First a theoretical description of intermediate and final assessment alternatives is provided. Then, a practical example is shown before discussing the main raised elements and their implications.

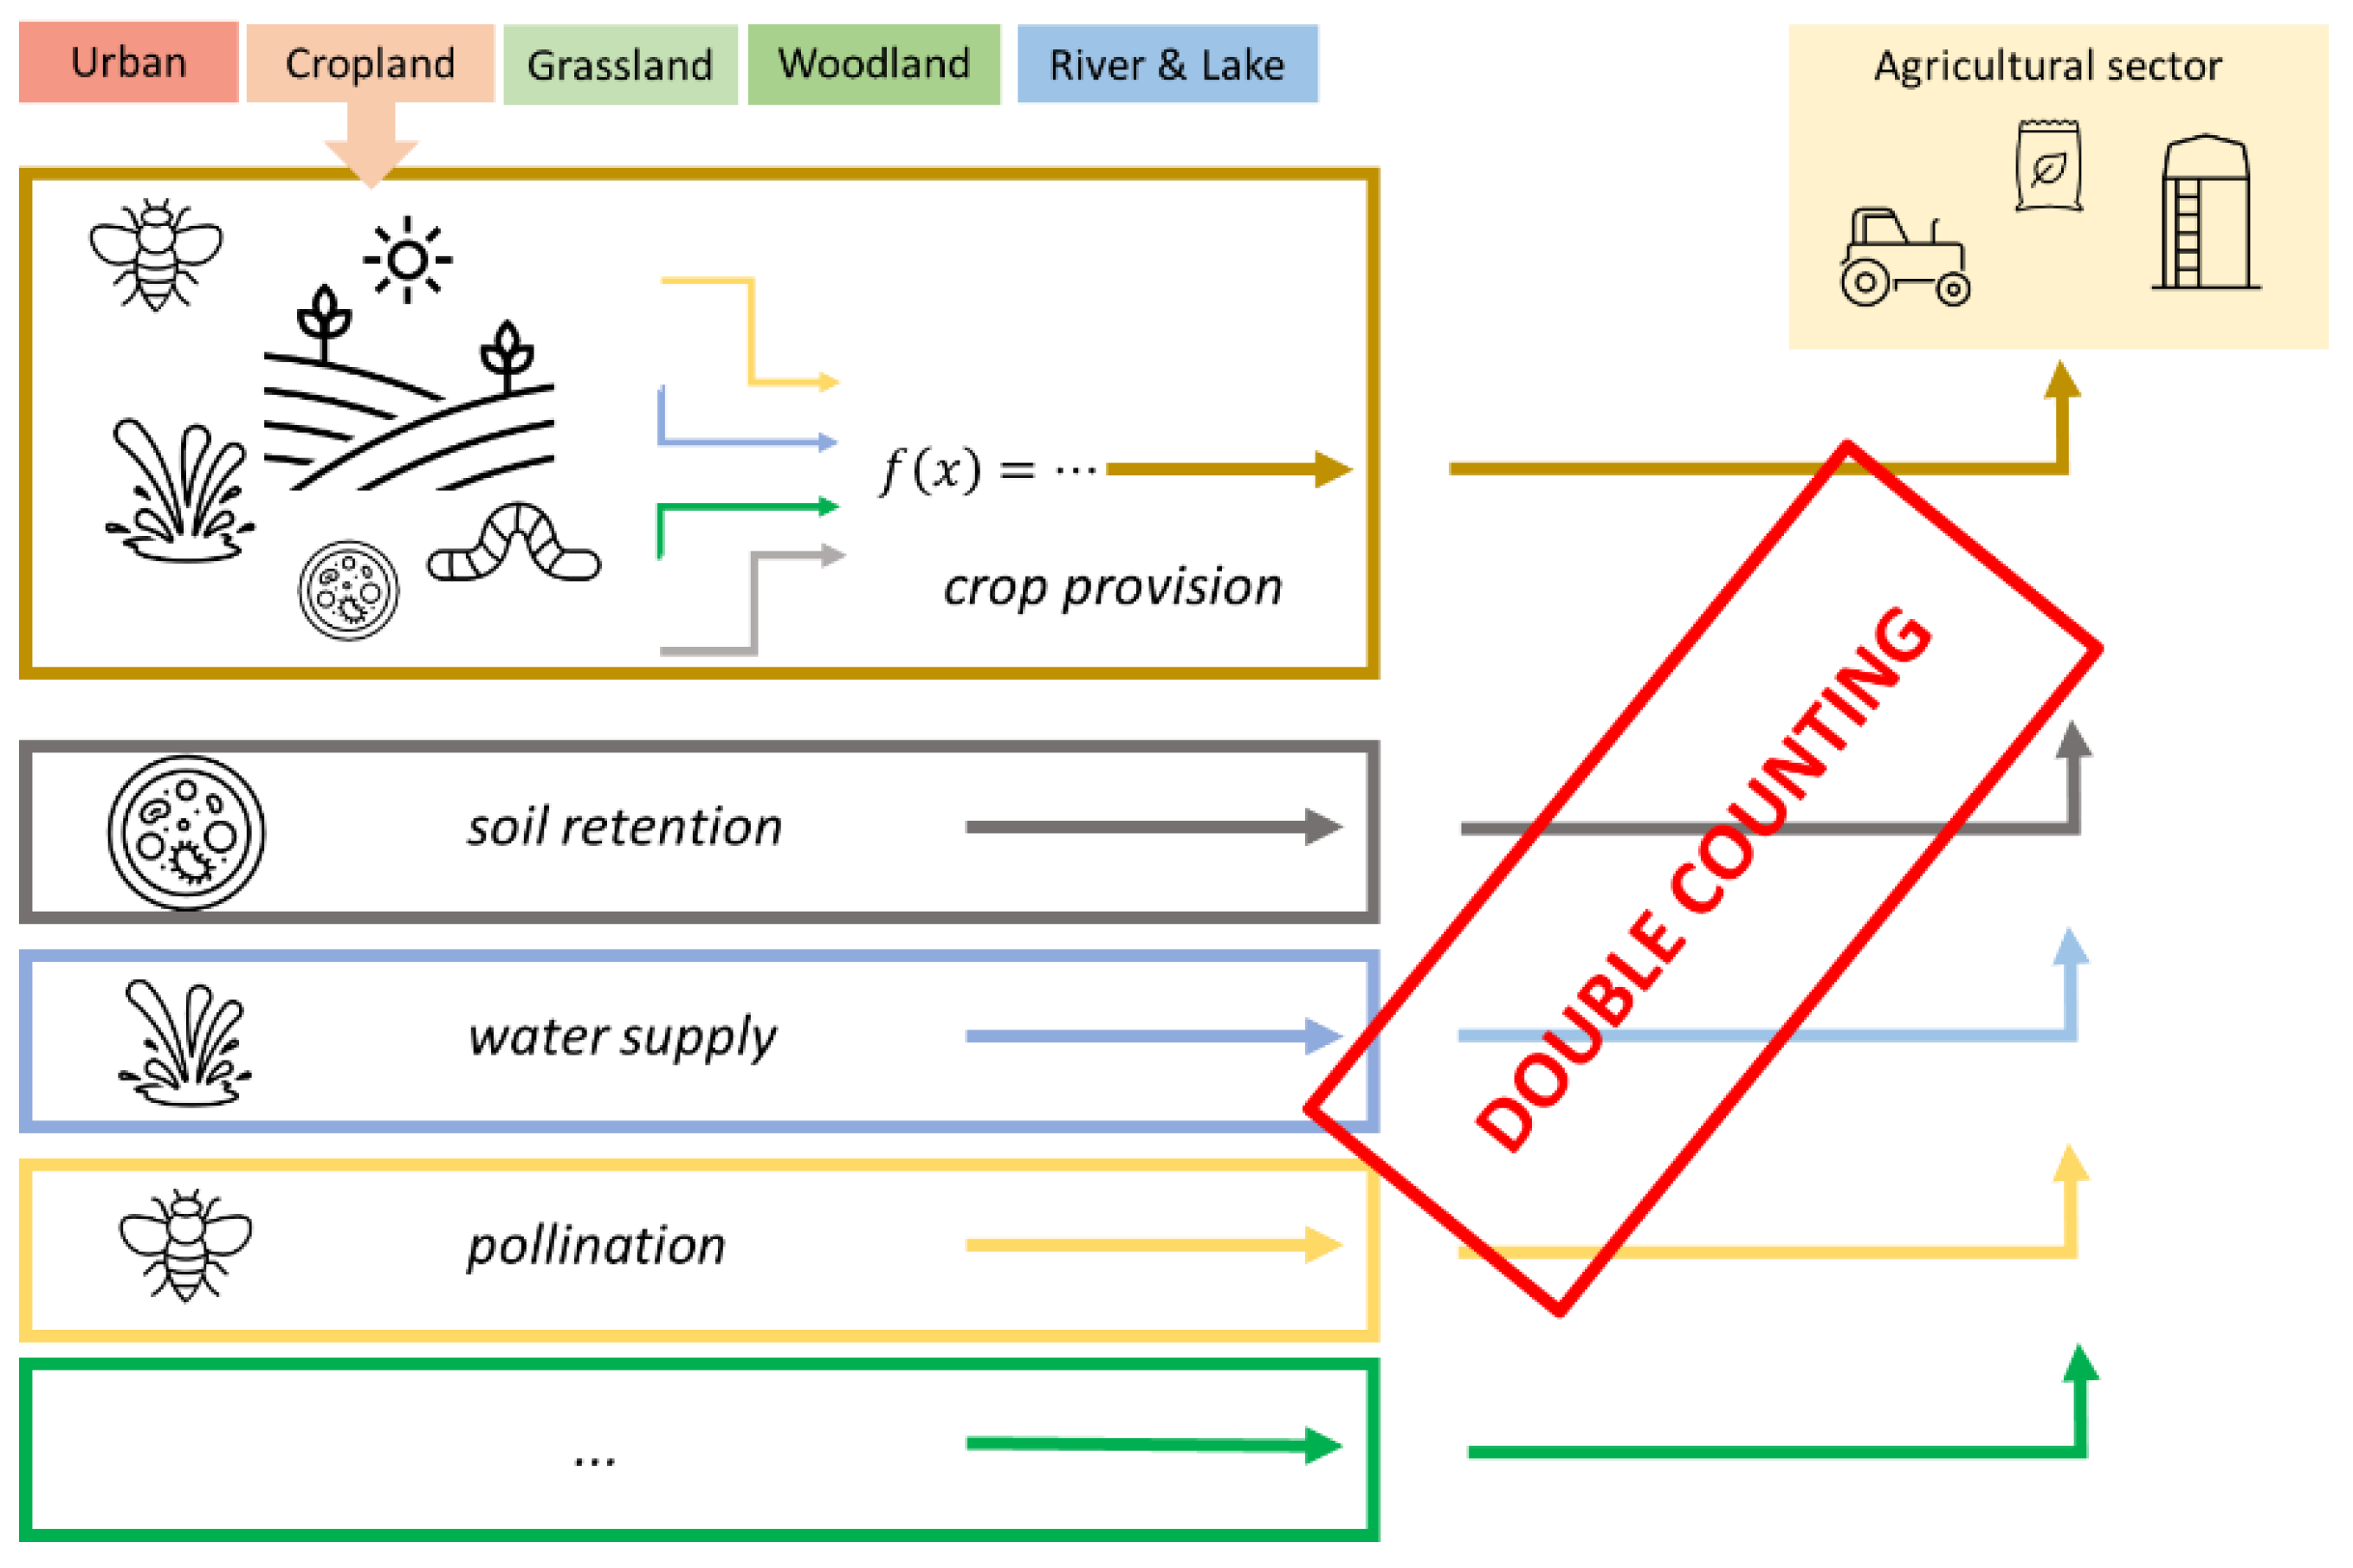
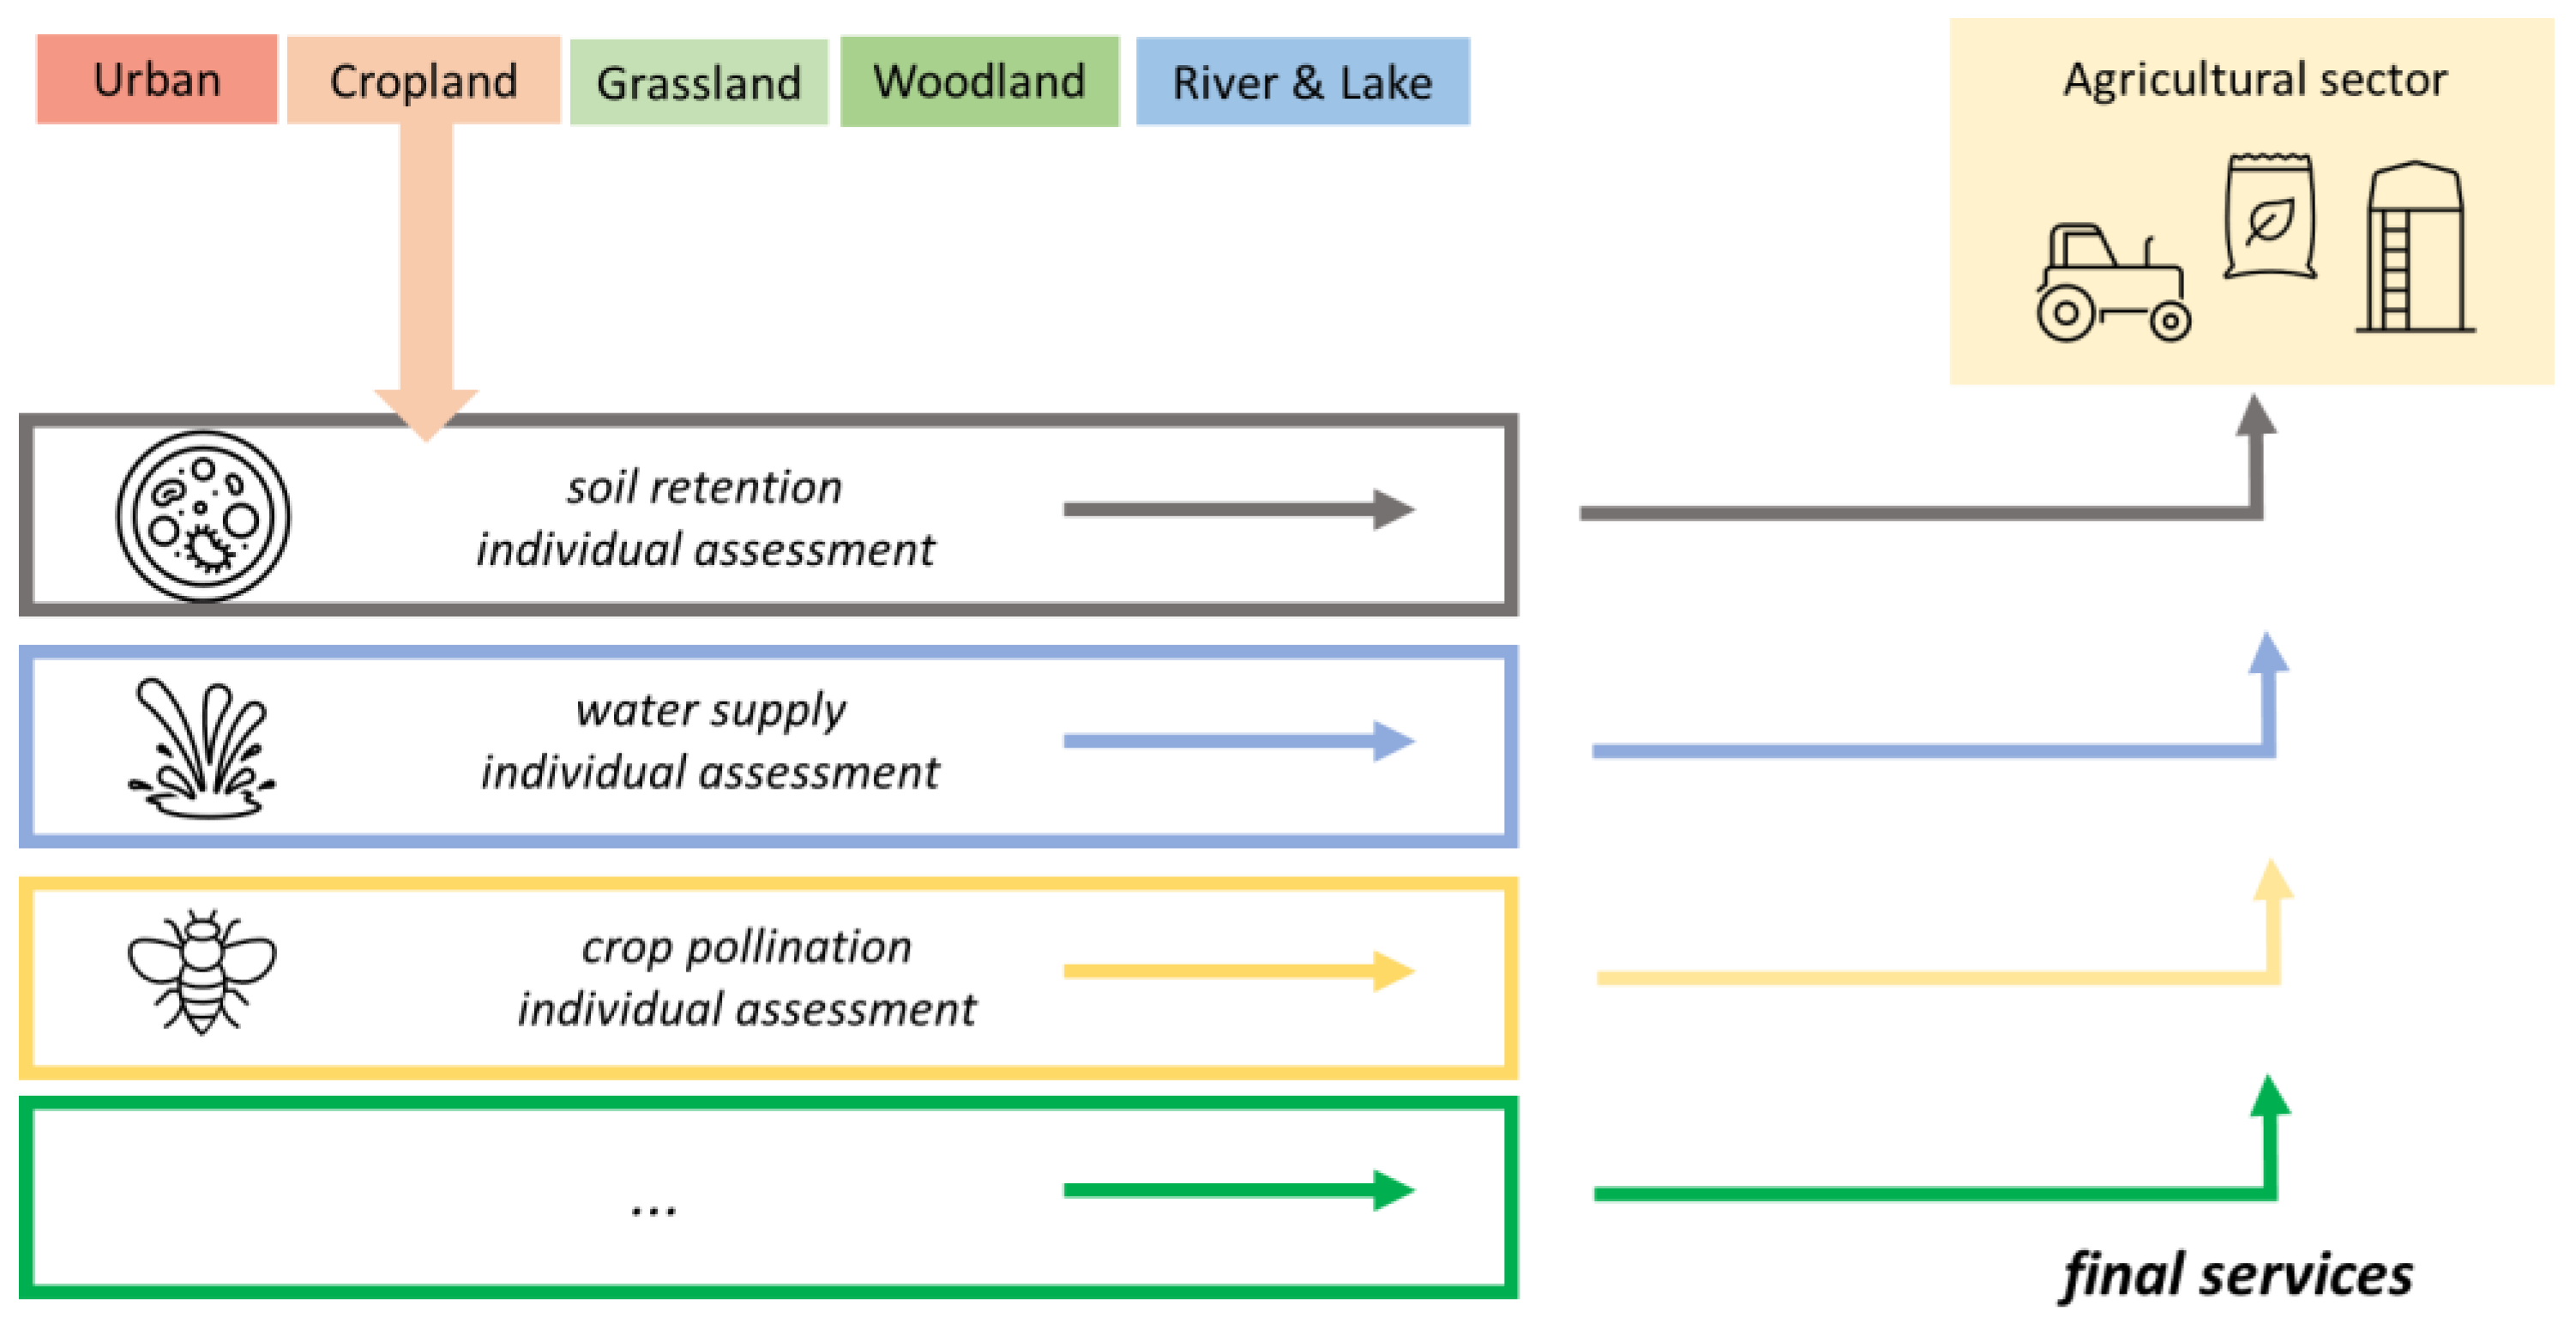
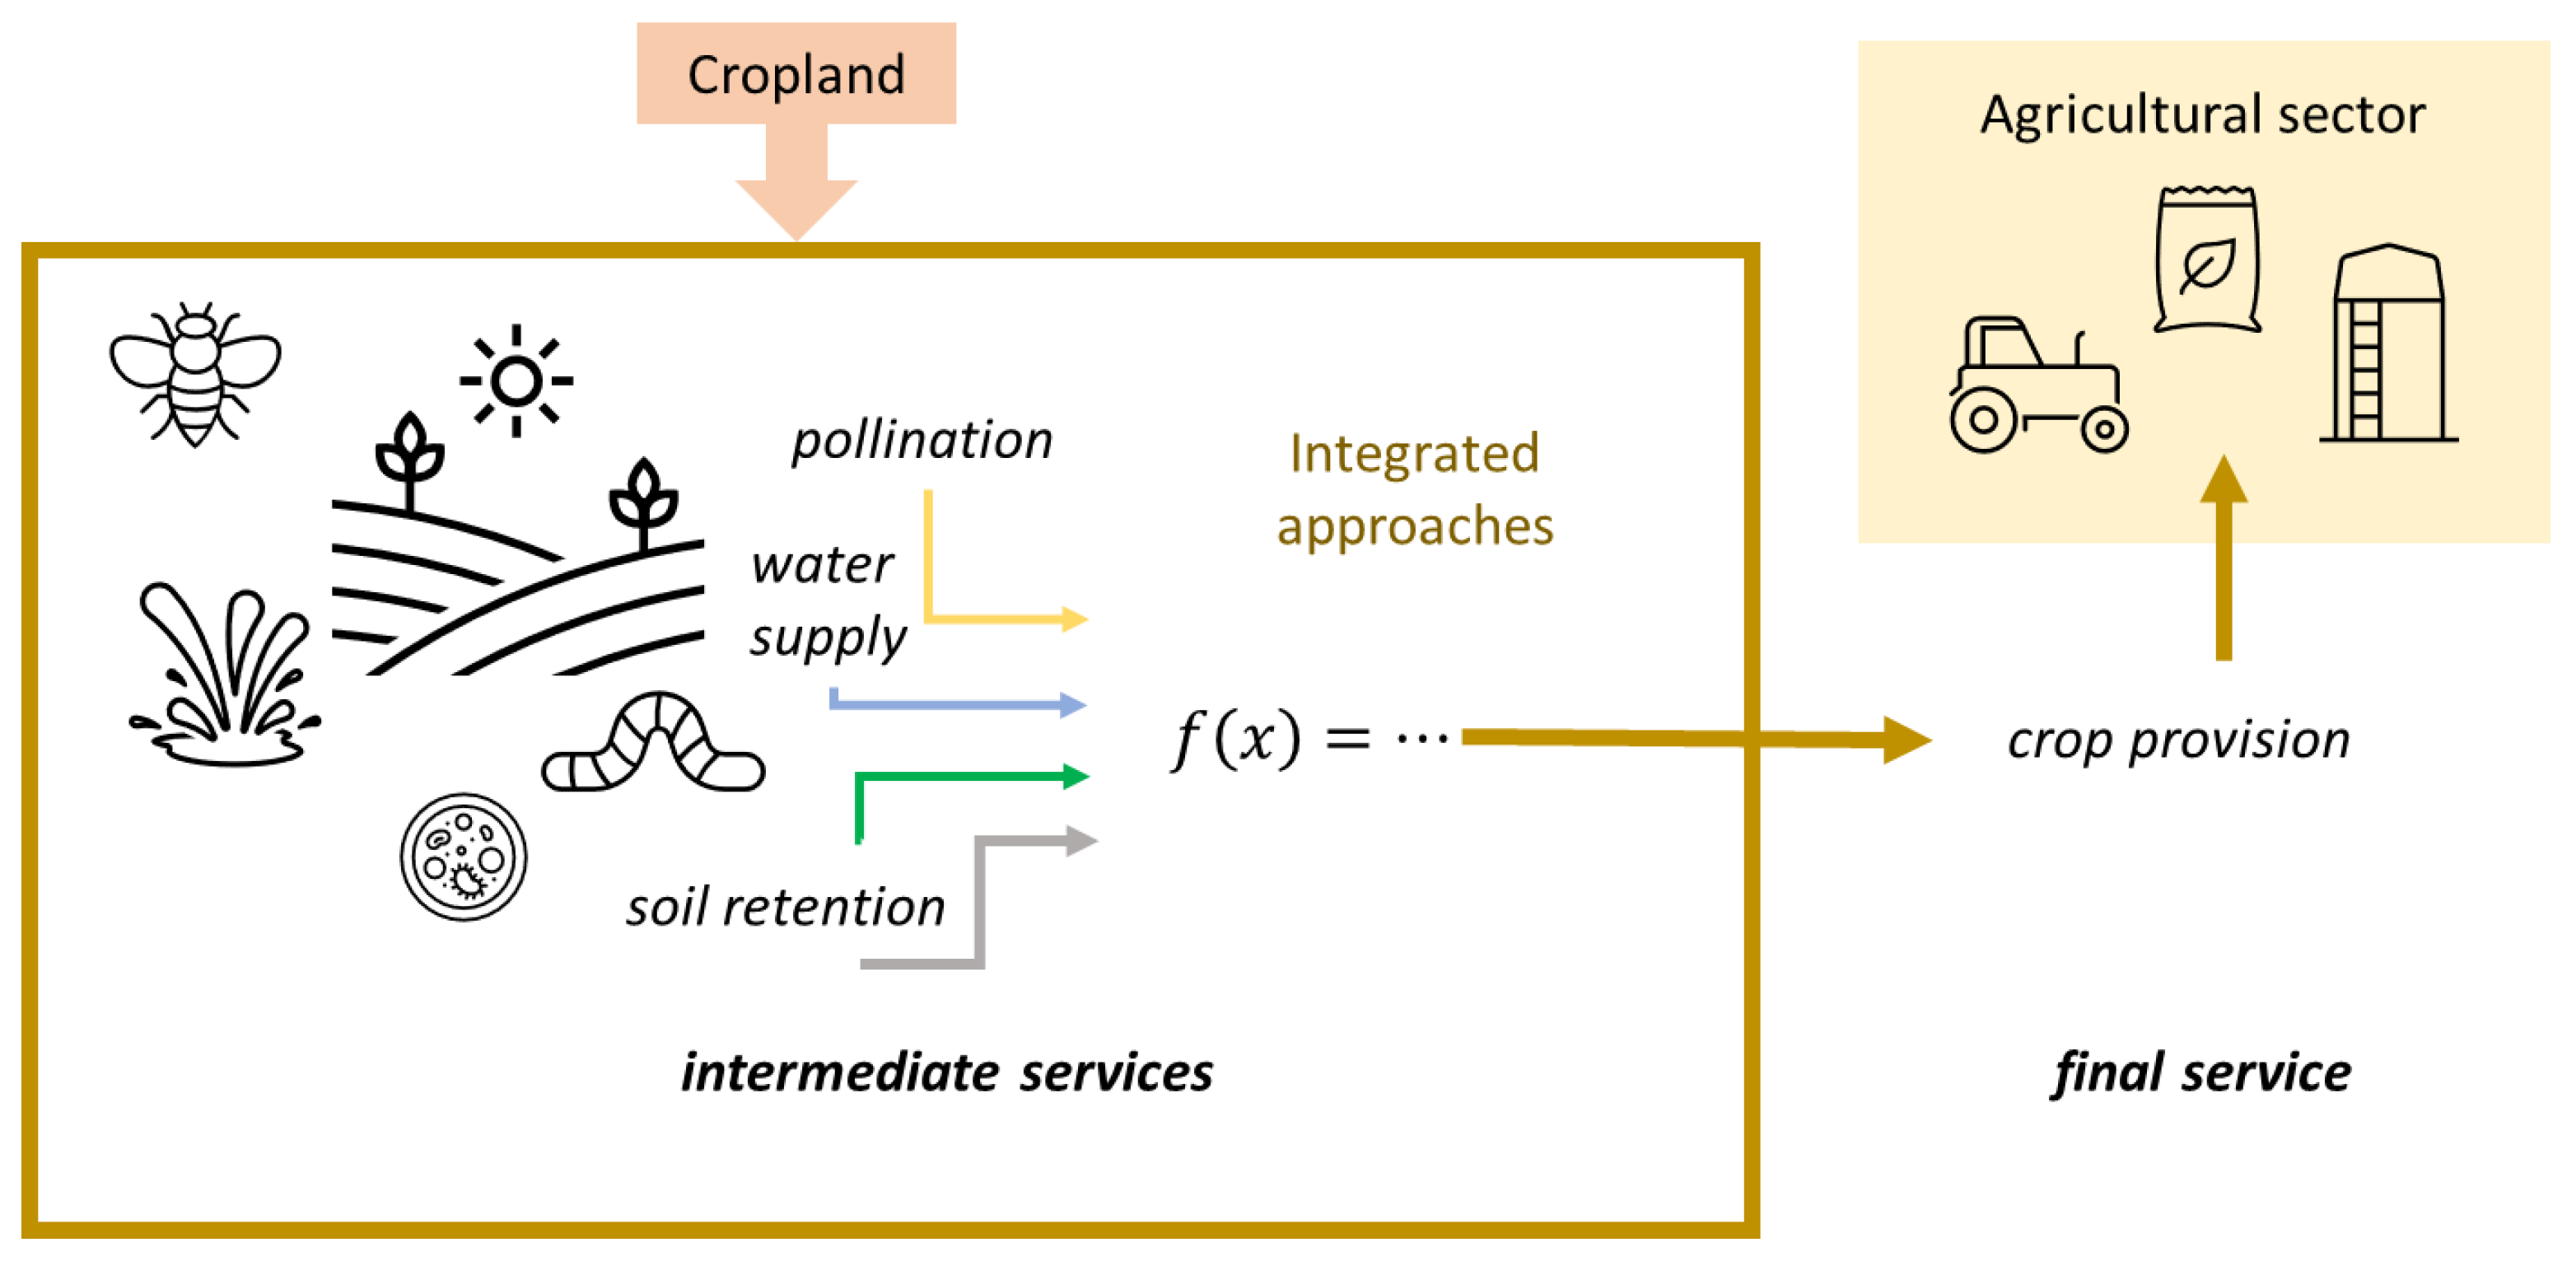
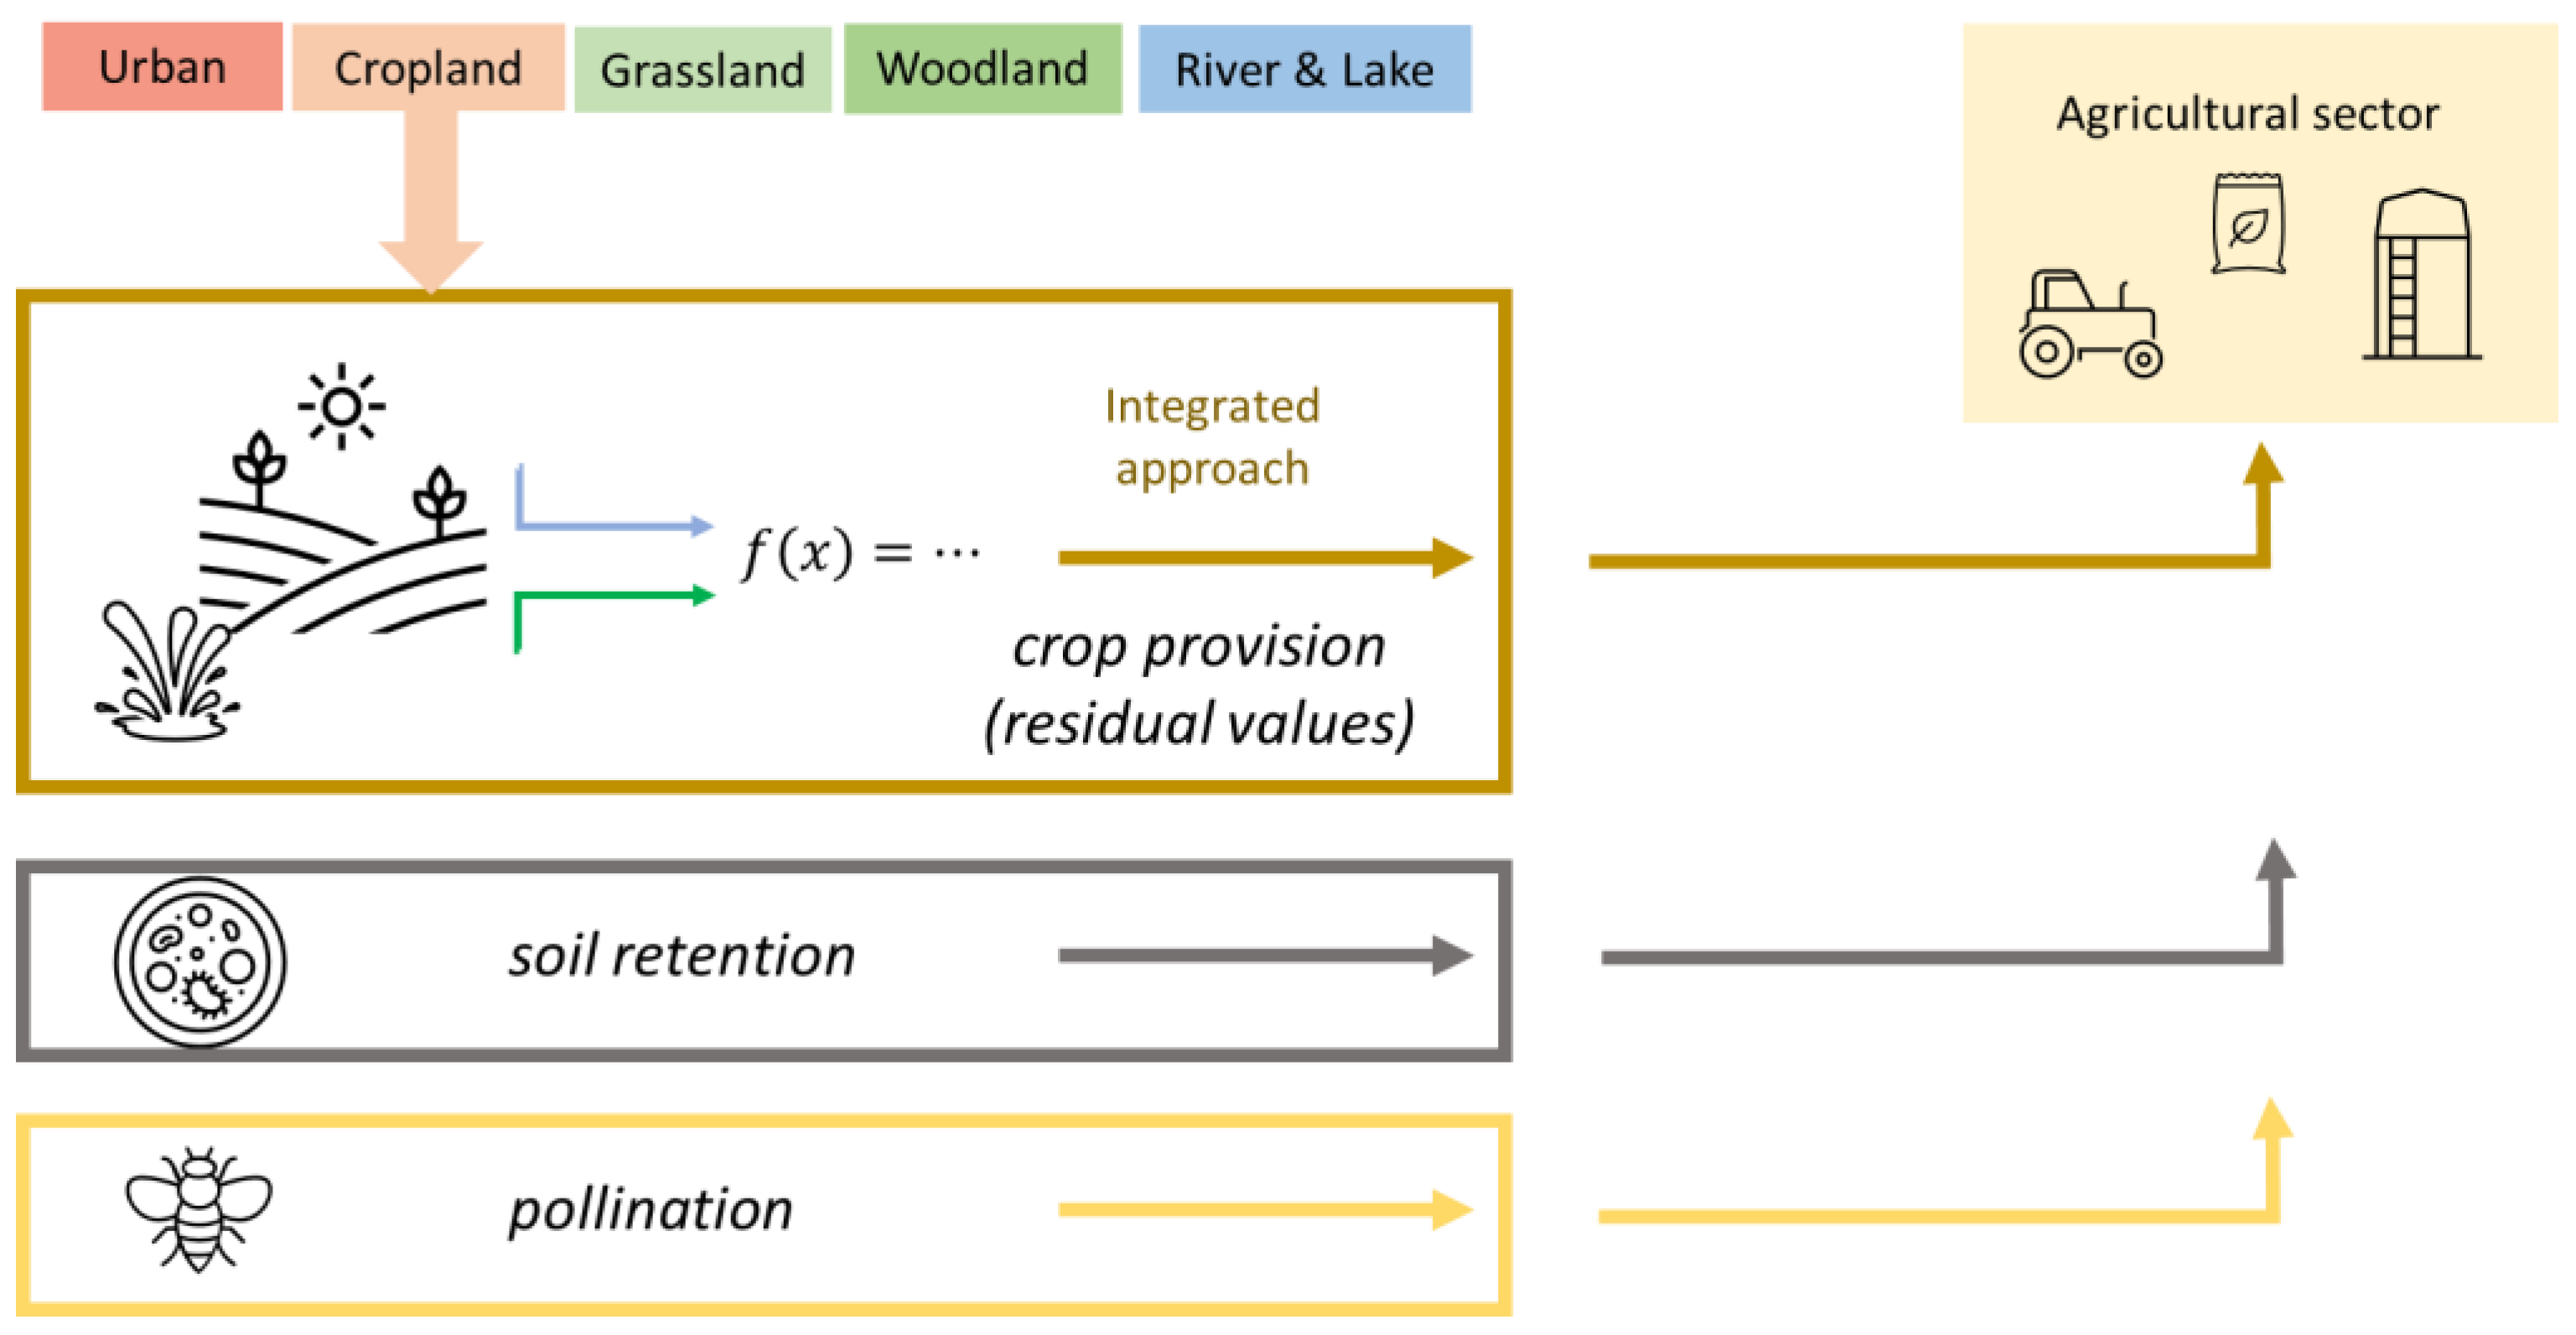
2. Methods: How to Consider Intermediate and Final Services in Assessing Crop Provision

The ES crop provision includes many factors, such as nutrients, water, pollination (for some specific crops), and energy from solar radiation. All these factors work together to generate the ecological input needed for agricultural production.
Let us consider the ecosystem accounting standard recently adopted by the UN Statistical Commission, i.e., the SEEA EA [7,20]. ES supply and use tables are one of the accounting modules that are part of the SEEA EA framework. The supply table reports on which ecosystem types (i.e., urban, cropland, grassland, etc.) ESs come from. The use table reports which economic units (i.e., economic sectors, households, etc.) the ESs go to. Only final ESs are reported; to report intermediate ESs would in fact double count the same flows.
For example, the assessment of soil retention takes into account the value of soil fertility and structure. However, soil fertility, in turn, is an ecosystem input for agricultural yield. There are methodologies to assess crop provision that already include the role of soil. For example, agricultural production functions likely include soil fertility together with water and solar energy. In a previous application of ES SUT undertaken for Europe [18], the approach adopted to assess and value crop provision was based on an emergy ratio (ref. Box 1) that already includes the role of soil in crop production. If the soil retention service is added to crop provision, we would have in this case a clear example of double counting (Figure 2).
There are several ways to avoid double counting. A first alternative is to adopt an integrated approach, where ecosystem services such as soil retention and water supply are considered intermediate inputs generating a single ES, and are not considered as individual ESs. Examples of comprehensive approaches are the agricultural production function [21,22,23,24] and the emergy-based approach [14] (Figure 3). In this case, intermediate ESs are assessed as “embedded” in crop provision. The advantage of this approach is its relative simplicity and full consistency; as a disadvantage, this approach provides the information in an aggregated format: decision makers will not be able to use it when they need to understand—for example—which are the most threatened ESs that require actions for ecosystem restoration, and on which crop yield depends.
A second alternative would require identification and assessment of each individual service by using a variety of techniques that range from complex biophysical models—such as those used to assess pollination and soil retention—to environmental statistics and accounts, such as water supply (Figure 4). In this case, no comprehensive approach is used; although more demanding in terms of data needs and modelling, it ensures a better, more realistic assessment of ESs. On the one hand, we would not record crop provision as a standalone ES: services are allocated as “final” to the agricultural sector.
On the other hand, it would be difficult to have the information to quantify and record all possible flows (one by one) in the accounting tables. Furthermore, ecological systems are very complex, and the contributions of different processes might not be additive, so the (re)allocation of ES flow would not be straightforward, even if we had all the data.
A third solution would be a combination of the two approaches, by making sure that there is no double counting (Figure 5). In this case, the assessment of individual ES flows is undertaken for all services where data and modelling enable the assessment; the application of comprehensive approaches (such as the ones concerning the first alternative) can help in assessing the remaining (“residual”) ESs.
Figure 5 shows that in this third case the contributions of ESs assessed individually are removed from the crop provision ES; thus, double counting is avoided.
Based on this description, it is possible to conclude that ESs cannot be defined as “intermediate” by default, as implicitly assumed by all applications based on the MA classification. Whether they are treated as “intermediate” or “final” depends on the assessment technique that is adopted to assess them.
In the next section, an example based on the on-site “soil retention” service is presented by comparing the following:
  • The first approach, where soil retention is treated as an intermediate service;
  • The third approach, where soil retention is treated as a final service.
Box 1. Calculation of ecosystem contribution for crop provision assessment.
The biophysical assessment of crop provision builds on the quantification of emergy flows in agricultural systems [14], i.e., the energy (from “embodied energy”)-based approach in agroecosystems. Emergy considered all the inputs used in agricultural production to obtain the agricultural output, including natural and anthropic inputs. Natural inputs include, for example, sunlight, rainfall, and soil; anthropic inputs include, for example, mineral fertilizers, pesticides, irrigation water, and machinery.
These inputs were converted from their original physical units (e.g., kg of fertilizer per ha, or hours of human labor) into a common metric: solar equivalent Joule (seJ). To make such a conversion, “transformity” coefficients were applied. Transformity is defined as the energy of one type (in this case, solar energy) directly and indirectly required to generate 1 J of another different source.
The quantification of inputs and outputs in agroecosystems in common units of energy enables the estimation of the percentage of the yield that is directly attributable to the ecosystem contribution, according to the following equation:
Ecosystem Contribution = Natural inputs/(Natural inputs + human inputs)
Ecosystem contribution varies between 0—when yield is entirely derived from human inputs—and 1, when no human input is provided. Practical applications have shown that both types of inputs are always present.

3. Results: From Theory to Practice with a Concrete Application

The quantitative assessments presented in this section are based on KIP INCA applications. The KIP INCA project is a European partnership meant to test, implement, and (in this case) further develop the SEEA Experimental Ecosystem Accounts initial guidelines [17] in Europe. After KIP INCA phase two [18], the published outcomes of the project deliver estimates for seven ecosystem services. Data are available in both physical and monetary terms. For the sake of comparability among different ESs, the reference will be made to monetary estimates delivered by the KIP INCA project, whose documentations (available at https://ecosystem-accounts.jrc.ec.europa.eu/ (accessed on 11 November 2021)) explain in detail the biophysical assessment and monetary valuation techniques applied.
When considering seven ecosystem services, the supply table shows that cropland accounts for 35.8% of total ESs provided in 2012; cropland provides an annual flow of total EUR 38,220/km2/year, including the following ESs: crop provision and pollination, water purification, flood control, and nature-based recreation [18]. The use table shows that the agricultural sector receives 37.7% of the total quantity of the seven ESs’ annual flows—especially from crop provision and pollination, and from water purification (basin retention) [18]. Among all economic sectors, agriculture is the one that receives most of the ES flows.
In Table 1 the crop provision service is calculated according to the first approach, i.e., the emergy ratio that is briefly explained in Box 1. The emergy-based approach embeds soil retention, which is thus considered an intermediate service.
However, recent applications specifically assessed on-site soil retention not as being embedded in crop provision, but rather as a final ES [25]. To add this service to the previous application would risk double counting of the soil retention. An attempt can be made to disentangle on-site soil retention from crop provision (see the Supplementary Materials), and the results (Table 2) show that:
  • On-site soil retention plays a very important role in overall crop provision, accounting for ~45% of the total ES flow (EUR 9388/year of a total EUR 20,795/year in 2012);
  • The calculation of on-site soil retention as a final ES flow is consistent with the previous crop provision calculation. Higher values of soil retention (EUR 11,407 in 2012) compared to crop provision (EUR 9388 in 2012) can be explained by the fact that crop provision only included arable crops, while on-site soil retention was also calculated for permanent crops.
The two approaches (“soil retention as an intermediate service” and “soil retention as a final service”) generate outcomes that are fully comparable; the soil retention assessment can thus be considered as an additional validation of the emergy ratio used to calculate crop provision according to the first approach.
It is important to consider that crop provision, with reference to arable crops, was not calculated for pollinator-dependent crops; thus, pollination was not included in the emergy ratio. When we add the crop pollination service [13], the total ecological input to agricultural production increases, as shown in Table 2.
When only looking at crop provision in both “embedded/aggregated” (Table 1) and “disentangled/disaggregated” (Table 2) versions, there is a slight decrease from 2000 to 2006 and a remarkable increase from 2006 to 2012, for a number of reasons that likely depend on crops’ distribution on the territory and their management practices.
On the other hand, for soil retention and crop pollination services the trend is the opposite: there is an increase from 2000 and 2006, which then decreases in 2012. The approach meant to disentangle individual ES flows enables us to highlight these differences and, thus, engage in a more detailed analysis that can provide interesting insights: e.g., the increase in crop pollination is mainly due to an increase in pollinator-dependent crops that is not counterbalanced by an increase in habitats suitable to host wild pollinators, leading to a decrease in the following years [13,18]. This kind of information could support sustainability and resilience evaluation, because it considers the ecological processes of individual flows to show ES overuse and/or ES absence, eventually leading to ecosystem degradation. However, further analysis would be needed to specifically tackle sustainability and resilience.
The first concrete outcome of these two approaches is that the total will be balanced by the three ES flows whose trends move in different directions. In fact, the change between 2000 and 2012 based on crop provision, as presented in Table 1, was ~33%, while the change between 2000 and 2012 based on three ESs that contribute to the agricultural production, as presented in Table 2, was ~16%.

4. Discussion

Inputs to agricultural production can be provided by humans (e.g., fertilizers, insecticides, addition of managed bees, use of machinery) and by ecosystems (e.g., water supply, soil fertility and structure, pest regulation, pollination). The balance between these two sets of inputs determines whether an agricultural production system can be more or less sustainable and, in turn, whether the agri-food system can be more or less resilient.
On the one hand, according to a simplified agricultural business perspective, farmers must increase the volume of production if they want to generate profits, because economic margins are tight. When farmers get bigger equipment, they can farm more acres. To buy bigger equipment increase farmers’ costs and reduces their profits, so they need more acres to farm. This is what Duffy [26] calls the “technology treadmill”. Farms become larger and more homogeneous, and (semi-) natural habitats disappear with the loss of many regulation and maintenance services [27,28]. Increases in human inputs—such as domesticated honeybees or bumblebees, pesticides, and artificial fertilizers—likely lead to an increase in crop yield, but also to a system that is “disconnected” from the natural environment [29] and, thus, less resilient to changes in environmental conditions. These agricultural practices record low ES flows.
On the other hand, an alternative to conventional intensification is the adoption of environmentally friendly practices such as planting hedgerows or flower strips, conservation of (semi-) natural habitats, or enhancement of habitat heterogeneity [30]. Such practices would be able to support the functioning of more diverse biotic communities that would, in turn, enable the ecosystem to recover more rapidly after disturbance [31], and to be more resilient to climate change [32]. In fact, if some species fail to adapt to changes in land use and climate, functional redundancy may help to protect against the negative consequences of the new environmental scenarios. For example, in the case of insect communities pollinating crops, Garibaldi et al. [33] demonstrated that diverse communities of wild pollinators enhance crop yields, while Winfree and Kremen [34] showed that their population sizes tend to remain stable if they are exposed to changing environmental conditions. These agricultural practices record high ES flows.
There are synergies between ES flows e.g., between nutrient cycling management and pollination; between wild pollinators and natural pest regulation; and between biomass and the composition of microbial communities. The whole functioning of the ecosystem works as an interconnected network, but an economic accounting-based analysis of the agroecological system would instead need to identify each ES flow one by one in order to avoid underestimation and, eventually, misleading analysis.
As shown in the supply and use tables, an assessment that embeds all regulation and maintenance services as intermediate by default cannot include all ESs, and cannot enable an analysis of the trends that take place in each ES flow. Changes in environmental conditions and management practices could in fact generate different impacts on different ESs. The trade-off can be measured and analyzed once regulation and maintenance ESs are disentangled.
It is important that the growth of crop biomass is assessed together with—and not in substitution of—individual regulation and maintenance ESs. A viable solution for those in charge to assess agricultural-related ESs would be (1) to disentangle some of the most acknowledged regulation and maintenance ESs allocated to the agricultural sector—such as soil structure and fertility (i.e., on-site soil retention), biotic pest regulation, and pollination—and (2) to assess all the other ecological processes contributing to agro-biomass growth as “residual” crop provision via an appropriate function.
With such an information, policymakers are able to perform appropriate analysis in order to (for example):
  • Assess the sustainability of management practices (e.g., use of human inputs such as chemicals and machinery) in agriculture—the more ecological inputs (compared to human inputs), the more the agricultural system is connected with natural conditions and, thus, resilient to changes in these conditions;
  • Measure whether the current protective role of vegetation is able to reduce soil erosion rates and prevent land degradation—where the soil formation rate is greater than the soil erosion rate, the protective role of the ecosystem can prevent degradation which, in turn, weaken the stability of the agricultural system;
  • Determine the presence of habitats suitable to host wild pollinators, where there are pollinator-dependent crops—wild pollinator communities can simultaneously enhance crop yields and reduce exposure to changing environmental conditions.

5. Conclusions

The role of ESs, as presented in this paper, is structured according to the rules of natural capital accounting, which require not accounting for intermediate ESs in order to avoid double counting. The crop provision ES, more than any other ES, is the one that best shows the criticalities of choosing whether to consider some ecological processes as intermediate or as final.
In fact, to deal with each individual ES flow enables a level of sustainability analysis that otherwise would not be possible, because the single ES trend is lost within the overall aggregation, which likely counterbalances ad hoc peculiarities.
To enable a more advanced level of sustainability analysis can help to better appreciate resilience. To investigate how to support resilience should come next in the research agenda.

Supplementary Materials

The following are available online at https://www.mdpi.com/article/10.3390/land11010084/s1, Figure S1: Figure 1–Visual simplification of the emergy flows contributing to ecosystem production.

Funding

This research received no external funding.

Data Availability Statement

Data presented in this work are available on request from the first author.

Conflicts of Interest

The author declares no conflict of interest. The author alone is responsible for the views expressed in this article, and they do not necessarily represent the views, decisions, or policies of the institutions with which they are affiliated.

References

  1. Van Zanten, B.T.; Verburg, P.; Espinosa, M.; Gomez-Y-Paloma, S.; Galimberti, G.; Kantelhardt, J.; Kapfer, M.; Lefebvre, M.; Manrique, R.; Piorr, A.; et al. European agricultural landscapes, common agricultural policy and ecosystem services: A review. Agron. Sustain. Dev. 2014, 34, 309–325. [Google Scholar] [CrossRef] [Green Version]
  2. Power, A.G. Ecosystem services and agriculture: Tradeoffs and synergies. Philos. Trans. R. Soc. Lond. B Biol. Sci. 2010, 365, 2959–2971. [Google Scholar] [CrossRef]
  3. Maes, J.; Teller, A.; Erhard, M.; Condé, S.; Vallecillo, S.; Barredo, J.I.; Paracchini, M.L.; Abdul Malak, D.; Trombetti, M.; Vigiak, O.; et al. Mapping and Assessment of Ecosystems and Their Services: An EU Ecosystem Assessment; Publications Office of the European Union: Ispra, Italy, 2020. [Google Scholar] [CrossRef]
  4. Garibaldi, L.A.; Andersson, G.; Requier, F.; Fijen, T.; Hipólito, J.; Kleijn, D.; Pérez-Méndez, N.; Rollin, O. Complementarity and synergisms among ecosystem services supporting crop yield. Glob. Food Secur. 2018, 17, 38–47. [Google Scholar] [CrossRef]
  5. Bethwell, C.; Burkhard, B.; Daedlow, K.; Sattler, C.; Reckling, M.; Zander, P. Towards an enhanced indication of provisioning ecosystem services in agro-ecosystems. Environ. Monit. Assess. 2021, 193, 1–37. [Google Scholar] [CrossRef]
  6. Therond, O.; Duru, M.; Roger-Estrade, J.; Richard, G. A new analytical framework of farming system and agriculture model diversities. A review. Agron. Sustain. Dev. 2017, 37, 21. [Google Scholar] [CrossRef]
  7. United Nations. System of Environmental-Economic Accounting—Ecosystem Accounting: Final Draft. 2021. Available online: https://seea.un.org/sites/seea.un.org/files/documents/EA/seea_ea_white_cover_final.pdf (accessed on 4 January 2022).
  8. Millennium Ecosystem Assessment. Ecosystems and Human Well-Being; Island Press: Washington, DC, USA, 2005. [Google Scholar]
  9. TEEB. Ecological and Economic Foundations; Kumar, P., Ed.; Earthscan: London, UK; Washington, DC, USA, 2010. [Google Scholar]
  10. Haines-Young, R.; Potschin, M. The links between biodiversity, ecosystem services and human well-being. In Ecosystem Ecology: A New Synthesis; Cambridge Univeristy Press: Cambridge, UK, 2012. [Google Scholar]
  11. Ouyang, Z.; Song, C.; Zheng, H.; Polasky, S.; Xiao, Y.; Bateman, I.J.; Liu, J.; Ruckelshaus, M.; Shi, F.; Xiao, Y.; et al. Using gross ecosystem product (GEP) to value nature in decision making. Proc. Natl. Acad. Sci. USA 2020, 117, 14593–14601. [Google Scholar] [CrossRef] [PubMed]
  12. Hein, L.; Remme, R.P.; Schenau, S.; Bogaart, P.W.; Lof, M.E.; Horlings, E. Ecosystem accounting in the Netherlands. Ecosyst. Serv. 2020, 44, 101118. [Google Scholar] [CrossRef]
  13. Vallecillo, S.; La Notte, A.; Ferrini, S.; Maes, J. How ecosystem services are changing: An accounting application at the EU level. Ecosyst. Serv. 2019, 40, 101044. [Google Scholar] [CrossRef] [PubMed]
  14. Perez-Soba, M.; Elbersen, B.; Braat, L.; Kempen, M.; van der Wijngaart, R.; Staritsky, I.; Rega, C.; Paracchini, M.L. The Emergy Perspective: Natural and Anthropic Energy Flows in Agricultural Biomass Production; Publications Office of the European Union: Luxembourg, 2019. [Google Scholar] [CrossRef]
  15. Hooper, D.U.; Chapin, F.S., III; Ewel, J.J.; Hector, A.; Inchausti, P.; Lavorel, S.; Lawton, J.H.; Lodge, D.M.; Loreau, M.; Naeem, S.; et al. Effects of biodiversity on ecosystem functioning: A consensus of current knowledge. Ecol. Monogr. 2005, 75, 3–35. [Google Scholar] [CrossRef]
  16. Potschin-Young, M.; Haines-Young, R.; Görg, C.; Heink, U.; Jax, K.; Schleyer, C. Understanding the role of conceptual frameworks: Reading the ecosystem service cascade. Ecosyst. Serv. 2018, 29, 428–440. [Google Scholar] [CrossRef] [PubMed]
  17. La Notte, A.; D’Amato, D.; Mäkinen, H.; Paracchini, M.L.; Liquete, C.; Egoh, B.; Geneletti, D.; Crossman, N. Ecosystem services classification: A systems ecology perspective of the cascade framework. Ecol. Indic. 2017, 74, 392–402. [Google Scholar] [CrossRef]
  18. Vysna, V.; Maes, J.; Petersen, J.; La Notte, A.; Vallecillo, S.; Aizpurua, N.; Ivits-Wasser, E.; Teller, A. Accounting for Ecosystems and Their Services in the European Union. Final Report from Phase II of the INCA Project Aiming to Develop a Pilot for an Integrated System of Ecosystem Accounts for the EU; Publications office of the European Union: Luxembourg, 2021. [Google Scholar] [CrossRef]
  19. La Notte, A.; Vallecillo, S.; Maes, J.; Shapiro, C.D.; Bagstad, K.J.; Ingram, J.C.; Glynn, P.D. Editorial special issue natural capital accounting: The content, the context, and the framework. Ecosyst. Serv. 2021, 51, 101347. [Google Scholar] [CrossRef]
  20. United Nations; European Union; Food and Agriculture Organization of the United Nations; Organisation for Economic Co-operation and Development; Word Bank Group. System of Environmental Economic Accounting 2012—Experimental Ecosystem Accounting; United Nations: New York, NY, USA, 2014; Available online: https://seea.un.org/sites/seea.un.org/files/seea_eea_final_en_1.pdf (accessed on 4 January 2022).
  21. Yuan, Z. Analysis of agricultural input-output based on Cobb–Douglas production function in Hebei Province, North China. Afr. J. Microbiol. Res. 2011, 5, 5916–5922. [Google Scholar]
  22. Imran, M.A.; Ali, A.; Ashfaq, M.; Hassan, S.; Culas, R.; Ma, C. Impact of Climate Smart Agriculture (CSA) Practices on Cotton Production and Livelihood of Farmers in Punjab, Pakistan. Sustainability 2018, 10, 2101. [Google Scholar] [CrossRef] [Green Version]
  23. Telldahl, C.; Hansson, H.; Emanuelson, U. Modelling animal health as a production factor in dairy production- a case of low somatic cell counts in Swedish dairy agriculture. Livest. Sci. 2019, 230, 103840. [Google Scholar] [CrossRef]
  24. Meja, M.; Alemu, B.; Shete, M. Total Factor Productivity of Major Crops in Southern Ethiopia: A Dis-Aggregated Analysis of the Growth Components. Sustainability 2021, 13, 3388. [Google Scholar] [CrossRef]
  25. Joachim, M.; Vallecillo, S.; La Notte, A.; Zurbaran, M.; INCA-Soil Retention. European Commission, Joint Research Cen-tre (JRC) [Dataset] PID. 2021. Available online: http://data.europa.eu/89h/2e120644-aee8-42f0-811a-c2bede08c604 (accessed on 30 November 2021).
  26. Duffy, M. Economies of Size in Production Agriculture. J. Hunger. Environ. Nutr. 2009, 4, 375–392. [Google Scholar] [CrossRef] [PubMed]
  27. Holland, J.M.; Douma, B.; Crowley, L.; James, L.; Kor, L.; Stevenson, D.R.; Smith, B. Semi-natural habitats support biological control, pollination and soil conservation in Europe. A review. Agron. Sustain. Dev. 2017, 37, 31. [Google Scholar] [CrossRef] [Green Version]
  28. Chaplin-Kramer, R.; O’Rourke, M.E.; Blitzer, E.J.; Kremen, C. A meta-analysis of crop pest and natural enemy response to landscape complexity. Ecol. Lett. 2011, 14, 922–932. [Google Scholar] [CrossRef]
  29. Meehan, T.D.; Werling, B.P.; Landis, D.A.; Gratton, C. Agricultural landscape simplification and insecticide use in the Midwestern United States. Proc. Natl. Acad. Sci. USA 2011, 108, 11500–11505. [Google Scholar] [CrossRef] [Green Version]
  30. Garibaldi, L.A.; Gemmill-Herren, B.; D’Annolfo, R.; Graeub, B.E.; Cunningham, S.A.; Breeze, T.D. Farming Approaches for Greater Biodiversity, Livelihoods, and Food Security. Trends Ecol. Evol. 2017, 32, 68–80. [Google Scholar] [CrossRef] [PubMed]
  31. Van Ruijven, J.; Berendse, F. Diversity enhances community recovery, but not resistance, after drought. J. Ecol. 2010, 98, 81–86. [Google Scholar] [CrossRef]
  32. Isbell, F.; Craven, D.; Connolly, J.; Loreau, M.; Schmid, B.; Beierkuhnlein, C.; Bezemer, M.; Bonin, C.; Bruelheide, H.; De Luca, E.; et al. Biodiversity increases the resistance of ecosystem productivity to climate extremes. Nat. Cell Biol. 2015, 526, 574–577. [Google Scholar] [CrossRef] [PubMed]
  33. Garibaldi, L.A.; Carvalheiro, L.G.; Vaissière, B.E.; Gemmill-Herren, B.; Hipólito, J.; Freitas, B.M.; Ngo, H.T.; Azzu, N.; Sáez, A.; Åström, J.; et al. Mutually beneficial pollinator diversity and crop yield outcomes in small and large farms. Science 2016, 351, 388–391. [Google Scholar] [CrossRef] [Green Version]
  34. Winfree, R.; Kremen, C. Are ecosystem services stabilized by differences among species? A test using crop pollination. Proc. R. Soc. B Boil. Sci. 2008, 276, 229–237. [Google Scholar] [CrossRef] [PubMed] [Green Version]
Figure 1. Telescopic cascade framework.
Land 11 00084 g001
Figure 2. Crop provision accounting with the risk of double counting.
Land 11 00084 g002
Figure 3. Crop provision assessment based on a comprehensive approach.
Land 11 00084 g003
Figure 4. Crop provision assessment based on the assessment of each individual ecosystem service contributing to agricultural production.
Land 11 00084 g004
Figure 5. Crop provision assessment based on a mixed comprehensive approach and ecosystem service modelling.
Land 11 00084 g005
Table 1. Supply and use tables of one ecosystem service (million EUR, year 2012).
SupplyEconomic UnitsEcosystem TypesUseEconomic UnitEcosystem Types
CroplandOther Ecosystem TypesTotalAgricultureOther Economic UnitsTotal
Crop provision Crop provision
2000 15.615015.615200015.615015.615
2006 15.326015.326200615.326015.326
2012 20.795020.795201220.795020.795
Table 2. Supply and use tables of three ecosystem services with no double counting (million EUR, year 2012).
SupplyEconomic UnitsEcosystem TypesUseEconomic UnitEcosystem Types
CroplandOther Ecosystem TypesTotalAgricultureOther Economic UnitsTotal
Crop provision Crop provision
2000 8.36508.36520008.36508.365
2006 8.11908.11920068.11908.119
2012 11.407011.407201211.407011.407
Soil retention Soil retention
2000 11.114011.114200011.114011.114
2006 11.648011.648200611.648011.648
2012 11.512011.512201211.512011.512
Crop pollination Crop pollination
2000 4.08504.08520004.08504.085
2006 5.23505.23520065.23505.235
2012 4.51704.51720124.51704.517
Total Total
2000 23.564023.564200023.564023.564
2006 25.002025.002200625.002025.002
2012 27.436027.436201227.436027.436
Publisher’s Note: MDPI stays neutral with regard to jurisdictional claims in published maps and institutional affiliations.

