Article

Preliminary Model-Based Evaluation of Water Conservation Strategies in a Semi-Arid Urban Zone

by
Marcelino Antonio Zúñiga-Estrada
1,
Liliana Lizárraga-Mendiola
2,
Carlos Alfredo Bigurra-Alzati
2,
Sergio Esteban Aldana-Alonso
3,
Jorge Santiago Ramírez-Núñez
3 and
Gabriela A. Vázquez-Rodríguez
1,*
1
Área Académica de Química, Universidad Autónoma del Estado de Hidalgo, Km. 4.5 Carretera Pachuca-Tulancingo, Mineral de la Reforma 42086, Mexico
2
Área Académica de Ingeniería y Arquitectura, Mineral de la Reforma 42086, Mexico
3
Laboratorio Nacional de Vivienda y Comunidades Sustentables, Sede Centro Universitario de Arte Arquitectura y Diseño, Universidad de Guadalajara, Calzada Independencia Nte. 5075, Huentitán El Bajo 44250, Mexico
*
Author to whom correspondence should be addressed.
Land 2022, 11(1), 101; https://doi.org/10.3390/land11010101
Submission received: 17 November 2021 / Revised: 5 January 2022 / Accepted: 6 January 2022 / Published: 8 January 2022

Abstract

:
The U.S. Environmental Protection Agency stormwater management model was applied to a semi-arid urban micro watershed. The sub-catchment’s current features were modeled as scenario A, while the insertion of a set of LID technologies (rain barrels, bioretention cells, permeable pavement, and infiltration trenches) was represented as scenario B. A third scenario (C), considering only the most feasible LID technologies, was also modeled. All the scenarios were evaluated under two representative storm events (30 and 9 mm in two consecutive days, and 39 mm of rainfall in one day) occurred during the sampling performed in this study. Water quality was also simulated for a 30-mm storm event and compared against field assessment results after a real 30-mm storm event. Through the model, the inefficiency of current evacuation methods after 30- and 39-mm storm events was demonstrated. Simulation of scenario B showed that LID technologies could satisfactorily diminish peak flows generated by the selected storm events as well as runoff-conveyed pollution, while the realistic scenario allowed a lower but satisfactory hydrological performance and almost the same runoff quality than scenario B. This preliminary study could contribute to spread awareness about the benefits of LID technologies in semi-arid urban areas of the developing world.

1. Introduction

Urbanization is a critical anthropogenic alteration of local hydrological cycles. Urban constructions such as buildings, roofs, roads, and parking lots are impervious due to their compact internal structure. This imperviousness of urban built environments modifies the local hydrology because it prevents rainwater infiltration into the soil’s lower layers. Simultaneously, runoff increases, thereby diminishing the potential for aquifer recharge [1]. A greater volume of runoff, in turn, leads to more severe and frequent floods. Until not so long ago, flood reduction measures often relied on the improvement of existing drainage capacity. The usual engineering responses include the implementation of canals, dams, and pipes, which further increase impervious coverage and have proven ineffective if implemented in isolation [2].
On the contrary, low-impact development (LID) is a relatively new urbanization approach to managing excess runoff from increased impervious surfaces caused by urban development, intended to mimic pre-development hydrology [3]. Also known as “water-sensitive urban design,” “green urban infrastructure,” and “sustainable drainage systems,” LID represents a fundamental element of change in how urbanization is understood since it aims to minimize the adverse environmental impacts of civil infrastructure and, in particular, to restore the urban hydrological cycle. LID practices comprise bioretention cells, infiltration trenches, green roofs, permeable pavements, and rainwater harvest systems. Incorporating these systems into built environments promotes evapotranspiration, infiltration, aquifer recharge, and processes that can improve runoff quality through the removal of contaminants [4].
Hydrological models can simulate the effects of LID application at various temporal-spatial scales in urban areas. Currently, the most used hydrological models are the SCS (Soil Conservation Service), the SWAT (Soil and Water Assessment Tool), the MOUSE (Model for Urban Sewers, Danish Hydraulic Institute), HydroCAD, and the stormwater management model (SWMM) of the U.S. Environmental Protection Agency [5]. The SWMM is an open-source, dynamic tool used to model the hydrological and hydraulic components of a catchment. It is also used to predict the catchment response after LID implementation. The SWMM allows for the estimation of flow quantities, water quality parameters, infiltration, dry-weather flow, and pollutant loadings. For instance, the features of 19 commonly-used hydrological models have been previously evaluated and compared, and the conclusion was that the SWMM is an appropriate hydrological model to represent and simulate various soil use scenarios as well as the potential effects of LID implementation in a mixed urban-rural Appalachian watershed [6].
So far, urban runoff management through LID has taken place mainly in mesic climates (i.e., ones that receive rainfall of 750 to 2000 mm per year) [7]. However, in arid or semi-arid zones, broadly characterized by annual precipitation rates lower than 500 mm and potential evapotranspiration higher than precipitation [3], there also exists the demand for LID implementation, maybe more than anywhere. In these zones, which cover around 41% of the world’s land surface and are inhabited by 38% of the global population [8], urban runoff is considered a promising new water resource; the actual volume thereof needs, then, to be estimated and managed. LID implementation could enhance the ecological resilience of these water-scarce environments, regions which are otherwise among the most vulnerable to climate change [9]. However, in a recent review [3], the lack of studies dedicated to the performance of LID in arid and semi-arid zones was still recognized as problematic, as well as the unique challenges presented when dealing with these climates.
The purpose of this paper is to apply a preliminary SWMM hydrological modeling to the semi-arid study area in its actual state (baseline scenario) and after the hypothetical integration of LID solutions. These solutions were integrated into either an ideal or a realistic scenario, set for simulation and comparison against the baseline scenario under two storm events. Also, a water quality survey was conducted after an actual storm event and compared against the simulated values. We hypothesize that the LID installation from the top and across the study micro watershed is desirable to reduce the runoff volumes and peak flows in the lower part of the micro watershed or flood zone. However, a limitation in these proposals is the reduced availability of spaces to size them properly, which reduces their capacity to mitigate floods.
This work is organized as follows. First, a short literature review about some of the particularities of the arid and semi-arid regions, and the application of SWMM to these zones, is presented. Then we describe our semi-arid study area, which is affected by seasonal floods, the different land uses and their physical characteristics (surface, slope, runoff coefficient). The criteria for carrying out the design and the selection of the storm events were established. Next, the design parameters to be used in SWMM modeling were determined. Subsequently, hydraulic variables such as runoff volume, runoff coefficient, infiltration, and peak runoff were evaluated. Next, the behavior of the contaminants identified in the sampled water was analyzed. Finally, the potential of the proposals to mitigate runoff and pollutants was examined.

2. Review of the SWMM Application to Arid and Semiarid Zones

In arid and semi-arid areas, storm events have a short duration and a random nature. Besides, due to the prolonged dry periods between two successive storm events and the high spatial and temporal variability of both rainfall and runoff, the availability of consistent hydrological data sets presents a considerable challenge [10]. This drawback is even more significant for the dry zones of the developing countries, where the scarcity of data and case studies has led to a lack of evidence about the benefits of urban runoff management through LID [11]. The shortage of good practice examples of LID, in turn, implies limited opportunities to generate design standards and manuals adapted to the particularities faced in the arid and semi-arid developing world [11,12].
Concerning urban runoff quality, higher contents of total suspended solids (TSS), organic matter, nutrients, and heavy metals have been reported for arid and semi-arid zones than for international data, which is typically biased toward mesic zones. This can be partially explained by the time elapsed between storm events, which is longer in arid regions than in temperate ones and allows for the buildup of significant amounts of pollutants. Furthermore, in dry climates, vegetation provides insufficient protection against wind or water erosion. The resulting displacement of soil material is likely to produce runoff with high contents of solids and crustal metals [13].
Hydrological modeling of urban runoff and its mitigation through LID is of utmost importance in this climatic context. The recent review cited above signaled that SWMM-based modeling was the most common approach of the studies about the LID performance in arid and semi-arid zones, followed by field monitoring or experiments [3]. For instance, Rabori and Ghazavi evaluated the runoff generated in Zanjan, an Iranian city in a semi-arid zone, and the drainage network capacity for transferring the peak runoff for a designed storm with a 50-year return period [10]. They concluded that SWMM modeling has a considerable predictive capability for semi-arid regions. In recent research, an integrated methodology based mainly on SWMM modeling evaluated the efficiency of three LID strategies (green roofs, permeable pavements, and rain gardens) in reducing flooded areas, flood volume, and impact in Campina Grande, a semi-arid region in Brazil [14].
Similarly, in a study estimating the runoff generated by the seasonal rainfall patterns in a large urban catchment in Kuwait, it was found that the SWMM model could design the storm drainage system more accurately than the rational method [15]. From the simulation results, the authors selected the values of rainfall frequency of design storms most adequate to model the flooding of urban areas. Also, they estimated the quantity of runoff that could be harvested and used as an additional water resource.
Despite the promising results issued by the modeling studies, the LID benefits concerning water quality have been scarcely demonstrated by field monitoring in arid and semi-arid zones [3,7]. Overall, TSS are expected to be removed by LID devices, along with some metals and phosphorus, although removal efficiencies vary widely [3]. Permeable pavements, infiltration trenches, and bioretention cells are recommended for these climates but should be implemented with caution because they often lead to nutrient or metal export [4,7]. Studies of water quality, air quality, and urban heat mitigation associated with LID implementation were considered urgent in the mentioned review [3], because their scarcity is a barrier against the generalized adoption of this sustainable runoff management approach.

3. Materials and Methods
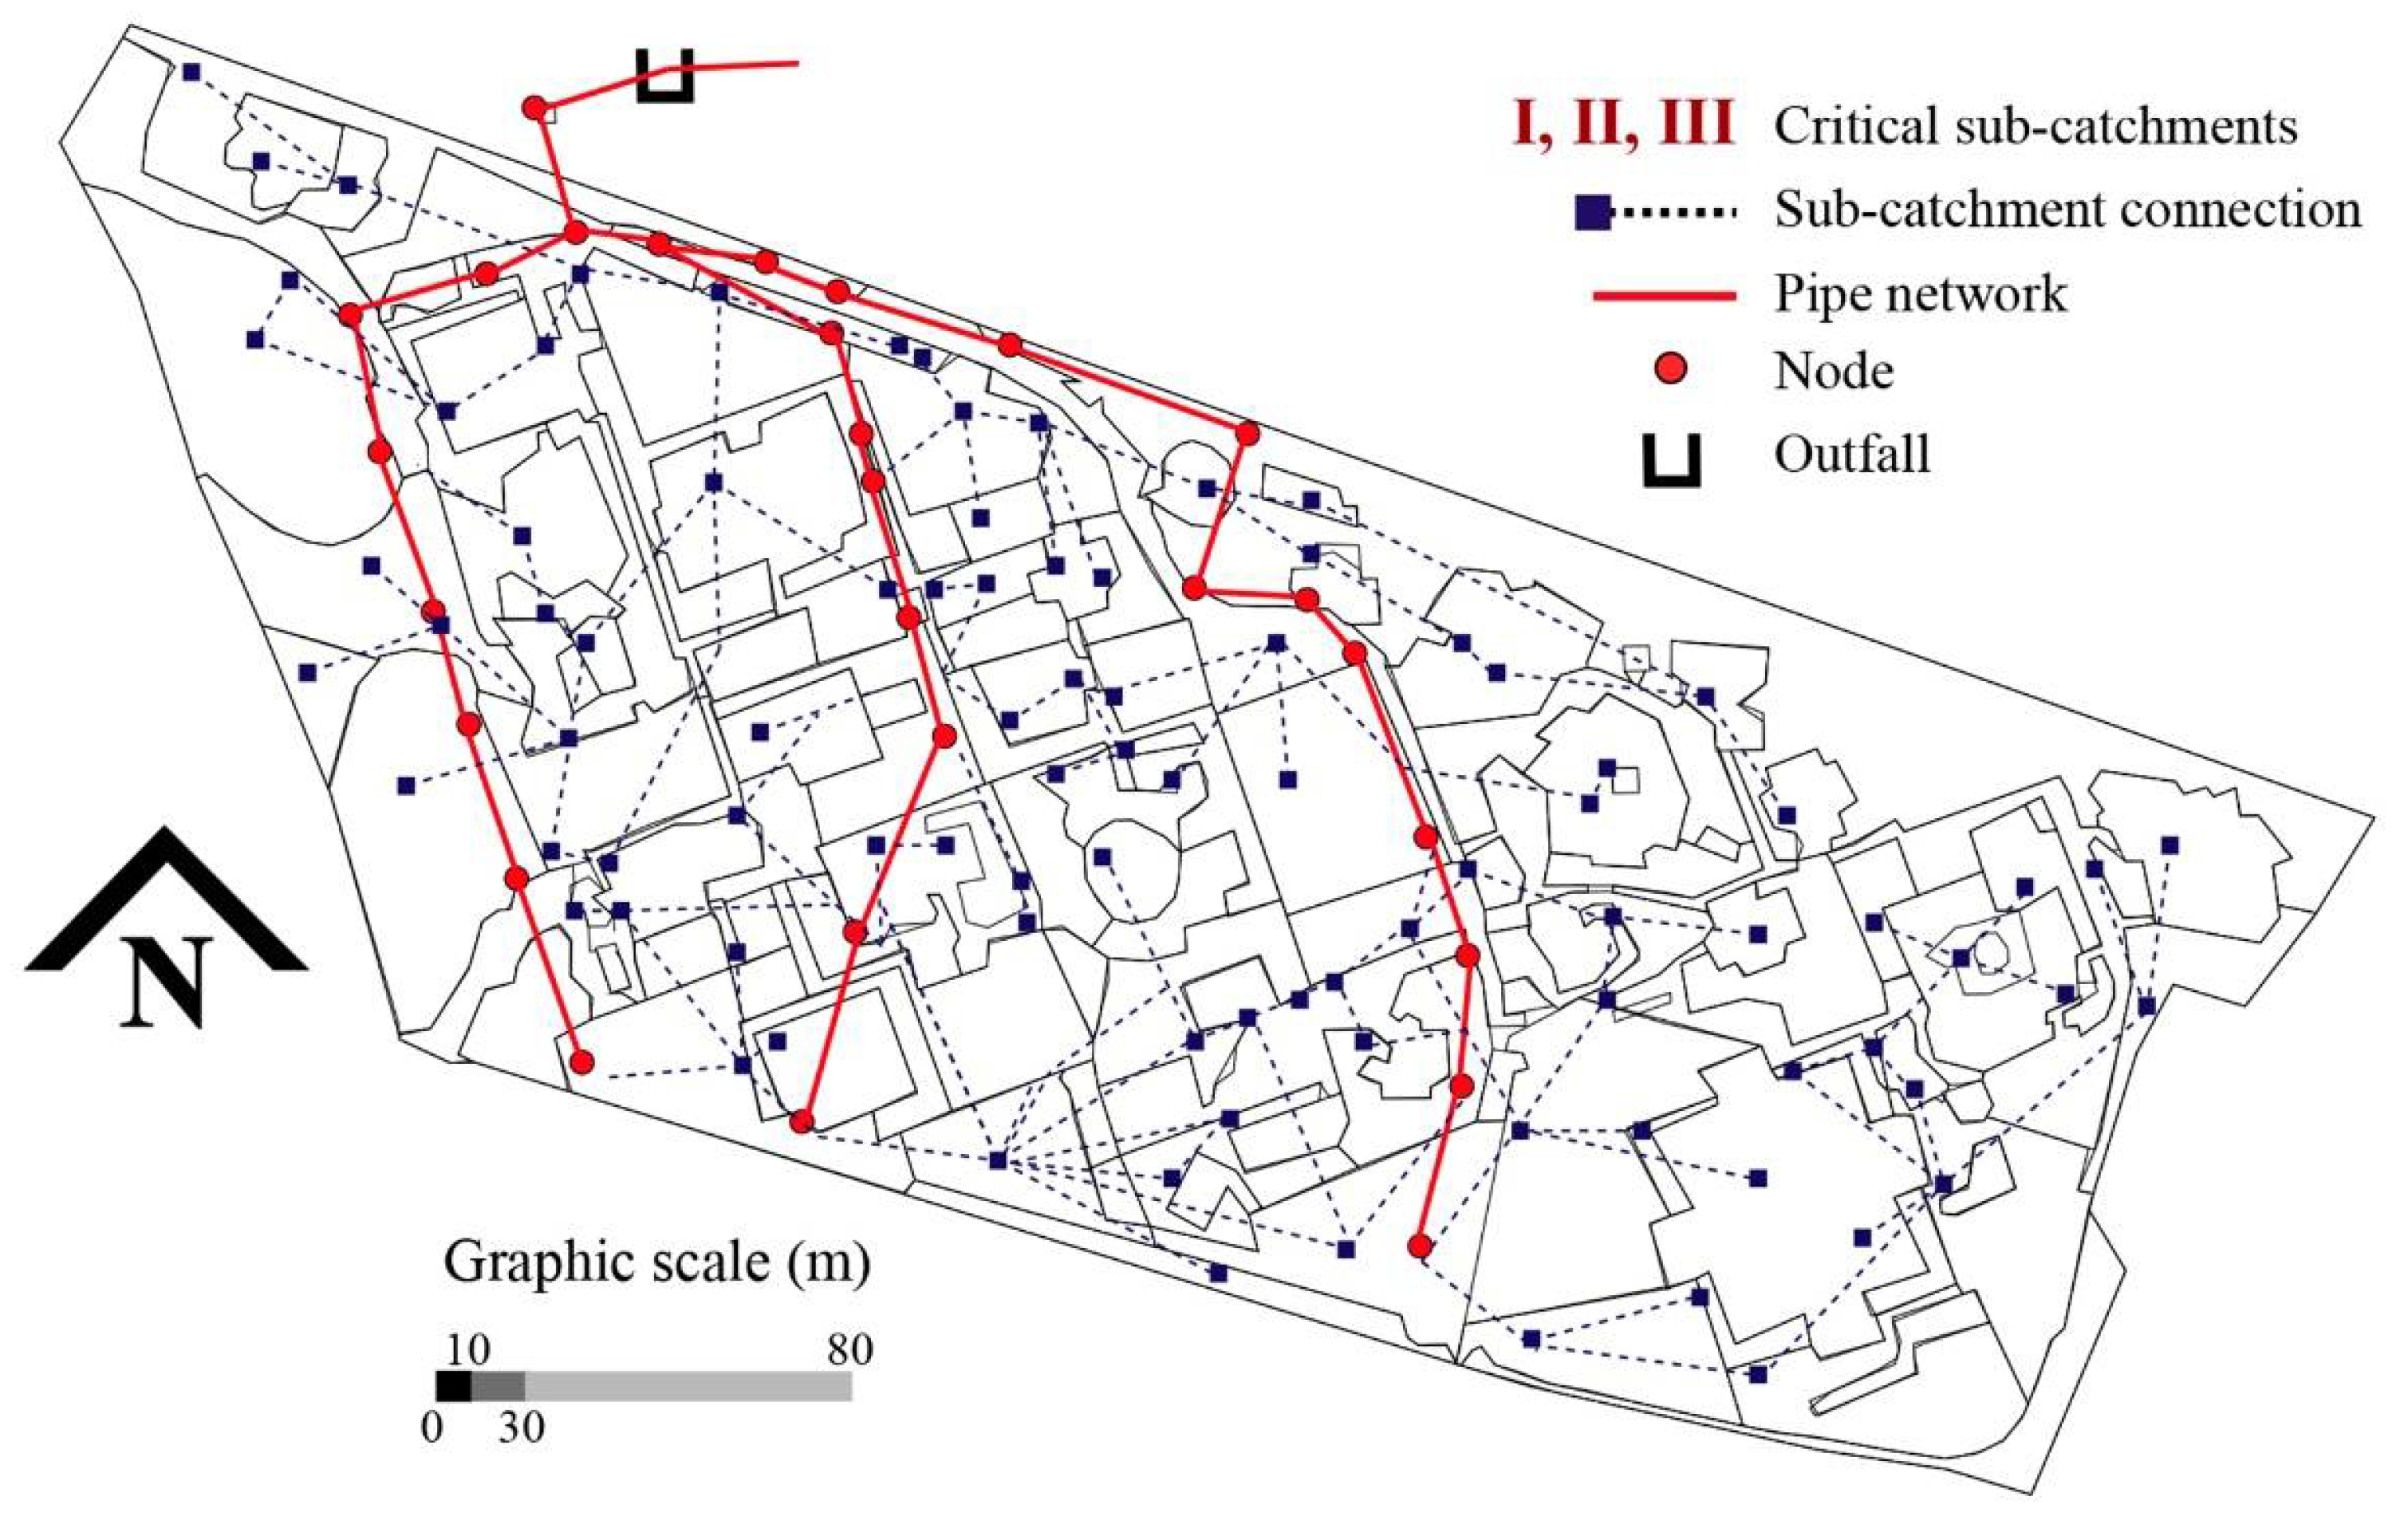
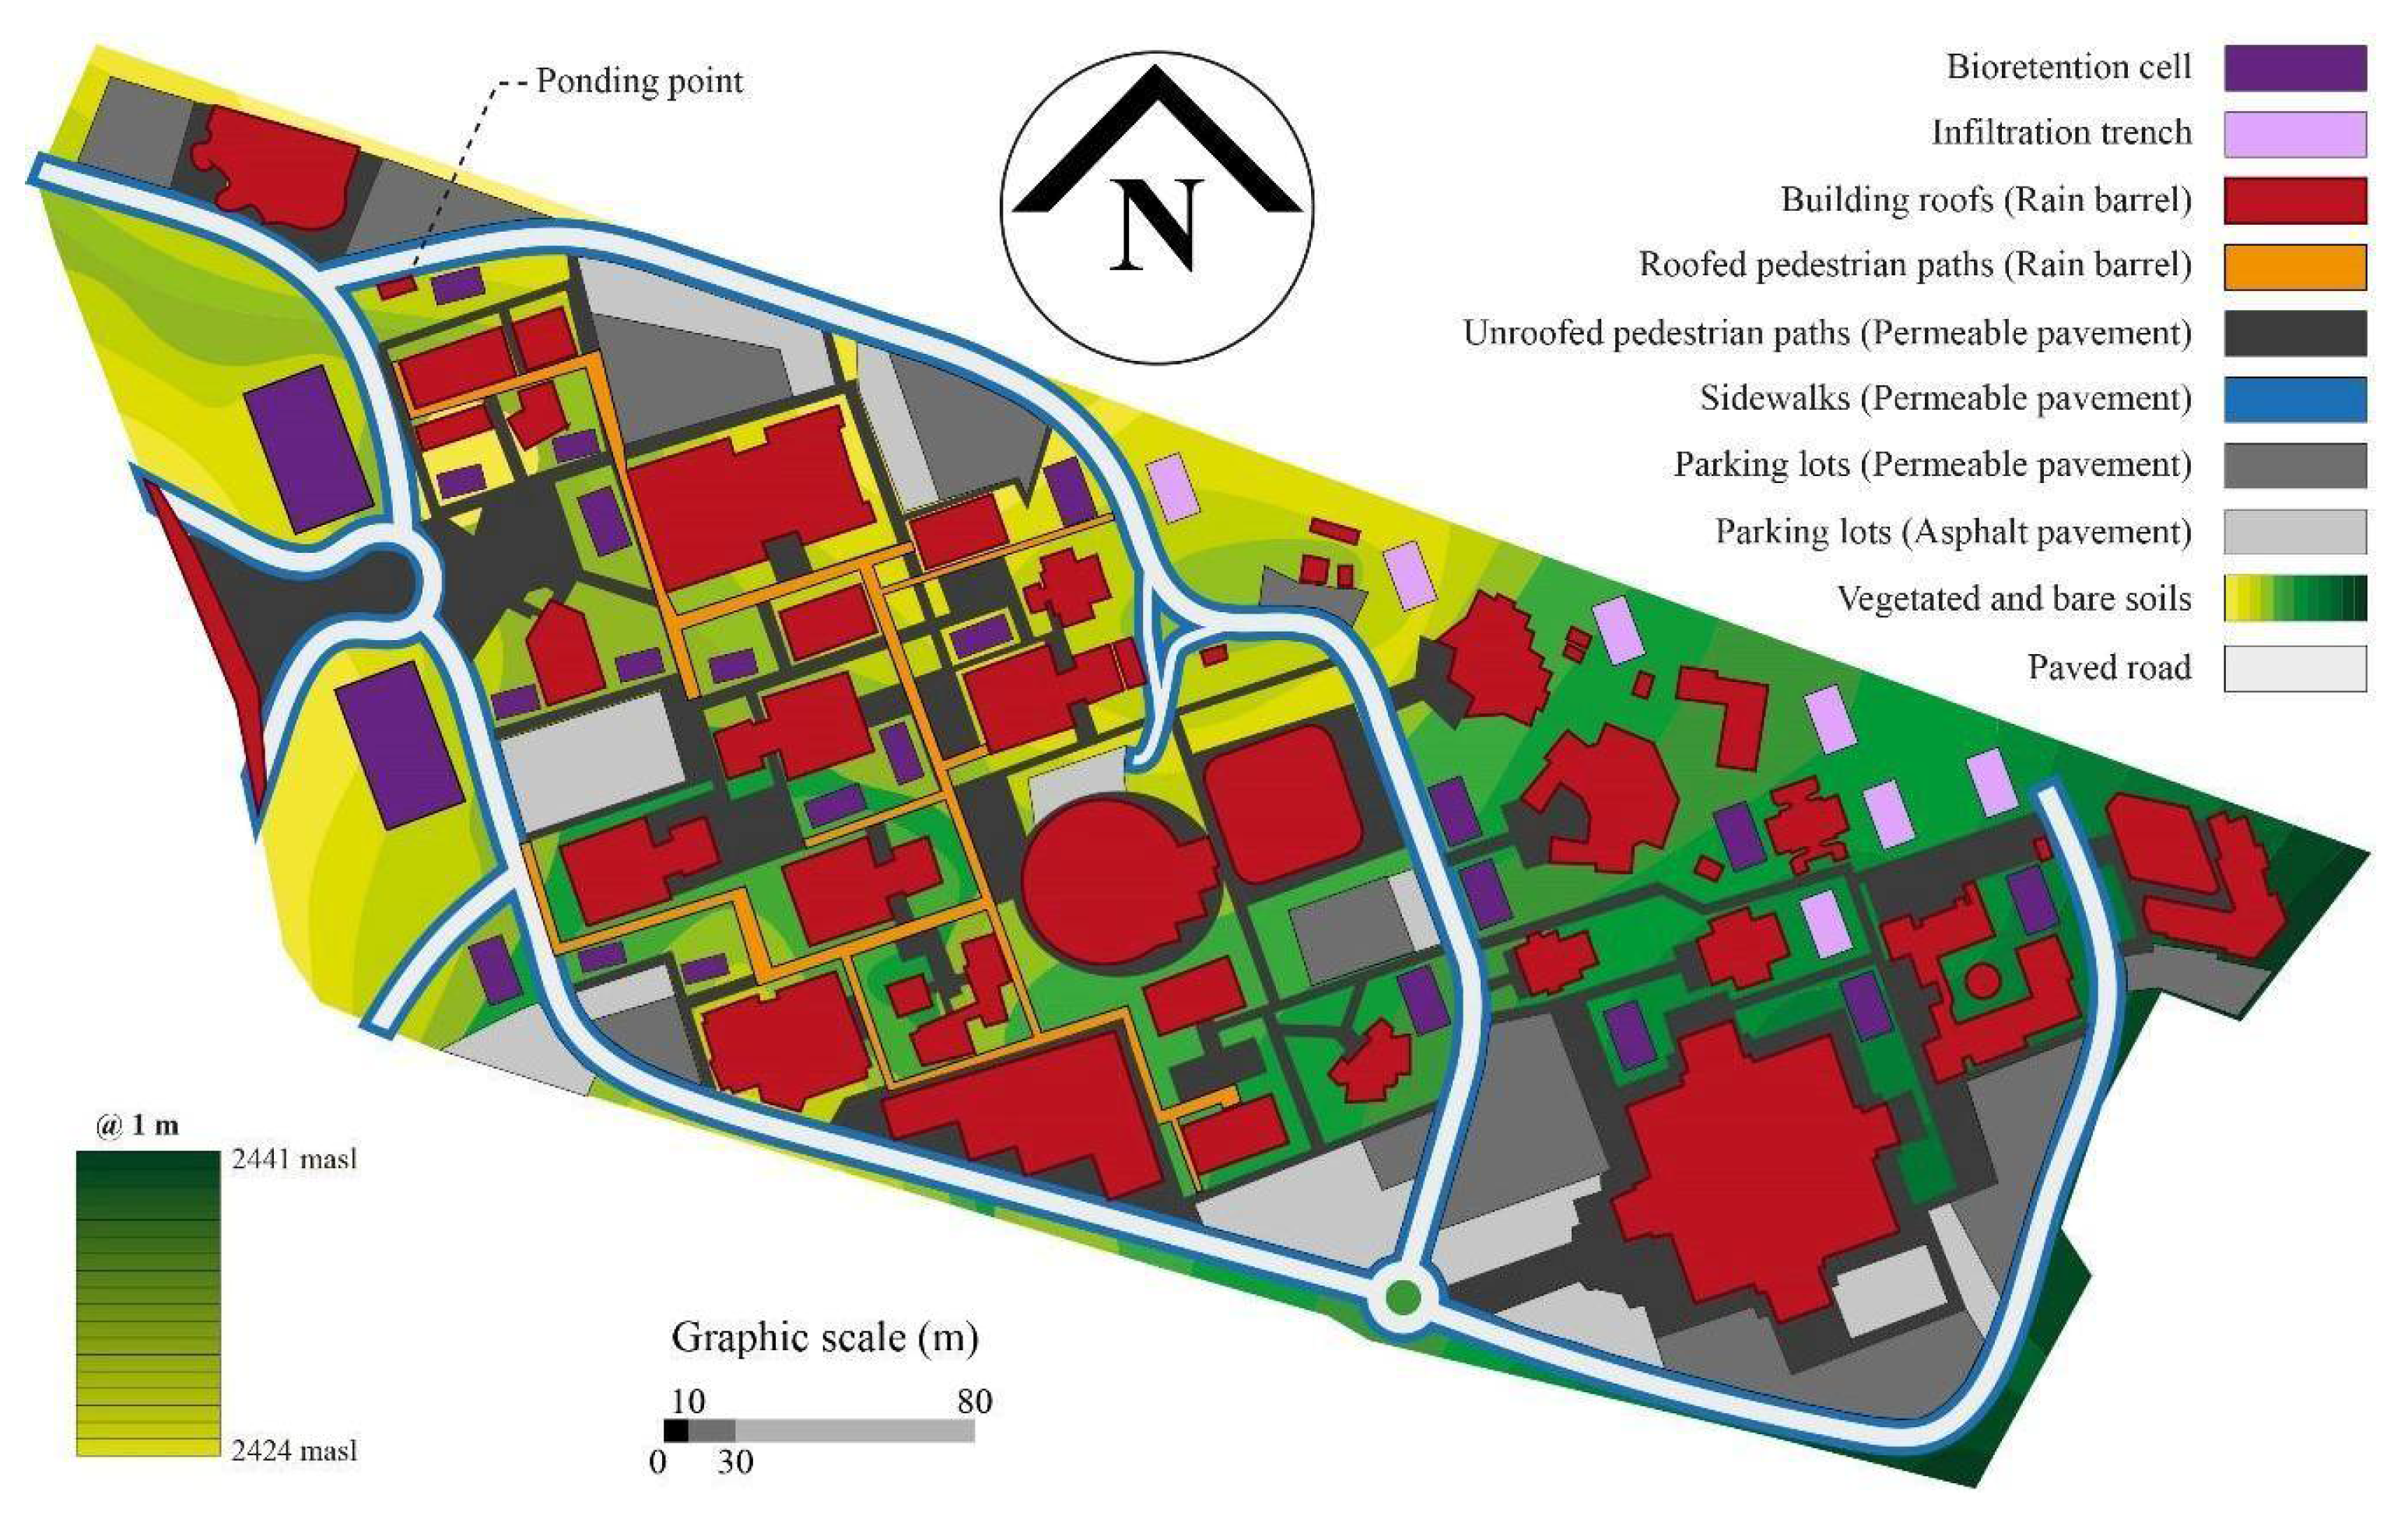
3.1. Study Area

The study area is a micro watershed situated at the Autonomous University of the State of Hidalgo (Figure 1), which is between the coordinates 20°05′47″ north latitude and 98°42′37″ west longitude, at 2426 m above sea level. The campus belongs to the municipality of Mineral de la Reforma, in the central-southern region of the state of Hidalgo, Mexico. Daily rainfall records gathered by the Pachuca Observatorio climatological station (station ID 1322) for the 1972–2018 period were taken from the CLICOM database [16]. On an average annual basis, the air temperature is 14.6 °C, and the precipitation is 375.9 mm. During the rainy season (from April to September) [17], floods often occur from the high to the low-lying zones and are dominated by the topographic slope and soil use. Based on the latter, the micro watershed can be divided into the following influencing zones: (a) high zone, (b) intermediate zone, and (c) low zone. Each of these has different ratios of impermeable to permeable area, which can determine their runoff generation potential or their mitigation capacity through the infiltration into the subsoil and their potential to adapt to LIDs. In turn, each zone is subdivided (A1, A2, and so forth) since the primary runoff deviates in two directions, from the high zone to the low zone. These zones can be observed in Figure 1, while their physical descriptive characteristics are included in Table 1.
From these three zones, critical surfaces were identified due to their flooding susceptibility during the rainy season. These critical surfaces are identified as sub-catchments I, II, and III, as presented in Figure 2. These sub-catchments are highly impervious because they consist, for the most part, in building roofs, pedestrian paths, and parking lots covered with asphalted pavement.

3.2. Selected Storm Events

During the last 10 years, atypical rains (one to two per year) have been observed with short-term rainfall depths (i.e., higher than 30 mm). A previous study in the same city determined that these atypical rains were due, among other factors, to high variability in the historical rainfall regime (intra-annual variation ranged between 0.50 and 1.73) [18]. Although there are no available historical records of hourly rainfall, these last between approximately 60 and 180 min, with intensities of 37 mm/h in the zone [19]. This value was employed in this study to define the time series of the intensity selected as a reference to model the runoff behavior under different urbanized scenarios. The selected rainfall duration was set at 1.5 h with intervals of 5 min because durations comprised between 60 and 90 min were signaled as the most frequent in the study zone [19]. Due to the lack of continuous measurements in the area, in this study the rainfall event recorded on the sampling date (30 mm) and the rainfall the following day (9 mm) were selected as model storm events. This criterion was chosen because it corresponds to a first-flush quality analysis performed in this study, which can be representative of the highest pollutant concentrations expected [20]. Another limitation for this modeling is that there is only one climatological station near the study area. The other neighboring stations are more than 20 km away, so reliable data could not be obtained to calibrate the model either. Therefore, since SWMM 5.1-EPA allows one to model short-duration rains, and based on local empirical experience, we proposed the following: first, the precipitation for two consecutive days (30 and 9 mm) was considered the real event, and second, another scenario with precipitation of 39 mm for one day was considered an extreme event. A return period (Tr) of less than 10 years was considered for small urban drainage works, as recommended by a study carried out in an area very close to the study area [21]. The first storm event seeks to identify the hydraulic behavior of the area when its surface is saturated after two consecutive days of rain. In contrast, the second storm event is intended to recognize the hydraulic capacity of the site under short-term heavy rains.

3.3. Simulated Urban Development Scenarios

Three urban scenarios were simulated: A, a conventional (baseline or business-as-usual) urban development scenario; B, an ideal scenario considering the hypothetical application of LID to the current situation; and C, a more realistic scenario where only the most feasible LID solutions were considered. These scenarios were designed according to prior and current urban planning, the existing land use patterns, and planned runoff management strategies. Scenario A was considered for constructing the baseline model, against which the LID-based scenarios (B and C) were compared.

3.3.1. Conventional Urban Development Scenario (A)

The conventional urban development scenario (A) only depicts the campus’s current development. Georeferenced information from the area of interest was extracted using Google Earth Pro.Ink. Land use cover and scale were presented in Figure 1 as well. The campus spans 303,669.24 m2 with an average slope of 2.8% and a maximum length of 1259 m. The main land uses of the study area are vegetated and bare soils (167,475.57 m2, 55.15%), building roofs (50,250.37 m2, 16.55%), parking lots (43,660.08 m2, 14.38%), paved roads (28,584.72 m2, 9.41%), sidewalks (3986.47 m2, 1.31%), unroofed pedestrian paths (5036.98 m2, 1.66%), and roofed pedestrian paths (4675.05 m2, 1.54%) (Figure 1). There is a Phaeozem soil type with a sandy clay texture, corresponding to the hydrological classification of a Group C soil [22], in open space conditions with coverage between 50–75% and Curve Number of 79. Due to the high-density land use, a general runoff coefficient for commercial and/or intensive use of 0.72 was considered [23]. The rocky substrate where the study area is located is made up of 400 m thickness of igneous rocks covered by alluvial material (200 m) with very low permeability [24]. The water table is located at a depth of 180 m, so its recharge does not have a direct influence on the artificial infiltration strategies suggested in this work. Based on these land-use types, the micro watershed was divided into 162 sub-catchments. From topographic and pipe collector network datasets, 32 sub-catchment connections and one outfall were included in the model (Figure 2).

3.3.2. Urban Development Scenario with LID Practices (B)

Due to recent changes in the urbanization of the campus, some land uses were modified from scenario A: vegetated and bare soils (164,593.63 m2, 54.20%), building roofs (56,680.44 m2, 18.67%), and parking lots (40,111.94 m2, 13.21%). The rest of the land uses remained unchanged. This scenario includes a set of potential LID devices (rain barrels, permeable pavements, infiltration trenches, and bioretention cells) applied to the impervious areas directly associated with stormwater runoff, as presented in Figure 3. These infiltration-based devices are well-suited for arid and semi-arid climates [25] and were included in the SWMM model as described below.
  • Porous pavement. This LID solution was hypothetically implemented in 100% of the sidewalks and pedestrian paths and 70% of parking lots and paved roads within the campus. It was contemplated that the remaining 30% would be destined for the transit and parking of heavy vehicles. The SWMM software assumed that the porous pavement functioned as a continuous system and without obstruction problems.
  • Rain barrels. It was proposed that rain barrels capture 50% of runoff generated on the campus buildings’ roofs with a maximum area of 5125 m2 and a minimum area of 96 m2. The remaining 50% of the harvested runoff was directed to permeable surfaces (i.e., vegetated and bare soils; Figure 3). The capacity of each rain barrel was established according to the catchment area of each building roof as follows: 2500 L for 90–250 m2 roofs; 5000 L for 250–500 m2 roofs; 10,000 L for 500–1000 m2 roofs; 15,000 L for 1000–3000 m2 roofs; 20,000 L for 3000–4500 m2 roofs; and finally 22,000 L for 4500–5500 m2 roofs. These capacities are based on commercial devices, not in their desirable dimensions, because it would require more infrastructure changes.
  • Bioretention cells and infiltration trenches. Bioretention cells were located to intercept the main runoff conveyances generated in the campus; they were preferably situated in existing vegetated spaces, while infiltration trenches were placed in locations where soils were left bare. For the dimensioning of bioretention cells and infiltration trenches, it was considered that 10% of the available area (vegetated and bare soils) was destined for these LID technologies [26]. We proposed that bioretention cells and infiltration trenches have storage volumes between 350 to 1500 L, depending on the available surface. The surfaces selected in the SWMM software ranged between 18 and 50 m2 to capture up to 50% of the runoff.

3.3.3. Realistic Urban Development Scenario with LID Practices I

This scenario was conceived to consider only the most feasible LID solutions among the whole set of devices proposed in scenario B. Although in this preliminary study any formal economical assessment was made, we considered that the substitution of the existing pavements by porous pavements in 100% of the sidewalks and pedestrian paths and 70% of parking lots and paved roads was the most labor-intensive LID solution. That is why, in the modeling of this realistic scenario, porous pavements were not included, being kept the rest of the LID devices, which are installed easily in the proposed non-built surfaces (bioretention cells and infiltration trenches). At the same time, rainfall harvesting does not modify the rooftops configuration. In particular, rain barrels are an affordable water conservation technique that is increasingly being used in the Mexican context for alternative water supply [21], and its is promoted by official instances [27]. So, scenario C is almost identical to that presented in Figure 3, excepting the porous pavements signaled by the dark gray and blue zones. However, it was proposed to intercept 50% of the rain on rooftops, so the remaining 50% will continue to discharge into the hydrosanitary network (this means that the water will not be diverted to the adjoining LIDs, namely, bioretention cells and infiltration ditches).

3.4. SWMM Model Setup

3.4.1. Hydrological and Hydraulic Model Construction

A model was constructed using version 5.1 of the U.S. Environmental Protection Agency SWMM (SWMM 5.1-EPA). This program generates a hydrological and hydraulic model in a one-dimensional format and calculates surface runoff hydrograms based on the Manning and continuity equations [28]. This non-linear method is based on the following equation [29].
Q = 1 n W ( d d s ) 5 / 3 S 1 / 2 ,
where Q = peak flow, in m3/s; n = the Manning roughness coefficient; W = basin width, in m; d = rainfall height, in mm; ds = surface storage height, in mm; and S = average slope of themicro watershed. The non-linear method is well suited for calculating surface runoff from urban, suburban, and rural areas of any size. It is also an appropriate method for the analysis and design of urban sustainable drainage systems [28]. With this same approach, the coefficients and percentage of runoff associated with the materials that make up the roofs of each of the buildings were related for their inclusion in the calculation of runoff generated through the Manning equation.

3.4.2. Graphic Representation

The hydrological and hydraulic model construction began by developing the site’s graphic representation with the information collected from urban hydrology and the hydrosanitary infrastructure. First, a simplified pipe collector network was established, and then the hydraulic part of the computational model was constructed. This information was mainly taken from a network plan, including information collected from the available hydrosanitary infrastructure to establish sub-catchments, storage structures, nodes, and ducts in the SWMM 5.1-EPA. Figure 2 shows how these elements were traced. The sub-catchments and pipe collector network were exported to Google Earth satellite images with their coordinates, and the AutoCAD program was used to carry out this process with greater precision.

3.4.3. Parameter Definition

Both calculated and obtained data were entered in the outline of the model that was previously developed. Initially, the rainfall data were defined in the model, in the “Rain Gages” tab in the hydrology section of the program taskbar. The designed storm events and the hydrological parameters were defined in the sub-catchments of the model. Surface area (ha), slope percentage, imperviousness percentage, basin width, and infiltration (defined by the Horton method) were determined in each sub-catchment. The hydrological information of the sub-catchments determined the runoff using the non-linear method (Equation (1)). To make the interaction between these peak flows with the plotted model possible, the hydraulic properties in the nodes, ducts, and storage units of the model were defined. Additionally, the runoff coefficients associated with each of the materials used in the buildings were considered, highlighting the slope of each of the roofs, the surface, and the percentage of roughness associated with surface runoff.

3.4.4. Simulation Execution

Once the hydrological and hydraulic parameters of the model were defined, it was executed. Some default SWMM modeling parameters were changed to consider some suggested features of the LID devices to be built in Mexico, particularly in arid and semi-arid climates [1,30]. These changed values are presented in Table 2.

3.5. Field Water-Quality Assessment

Field monitoring of the runoff quality was performed on 4 June 2019, during the first storm event of the rainy season, which was preceded by 274 days of drought. The rainfall depth was 30 mm the first day and 9 mm the following day [17], but we do not have the full description of the rainfall pattern nor the precise duration of the storm event. Sampling was carried out at the study site location where excessive rainfall resulted in the most critical ponding. The location of this ponding point is presented in Figure 1. Single-grab samples of about 250 mL were obtained during the first part of the storm, as soon as the runoff water was deep enough to be sampled, to collect the first flush. These single-grab samples were composited in one nitric acid-washed plastic container until a total volume of 3 L was reached. This was accomplished in about 1 h. The collected sample was transported to the laboratory and maintained at 4 °C until analysis.
Samples were analyzed in triplicate and following the standard methods [31] unless otherwise indicated. The parameters analyzed were total suspended solids (TSS), chemical oxygen demand (COD), ammonium (NH4+), nitrites (NO2), nitrates (NO3; [32]), dissolved orthophosphates (PO43−), and the concentrations of manganese (Mn) and lead (Pb). Before analyzing these heavy metals by flame atomic absorption spectrometry using a SpectrAA spectrophotometer (Varian 880, Palo Alto, USA), the samples were digested using a microwave oven (CEM Mars X, Markham, Canada).

4. Results and Discussion

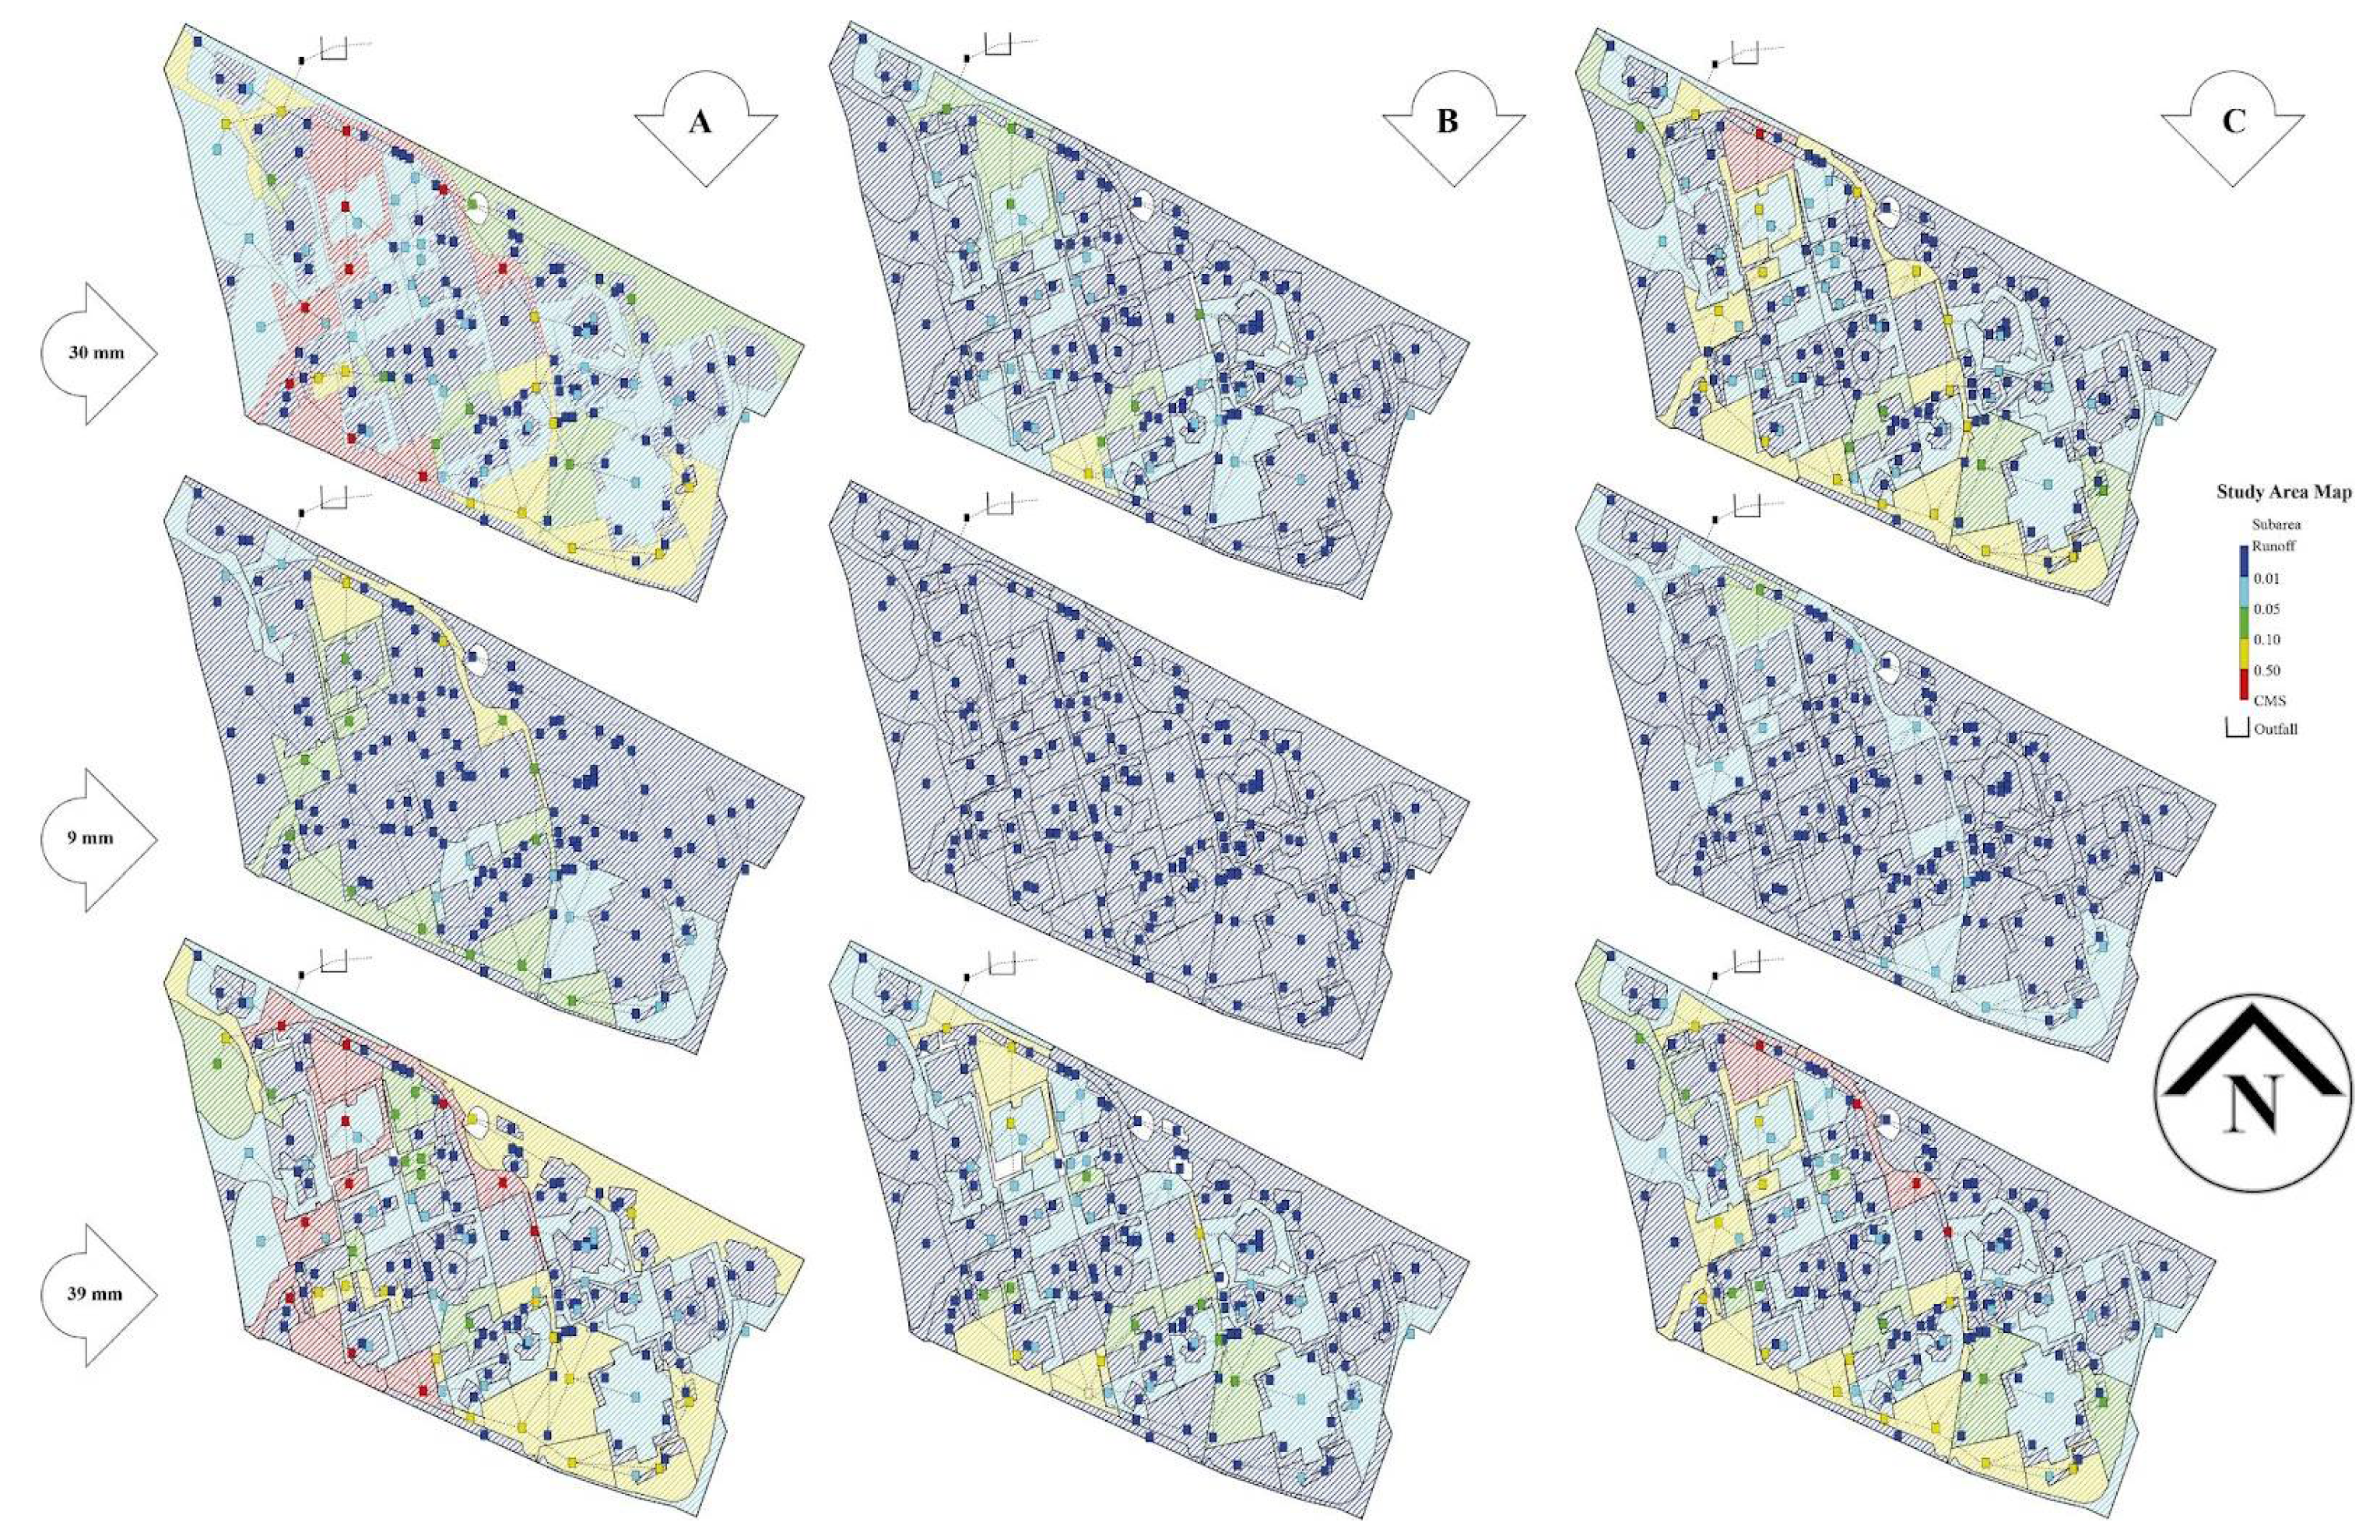
4.1. Model Simulation

As stated before, scenario A describes a conventional urbanization pattern associated with large impervious areas, thereby leading to frequent floods at the site’s low-lying zones during the rainy season. The simulation of this model allowed us to evaluate the hydraulic capacity of the site under heavy storm events (39 mm) occurred in one day or in two consecutive days to identify and locate appropriate LID solutions. The resulting profiles of flow and volume in the outfall (Figure 2) simulated for the 39-, 30-, and 9-mm storm events were included as Supplementary Material. In the case of the 39-mm storm event, it generated a runoff of 7773 m3, while the peak flow was 0.610 m3/s. For the 30-mm storm the simulated runoff and the peak flow rate were 5338 m3 and 0.400 m3/s, respectively. For the 9-mm storm event, these variables were 615 m3 and 0.05 m3/s, respectively.
Figure 4 shows the computational simulations of the urban runoff behavior on the surface and through the campus infrastructure 1.5 h after the beginning of the two designed storm events. Computational simulations of urban runoff behavior through the study site 1.5 h after the start of the two designed storm events indicated the relationship between rainfall depths, runoff water, surface flow, and runoff volumes retained by LIDs (rain barrels, infiltration ditches, and bioretention cells). Through different colors, the variations in runoff flow ranging from blue (low runoff volume, 0–0.1 m3/s) to red (high runoff volume, >0.5 m3/s) were indicated (Figure 4). In this way, the areas most prone to floods under the different rainfall depths simulated (30, 9, and 39 mm) are displayed, which further confirms the localization of the highest ponding depths experienced during the rainy season.
Simulations showed that in scenario A the urban drainage network does not have the capacity to manage the runoff generated in the study area. According to Figure 4, floods are an evident problem in the study site since they occur a short time after the beginning of the two storm events simulated: the first day of the two-day event (after the rainfall of 30 mm), and after the rainfall of 39 mm. Floods occurred despite the implementation of previously planned hydraulic evacuation works, thus accentuating the need for complete restoration of the water cycle through the implementation of LID solutions. In the second day of the two-day storm event, the 9 mm rain depth did not lead to floods even though the catchment surface was still saturated after the previous heavy rainfall. From previous empirical observations, three sub-catchments with large-scale flood problems (named I, II, and III) had been identified (Figure 2). Surface runoff, infiltration, total precipitation, and final peak flow 1.5 h after starting the two simulated storm events are shown in Table 3 for both scenarios and for the three critical sub-catchments.
According to the results shown in Table 3, as total precipitation increases, it directly affects runoff. Scenario A presents high volumes of runoff associated with the 30- and 39-mm storm events, making it clear that the runoff transport capacity of the site would be compromised after severe rains. The highest peak flows that occurred were in sub-catchment II because it receives the volume of runoff coming from the upper part of the micro watershed, which comprises 28.94% of the total surface of the campus. This zone has an average runoff coefficient equal to 0.94 and an average slope of 3.75%. Its great capacity to contribute to the runoff in this critical area is due to the relationship between the runoff area and its impermeable surface (1:0.57), and its physical characteristics. In general, according to Figure 4, peak flows and runoffs greater than 0.5 m3/s are two crucial indices for the forecast of urban floods since the resulting total runoff volume is abundant due to the null infiltration capacity of the sub-catchments involved.
Figure 4 also shows the simulation results that contemplate the insertion of LID as a sustainable alternative. Among the technologies included were permeable pavement, infiltration trenches (7), bioretention cells (13), and rain barrels (11), as signaled in Figure 3. These technologies were found to be well suited for modeling the scenario under hydrological restoration conditions since they have been recognized as strategies of the integrated management of basins that provide natural retention, treatment, and water resources in semi-arid climates [25,33]. Therefore, in the modeling, LID technologies were placed throughout themicro watershed. In each of two critical sub-catchments (I and II), a bioretention cell was placed due to the availability of unbuilt spaces and favorable terrain slopes supporting the runoff chanelling into the proposed LID. In critical sub-catchment III, which is heavily built up and mostly impervious, only permeable pavements could be located.
In a general way, LID devices satisfactorily fulfilled their function by retaining or infiltrating water both the first day of the two-day event (after the rainfall of 30 mm) and the only day after the rainfall of 39 mm. As a whole, the 32 LID units promoted the retention and infiltration of a fraction of the rainfall, leading to the reduction of runoff and peak flow (Table 3). With this, it was determined that the implementation of these technologies could be a sustainable solution for runoff management in the study area.
A notorious decrease in runoff (100% in sub-catchment III -30 mm-, and in sub- catchments I, II, and III -9 mm-) and peak flows (100% in sub-catchment II -30 mm- and in sub-catchment III -9 mm-) generated in the university campus can be highlighted from scenario B’s simulation since no floods occurred for any of the designed storm events (30, 9, and 39 mm; Figure 4). Therefore, under these hydrological restoration conditions, it is possible to mitigate the urban runoff impact after extreme storm events. This is because the precipitated volumes from the upper and middle parts of the study site could be successfully retained, stored, or infiltrated (166% in sub-catchment II -30 mm-, and 119% in sub-catchment III -9 mm-). As mentioned earlier, the area of influence that mainly brings the volume of runoff and peak runoff to sub-catchments I and II has a high percentage of imperviousness (see Figure 1 and Table 1). Therefore, as a control measure, in scenario B, the impermeable surfaces of parking lots, roads, and walkways were replaced with permeable pavement. At the same time, the available green areas were designed to partially intercept the runoff and infiltrate it through rain gardens and infiltration ditches, which significantly influenced its capacity to mitigate flooding. These measures also increased the infiltration capacity from 0 (in scenario A) to 0.84 mm/h as a maximum value, found in sub-catchment II after the 39-mm storm event (Table 3).
In a SWMM-based study in a catchment with monsoon climate in Xi’an City (China), simulations considering the installation of a similar number of LID (36 rain gardens covering 36 ha in total, about 2% of the catchment), the peak flows at the outlet were reduced by 12.9–44.6% under the design storms with Tr of 2, 10 and 20 years, respectively. Similar reductions (12.3–44.2%) of the runoff volume were also simulated [34]. In another study focused on a zone with semi-humid and semi-arid climates (in Handan, China), the effect of two LID devices (green-roofs and infiltration trenches) was simulated. In the simulations, green roofs were implemented in 30% of the total area, while infiltration trenches were placed on both sides of the site roads, in about 20% of the total area. As a result, the peak discharge of the scenario considering the LID installation was reduced by 5.2–39.2% under Tr comprised between 2 and 20 years, while the total runoff quantity diminished by 27.3–29.7% [35]. Another example is the evaluation of flood mitigation in a city with a semi-arid climate (Campina Grande, Brazil) through the combination of green roofs, permeable pavements, and rain gardens. Simulations were carried out placing green roofs in all the institutional and public buildings, permeable pavements in every sidewalk, and bioretention cells in available spaces, and considering Tr of 2 and 5 years. This LID synergy allowed a reduction of 85.72% in the runoff volume [14].
These results demonstrate that, although the contributing drainage areas of proposed LID are small, their number and appropriate location around the total surface make a difference in the total flood volume of the catchment. When all these LID devices are incorporated as a strategy to mitigate runoff, the permeable surface in the area of influence affecting sub-catchments I, II, and III increases from 43 to 61%, with an average runoff coefficient that changes from 0.94 to 0.60. Another favorable function of LID implementation in the study area is that under scenario A, infiltration capacity in sub-catchments I, II, and III is null due to their imperviousness. In contrast, scenario B increases infiltration (166%, 121%, and 184%), contributing to mitigating floods at 30-, 9-, and 39-mm storm events, respectively.
Finally, Figure 4 also shows the effects of the insertion of LID devices in a more realistic schema (scenario C, which contemplates the same set of LID solutions than scenario B excepting permeable pavements). One hour and a half after of the beginning of the two storm events simulated (the first day of the two-day event, after the rainfall of 30 mm, and the only day after the rainfall of 39 mm), some areas of the study site were flooded. In this scenario, the highest runoff (531% higher than in scenario B) and peak flows (590% higher than in scenario B) were presented in sub-catchment I, in which, due to the lack of available space for bioretention cells or infiltration trenches, the preferable LID solution (permeable pavement) was not implemented. Consequently, the infiltration in this sub-catchment under scenario C was null (as in scenario A), while under scenario B (considering the installation of permeable pavements) this variable was estimated at 0.20–0.21 mm/h after the simulation of the three storm events. Nevertheless, in this critical sub-catchment, runoff and peak flows were reduced up to 47% and 44%, respectively, with rainfall depths of 30 and 39 mm and with regard to values simulated in scenario A.
Notably, the infiltration rate in sub-catchment II was higher after the 9-mm storm event (1.87 mm/h) than after the other events (1.66 and 1.64 mm/h after 30-mm 39-mm rainfalls, 11.23% and 12.3%, respectively). An explanation for this is that the low runoff induced by the 9-mm storm event would be also slower than the runoff produced by the other storm events, thereby leading to an enhanced infiltration due to its reduced velocity.
In critical sub-catchment II, infiltration and peak flows were higher in scenario C than the values simulated in scenario B (Table 3). This could be explained by the fact that the high and intermediate zones of the campus include large impervious surfaces intended for parking lots, roads, and sidewalks, which generate high runoff volumes and peak flows. This runoff flows easily to the low zones of the campus, in particular to the sub-catchment II. In scenario B, with LID implementation, the runoff generated in the high and intermediate zones is mitigated by incorporating permeable pavements in the impervious areas already mentioned, while in critical sub-catchment II, infiltration increases concerning scenario A. Under scenario C, in which permeable pavements were omitted, runoff generated in the impervious surfaces of the high and intermediate zones did not decrease as much as in scenario B (compared with scenario A). Consequently, the significant runoff volumes generated by the land use foreseen by scenario C entailed higher infiltration and peak flows in sub-catchment II than the values determined for scenario B. Conversely, peak flows simulated for scenario C were still lower than in case of scenario A.
Scenario C can be seen as a compromise between a sub-optimal (but satisfactory) hydraulic performance and an affordable LID-based strategy, which is also less cost- and labor-intensive [36]. Permeable pavements, whose design (and notably the thickness of the soil layer) was modified according to Mexican design guidelines for arid and semi-arid regions [30] in our simulations, proved to increase the regulating hydraulic capacity of the site in a rather limited way. This was most likely due to these design modifications in the pavement and soil thicknesses. The scarce hydrological benefits of permeable pavements found herein disagree with a recent research concluding that, among a set of LID devices (bioretention cells, permeable pavement, rain barrels, and green roofs), permeable pavements were the most cost-effective option, because they provided a higher reduction of combined sewer overflows for less than the area requirements for bioretention cells [37]. In their study, bioretention cells were found to be the most expensive LID solution due to their considerable spatial coverage, expensive excavation works, and the operation and maintenance costs [37]. So, caution should be taken regarding the current LID Mexican design guidelines for arid and semi-arid zones related to permeable pavements, which must be investigated further and adjusted where appropriate.
Although the optimization of the LID design parameters nor the economical feasibility of these devices was not among the objectives of this work, our results highlight the need of contributing, through modeling techniques, to the validation of new design guidelines, and to the proper selection of the LID solutions to be implemented.

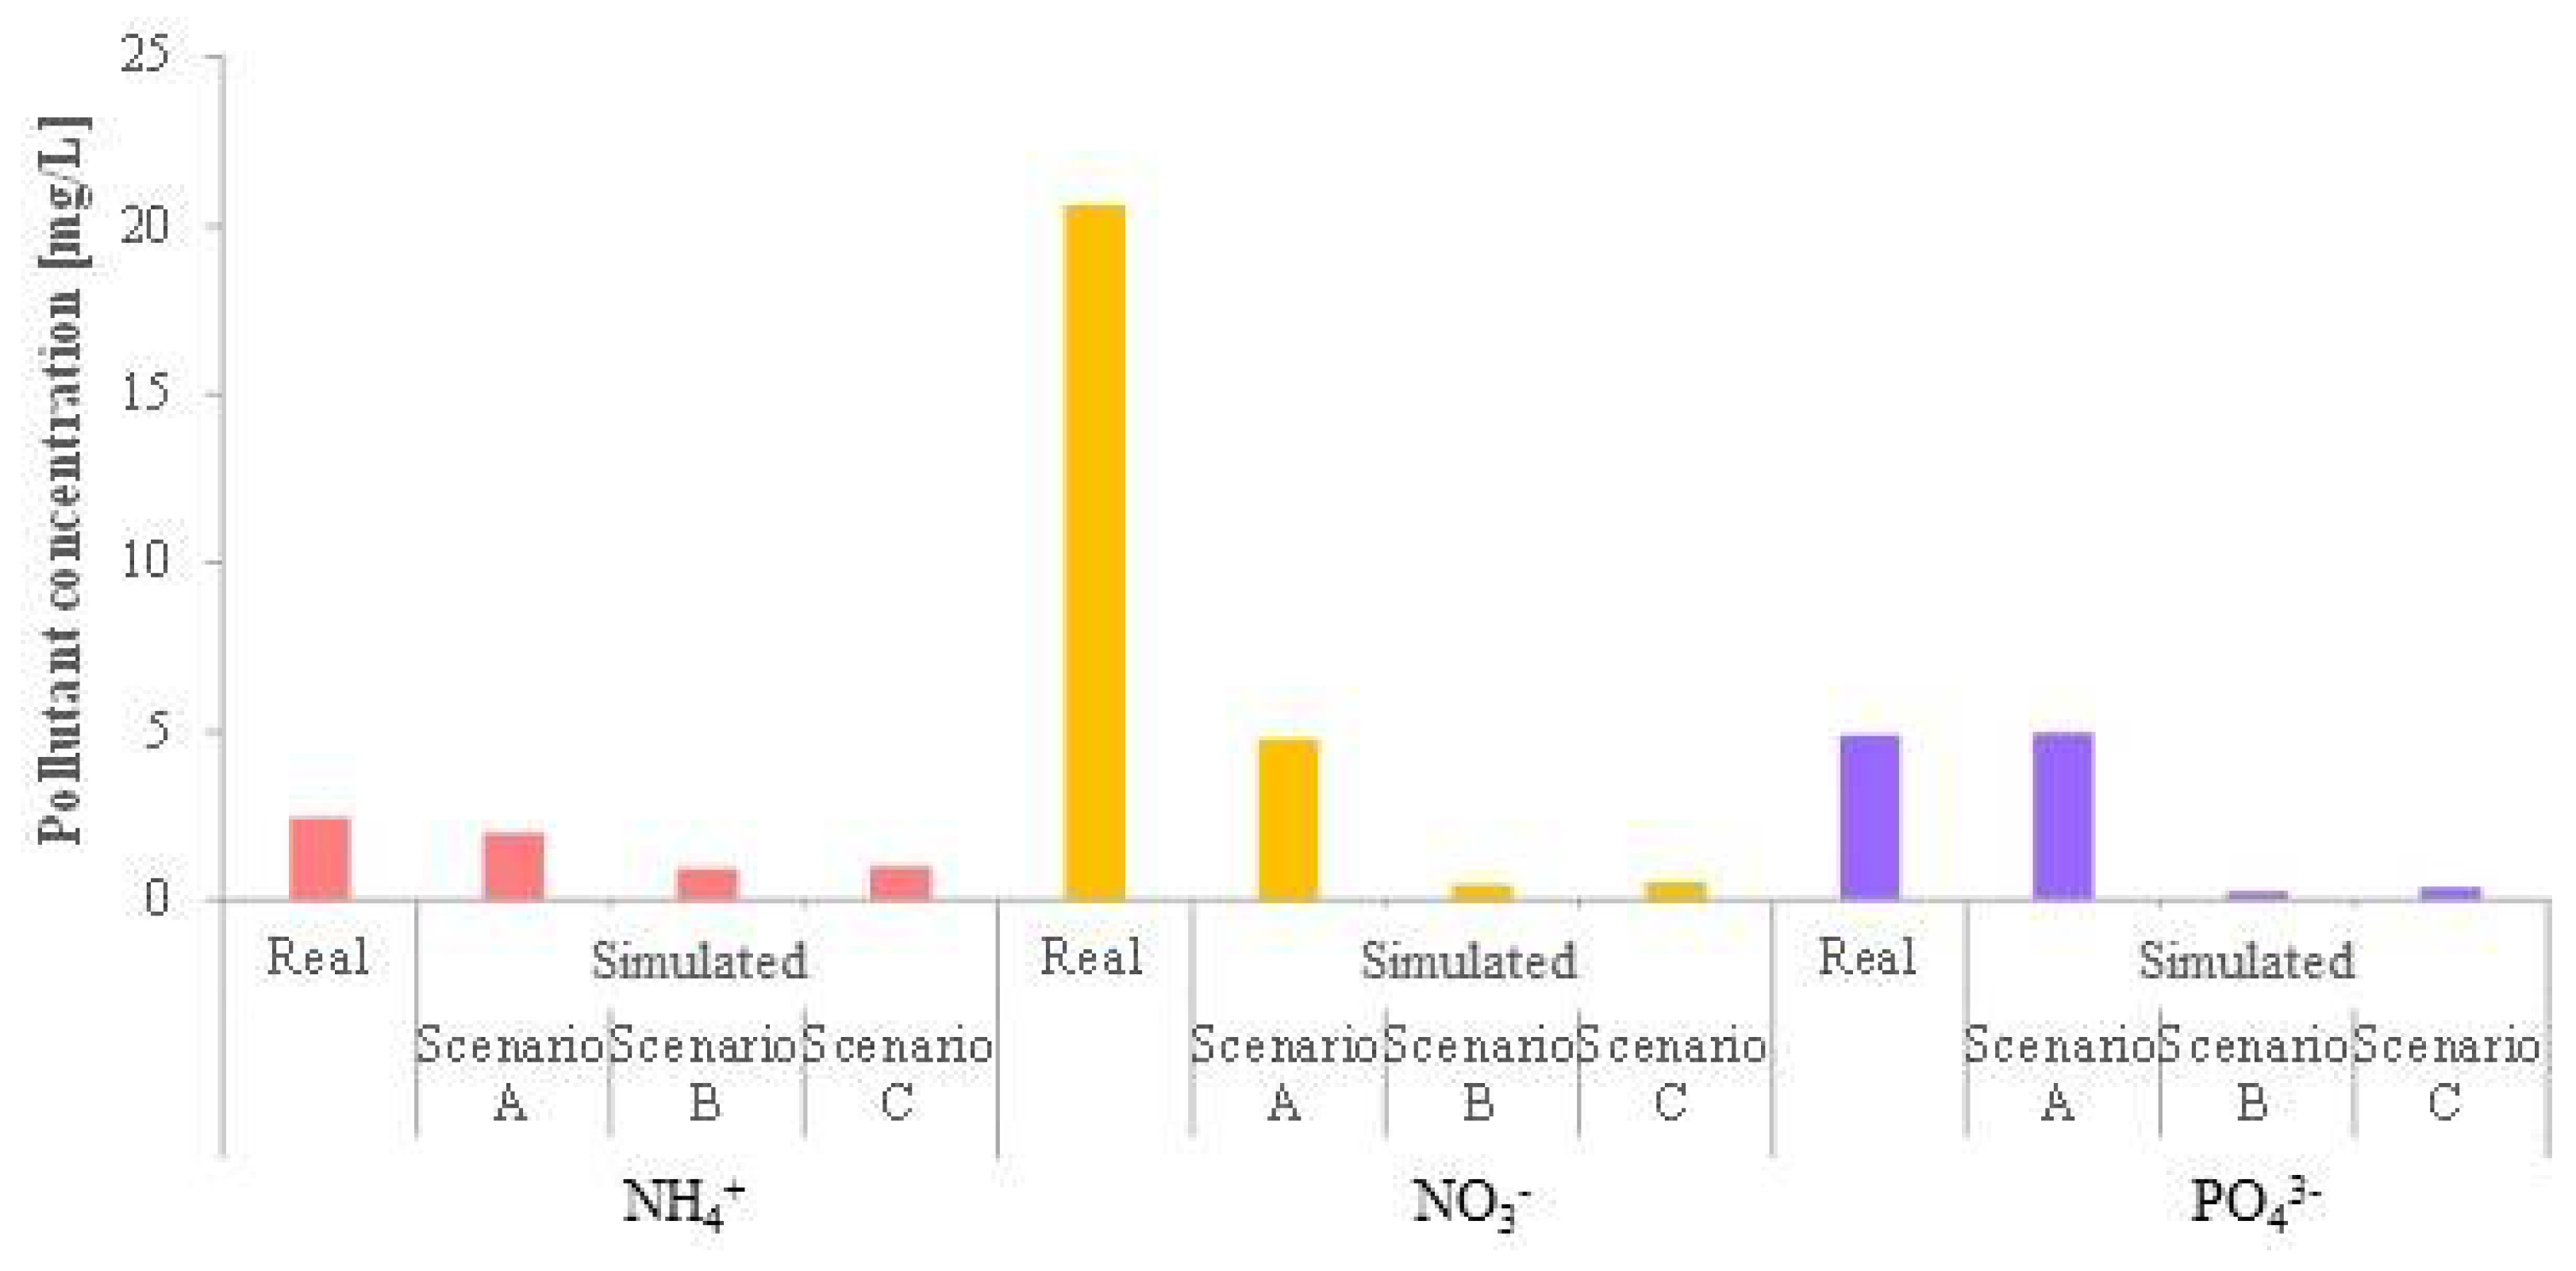
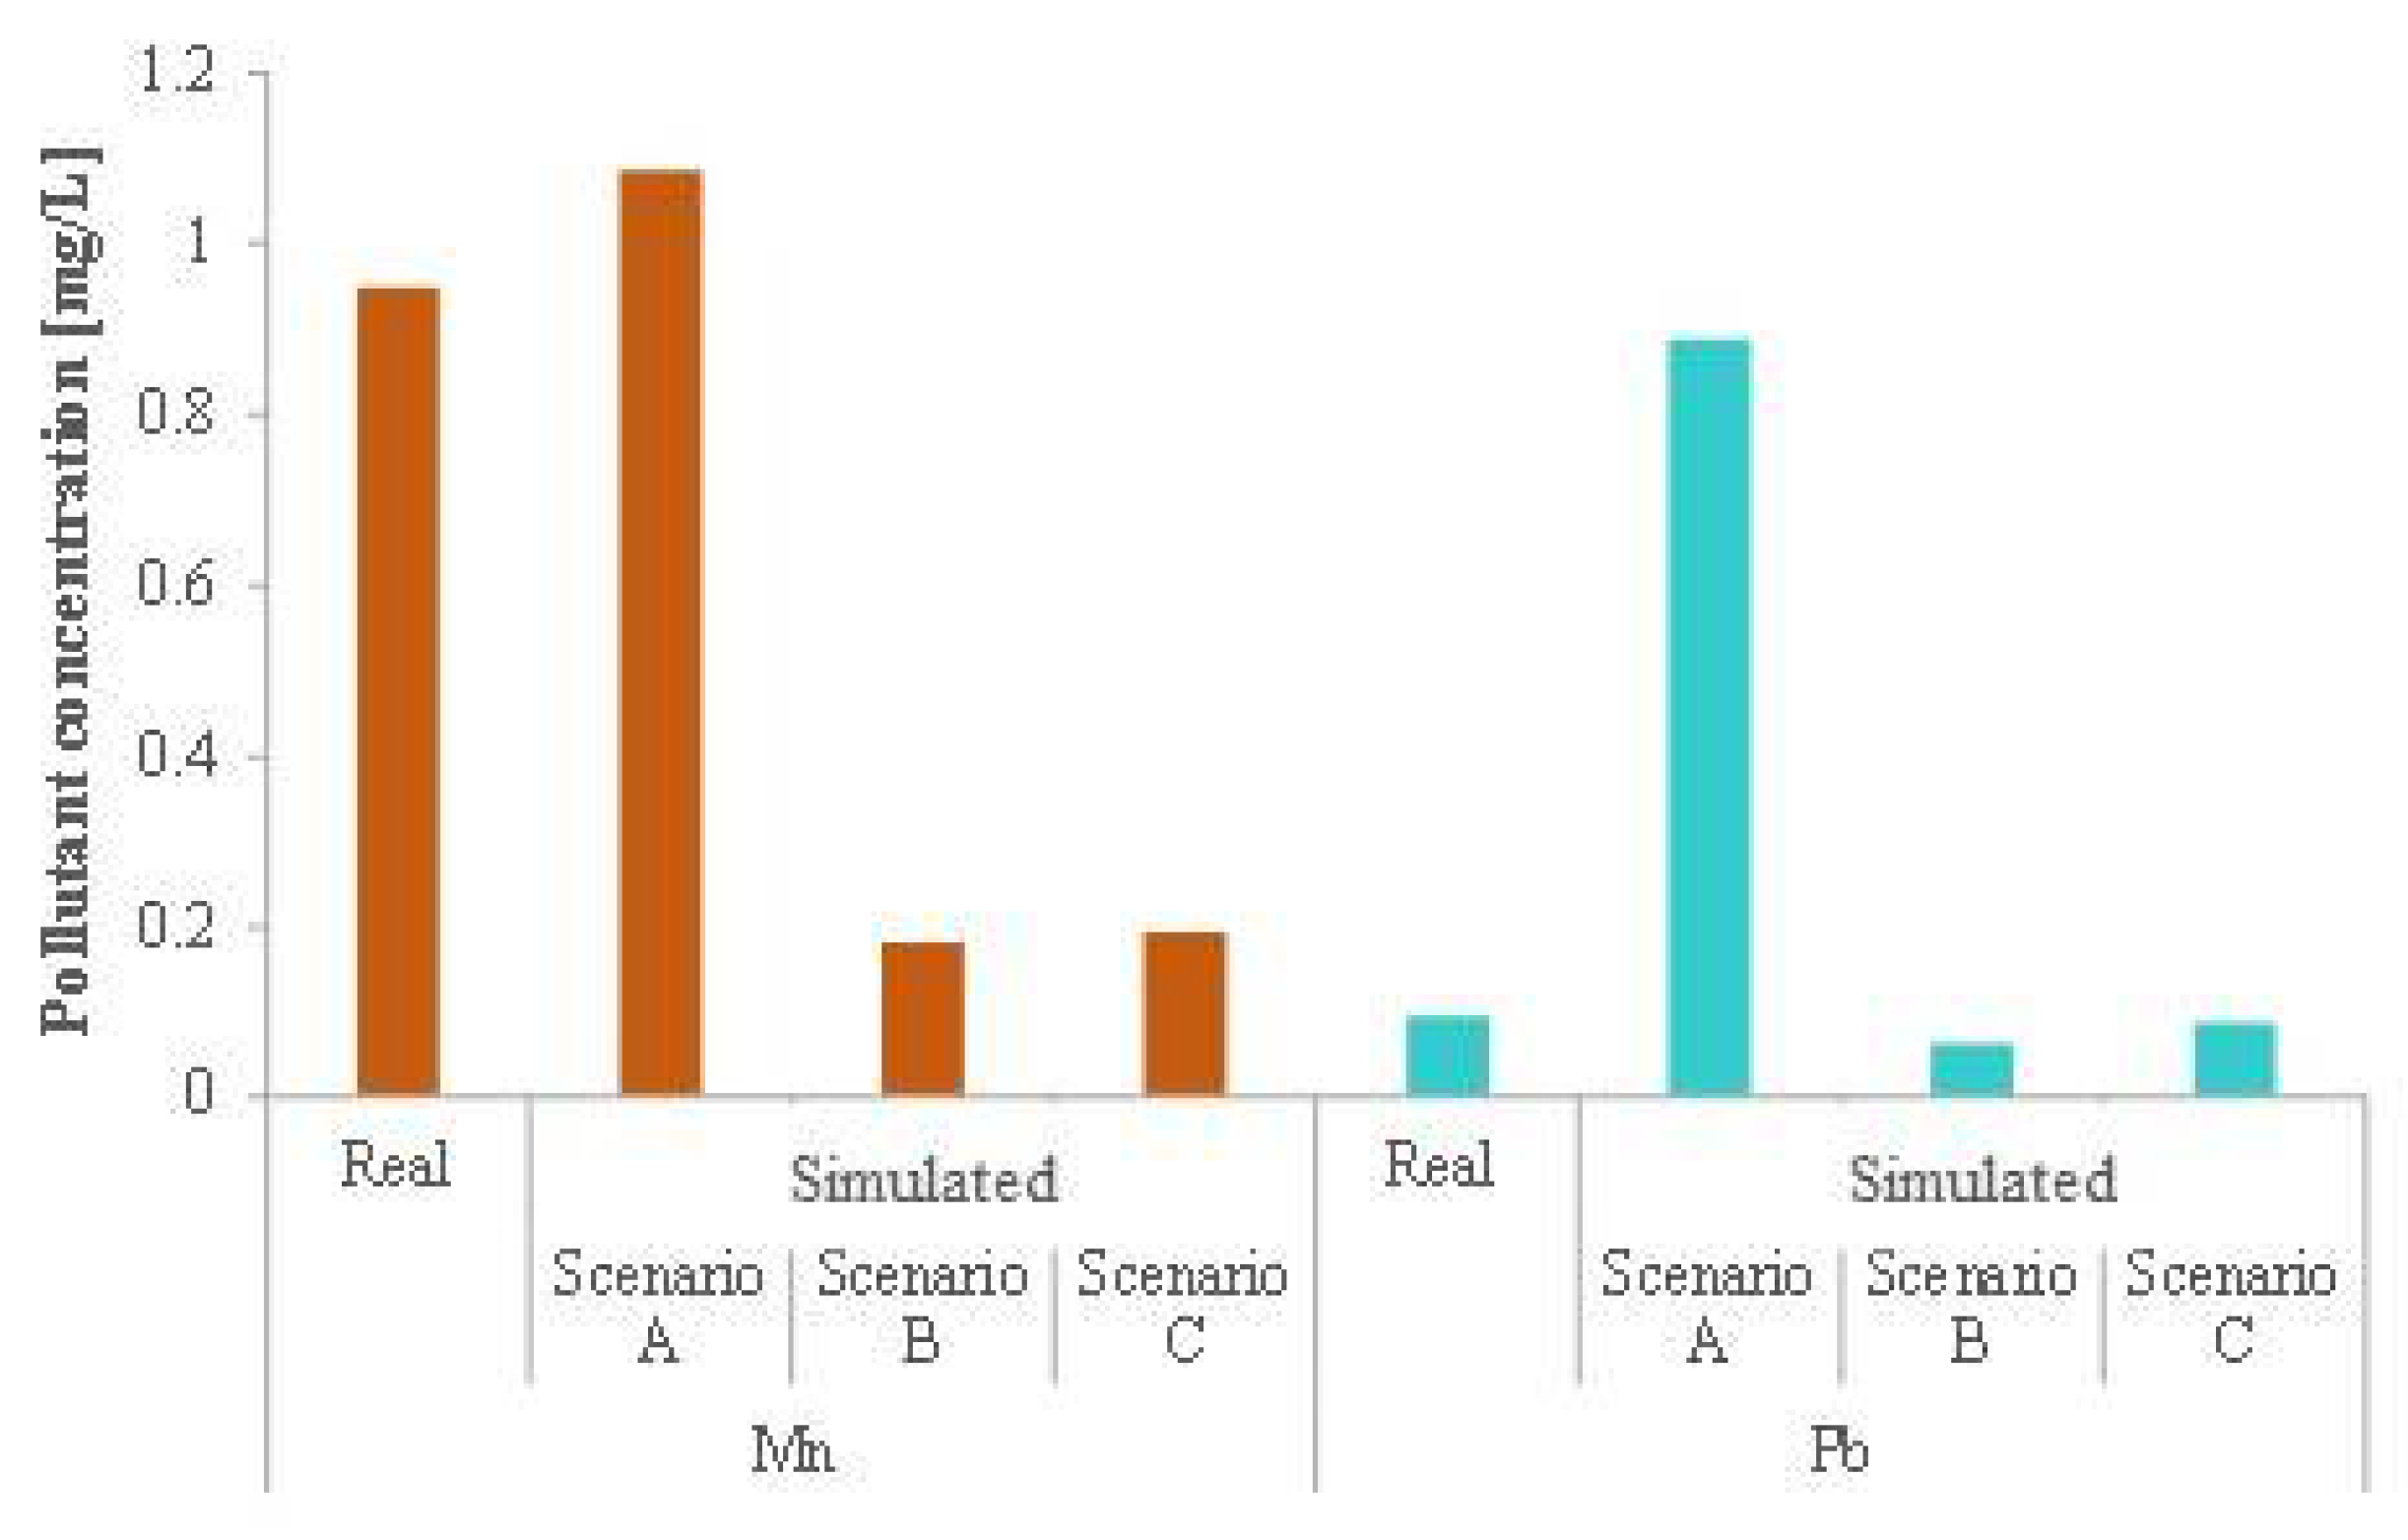
4.2. Simulation and Field Assessment of Runoff Quality

After the real storm event described previously, samples were obtained in the ponding point signaled in Figure 1. These experimental results were compared against the peak concentrations simulated for a 30-mm storm event in scenarios A, B, and C. Figure 5 shows the measured and simulated runoff quality in terms of total suspended solids (TSS) and organic matter (COD), while Figure 6 and Figure 7 show the same data in terms of nutrients (ammonium, nitrates, and phosphates) and heavy metals, respectively.
The real runoff sample showed high average values for all the measured variables: 1108 mg TSS/L, 287 mg COD/L, 2.46 mg NH4+/L, 20.61 mg NO3/L, 4.89 mg PO43−/L, 0.949 mg Mn/L, and 0.095 mg Pb/L. Concentrations of TSS and lead were similar to the values previously measured for the dry season in the same point (i.e., 1059 mg TSS/L and 0.079 mg Pb/L) [13]. Excepting nitrates, the concentrations determined for the other pollutants were higher than those reported in the same study for the dry season (195 mg COD/L, 1.0 mg NH4+/L, 2.95 mg PO43−/L, 0.48 mg Mn/L), but still in the common ranges of values found in the bibliography [13]. Instead, the average concentration of nitrates measured in our real runoff sample even surpasses other significant values reported in the bibliography as upper limits (17.6 mg NO3/L, [38]; 16 mg NO3/L, [39]).
The high concentrations we measured are consistent with the fact that the sample was obtained after the first storm event of the wet season, that is, after a dry period of 274 days. In the previous research already mentioned, the sample was obtained at the same point, but after a dry period of only 19 days [13]; this could partially explain the differences found in the runoff quality. The accumulation of pollutants, and mainly inorganic dissolved nitrogen (in the form of NO2 and NO3), has been associated with the length of the antecedent dry period, which provides the opportunity for nutrient buildup on urban surfaces before the first storm event occurs. It is perhaps for this reason that in arid and semi-arid urban catchments, runoff pollutant concentrations tend to be higher than in mesic or humid catchments, considerably at the beginning of the rainy season [40]. These high amounts of pollutants are likely to accumulate in the porous media of infiltration-based devices. Its potential to accumulate or leach pollutants and support biota activity capable of degrading or transforming them defines if a solid media can act as a sink or as a source of pollutants [41]. LID devices such as bioretention cells and vegetated infiltration trenches are not expected to become sinks of nitrogen pollutants, which can be significantly removed by plant uptake or further transformation through microbial nitrification-denitrification [42]. This is also true for orthophosphates, which besides being removed by adsorption/precipitation, are actively uptaken by plants and can be removed efficiently in bioretention cells. During a 9-year monitoring study of a rain garden, orthophosphates were uniformly distributed in the top layer of the infiltration bed and then decreased with depth between 0 and 10 cm. It was estimated that the phosphates saturation of 10–30 cm depths would not occur for the following 20 years [43]. Conservative pollutants such as metals or persistent organics also accumulate at the surface of these LID devices, specifically in the upper 10–30 cm of soil [41]. The buildup of concern metals such as lead or cadmium can limit the LID lifetime if soil regulatory limits are considered. For instance, it was estimated that cadmium, lead, and zinc accumulations in bioretention cells would reach the U.S. regulatory limits for land receiving wastewater biosolids after 15–20 years [44]. If pollutant concentrations are seasonally high in arid and semi-arid urban zones, the filter material turnover in LID practices could be faster, but this needs to be investigated further.
As seen in Figure 5, the measured and simulated (scenario A) values for the 30-mm storm event in the study site without LID implementation are similar if TSS and COD are compared. In absence of LID devices, the simulation results are also similar to the experimentally measured values for manganese (Figure 7), ammonium, and phosphate (Figure 6) concentrations. The main differences were obtained for lead (Figure 7) and nitrates (Figure 6), for which the simulated values were 934% and 23.22% of the real values, respectively. These differences could arise from the insufficient capability of SWMM in predicting water quality parameters, which is considerably superior concerning hydrographs [45]. This gap extends into the water quality simulations considering LID effectiveness, as essential processes such as decomposition of pollutants or their attachment to particles in LID soil are not simulated [46]. It has been signaled that urban runoff pollution is highly dependent on-site characteristics and land management practices [47]. This is particularly true for nutrients such as nitrates, whose fate in a watershed is biogeochemically driven, depends highly on lawn fertilization rates, and not only results from buildup and wash-off equations, as SWMM presumes [45,48]. This issue has been addressed, for instance, by modifying the SWMM water quality module [46] or by adjusting the parameters defining the buildup and wash-off of pollutants according to local factors [48].
Simulation of scenario B illustrates the effect of LID implementation on runoff quality (Figure 5, Figure 6 and Figure 7). TSS, COD, PO43−, and Pb are the pollutants expected to be best removed, with simulated reductions of 99.4%, 93.5%, 95%, and 92.8%, respectively. For Mn, a decrease of 83.2% in the peak concentration was obtained. This results from the fact that three of the four LID solutions proposed (bioretention cells, permeable pavements, and infiltration trenches) are infiltration-based technologies that are effective in removing several runoff pollutants, mainly TSS and lead, through filtration and adsorption [4,7,49]. However, the overall performance of these LID practices varies broadly according to specific pollutants and among sites. In the case of bioretention systems, they are claimed to be promising solutions to remove other pollutants as well, notably bacteria and hydrocarbons, since the plants involved have a significant decontamination role; yet, their ability to retain phosphates is limited [7]. However, the most challenging pollutants to be removed through LID practices are undoubtedly highly soluble nitrogenous compounds, such as ammonium and nitrates [50]. In fact, permeable pavements and bioretention cells are often reported as sources rather than sinks of nitrates [4,42]. According to our simulation results, the incorporation of the full set of LID technologies could reduce the peak concentrations of ammonium and nitrates by 52.8% and 89.9%, respectively (Figure 6).
Concerning the simulation of the runoff quality resulting from a realistic scenario (C), the main variable affected by the reduction of the LID devices was the TSS concentration (Figure 5). In this scenario, the removal of this parameter was only 46.8% (against more than 99% simulated in scenario B). This shows that the TSS removal efficiency of permeable pavement alone is considerable and could constitute a key factor in choosing scenario B over scenario C. The benefits of permeable pavements on removing TSS and the pollutants interacting strongly with particles (as phosphates and most heavy metals) from runoff are well known [51]. TSS removal efficiencies in this LID device are as high as 56–96% [51]. The simulated concentrations of the rest of the parameters (organic matter, nutrients, and heavy metals) were almost the same in scenarios B and C (Figure 5, Figure 6 and Figure 7). These results reinforce the idea that scenario C is a convenient schema of LID implemementation, whether the mitigation of runoff peak flows or the reduction of runoff pollutants, with the exception of TSS, is targeted.

5. Conclusions

Hydrological modeling of urban runoff and its further mitigation through LID implementation are effective alternatives for runoff management but are still scarcely applied to semi-arid built environments of the developing world. Our study area, a semi-arid site with large impervious surfaces arising from a conventional urbanization approach (and then affected by seasonal floods), was modeled through SWMM 5.1-EPA (scenario A). Two storm events were selected to simulate the LID’s hydrological efficiency. We could assess the impact of the conventional development of the study area on the local water cycle after the 30- and 39-mm storm events. The simulations also indicated high levels of pollutants in the runoff quality, especially suspended solids, organic matter, nutrients, and two model heavy metals. This is in good agreement with the long dry period preceding the storm events, which favors the buildup of pollutants. The quality of the runoff generated after a 30-mm storm event was confirmed by a field study.
We proposed a set of LID solutions (rain barrels, bioretention cells, permeable pavements, and infiltration trenches) adapted to both the climatic conditions and the study site characteristics, which were also modeled (scenario B). The simulation of this scenario showed a positive impact of LID technologies on the local water cycle since runoff decreased, and no floods occurred for any of the designed storm events. Besides, the LID-based scenario simulation showed significant decreases in the considered pollutants in the runoff generated after a 30-mm storm event. An alternative and more realistic LID-based scenario omitting permeable pavements was also conceived and modeled. This scenario allowed a lower but satisfactory hydrological performance and almost the same runoff quality than scenario B.
In this paper, the incorporation of LID to the study site was not modeled to achieve a specific quantitative goal but rather to obtain a general improvement in the runoff management, thereby relieving the low-lying zones of the campus of excessive runoff volumes, especially in the rainy season. This is why the modification of the LID design parameters was not targeted, and these were chosen among the default values suggested by the software and the guidelines applicable to the site. Due to the preceding point, this study is considered preliminary. The lack of an extensive calibration of the model is the main limitation of the study, and consequently future research should focus on this point, as well as in a more in-depth discussion on the effects of the scenarios B and C on the hydrosanitary capacity of the site. It is our view that SWMM 5.1-EPA can be applied successfully to estimate the benefits derived from water conservation strategies such as LID-based site development in arid and semi-arid urban locations.

Supplementary Materials

The following supporting information can be downloaded at: https://www.mdpi.com/article/10.3390/land11010101/s1, Figure S1: Flow simulated in scenario A after a 39-mm storm event; Figure S2: Volume simulated in scenario A after a 39-mm storm event; Figure S3: Flow simulated in scenario A after a 30-mm storm event; Figure S4: Volume simulated in scenario A after a 30-mm storm event; Figure S5: Flow simulated in scenario A after a 9-mm storm event; Figure S6: Volume simulated in scenario A after a 9-mm storm event.

Author Contributions

M.A.Z.-E. gathered the data, set up the model, carried out the simulations, analyzed the runoff samples, and wrote the draft. L.L.-M. conceived of and supervised the study. C.A.B.-A. supervised the location of LID devices in scenarios B and C, and made the figures. S.E.A.-A. and J.S.R.-N. provided valuable feedback during the model development. G.A.V.-R. supervised the study, discussed the results, and cowrote, reviewed, and edited the paper. All authors have read and agreed to the published version of the manuscript.

Funding

This research received no external funding.

Institutional Review Board Statement

Not applicable.

Informed Consent Statement

Not applicable.

Data Availability Statement

Data used in this study are contained within the article.

Acknowledgments

Marcelino Antonio Zúñiga-Estrada is grateful for the PhD scholarship provided by the Consejo Nacional de Ciencia y Tecnología (CONACYT-Mexico). All authors appreciate the support received from Arturo Gleason Espíndola regarding the technical details implemented during the simulation in the SWMM, as well as the careful reading and constructive feedback from anonymous reviewers.

Conflicts of Interest

The authors declare no conflict of interest.

References

  1. Lizárraga-Mendiola, L.; Vázquez-Rodríguez, G.A.; Lucho-Constantino, C.A.; Bigurra-Alzati, C.A.; Beltrán-Hernández, R.I.; Ortiz-Hernández, J.E.; López-León, L.D. Hydrological design of two low-impact development techniques in a semi-arid climate zone of Central Mexico. Water 2017, 9, 561. [Google Scholar] [CrossRef] [Green Version]
  2. Qin, H.; Li, Z.; Fu, G. The effects of low impact development on urban flooding under different rainfall characteristics. J. Environ. Manag. 2013, 129, 577–585. [Google Scholar] [CrossRef] [PubMed] [Green Version]
  3. Meerow, S.; Natarajan, M.; Krantz, D. Green infrastructure performance in arid and semi-arid urban environments. Urban Water J. 2021, 18, 275–285. [Google Scholar] [CrossRef]
  4. Ortega-Villar, R.; Lizárraga-Mendiola, L.; Coronel-Olivares, C.; López-León, L.D.; Bigurra-Alzati, C.A.; Vázquez-Rodríguez, G.A. Effect of photocatalytic Fe2O3 nanoparticles on urban runoff pollutant removal by permeable concrete. J. Environ. Manag. 2019, 242, 487–495. [Google Scholar] [CrossRef]
  5. Cunha, M.C.; Zeferino, J.A.; Simões, N.E.; Saldarriaga, J.G. Optimal location and sizing of storage units in a drainage system. Environ. Model. Softw. 2016, 83, 155–166. [Google Scholar] [CrossRef] [Green Version]
  6. Bosley, E.K. Hydrologic Evaluation of Low Impact Development Using a Continuous, Spatially-distributed Model. Master’s Thesis, Virginia Polytechnic Institute and State University, Blacksburg, VA, USA, 2008. [Google Scholar]
  7. Jiang, Y.; Yuan, Y.; Piza, H. A review of applicability and effectiveness of low impact development/green infrastructure practices in arid/semi-arid United States. Environments 2015, 2, 221–249. [Google Scholar] [CrossRef]
  8. Huang, J.; Zhang, G.; Zhang, Y.; Guan, X.; Wei, Y.; Guo, R. Global desertification vulnerability to climate change and human activities. Land Degrad. Dev. 2020, 31, 1380–1391. [Google Scholar] [CrossRef]
  9. Burrell, A.L.; Evans, J.P.; De Kauwe, M.G. Anthropogenic climate change has driven over 5 million km2 of drylands towards desertification. Nature Comm. 2020, 11, 3853. [Google Scholar] [CrossRef] [PubMed]
  10. Rabori, A.M.; Ghazavi, R. Urban Flood Estimation and Evaluation of the Performance of an Urban Drainage System in a Semi-Arid Urban Area Using SWMM. Water Environ. Res. 2018, 90, 2075–2082. [Google Scholar] [CrossRef]
  11. Du Toit, M.J.; Cilliers, S.S.; Dallimer, M.; Goddard, M.; Guenat, S.; Cornelius, S.F. Urban green infrastructure and ecosystem services in sub-Saharan Africa. Landsc. Urban Plan. 2018, 180, 249–261. [Google Scholar] [CrossRef]
  12. Soz, S.A.; Kryspin-Watson, J.; Stanton-Geddes, Z. The Role of Green Infrastructure Solutions in Urban Flood Risk Management; World Bank: Washington, DC, USA, 2016; Available online: https://openknowledge.worldbank.org/handle/10986/25112 (accessed on 27 July 2021).
  13. Ortiz-Hernández, J.E.; Lucho-Constantino, C.A.; Lizárraga-Mendiola, L.; Beltrán-Hernández, R.I.; Coronel-Olivares, C.; Vázquez-Rodríguez, G.A. Quality of urban runoff in wet and dry seasons: A case study in a semi-arid zone. Environ. Sci. Pollut. Res. 2016, 23, 25156–25168. [Google Scholar] [CrossRef]
  14. Barros, R.A.P.; Alves, R.I.A.; Hermínio, C.F.P.; Djordjević, S.; Javadi, A. Land-Use and Legislation-Based Methodology for the Implementation of Sustainable Drainage Systems in the Semi-Arid Region of Brazil. Sustainability 2020, 12, 661. [Google Scholar] [CrossRef] [Green Version]
  15. Zaghloul, N.A.; Al-Mutairi, B.L. Water harvesting of urban runoff in Kuwait. Trans. A Civil. Eng. 2010, 17, 236–243. [Google Scholar]
  16. National Water Commission (CONAGUA). National Climatological Database (Sistema CLICOM); CONAGUA: Jalisco, Mexico, 2020; Available online: http://clicom-mex.cicese.mx (accessed on 27 November 2020). (In Spanish)
  17. National Meteorological Service (SMN). Forecasted Weather for Municipalities (Pronóstico del Tiempo por Municipios); CONAGUA: Jalisco, Mexico, 2019. Available online: http://smn.cna.gob.mx/es/pronostico-del-tiempo-por-municipios (accessed on 4 September 2020). (In Spanish)
  18. Lizárraga-Mendiola, L.; Vázquez-Rodríguez, G.; Blanco-Piñón, A.; Rangel-Martínez, Y.; González-Sandoval, M. Estimating the Rainwater Potential per Household in an Urban Area: Case Study in Central Mexico. Water 2015, 7, 4622–4637. [Google Scholar] [CrossRef] [Green Version]
  19. Campos-Aranda, D.F. Rainfall Maximum Intensities for Urban Hydrological Design in Mexican Republic. Ing. Inv. Tecnol. 2010, 2, 179–188. [Google Scholar] [CrossRef]
  20. Hur, S.; Nam, K.; Kim, J.; Kwak, C. Development of runoff model FFC-QUAL for first-flush water-quality analysis in urban drainage basins. J. Environ. Manag. 2018, 205, 73–84. [Google Scholar] [CrossRef] [PubMed]
  21. Bigurra-Alzati, C.A.; Ortiz-Gómez, R.; Vázquez-Rodríguez, G.A.; López-León, L.D.; Lizárraga-Mendiola, L. Water Conservation and Green Infrastructure Adaptations to Reduce Water Scarcity for Residential Areas with Semi-Arid Climate: Mineral de la Reforma, Mexico. Water 2020, 13, 45. [Google Scholar] [CrossRef]
  22. United States Department of Agriculture (USDA). Urban Hydrology for Small Watersheds; Technical Release 55; United States Department of Agriculture (USDA): Washington, DC, USA, 1986; 164p.
  23. McCuen, R.H. Hydrologic Analysis and Design; Prentice Hall: Upper Saddle River, NJ, USA, 1998. [Google Scholar]
  24. Huízar-Álvarez, R. Carta Hidrogeológica de la Cuenca del Río de las Avenidas, de Pachuca, Hgo., México; Instituto de Geología, Universidad Nacional Autónoma de México: Mexico City, Mexico, 1993; 37p. [Google Scholar]
  25. Mays, L. (Ed.) Integrated Urban Water Management: Arid and Semi-Arid Regions; UNESCO-IHP, CRC Press: Paris, France, 2014; p. 50. [Google Scholar]
  26. Gonçalves, M.L.R.; Zisch, J.; Rau, S.; Sitzmann, M.; Rauch, W.; Kleidorfer, M. Modeling the effects of introducing low impact development in a tropical city: A case study from Joinville, Brazil. Sustainability 2018, 10, 728. [Google Scholar] [CrossRef] [Green Version]
  27. Mexico News Daily. Mexico City Announces Water Catchment Program For Homeowners (18 January 2019). Available online: https://mexiconewsdaily.com/news/mexico-city-announces-water-catchment-program/ (accessed on 5 August 2021).
  28. XP Solutions. XP-SWMM Stormwater and Wastewater Management Model: Getting Started Manual; XP Solutions: Newbury, UK, 2016. [Google Scholar]
  29. Rossman, L. Storm Water Management Model User´s Manual Version 5.1—EPA/600/R-14/413 (NTIS EPA/600/R-14/413b); Office of Research and Development, Environmental Protection Agency: Washington DC, USA, 2015. Available online: https://www.epa.gov/sites/production/files/2019-02/documents/epaswmm5_1_manual_master_8-2-15.pdf (accessed on 4 December 2020).
  30. Municipal Planning Institute (IMPLAN). Green Infrastructure Design Guidelines for Mexican Municipalities (Manual de Lineamientos de Diseño de Infraestructura Verde Para Municipios Mexicanos); IMPLAN: Hermosillo, Mexico, 2019; Available online: https://www.implanhermosillo.gob.mx/wp-content/uploads/2019/06/ManualIV3.pdf (accessed on 4 April 2021).
  31. American Public Health Association; American Water Works Association; Water Environment Federation (APHA/AWWA/WEC). Standard Methods for the Examination of Water and Wastewater, 22nd ed.; APHA; AWWA; WEC: Washington, DC, USA, 2012. [Google Scholar]
  32. Mubarak, A.; Howald, R.A.; Woodriff, R. Elimination of chloride interferences with mercuric ions in the determination of nitrates by the phenoldisulfonic acid method. Anal. Chem. 1977, 49, 857–860. [Google Scholar] [CrossRef]
  33. Huang, J.J.; Li, Y.; Niu, S.; Zhou, S.H. Assessing the performances of low impact development alternatives by long-term simulation for a semi-arid area in Tianjin, northern China. Water Sci. Technol. 2014, 70, 1740–1745. [Google Scholar] [CrossRef]
  34. Li, J.; Li, Y.; Li, Y. SWMM-based evaluation of the effect of rain gardens on urbanized areas. Environ Earth Sci. 2016, 75, 1–14. [Google Scholar] [CrossRef]
  35. Huo, Y.C.; Wu, X.; Luan, Q.H.; Liu, J.H.; Ma, D. Effectiveness evaluation of LIDs through SWMM: A case study of typical urban unit in Handan, China. In Proceedings of the IOP Conference Series: Earth and Environmental Science, Proceedings of the 5th International Conference on Water Resource and Environment (WRE 2019), Macao, China, 16–19 July 2019; IOP Publishing: Macao, China, 2019; Volume 344, p. 012056. [Google Scholar] [CrossRef]
  36. Mahmoud, A.; Alam, T.; Rahman, Y.A.; Sánchez, A.; Guerrero, J.; Jones, K.D. Evaluation of field-scale stormwater bioretention structure Flow and pollutant load reductions in a semi-arid coastal climate. Ecol. Eng. X 2019, 1, 100007. [Google Scholar] [CrossRef]
  37. Joshi, P.; Leitão, J.P.; Maurer, M.; Bach, P.M. Not all SuDS are created equal: Impact of different approaches on combined sewer overflows. Water Res. 2021, 191, 116780. [Google Scholar] [CrossRef]
  38. Asaf, L.; Nativ, R.; Shain, D.; Hassan, M.; Geyer, S. Controls on the chemical and isotopic compositions of urban stormwater in a semiarid zone. J. Hydrol. 2004, 294, 270–293. [Google Scholar] [CrossRef]
  39. Ivanovsky, A.; Belles, A.; Criquet, J.; Dumoulin, D.; Noble, P.; Alary, C.; Billon, G. Assessment of the treatment efficiency of an urban stormwater pond and its impact on the natural downstream watercourse. J. Environ. Manag. 2018, 226, 120–130. [Google Scholar] [CrossRef]
  40. Caraco, D. Stormwater Strategies for Arid and Semi-Arid Watersheds. In The Practice of Watershed Protection; Schueler, T.R., Holland, H.K., Eds.; Center for Watershed Protection: Ellicott City, MD, USA, 2000; pp. 382–391. [Google Scholar]
  41. Tedoldi, D.; Chebbo, G.; Pierlot, D.; Kovacs, Y.; Gromaire, M.C. Impact of runoff infiltration on contaminant accumulation and transport in the soil/filter media of Sustainable Urban Drainage Systems: A literature review. Sci. Total Environ. 2016, 569, 904–926. [Google Scholar] [CrossRef]
  42. Li, L.; Davis, A.P. Urban stormwater runoff nitrogen composition and fate in bioretention systems. Environ. Sci. Technol. 2014, 48, 3403–3410. [Google Scholar] [CrossRef] [PubMed]
  43. Komlos, J.; Traver, R.G. Long-term orthophosphate removal in a field-scale storm-water bioinfiltration rain garden. J. Environ. Eng. 2012, 138, 991–998. [Google Scholar] [CrossRef]
  44. Davis, A.P.; Shokouhian, M.; Sharma, H.; Minami, C.; Winogradoff, D. Water quality improvement through bioretention: Lead, copper, and zinc removal. Water Environ. Res. 2003, 75, 73–82. [Google Scholar] [CrossRef] [PubMed]
  45. Niazi, M.; Nietch, C.; Maghrebi, M.; Jackson, N.; Bennett, B.R.; Tryby, M.; Massoudieh, A. Storm water management model: Performance review and gap analysis. J. Sustain. Water Built Environ. 2017, 3, 04017002. [Google Scholar] [CrossRef] [Green Version]
  46. Baek, S.S.; Ligaray, M.; Pyo, J.; Park, J.P.; Kang, J.H.; Pachepsky, Y.; Chun, J.A.; Cho, K.H. A novel water quality module of the SWMM model for assessing low impact development (LID) in urban watersheds. J. Hydrol. 2020, 586, 124886. [Google Scholar] [CrossRef]
  47. Ellis, J.B.; Mitchell, G. Urban diffuse pollution: Key data information approaches for the Water Framework Directive. Water Environ. J. 2006, 20, 19–26. [Google Scholar] [CrossRef]
  48. Tu, M.C.; Smith, P. Modeling pollutant buildup and washoff parameters for SWMM based on land use in a semiarid urban watershed. Water Air Soil Pollut. 2018, 229, 1–15. [Google Scholar] [CrossRef]
  49. Zúñiga-Estrada, M.A.; Vázquez-Rodríguez, G.A.; Ramírez-Cardona, M.; Lizárraga-Mendiola, L. Mineralogical evidence of unfavorable geochemical interactions between urban runoff pollutants and filter materials in low-impact systems. J. Hazard. Mater. 2020, 390, 122136. [Google Scholar] [CrossRef] [PubMed]
  50. Golden, H.E.; Hoghooghi, N. Green infrastructure and its catchment-scale effects: An emerging science. WIRES Water 2018, 5, e1254. [Google Scholar] [CrossRef] [Green Version]
  51. Drake, J.A.; Bradford, A.; Marsalek, J. Review of environmental performance of permeable pavement systems: State of the knowledge. Water Qual. Res. J. Canada 2013, 48, 203–222. [Google Scholar] [CrossRef]
Figure 1. Study site with its current urban development (scenario A).
Land 11 00101 g001
Figure 2. Graphic representation of current urban infrastructure. I, II, and III represent the sub-catchments prone to floods during the rainy season.
Land 11 00101 g002
Figure 3. Urban development of the study site with LID practices (scenario B).
Land 11 00101 g003
Figure 4. Dynamics of the runoff generated in scenarios A (conventional urban development without LID implementation), B (urban development with LID practices), and C (realistic urban development with LID practices) 1.5 h after starting two simulated storm events: 30 mm in one day followed of 9 mm the following day, and 39 mm in one day.
Land 11 00101 g004
Figure 5. Measured and simulated concentrations of total suspended solids (TSS) and chemical oxygen demand (COD) in the runoff of the study site after 30-mm storm events. Simulated concentrations correspond to the three scenarios analyzed.
Land 11 00101 g005
Figure 6. Measured and simulated concentrations of ammonium, nitrates, and phosphates in the runoff of the study site after 30-mm storm events. Simulated concentrations correspond to the three scenarios analyzed.
Land 11 00101 g006
Figure 7. Measured and simulated concentrations of manganese and lead in the runoff of the study site after 30-mm storm events. Simulated concentrations correspond to the three scenarios analyzed.
Land 11 00101 g007
Table 1. Physical characteristics of the micro watershed divided into three zones: high, intermediate, and low zone.
ParameterHigh ZoneIntermediate ZoneLow Zone
A1A2B1B2C1C2
Total surface area (m2)62,240.640,337.543,69525,43064,384.550,877.8
Slope (%)3.64.35.82.51.82.3
Soil use (m2)
Soil without vegetation cover35,392.46228.57089.411,89755742112
Soil with vegetation cover003737021,33619,007
Asphalted surface9897.223,55516,368963122,67618,719
Roof catchment16,95110,55416,500.6390214,798.511,039.8
Average runoff coefficient (impermeable)0.93110.870.890.75
Average runoff coefficient (permeable)0.610.650.710.650.550.69
Rainwater collection surface (m2)16,95110,55416,500.6390214,798.511,039.8
Runoff surface (m2)45,289.629,783.527,194.421,52849,58639,838
Total area:permeable area01:0.601:0.201:0.201:0.501:0.401:0.4
Table 2. Summary of the changes made to the stormwater management model default parameters for the low-impact development (LID) devices considered in scenarios B and C.
LID DeviceParameterDefault Value [mm]Value Used in the Model [mm]Source
Bioretention cell 1Berm height750150[30]
Soil thickness500400
Storage thickness1500300
Infiltration trench 1Berm height750350[1]
Permeable pavement 2Pavement thickness100190[30]
Soil thickness9002
1 Considered in scenarios B and C. 2 Considered only in scenario B.
Table 3. Hydraulic parameters showing the runoff response to scenarios analyzed.
Sub-CatchmentTotal Precipitation [mm]Runoff
1.5 h
[m3/s]
Infiltration
1.5 h
[mm/h]
Peak Flow
[m3/s]
Conventional urban development scenario (A)I301.230.001.35
II301.370.001.41
III300.700.000.71
I090.140.000.15
II090.150.000.17
III090.080.000.10
I391.600.001.61
II391.840.001.93
III391.010.001.01
Urban development scenario with LID practices (B)I300.070.210.07
II300.070.660.08
III300.000.460.00
I090.000.200.00
II090.000.210.00
III090.000.190.00
I390.150.210.15
II390.160.840.18
III390.010.640.03
Realistic urban development scenario with LID practices (C)I300.570.000.59
II300.141.660.15
III300.180.000.29
I090.060.000.07
II090.021.870.02
III090.010.000.03
I390.850.000.90
II390.221.640.24
III390.360.000.46
Publisher’s Note: MDPI stays neutral with regard to jurisdictional claims in published maps and institutional affiliations.

