Article

Understanding Grass Invasion, Fire Severity, and Acacia koa Regeneration for Forest Restoration in Hawaiʻi Volcanoes National Park

by
Natalia P. Hamilton
1,*,
Stephanie G. Yelenik
2,3,
Tara D. Durboraw
1,
Robert D. Cox
1 and
Nathan S. Gill
1
1
Department of Natural Resources Management, Texas Tech University, Lubbock, TX 79410, USA
2
U.S. Geological Survey, Pacific Island Ecosystems Research Center, Hawaii Volcanoes National Park, HI 96718, USA
3
U.S. Forest Service, Rocky Mountain Research Station, Reno, NV 89512, USA
*
Author to whom correspondence should be addressed.
Land 2021, 10(9), 962; https://doi.org/10.3390/land10090962
Submission received: 30 June 2021 / Revised: 29 August 2021 / Accepted: 1 September 2021 / Published: 10 September 2021
(This article belongs to the Special Issue Forest Landscape Restoration: Strategies, Challenges, and Impacts)

Abstract

:
With invasive grasses increasing wildfire occurrence worldwide, a better understanding of the relationships between native plants, fire, and invasive grass is needed to help restoration plans facilitate ecosystem resilience. Invasive grasses are particularly problematic for altering fire regimes in the tropics, yet in Hawaiʻi, restoration sites are often planted with monocultures of the native tree Acacia koa, which can promote grass growth via nitrogen fixation. This, combined with the difficulty of estimating pre-fire grass cover under thick canopies, complicates attempts to restore Hawaiian ecosystems. We studied the 2018 Keauhou Ranch Fire in Hawaiʻi to investigate three questions: (1) at what level of precision can pre-fire grass cover be accurately estimated from oblique aerial photos? (2) how are post-fire A. koa regeneration densities affected by fire severity? and (3) how are post-fire A. koa regeneration densities affected by pre-fire grass cover and its interaction with fire severity? We collected burn severity and post-fire regeneration data from 30 transects stratified across mid-elevation woodland, montane woodland, and montane shrubland communities. We evaluated visual estimates of pre-fire grass cover from oblique aerial imagery with quantitative in situ data from 60 unburned transects of the same cover types. Pre-fire estimates of grass cover categories were 67% accurate in montane woodland (n = 9) and 100% accurate in montane shrubland (n = 11), but only 20% accurate in mid-elevation woodland (n = 10). In montane woodlands with low pre-fire tree densities, A. koa regeneration densities were higher with increased fire severity, but this trend reversed when pre-fire tree densities were high. We detected no effect of pre-fire grass cover, nor its interaction with fire severity, on A. koa regeneration density. This indicates that restoration through the planting of A. koa may be successful in promoting fire-resilient A. koa forest, although there are potential issues to consider regarding the effects that A. koa’s grass promotion may have on other species within the ecosystem.

1. Introduction

The potential for wildfire ignition “based on flammability and exposure to ignition vectors” [1] has been increasing in fire-prone regions globally throughout the past century [2], and the world is seeing larger, more frequent wildfires as a result [3], necessitating restoration plans that incorporate fire resiliency. There are multiple causes of the global increase in wildfires, including climate change [4], changes in land use patterns [1,5], and shifting fuel dynamics within ecosystems, which occur when an ecosystem’s vegetation changes in a way that affects its fire potential [6]. Shifts in fuel dynamics may be precipitated seasonally with senescence or over multiple years via structural changes as vegetation ages [7,8]. Shifts can also be caused by human alterations of an ecosystem’s structure such as logging, development, fire suppression [1,9,10,11], or when an ecosystem is invaded by a plant species such as non-native, invasive grasses [6,12,13].
Invasive grasses can disrupt soil nutrient dynamics [14,15], plant water dynamics [16], and soil carbon cycling [17]. Many are suited to post-disturbance environments and propagate easily after wildfire, and some of the most successful invasive grasses have seeds that are stimulated to germinate after exposure to heat and smoke [18,19]. Additionally, many invasive grasses tend to have low moisture levels and high fuel biomass and flammability [6,12,13]. Invasive species that are fire-tolerant can crowd out native species that are slower to establish in a post-fire landscape, creating a positive feedback loop in which an increase in the abundance of invasive species leads to more frequent wildfire, which in turn leads to a further increase in the abundance of invasive species [20]. Such positive feedback increases the resilience of the ecosystem’s invaded state [21], and makes the restoration of diverse, native landscapes without invasive grasses difficult [22,23].
The Hawaiian Islands offer an example of this phenomenon, as native forests there are being encroached upon by highly flammable invasive grasses such as Ehrharta stipoides (meadow ricegrass), Megathyrsus maximus (Guinea grass), and Andropogon glomeratus (bushy bluestem) [12,24,25]. These grasses were introduced to the Hawaiian Islands to provide forage for cattle and quickly began to reproduce, becoming widespread by the 1960s [24,26]. In the absence of grass invasion, Hawaiian forests and woodlands have historically had subcanopies dominated by ferns, shrubs, and sub-trees, with little to no native grass present [24,26]. Because invading grasses change the fuel composition of Hawaiian forests, propagate quickly in burned areas, and prevent the reestablishment of less flammable native species, they increase fire potential and have led to wildfires that are more frequent and intense than historical fire patterns [24,25].
Paleontological evidence indicates that pre-settlement Hawaiʻi experienced occasional wildfires caused by volcanic activity and lightning strikes [27]. While there is some debate over the degree to which Polynesian settlers used fire to alter landscapes in Hawaiʻi [28], sedimentological evidence does indicate that their arrival caused a significant increase in fire frequency [27,29,30]. Early Hawaiians employed fire as a tool to increase the abundance of Heteropogon contortus (pili grass), which they used for thatching [30]. European colonization further increased fire frequency as agriculture expanded and non-native grasses were introduced for cattle forage [27,30]. From 1904 to 1959, the total area burned per year statewide increased over fourfold, and it is experiencing unprecedented highs in the present day [31]. From 2005 to 2011, there were on average 1007 fires per year across all the islands, burning an average of 8427 ha per year [31]. Because many native plant species in Hawaiʻi are vulnerable to the effects of frequent [32] or intense [30] fire, the shifting Hawaiian wildfire regime has contributed to their decline, which in turn has negatively affected wildlife habitat quality and ecosystem function [30].
Efforts to re-establish native species composition in grass-invaded sites in Hawaiʻi often include planting or otherwise facilitating the native koa tree Acacia koa, which can reduce grass cover through shading [33,34]. A. koa is considered a good candidate for restoration of Hawaiian forests because it has high survival rates, grows quickly relative to other native canopy dominant trees, and holds economic, ecological, and cultural value [33,35]. Additionally, in the absence of invasive grass, A. koa quickly regenerates after disturbance, including fire, through resprouting and seedling establishment [36].
However, the overrepresentation of A. koa at restoration sites may have negative ecological consequences. A. koa is a nitrogen fixer, which leads to localized increase in invasive grass under its canopy relative to under the canopies of common non-fixing native trees such as Metrosideros polymorpha (‘ōhi‘a) [37]. This increased grass cover hinders the development of native understories, particularly in A. koa monocultures [37]. Because the National Park Service (NPS) and other management organizations aim to restore biodiversity in Hawaiʻi, suppression of native understory may be counterproductive, and restoration alternatives to A. koa are being considered. Additionally, as invasive grass cover expands, grass-fueled fires will become more frequent and more likely to diminish A. koa seed banks, because frequent fires can prevent A. koa stands from reaching seeding age before being burned [36], a phenomenon referred to as immaturity risk [38]. It is unknown how a higher frequency of grass-fueled fires may affect post-fire A. koa establishment in areas with increasing grass cover. Increased grass cover may suppress post-fire regeneration of A. koa due to competition for resources other than nitrogen [39].
If grass cover negatively affects post-fire A. koa regeneration, A. koa’s grass facilitation could be highly problematic for the long-term success of A. koa restoration in areas that experience wildfires [36]. Literature is sparse on the effects of high-severity fire on A. koa regeneration, although there is evidence that A. koa is able to establish naturally and aggressively after high-severity fire [40]. It is not known whether there is a threshold at which grass cover has substantial negative effects on A. koa regeneration through its potential influence on fire severity. We aimed to test this at sites with varying levels of pre-fire grass cover by determining the combined effects of grass cover and fire severity on A. koa regeneration densities one year after fire.
Assessing grass cover is key to understanding its effects on ecosystems and can be done in person or remotely. However, it is difficult to assess grass cover from remote sensing data in forested ecosystems when the forest floor is obscured by the canopy, as is often the case in Hawaiʻi. This presents a challenge to determining the fire risk and management needs of forested landscapes without spending time and resources on in-person surveys. We aimed to test whether oblique-angle aerial images could fill this knowledge gap. Oblique aerial images are shot at an angle that allows the viewer to see further under the canopy than one can using traditional top-down images, and this could potentially allow for greater ability to assess grass cover.
The objectives of this study were to quantify how grass cover, fire severity, and the interaction of the two affect A. koa regeneration, and to discover whether one can obtain accurate grass cover estimations from oblique-angle aerial photography. The future resilience of A. koa to the increasing threat of grass-fueled wildfire depends on how it responds to various levels of grass cover and fire severity. Understanding this response and knowing whether oblique-angle aerial photography is a viable option for grass cover measurement will allow land managers to make informed choices about how they assess fire hazard and restoration priorities on their land.
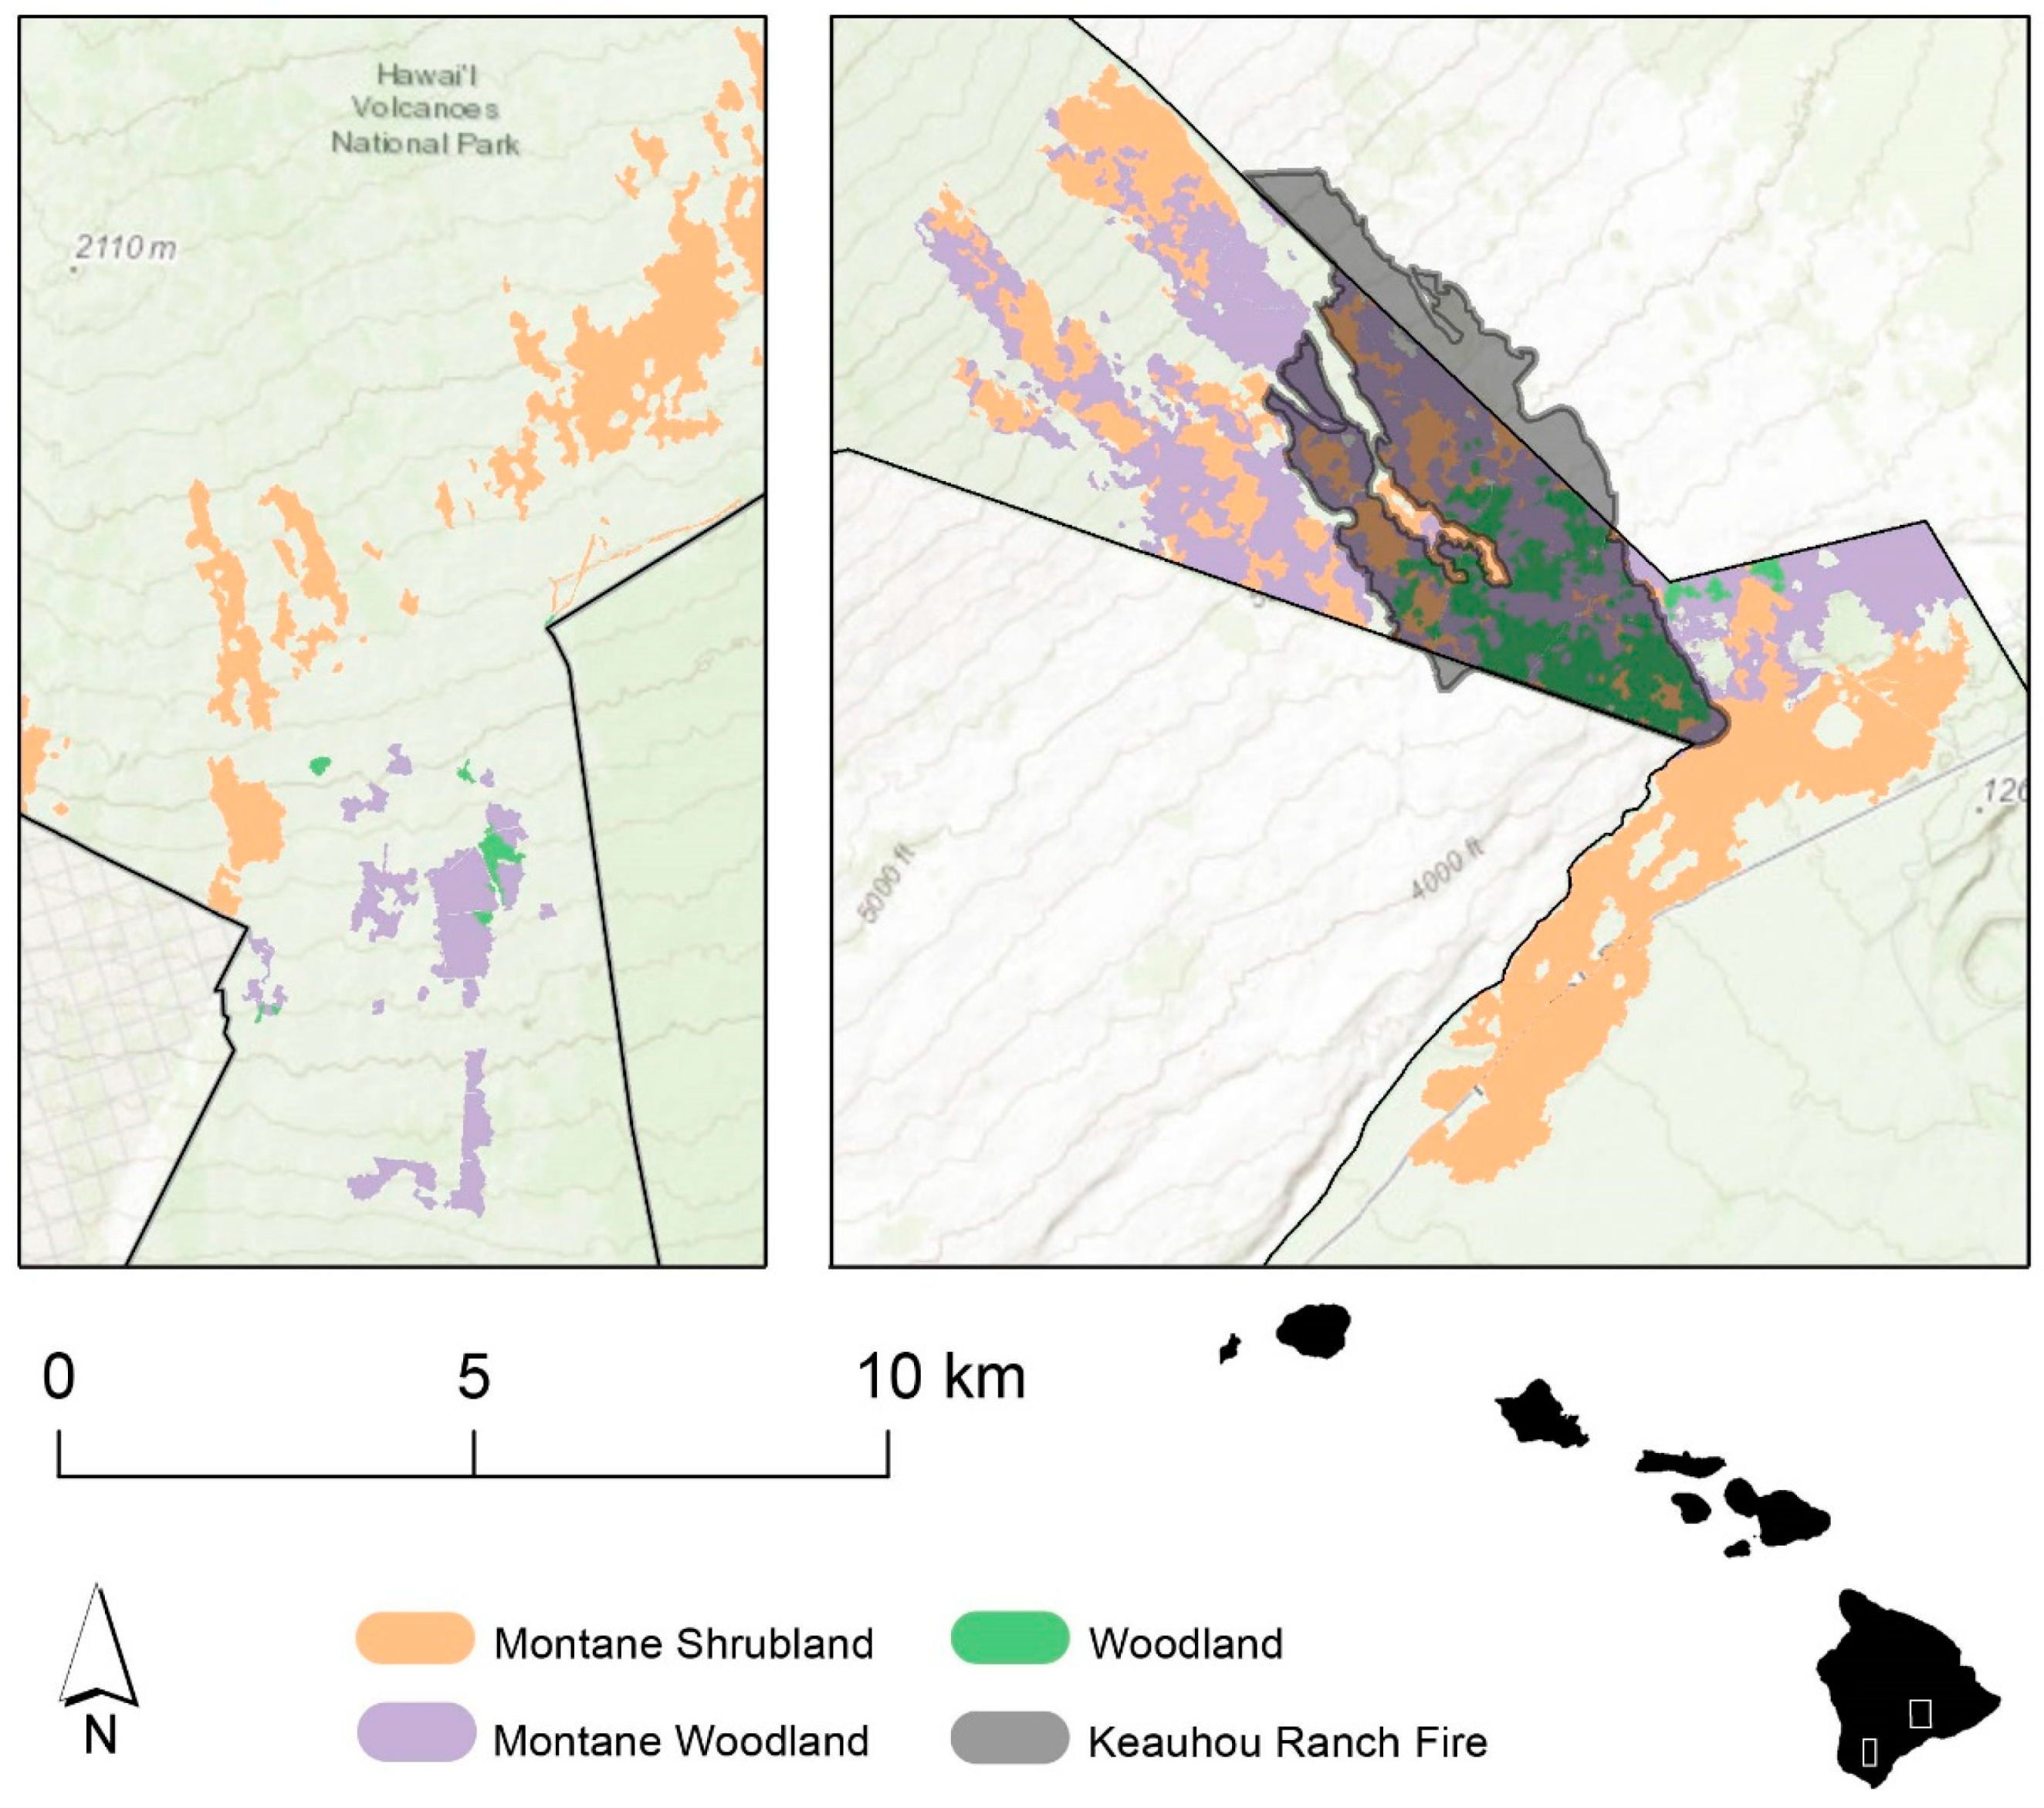
We chose to use the landscape burned in the 2018 Keauhou Ranch Fire as our study area. The Keauhou Ranch Fire burned an estimated 1203 hectares of land in Hawaiʻi Volcanoes National Park (HAVO) and 308 hectares of the surrounding state and public lands on the Island of Hawaiʻi [41]. The fire affected numerous ecotypes, including A. koa forests with varying levels of grass invasion. Ongoing restoration efforts in Hawaiʻi seek to restore forest habitat by planting native species and limiting invasive grass cover. However, for restoration efforts to be successful, land managers would benefit from knowledge of how invasive grass cover varies across the landscape and how it influences both fire effects and native plant response to fire. In an effort to achieve this knowledge, we investigated a method for estimating grass cover from oblique aerial photos, and analyzed the relationships between fire severity, grass cover, and the dominant native tree, Acacia koa.
We asked the following:
  • At what level of precision can categories of pre-fire grass cover be accurately (≥60% accuracy) estimated from oblique aerial photos?
  • How do post-fire A. koa regeneration densities vary with fire severity?
  • How do post-fire A. koa regeneration densities vary with pre-fire grass cover and its interaction with fire severity?

2. Materials and Methods

2.1. Study Area

The study area was within the mid-elevation woodland, montane woodland, and montane shrubland zones of HAVO [42,43], which has been designated as a National Park since 1916 and contains a broad range of ecosystems with many endemic flora and fauna. Our sites ranged in elevation from 1006 to 2195 m. The study area included a 39.59 km2 area along the Mauna Loa Road on the southeastern slope of Mauna Loa, 12.95 km2 of which burned in the 2018 Keauhou Ranch Fire. It also included a 52.89 km2 area in the Kahuku Unit on the southwestern slope of Mauna Loa (Figure 1). Within both regions (Mauna Loa Road and Kahuku) of the study area, the three cover types—woodland, montane woodland, and montane shrubland zones—occurred [43] (Table 1).
The study area, especially the mid-elevation woodland section, was subject to land clearing and ungulate effects in the 20th century, which lowered biodiversity and created an artificially simplified vegetation community that the area has been naturally regenerating from since ungulates were removed. Cattle were removed in 1948; goats and pigs were removed in the 1970s and 1980s. There are currently no ungulates in the study area.
Persistent non-native grass cover and a lack of native plant seed sources have both been major barriers to full recovery of the mid-elevation woodland zone. There has not been any large-scale A. koa planting in the study area.

2.2. Aerial Photo Interpretation

2.2.1. Field Methods

From September 2019–February 2020, we collected in situ measurements of percent grass cover along 100 m transects (n = 60) that lay outside the area that burned in 2018 using the point-intercept method [45]. The locations of these transects were randomly selected in ArcGIS, stratified by cover type (mid-elevation woodland, montane woodland, and shrubland). We collected data from unburned areas that were similar and close to the areas that burned, but because almost all woodland in the Mauna Loa Road area was burned, we also collected data from unburned patches of woodland in the Mauna Loa Road area as well as from the same elevation range in the Kahuku Unit of the park (Figure 1). Data from 30 of these transects were set aside as validation data, while data from the remaining 30 sites were used as training data to calibrate the estimation of grass cover from oblique-angle aerial imagery taken in 2014 [46]. All aerial images were taken using three true-color bands capturing visible light. Because these sites had not been substantially altered by fire or human intervention since 2014, it was likely that they still reflected the vegetation composition and structure from the year of the fire. Cover types were equally represented among training and validation data.

2.2.2. Data Analysis

Visible light aerial photos were georeferenced by Pictometry International. Although exact zenith angles were not reported, all images were taken at low oblique angles (below the horizon line, typically near 45°). On each aerial photo, we overlaid a 100 m transect line that mirrored the actual transect line from which we took in situ measurements in 2019–2020.
To calibrate our grass cover estimations, we labeled 30 training sites with the corresponding in situ grass cover percentages. We studied the images and grass cover percentages of the training sites and trained ourselves to recognize context clues that signified the amount of grass cover along a transect, such as the amount of grass present directly on a transect, the amount of grass present in the area around the transect, nearby openings in the canopy, and the degree to which a site had rocky substrate or well-developed soil. The use of visual and context clues has been shown to be a viable method of aerial photography analysis in past studies [47,48]. We used two image interpreters (Hamilton and Gill) in our grass cover estimations.
After training, we visually interpreted the percentage of grass cover along the transects of the 30 remaining validation data sites. We estimated grass cover to the nearest 5% and averaged estimates from the two image interpreters together so that we would have a single estimated value per site. We compared these estimates to the in situ grass cover percentage for each site, which had not been looked at before estimation. We then determined the accuracy achieved when we generalized the 5% estimates to varying levels of precision. We generalized them to ten levels of precision (0–9%, 10–19%, 20–29%, 30–39%, 40–49%, 50–59%, 60–69%, 70–79%, 80–89%, and 90–100% grass cover; Table A1), five levels (0–19%, 20–39%, 40–59%, 60–79%, and 80–100% grass cover; Table A2), four levels (0–24%, 25–49%, 50%–74%, and 75–100% grass cover; Table A3), and three levels of precision (0–33%, 34–66%, and 67–100% grass cover; Table A4).
For comparison, we randomly generated percentages in increments of 5% using the RAND Function in Microsoft Excel (version 16.50) and performed a z-test to determine whether the accuracy of the image-based grass cover estimates at each level of precision was significantly (p < 0.05) greater than by chance (Table 2). We also ran a one-way ANOVA to determine whether there was a relationship between pre-fire grass cover and post-fire grass cover to further (anecdotally) validate grass cover estimates, as areas with high post-fire invasive grass cover might coincide with areas that had high pre-fire invasive grass cover as a result of resprouting and pre-existing soil seedbank [18,19].
To quantify bias, we calculated the average of the difference between the in situ grass percentages and the image interpreters’ estimations. We also calculated the average difference between the image interpreters’ estimations to determine variability.

2.3. Fire Severity Effects on Post-Fire A. koa Regeneration

2.3.1. Field Methods

We randomly generated 100 m burned transects in ArcGIS (n = 27) stratified by burn severity (high, medium, and low) and cover type (mid-elevation woodland, montane woodland, and montane shrubland). We determined burn severity categories using a U.S. Forest Service Burned Area Reflectance Classification (BARC) map [49] of the Keauhou Ranch Fire, and cover type using spatial vegetation cover data produced by Green et al. [43] in 2015. Each transect was oriented in a random direction. Like the unburned transects (Section 2.2.1), the burned transects were sampled one year after fire.
In October 2019, we collected in situ data from each burned transect to assess fire severity and post-fire vegetation. At 1-m intervals along each transect, we took point-intercept measurements of the plant species present [45]. We recorded whether each occurrence of a species was alive or dead. We used a hypsometer to record scorch height and char height on the nearest tree or shrub every 5 m along the transect. We counted all trees and shrubs within 1 m of either side of the transect (2 m × 100 m plots). Live trees and shrubs, including post-fire recruitment, were identified by species.

2.3.2. Data Analysis

We tested for a relationship between burn severity and A. koa regeneration density using a mixed-effect linear model fit by restricted maximum likelihood (REML, R [50] lmerTest package [51]). We conducted post hoc t-tests in R (version 4.0.2) using Satterthwaite’s method. All formulae used are found in Table A5.
We set post-fire A. koa regeneration density as a function of minimum scorch height. Minimum scorch height is the lowest scorch height recorded along an entire transect, and is a demonstrated indicator of fire severity [52]. We selected it from among other collinear fire severity metrics for several reasons. First, minimum scorch height is a continuous variable, which some of our models required. Second, it is measured from the ground up, which allows for recording of fine-scale, vertically oriented effects that may be missed by top-down satellite data such as BARC fire severity classification. Minimum scorch height also avoided any error from surrounding features that would have influenced the BARC measurements, which are taken from 1 to 3 pixels of satellite data, each of which represents 30 × 30 m2 on the ground. Third, minimum scorch height values were less skewed than char values, which were zero-inflated. Finally, minimum scorch height captured subtle within-site variability and patchiness in a way that average scorch height did not; average scorch height values could be skewed by outliers and thus give an inaccurate picture of the true condition of a site, while minimum scorch height accurately portrays a threshold level of fire effects that were experienced throughout a plot. We chose not to relativize scorch height values as a percentage of canopy height because of the large difference in canopy heights between woodland and shrubland cover types, which overrode the variability in apparent flame lengths when scorch height was relativized. We measured scorch height using a meter stick or a hypsometer, depending on whether the scorch height extended past our reach.
Because we wanted to control for the influence of differences in post-fire A. koa seed availability, we chose to use surviving A. koa dominance, a categorical measurement of what percentage of a site’s post-fire canopy was composed of A. koa trees, as a random effect in all of our models. Surviving A. koa dominance was calculated by dividing the number of surviving A. koa trees by the number of total surviving trees at each site, and then categorizing the values so that the variable could be used as a random effect. Categories were “A. koa dominated” (>50% A. koa, n = 14), “dominated by other species” (<50% A. koa, n = 6), and “no local canopy seedbank” (there were no surviving trees at a site, n = 7).

2.4. Pre-Fire Grass Cover’s Interaction with Fire Severity, and Its Effects on A. koa Regeneration

Data Analysis

Informed by the precision and accuracy rates determined in addressing Q1 (Section 2.2), we classified the burned sites by estimating pre-fire grass cover using four levels of classification. Following the procedure used to address Q2 (Section 2.3), we used a linear mixed-effects model to estimate post-fire A. koa regeneration density from pre-fire grass cover and other variables, testing as well for significant (p < 0.05) interaction between pre-fire grass cover and fire severity (R, lmerTest package [50,51]). A. koa regeneration density was set as a function of minimum scorch and estimates of pre-fire grass cover. Surviving A. koa dominance was again included as a random effect in all models (Table A5).
We also tested whether there was a relationship between post-fire grass cover and post-fire A. koa regeneration density, with the hypothesis that increased grass recovery might suppress A. koa recruitment, using a one-way ANOVA. We additionally tested whether there was a relationship between pre-fire grass cover and fire severity, isolated from post-fire A. koa regeneration density, using a one-way ANOVA.

3. Results

3.1. Accuracy of Aerial Photo Interpretation

We achieved greater than 60% overall accuracy (67%) in grass cover estimations at a four-category level of precision (Table 3) across all cover types together. Comparisons of classified data to reference data for the other tested levels of precision (3, 5, and 10) can be found in Appendix A (Table A1, Table A2, Table A3 and Table A4). Accuracy was 20% in mid-elevation woodland, 67% in montane woodland, and 100% in montane shrubland (Table 3). There was no trend in whether estimated grass cover tended to be underestimated or overestimated. When an estimation was incorrect, 78% of the time it was only separated from the true value by one class. Grass cover estimates were significantly more accurate than random (z = 168.221, p < 0.001; Table 2). Randomly generated estimates were 20% accurate. There was a significant positive relationship between pre-fire grass cover estimates and post-fire presence of grass cover (df = 1, F = 16.7, p = 0.000397, Appendix B), which anecdotally supports the overall accuracy of the grass cover estimates: high levels of pre-fire grass can imply high levels of grass seed in the soil seedbank, which could lead to higher post-fire grass establishment.
Differences in average grass and canopy cover in the three cover types exacerbated different accuracy rates between them. In montane woodland, grass cover was consistently less than 50%. It was often possible to see the forest floor because of breaks in the canopy, which allowed us to make accurate predictions (Table 3). In montane shrublands, which tended to have open canopies, the ground was highly visible, enabling us to predict grass cover with high accuracy (Table 3). In situ measurements of grass cover at these sites were consistently low (0–24%), as were predictions from visual interpretation of imagery. This lack of variability hindered our ability to analyze interactions between grass cover and fire severity or A. koa regeneration within the montane shrubland cover type. The mid-elevation woodland accuracy rate was low (Table 3) because of the thick canopy cover at the mid-elevation woodland sites, which often made it difficult to view the ground. Comparisons of classified data to reference data for each individual cover type can be found in Appendix A (Table A6, Table A7 and Table A8).
A comparison between the in situ grass percentages and both image interpreter’s grass percentage estimations is displayed in Table 4.
The average difference between the two image interpreters’ estimations was −0.5% in mid-elevation woodland, 11.1% in montane woodland, and 6.8% in montane woodland.

3.2. Fire Severity and Post-Fire A. koa Regeneration

Minimum scorch height and post-fire A. koa regeneration density were positively related (p = 0.006, F23 = 9.115) when all cover types were grouped together (Table 5). Transects with greater burn severity tended to have more regenerating A. koa (Figure 2). Minimum scorch height and pre-fire tree density were also positively related except when pre-fire tree density was high (significant interaction, p < 0.05, F23 = 4.396) (Table 5, Figure 2). Transects with greater A. koa density before the fire tended to have greater post-fire regeneration, but this was not statistically significant (p = 0.073, Table 5). Pre-fire tree density was unrelated to fire severity in the individual cover types, including when they were grouped (p > 0.05; Table 5).
In the montane shrubland and montane woodland cover types, A. koa regeneration density was not affected by minimum scorch height or any other of the tested variables (Table A9, Figure 3). In mid-elevation woodlands, post-fire A. koa regeneration densities exhibited a significant, positive relationship with minimum scorch height (p = 0.005, F5 = 22.734) and a marginally significant, positive relationship (p = 0.091, F5 = 4.369) with pre-fire tree density (Table 6, Figure 2).

3.3. Pre-Fire Grass Cover, Fire Severity, and A. koa Regeneration

We could only analyze the relationship between post-fire A. koa regeneration and pre-fire grass cover’s interaction with minimum scorch height in montane woodland sites, as we did not have reliable pre-fire grass cover estimates for mid-elevation woodland sites and the montane shrubland sites had no variability in grass cover.
At the four-category level of precision in grass cover estimates, there was no significant relationship between pre-fire grass cover and A. koa regeneration, and no significant relationship between A. koa regeneration and the interaction of pre-fire grass cover and minimum scorch height (Table 7, Figure 3). Put another way, the amount of pre-fire grass cover at a site and the severity of the fire did not appear to interact in a way that influences post-fire A. koa regeneration. We additionally did not find a significant relationship between post-fire grass cover and post-fire A. koa regeneration density (Present grass cover, df = 1, F = 0.041, p = 0.841, Appendix B).
We also did not detect a significant relationship between minimum scorch height and pre-fire grass cover when analyzed separately from A. koa regeneration in montane woodland (minimum scorch, df = 1, F = 1.877, p = 0.208, Appendix B).

4. Discussion

Our goal was to understand better the role of fire on A. koa regeneration in Hawaiʻi. As a part of this, we also estimated pre-fire grass cover, as grasses are well known to alter fire spread and in some cases can lead to lower native woody abundance post-fire [20,24,53]. We accurately estimated pre-fire grass cover from aerial imagery, though this may depend on habitat type and canopy cover. Pre-fire grass cover, however, was not found to be related to post-fire A. koa regeneration. In contrast, burn severity and pre-fire tree cover were important factors in one of the three habitat types studies: the mid-elevation woodland habitat.

4.1. Aerial Photo Interpretation

We found that by estimating from aerial photos using our training and validation protocol, land managers can assess grass cover in montane shrubland and montane woodland landscapes with reasonable confidence, and in a shorter amount of time than in situ measurements in remote sites. A greater understanding of grass cover in these landscapes enables more targeted restoration efforts. For example, sites with high invasive grass cover could be prioritized for management actions such as supplemental planting of native woody species, which can lower grass biomass and possibly reduce the ability of fine fuels to carry fire into forest sites [40,54,55]. Improved grass cover data also allows for historical vegetation data to be compared to contemporary aerial photos to investigate how fire can affect successional processes and forest composition. However, a better method is needed for assessing grass cover in heavily canopied mid-elevation woodland areas. In situ measurements showed that mid-elevation woodland sites had highly variable levels of grass, ranging from 8% to 85% of ground cover along our transects, with an average of 48% cover. Being unable to assess grass cover remotely at these sites creates blind spots that hinder efforts to detect and control invasive grass spread, complicate large-scale spatial analyses of grass cover, and decrease land managers’ ability to target restoration and fire hazard management plans effectively.
It would be illuminating to replicate the present study using a different form of remote sensing to assess grass cover, such as light detection and ranging (lidar). High-resolution airborne lidar can detect invasive grass in open tropical savanna woodland habitat [56], but whether it can be used to detect invasive grass in denser tropical woodland is unknown. It may convey greater precision and accuracy than aerial imagery when assessing montane woodland cover types, where there is more visible ground than in mid-elevation woodland. It also might give greater precision within the montane shrubland cover type, potentially enabling observers to record more variation in grass cover within that cover type and allowing analysis of the relationships between invasive grass cover and other variables, including those relating to fire such as post-fire grass cover, native woody regeneration, and grass-fire cycles.
A limitation in this study was our inability to distinguish between invasive grasses and native grasses in our aerial photos. This does not pose a problem for site assessment in the mid-elevation woodland and montane woodland cover types, which we found to have low proportions of native grass to invasive grass during our in situ data collection. We found the montane shrubland cover type to contain a higher proportion of native grass than the other cover types did, so an inability to distinguish between native and invasive grasses might hinder the ability of land managers to gather meaningful information on site needs in montane shrubland. However, because montane shrubland sites consistently displayed low levels of grass cover overall (<10% cover), they would not be high-priority sites for grass control, and this limitation may not be relevant to management.

4.2. Fire Severity Effects on Post-Fire A. koa Regeneration

We found a positive relationship between fire severity (as measured by minimum scorch height) and A. koa regeneration in mid-elevation woodland cover types. This pattern might be due to the fact that A. koa benefits from canopy openness and clearing of debris from the forest floor [36,57,58], which can be brought about by fire. In addition, A. koa seedbanks are able to survive wildfires, and vegetatively resprout from live root stock after fire, while seeds of other species may be consumed, leading to increased post-fire A. koa recruitment [39,59]. The majority of the A. koa we observed regenerating at our sites was regenerating from seed.
If increased light availability as a result of high fire severity is a contributor to increased A. koa regeneration [57], it may be tempered by cover type. A. koa was not abundant in montane shrublands despite high light availability, and there was no correlation between scorch height and post-fire A. koa regeneration in montane woodland. These two cover types experience lower temperatures and precipitation than the mid-elevation woodland cover type does. In addition, the montane shrubland cover type has less soil present than the other cover types (observed during field work), which, like its climate, tends to support lower productivity than the other cover types and could suppress regenerating A. koa. Montane woodland and mid-elevation woodland sites displayed similar canopy closure and stand density, so their differing levels of seed presence in the soil may be what led to differences in A. koa’s response to fire between them.
If A. koa regeneration has a positive relationship with fire severity, as in the mid-elevation woodland cover type, then invasive grasses may also be indirectly promoted via facilitation by A. koa. A koa’s nitrogen-fixing capabilities locally increase soil nitrogen, and this, in combination with higher incident light under the canopy than in more diverse forest, may help facilitate grass abundance [33,37]. Invasive grasses in Hawaiʻi are well known to stall native seedling germination and survival [15,33,60], leading to homogenous landscapes with seemingly stable states of A. koa and grass [21,40]. This would hinder the NPS’s goal of increasing biodiversity in Hawaiʻi Volcanoes National Park [61]. The planned ongoing research of the U.S. Geological Survey (USGS) and the NPS into optimal restoration strategies and restoration treatment success in Hawaiian landscapes, in which various combinations of native species are being planted into restoration sites, may be helpful in determining if planting a broader range of species leads to reduced invasive grass establishment compared to restoration efforts where primarily A. koa is planted. Sites with high burn severity could be targeted for direct seeding of non-A. koa native species to increase biodiversity.
In our study area, there were sites that had burned in both 1975 and 2018. A. koa regeneration and resprouting was abundant following both fires [62]. However, shorter wildfire intervals may affect A. koa regeneration differently. Trauernicht et al. (2018) [40] showed that A. koa seedbanks in the soil deplete themselves extensively after a wildfire event; the seedbanks regenerate aggressively and the regenerating trees self-thin, lowering the overall amount of seed in the soil. This depletion may be in the process of occurring after the Keauhou Ranch Fire, especially given the high rates of A. koa regeneration in the woodland sites (Table 8).
If wildfire intervals in Hawaiʻi continue to shorten [31], A. koa stands regenerating from fire may be killed by another fire before they are able to reach reproductive maturity, as A. koa generally take five years to start bearing seeds [63]. If so, mid-elevation woodland restoration sites would benefit from outplanting of native species that are fire-tolerant and/or reach reproductive maturity quickly (<2 years), such as Dodonaea viscosa, Santalum freycinetianum (‘iliahi), and Santalum paniculatum (‘iliahi) [63,64]. Plants that are outplanted as juveniles will reach sexual maturity faster than those that are direct seeded, which would further protect mid-elevation woodland sites from seedbank depletion due to wildfire. Creating green fuel breaks of native vegetation around these sites could raise local humidity, shade out local grass cover, and increase landscape resistance to fire disturbance while simultaneously increasing landscape resilience after fire disturbances through the planting of fast-growing native species that are quick to reproduce. Additionally, diverse assemblages of native species planted at these sites might help suppress grass by taking up resources that the grass would otherwise benefit from. Green fuel breaks have been shown to be effective in other systems [65,66], and could help protect not only A. koa seedbanks but also other native plants from grass invasion and wildfires. In the Keauhou Ranch Fire, areas with understories that had been restored with biodiverse native species did not carry fire as well as the surrounding simplified A. koa–grass forest [62].

4.3. Pre-Fire Grass Cover, Fire Severity, and A. koa Regeneration

Other researchers have found a link between grass invasion and fire severity in Hawaiʻi [23,25]. We suspect we did not detect significance because of limitations in our dataset; there are environmental variables such as soil moisture that we did not measure and that could have influenced our results. We also could not definitively assess pre-fire forest composition, as many of the burned trees at sites were unidentifiable.
If there is no relationship between A. koa regeneration and the interaction between fire severity and grass cover in montane woodland sites, as our study indicates, then land managers wishing to promote A. koa can continue to plant it in sites with high grass cover without concern of A. koa regeneration being suppressed by grasses after fire. However, the sample size of this analysis was small (n = 10). Similar to the analysis we performed on grass cover’s relationship with fire, there may be factors this analysis did not take into account, such as soil moisture, temperature, species composition, and humidity, which could all affect fire, grass, and A. koa regeneration trends.

5. Conclusions

In this study, we determined that grass cover can be accurately estimated from visual interpretation of oblique-angle aerial photos in Hawaiian montane shrubland and montane woodland ecosystems using four categories of precision. Other methods, such as lidar, may be helpful in areas with denser canopies.
We found that fire intensity, as indicated by minimum scorch height, has a positive effect on post-fire A. koa regeneration densities in mid-elevation woodlands when pre-fire tree density is low, though this trend reversed when pre-fire tree density was high (>70 trees per transect). Our findings imply that, when fire intervals are long enough to allow a sufficient soil seedbank to develop, A. koa is capable of regenerating at high density even after severe fire in low- to medium-density stands (<70 trees per transect). Further research would allow determination of the cause of the negative relationship between minimum scorch height and A. koa regeneration in high-density stands, and determination of how densely A. koa regenerates when fire intervals are less than 43 years, the shortest interval contained in our study area.
We did not detect a relationship between A. koa regeneration and the interaction between pre-fire grass cover and fire severity. This finding only applies to the montane woodland cover type because we could not use the grass cover estimations from the other two cover types in our analysis. If there truly is no relationship between grass cover, fire severity, and A. koa regeneration, then A. koa in grassy montane woodland areas are not at risk of grass suppressing their post-fire regeneration. Further research would be needed to determine whether this lack of a relationship holds true at larger sample sizes and across multiple cover types, and with other environmental variables considered.
Although A. koa regenerates quickly after fire [36,40] and does not appear to be sensitive to potential changes in fire behavior caused by invasive grass, the establishment of A. koa alone is not sufficient to maintain ecological diversity to the NPS’s standards, especially in areas where post-fire grass cover is high and suppresses native understory. Many threatened and endangered plant species of Hawaiʻi Volcanoes National Park are not fire adapted and cannot be planted into grassy areas; thus, creating landscapes that are low in grass cover and protected from wildfire may help with conservation efforts of these species. The planting of other native species alongside A. koa, which is the NPS’s current practice in HAVO, would help achieve this goal in Hawaiʻi.

Author Contributions

Conceptualization, N.S.G. and S.G.Y.; methodology, N.S.G., S.G.Y. and N.P.H.; formal analysis, N.P.H. and N.S.G.; investigation, N.P.H., N.S.G., S.G.Y., R.D.C. and T.D.D.; resources, N.S.G. and S.G.Y.; data curation, N.P.H., N.S.G. and T.D.D.; writing—original draft preparation, N.P.H.; writing—review and editing, N.P.H., N.S.G., S.G.Y., T.D.D. and R.D.C.; visualization, N.P.H.; supervision, N.S.G., S.G.Y. and R.D.C.; project administration, N.S.G. and S.G.Y.; funding acquisition, S.G.Y. and N.S.G. All authors have read and agreed to the published version of the manuscript.

Funding

This research was funded by the USGS Environments Program, and USGS-NPS Natural Resources Preservation Program (NRPP).

Data Availability Statement

Data are available at https://doi.org/10.5066/P9B3V59U (accessed on 1 September 2021) [67].

Acknowledgments

The authors would like to acknowledge Jeff Stallman, Rosanise Odell, and Taylor Saunders for their help with field data collection, Sierra McDaniel and Rhonda Loh of the National Park Service for facilitating fieldwork, Jim Jacobi for access to Pictometry, and Taylor Grant and Steven Iida for assisting with data management. Any use of trade, firm, or product names is for descriptive purposes only and does not imply endorsement by the U.S. Government. We acknowledge that our field work took place in the ahupuaʻa of Keauhou and Kapāpala, in the moku of Ka‘ū, on the mokupuni of Hawaiʻi, which are the ancestral and traditional lands of the Native Hawaiian people.

Conflicts of Interest

The authors declare no conflict of interest. The funders had no role in the design of the study; in the collection, analyses, or interpretation of data; in the writing of the manuscript, or in the decision to publish the results.

Appendix A

Table A1. Classified data, which represent predicted grass cover from visual interpretation, versus reference data, which represent in situ grass cover across all cover types, when using 10 levels of precision. Each value in the table represents a number of transects. The italicized diagonal values represent how many transects were interpreted accurately per grass cover category. The column total represents the number of transects of field-based data that fell within each cover class. Row totals are the number of transects of predicted data that fell within each cover class.
Reference Data
Classified Data 0–9%10–19%20–29%30–39%40–49%50–59%60–69%70–79%80–89%90–99%Row Total
0–9%1410110000017
10–19%10001000002
20–29%20000010003
30–39%00000000000
40–49%10100000002
50–59%00010001103
60–69%00000000000
70–79%00002000002
80–89%00010000001
90–99%00000000000
Column Total1811340111030
Table A2. Classified data versus reference data across all cover types when using 5 levels of precision. Each value in the table represents a number of transects. The italicized diagonal values represent how many transects were interpreted accurately per grass cover category. The column total represents the number of transects of field-based data that fell within each cover class. Row totals are the number of transects of predicted data that fell within each cover class.
Reference Data
Classified Data 0–19%20–39%40–59%60–79%80–99%Row Total
0–19%16120019
20–39%200103
40–59%120115
60–79%002002
80–99%010001
Column Total19442130
Table A3. Classified data versus reference data across all cover types when using 4 levels of precision. Each value in the table represents a number of transects. The italicized diagonal values represent how many transects were interpreted accurately per grass cover category. The column total represents the number of transects of field-based data that fell within each cover class. Row totals are the number of transects of predicted data that fell within each cover class.
Reference Data
Classified Data 0–24%25–49%50–74%75–99%Row Total
0–24%1831022
25-49%11002
50-74%03115
75-99%01001
Column Total1982130
Table A4. Classified data versus reference data across all cover types when using 3 levels of precision. Each value in the table represents a number of transects. The italicized diagonal values represent how many transects were interpreted accurately per grass cover category. The column total represents the number of transects of field-based data that fell within each cover class. Row totals are the number of transects of predicted data that fell within each cover class.
Reference Data
Classified Data 0–33%34–66%67–99%Row Total
0–33%192122
33–66%3025
67–99%0303
Column Total225330
Table A5. R formulae for the calculations carried out for each research question, and their corresponding tables and R packages. The * symbol represents an interaction between two variables.
TableFormulaCorresponding Research QuestionPackage
3Keauhou_Burned_2019$
Grass4Categories ~ Keauhou_Burned_2019$PostFireGrass
2Base
4MidElevationWoodland$KoaRegen ~ (1|MidElevationWoodland$
KoaDominance) +
MidElevationWoodland$MinScorch + MidElevationWoodland$
PreFireTreeDensity
2lmerTest
5MontaneWoodland$KoaRegen ~ (1|MontaneWoodland$KoaDominance) + MontaneWoodland$MinScorch *
MontaneWoodland$Grass4Categories + MontaneWoodland$
PreFireTreeDensity
3lmerTest
6Keauhou_Burned_2019$PostFireGrass ~ Keauhou_Burned_2019$KoaRegen3Base
Table A6. Classified data versus reference data in the montane woodland cover type at 4 levels of precision. Each value in the table represents a number of transects. The italicized diagonal values represent how many transects were interpreted accurately per grass cover category. The column total represents the number of transects of field-based data that fell within each cover class. Row totals are the number of transects of predicted data that fell within each cover class.
Reference Data
Classified Data 0–24%25–49%50–74%75–99%Row Total
0–24%62008
25–49%10001
50–74%00000
75–99%00000
Column Total72009
Table A7. Classified data versus reference data in the mid-elevation woodland cover type at 4 levels of precision. Each value in the table represents a number of transects. The italicized diagonal values represent how many transects were interpreted accurately per grass cover category. The column total represents the number of transects of field-based data that fell within each cover class. Row totals are the number of transects of predicted data that fell within each cover class.
Reference Data
Classified Data 0–24%25–49%50–74%75–99%Row Total
0–24%01102
25–49%11002
50–74%03115
75–99%01001
Column Total162110
Table A8. Classified data versus reference data in the montane shrubland cover type at 4 levels of precision. Each value in the table represents a number of transects. The italicized diagonal values represent how many transects were interpreted accurately per grass cover category. The column total represents the number of transects of field-based data that fell within each cover class. Row totals are the number of transects of predicted data that fell within each cover class.
Reference Data
Classified Data 0–24%25–49%50–74%75–99%Row Total
0–24%1100011
25–49%00000
50–74%00000
75–99%00000
Column Total1100011
Table A9. All of the fire severity metric variables we tested against A. koa regeneration density in the montane shrubland and montane woodland cover types.
VariableDefinition
Average scorch heightThe average height (m) of scorch on trees and shrubs at a site
Maximum scorch heightThe maximum height (m) of scorch on trees and shrubs at a site
Minimum scorch height as percent of canopy heightThe minimum height (m) of scorch on trees and shrubs at a site
Maximum scorch height as percent of canopy heightThe maximum scorch height of a site expressed as a percentage of the site’s average canopy height
Average scorch height as percent of canopy heightThe average scorch height of a site expressed as a percentage of the site’s average canopy height
Average char heightThe average height (m) of char on trees and shrubs at a site
Maximum char heightThe maximum height (m) of char on trees and shrubs at a site
Minimum char heightThe minimum height (m) of char on trees and shrubs at a site
Minimum char height as percent of canopy heightThe minimum char height of a site expressed as a percentage of the site’s average canopy height
Maximum char height as percent of canopy heightThe maximum char height of a site expressed as a percentage of the site’s average canopy height
Average char height as percent of canopy heightThe average char height of a site expressed as a percentage of the site’s average canopy height
Percent mortalityThe percentage of trees and shrubs at a site that were killed by fire
Percent stem mortalityThe percentage of trees and shrubs at a site that experienced stem morality as a result of wildfire

Appendix B

(1) R formula modeling the relationship between pre-fire grass cover estimates and post-fire grass cover using R’s lmerTest package [49,50].
Keauhou_Burned_2019$KoaRegen ~ (1|Keauhou_Burned_2019$KoaDominance) + Keauhou_Burned_2019$MinScorch*Keauhou_Burned_2019$PreFireTreeDensity
(2) R formula modeling the relationship between post-fire grass cover and post-fire A. koa regeneration density using R’s base package [49].
Keauhou_Burned_2019$PresentGrass ~ Keauhou_Burned_2019$KoaRegen
(3) R formula modeling the relationship between minimum scorch height and pre-fire grass cover when analyzed separately from A. koa regeneration in montane woodland [49].
MontaneWoodland$Grass4Categories ~ MontaneWoodland$MinScorch

References

  1. Lein, J.K.; Stump, N.I. Assessing wildfire potential within the wildland–urban interface: A southeastern Ohio example. Appl. Geogr. 2009, 29, 21–34. [Google Scholar] [CrossRef]
  2. Liu, Y.; Stanturf, J.; Goodrick, S. Trends in global wildfire potential in a changing climate. For. Ecol. Manag. 2010, 259, 685–697. [Google Scholar] [CrossRef]
  3. Dennison, P.E.; Brewer, S.C.; Arnold, J.D.; Moritz, M.A. Large wildfire trends in the western United States, 1984–2011: Dennison et al.; Large wildfire trends in the Western US. Geophys. Res. Lett. 2014, 41, 2928–2933. [Google Scholar] [CrossRef]
  4. Westerling, A.L. Warming and earlier Spring increase Western U.S. forest wildfire activity. Science 2006, 313, 940–943. [Google Scholar] [CrossRef] [PubMed] [Green Version]
  5. Rego, F. Land use changes and wildfires. In Responses of Forest Ecosystems to Environmental Changes; Teller, A., Mathy, P., Jeffers, J.N.R., Eds.; Elsevier: London, UK, 1992; pp. 367–373. [Google Scholar] [CrossRef]
  6. Davies, K.W.; Nafus, A.M. Exotic annual grass invasion alters fuel amounts, continuity and moisture content. Int. J. Wildland Fire 2013, 22, 353–358. [Google Scholar] [CrossRef]
  7. Baeza, M.J.; Raventós, J.; Escarré, A.; Vallejo, V.R. Fire risk and vegetation structural dynamics in Mediterranean shrubland. Plant Ecol. 2006, 187, 189–201. [Google Scholar] [CrossRef]
  8. Fernandes, P.M.; Loureiro, C.; Magalhães, M.; Ferreira, P.; Fernandes, M. Fuel age, weather and burn probability in Portugal. Int. J. Wildland Fire 2012, 21, 380–384. [Google Scholar] [CrossRef] [Green Version]
  9. Cawson, J.G.; Duff, T.J.; Swan, M.H.; Penman, T.D. Wildfire in wet sclerophyll forests: The interplay between disturbances and fuel dynamics. Ecosphere 2018, 9, e02211. [Google Scholar] [CrossRef]
  10. McIver, J.D.; Ottmar, R. Fuel mass and stand structure after post-fire logging of a severely burned ponderosa pine forest in northeastern Oregon. For. Ecol. Manag. 2007, 238, 268–279. [Google Scholar] [CrossRef]
  11. Parsons, D.; De Benedetti, S. Impact of fire suppression on a mixed-conifer forest. For. Ecol. Manag. 1979, 2, 21–33. [Google Scholar] [CrossRef]
  12. Brooks, M.L. Plant invasions and fire regimes. In Wildland Fire in Ecosystems: Fire and Nonnative Invasive Plants; General Technical Report RMRS-GTR-42-vol.6; Zouhar, K., Kapler Smith, J., Sutherland, S., Brooks, M.L., Eds.; U.S. Department of Agriculture, Forest Service, Rocky Mountain Research Station: Fort Collins, CO, USA, 2008; pp. 33–46. [Google Scholar] [CrossRef]
  13. Brooks, M.L.; D’Antonio, C.M.; Richardson, D.M.; Grace, J.B.; Keeley, J.E.; DiTomaso, J.M.; Hobbs, R.J.; Pellant, M.; Pyke, D. Effects of invasive alien plants on fire regimes. BioScience 2004, 54, 677–688. [Google Scholar] [CrossRef] [Green Version]
  14. Asner, G.P.; Beatty, S.W. Effects of an African grass invasion on Hawaiian shrubland nitrogen biogeochemistry. Plant Soil 1996, 186, 205–211. [Google Scholar] [CrossRef]
  15. Yelenik, S.G.; D’Antonio, C.M. Self-reinforcing impacts of plant invasions change over time. Nature 2013, 503, 517–520. [Google Scholar] [CrossRef] [PubMed]
  16. Ludwig, F.; Dawson, T.; Prins, H.; Berendse, F.; De Kroon, H. Below-ground competition between trees and grasses may overwhelm the facilitative effects of hydraulic lift. Ecol. Lett. 2004, 7, 623–631. [Google Scholar] [CrossRef]
  17. Litton, C.M.; Sandquist, D.R.; Cordell, S. A non-native invasive grass increases soil carbon flux in a Hawaiian tropical dry forest. Glob. Chang. Biol. 2008, 14, 726–739. [Google Scholar] [CrossRef]
  18. Musso, C.; Miranda, H.S.; Aires, S.S.; Bastos, A.C.; Soares, A.M.V.M.; Loureiro, S. Simulated post-fire temperature affects germination of native and invasive grasses in cerrado (Brazilian savanna). Plant Ecol. Divers. 2015, 8, 219–227. [Google Scholar] [CrossRef]
  19. Blank, R.R.; Young, J.A. Heated substrate and smoke: Influence on seed emergence and plant growth. J. Range Manag. 1998, 51, 577–583. [Google Scholar] [CrossRef]
  20. D’Antonio, C.M.; Vitousek, P.M. Biological invasions by exotic grasses, the grass/fire cycle, and global change. Annu. Rev. Ecol. Syst. 1992, 23, 63–87. [Google Scholar] [CrossRef]
  21. Yelenik, S.G.; D’Antonio, C.M.; Rehm, E.M.; Caldwell, I.R. Multiple feedbacks due to biotic interactions across trophic levels can lead to persistent novel conditions that hinder restoration. Plant Invasions Role Biot. Interact. 2020, 13, 402. [Google Scholar] [CrossRef]
  22. Suding, K.N.; Gross, K.L.; Houseman, G.R. Alternative states and positive feedbacks in restoration ecology. Trends Ecol. Evol. 2004, 19, 46–53. [Google Scholar] [CrossRef] [PubMed]
  23. Kerns, B.K.; Tortorelli, C.; Day, M.A.; Nietupski, T.; Barros, A.M.G.; Kim, J.B.; Krawchuk, M.A. Invasive grasses: A new perfect storm for forested ecosystems? For. Ecol. Manag. 2020, 463, 117985. [Google Scholar] [CrossRef]
  24. Hughes, F.; Vitousek, P.M.; Tunison, T. Alien grass invasion and fire in the seasonal submontane zone of Hawai’i. Ecology 1991, 72, 743–747. [Google Scholar] [CrossRef]
  25. Ellsworth, L.M.; Litton, C.M.; Dale, A.P.; Miura, T. Invasive grasses change landscape structure and fire behaviour in Hawaii. Appl. Veg. Sci. 2014, 17, 680–689. [Google Scholar] [CrossRef]
  26. Wagner, W.H. Ferns naturalized in Hawaii. Occasional Papers of Bernice P. Bish. Mus. 1950, 20, 95–121. [Google Scholar]
  27. Gillespie, T.W.; Chu, J.; Pau, S. Non-native plant invasion of the Hawaiian Islands. Geogr. Compass 2008, 2, 1241–1265. [Google Scholar] [CrossRef]
  28. Athens, J.S.; Ward, J.V. Environmental change and prehistoric Polynesian settlement in Hawai’i. Asian Perspect. 1993, 32, 205–223. [Google Scholar]
  29. Burney, L.P.; Burney, D.A. Charcoal stratigraphies for Kaua’i and the timing of human arrival. Pac. Sci. 2003, 57, 211–226. [Google Scholar] [CrossRef] [Green Version]
  30. Cuddihy, L.W.; Stone, C.P. Alteration of native Hawaiian vegetation: Effects of humans, their activities and introductions. Choice Rev. Online 1990, 28. [Google Scholar] [CrossRef]
  31. Trauernicht, C.; Pickett, E.; Giardina, C.P.; Litton, C.M.; Cordell, S.; Beavers, A. The contemporary scale and context of wildfire in Hawai’i. Pac. Sci. 2015, 69, 427–444. [Google Scholar] [CrossRef]
  32. Stone, C.P.; Smith, C.W.; Tunison, J.T. (Eds.) Alien Plant Invasions in Native Ecosystems of Hawaii: Management and Research; University of Hawaii: Manoa, HI, USA, 1992. [Google Scholar]
  33. McDaniel, S.; Ostertag, R. Strategic light manipulation as a restoration strategy to reduce alien grasses and encourage native regeneration in Hawaiian mesic forests. Appl. Veg. Sci. 2010, 13, 280–290. [Google Scholar] [CrossRef]
  34. Jeffrey, J.; Horiuchi, B. Tree planting at Hakalau Forest National Wildlife Refuge. Nativ. Plants J. 2003, 4, 30–31. [Google Scholar] [CrossRef]
  35. Pejchar, L.; Press, D.M. Achieving conservation objectives through production forestry: The case of Acacia koa on Hawai’i Island. Environ. Sci. Policy 2006, 9, 439–447. [Google Scholar] [CrossRef]
  36. Scowcroft, P.G.; Wood, H.B. Reproduction of Acacia koa after Fire. Pac. Sci. 1976, 30, 177–186. [Google Scholar]
  37. Yelenik, S.G. Linking dominant Hawaiian tree species to understory development in recovering pastures via impacts on soils and litter: Canopy tree effects on understory regeneration. Restor. Ecol. 2017, 25, 42–52. [Google Scholar] [CrossRef]
  38. Keeley, J.E.; Ne’eman, G.; Fotheringham, C.J. Immaturity risk in a fire-dependent pine. J. Mediterr. Ecol. 1999, 1, 41–48. [Google Scholar]
  39. Wilson, S.D.; Tilman, D. Plant competition and resource availability in response to disturbance and fertilization. Ecology 1993, 74, 599–611. [Google Scholar] [CrossRef]
  40. Trauernicht, C.; Ticktin, T.; Fraiola, H.; Hastings, Z.; Tsuneyoshi, A. Active restoration enhances recovery of a Hawaiian mesic forest after fire. For. Ecol. Manag. 2018, 411, 1–11. [Google Scholar] [CrossRef]
  41. National Park Service. Keauhou Ranch Fire. 2018. Available online: https://www.nps.gov/havo/keauhou-ranch-fire.htm (accessed on 22 March 2020).
  42. Esri, HERE, Garmin, Intermap, Increment P Corp., GEBCO, USGS, FAO, NPS, NRCAN, GeoBase, IGN, Kadaster NL, Ordnance Survey, Esri Japan, METI, Esri China (Hong Kong), (c) OpenStreetMap Contributors, and the GIS User Community. Topographic Basemap ArcMap 10.7.1. Available online: https://www.esri.com/en-us/home (accessed on 15 June 2021).
  43. Green, K.; Hall, M.; Lopez, C.; Ainsworth, A.; Selvig, M.; Akamine, K.; Fugate, S.; Schulz, K.; Benitez, D.; Wasser, M.; et al. Vegetation Mapping Inventory Project: Hawai’i Volcanoes National Park; Natural Resource Report NPS/PACN/NRR—2015/966; National Park Service: Fort Collins, CO, USA, 2015. [Google Scholar]
  44. BAER Imagery Support. Keauhou Ranch Fire BARC. 2018. Available online: https://fsapps.nwcg.gov/baer/baer-imagery-support-data-download (accessed on 10 October 2019).
  45. Herrick, J.; Zee, J.; McCord, S.; Courtright, E.; Karl, J.; Burkett, L. Monitoring Manual for Grassland, Shrubland, and Savanna Ecosystems, Volume I: Core Methods, 2nd ed.; USDA-ARS Jornada Experimental Range: Las Cruces, NM, USA, 2017. [Google Scholar]
  46. Pictometry International Corporation. 2014. Available online: https://explorer.pictometry.com/ (accessed on 2 October 2019).
  47. Wulder, M. Optical remote-sensing techniques for the assessment of forest inventory and biophysical parameters. Prog. Phys. Geogr. Earth Environ. 1998, 22, 449–476. [Google Scholar] [CrossRef]
  48. Lillesand, T.M.; Kiefer, R.W. Remote Sensing and Image Interpretation, 4th ed.; Wiley & Sons: New York, NY, USA, 2000; pp. 190–303. [Google Scholar] [CrossRef]
  49. Hudak, A.T.; Robichaud, P.; Jain, T.; Morgan, P.; Stone, C.; Clark, J. The relationship of field burn severity measures to satellite-derived Burned Area Reflectance Classification (BARC) maps. In Proceedings of the American Society for Photogrammetry and Remote Sensing Annual Conference Proceedings, CD-ROM 96–104, Denver, CO, USA, 23 May 2004. [Google Scholar]
  50. R Core Team. R: A Language and Environment for Statistical Computing; R Foundation for Statistical Computing: Vienna, Austria, 2013; Available online: http://www.R-project.org/ (accessed on 1 December 2019).
  51. Kuznetsova, A.; Brockhoff, P.B.; Christensen, R.H.B. LmerTest package: Tests in linear mixed effects models. J. Stat. Softw. 2017, 82, 1–26. [Google Scholar] [CrossRef] [Green Version]
  52. Wagner, C.E.V. Height of Crown Scorch in Forest Fires. Can. J. For. Res. 1973, 3, 373–378. [Google Scholar] [CrossRef] [Green Version]
  53. D’Antonio, C.M.; Tunison, J.T.; Loh, R.K. Variation in the impact of exotic grasses on native plant composition in relation to fire across an elevation gradient in Hawaii. Austral Ecol. 2000, 25, 507–522. [Google Scholar] [CrossRef]
  54. St John, L.; Ogle, D. Green Strips or Vegetative Fuel Breaks; Technical Note, TN Plant Materials No. 16; U.S. Department of Agriculture, Natural Resources Conservation Service: Boise, ID, USA; Salt Lake City, UT, USA, 2009. [Google Scholar]
  55. Trauernicht, C.; Kunz, M. Fuel Breaks and Fuels-Management Strategies for Pacific Island Grasslands and Savannas; College of Tropical Agriculture and Human Resources, University of Hawai’i at Mānoa: Honolulu, HI, USA, 2019. [Google Scholar]
  56. Levick, S.; Setterfield, S.; Rossiter-Rachor, N.; Hutley, L.; McMaster, D.; Hacker, J. Monitoring the distribution and dynamics of an invasive grass in tropical savanna using airborne LiDAR. Remote Sens. 2015, 7, 5117–5132. [Google Scholar] [CrossRef] [Green Version]
  57. Craven, D.; Gulamhussein, S.; Berlyn, G.P. Physiological and anatomical responses of Acacia koa (Gray) seedlings to varying light and drought conditions. Environ. Exp. Bot. 2010, 69, 205–213. [Google Scholar] [CrossRef]
  58. Yelenik, S.G.; D’Antonio, C.M.; August-Schmidt, E. The influence of soil resources and plant traits on invasion and restoration in a subtropical woodland. Plant Ecol. 2017, 218, 1149–1161. [Google Scholar] [CrossRef]
  59. Tunison, J.T.; D’Antonio, C.M.; Loh, R.K. Fire and invasive plants in Hawai’i Volcanoes National Park. In Proceedings of the Invasive Species Workshop: The Role of Fire in the Control and Spread of Invasive Species, Fire Conference, San Diego, CA, USA, 27 November 2000; pp. 122–131. [Google Scholar]
  60. Denslow, J.S.; Uowolo, A.L.; Hughes, R.F. Limitations to seedling establishment in a mesic Hawaiian forest. Oecologia 2006, 148, 118–128. [Google Scholar] [CrossRef]
  61. Loh, R.; McDaniel SSchultz, M.; Ainsworth, A.; Benitez, D.; Palumbo, D.; Smith, K.; Tunison, T.; Vaidya, M. Rehabilitation of Seasonally Dry ‘ōhi ‘a Woodlands and Mesic A. koa Forest Following the Broomsedge Fire, Hawaii Volcanoes National Park; PCSU Technical Report 147; Pacific Cooperative Studies Unit, University of Hawaii at Manoa, Department of Botany: Honolulu, HI, USA, 2007. [Google Scholar]
  62. McDaniel, S.; National Park Service, Volcano, HI, USA. Personal communication, August 2021.
  63. Vozzo, J.A. United States Forest Service, Tropical Tree Seed Manual; U.S. Dept. of Agriculture, Forest Service: Washington, DC, USA, 2002. [CrossRef] [Green Version]
  64. Ainsworth, A.; Kauffman, J.B. Response of native Hawaiian woody species to lava-ignited wildfires in tropical forests and shrublands. Plant Ecol. 2009, 201, 197–209. [Google Scholar] [CrossRef]
  65. Trauernicht, C.; Murphy, B.; Portner, T.; Bowman, D. Tree cover–fire interactions promote the persistence of a fire-sensitive conifer in a highly flammable savanna. J. Ecol. 2012, 100, 958–968. [Google Scholar] [CrossRef]
  66. Curran, T.J.; Perry, G.L.W.; Wyse, S.V.; Alam, M.A. Managing fire and biodiversity in the wildland-urban interface: A Role for Green Firebreaks. Fire 2018, 1, 3. [Google Scholar] [CrossRef] [Green Version]
  67. Hamilton, N.P.; Yelenik, S.G.; Durboraw, T.D.; Cox, R.D.; Gill, N.S. Hawaii Volcanoes National Park Plant Community and Fire Severity Data, 2018–2020: U.S. Geological Survey Data Release. U.S. Geological Survey: Denver, CO, USA. Available online: https://www.sciencebase.gov/catalog/item/6109c35fd34ef8d70566cc6d (accessed on 1 September 2021).
Figure 1. Map of the study area: the Mauna Loa Road area (right) and the Kahuku Unit (left) of Hawaiʻi Volcanoes National Park (HAVO), on the Island of Hawaiʻi. The grey perimeter represents the Keauhou Ranch Fire, which burned in 2018 [44]. The black perimeter represents the boundaries of HAVO [42].
Land 10 00962 g001
Figure 2. When all cover types were grouped together, post-fire A. koa regeneration increased with minimum scorch height. However, at sites with highest pre-fire tree densities, this trend reversed. In mid-elevation woodlands, post-fire A. koa regeneration densities exhibited a significant, positive relationship with minimum scorch height and only a marginally significant, positive relationship (p = 0.091) with pre-fire tree density.
Land 10 00962 g002
Figure 3. Measurements of in situ conditions at burned sites by cover type. The top two panels represent post-fire variables: A. koa regeneration and minimum scorch height. The bottom two panels represent pre-fire variable: grass cover estimates derived from aerial imagery interpretation, and percent A. koa of canopy. The accuracy of the grass cover estimates varied considerably by cover type. Grass cover was estimated categorically, but is displayed as a percentage here. The midline is the median value, and the upper and lower limits of each box are the 75th and 25th percentile, respectively. The points represent outliers.
Land 10 00962 g003
Table 1. Vegetation assemblage, elevation, moisture regime, and vegetation overstory and understory information for each cover type, referenced from Green et al. (2015) [43].
Cover TypeAssemblageElevationMoisture RegimeVegetation OverstoryVegetation Understory
Mid-elevation woodlandA. koa-dominated1200–2100 mMesicOften dense A. koaHerbaceous layer dominated by exotic Ehrharta stipoides, exotic Setaria parviflora (marsh bristlegrass), or exotic Cenchrus clandestinus (Kikuyu grass). Sparse Leptecophylla tameiameiae (pūkiawe) and/or Dodonaea viscosa (‘a‘ali‘i).
Montane woodlandA. koa-dominated1350–2100 mMesicScattered to medium-density A. koa with scattered Sophora chrysophylla (māmane)Dominant Leptecophylla tameiameiae and Dodonaea viscosa, herbaceous layer of exotic Ehrharta stipoides
Māmane-dominated1400–2400 mDrySparse Sophora chrysophylla and sometimes sparse Myoporum sandwicense (naio)Dominant Leptecophylla tameiameiae and Dodonaea viscosa, herbaceous layer of exotic Ehrharta stipoides
Montane shrublandPūkiawe- and ‘a‘ali‘i-dominated1000–2300 mDry to mesicScattered Sophora chrysophyllaOccasional Vaccinium reticulatum (ʻōhelo ʻai); sparse to well-developed layer of exotic Schizachyrium condensatum (bush beardgrass) and exotic Andropogon virginicus (broom sedge) at more mesic sites
Pūkiawe-dominated1500–2000 mDryScattered Sophora chrysophylla and Dodonaea viscosaDeschampsia nubigena (alpine hairgrass), scattered exotic herbaceous species
Table 2. Grass cover estimates were more accurate than randomly generated estimates at 10-, 5-, 4-, and 3-class levels of precision.
Level of Precision (Number of Classes)Average Accuracy of Random ValuesOverall Accuracy of Grass
Cover Estimations
Standard Error of Estimationsz Valuep Value
1010%47%0.002232.393<0.001
520%53%0.002142.799<0.001
424%67%0.003168.221<0.001
339%63%0.00388.972<0.001
Table 3. Accuracy rates of grass cover estimations at four different levels of precision.
Number of Classes34510
Overall accuracy63%67%53%47%
Mid-elevation woodland0%20%0%0%
Montane woodland89%67%56%33%
Montane shrubland100%100%100%100%
Table 4. We subtracted the average of each image interpreter’s grass cover percentage estimations from the averages of the in situ grass percentage values to obtain each interpreter’s average error.
Image InterpreterMid-Elevation Woodland ErrorMontane Woodland ErrorMontane Shrubland
Hamilton−4.8%8.4%2.4%
Gill−4.3%−2.7%−4.3%
Table 5. A. koa regeneration density exhibited a significant, positive relationship with minimum scorch height, except when tree density was particularly high (greater than 70 trees per site, Figure 2). A. koa regeneration density displayed only a marginally significant, positive relationship (p = 0.073) with pre-fire tree density.
FactorCoefficientStandard ErrordfF Valuep Value
Minimum scorch198.66665.803239.1150.006
Pre-fire tree density2.6101.390233.5270.073
Minimum scorch × pre-fire tree density−3.4471.644234.3960.047
Table 6. In mid-elevation woodland, A. koa regeneration density exhibited a significant, positive relationship with minimum scorch height and a marginally significant negative relationship with pre-fire tree density at the p = 0.09 level.
ModelCoefficientStandard ErrordfF Valuep Value
Minimum scorch111.14423.3115.00022.7340.005
Pre-fire tree density−0.7660.3675.0004.3690.091
Table 7. Using four categories of pre-fire grass cover, there was no significant relationship between A. koa regeneration, minimum scorch height, and pre-fire grass cover in the montane woodland cover type.
ModelCoefficientStandard ErrordfF Valuep Value
Minimum scorch−131.076197.96750.4380.537
Grass cover−15.73023.23450.4580.528
Pre-fire tree density−0.2882.71950.0110.920
Minimum scorch × grass cover8.81314.09650.3910.559
Table 8. Average A. koa regeneration was highest in montane woodland sites and lowest in montane shrubland sites.
FactorCover TypeAverage (Stems/Transect)Standard ErrorRange
Regenerating A. koa stem densityMontane shrubland8.4443.90228
Montane woodland170.4045.397379
Mid-elevation woodland65.00021.950167
Publisher’s Note: MDPI stays neutral with regard to jurisdictional claims in published maps and institutional affiliations.

