Abstract
The COVID-19 pandemic has severely impacted the urban real estate market around the world. This study regards the impact of the pandemic as a quasi-natural experiment, using the Difference in Difference model (DID) to examine the short-term impact of this severe public health crisis on the residential land and housing markets in the Yangtze River Delta. The study found that the COVID-19 pandemic has had a significant inhibitory effect on the average price of urban residential land and houses in the Yangtze River Delta. Although the currency oversupply has caused real estate prices in all cities to rise, the price of urban residential land decreased by 13.7% for each additional unit of epidemic severity. The greater the city’s resilience to the pressure of the COVID-19 pandemic, the faster its residential land prices will recover. Empirical research on the new house samples confirmed this conclusion. Local governments should continue to improve their ability to manage abnormal conditions, not only to prevent the spread of the epidemic, but also to gradually promote the recovery of the urban economy, strengthen urban resilience to better respond to health crises, and achieve sustainable urban development.
1. Introduction
In January 2020, Coronavirus Disease 2019 (COVID-19) broke out in Wuhan and spread rapidly. Since the Spring Festival is the period when the population flows most numerously and frequently across provinces and cities in China, COVID-19 quickly spread from Wuhan to economically developed areas across the country. As a region with close economic ties with Wuhan, the Yangtze River Delta and its cities bore the brunt of the impact. Shanghai, Hangzhou, Wenzhou, Taizhou and other places have become the hardest-hit areas of the pandemic. As of 24 March 2020, a total of 81,747 confirmed cases and 3283 deaths have been reported nationwide. In terms of the speed of transmission and the number of infections, COVID-19 far exceeds SARS, which gave the world its first coronavirus epidemic in 2003.
As a serious public health crisis event, the pandemic has disrupted the normal economic order of human society, thereby affecting the expectations of producers, consumers and investors. Without effective control, the pandemic could cause huge economic and property losses in human society. In order to alleviate the impact of the pandemic on the economy, various countries have adopted the method of increasing the supply of money. This led to a rise in real estate prices in the United States, China and other countries. However, the effort to boost economies using loose monetary policies is national, and the various cities within each country are affected by the pandemic differently. Therefore, it is possible to compare the impact of different degrees of the COVID-19 pandemic on urban real estate prices.
Scholars have often discussed the short-term and long-term economic impacts of the series of sudden public crises presented by the pandemic, but they have not reached a consensus.
Some scholars have examined the impact of public crises, such as plague, explosions and floods, on surrounding asset prices. They believe that, in the short term, public crisis events have a significant inhibitory effect on asset prices, but in the long term, the negative impact will disappear [1,2,3,4]. Huang et al. found that after the explosion of Tianjin Port in 2015, the surrounding housing prices dropped by an average of 24%, but returned to normal within a few months [5]. Rajapaksa et al. investigated the impact of floods on Brisbane housing prices. The study found that flooding caused real estate prices in the disaster area to drop by 5%. However, housing prices in high-income suburbs began to recover after two years, while housing prices in low-income suburbs continued to decline [6]. Wong analyzed the impact of 2003’s SARS outbreak on the weekly real-estate prices Hong Kong and found that the real estate market was not excessively affected: average housing prices dropped by 1–3% [7]. In the 10 years following that epidemic, housing prices in Hong Kong rose rapidly. It can, therefore, be seen that the impact of the epidemic was short-lived and controllable. The government can stimulate the rapid recovery of the economy through macro-policy intervention and solve the problem of market failure caused by the pandemic.
At present, the research into the short-term and medium-term impact of COVID-19 pandemic on the real estate market is also gradually emerging [8,9]. Tomal used a GJR-GARCHX model to investigate the impact of COVID-19 pandemic waves on real estate stock returns, and found that pandemic outbreak had a limited impact on real estate company stocks. The first pandemic wave only led to a decline in stock returns in the US [10]. Allan et al. examined the contemporary effect of the COVID-19 pandemic on commercial property rent dynamics in the Asia-Pacific region and the research showed that the impact was detrimental but could be moderated by fiscal stimuli [11]. Cheung et al. applied a price gradient analysis to identify the pandemic’s impact and found that the risk of COVID-19 pandemic is localized and transitory [12]. Del Giudice et al. developed a real estate pricing model, Lotka–Volterra, and found that the housing prices drop by 4.16% in the short term and 6.49% in the mid-term [13].
However, other research found that public crises have a long-term and continuously negative impact on urban economic development. In 1918, the Spanish Flu not only caused 40 million infections, but also caused a sharp drop in housing prices in the United States after World War I. Despite the gradual recovery of the economy, the real estate market remained at a low ebb for a long time [14]. Ambrus et al. studied the short-term and long-term effects on rents of a cholera outbreak that occurred in London’s Broad Street in 1854. The study showed that ten years after the outbreak of cholera, the rent value of houses in the local area had dropped by about 15%, and they remained in a state of low value for more than 160 years [15].
Some researchers believe that the impact of public crises on asset prices is not necessarily entirely negative. Hornbeck and Keniston regarded the Boston Fire in 1872 as a quasi-natural experiment. They found that the prices of the land destroyed by the fire had risen by 15% a year later. The reconstruction after the fire also led to an increase in land prices in the surrounding unburnt areas [16]. The United States, despite becoming a serious disaster area in the COVID-19 pandemic, has shown “unprecedented prosperity” in its residential real estate market. In May 2020, data released by the National Association of Realtors (NAR) showed that the annual sales rate of housing in the United States in August increased by 2.4% on a month-by-month basis, reaching a new high following its peak in December 2006.
Therefore, the impact of public crisis on asset prices is complex and heterogeneous. The extent and direction of its impact involves not only the severity of the crisis itself, but may also be closely related to people’s perception of risk, the government’s governance and prevention abilities, regional resource endowment, and urban resilience.
In the face of complex public crises with highly uncertain risk profiles, the traditional strategy of passive disaster reduction and prevention has been unable to ensure the safety of people and property and realize the sustainable development of urban economies. As a result, the scholars’ research on crisis management has gradually changed from a defensive and fragile perspective to an urban resilience perspective. Holling describes resilience as an ecosystem’s ability to continue to perform its existing functions when changes occur [17]. The strength of the system’s resilience determines the maintenance of the system’s relationship and how the system absorbs the changes. To be more specific, the resilience is defined as how fast a system that has been displaced from equilibrium by a disturbance or shock returns to that equilibrium. Meerow et al. further believe that “urban resilience refers to the ability of an urban system, and all its constituent socio-ecological and socio-technical networks across temporal and spatial scales, to maintain or rapidly return to desired functions in the face of a disturbance, to adapt to change, and to quickly transform systems that limit current or future adaptive capacity” [18]. Alberti et al. also propose that urban resilience can be understood as the ability and extent to absorb and resolve changes before urban structural changes are reorganized [19]. James Simmie argues that the regional economic resilience is the capacity of a local economy to maintain, resume or improve its historical growth path, and the output, employment, income and welfare associated with it, following the immediate impacts of unpredictable external or endogenous shocks, by adapting or reconfiguring its economic, social and institutional structures and arrangements in order to do so [20]. Ron Martin distinguishes four main dimensions of economic resilience: resistance, recovery, re-orientation, and renewal. Then, he expands the definition of regional economic resilience as the capacity of a regional or local economy to withstand or recover from market, competitive and environmental shocks to its developmental growth path, if necessary by undergoing adaptive changes to its economic structures and its social and institutional arrangements, so as to maintain or restore its previous developmental path, or transit to a new sustainable path characterized by a fuller and more productive use of its physical, human and environmental resources [21].
Although the academic definition of urban resilience is complex, some scholars have condensed urban resilience into three aspects (maintenance, resistance and recovery) and construct new indicators to evaluate the strength of urban resilience after public crises. Chen et al. explore the relationship between urban resilience and important factors such as population shift, population, city size, and medical resource reserves through the lens of the COVID-19 pandemic. Their study uses the period from the day of the first confirmed case of COVID-19 to the day after three successive days without a confirmed COVID-19 case to measure the urban resilience [22]. Meanwhile, Zhang et al. used the intra-city travel intensity index in Baidu Migration Data and built the Relative Return-to-Work Index to measure the degree of urban economic recovery after the epidemic [23]. It can, therefore, be seen that there are various measures of urban resilience under abnormal conditions. From the perspectives of crisis control, economic recovery and population mobility, indicators can be found to assess the strength of urban resilience. However, this paper believes that the above indicators are still relatively unsophisticated when measuring urban resilience. For example, Chen only considers the resilience of different cities in terms of controlling the spread of the disease, which is mainly reflected in the maintenance and resistance dimensions of urban resilience. However, this method of measurement ignores the recovery dimension. In the actual practice of disease control, many cities in China have achieved good results in controlling the spread of the COVID-19 through administrative but compulsory measures, such as the suspension of work and school, and issuing “road cards” to restrict population travel. However, the economic cost of these control measures has not been taken into account. In addition, although the Return-to-Work Index constructed by Zhang accounts for the dimension of urban economic recovery, its calculations will be affected by cross-regional migration during the Spring Festival, so it cannot accurately reflect the true urban resumption of production and work.
Building on the existing literature, an exploratory theoretical framework has been constructed. In the market, real estate prices will change with the adjustment of supply and demand. As a serious public health crisis, the COVID-19 pandemic threatens people’s lives. At the same time, it also brings huge risks to the sustainable development of the city’s economy. On the demand side, in order to ensure the safety of people, the government has appealed for people to stay at home and reduce unnecessary travel. These measures have largely restrained the consumption or investment demands in the real estate market, leading to a sharp drop in real estate transaction volume compared with that during the Spring Festival period.
However, urban resilience can alleviate the negative impact of the epidemic on the real estate market. Theoretically, urban resilience can enhance people’s confidence in consumption and investment in the real estate market, for those who perceived the risk of public crises. If local governments have achieved good results in controlling the spread of the epidemic and restoring urban economic, this means that the city is safer for investors and consumers, and that the urban resilience is stronger. Therefore, the cities have actually sent a signal of greater resilience to domestic and international talents and capital through this crisis. While stabilizing the investment expectations of the natives, they also attracted more foreign investors and consumers. Finally, more investment and population inflow can speed up the recovery of the local real estate market.
Based on the theoretical framework, this paper regards the COVID-19 pandemic as a quasi-natural experiment, selects the real estate market in the Yangtze River Delta as the analysis object, and uses the Difference in Difference model to investigate the short-term impact of the COVID-19 on the prices of residential land and houses in the Yangtze River Delta. In addition, the research also reconstructs the urban Return-to-Work Index as a proxy variable of urban resilience, and performs an in-depth analysis of the impact of urban resilience on real estate prices. Finally, based on the results of the empirical test, reasonable policy recommendations are put forward to restore the vitality of the real estate market, attracting talent and capital inflow, and improving government governance and urban resilience.
In terms of research contributions, this study firstly uses the background of the COVID-19 pandemic to re-evaluate urban resilience using intra-city travel intensity data, and measures resilience to the impact of the pandemic from the three previously described aspects of maintenance, resistance and recovery. In addition, the research clarifies the relationship between the COVID-19 pandemic, urban resilience and real estate prices, and found that urban resilience alleviated the negative impact of the epidemic on the real estate market, and provided some policy recommendations for the prevention and control of public crisis and urban governance. Secondly, in order to capture the net effect of public crises, the existing literature has mostly constructed traditional DID models by setting the interaction terms of dummy variables to identify the differences in spatial and temporal dimensions. As the spread of COVID-19 has been both rapid and extensive, there are few cities that have not been impacted. Subjective grouping will lead to inaccurate model recognition. Based on these considerations, this paper chooses a continuous DID model and constructs the continuous variable, the severity of the pandemic, as the core explanatory variable. This can, therefore, identify the changes in real estate prices caused by the differences in pandemic severity in various cities.
2. Empirical Strategy and Data Description
2.1. Empirical Model
In order to identify exogenous shocks, the Differences in Differences model (DID) is often regarded as an effective method for separating the time trend effect and the policy effect. It is, therefore, widely used in policy effect research. Before the outbreak of the COVID-19 pandemic, no one could predict its emergence. Therefore, the pandemic arrived as an entirely exogenous shock to the urban economy. This study uses the DID model to identify changes in real estate prices before and after the epidemic. However, due to the rapid spread of COVID-19 in China, most cities have been affected by it to some extent. Constructing a traditional DID model by setting dummy variables cannot accurately identify the differences in urban land and housing prices caused by the pandemic. This paper, therefore, draws on the continuous DID model used by Nancy et al. [24].
In addition, in order to better identify the net effect of the COVID-19 pandemic on the real estate market and eliminate the interference of other key variables on real estate prices, this study uses the fixed effect model. This is a panel data analysis method that can effectively control the interference of some unobservable or inaccessible key variables. Specifically, the city (individual) fixed effect can solve the problem of missing variables that do not change with time but vary by city (individual). The time fixed effect can solve the possible problem of missing variables that do not vary with individuals but change with time.
Based on these considerations, the equation is as follows:
In Equation (1), is the core explanatory variable and is the severity of the COVID-19 pandemic, which is the cumulative diagnosis rate of a given city from January to June in 2020. The cumulative diagnostic rate is the ratio of the city’s cumulative confirmed cases to the permanent population in each city. is a dummy variable in the time dimension. Before the outbreak of the COVID-19 pandemic (that is, before (and exclusive of) January 2020), it is assigned a value of 0, and after that, it is assigned a value of 1. The coefficient measures the short-term impact of the pandemic on urban real estate market prices. represent the control variables at the city level and the characteristic variables of land. is the time fixed effect, is the city fixed effect, and ε is the random error term.
Furthermore, in order to measure the strength of urban resilience after the pandemic, this study used the intra-city travel intensity index to construct the urban Return-to-Work Index. The construction of the Return-to-Work Index is derived from the Baidu Migration Data. These are the big data of population movement, collected based on individual geographic location services. They map the personal movement trajectory through the location of mobile phone users, thereby capturing the characteristics of population activities within the city. The accuracy of the data reaches the individual level, including the population flow by non-public transportation and combined public transportation. Compared with general statistical yearbooks, Baidu Migration Data are daily, continuous and real-time, so the characterization of urban population travel in different stages of epidemic prevention and control will also be more accurate.
Baidu Migration Data include three indicators: urban daily migration-in index, urban daily migration-out index and urban travel intensity index. These measure the characteristics of urban population flow from two perspectives: inter-city population flow and intra-city population travel. The urban travel intensity index is the indexation result of the ratio of the number of people who travel compared to the resident population in the city, to measure the degree of urban vitality. We considered that the time of the resumption of production and work in all cities in China cannot be earlier than February 9. According to the trend of the daily travel intensity in the Yangtze River Delta, the daily urban travel intensity index, in most cities, tended to be stable in early April 2020. Therefore, the calculation interval for the urban Return-to-Work Index was selected for all working days from 10 February to 27 March 2020. Combined with the daily scatter plots of the urban travel intensity index in each city, there is a strong linear relationship between the urban population travel intensity and time in the all samples. Therefore, we applied this linearly and the regression coefficient is the marginal travel intensity of each city in the selected time, which is the urban Return-to-Work Index.
In summary, the Return-to-Work Index is the marginal growth rate of the urban travel intensity index at the stage of epidemic prevention. It not only refers to the degree to which the urban population has resumed office and production, but also includes the degree to which any travel activities have been resumed. The greater the marginal travel intensity of a city, the faster the recovery speed of urban vitality and the higher the efficiency of returning to work and production, which also means cities have stronger resilience.
This study uses the urban Return-to-Work Index as a measure of urban resilience, and constructs the generalized DID model to explore the relationship between urban resilience and real estate prices. The equation is as follows:
In these terms, is the urban Return-to-Work Index for city i, and the interaction term means a signal of urban resilience. Before the pandemic (i.e., January 2020), all local governments were in the normalized governance stage. The cities still had urban resilience, but no relevant signals were sent to consumers or investors. The interaction term is 0; after January 2020, the pandemic acted as a mechanism for sending urban resilience signals, and people could make investment and consumption decisions based on the results of the resumption of production and work. Therefore, the interaction term is the urban Return-to-Work Index for each city.
2.2. Variables Selection and Data Sources
2.2.1. Dependent Variables
The dependent variables in this paper are the average price of new residential houses and the land price of urban residential land, both of which are processed logarithmically. The monthly average price of new residential houses comes from the China Residential House Price Index (HPI-100), issued by the China Index Academy. The data include information such as the name of the prefecture-level city, time (month) and average price of urban residential land (yuan/square meter). The land prices of urban residential land are published on the China Land Market Website (http://www.landchina.com accessed on 2 September 2020). The data contain the land price, the district and county in which the land is located, the specific address, land area, land level, project name, industry classification, land function, land source, land supply, land-use period, and contract signing date, etc. As, after June 2020, the government increased macro-control in the field of real estate, the property market in some cities has been tightened. Therefore, this study selected January 2019-June 2020 as the sample interval. In addition, taking the availability of data and the representativeness of the sample into account, this paper selected 20 cities located in the Yangtze River Delta. Therefore, in terms of sample size, the housing price is the average housing price in 20 cities each month, so there are only 360 observations. However, the residential land price is the average price of each land transaction, not the average monthly price of residential land in each city. Therefore, the number of observations of land prices is far more than that of housing prices, with 5066 observations.
2.2.2. Independent Variables
According to the continuous DID model setting, the core independent variable is the severity of the pandemic, that is, the ratio of the cumulative number of confirmed cases in each city from January to June 2020 to the number of permanent urban residents in 2019. The data are, respectively, from the Dingxiangyuan database and “National Economic and Social Development Statistical Bulletin in 2019”, issued by the statistics bureaus of each city.
In addition, urban resilience is also an important independent variable in this paper, and is calculated from the urban travel intensity data.
2.2.3. Other Control Variables
At the urban level, this paper, in concert with research performed by other scholars, finds that the scale of urban economic development, population, real estate investment and other factors may affect the price in the housing and land markets [25,26,27]. In addition, due to the potential time lag of the influence of these macroeconomic factors, this study selected 2018–2019 urban per capita GDP, the urban permanent population and real estate development investment as additional control variables. The data are all from the “National Economic and Social Development Statistical Bulletin”. At the parcel level, this study selects the land rank, supply method, and the distance between the plot and the city center as the control variables, to control the impact of land characteristics on residential land prices.
2.3. Descriptive Statistics
The study selects two samples: the housing market and the residential land market in 20 cities from January 2019 to June 2020. Then, we examined the impact of the epidemic and signals of urban resilience on urban real estate prices. The specific variables are shown in Table 1. In the housing market sample, lnhouseprice is the logarithmic value of the average monthly price of housing in the city; ratio_COVID is the severity of the epidemic; workresumption is the urban Return-to-Work Index used to measure the strength of urban resilience; pergdp_1, population and investment are the city’s per capita GDP, population of permanent residents and completed real estate investment in 2018–2019, respectively. In the residential land market sample, landrank is the land grade, with a total of 18 grades. The lower the rank, the higher the comprehensive quality of the land; landsupply records the method of land transfer. If the land is transferred through bidding, auction and listing, the value of the variable is 1; if the land is transferred through other non-market ways, such as agreements, the value is 0. distance is the distance between the plot and the city center. The closer the distance, the higher the value of the land. lnhouseprice is used in the land sample to control the impact of housing prices on land prices.

Table 1.
Descriptive statistics of main variables.
3. Empirical Results
3.1. Statistical Characteristics of the 20 Cities
In this part, line charts are used to display simple descriptive statistics of the impact of the epidemic in 20 cities in the Yangtze River Delta and the performance of their real estate markets. We selected Shanghai, which was more severely affected by the epidemic, and Zhenjiang, which was less affected, as the analysis objects. We also described the overall disaster situation and housing prices of the 20 cities selected in the sample. In January 2020, the COVID-19 pandemic broke out in Wuhan and quickly spread to all parts of the country. Since the 20 cities in the Yangtze River Delta region selected in the sample have close economic and population exchanges with Wuhan, the number of newly confirmed cases in the sample cities rapidly increased to 612 by the end of January 2020 (Figure 1). Big cities like Shanghai are the hardest hit areas of the epidemic, while the underdeveloped Zhenjiang is less affected. Due to the highly contagious nature of the virus and the importation of overseas populations, the number of newly confirmed cases in 20 cities will reach 1020 in February. From March to April, because of a series of policies formulated by the authorities and the increase in public awareness of epidemic prevention, the number of newly confirmed cases began to drop to about 200 and dropped to the lowest point in May. However, there was a slight rebound in June. Overall, the Yangtze River Delta region was initially affected by the epidemic, but the epidemic was quickly brought under control within 3 months.
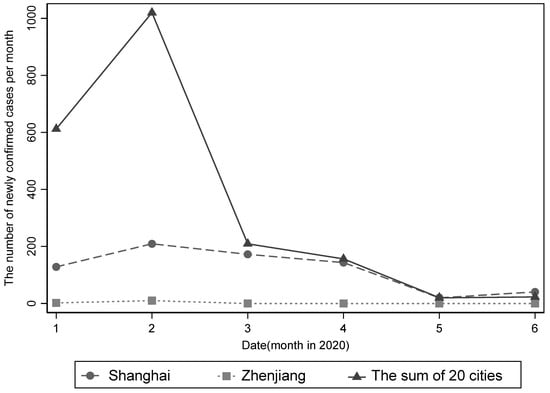
Figure 1.
The severity of COVID-19 in Yangtze River Delta.
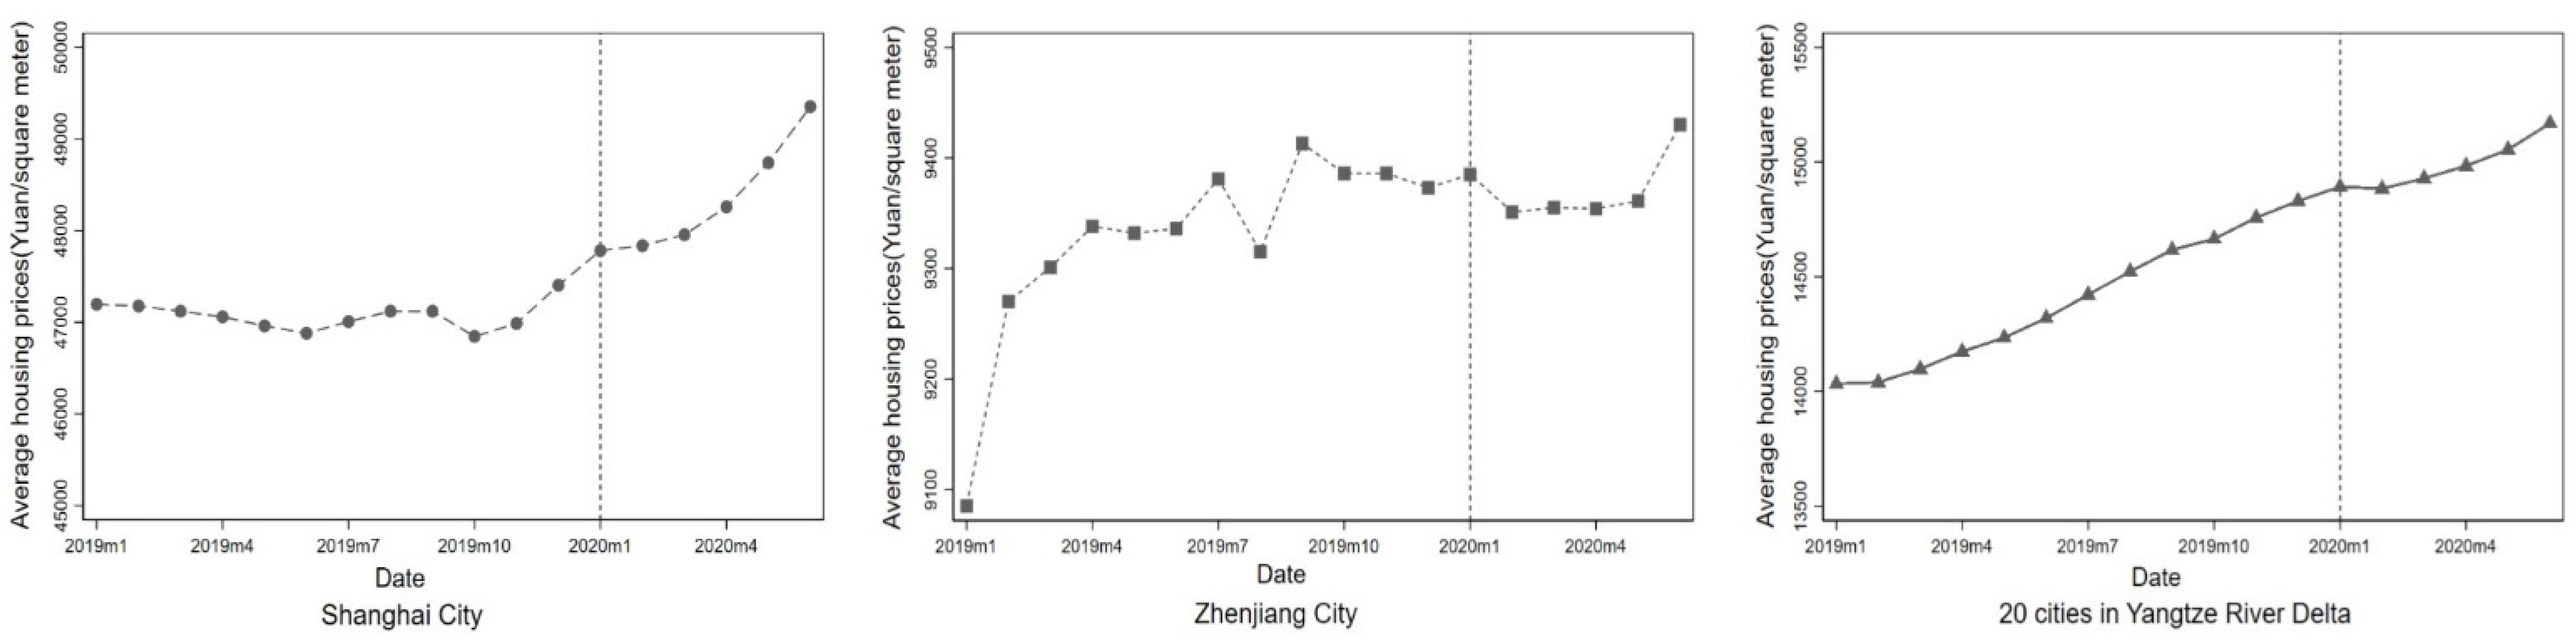
In Figure 2, the average housing prices per month of 20 cities in the Yangtze River Delta are shown to rise slowly during the epidemic period (January–June 2020). The average housing prices in Shanghai, which were severely affected by the epidemic, showed greater growth after the epidemic was effectively controlled (April–June 2020). However, housing prices in the less-affected city Zhenjiang fell briefly after the outbreak of the epidemic. After a four-month trough period, as the epidemic was effectively controlled, housing prices began to rebound upward. However, we cannot see the net impact of the epidemic on urban housing prices from changes in housing prices alone. We believe that the reason for this is because cities that are severely affected by the epidemic tend to have strong economic strength and urban resilience, which can effectively offset the negative impact of the epidemic on housing prices. Additionally, in order to alleviate the downward pressure on the economy, the central authorities implemented an excessive money supply policy, which led to a sharp rise in urban housing prices when the epidemic was under control. Therefore, due to the interference of other factors, we cannot see the net effect of the epidemic on housing prices from the tables, and a more scientific and rigorous empirical analysis is needed.
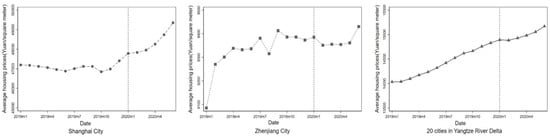
Figure 2.
The trends of average housing prices in the Yangtze River Delta, Shanghai and Zhenjiang.
3.2. Baseline Regression: Residential Land Market Sample
Based on Equations (1) and (2), the research performs a linear regression analysis on the sample of residential land market. The results are shown in Table 2. Column (1) is the result without adding other control variables or controlling the time-fixed effects and city-fixed effects. At this time, the regression coefficients of the core independent variables are significantly positive, which means the more severe the epidemic, the faster the land prices will rise. However, this is not the net effect of the COVID-19 pandemic on real estate prices. The epidemic situation is often more serious in large cities, such as Shanghai, Hangzhou and Wenzhou, because of the increased economic and demographic interaction with Wuhan. Additionally, the real estate prices in the large cities always rise faster than in smaller cities. Therefore, if we do not remove other interfering factors, such as urban characteristics, the urban residential land prices show an upward trend after the COVID-19 pandemic. In column (4), we add the control variables of the urban economic level and the land characteristics level, and control the time-fixed effect and the city-fixed effect. The coefficient of the interaction term ratio_COVID × After is −0.137, which is significant at the 1% level. This means that after removing the impact of other key variables, such as urban economic characteristics, market fundamentals, currency, etc., the net effect of the pandemic on land prices is significantly negative.
Table 2.
The empirical results of COVID-19, urban resilience signals and residential land prices.
The more serious the pandemic, the greater the reduction in the price of residential land. Specifically, for every additional unit in the severity of the pandemic, the prices of urban residential land fell by 13.7%.
In column (5), the interaction term workresumption × After, which represents the urban resilience signal, is added. The results show that the negative impact of COVID-19 on the residential land market still exists, but the coefficient of the interaction term workresumption × After is significantly positive at the 10% level. Despite the pressure of the COVID-19 pandemic, if the city has strong resilience, its residential land market will improve. Although the pandemic has hindered the increase in residential land prices, the more resilient cities are, the faster residential land prices will recover.
The regression coefficients of other control variables are basically in line with expectations. In column (5), landrank is the land grade, its coefficient is significantly negative at the 1% level. The higher the land grade, the lower the land quality, so the residential land price will also be lower; landsupply is the land transfer method, and the coefficient is significantly positive, indicating that the price of land transferred through market-oriented methods such as bidding, auction and listing is much higher than the price of land transferred through agreement; the variable distance is the distance between the plot and the city center. Its coefficient is positive but insignificant, indicating that the variable has little effect on the land price in our sample. pergdp_1 is the per capita GDP of a city with a lag of one year. Its significantly positive coefficient means that the more developed the economy is, the higher the land prices will be. lnhouseprice is the average monthly housing prices in each city, and the coefficient is significantly positive, indicating that urban housing prices promote the increase in land prices.
3.3. Baseline Regression: Housing Market Sample
The study makes the same linear regression on housing market sample, as shown in Table 3. In column (1), the first model does not add other control variables, nor does it control time and city fixed effects. Therefore, housing prices may also be affected by excess money supply, urban economic development level, population and other key factors. The core explanatory variable coefficient is significantly positive at the 1% level, but it is not the net effect of the epidemic shock. According to Equation (1), after controlling for fixed effects and other explanatory variables, the coefficient of the core interaction term ratio_COVID × After in column (3) is −1.5%, which is significant at the 1% level. After removing the interference of other economic factors, the pandemic has had a significant inhibitory effect on the average housing prices in the Yangtze River Delta. Specifically, when compared with different cities, the housing prices in these cities will drop by 1.5% for each further unit of the pandemic severity.
Table 3.
The empirical results of COVID-19, urban resilience signals and housing price.
In column (4), the interaction term workresumption × After is added to test the mechanism of urban resilience signals on housing prices during the epidemic. From the regression results, the coefficient of the interaction term ratio_COVID×After is −1.7%, which is significantly negative at the 1% level. The regression coefficient of the interaction term workresumption × After is 0.45, which is significantly positive at the 1% level. This suggests that the urban resilience signal has driven up urban housing prices. In other words, the COVID-19 pandemic has shown the strength of each city’s resilience under the pressure of the public crisis and transmitted the signals to consumers or investors. The stronger the urban resilience, the faster the urban vitality will be restored. The urban housing market will recover more quickly, despite the negative impact of the pandemic and the price of new houses will gradually rise.
In the housing sample, the coefficients of the control variables are consistent with expectations. The coefficients of per capita GDP (pergdp_1), the number of permanent residents (population), and completed real estate investment (investment) are all significantly positive at the 1% level. This means that the higher the level of economic development, the larger the population and the more sufficient the investment in real estate, the higher the residential land prices, which also shows that the characteristics of the cities have been effectively controlled.
4. Further Discussions
A large number of empirical studies have confirmed the negative impact on asset prices of public crises such as epidemics, floods and nuclear leaks [28]. In the short term, the more serious the crisis, the greater the decline in asset prices; however, the long-term impact of the crisis is more controversial. The differences in economic development level and resource endowment between regions may lead to the heterogeneity of the impact.
This research uses the DID model to confirm that, after removing other disruptive factors, the more severely affected a city is by the pandemic in the Yangtze River Delta, the more rapidly the price of new houses and residential land will decline in the short term. In recent years, the cities in Yangtze River Delta have been an economic benchmark for other cities in transforming development patterns, optimizing economic structure and transforming growth momentum. However, the sudden COVID-19 outbreak added great uncertainty to urban economic development. Most of the cities are facing production stagnation, consumption and investment demand decline, as well as other serious problems. Specifically, due to the COVID-19 pandemic and in light of the fact that the virus is highly contagious and harmful, the China Real Estate Association proposed on January 26 that “real estate development companies should temporarily stop sales office activities and resume after the epidemic” (Available online: http://www.fangchan.com/prefecture/41/2020-01-26/6627165527213412844.html accessed on 10 December 2020). In late January, real estate turnover plummeted 95% compared with the previous Spring Festival period. Before mid-February, most of the sales offices were essentially closed, the demand for homes was suppressed, and real estate sales decreased significantly in the short term. Sales obstruction increased the pressure on capital turnover for real estate enterprises, and the ability to acquire land and build houses has declined in the short term. In terms of production and construction, some cities with severe outbreaks will continue to postpone their resumption. Workers cannot return to work, and scheduled development projects are continuously delayed. According to “the land price test report of major cities in China in the first quarter of 2020”, the growth rate of residential land prices in major cities decreased by 0.32% compared with the previous quarter (Available online: http://gi.mnr.gov.cn/202004/t20200417_2508842.html accessed on 10 December 2020). Based on this, in the short term, both supply and demand in the real estate markets in the Yangtze River Delta have been negatively affected by the pandemic and entered a period of stagnation, and the real estate market prices have been suppressed as a result.
In addition to the direct impact of the pandemic, asset price changes also depend on the adjustment of a series of investment or consumption decisions based on the risk perception of public crises [29]. Behavioral economics and psychological theories have pointed out that people’s perceived risk of public crisis events is different from the actual risks as assessed and determined by experts. Perceived risks are not only derived from the hazards of the incident itself, but also affected by factors such as government control capabilities, regional resource endowments and media propaganda [30,31]. The size of the perceived risk will eventually make people adjust the structure and direction of investment and consumption, thereby affecting the changes in asset prices.
From the perspective of epidemic prevention consequences, local authorities in China have shown completely different governance capabilities, so the government is not a “monolithic” one. Different crisis management capabilities of local governments directly lead to great differences in their urban resilience. In the process of combatting the pandemic, the central authorities in China issued a guideline “on the premise of ensuring effective epidemic control, accelerating the restoration of production and living order, and successfully completing all the work for economic and social development” (Available online: https://baijiahao.baidu.com/s?id=1662541336518395006&wfr=spider&for=pc accessed on 24 August 2021). The local authorities were required to implement differentiated combatting strategies. Therefore, local authorities have greater autonomy in formulating and implementing specific epidemic prevention strategies. Central authorities will monitor the local epidemic prevention performance. On the one hand, they encourage and promote good local policy innovations. On the other hand, they promptly curb local authorities from using the power of epidemic prevention to disrupt the production and living order.
For example, after the outbreak of the epidemic, the Wuhan Government not only failed to disclose important information in time, but also did not take effective measures to control the spread of the virus, causing panic and outflow among the people. In contrast, in Henan Province, in order to achieve good epidemic prevention results, the local government adopted a “one size fits all” blockade policy. For example, the main roads were cut off, the basic demands for living were restricted, and public power was not constrained under the cloak of epidemic prevention. The epidemic was quickly controlled, but this also severely disrupted the normal order of life and production in the city. However, the Hangzhou government has balanced the relationship between epidemic control and economic recovery well. It was the first to introduce a “health code” system and implement the three-color dynamic management of “green code, red code, and yellow code” for citizens and those who intend to enter Hangzhou. A large number of people returned to work after applying for health codes. The “health code” system played an important role in restoring the normal operation of Hangzhou’s economy while carrying out effective epidemic management for citizens. Due to the “health code”, the system has achieved good epidemic prevention consequences. Therefore, the central authority has promoted it in all parts of the country and realized the mutual recognition of “health codes” in various regions.
The introduction of various public policies is an important manifestation of urban resilience under abnormal conditions. Therefore, the COVID-19 pandemic is not only a crisis, but also a test of the social governance system, governance capabilities and urban resilience [32,33].
The cities that achieved good pandemic prevention results conveyed strong signals to talent and capital in both domestic and international markets. A large number of studies have shown that the formation of the market and profitable space is inseparable from the support of local governance. The quality of public services provided by local governments under normal and abnormal conditions will determine the strength of urban resilience, thereby affecting people’s investment and consumption choices. Cities with higher resilience tend to have an advantage in the competition, attracting capital and talent between cities. More investment and population inflow will be more conducive to the development of the urban real estate market. It will have a positive effect on the residential housing and land prices [34]. The empirical results of this paper also show that urban resilience can effectively withstand the negative impact of the COVID-19 pandemic on the urban real estate market. The stronger the urban resilience, the faster housing and residential land prices will recover.
5. Conclusions and Outlook
5.1. Conclusions
The COVID-19 pandemic has severely disrupted the normal order of the Chinese economy and brought the real estate market to a standstill. In order to ensure the safety of people’s lives and property and to ease the pressure of the economic downturn, the central government formulated guidelines for “scientific and precise prevention and control” and local governments also launched an emergency response mechanism for major public health emergencies. These measures consolidated people’s confidence in investment and consumption and promoted the gradual recovery of the city’s main asset prices. The empirical results of this study show that, in the short term, the COVID-19 pandemic has had a significant negative effect on the prices of new houses and residential land in the Yangtze River Delta. As a benchmark for China’s regional economy, real estate prices in the Yangtze River Delta have generally maintained an upward trend in recent years. However, the pandemic has led to large differences in the price fluctuations in houses and residential land in various cities. Specifically, for every additional unit of pandemic severity, the prices of new houses and residential land will drop by 1.5% and 13.7%, respectively.
In addition, this study also confirmed the positive effect of urban resilience signals on the urban housing and residential land markets during the pandemic. The pandemic’s severity has tested both the Chinese government’s governance ability and Chinese urban resilience in extraordinary conditions. In the early stage of the pandemic, different local governments also fully exerted their autonomy and initiative to implement a series of pandemic response measures, and quickly received feedback. Some cities gradually resumed economic production while controlling the spread of the disease via digital means. However, others have violated basic market regulations in order to achieve pandemic prevention targets. Therefore, the strength of resilience in different cities can be fully demonstrated through the efficiency of production and work resumption. While controlling the pandemic, cities with stronger resilience also actively promote the resumption of production and work, meaning that urban vitality recovers faster. However, cities with weak resilience often cannot balance the relationship between pandemic control and the resumption of work, and urban vitality recovers more slowly. The urban resilience signals transmitted through the pandemic response effect will then affect the flow of talent or capital between various cities. Therefore, this study used marginal travel intensity as an indicator of urban resilience, and constructed a generalized DID model. This found that cities with stronger resilience will send stronger signals, and its new housing and residential land markets will also recover faster from the negative impact of the pandemic.
5.2. Policy Implications
In this crisis, the stable operation of the urban real estate market is inseparable from the effective control of the pandemic. This study shows that the more severe the pandemic, the greater the negative impact on the real estate market. Therefore, only by controlling the highly contagious and harmful coronavirus within the minimum range in the shortest time can the negative impact of the pandemic be minimized.
First, as the main implementer of pandemic prevention and control, the government should not only adopt administrative control methods, but also actively mobilize social forces to improve the efficacy of resource allocation. Besides this, governments should fully endorse people’s autonomy in pandemic prevention; guide the people to realize the seriousness of the pandemic through publicity, education, information disclosure and other means; and enhance their risk perception within a short time, so as to make scientific consumption or investment decisions.
Second, the government should attach importance to the value of social organizations in epidemic and pandemic prevention, embed the strength of social organizations into the whole national epidemic prevention system, and maximize allocation efficiency according to the respective resource advantages of multiple subjects.
Third, local governments should improve urban resilience, cope with the uncertainty of urban risk by making use of resilience thinking, and allow for the management of uncertain risks and the construction of resilient cities under normal conditions to be effectively connected. It is important to balance the relationship between epidemic control and economic development. The examination of the pandemic confirms that the resilience of Chinese cities is uneven. The construction of governance systems under abnormal conditions in some regions is still in the exploratory stage. A lot of experience has been gained and lessons learned in epidemic control. Some cities have also created a precedent in their digital management of the pandemic. Some measures are promoted nationwide, such as those of Hangzhou and Shanghai. The empirical results of this paper show that the improvement in urban resilience can not only minimize the negative impact of the pandemic on asset prices, but also accelerate the recovery of urban asset prices in the pandemic’s aftermath. Stronger resilience often means that, in conjunction with effective control of the pandemic, the city’s vitality will recover faster, and the resumption of production and work will proceed more efficiently. People will also prefer to invest or consume in such a city, thereby attracting more capital and increasing the population. Therefore, in order to improve governance capabilities, local governments should actively promote digital transformation and fully accept the potential role of big data in crisis management. It is vital to strengthen learning among cities, break information islands, realize governance transformation and construct resilient cities as soon as possible. In the end, the healthy and sustainable development of the real estate market in the Yangtze River Delta will be realized.
5.3. Outlook for the Research
In future research, alongside the enrichment of data, it is important to compare the trends of housing prices in different countries and regions before and after the epidemic under the influence of various monetary policies, cultures, investors’ uniqueness and the competences of public authorities.
Author Contributions
Conceptualization, C.T., X.P. and X.Z.; funding acquisition, C.T. and X.Z.; methodology, C.T. and X.P.; project administration, C.T. and X.Z.; software, X.P.; validation, C.T. and X.P.; formal analysis, C.T. and X.P.; investigation, X.P.; resources, C.T. and X.Z.; data curation, X.P.; writing—original draft preparation, X.P.; writing—review and editing, C.T., X.P. and X.Z.; visualization, X.P. All authors have read and agreed to the published version of the manuscript.
Funding
This research was funded by the Fundamental Research Funds for the Central Universities and the Strategic Development Research Platform of Hangzhou City-Zhejiang University.
Data Availability Statement
The reader may contact the corresponding author for the relevant data and do file in this article.
Conflicts of Interest
The authors declare no conflict of interest.
References
- Chu, X.; Lu, C.; Tsang, D. Geographic Scope and Real Estate Firm Performance during the COVID-19 Pan-demic. J. Risk Financ. Manag. 2021, 14, 309. [Google Scholar] [CrossRef]
- Lamond, J.; Proverbs, D.; Hammond, F. The Impact of Flooding on the Price of Residential Property: A Transactional Analysis of the UK Market. Hous. Stud. 2010, 25, 335–356. [Google Scholar] [CrossRef]
- Sawada, Y.; Nakata, H.; Sekiguchi, K.; Okuyama, Y. Land and Real Estate Price Sensitivity to a Disaster: Evidence from the 2011 Thai Floods. Econ. Bull. 2018, 38, 89–97. [Google Scholar]
- Tanaka, K.; Managi, S. Impact of a Disaster on Land Price: Evidence from Fukushima Nuclear Power Plant Accident. Singap. Econ. Rev. 2016, 61, 1640003. [Google Scholar] [CrossRef] [Green Version]
- Huang, Y.; Yip, T.L.; Liang, C. Risk Perception and Property Value: Evidence from Tianjin Port Explosion. Sustainability 2020, 12, 1169. [Google Scholar] [CrossRef] [Green Version]
- Rajapaksa, D.; Zhu, M.; Lee, B.; Hoang, V.N.; Wilson, C.; Managi, S. The impact of flood dynamics on property values. Land Use Policy Int. J. Cover. All Asp. Land Use 2017, 69, 317–325. [Google Scholar] [CrossRef]
- Wong, G. Has SARS Infected the Property Market? Evidence from Hong Kong. J. Urban Econ. 2008, 63, 74–95. [Google Scholar] [CrossRef] [PubMed]
- Baek, S.; Mohanty, S.K.; Mina, G. COVID-19 and Stock Market Volatility: An Industry Level Analysis. Financ. Res. Lett. 2020, 37, 101748. [Google Scholar] [CrossRef]
- Sène, B.; Mbengue, M.L.; Allaya, M.M. Overshooting of sovereign emerging eurobond yields in the context of COVID-19. Financ. Res. Lett. 2021, 38, 101746. [Google Scholar] [CrossRef] [PubMed]
- Tomal, M. Modelling the Impact of Different COVID-19 Pandemic Waves on Real Estate Stock Returns and their Volatility Using a GJR-GARCHX Approach: An International Perspective. J. Risk Financ. Manag. 2021, 14, 374. [Google Scholar] [CrossRef]
- Allan, R.; Liusman, E.; Lu, T.; Tsang, D. The COVID-19 Pandemic and Commercial Property Rent Dynamics. J. Risk Financ. Manag. 2021, 14, 360. [Google Scholar] [CrossRef]
- Cheung, K.S.; Yiu, C.Y.; Xiong, C. Housing Market in the Time of Pandemic: A Price Gradient Analysis from the COVID-19 Epicentre in China. J. Risk Financ. Manag. 2021, 14, 108. [Google Scholar] [CrossRef]
- Del Giudice, V.; De Paola, P.; Del Giudice, F.P. COVID-19 Infects Real Estate Markets: Short and Mid-Run Effects on Housing Prices in Campania Region (Italy). Soc. Sci. 2020, 9, 114. [Google Scholar] [CrossRef]
- Trilla, A.; Trilla, G.; Daer, C. The 1918 “Spanish Flu” in Spain. Clin. Infect. Dis. 2008, 47, 668–673. [Google Scholar] [CrossRef] [Green Version]
- Ambrus, A.; Field, E.; Gonzalez, R. Loss in the Time of Cholera: Long-Run Impact of a Disease Epidemic on the Urban Landscape. Am. Econ. Rev. 2020, 110, 475–525. [Google Scholar] [CrossRef] [Green Version]
- Hornbeck, R.; Keniston, D. Creative Destruction: Barriers to Urban Growth and the Great Boston Fire of 1872. Am. Econ. Rev. 2017, 107, 1365–1398. [Google Scholar] [CrossRef] [Green Version]
- Holling, C.S. Resilience and Stability of Ecological Systems. Annu. Rev. Ecol. Syst. 1973, 4, 1–23. [Google Scholar] [CrossRef] [Green Version]
- Meerow, S.; Newell, J.P.; Stults, M. Defining urban resilience: A review. Landsc. Urban Plan. 2016, 147, 38–49. [Google Scholar] [CrossRef]
- Alberti, M.; Marzluff, J.M.; Shulenberger, E.; Bradley, G.; Ryan, C.; Zumbrunnen, C. Humans into Integrating and Ecology: Opportunities for Studying Urban Challenges Ecosystems. BioScience 2003, 53, 1169–1179. [Google Scholar] [CrossRef] [Green Version]
- Simmie, J. Regional Economie Resilienee: A Sehumpeterian Perspective. Raumforsch. Raumordn. 2014, 72, 103–116. [Google Scholar] [CrossRef]
- Martin, R.; Sunley, P. On the Notion of Regional Economic Resilience: Conceptualization and Explanation. J. Econ. Geogr. 2014, 15, 1–42. [Google Scholar] [CrossRef] [Green Version]
- Chen, J.; Guo, X.; Pan, H.; Zhong, S. What determines city’s resilience against epidemic outbreak: Evidence from China’s COVID-19 experience. Sustain. Cities Soc. 2021, 70, 102892. [Google Scholar] [CrossRef] [PubMed]
- Zhang, W.; Zhuo, H.; Dong, Z. Labor shortage during the COVID-19 pandemic: Revisiting China’s labor migration and work resumption policies. China Popul. Resour. Environ. 2020, 30, 29–39. (In Chinese) [Google Scholar]
- Qian, N. Missing Women and the Price of Tea in China: The Effect of Sex-Specific Earnings on Sex Imbalance. Q. J. Econ. 2008, 123, 1251–1285. [Google Scholar] [CrossRef]
- Quan, D.C.; Titman, S. Do Real Estate Prices and Stock Prices Move Together? An International Analysis. Real Estate Econ. 2010, 27, 183–207. [Google Scholar] [CrossRef]
- Wang, R. The Structure of Chinese Urban Land Prices: Estimates from Benchmark Land Price Data. J. Real Estate Financ. Econ. 2009, 39, 24–38. [Google Scholar] [CrossRef]
- Yang, S.; Hu, S.; Li, W.; Zhang, C.; Torres, J.A. Spatiotemporal Effects of Main Impact Factors on Residential Land Price in Major Cities of China. Sustainability 2020, 9, 2050. [Google Scholar] [CrossRef] [Green Version]
- Zhu, H.; Deng, Y.; Zhu, R.; He, X. Fear of Nuclear Power? Evidence from Fukushima Nuclear Accident and Land Markets in China. Reg. Sci. Urban Econ. 2017, 60, 139–154. [Google Scholar] [CrossRef]
- Cooper, T.; Faseruk, A. Strategic Risk, Risk Perception and Risk Behaviour: Meta-Analysis. J. Financ. Manag. Anal. 2011, 24, 20–29. [Google Scholar]
- Genesove, D.; Mayer, C. Loss Aversion and Seller Behavior: Evidence from the Housing Market. Q. J. Econ. 2001, 116, 1233–1260. [Google Scholar] [CrossRef] [Green Version]
- Slovic, P.; Flynn, J.; Mertz, C. Nuclear power and the public. In Cross-Cultural Risk Perception; Springer: Boston, MA, USA, 2000; pp. 55–102. [Google Scholar]
- Moon, M. Fighting Against COVID-19 with Agility, Transparency, and Participation: Wicked Policy Problems and New Governance Challenges. Public Adm. Rev. 2020, 80, 651–656. [Google Scholar] [CrossRef]
- Woo, J.J. Policy Capacity and Singapore’s Response to the COVID-19 Pandemic. Policy Soc. 2020, 39, 345–362. [Google Scholar] [CrossRef]
- He, Z.; Nagel, S.; Song, Z. Treasury Inconvenience Yields during the COVID-19 Crisis. J. Financial Econ. 2020. [Google Scholar] [CrossRef]

Publisher’s Note: MDPI stays neutral with regard to jurisdictional claims in published maps and institutional affiliations. |
© 2021 by the authors. Licensee MDPI, Basel, Switzerland. This article is an open access article distributed under the terms and conditions of the Creative Commons Attribution (CC BY) license (https://creativecommons.org/licenses/by/4.0/).