Article

Assessment of Value Changes and Spatial Differences in Land Use Based on an Empirical Survey in the Manas River Basin

1
College of Science, Shihezi University, Shihezi 832000, China
2
Xinjiang Institute of Ecology and Geography, Chinese Academy of Sciences, Urumqi 830011, China
*
Author to whom correspondence should be addressed.
Land 2021, 10(9), 961; https://doi.org/10.3390/land10090961
Submission received: 26 July 2021 / Revised: 6 September 2021 / Accepted: 7 September 2021 / Published: 10 September 2021
(This article belongs to the Section Landscape Ecology)

Abstract

:
Land integration is an important means of increasing the multifunctional value of arable land. The scientific measurement of the integrative value of arable land before and after land consolidation can improve farmers’ overall understanding of the value of arable land, increase their awareness of arable land protection, and encourage them to implement arable land protection policies. Additionally, it can provide a theoretical basis for the formulation of reasonable compensation standards for arable land in various areas of the Manas River Basin and effectively promote the use of the “Shawan model”. In this paper, the sample used for the survey was made up of 380 farmers from 10 villages in three different regions of Shawan City (county-level city). The participatory farmer assessment (PRA) method was used to conduct a detailed investigation of the integration of farmers’ cultivated land, while the landscape pattern index method was used to analyze the intensity of the cultivated land integration pattern. By constructing a measurement system for the integrative value of cultivated land and adding up the economic, pro-ecological, and social values before and after the integration of the cultivated land, estimated using the income reduction method, the equivalent factor method, and the shadow engineering method, we found that the cultivated land in each region of Shawan City (county-level city) was more effectively integrated, the scale of the field expanded, the shape of the patches tended to be more regular, and the field surface more flat. However, the degree of integration varied from region to region, with the degree of integration from the largest to the smallest as follows: oasis agricultural zone > oasis/desert ecological zone > hilly zone. We found that the integration of cultivated land has a significant effect on the integrated value of cultivated land, and the value of cultivated land in different regions showed different degrees of improvement after integration. The cultivated land of villages located in the oasis/desert ecotone showed a significant overall improvement after integration, followed by cultivated land in the oasis agricultural area. The value of cultivated land increased significantly, while the value of cultivated land in the hilly area showed less improvement after integration. The value of cultivated land integration in different regions is related to the intensity of the cultivated land integration, the per capita cultivated land area, the ecosystem biomass, and the crop planting area. The purpose of this paper is to effectively diagnose and promote the “Shawan Model” (land integration), formulate reasonable compensation standards for cultivated land in different regions of the Manas River Basin, and implement cultivated land protection policies.

1. Introduction

Cultivated land resources are an important guarantee for national food security; are the most important means of agricultural production in the Earth’s life system; and have multi-functional value, which is mainly reflected in maintaining the economic value of human production and living conditions, ensuring national food security, safeguarding people’s employment, providing pension insurance and other social values, maintaining water and soil, producing food, regulating the climate, etc. [1,2,3]. However, in the practice of farmland transfer and land expropriation, the concept of the multi-functional value of cultivated land has not been fully reflected in the transaction price of cultivated land and the compensation standard for land expropriation or a single economic value, thus leading to the real value of cultivated land being underestimated, greatly reducing farmers’ income and hindering the development of rural areas [4,5].
Land consolidation is an important means of promoting the value of cultivated land. This term refers to the integrative consolidation of fields, water, roads, forests, and villages; improving the quality of cultivated land; increasing the effective cultivated land area; and possibly improving agricultural conditions and the environment through various measures [6]. Gaining an in-depth understanding and accurate evaluation of multiple values before and after cultivated land consolidation can ensure that farmers receive reasonable compensation in the process of land consolidation so that cultivated land can be effectively combined with capital, labor, and other resources, thus providing a scientific basis for land resource protection decisions [7,8].
In recent years, scholars have carried out a series of studies on the value of cultivated land. Sullivan et al. [9] indicated that identifying and protecting farmland with a high natural value was a major goal of European rural development. Bastian et al. [10] also pointed out that estimating the value of cultivated land is crucial to policies aimed at protecting open space, using agriculture to protect easements, and solving land use conflicts. Ecosystem services provided by agriculture include the management of water, soil, and (micro)climate systems [11]; aesthetic and cultural services; and enhanced ancillary services. However, given the supply incentives that prices [12,13] can create, Swinton et al. [14] proposed the need for non-market valuation techniques, such as travel costing, hedonic valuation, and the cost or factor income-based valuation of agricultural land.
In order to improve the understanding of the natural protection value of agricultural land, Geneletti [15] proposed an evaluation method for the natural protection value of agricultural landscape based on common data. Chinese scholars have carried out a great deal of research on the function and value of farmland improvement. Wu Zhaojuan [16] believed that land consolidation could improve the soil conditions, irrigation conditions, and external traffic conditions of cultivated land; increase the scale of cultivated land management; reduce the ground slope of cultivated land; and thus improve the production capacity of cultivated land. Zhang Zhengfen et al. [17] proposed that land consolidation affects the utilization efficiency of cultivated land by affecting the scale, fragmentation, and density of the field. Wang Yuying et al. [18] pointed out that land consolidation could improve the output efficiency of cultivated land by promoting the development of agricultural modernization. According to the research of various scholars, agricultural land consolidation mainly improves the quality of cultivated land by improving the level of cultivated land infrastructure, improving soil conditions, and reducing the degree of fragmentation of the cultivated landscape, thereby affecting the production function and value of agricultural land.
At present, mainstream land transfer models have been explored in different parts of China according to local conditions, including the “Ningyang Model” (in the form of shares and cooperatives), the “Chongqing Jiulong Model” (in the form of house bases for housing and contracted land for social security), the “Jiangjin Model” (in the form of leasing), the “Nanhai Model” (in the form of shares), and the “Shawan Model” (in the form of swaps and land consolidation), which were named by « Half Moon Talks »as the top five models of land transfer in China [19]. These models generally function well in terms of promoting the healthy and orderly development of large-scale land management, steadily increasing farmers’ income, ensuring national food security, and promoting sustainable development [5]. Our team studied the land consolidation benefits of the “Shawan Model” by studying the differences in plot size, crop unit value, income, and irrigation before and after farmer consolidation. We found that farmer consolidation resulted in a significant increase in the cultivated land area, an increase in crop unit yield of at least 42.66%, and the average income of farmers increased by a value of RMB 4324 /ha, and water savings were all higher than 7.18 m3/ha. Additionally, the results showed that the benefits of land swapping were relatively obvious [5,19].
However, it is regrettable that there have been few reports on the scientific evaluation of the value improvement of cultivated land before and after the consolidation of arid areas; in particular, there is a lack of research on the economic, social, and pro-ecological value of cultivated land before and after the “Shawan Model” (land consolidation) was introduced in Xinjiang, with the available research being insufficient for the publicity and promotion of the results of the “Shawan Model” [20].
Based on this, this paper takes 380 farmers from 10 villages in three different regions of Shawan City (county-level city) as samples, uses the participatory farmer assessment method (PRA) to conduct a detailed survey of farmers’ cultivated land integration, and uses the landscape pattern index method to analyze the intensity of cultivated land integration. By constructing a system for the calculation of cultivated land integrative value, the economic, pro-ecological, and social values before and after cultivated land integration are estimated by income reduction method, equivalent factor method, and shadow engineering method. The research results provide suggestions and references for the effective promotion of the “Shawan Model” (land consolidation), the formulation of reasonable compensation standards for cultivated land in different regions of the Manas River Basin, and the implementation of cultivated land protection policies.

2. Materials and Methods

2.1. Overview of the Study Area

The Manas River Basin Oasis Area (referred to as the Manas River Oasis Area) is located in an important economic development center on the northern slope of the Tianshan Mountains. The geographical coordinates are N 43°20′–45°55′, E 85°01′–86°42′. The administrative divisions include the Shihezi Reclamation Area, Shawan City (county-level city), Manas County, and other areas. Manas Oasis is a typical temperate desert climate with sufficient sunshine, a large temperature difference, low level of precipitation, and high level of evaporation. The annual precipitation is 120–200 mm and the annual evaporation is 1000–1500 mm.
Due to the vast size of the basin, the value of cultivated land is bound to vary from region to region. Considering the completeness of the data collection, the availability of land reclamation activities, and the representativeness of typical land types [21], we selected 10 villages from different regions of Shawan City, which span the typical features of the oasis area of Manas River to assess the cultivated land value. The specific villages are Shangbajiahu Village and Xiaxiwan Village in the hilly area of the basin; Gudao Village, Huanggongzhuangzi Village, Shaofangzhuang Village, and Xingfen Village in the oasis agricultural area; and Weijiazhuang Village, Shanghudidong Village, Xiazhuangzi Village, and Huangqu Village in the oasis/desert ecotone (Figure 1).

2.2. Data Sources

The oasis farmland in the Manas River Basin began to be integrated with village-level farmland in 2008, and this was basically completed in 2016. Therefore, the remote sensing image LSV (LocaSpaceViewer) with a spatial resolution of 0.3 m in 2007 and 2019 (the idea of cultivated land integration is to remove ridges and transform ditches and shelterbelts, and the required accuracy is generally less than 0.5 m) was used as the data source. Using the maximum likelihood method and Arcgis10.3, the land types of 10 villages were divided into 12 categories under the condition that the accuracy meets the requirements [19], so as to obtain the pattern of cultivated land integration of each village.
From 15 July to 25 July 2019, the authors and members of the research team went deep into the project area and conducted household research in 10 villages in Shawan City for a cumulative period of 10 days. Participatory farm household assessment methods were used to conduct in-depth interviews with village cadres to obtain basic information and socio-economic statistics about the project area, as well as to randomly visit farm households to conduct farmland consolidation surveys, with each farm household taking approximately 1.5–2 h to interview. The questionnaire included the economic returns of the farming households before and after the integration, the production costs used by the households for production, and the net household income (net income = income−production costs). The survey sample was 380 people, including six county and township leaders, 24 village cadres, and 350 farmer representatives, with a total of 367 valid questionnaires returned.

2.3. Research Methods

2.3.1. Degree of Cultivated Land Integration

The degree of fragmentation of cultivated land is an important manifestation of the intensity of cultivated land integration—that is, the degree of fragmentation of plots in areas with a high intensity of integration is small [21]. Therefore, this paper selected the patch density (PD), average patch area (MPS), area weighted average shape index (AWMSI), edge density index (ED), landscape patch number fragmentation index (FN), and landscape patch shape fragmentation index (FS) to reflect land use fragmentation (Table 1) and, conversely, measure cultivated land integration [22,23,24]. Combined with the integration strength of each village, the difference in values for each village before and after land integration is explored.

2.3.2. Construction of Cultivated Land Value Measurement System

The multifunctional value of cultivated land is mainly manifested through the following three aspects: economic value of the ability to maintain human production and living conditions, to ensure the country’s food security and protect people’s employment, provide pension insurance and other social values, to maintain water and soil services, produce food, regulate the climate, etc. In this paper we construct a value measurement system for assessing the economic value, social value, and pro-ecological value of cultivated land.
Calculation of the economic value of cultivated land. The revenue reduction method is an accounting method oriented towards maximizing revenue from the perspective of expected returns on arable land; it is easy to obtain information and data for this. It is now common in China to apply the revenue reduction method for the measurement of the production value of arable land; this has proven to be feasible. The specific formula is as follows [22]:
P e = A R   1 - 1 1 + R N .
where P e is the economic value of agricultural land, RMB/ha; A is the net income generated by agricultural land, RMB/ha; R is the reduction rate, taking the sum of the safe interest rate and the risk value; N is the service life of agricultural land.
The net income received from cultivated land is made up of two components: (1) the net income generated by the land in carrying out agricultural production; (2) the subsidy given by the government to the farmland. The formula for its calculation is [25]:
A = A 1 + A 2 ,
  A 1 = i = 1 n p i     c i q i     d i / S ,
  A 2 = i = 1 n b i .
where A1 is the net income of cultivated land for agricultural production, RMB/ha; A2 is the government subsidy, RMB/ha; c i   represents the total output of the ith crop, kg; p i represents the unit price of the ith crop, RMB/ha; di represents the unit cost of the i-th crop, RMB/ha; q i is the sown area of the i-th crop, ha; bi is the government’s unit subsidy for the ith crop, RMB/ha; S is the total cultivated area, ha.
Social value of cultivated land. This includes the social security value V1 and the social stability value V2. Considering the feasibility and difficulty of directly accounting for the social value of arable land, this paper is guided by the value substitution approach—i.e., using a proxy with market value to indirectly measure items that do not have market value [26].
The value of social security V1 is replaced by the value of social insurance, with the following formula:
V 1 = Va + Vb + Vc + Vd + Ve ,
Vi = r 1 + r 2 × k ,   i = a r 3 + r 4 × k ,   i = b r 5 + r 6 × k ,   i = c r 7 × k ,   i = d r 8 × k ,   i = e
where V 1 represents the social insurance amount; Va, Vb, Vc, Vd, and Ve are the pension, unemployment, medical, work-related injury, and maternity insurance amounts, respectively; r1, r3, r5, r,7 and r8 are the rates of pension, unemployment, medical, work injury, and maternity insurance paid by the employer, respectively; r2, r4, and r6 are the rates of pension, unemployment, and medical insurance paid by individual employees, respectively; k denotes the minimum social insurance contribution base in Shawan County [27,28].
The value of social security is:
V 1 = V 1 R
The social stability value V2 is calculated by replacing the social stability value with the sum of the discount rates of fixed asset inputs, production inputs, and outputs according to the calculation of Ren et al. [28], using the following formula:
V 2 = V f + V g + V h .
where Vf is the discounted value of inputs for reclaiming wasteland in 5 years, Vg is the discounted value of gains and losses for 4 years, and Vh is the input of fixed assets in cultivated land [28].
V f = T + T 1 + R + T 1 + R 2 + T 1 + R 3 + T 1 + R 4 ,
V g = P + P 1 + R + P 1 + R 2 + P 1 + R 3 + P 1 + R 4 .
where T is the average annual investment level, P is the annual average farmland net income, and the average one-year time deposit rate R is taken at the reduction rate.
Pro-ecological value of cultivated land resources. As a natural resource, the most obvious value of cultivated land is its pro-ecological value, which is an indispensable part of the cultivated land value system [29,30]. The pro-ecological value of cultivated land not only has positive values for areas such as climate regulation, gas regulation, production of raw materials, hydrological regulation, waste treatment, water and soil conservation, biodiversity conservation, food production, and creating an aesthetic landscape [31], but also includes negative values such as environmental pollution caused by the excessive use of chemical fertilizers and pesticides and residual plastic film from agricultural production [32].
  V S = V sz + V sf ,
V sf = v hn + v dm .
(1)
Pro-ecological positive value of cultivated land
The equivalence factor method was used for measurement. The equivalent factor method involves a small amount of data and is intuitive and easy to use. Referring to the equivalent factors of Xie Gaodi’s improvement of pro-ecological service value per unit area of terrestrial ecosystem in China in 2015 [31], the ratio of cultivated land multiple cropping index in each village and cultivated land multiple cropping index in Shawan City (county-level city) was selected as the biomass correction factor for calculating the positive value of cultivated land pro-ecological service in the study area. The specific calculation formula is [31]:
V sz = F j F 0 1 7 i = 1 n p i c i C × γ
where Vsz is the positive value of cultivated land pro-ecological services; F 0   and   F j are the multiple cropping index of cultivated land in Shawan City (county-level city) and the jth village in that year; C is the sown area of crops; γ is the equivalent factor per unit area, which is taken as the dry land unit area equivalent factor. A value of 1/7 means that the economic value of one ecological service value equivalent factor is determined to be equal to 1/7 of the national average market value of grain yields for the year (in China) [31].
(2)
Negative pro-ecological value of cultivated land
(a)
The negative value of environmental pollution caused by the excessive use of chemical fertilizers and pesticides in cultivated land.
In order to prevent diseases and insect pests and increase crop production, farmers have widely used pesticides and fertilizers on cultivated land and their dependence has gradually increased, resulting in water eutrophication, increased nitrate content in crops and groundwater, and pesticide residues that endanger human health. The specific formula is as follows [32]:
v hn = hf × 1 - e 1 × g hf + ny × 1 - e 2 × g ny S
where v hn is the negative value of the cultivated land in the study area due to the use of pesticides and fertilizers, hf and ny are the amounts of fertilizer and pesticides used, and   e 1 and e 2 are the utilization rates of fertilizers and pesticides. We refer to Chen Tongbin [33] and Sun Xinzhang [34] to take 36% and 35%; g hf and gny are the prices of fertilizers and pesticides, respectively.
(b)
Negative value caused by residual mulch film on cultivated land.
Any mulch film remaining in cultivated land destroys the soil structure, hinders the penetration of moisture into the soil, and affects the growth of crops. Additionally, it affects the environmental landscape of the cultivated land and causes visual pollution. The negative value calculation formula is as follows [32]:
v dm = dm × e 3 × o × i = 1 n y i × p i S .
where v dm is the negative value caused by the residual mulch film on cultivated land, dm is the area covered by the mulch film, and e 3 and o are the residual ratios of mulch film and crop loss ratio. We refer to Chen Tongbin [35] and Sun Xinzhang [36] to take 41.7% and 10%; y i is the yield per unit of the i-th crop.

3. Results and Analysis

3.1. Intensity of Cultivated Land Integration

3.1.1. Cultivated Land Integration

The result of land consolidation is that scattered small plots become larger plots, redundant field roads and ditches are integrated, field shapes are trimmed, abandoned land is reclaimed, etc. These obvious consolidations can be clearly shown from the data form before and after the consolidation of villages.
Through intensive and contiguous integration projects such as the destruction of Tianhu roads and the merging of scattered features and unused land, the degree of fragmentation of cultivated land has been greatly reduced. From Table 2, it can be seen that the total number of fields, ridges, and roads in the field have been correspondingly reduced during the study period. In contrast, the area of the fields has increased and the increase in the area will directly affect the economic value of the land. Among them, Shaofang Village has the largest area after integration, reaching 55.13 ha, followed by Xingfen Village, with an additional area of 51.68 ha; Shangbajiahu Village and Xiaxiwan Village have the smallest areas of integration, with additional areas of 21.35 ha and 29.90 ha.

3.1.2. Calculation and Analysis of Cultivated Land Integration

Based on the cultivated land integration data, the relevant index values of the cultivated land fragmentation before and after the integration were calculated through the Fragstats 3.3 software. Figure 2 shows the index change rate. The results show that the fragmentation of cultivated land in the study area decreased after the integration of the cultivated land. After the integration of the 10 villages, the patch density (PD) decreased while the mean patch area (MPS) increased, indicating that the size of the plots increased. The area-weighted mean shape index (AWMSI) steadily decreased, indicating that the shape is becoming more regular. The edge density (ED) also decreased, indicating that the degree of division of the field was reduced. The fragmentation index of landscape patch number (FN) and the fragmentation index of landscape patch shape (FS) are both intuitive expressions of the degree of fragmentation of cultivated land.
Looking at the barplots of the degree of integration change, the six indicators appear to be a kind of “some crests, other intermediate and still platforms”. The villages located on the high wave peak and high stairs include Gudao Village, Huanggongzhuangzi Village, Shaofang Village, and Xingfen Village. They are all located in the alluvial fan overflow zone of the oasis agricultural area in the Manas Oasis District. The area is flat and open, with fertile soil and a good foundation for integration. The villages on the stairs in the higher peak are Weijiazhuang Village, Shanghudidong Village, Xiazhuangzi Village, and Huangqu Village. They are all located in the oasis/desert interlaced zone of the Manas Oasis District. The farmland in this area is mainly composed of swamps. The soil, salinized meadow soil, and meadow salt soil are cultivated, and the integration foundation is weaker than that of the oasis farming area. The villages located on the lower steps are Shangbajiahu Village and Xiaxiwan Village. The area is close to the hilly valley in the mountains. The terrain has large ups and downs, the land that can be developed is small and scattered, and the human interference is small, but the overall integration foundation is weak. Being at the peak indicates that the relative degree of integration of these three indicators has a high value, thus reflecting the higher integration intensity. Therefore, the order of integration strength is oasis agricultural area > oasis/desert interlaced area > low mountain and hilly area.

3.2. Integrated Value of Cultivated Land

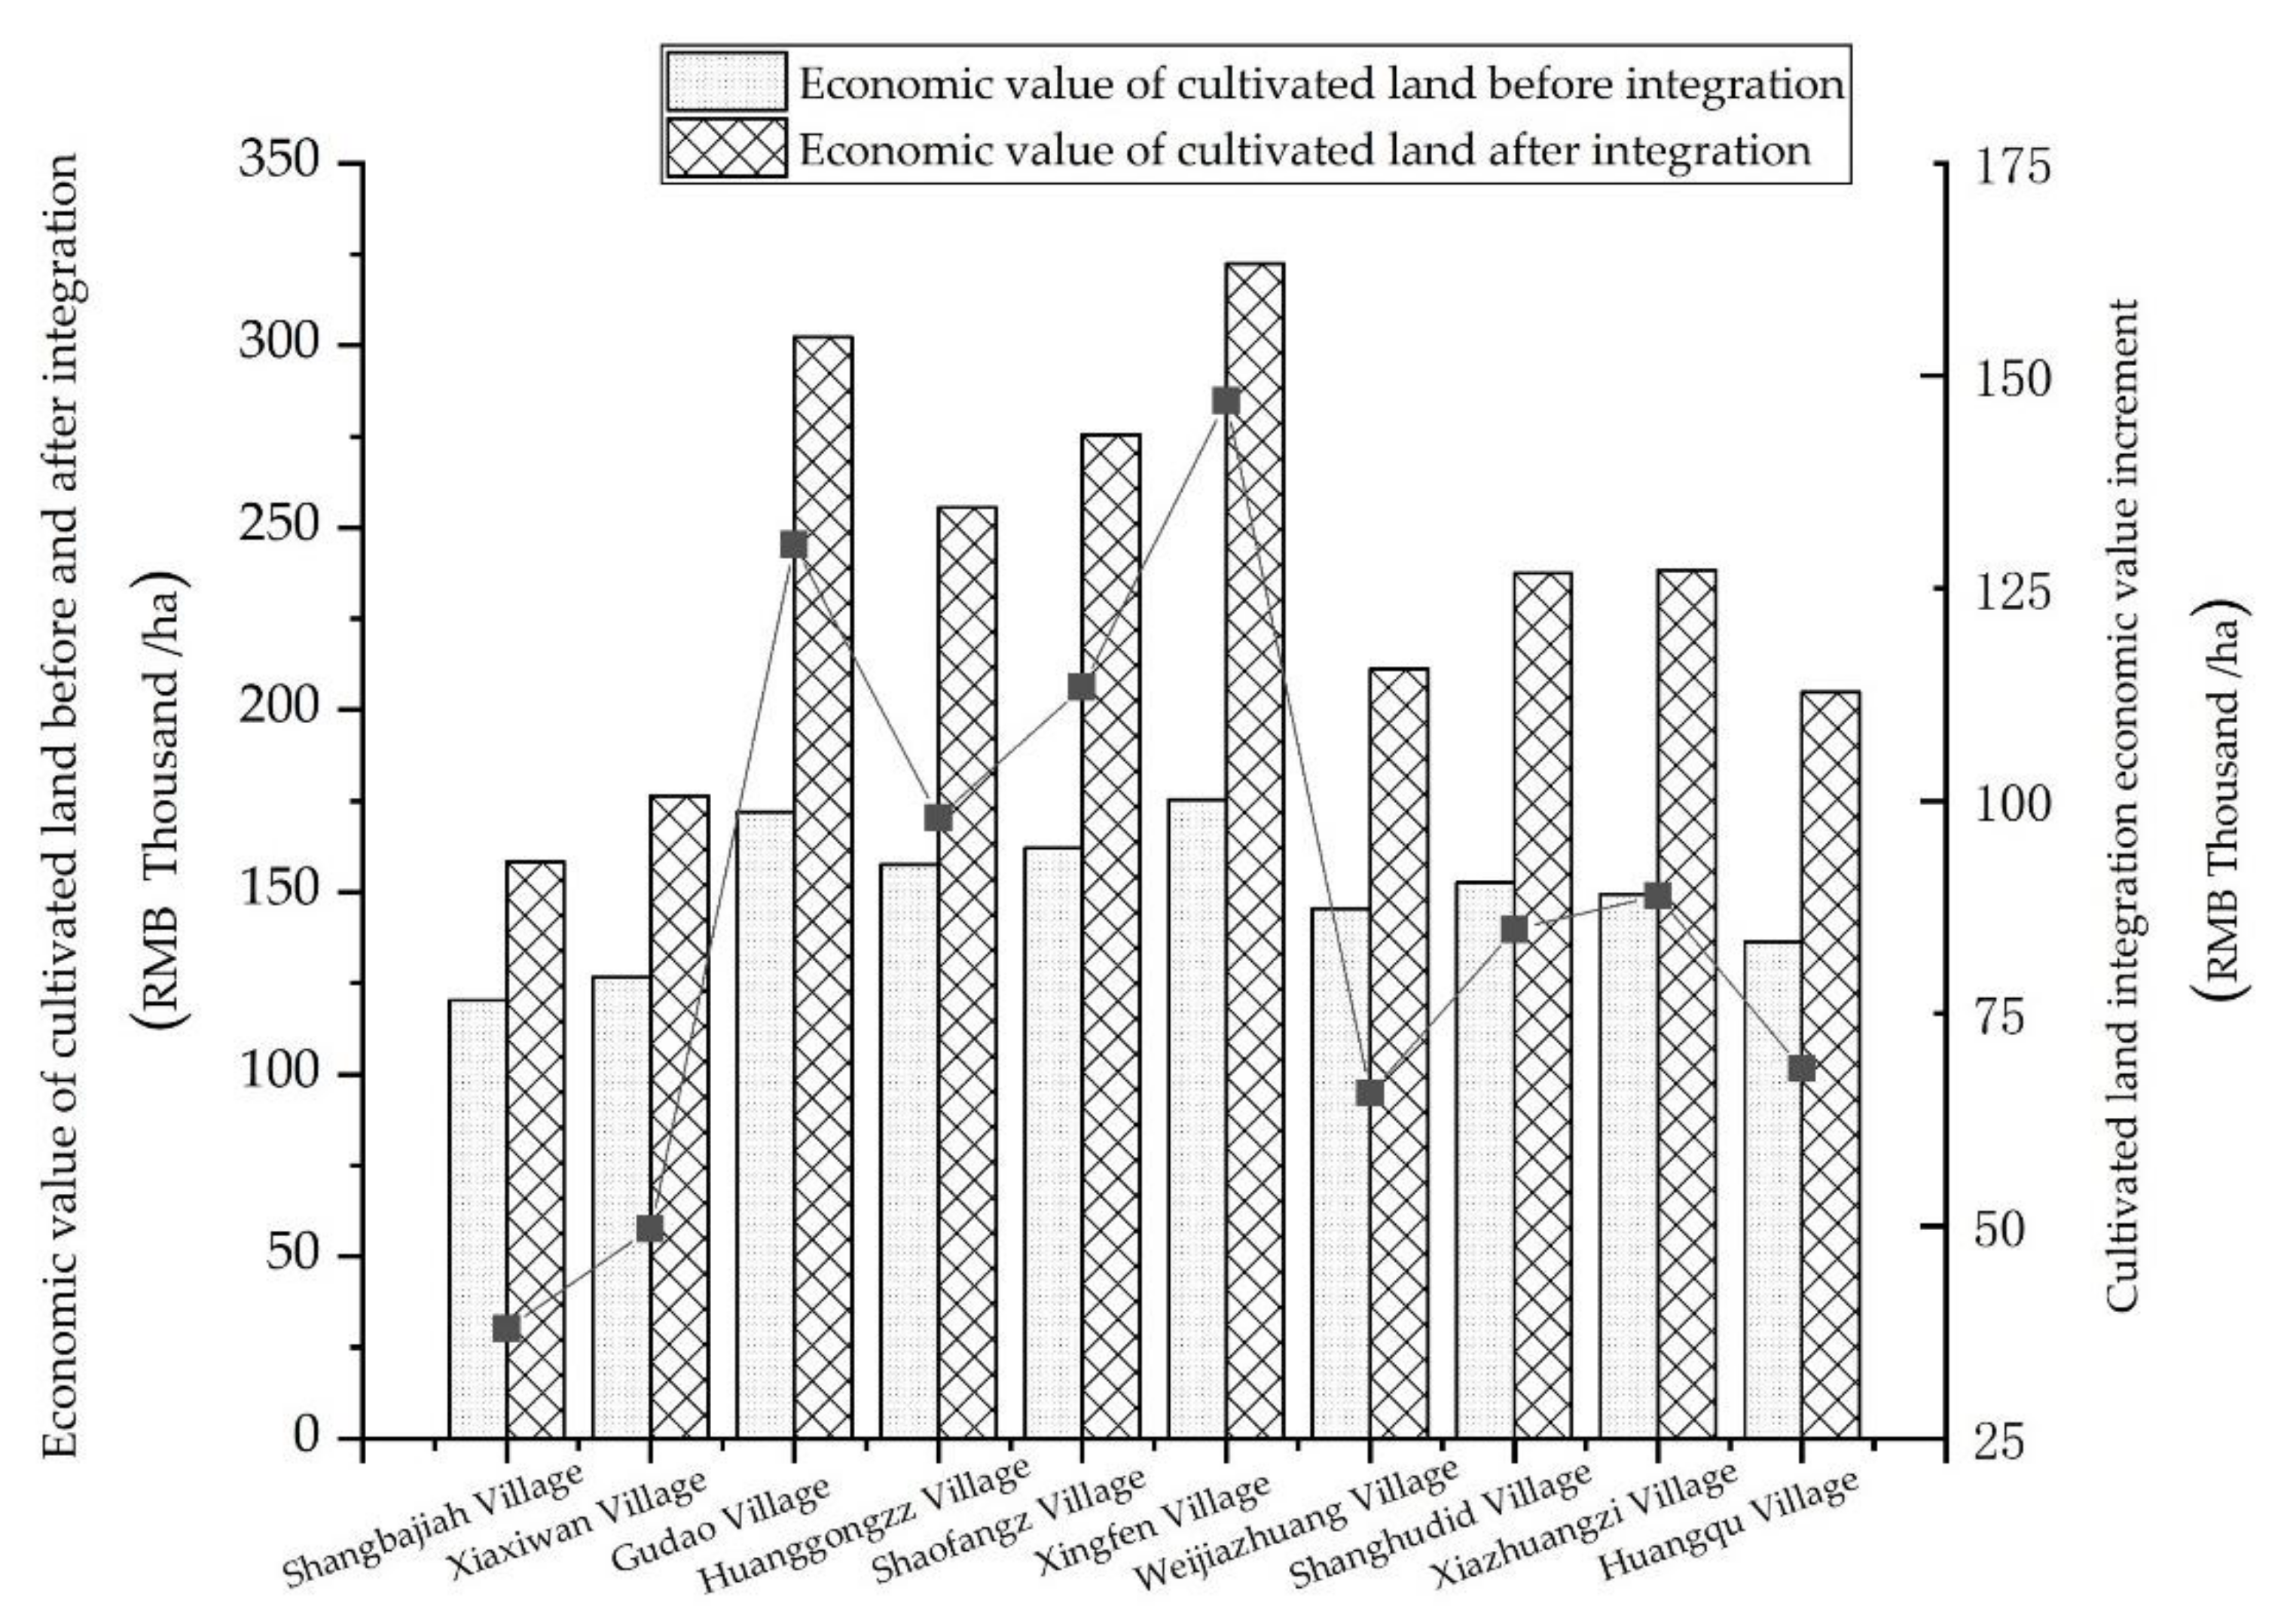
3.2.1. Economic Value before and after the Integration of Cultivated Land

According to the net income data obtained from the questionnaire (Table 3) combined with the economic value calculation formula, we calculated the integrated economic value of cultivated land.
It can be seen from Figure 3 that the economic value of the cultivated land before the integration of the villages is similar because the area of the cultivated land before the integration does not differ greatly. After the integration, due to the different integration strengths of the villages, the increased area of the integration is quite different, causing the net economic value of the increase to differ. The curve shows the increase in economic value before and after the integration of the cultivated land in each village, in which the economic value increases. The largest is Xingfen Village, which increased by RMB 147,100/ha, followed by Gudao Village, where the economic value per hectare increased by RMB 113.30 thousand, while the economic value of cultivated land in Shangbajiahu Village and Xiaxiwan Village increased by small amounts of RMB 37,900/ha and RMB 49,700/ha, respectively.
It can be seen from the figure below that the four villages located in the oasis area of the Manas River Basin have a higher economic value after integration, followed by four villages located in the oasis/desert interlaced area and two villages in the upper low mountain and hilly area. The economic value of the village’s cultivated land is low after integration. In the central area where the integration of cultivated land is relatively high, it is easy to integrate cultivated land because this area is located in the alluvial fan overflow area. The number and weighted shape index of the cultivated land integration plots are much less than those of the upper oasis/desert interlaced area, while the average plot area is also significantly higher than that of the upper oasis/desert interlaced area. Due to the rules, the amount of high-quality farmland in the area has been increased, while the contiguous cultivated land is conducive to the improvement of the degree of mechanization, which reduces the labor cost per unit area and increases the economic value of the cultivated land in the area. Meanwhile, the low mountain and hilly areas of the Manas River Basin Located are limited by the surrounding environment, the basic conditions for integration are very poor, and it is difficult to create new cultivated land, meaning that the economic value is low.

3.2.2. Social Value before and after the Integration of Cultivated Land

In 2007 and 2019, the minimum social insurance payment bases in Shawan County were RMB 891 and RMB 2844, respectively. According to the insurance premium rate and calculation formula of Shawan County in 2007 and 2019, the social insurance of rural households in 2007 and 2019 can be calculated for one year to be RMB 4405.10 /year and RMB 15,359.47 /year.
By searching the Shawan Statistical Yearbook and data survey, the per capita cultivated land area of the 10 villages before and after the integration was summarized, and the social security value was finally obtained according to the formula. According to the statistical yearbook and on-site visits, the village cadres learned the value of the capital input of the newly increased cultivated land in each village. Using the formula, the social stability value of cultivated land before and after integration can be obtained.
As can be seen from Figure 4, before and after the consolidation of agricultural land, the social security value accounted for a larger proportion, indicating that farmland is the core guarantee for farmers. From the perspective of the overall social value changes, the social value of Xiazhuangzi Village increased the most after the integration, with an increase of RMB 324,300/ha from before and after the integration, followed by Shanghudidong Village, with an increase of RMB 301,400/ha. The smallest increase was seen in Gudao Village, with its value being RMB 143,300/ha.

3.2.3. Pro-Ecological Value of Cultivated Land before and after Integration

(1)
The positive pro-ecological value of cultivated land before and after integration
The multiple crop index was calculated by querying the Shawan County Statistical Yearbook, while the crop sown area and unit price were obtained through a questionnaire. The above data were substituted into the formula to calculate the positive pro-ecological value of the cultivated land before and after the integration of each village (Figure 5).
From the results, the positive pro-ecological value of cultivated land increased significantly after integration. In terms of the pro-ecological value of cultivated land, the functional value of the soil and water conservation of cultivated land was the highest before and after integration, followed by the functional value of food production services on cultivated land (here, we refer to the functional value of ecological services arising from natural processes on cultivated land, rather than the economic value of human cultivation activities) [32], which reflects the importance of these two pro-ecological functions of cultivated land.
From a village perspective (Table 4), the pro-ecological value of cultivated land increased the most in Xingfen village after consolidation, at RMB 25,900/ha, followed by the positive pro-ecological value of cultivated land in Gudao village, which increased by RMB 22,800/ha. The increase was not obvious for Shangbajia households. The village only had RMB 6600/ha. From the overall positive value, the four villages located in the Manas Oasis agricultural area had higher pro-ecological positive values before and after the integration, followed by the four villages located in the oasis/desert interlaced area; in the two villages in the upper low mountain and hilly area integrated cultivated land, the pro-ecological positive value after integration was low. The pro-ecological function value of cultivated land is closely related to the biomass in the system. According to the actual situation, the sown area of crops in the oasis area is the largest. On the basis of the main planting of cotton and sowing wheat and maize, the use of many types of crops will create more biomass. The pro-ecological positive value of the cultivated land is higher, while due to the low mountains and hills in this area the area of cultivated land is small due to topographical factors, and only a single corn crop was planted, greatly reducing the total biomass and causing its pro-ecological positive value to be low.
(2)
Negative pro-ecological value of cultivated land before and after integration
Some of the data from 2007 were difficult to obtain. According to the research findings of various scholars [35,36], the use of pesticides and fertilizers is highly positively correlated with crop yields, which can be obtained by multiplying the proportion of crops by the city’s total use of pesticides and fertilizers in 2007. The data for 2019 were obtained through questionnaires. Substituting data on aspects such as pesticides, fertilizer usage, prices, and plastic film coverage into the formula, it can be concluded that the negative value of environmental pollution was caused by the overuse of fertilizers and pesticides and the residual plastic film in each village before and after the integration of farmland (Figure 6).
As can be seen from the above figure, the negative value of pesticides, fertilizers, and residual mulch film after the integration of farmland in various villages increased greatly, of which the value of fertilizers and pesticides had a relatively large value. Shaofangzhuang Village had the highest pro-ecological negative value after integration, with the highest increment in value of RMB 1305.5/ha, followed by Huanggongzhuangzi Village, with a negative value increase of RMB 1213.21/ha. On the contrary, the pro-ecological negative value generated after the integration of the cultivated land in Xiaxiwan Village and Shangbajiahu Village was the lowest; the changes in value were RMB 518.98/ha and RMB 246.7/ha, respectively. From the overall negative value, it can be seen that the four villages located in the Manas Oasis agricultural area had higher pro-ecological negative values before and after the integration, followed by the four villages located in the oasis/desert interlaced area and the two villages in the upper low mountain and hilly area integrated cultivated land, where the post-pro-ecological negative value is low. This is directly proportional to the increase in the area of cultivated land after integration. The greater the integration effort and the greater the increase in cultivated land area, the more negative pro-ecological value the village produces.
(3)
Pro-ecological value of cultivated land before and after integration
Based on the above results, the total pro-ecological value of the cultivated land of each village is obtained. Compared with the social value, the pro-ecological value of each village before and after the integration has a small difference. From the perspective of positive and negative pro-ecological value, the positive pro-ecological value of cultivated land is far greater than the negative pro-ecological value, which causes the final pro-ecological value to present a positive value. The most obvious increase in the pro-ecological value of cultivated land was in Xingfen Village, with an increase in value of RMB 24,900/ha (Table 5). The overall pro-ecological value is consistent with the previous analysis. The four villages located in the Manas Oasis agricultural area have a higher total pro-ecological value after integration, followed by the four villages located in the oasis/desert interlaced area and two villages in the upper low mountain and hilly area. The pro-ecological value of the cultivated land in this village is low after integration.

3.2.4. Integrative Value of Cultivated Land before and after Integration

The integrative value of cultivated land is the sum of the economic value, social value, and pro-ecological value. It can be seen from Table 6 that the integrative value of cultivated land increased significantly before and after the integration. The curve represents the increase in integrative value. The greatest increase in the integrative value of cultivated land is in Xiazhuangzi Village, with the integrative value increase of RMB 429,200/ha, followed by an increase of RMB 401,100/ha in the integrative value of the merchant Shanghudidong Village, which saw the smallest change in integrative value. Shangbajiahu Village’s increase of RMB 277,700/ha was roughly the same as the order of the increase in the social value of the cultivated land in each village. This also reflects that the social value occupies the core position both before and after the integration, indicating that the cultivated land provides social stability, and social security plays a major role. Although economic value and pro-ecological value are only very small factors in the value of cultivated land, it can be seen that the proportion of integrated economic value and pro-ecological value is increasing.

4. Discussion

Cultivated land integration through the “Shawan Model” significantly reduces the degree of land fragmentation. Without creating wasteland, an increase in the area of cultivated land can be achieved, the ecological environment can be protected, the results of the above calculation also show that huge external benefits can be generated, the social and ecological value of cultivated land can be significantly increased, and the external benefits of cultivated land are highly significant [37]. Therefore, tools such as “land remediation +” and new models for the composite use of cultivated land should be actively explored to open up non-economic value-added paths for cultivated land, enhance the integrative value of cultivated land, promote land transfer, develop large-scale operations, and ultimately promote sustainable agricultural development and integrative rural revitalization in China [37,38,39]. Based on the integrative value of cultivated land resources that can be used to determine the government’s land acquisition compensation standard [40], this article estimates that the average integrative value of the low mountain and hilly area is RMB 601,300/ha and the average value of the oasis agricultural area is RMB 541,200/ha. Meanwhile, the integrative value of the desert interlaced area is RMB 737,600/ha. According to the national policy, 70% of the cultivated land compensation fee and resettlement subsidy will be given to farmers who have lost their land, while 30% of the land compensation fee will be given to the rural collectives. Farmers in low mountain and hilly areas, oasis agricultural areas, and interlaced oasis/desert areas receive an integrative value compensation of RMB 488,300/ha, RMB 385,200/ha, and RMB 509,600/ha, respectively. The integrative value compensation for rural collectives in the interlaced area is RMB 209,300/ha, RMB 165,100/ha, and RMB 218,400/ha. Compared with the current land expropriation compensation standard of RMB 430,900/ha [40,41], the compensation standards of each region discussed in this paper are 1.39 times, 1.60 times, and 1.71 times. This gap is reflected in the current compensation standard, which mainly includes farmland compensation fees and resettlement subsidies [41,42]. In order to solve the conflict of interest between cultivated land occupation and protection, the compensation standard should be appropriately improved, the compensation scope for landless farmers should be increased, the legitimate rights and interests of farmers should be safeguarded, and cultivated land resources should be effectively protected [6].
This paper fully considers the multiple utilities of the social, economic, and pro-ecological value of cultivated land resources. It not only calculates the employment value and agricultural output value of cultivated land resources for farmers but also focuses on the social security utility and pro-ecological security utility of cultivated land resources for farmers. It also enriches and improves the pro-ecological value of cultivated land, overcomes the defects of the current land expropriation compensation standards, clarifying that the compensation of cultivated land resources is not adequate, makes up for the defects of the incomplete compensation of cultivated land value, and expands the scope of compensation.
However, there are also some problems: (1) In terms of the scientific definition and value estimation of arable land values, there is a lack of relatively mature guiding theories and methods, and values derived from using different methods vary greatly. In this paper, the value of arable land is broken down into economic, social, and pro-ecological values, and specific methods are used to estimate them. In future studies, various methods should be used in an integrated manner in order to provide a more scientific and integrative evaluation of farmland values.
(2) In analyzing the differences in farmland values, this paper only compares the starting and ending years of consolidation. However, in reality farmland consolidation is a long-term process; for example, some townships have carried out secondary and tertiary consolidation, though this paper ignores the consolidation in the intermediate years.
(3) The value of farmland consolidation in different areas of the oasis varies greatly, and the differences in value are closely related to factors such as land quality, crop yields, hired labor and farming costs, and consolidation patterns, which will be the focus of future research for the authors.

5. Conclusions

Based on perspective of farmers, this paper constructed the basic value system of cultivated land including economic value, social value, and pro-ecological value. Combined with the actual situation of 10 villages in different regions of Shawan City (county-level city) before and after the integration of cultivated land, this paper calculated the three values of cultivated land before and after the integration of cultivated land and draws the following conclusions:
(1) The cultivated land in various regions of Shawan City (county-level city) is more effectively integrated. The scale of the field is expanded, the shape tends to be more regular, and the field surface is flatter. The degree of integration of different regions is different. Through six landscape pattern index analysis of regional integration, using the patch density (PD), mean patch area (MPS), area-weighted mean shape index (AWMSI), edge density index (ED), fragmentation index of landscape patch number (FN), fragmentation index of landscape patch shape (FS), the intensity of cultivated land consolidation ranges from large to small as follows: oasis agriculture area > oasis/desert ecotone > hilly area;
(2) Cultivated land integration plays a major role in improving the economic value, social value, and pro-ecological value of cultivated land. The value of cultivated land in different regions is different after integration: the cultivated land in villages in the oasis/desert ecotone was most significantly improved after integration, followed by the cultivated land in the oasis agricultural area, where the cultivated land value was significantly improved, while the cultivated land in the hilly area saw less improvement after integration;
(3) After land consolidation, the value of land varies from area to area and the value is found to be influenced mainly by these factors in the calculation process. Areas of land cultivated in regions with a high intensity of integration will increase in value more, which directly affects the economic value of cultivated land. Secondly, a higher area of land cultivated per capita will raises the social value of cultivated land. The smaller the amount of land cultivated per capita is, the greater the social security value is. The pro-ecological value of cultivated land includes positive and negative aspects. The positive pro-ecological value of cultivated land is related to the regional ecosystem biomass, while the negative pro-ecological value of cultivated land is proportional to the crop planting area;
(4) From the empirical assessment made, it seems adequate to formulate reasonable compensation standards for cultivated land in the different regions studied while implementing suitable cultivated land protection policies, including further land consolidation measures that promote biodiversity conservation.

Author Contributions

Conceptualization, X.Y.; methodology, Y.W.; software, X.Y.; validation, X.Y.; formal analysis, H.X.; investigation, Z.F.; resources, Y.W.; data curation, X.Y.; writing—original draft preparation, X.Y.; writing—review and editing, Y.W.; visualization, N.L.; supervision, Y.W.; project administration, Y.W.; funding acquisition, Y.W. All authors have read and agreed to the published version of the manuscript.

Funding

This research was funded by the National Natural Science Foundation of China (Project Number: 41661040), Corps key areas of science and technology research program projects (Project Number: 2021AB021), and Shihezi University High-level Talents Research Start Project (Project Number: RCZK2018C41).

Institutional Review Board Statement

Not applicable.

Informed Consent Statement

Informed consent was obtained from all subjects involved in the study.

Data Availability Statement

Not applicable.

Conflicts of Interest

The authors declare no conflict of interest.

References

  1. Su, H.; Wu, C.F. Analysis of the influencing factors of the cultivated land resources value in black soil region based on the production-living-ecological functions: A case study in keshan county, Heilongjiang province. China Land Sci. 2020, 34, 77–85. [Google Scholar] [CrossRef]
  2. Chen, S.; Ye, J.P.; Xue, B.; Yao, R. Property rights decomposition and policy improvement of “tripartite entitlement system” of farmland. China Land Sci. 2020, 34, 42–48. [Google Scholar] [CrossRef]
  3. Wu, X.C. Research on coupling mechanism and coordinated development model of rural rejuvenation-rural tourism system. Fresenius Environ. Bull. 2020, 29, 9345–9351. [Google Scholar]
  4. Wang, J.; Yan, S.C.; Guo, Y.Q.; Li, J.R.; Su, G.Q. The effects of land consolidation on the ecological connectivity based on ecosystem service value:A case study of da’an land consolidation project in Jilin province. J. Geogr. Sci. 2015, 25, 603–616. [Google Scholar] [CrossRef]
  5. Liao, N.; Gu, X.C.; Wang, Y.J.; Xu, H.L.; Fan, Z.L. Analysis of ecological and economic benefits of rural land integration in the Manas river basin oasis. Land 2021, 10, 451. [Google Scholar] [CrossRef]
  6. Chen, I.C.; Chuo, Y.Y.; Ma, H.W. Uncertainty analysis of remediation cost and damaged land value for brownfield investment. Chemosphere 2019, 220, 371–380. [Google Scholar] [CrossRef] [PubMed]
  7. Sam, K.; Zabbey, N. Contaminated land and wetland remediation in Nigeria: Opportunities for sustainable livelihood creation. Sci. Total Environ. 2018, 639, 1560–1573. [Google Scholar] [CrossRef] [PubMed]
  8. Song, Y.N.; Kirkwood, N.; Maksimovic, C.; Zhen, X.D.; O’Connor, D.; Jin, Y.L.; Hou, D.Y. Nature based solutions for contaminated land remediation and brownfield redevelopment in cities: A review. Sci. Total Environ. 2019, 663, 568–579. [Google Scholar] [CrossRef]
  9. Sullivan, C.A.; Skeffington, M.S.; Gormally, M.J.; Finn, J.A. The ecological status of grasslands on lowland farmlands in western Ireland and implications for grassland classification and nature value assessment. Biol. Conserv. 2010, 143, 1529–1539. [Google Scholar] [CrossRef]
  10. Bastian, C.T.; McLeod, D.M.; Germino, M.J.; Reiners, W.A.; Blasko, B.J. Environmental amenities and agricultural land values: A hedonic model using geographic information systems data. Ecol. Econ. 2002, 40, 337–349. [Google Scholar] [CrossRef]
  11. Mitchell, M.; Suarez-Castro, A.; Martinez-Harms, M.; Maron, M.; McAlpine, C.; Gaston, K.J.; Johansen, K.; Rhodes, J.R. Reframing landscape fragmentation’s effects on ecosystem services. Trends Ecol. Evol. 2015, 30, 190–198. [Google Scholar] [CrossRef] [PubMed] [Green Version]
  12. Rau, A.L.; Burkhardt, V.; Dorninger, C.; Hjort, C.; Ibe, K.; Kessler, L.; Kristensen, J.A.; McRobert, A.; Sidemo-Holm, W.; Zimmermann, H.K.; et al. Temporal patterns in ecosystem services research: A review and three recommendations. Ambio 2020, 49, 1377–1393. [Google Scholar] [CrossRef] [PubMed]
  13. Xu, L.X.; Yang, D.W.; Wu, T.H.; Yi, S.H.; Fang, Y.P.; Xiao, C.D.; Lin, H.X.; Huang, J.C.; Habimana Simbi, C. An ecosystem services zoning framework for the permafrost regions of China. Adv. Clim. Chang. Res. 2019, 10, 92–98. [Google Scholar] [CrossRef]
  14. Swinton, S.M.; Lupi, F.; Robertson, G.P.; Hamilton, S.K. Ecosystem services and agriculture: Cultivating agricultural ecosystems for diverse benefits. Ecol. Econ. 2007, 64, 245–252. [Google Scholar] [CrossRef]
  15. Geneletti, D. An approach based on spatial multicriteria analysis to map the nature conservation value of agricultural land. J. Environ. Manag. 2007, 83, 228–235. [Google Scholar] [CrossRef] [PubMed]
  16. Wu, Z.J.; Wei, C.F.; Ding, S.Y. Research on the social security function of cultivated land in a hilly-mountainous region. Resour. Sci. 2013, 35, 773–781. [Google Scholar]
  17. Zhang, Z.F.; Yang, H.; Gu, X.K. Effects of land consolidation in plains and hills on plots use. Trans. Chin. Soc. Agric. Eng. 2013, 29, 1–8. [Google Scholar]
  18. Wang, Y.Y.; Jin, X.B.; Fan, Y.T.; Xiang, X.M.; Liu, J.; Zhou, Y.K. The impact of rural land consolidation program on promoting the level of agricultural modernization. China Land Sci. 2017, 31, 69–76. [Google Scholar] [CrossRef]
  19. Liao, N.; Gu, X.C.; Wang, Y.J.; Xu, H.L.; Fan, Z.L. Analyzing macro-level ecological change and micro-level farmer behavior in Manas river basin, China. Land 2020, 9, 250. [Google Scholar] [CrossRef]
  20. Fan, Z.L.; Yu, P.J.; Qiao, M.; Xu, H.J. Integrative improvement of cultivated land for ecological protection to agriculture in arid areas: A case of Manasi river basin of Xinjiang. Arid. Land Geogr. 2012, 35, 772–777. [Google Scholar]
  21. Ding, S.Y.; Liang, G.F. Landscape pattern change of regional wetland along the yellow river in henan province in the last two decades. J. Geogr. Sci. 2004, 653–661. [Google Scholar] [CrossRef]
  22. Corry, R.C.; Nassauer, J.I. Limitations of using landscape pattern indices to evaluate the ecological consequences of alternative plans and designs. Landsc. Urban Plan. 2005, 72, 265–280. [Google Scholar] [CrossRef]
  23. Lu, C.; Qi, W.; Li, L.; Sun, Y.; Qin, T.T.; Wang, N.N. Applications of 2d and 3d landscape pattern indices in landscape pattern analysis of mountainous area at county level. Chin. J. Appl. Ecol. 2012, 23, 1351–1358. [Google Scholar] [CrossRef]
  24. Suo, A.N.; Wang, C.; Zhang, M.H. Analysis of sea use landscape pattern based on Gis: A case study in Huludao, China. Springerplus 2016, 5, 1–12. [Google Scholar] [CrossRef] [Green Version]
  25. Yang, B. Performance evaluation model of economic compensation policy for cultivated land protection in coastal areas based on propensity value matching method. J. Coast. Res. 2020, 103, 19–23. [Google Scholar] [CrossRef]
  26. Wang, Y.H.; Li, X.B.; He, H.Y.; Xin, L.J.; Tan, M.H. How reliable are cultivated land assets as social security for chinese farmers? Land Use Policy 2020, 90, 104318. [Google Scholar] [CrossRef]
  27. Wu, D.F.; Liu, Y.Y.; Zhang, X.L. Analysis of cultivated land function evaluation in Guangzhou city from 1990 to 2014. Chin. J. Agric. Resour. Reg. Plan. 2019, 40, 64–72. [Google Scholar] [CrossRef]
  28. Ren, P.; Wu, T.; Zhou, J.M. Method of quantitative compensation for cultivated land conversion based on spatial characteristics of cultivated land protection value. Trans. Chin. Soc. Agric. Eng. 2014, 30, 277–287. [Google Scholar] [CrossRef]
  29. Dai, W.Y.; Jiang, F.Q.; Huang, W.L.; Liao, L.H.; Jiang, K. Study on transition of land use function and ecosystem service value based on the conception of production, living and ecological space: A case study of the Fuzhou new area. J. Nat. Resour. 2018, 33, 2098–2109. [Google Scholar] [CrossRef]
  30. Yang, W.J.; Liu, D.; Gong, Q.W. Estimation loss of agroecosystem service value in farmland conversion and its provincial difference in 2001–2016. Econ. Geogr. 2019, 39, 201–209. [Google Scholar] [CrossRef]
  31. Xie, G.D.; Zhang, C.X.; Zhang, L.M.; Chen, W.H.; Li, S.M. Improvement of the evaluation method for ecosystem service value based on per unit area. J. Nat. Resour. 2015, 30, 1243–1254. [Google Scholar] [CrossRef]
  32. Liu, L.H.; Zhang, B.X.; Liu, X.H. Compensation of provincial cultivated land protection in China from the dual perspectives of food security and ecological security. Trans. Chin. Soc. Agric. Eng. 2020, 36, 252–263. [Google Scholar] [CrossRef]
  33. Chen, T.B.; Zeng, X.B.; Hu, Q.X. Utilization efficiency of chemical fertilizers among different counties of China. Acta Geogr. Sin. 2002, 57, 531–538. [Google Scholar] [CrossRef]
  34. Sun, X.Z.; Zhou, H.L.; Xie, G.D. Ecological services and their values of chinese agroecosystem. China Popul. Resour. Environ. 2007, 17, 55–60. [Google Scholar] [CrossRef]
  35. Huang, W.J.; Sun, D.L.; Lu, Y.L.; Dai, S.X.; Chen, L.J.; An, Y.X. Effects of pesticide-fertilizer combinations on the rhizosphere microbiome of sugarcane: A preliminary study. Sugar Tech 2021, 23, 571–579. [Google Scholar] [CrossRef]
  36. Liu, Y.B.; Pan, X.B.; Li, J.S. A 1961–2010 record of fertilizer use, pesticide application and cereal yields: A review. Agron. Sustain. Dev. 2015, 35, 83–93. [Google Scholar] [CrossRef] [Green Version]
  37. Sun, S.H.; Zhou, M.H. Analysis of farmers’ land transfer willingness and satisfaction based on SPSS analysis of computer software. Clust. Comput. J. Netw. Softw. Tools Appl. 2019, 22, S9123–S9131. [Google Scholar] [CrossRef]
  38. Zheng, A.M.; Li, Z. The impact mechanism of rural land circulation on promoting rural revitalization based on wireless network development. EURASIP J. Wirel. Commun. Netw. 2019. [Google Scholar] [CrossRef]
  39. Song, Y.N.; Wang, M.Y.; Lei, X.T. Following the money: Corruption, conflict, and the winners and losers of suburban land acquisition in China. Geogr. Res. 2016, 54, 86–102. [Google Scholar] [CrossRef]
  40. Wen, L.J.; Chatalova, L.; Butsic, V.; Hu, Z.Y.; Zhang, A.L. Capitalization of land development rights in rural China: A choice experiment on individuals’ preferences in peri-urban Shanghai. Land Use Policy 2020, 97, 104803. [Google Scholar] [CrossRef]
  41. Liu, W.; Xu, J.; Li, J. The influence of poverty alleviation resettlement on rural household livelihood vulnerability in the western mountainous areas, China. Sustainability 2018, 10, 2793. [Google Scholar] [CrossRef] [Green Version]
  42. Yan, J.Z.; Li, H.L.; Hua, X.B.; Peng, K.; Zhang, Y.L. Determinants of engagement in off-farm employment in the Sanjiangyuan region of the Tibetan plateau. Mt. Res. Dev. 2017, 37, 464–473. [Google Scholar] [CrossRef]
Figure 1. Location diagram of the study area.
Land 10 00961 g001
Figure 2. Changes in the degree of fragmentation in each village.
Land 10 00961 g002
Figure 3. Economic value before and after the integration of cultivated land.
Land 10 00961 g003
Figure 4. Social value before and after the integration of cultivated land.
Land 10 00961 g004
Figure 5. The positive pro-ecological value of cultivated land before and after integration.
Land 10 00961 g005
Figure 6. Negative pro-ecological value of cultivated land before and after integration.
Land 10 00961 g006
Table 1. Fragmentation/integration strength indices.
Analytical IndexCalculation FormulaSelection Basis
Patch Density PD = N M , M is the total area of patches; N is the total number of patches.The ratio of patch number to total area; the greater the value, the higher the fragmentation.
Mean Patch Size MPS = M N The larger the average patch area, the lower the fragmentation.
Area Weighted Mean Shape Index AWMSI = i = 1 N 0.25 L i M i M i M , Li and Mi are the perimeter and area of the ith patch.To reflect the complexity of patch shape, the larger the value is, the more irregular the shape is.
Edge Density ED = L / M , L is the total boundary length of patches.The greater the degree of landscape segmentation by edge is, the higher the degree of fragmentation is.
Fragmentation index of landscape patch number FN = N - 1 M min / M , Mmin is the minimum area of patch.The degree of fragmentation of the landscape reflects the complexity of the spatial structure of the landscape. The larger the value is, the more fragmented the landscape is.
Fragmentation index of landscape patch shape FS = 1 - 1 i = 1 N 0.25 L i M i / N The shape feature of the landscape spatial structure; the larger the value, the more irregular the shape of the landscape patch.
Table 2. Integration of each village.
VillageCultivated Land Area before Integration (ha)Cultivated Land Area after Integration (ha)Change of Area (ha)Increase Area (ha)
Tian KanWayDitchesSporadicallyUnused LandThe Percentage Increase in Cultivated Area after Integration (%)
Shangbajiahu Village357.55378.93.262.141.575.848.5421.355.97
Xiaxiwan Village352.48382.383.982.9827.9812.9629.908.48
Gudao Village405.81455.096.866.437.2113.0715.7149.2812.14
Huanggongzhunagzi Village338.67388.529.5912.737.510049.8314.71
Shaofangzhuang Village344.26399.399.034.512.2618.2821.0555.1316.01
Xingfen Village447.44499.128.345.172.5814.9220.6751.6811.55
Weijiazhuang Village367.42299.343.980.911.0810.9814.9731.928.69
Shanghudidong Village441.11475.363.321.131.3912.5915.8234.257.76
Xiazhuangzi Village397.09435.153.091.231.3217.7514.6738.069.58
Huangqu Village335.77365.943.341.681.519.5114.1330.178.99
Table 3. Farmland income—expenditure status before and after consolidation in each village.
VillageEconomic Value before Integration (RMB Thousand/ha)Economic Value after Integration (RMB Thousand/ha)Absolute Net Gain before and after Consolidation of Cultivated land (RMB Thousand/ha)Change in Net Return before and after Consolidation of Cultivated Land (%)
Unit Output ValueUnit CostNet IncomeUnit Output ValueUnit CostNet Income
Shangbajiahu VillageLMHA14.208.705.5018.6011.307.201.7030.91
Xiaxiwan Village14.508.705.8019.1011.008.102.3039.66
Gudao VillageOAA16.508.707.9023.8010.0013.805.9074.68
Huanggongzhuangzi Village15.908.707.2022.0010.3011.704.5062.50
Shaofangzhuang Village16.108.707.4022.8010.2012.605.2070.27
Xingfen Village16.608.608.0025.0010.3014.706.7083.75
Weijiazhuang VillageODIA15.408.706.7020.2010.509.703.0044.78
Shanghudidong Village15.608.707.0021.5010.7010.903.9055.71
Xiazhuangzi Village15.508.706.8021.4010.5010.904.1060.29
Huangqu Village14.908.706.2019.8010.509.403.2051.61
Table 4. Total positive pro-ecological value of cultivated land before and after consolidation and the amount of change.
VillagePositive Pro-Ecological Value of Cultivated Land before Consolidation (RMB Thousand/ha)Positive Pro-Ecological Value of Cultivated Land after Consolidation (RMB Thousand/ha)Amount of Change in Value (RMB Thousand/ha)
Shangbajiahu VillageLMHA21.2027.806.60
Xiaxiwan Village22.4031.308.90
Gudao VillageOAA30.5053.3022.80
Huanggongzhuangzi Village27.8045.2017.40
Shaofangzhuang Village28.6048.6020.10
Xingfen Village30.9056.7025.90
Weijiazhuang VillageODIA25.9037.4011.60
Shanghudidong Village27.0042.1015.10
Xiazhuangzi Village26.2042.1015.80
Huangqu Village23.9036.3012.40
Table 5. Pro-ecological value of cultivated land before and after integration.
VillagePro-Ecological Value of Cultivated Land before Integration (RMB Thousand/ha)Pro-Ecological Value of Cultivated Land after Integration (RMB Thousand/ha)Value Increment (RMB Thousand/ha)Percentage Change in Value (%)
Shangbajiahu VillageLMHA18.925.206.3033.33
Xiaxiwan Village20.228.608.4041.58
Gudao VillageOAA26.848.6021.8081.34
Huanggongzhuangzi Village25.942.1016.2062.55
Shaofangzhuang Village26.745.5018.8070.41
Xingfen Village26.951.8024.9092.57
Weijiazhuang VillageODIA24.635.4010.8043.90
Shanghudidong Village23.237.5014.4062.07
Xiazhuangzi Village22.737.9015.3067.40
Huangqu Village22.434.0011.6051.79
Table 6. Integrative value of cultivated land before and after integration.
VillageThe Integrative Value of Cultivated Land before Consolidation. (RMB Thousand/ha)The Integrative Value of Cultivated Land after Consolidation. (RMB Thousand/ha)Incremental Integrated Value (RMB Thousand/ha)Percentage Change in Value (%)
Shangbajiahu VillageLMHA321.10598.80277.7086.47
Xiaxiwan Village318.80603.80285.0089.38
Gudao VillageOAA398.00692.20294.2073.91
Huanggongzhuangzi Village386.80653.10266.3068.86
Shaofangzhuang Village386.30684.80298.5077.27
Xingfen Village392.50734.70342.2087.17
Weijiazhuang VillageODIA348.20716.70368.50105.85
Shanghudidong Village347.70748.70401.10115.36
Xiazhuangzi Village349.30778.50429.20122.89
Huangqu Village345.50706.40360.90104.45
Publisher’s Note: MDPI stays neutral with regard to jurisdictional claims in published maps and institutional affiliations.

