1. Introduction
Urban sprawl is a spatial phenomenon around which scientific debate has been ongoing for a number of years.
In historical terms, urban sprawl is a term that was introduced into scientific debate in 1937 by E. Draper during an urban conference in the United States and concerned a specific way of building suburban space [
1]. Since then, the term has spread to many disciplines [
2]. Until the end of the 1990s, studies focus on the specific features of suburbs’ development, creating the concept of urban sprawl, such as [
3,
4,
5]: “leapfrog”—i.e., location of small residential estates in different places that are not directly adjacent to each other; “ribbon development”—i.e., along communication routes; low building density. The cause of urban sprawl was poor quality of spatial planning, which results in faster growth of the urbanized area than the population [
6,
7]. Ewing [
5] catalogs classical and derivative features of the phenomenon. Among the classic, it indicates the specific features of land development, i.e.: low density, ribbon development, dispersion, and “leapfrog”. However, for the group of derivatives, it includes: low transport accessibility and lack of open spaces; social segregation and dependency on cars.
The beginning of the 21st century brought an agreement in defining urban sprawl as a spontaneous change in the spatial structure of suburban communes resulting from the intensification of suburbanization with a low control degree of these processes on the part of spatial policy [
8,
9,
10,
11]. Spontaneity is defined as a building location that results in the creation of a spatial structure with many negative features that are a departure from planning and therefore rational function. The past two decades have also brought interest in post-socialist urban sprawl [
12,
13,
14]. In the literature, there is a lot of evidence showing that urban sprawl has been the dominant spatial growth model of post-socialist metropolitan areas and medium-sized urban areas [
15,
16,
17,
18,
19,
20,
21,
22]. The 21st century focuses on quantifying techniques for measuring urban dispersion by using GIS data, such as remote sensing images. The availability of satellite images from different time series enabled tracking of land use changes [
23,
24,
25,
26] or presenting the dynamics of urban development, including spontaneous suburbanization processes [
27,
28]. Parallel to remote sensing methods, Galster et al. [
9,
10] emphasize that urban sprawl is a collection of many negatively assessed spatial development features. Therefore, they point to eight dimensions of urban sprawl based on the distribution of buildings in space [
9,
10]: low density, lack of continuity, lack of clustering, lack of concentration, decentralization, polynuclearity, lack of mixed uses, lack of proximity. The Galster et al. [
10] approach is considered as one of the more important and accurate contemporary concepts of specification and measurement of urban sprawl [
9,
29,
30,
31].
Urban sprawl is generally valued negatively because of the socio-economic, spatial, and environmental costs it generates [
8,
32]. Major economic losses include [
29,
33,
34,
35,
36]: excessive public expenditure on infrastructure and public services; inefficiency of energy consumption; negative impact on the household budget; negative market impact on the city center. Social losses include [
37,
38]: society’s dependence on cars, an increase in the incidence of civilization diseases, e.g., obesity, heart disease, diabetes, movement and breathing problems, etc. Among the environmental losses are [
35,
39,
40,
41,
42]: a reduction of atmospheric air quality, temperature rise, loss of valuable natural and agricultural areas, negative impact on the ecosystem. These consequences become the justification for formulating and implementing anti-sprawl spatial policies.
There are two important reports often pointing out the directions of national spatial policies: the first is “Potentials for polycentric development in Europe” [
43], while the second is “Rethinking Urban Sprawl. Moving Towards Sustainable Cities” [
35]. In both reports, along with urban sprawl, polycentricity plays an important role. In the ESPON Report, polycentricity is evaluated positively by setting the desired goal for spatial policy. In the OECD Report, on the other hand, polycentricity is one of the negative features of the spatial structure attributed to urban sprawl, which requires intervention on the part of spatial policy. The dichotomous assessment of polycentricity may be further compounded by one of the characteristics pointed out by Galster et al. [
9,
10], i.e., polynuclearity can be conceptually similar to polycentricity. Thus, semantic confusion is born: is polycentricity a positive or negative feature of spatial development and how does it differ from polynuclearism? The answer to this question is essential for solving the main problem of the article, i.e., polynuclearity as a measure of urban sprawl. The answer is also of permanent importance for formulating appropriate anti-sprawl spatial policies.
Polynuclear character is the degree to which a metropolis shows a multiplicity of areas with a very high density of buildings [
9,
10]. Urban sprawl caused polynuclearization in metropolises, and the leading role of historic city centers was weakened in favor of other districts of a given metropolitan area taking over specific functions [
44], e.g., financial centers, technology centers, shopping centers, industrial centers, etc. In the event that the center of a given city is the only area of intensive development, the area is characterized by a mononuclear structure. If, on the other hand, the development is spread over several intensively built-up areas, then the structure is polynuclear. Thus, poly- or mononuclearization by definition emphasizes the density of buildings in the metropolis but does not include the functional relationship with the surroundings of high-density areas. The polynuclear urban system requires a larger area of land from the city to aggregate a certain number of buildings or populations [
35]. In this sense, polynuclearity is indicated by the urban sprawl feature.
Polynuclearity is conceptually and semantically similar to polycentricity, which is defined as multiplicity of urban centers. Polycentricity is the extent to which an urban area displays a multitude of centers around which autonomous urban structures are created [
10,
45,
46,
47,
48]. In general, polycentricity can be considered in different territorial scopes [
43]: macro as a multitude of urban centers on a continental scale; meso as an inter-urban dimension, i.e., two or more urban centers should be functionally complementary; micro, as mentioned, the internal character of a city. Within each territorial scope, polycentricity involves two types of functional linkages. First, linking urban and economic functions between each of the city centers and its surroundings. The second is the connection between all city centers. Such a polycentric structure strengthens economic opportunities by reducing the high operating costs of entities (real estate and transport costs, costs of congestion, etc.) in one urban core. Hence, polycentricity has become a key concept for scientific research and for policies for spatial planning.
Bartosiewicz and Marcińczak [
49], reviewing scientific research on polycentricity, note that since the 1970s, polycentricity has become a spatial phenomenon so visible that it has been defined as a model explaining changes in the city’s structure. The authors notice that current research on polycentricity is conducted primarily in Europe [
49,
50,
51,
52,
53,
54], but also in China, where they are currently the most developed [
55,
56,
57,
58].
Polycentricity as a concept for spatial policy is not reflected in the implementation of specific polycentric instruments but is rather expressed in stimulating the creation of many urban centers [
43]. Stimulation is understood as the formulation of government documents that are not binding on local policy, but at the same time initiate the process of introducing and disseminating polycentricity. In countries where spatial policy is widely respected, the implementation of the polycentric concept is possible through spatial planning agencies (e.g., Denmark, Switzerland, France, the Netherlands). However, in countries where spatial policy does not occupy an important place in public policy, the implementation of the concept of polycentricity remains at very low levels of decision-making (e.g., Italy, Poland). Stimulating the emergence of a polycentric city structure is aimed at strengthening economic integration. Therefore, urban policies should focus on the development of linkages between centers, e.g., by defining planning strategies, determining the economic role of each center, and developing common service provision facilities [
43].
The difference between polynuclearity and polycentricity thus comes down to functional linkages. In the case of polycentricity, functional linkages do not exist or are not examined because polycentricity assesses the number of high-density areas. In contrast, polycentricity examines the number of centers, which are defined as high-density areas that are functionally connected to the surrounding area. In explaining the differences between polynuclearity and polycentricity, there are two main aspects: functional and morphological. In functional terms, there is a reference to relationships and cooperation between centers at various territorial scales. The morphological approach is to identify the spatial distribution of centers in the studied area.
The study of functional connections in polycentric systems first concerns the labor market, followed by institutional and structural connections [
59]. Functional polycentricity of the labor market is assessed both positively and negatively. The disadvantage of the polycentric system of the labor market is the homogeneity of the economic environment. The same feature is sometimes seen as an advantage of area specialization with the advantages of clustering business entities, and further synergies. Institutional links are based on the voluntary cooperation of institutions or political systems. Such cooperation is expressed in the collaboration of territorial agencies on joint projects and strategies. Structural links refer to the organization of economic and functional connections in space. These connections do not always result from urban strategies and are more often the external effects of the spread of housing or the labor market, i.e., urban sprawl. Therefore, structural polycentricity can be identified through: communication routes (roads, railways), financial flows (salaries, investments), information flows (advertising), etc.
Polycentricity in terms of morphology has the dimension of spatial identification of urban centers. In this regard, spatial morphology may be strongly or weakly hierarchical, i.e., mononuclear with one dominant center and several peripheral centers, and polycentric without a dominant center with several equivalent ones [
43] (pp. 45). Centers of comparable sizes are most often examples of spatial polycentricity. Hence, it is assumed that polycentricity in a morphological approach can be determined by polynuclearity. However, this does not change the fact that polycentricity can be achieved through the hierarchical configuration of centers in the area, i.e., mononuclearity.
The presented theoretical considerations indicate the fundamental difference between polycentricity and polynuclearity and their functional connections. In the case of the polycentric structure, there are functional relationships between local centers and their surroundings, while polynuclearism emphasizes only high density of buildings without their connection to the environment. Thus, polycentricity analysis based solely on the density index will be the same as polynuclearity. Therefore, it seems that in the context of the phenomenon of urban sprawl one should reference polynuclearism rather than polycentricity. Polycentricity, in turn, is assessed positively by its connections with the environment. In turn, polynuclearism does not analyze connections, only a grouping of buildings, e.g., “leapfrog”, which is assessed negatively. On the other hand, polynuclearity may be the first step to identifying polycentricity, and in other words, adding a polynuclearity measurement to the analysis of functional relationships will determine the polycentricity of the analyzed area.
Since the research presented in the following part of the article concerns a proposal for the measurement of polynuclearity as a feature of urban sprawl, two issues require specific reflection: the first is the current state of research on polynuclearity; the second is the validation of spatial measures.
Polynuclearity analysis in the context of urban sprawl is conducted by Galster et al. [
10]. The polynuclear measurement procedure involves the use of a 1-mile square grid. Polynuclear measurement involves several steps. In the first step, the procedure begins with identifying the squares of the highest density of the analyzed feature per 1 mL
2 within the square grid defined in the urban area. The second step is to identify the central core “c” by determining and attaching it to the squares highlighted in the first step—squares with a density within one standard deviation of the analyzed feature for the squares with the highest density value. The third step involves the re-determination of the standard deviation for the density of the analyzed feature of the core “c”. If, as a consequence of using the determined measure in the third step, there are clusters of squares separated from the “c” core that fall within one density standard deviation, calculated for the core “c”, then they are treated as separate “n” cores. The next step is the addition of square grid areas adjacent to the identified cores that fall within one standard deviation of the recalculated densest cores—“c”. The procedure ends with the calculation of the “c” nuclearity based on one of the three alternative formulas:
Counting the separate cores, which is interpreted as a measure of the degree of polynuclearity;
The ratio of buildings in the central core to the other cores;
The percentage share of observations (e.g., buildings, apartments) of the central core in all cores.
One of the key problems associated with the use of the polynuclear measurement method seems to be determining the range of the highest density of squares eligible for the central core “c”. Thus, this raises the question of method validation, including but not limited to whether the use of standard deviation is an appropriate approach to identifying central core. It has a significant impact on the results obtained. In addition, extreme values, i.e., maximum high square densities, also influence the final results. Leaving such values distorts the results.
The OECD Report [
35] presents an example approach to measuring polynuclearity in the context of urban sprawl. This report attempts to identify urban sprawl in 1156 urban areas of 29 OECD countries, including Poland et al. The authors use three data sets for the periods 1990, 2000, and 2014: (1) built-up areas in a square with a side of 38 m; (2) population density in a square with a side of 250 m; (3) urban boundaries in OECD countries. On this basis, they calculate the following indicators:
Density of population;
Share of population residing in areas with a population density below the threshold (separately adopted for each urban area);
Standard deviation of population density;
Fragmentation index, being the share of development in 1 km2 of the urbanized area;
The polycentricity;
Spatial decentralization, which is the share of people living outside the core city.
The OECD Report [
35] notes that polycentricity measured by building density is the same as the polynuclearity category. It is assumed in the report that the measurement of polycentricity should be limited to the identification of centers in the urban area. In the report, polycentricity operationalizes the center as an area larger than 5 km
2, where the population density is significantly higher than the density in the surrounding areas. Sample conclusions formulated in the report [
35] indicate that Polish urban areas are less polycentric in nature than the OECD average, although large urban areas (e.g., Warsaw) can be attributed to a polycentric system. The advantage of the research is the possibility of comparison between many countries and methodological advancement. However, the limitation can be found in the input data based on the spatial distribution of the population residing in a given place. However, the urban sprawl structure of the space is reflected in the state of its actual development, with both residential and business buildings as well as infrastructure. It should also be noted that the urban center is both a place to live and work, so data on the location of buildings seems to more accurately reflect polynuclearity.
An additional example of polynuclearity identification can be found in the ESPON Report [
43], which undertakes an assessment of the spatial structure of the urban area through three morphological types, i.e.,
Sprawl defined as ungrouped continuous settlements outside the city limits.
A monocentric spatial structure characterized by grouping buildings into one area with one clearly dominant center and no other centers.
A polycentric spatial structure characterized by several large, grouped settlements that are clearly distant from each other.
Critical references should be made to the definitions of urban sprawl and its operational use in the ESPON Report. One of the important features of spatial structure is the lack of continuous development, which is characteristic of “leapfrog” [
5,
10]. It should be noted that the ESPON Report doubtfully assumes the continuation of development between the city and the surrounding settlements. With an erroneous assumption, and at the same time without other morphological measures important for urban sprawl, the matter is research-rationalized, which in effect results in questionable research results. In Europe, relatively few urban areas subject to the urban sprawl phenomenon have been identified [
43] (pp. 161), i.e., 58 functional areas from 1574 (4%). There is no identification of areas with urban sprawl, e.g., in Poland, while other external studies identify the phenomenon in this country [
15].
It is also doubtful whether placing urban sprawl as a morphology type next to monocentricity and polycentricity and treating such a classification as disjunctive is relevant. The question arises, can urban sprawl take place in a monocentric urban area? The answer is yes, because sprawl is defined as the disorderly spread of the city, which goes directly to the ESPON definition in terms of monocentric structure. Thus, a monocentric city with widespread suburbs is referred to as urban sprawl. Similarly, in the case of polycentric structure, we can have spontaneous expansion of buildings around many centers. At the same time, urban sprawl in the areas surrounding the centers is a structure with no concentration of buildings, low density, lack of building continuity, and a multitude of individual settlements (polynuclear). Thus, in the polycentric area, we can also observe urban sprawl with elements of polynuclearity.
The ESPON Report [
43] (pp. 49) formulates many necessary research directions in the morphological and functional scope of polycentricity, aggregating them into the following groups: analysis, evaluation, policy analysis, forecasting, implementation. From the point of view of the title of the article, attention is drawn to the question formulated in the group of morphological analyses, i.e., “How can polycentricity be defined in a way that makes it measurable?”. The research presented in the article meets the question established in the ESPON Report.
The second issue requiring reflection to fulfill the title research problem is validation. Validation is the evaluation of the suitability or usefulness of the structural factors of the equation, the choice of the research area, etc. The task of validation is [
60,
61]: to identify possible errors and correct them; to compare methods quantitatively; to provide reliable information to make informed decisions. The literature on validation of space morphology tests addresses the issue of accuracy of test results [
62,
63]. The methodological approach of taking test samples and further analyzing them is an important part of accuracy assessment [
60]. There are several techniques for validating a study of data accuracy or error [
63]: visual inspection, non-site-specific analysis, difference image generation, error budgeting, and quantitative accuracy assessment.
The conceptualization and operationalization of morphological testing requires adequate validation to help establish greater accuracy of results and their interpretation. Three dimensions of validation are important here [
60]. The first is the sampling design selecting the subset of spatial units (e.g., polygons) that will form the basis of the accuracy assessment. The secund is the response design that leads to a decision regarding agreement of the reference and map classifications. The third is an analysis that specifies the measures to be used to express accuracy and class area, as well as the procedures to estimate the selected measures from the sample data.
The main aim of the article is to propose a morphological measure of polynuclearity as a feature of urban sprawl. On the basis of the presented theoretical considerations, instead of hypotheses, goals determining the course of the research process were formulated. It was assumed that the research objectives in the field of polynuclear calculations as a morphological measure of urban sprawl are: (G1) use of building location data, (G2) assessment of various statistical approaches for determining the central core, (G3) assessment of the influence of extreme values on final results, (G4) selection of the most accurate approach to polynuclear calculations.
2. Materials and Methods
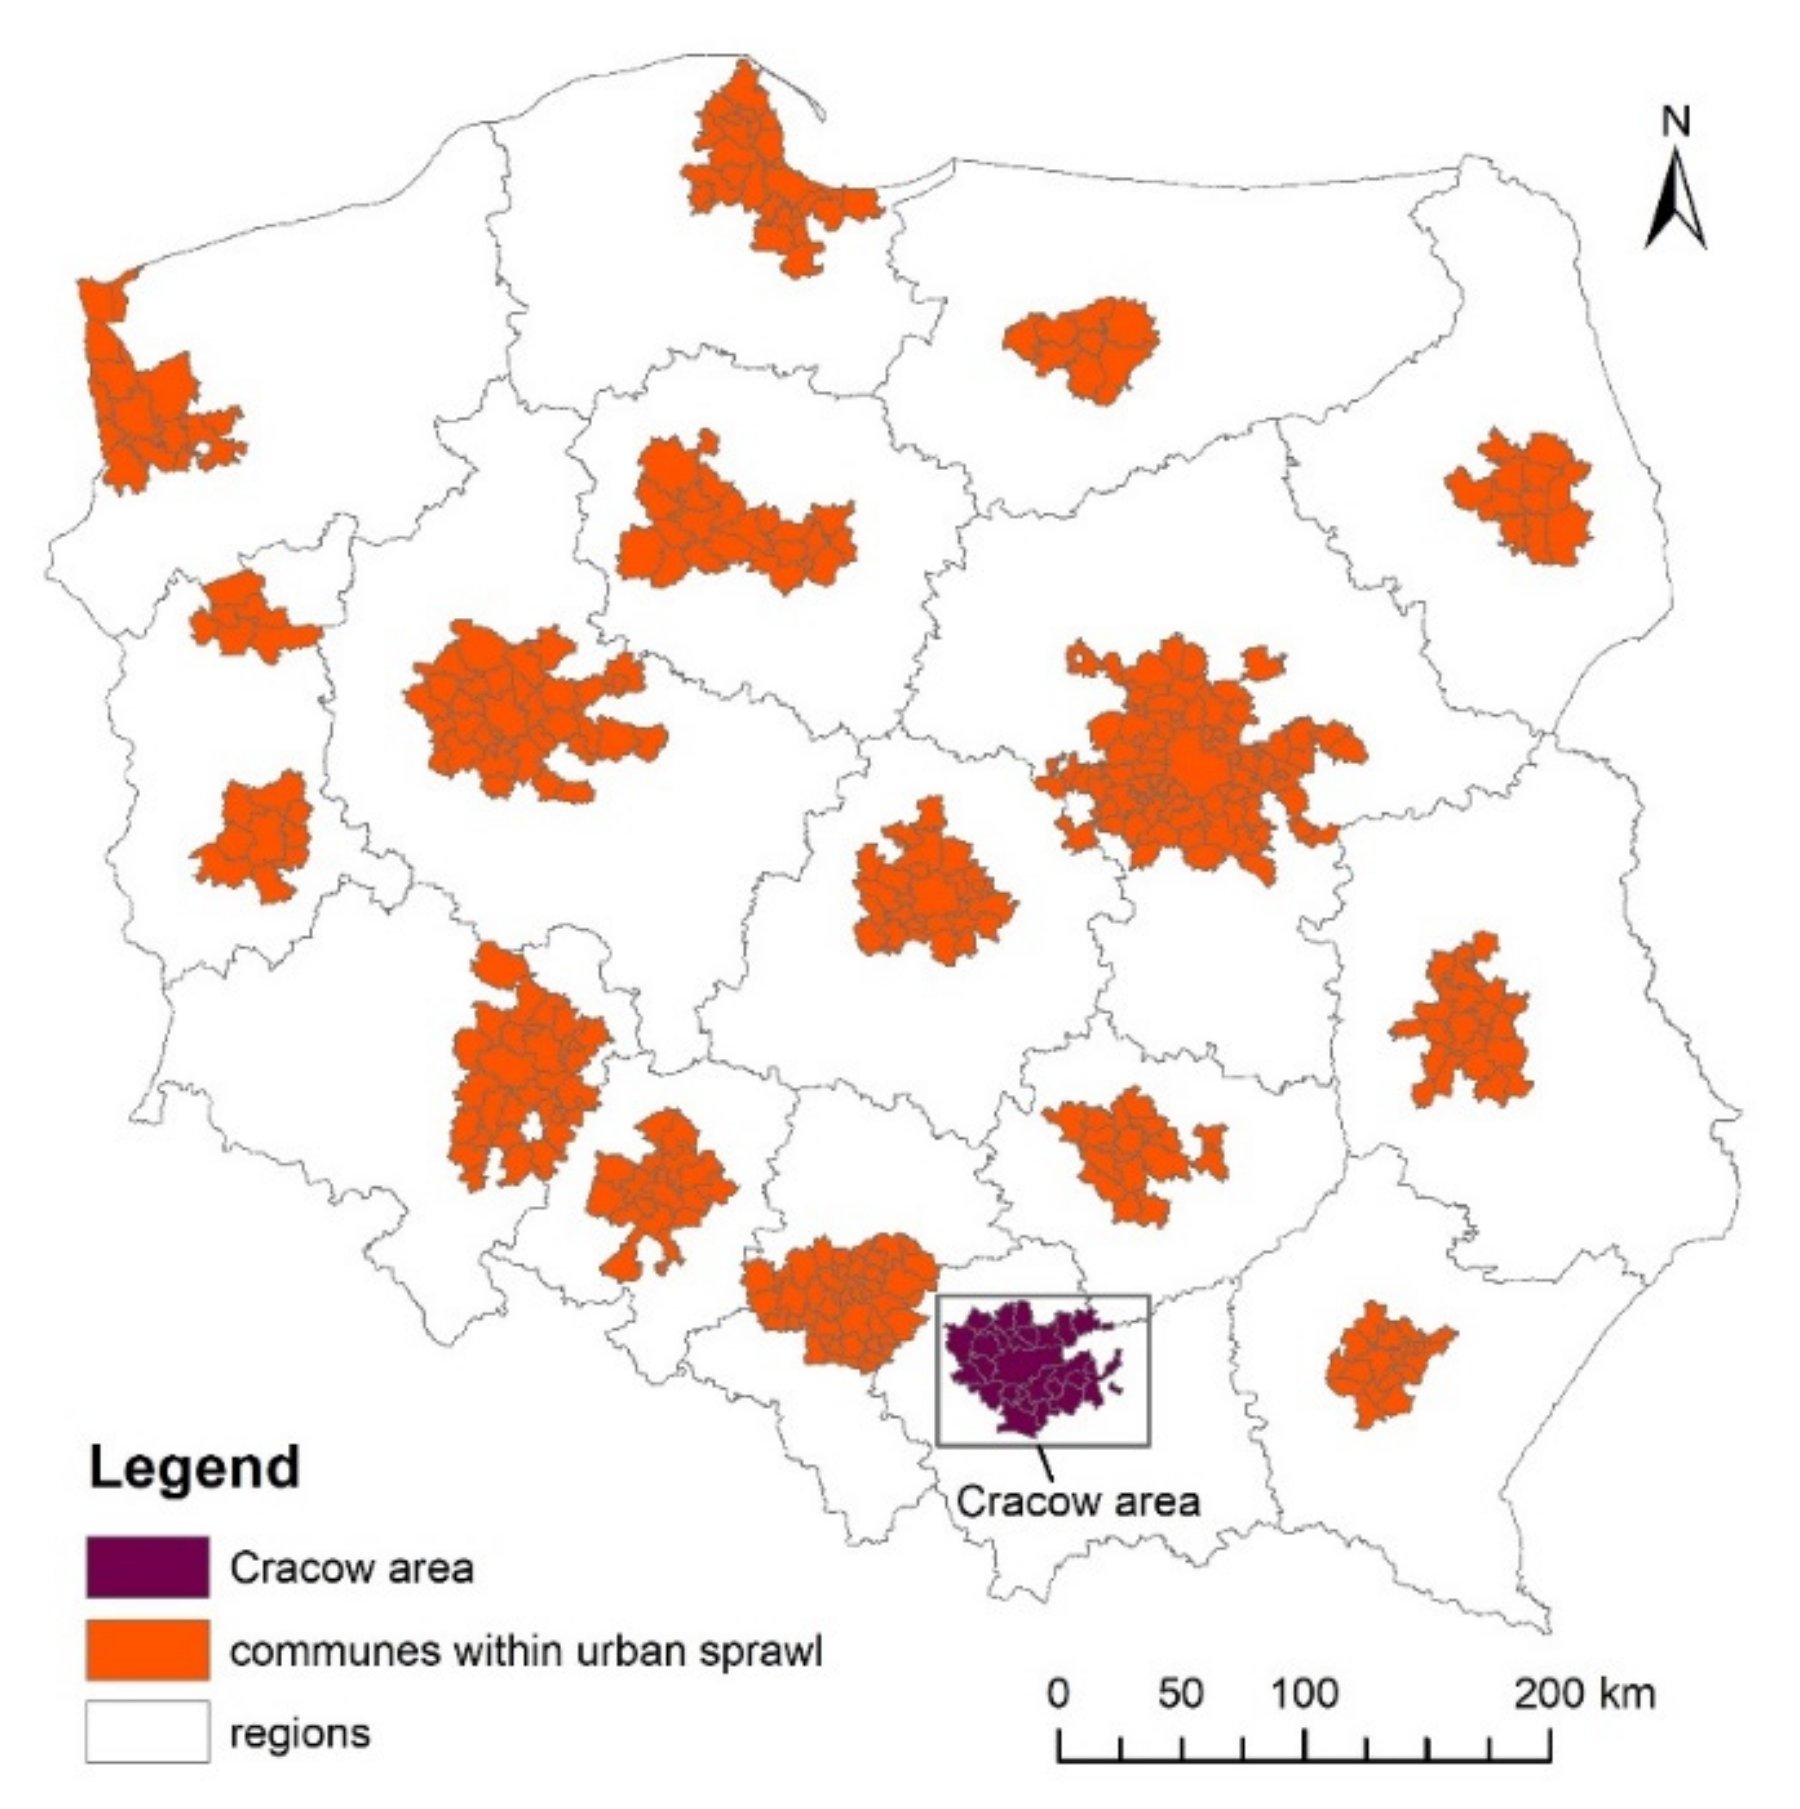
The implementation of research goals should be carried out in the previously designated area in which urban sprawl takes place. The article uses the delimitation presented by Lityński and Hołuj [
64] (pp. 5–9), which is based on variables indicating the occurrence of urban sprawl. An example of the area used for conducting polynuclear analyses was the area of Cracow, Poland and its impact zones designated as part of the delimitation cited. Cracow is developing its metropolitan functions, and suburbanization processes are occurring rapidly in its surroundings and changes in the structure of space are observed, showing the described urban sprawl features. Observation of contemporary development processes taking place around Cracow leads to conclusions about the occurrence of changes in the nuclear character of buildings in the metropolitan area. To empirically confirm their occurrence, it is necessary to carry out a study of the morphological continuity and homogeneity of buildings—by means of nuclear analysis. The nuclear analysis requires an application of a validation procedure framework, which requires: the adoption of an appropriate spatial scale of the study area; data selection of buildings in temporal sections as close as possible from reliable record sources. Moreover, the nuclear analysis requires a calculation of the area of possible buildings, which involves qualitative and quantitative validation of data describing particular land use types. The choice of the Cracow area also resulted from the validation of the results of building density in all delimited urban sprawl areas studied by Lityński and Hołuj [
64]. As a result, the adopted solution allowed for the performance of comparative, trial calculations for each of them and distinguished a specificity of the Cracow area. Finally, the choice of the Cracow area was determined by the presence of extreme values. In the Cracow area, the highest values of housing density in Poland were observed. Extremely high values influence the final results, and therefore should be investigated in the validation procedure. The determined strength of influence of extremely high values may serve as reference values in other studies, such as comparative morphological studies.
The urban sprawl zone adopted for research includes 25 communes located in the vicinity of Cracow. Its range compared to other cities is presented in
Figure 1.
Cracow is the second largest city in Poland in terms of population (779,000) and area (327 km2), featured as the capital of the Lesser Poland region. The city’s building structure is very diverse. On the outskirts of the city, the functions and forms characteristic of the city and the countryside are intermingling, and in non-built-up spaces there is a strong pressure to de-agriculturalize land for housing and shopping centers. The specificity of the building structure of communes included in the area of Cracow’s influence is the concentration of residential and business buildings along roads. The dominant type of development is single-family residential buildings, but duplex and townhouses are present as well.
G1, i.e., the use of building location data, consists of using the original set of the Central Center for Geodetic and Cartographic Documentation, Poland (CCGCD) referring to the location of the buildings from the topographic object database (BDOT10k). BDOT10k contains information on topographic objects, including: their spatial location, characteristics, cartographic codes, as well as metadata of these objects. The database corresponds to the detail of a 1:10,000 scale topographic map and is available in vector form or as a web service. It was launched in 2012–2013, and the Polish central and voivodeship geodetic and cartographic services are responsible for its development and updating. Topographic objects are grouped into nine classes, and they are: water, communication, utilities, land cover, land use complexes, protected areas, territorial division units, other objects and buildings, structures, and devices. The database used the in research covers all categories of buildings, structures, and infrastructural devices for 2017:
Single-family residential buildings;
Two-apartment buildings;
Buildings with three or more apartments;
Collective residence buildings;
Hotel buildings;
Accommodation buildings;
Office buildings;
Commercial and service buildings;
Communication buildings, stations and terminals, garage buildings;
Industrial buildings;
Tanks, silos, and storage buildings;
Publicly accessible cultural facilities;
Museum and library buildings;
Buildings of schools and research institutions;
Buildings of hospitals and medical care facilities;
Physical activity buildings (fitness centers etc.);
Farm buildings;
Buildings intended for religious activities;
Objects from the register of monuments and subject to individual conservation protection as well as immovable, archaeological goods of culture;
Other non-residential buildings not mentioned elsewhere.
Based on the above-described data, a further calculation of the nuclear index was made.
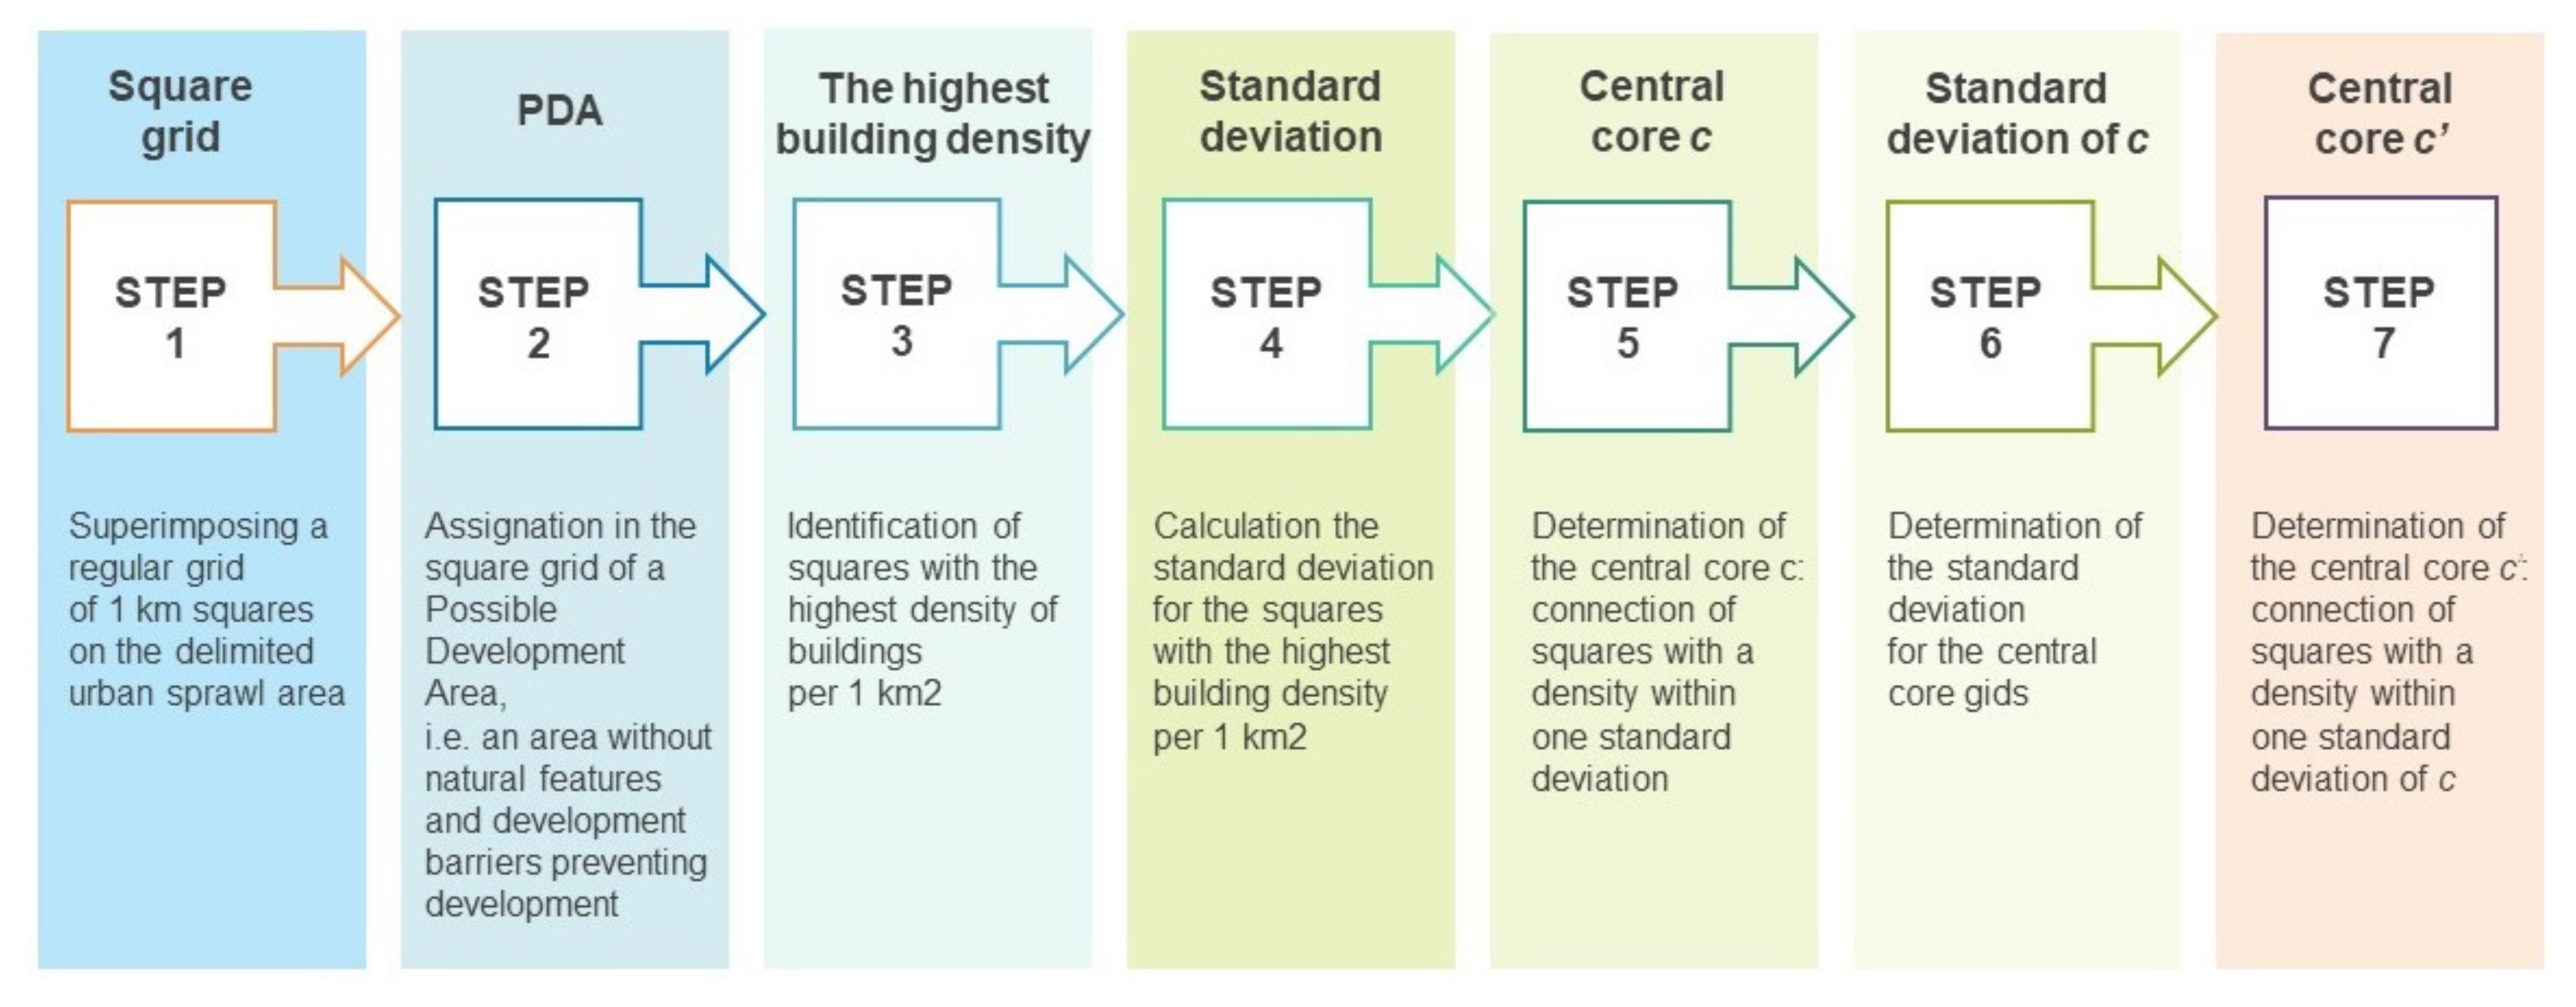
The procedure for conducting nuclear analysis assumes taking several steps using a 1 km
2 square grid to identify the central core and other cores. Generally, buildings were counted in the following squares, which is the basis for calculating nuclearity. The following programs were used in this procedure: SpatiaLite database, QGIS and ArcGIS for spatial analyses, and MS Excel spreadsheet. The calculated values of the building density were assigned to the square grid centroids. A simplified diagram is shown in
Figure 2.
The first two steps are preparatory. The first step is to prepare a 1 km square grid and overlay it over the delimited urban sprawl area. The second is to designate the Possible Development Area (PDA). PDA is important as in the 1 km
2 square grid method the total area is not 1 km
2; there is, however, the so-called 1 km
2 of the PDA. Thus, PDA is the area that is entered in the calculations instead of the total area of the communes. PDA is understood as an area without natural features and development barriers preventing development. In the original study, conducted in American conditions, a net land area available in statistics was used, based on which the non-built-up area was identified [
30]. The authors note, however, some shortcomings for the undeveloped but buildable area that plays a key role in the method. Firstly, there is no distinction between usable land and similar but inaccessible land that is reserved for parks or protected nature areas. Secondly, it is not possible to determine the angles of the slope of the terrain, and thus the possibility of eliminating steep terrain. Thirdly, taking into account some categories of land that may seem problematic for building, but at high demand they can be built upon: rocky, clay, and sand plots, as well as open-cast mines and gravel pits. However, in this study it was proposed that the PDA exclude the surface of roads, waters, and protected areas. Thus, in the calculation of nuclearity for Polish conditions, it was calculated in each of the squares of a 1 km
2 grid by subtracting from the total surface of the squares the buffer area around: national, regional, poviat, and commune roads; rivers, streams, and standing waters; protected areas, including national parks and reserves. In Polish legal regulations, it is absolutely not possible to implement construction investments in these areas [
42,
65]. On the other hand, in other areas, examples of implementation of construction investments can be found despite the fact that seemingly such areas cannot be built on (e.g., agricultural land, forests). Śleszyński et al. [
66] indicate that the ineffectiveness of the Polish spatial policy enables a problem-free transformation of forest areas into construction areas. Nowak [
67] sees a similar problem regarding the transformation of agricultural land on which residential buildings are built. The ease of transforming agricultural and forest land described in Polish literature intensifies the chaotic location of buildings attributed to urban sprawl [
68,
69].
In the third step, the squares with the highest building density per 1 km
2 are identified within the one-kilometer grid defined in the urban area. Then, the central core “c” is determined by identification and attachment to the squares highlighted in the third and fourth steps; squares with a density within one standard deviation. The sixth step is associated with the recalculation of the standard deviation for the core density “c”. If, as a consequence of using the value of the newly calculated standard deviation, there are clusters of squares separated from the “c” core that fall within one standard deviation of the density of the “c” core, they are treated as separate “n” cores. The procedure ends with the addition of squares grid adjacent to the identified cores, which are in one standard deviation of the recalculated densest cores “c”. The “c” core is distinguished for a detailed explanation of the method used and is of a technical nature. Galster et al. [
10] use one core designation “c” for the final result of the calculations. In the proposed method, we introduced two distinctions of the central core: “c” (step 5) and “c’” (step 7).
The problem of identifying the central core, i.e., determining the highest density range, is one of the key problems associated with the verification of the Galster et al. method [
10], and then its adaptation for measuring nuclearity in Poland. Its determination has a significant impact on the results obtained. Thus, the numbers of grid squares with the highest densities, belonging to the ranges: 75th percentile (third quartile), 80th percentile (fourth quintile), 90th percentile (ninth decile), and 95th percentile were tested. This test is the implementation of the research goal G2.
An additional important test is the analysis considering all density results and the analysis omitting extremely high building density results. This test is the implementation of the research goal G3. The test of extremely high densities increases the accuracy of the real measurement of the nuclear area of the test area. In the extremely high test, structural analysis was also proposed, i.e., the assessment of statistics constituting the nuclearity calculation, which distinguishes:
Min(Dgi(max))—the minimum density of the centroid of the square in the range of the highest building density;
Max(Dgi(max))—maximum value of the centroid density of the square in the range of the highest building density;
M(Dgi(max))—average density of centroid squares in the range of the highest building density;
σ(Dgi(max))—value of the standard deviation of the building density in the range of the highest building density;
Min(DgiC)—minimum value of the building density of centroid of the square of the core “c”;
σ(DgiC)—value of the standard deviation of the building density of centroid squares forming the core “c”;
Min(DgiC’)—minimum value of the centroid density of the square of the core “c’“;
Max(DgiC’)—maximum value of the centroid density of the core “c’“.
The Min(Dgi(max)) and Max(Dgi(max)) data determine the boundary values of the assumed range of the highest building density, with the number depending on the adopted percentile range. The Max(Dgi(max)) value identical to the Max(DgiC’) value is independent of the adopted range of the highest building density, but after calculating this component and obtaining clearly outlying values, it is important in its analysis to pay attention to the value of one of the density components—PDA, which should not take extremely small values, preventing the foundation of any building in practice. Expert assessment of not only the Min(Dgi(max)) value, but above all the Min(DgiC) and Min(DgiC’) values are also important; it can be assumed that each of them should be higher than the average density of centroids from the entire area, which seems justified due to the described features of the core. When analyzing the values of standard deviations, it can be assumed that they should not be a multiple of the average density of centroids from the entire area. This would indicate a significant dispersion of the density of centroids included in the range of the highest building density, as well as to the core and, indirectly, the heterogeneity of the building.
Nuclearity can be represented in three ways. The first consists of counting the separate cores, which is interpreted as a measure of the degree of polynuclearity. It is calculated according to the formula:
where:
n—is the number of 1 km
2 square grids within one density standard deviation;
c′—central core: it is the sum of 1 km
2 grid fields, whose squares meet two conditions: the first—belonging of the calculated building density for the square to the range of one standard deviation of the densest grid, and the second—direct neighboring squares;
N—is the sum of
n.
The second way is the ratio of buildings in the central core to the other cores and it can be represented as:
where:
Tic—total number of observations of the
ith land use in area c’;
Tin—total number of observations of the
i-th land use in area
n.
The third method presents a share of observations (e.g., buildings, apartments) of the central core in all cores. This method can be considered as a measure of the degree of mononuclearity, which is calculated on the basis of:
The use of different identification ranges of the central core “c’” may result in a different number of cores, and thus nuclearity values. The selection of the correct density range for accurate nuclear identification was made by the mentioned structural statistical analysis supported by the study of square grid maps. The combination of graphical and statistical evaluation is the implementation of the G4 research objective. In addition, verification of test results was supported by comparison with the actual state, i.e., orthophotomaps were used.
3. Results
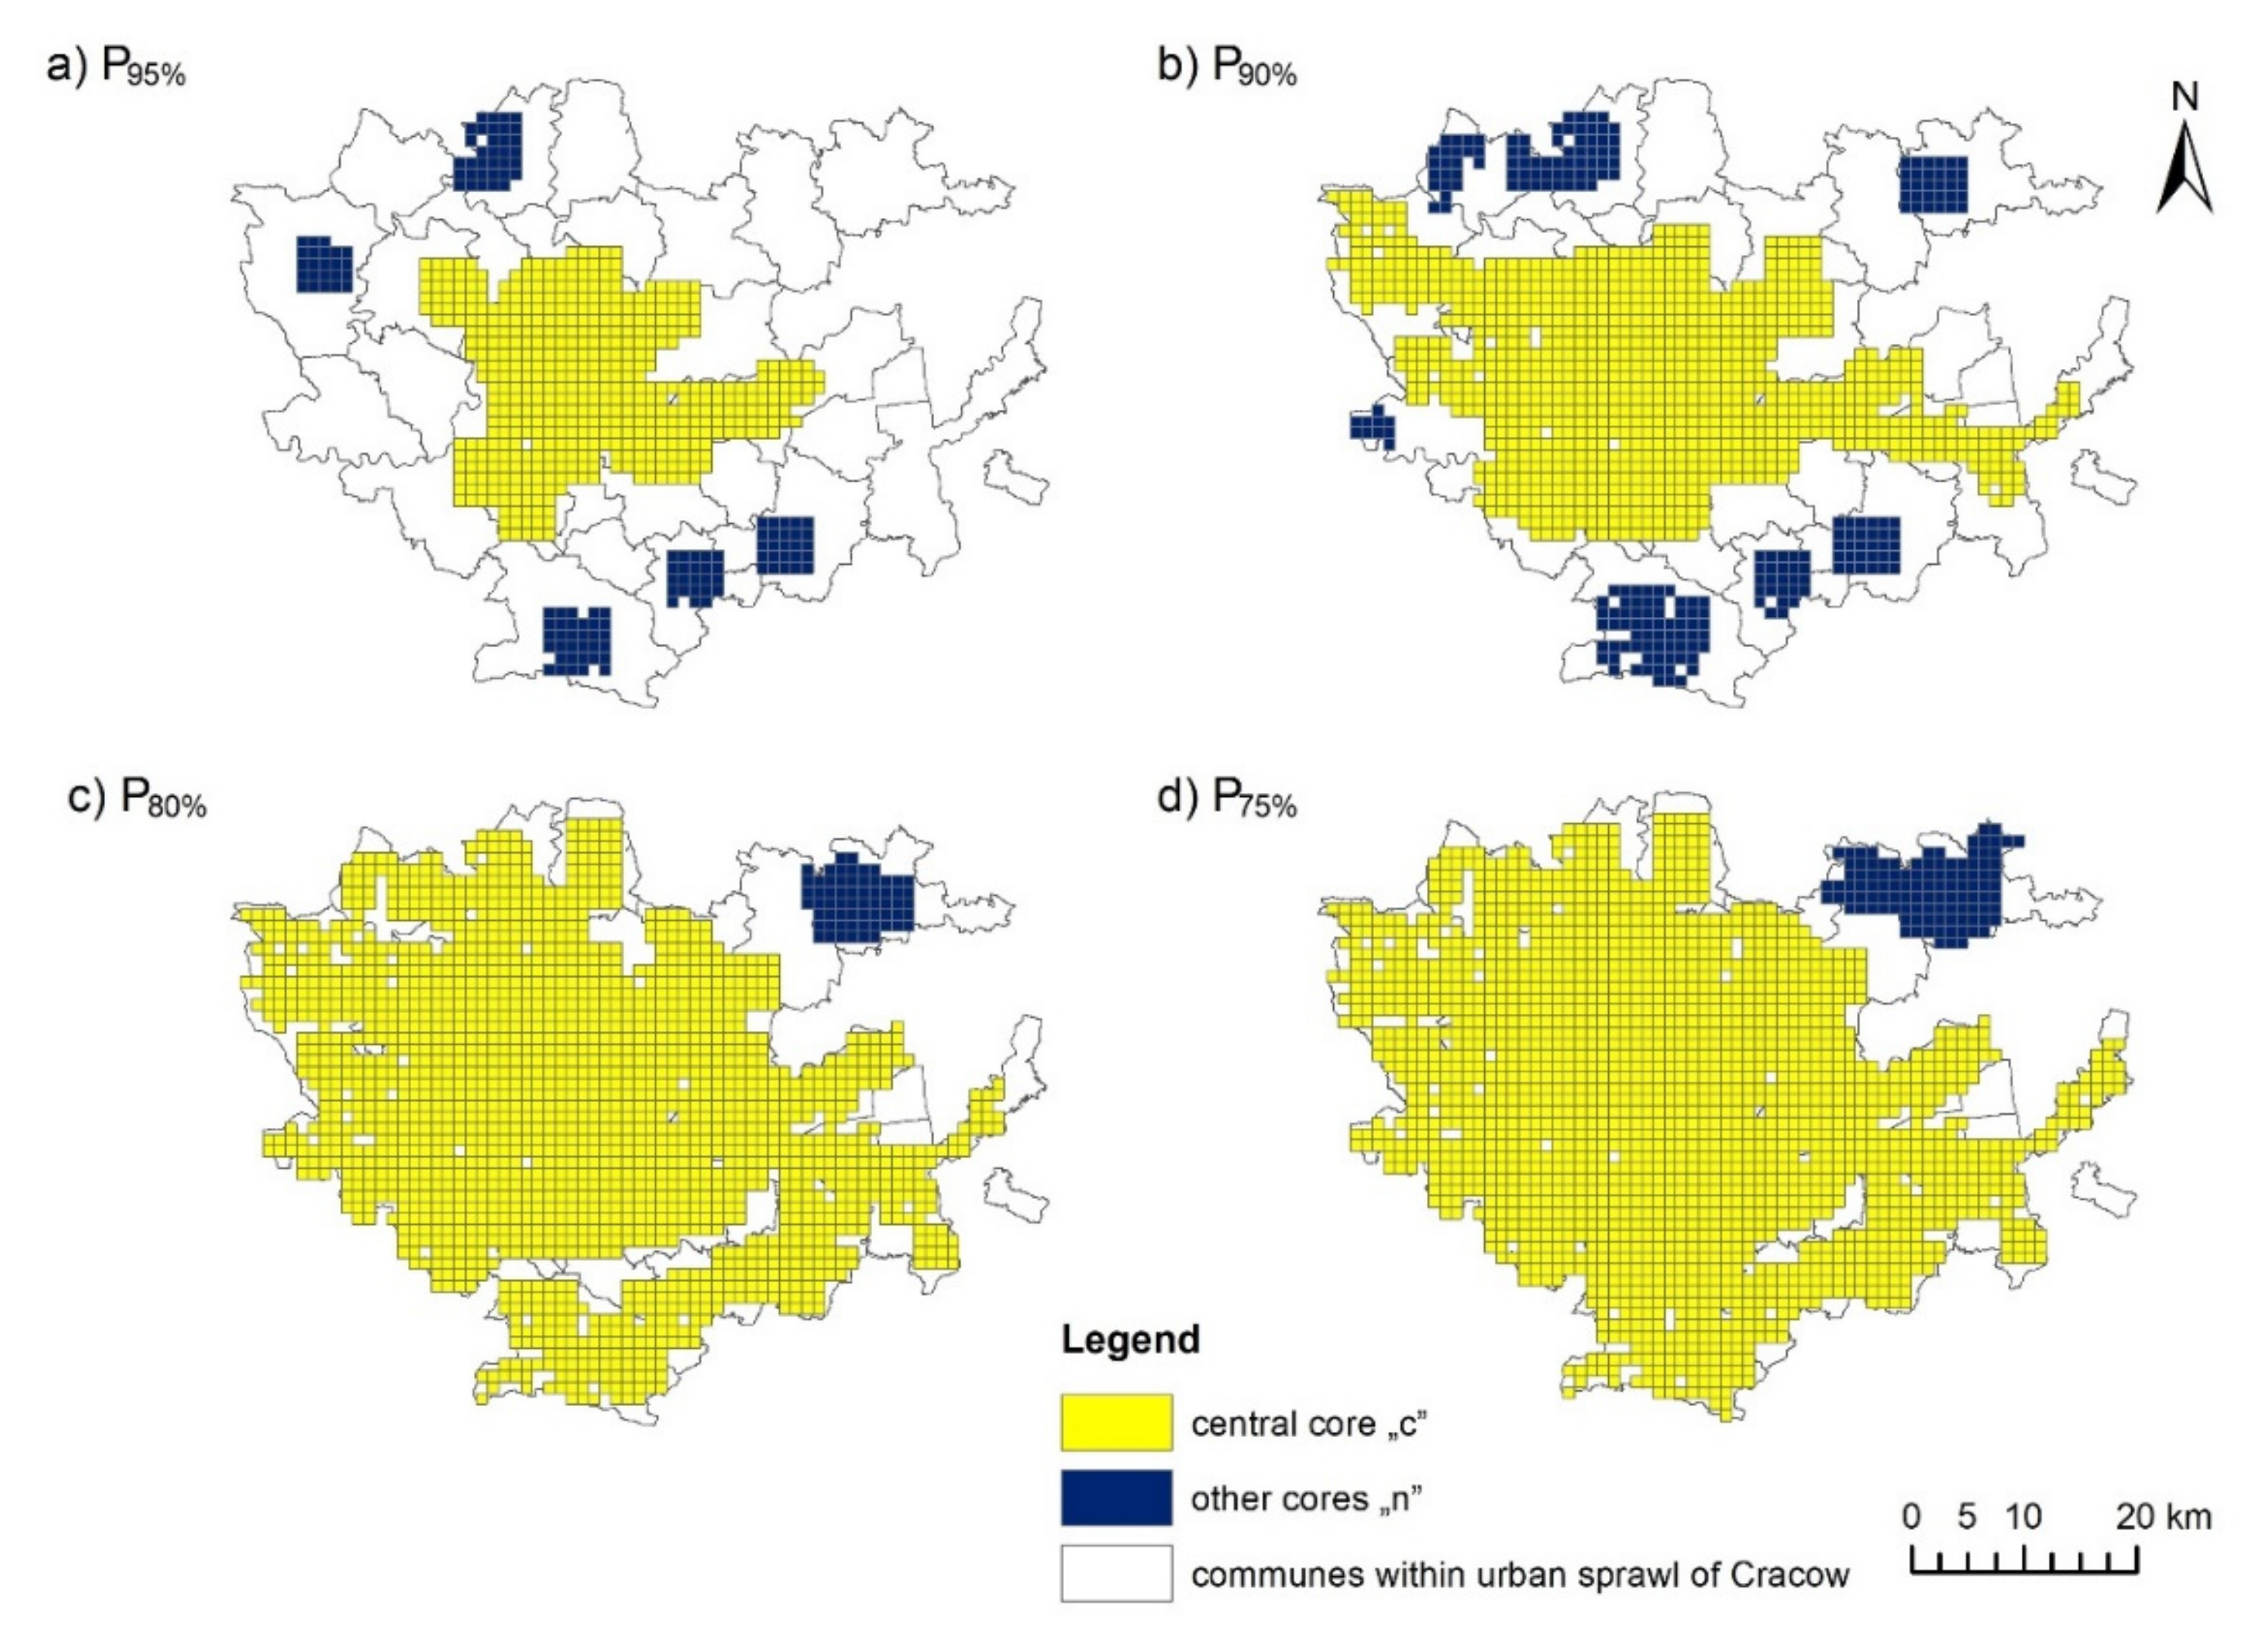
The presented results were included while taking into account the extreme density values test and using alternative highest density ranges. The following centroid abundance ranges of the highest square density were adopted: 75th, 80th, 90th, and 95th percentile, which were marked with the reference numbers: P
75%, P
80%, P
90%, P
95%.
Figure 3 presents nuclearity results of all squares, including squares with extremely high building densities.
Adoption of the solution (c) P80% or (d) P75% cannot be considered accurate, as almost the entire area studied would be eligible for inclusion in the central core. Regardless of whether it is a very densely built-up central city of Cracow, with medieval buildings, or rural communes very far from Cracow. Solution (b) P90% is also burdened with a similar error because the central core covers the central city of Cracow and the communes in the east–west corridor. Therefore, the (a) P95% solution requires reflection.
The assessment of the solution (a) P
95% requires, apart from graphical analysis of the map, also structural analysis, i.e., the assessment of statistics constituting the nuclear calculation.
Table 1 contains statistics on building density, including extreme values. Analyzing subsequent P
95% structural statistics, attention is drawn to zero building densities Min(Dg
iC) and Min(Dg
iC’). This means that in the test in the designated central core there are also squares with a density equal to 0. Therefore, the adoption in the extreme test density results in the appearance of very high σ(Dg
i(max)) and σ(Dg
iC) and the qualification of undeveloped squares to the central core. The inclusion of the zero density squares in the central core significantly distorts the nuclear measurement and cannot be considered for the right research approach.
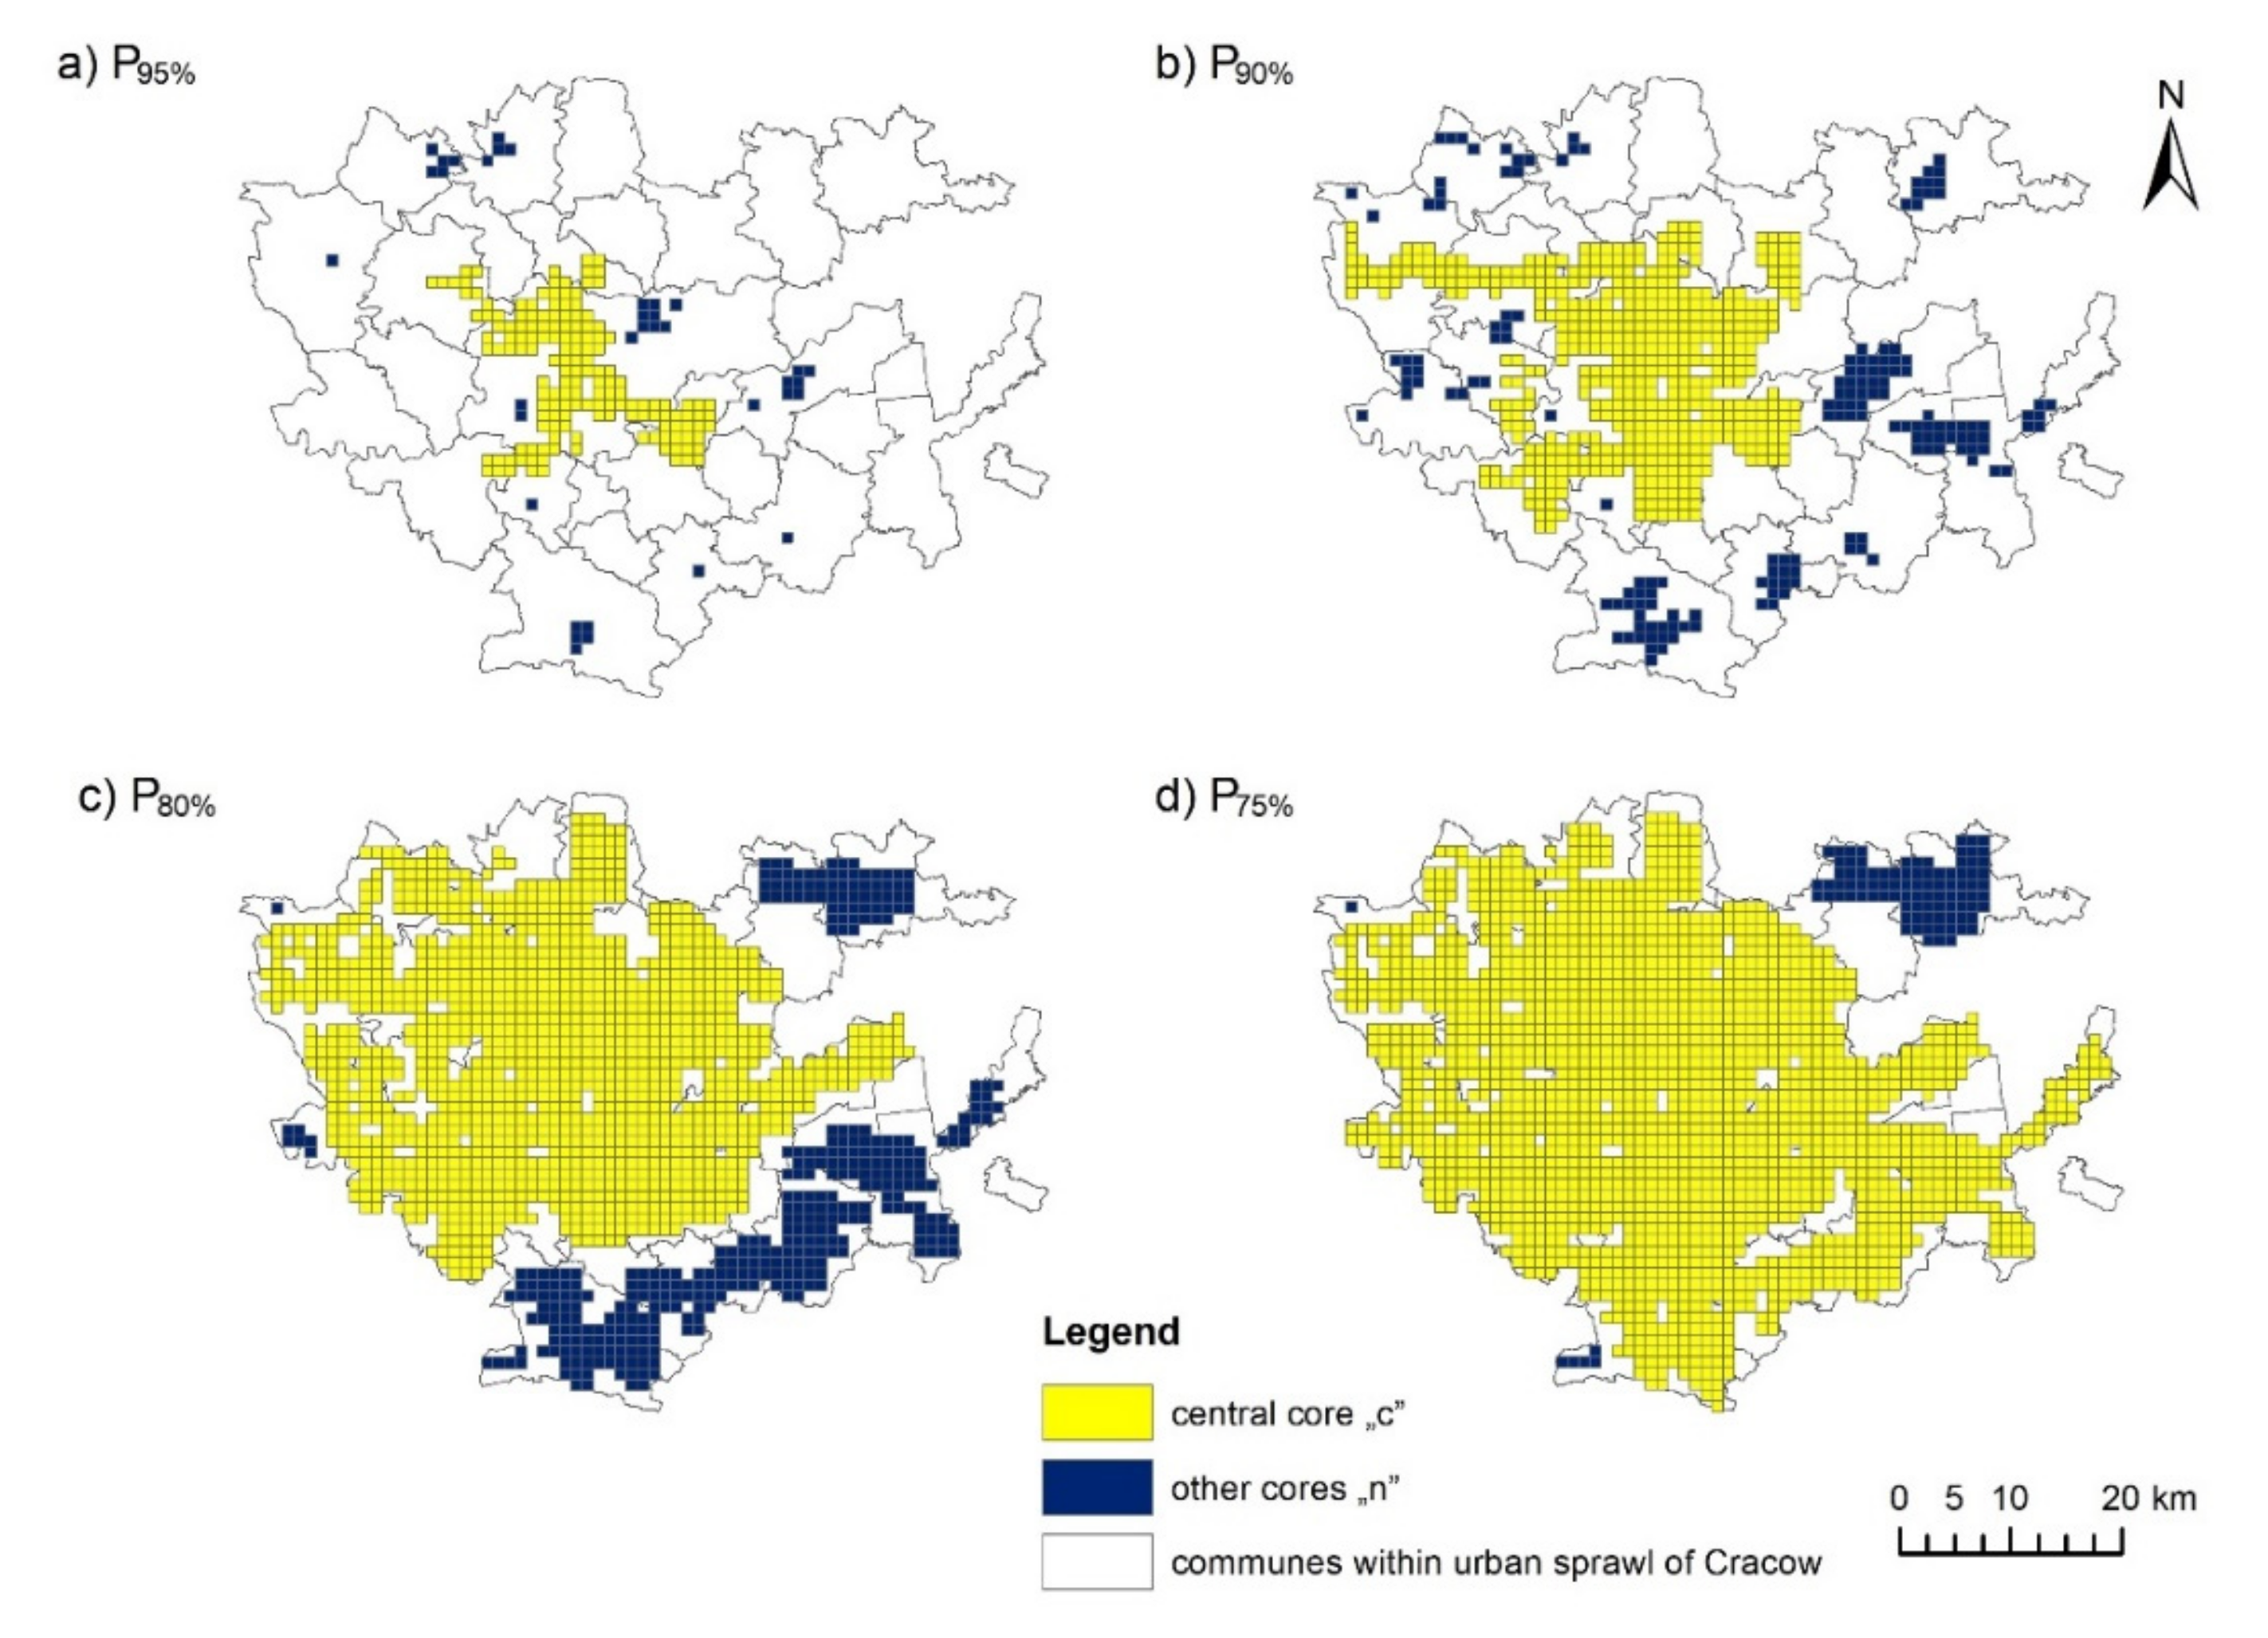
The extreme density test results in the removal of the square with the highest density. Such a square with a density of over 38,200 buildings is one of the centroids, located in the area of a national park, for which the calculated PDA was about 10 areas, with 39 buildings located in the square. These buildings are located in the area of an existing village or complement existing settlements and are located in an area excluded from PDA. The next density value in descending order is much smaller (approximately 1200 buildings) and is located in the city of Cracow.
After removing the square with the highest density, the measurement results are presented in
Figure 4.
The graphic illustration of the results forces the consideration of only two solutions: (a) P
95%, (b) P
90%. In addition, structural analysis based on statistics included in
Table 2 indicates solutions (c) P
80% and (d) P
75% are not accurate due to zero Min(Dg
iC’) values. It seems that the most accurate solution is (a) P
95%. The accuracy of the proposal (a) P
95% is demonstrated by the results of the minimum densities of the centroid building cores “c” (Min(Dg
iC)—329.9) and final extended cores (Min(Dg
iC’)—175.8), whose values are higher than the average for the whole area (162.9). This means that the designated central core and other cores are characterized by dense building coverage and do not contain grid squares in which there is a small number of buildings or none at all. This condition for extended cores was not met by any of the other tested variants.
Based on the above considerations, it is proposed in
Table 3 to identify nuclearity for the urban sprawl of the Cracow area. It is a solution that includes removing extreme values.
Interpretation of research results for the Cracow area indicates that urban sprawl is characterized by a mononuclear character. The share of central core buildings accounts for 81.9% of the buildings in the entire area—Nuclear (3). Although 13 cores have been identified in the entire area—Nuclear (1), the number of buildings in the central core is 4.5 times higher than the number of buildings in the 12 remaining cores—Nuclear (2). The results and the assessment made are consistent with the definition approach indicated in the cited literature [
43], where mononuclearity or monocentricity in a morphological approach is one dominant center and several peripheral centers. A polynuclear structure is one in which no dominant center has been identified and several equivalent centers are present. The presented results of the calculations of the Nuclear (2) and Nuclear (3) measures contradict the description of the polynuclearity of the Cracow area.
Summing up the results of nuclearity testing, it should be noted that in the procedure of core extraction, the lack of rejection of squares, for which the density values are extremely high, gives the effect of covering the test space with the surface of the cores incompatible with reality. Regardless of the adopted variant of percentiles, extreme values significantly distort the results. The calculated nuclearity measures confirmed the mononuclearity of the studied area and are consistent with the actual state of knowledge.
4. Discussion and Conclusions
The main difference between polycentricity and polynuclearity relates to the functional approach. Thus, polycentricity in terms of functionality is associated with the occurring functional relationships between local centers and their surroundings. Whereas polynuclearity is not associated with functional connections with the surroundings but emphasizes only the high building density of the urban core. Thus, polycentricity analysis based solely on the density index will be the same as polynuclearity. Hence, it seems that in the context of the phenomenon of urban sprawl one should consider polynuclearism rather than polycentricity. This is due to the fact that urban sprawl is a phenomenon with undesirable features of spatial structure. Polycentricity, in turn, can be assessed positively by its links with the surroundings, which are associated with social and economic benefits, e.g., shorter distances, lower land prices. On the other hand, polynuclearity does not include connections but only a grouping of buildings, e.g., “leapfrog” [
5,
10,
43], which is assessed negatively. Thus, polynuclearity can be the first step to identifying polycentricity. In other words, including in the polynuclear measurement the analysis of functional connections will determine the polycentricity of the analyzed area.
Polynuclearity measurement based on a square grid and building location has three measures [
9,
10]. The first measure is the number of cores, the second is the ratio of buildings in the central core to the remaining cores, and the third is the share of central core building in all cores. Galster et al. in [
9,
10] treat the three measures of nuclearity substitutionally. In our study, testing the three measures instead leads to the conclusion of complementary use of the three nuclearity measures requiring combined interpretation. Nuclearity measures complement each other and give a complete answer to whether the studied area is identified by polynuclear or mononuclear character. The complementary treatment of nuclearity measures is due to the hierarchical nature of the spatial structure, i.e., the morphology can be strongly or weakly hierarchical [
43]. Mononuclear structure is when one dominant center with several peripheral centers is observed. Polynuclear structure is when there is no dominant center but there are several equivalent centers.
In the test area, the nuclearity measured by the first measure was 13 cores, which may lead to the conclusion of polynuclearity. However, the second measure of nuclearity indicates that there is one central core that includes 4.5 times as many buildings as the other 12 cores. The third measure indicates that the central core aggregates 81.9% of all buildings in the Cracow area. The second and third measures therefore suggest that the dominance of the central core is so great that the Cracow area should be considered mononuclear. The presented test of using three measures of nuclearity to identify polynuclearity in Poland is a pioneering study. The adaptation of the method of Galster et al. [
9,
10] to Polish conditions necessitates caution in evaluating the results obtained. Therefore, the complementary use of the measures allowed for a triple verification of nuclearity and is consistent with the assumed validation approach to the performed studies [
60,
61,
62,
63].
However, an important stage of computational work in identifying the three nuclearity measures is the identification of the central core. If two or more equal cores appear then polynuclearity is identified. However, if one dominant appears, then we refer to mononuclearity. Identifying the central core, however, has many operational problems. These problems are associated with the mathematical formula for qualifying grids for the core and observing the values of extreme grids. Testing of four mathematical approaches to identifying the central core showed that the most accurate results are given by the 95th percentile, i.e., the grids within the 95th percentile of building density qualify for the central core. In this approach, the density of the central core is higher than the average for the entire area and there are no grids with zero density. In the remaining percentile tests unsatisfactory results were obtained. In addition, the need to remove from the analysis grids with extremely high building density should be emphasized. Taking into account such grids, which are mathematically correctly calculated, results in classification of undeveloped grids into core areas, which is not realistic. Thus, polynuclearity identification is not substantively verified and is not correct.
Nuclearity research, which serves to identify one of the features of the urban sprawl phenomenon, requires proper selection of the research area, presented on an appropriate spatial scale, and having updated building location data, coming from reliable sources. The method enforces identification and calculation of the area of possible development, which involves the need for a thorough assessment of the quality of data describing the counted types of land use, and to use the obtained density indicators it is necessary to verify them. The testing of the nuclear measure in the Cracow area was due to the presence of extreme values in this area, which made it possible to validate the method. Extreme values of density resulted in the inability to accurately identify nuclearity. In other words, leaving out the extreme values results in misinterpretation. For example, taking the extreme values into account, the city of Cracow would be a homogenously built-up area (
Figure 3a). In reality, this is not the case, as Cracow has a dense medieval built-up area in the center and some distant residential areas. Removing the outliers results in the identification of the densely built-up area (central core) and the residential areas as the remaining cores (
Figure 4a). Removing the extreme values more accurately assesses the spatial structure of the city and provides a recommendation for other comparative morphological studies. The values of the intervals of the highest density of squares marked with the signature: P
75%, P
80%, P
90%, P
95%, tested in the detailed studies for Cracow and its urban sprawl, allowed us to capture specific statistical features in the procedure used for the isolated centroids. The analysis of these features allows for the indication of the reference value of the P
95% range; the number of the highest density centroids for research conducted in Polish conditions. As has been emphasized, this value is of fundamental importance in distinguishing the extent of urban cores. An additional justification is the morphologically similar structure of most delimited urban sprawl areas in Poland, which was confirmed by the results of the conducted but unpublished pilot research on them.
Despite the fact that the method of measuring nuclearness is time-consuming, it has an important advantage—it is useful for conducting spatial policy aimed at reducing the effects of urban sprawl. Identifying emerging cores in an urban area may encourage public authorities to direct investment in these areas; investments activating functional connections with the areas surrounding the cores and connections with other cores. The structure of the urban area thus shapes and strengthens economic opportunities by reducing the high operating costs of entities (real estate and transport costs, costs of congestion, etc.). In addition, such a structure is a spatially coherent urban area, leveling the development opportunities of the society of the area regardless of location. This may contribute to raising the significance of the urban area in the national and international dimension.
Like all innovative concepts, the presented method also has some limitations. At the same time, these restrictions set the direction for future research. There are two directions of method development. The first concerns the dynamic approach, i.e., it is valuable to carry out a nuclearity measurement for two-time sections in several-year intervals. This will allow us to identify new cores, their growth and geographical direction, as well as monitor the rate of building growth. The second direction of research is to conduct simulations for other urban areas and compare the conclusions regarding consideration of extreme values and selection of percentiles for identifying the central core.


