
Does the Construction and Operation of High-Speed Rail Improve Urban Land Use Efficiency? Evidence from China


Abstract
1. Introduction
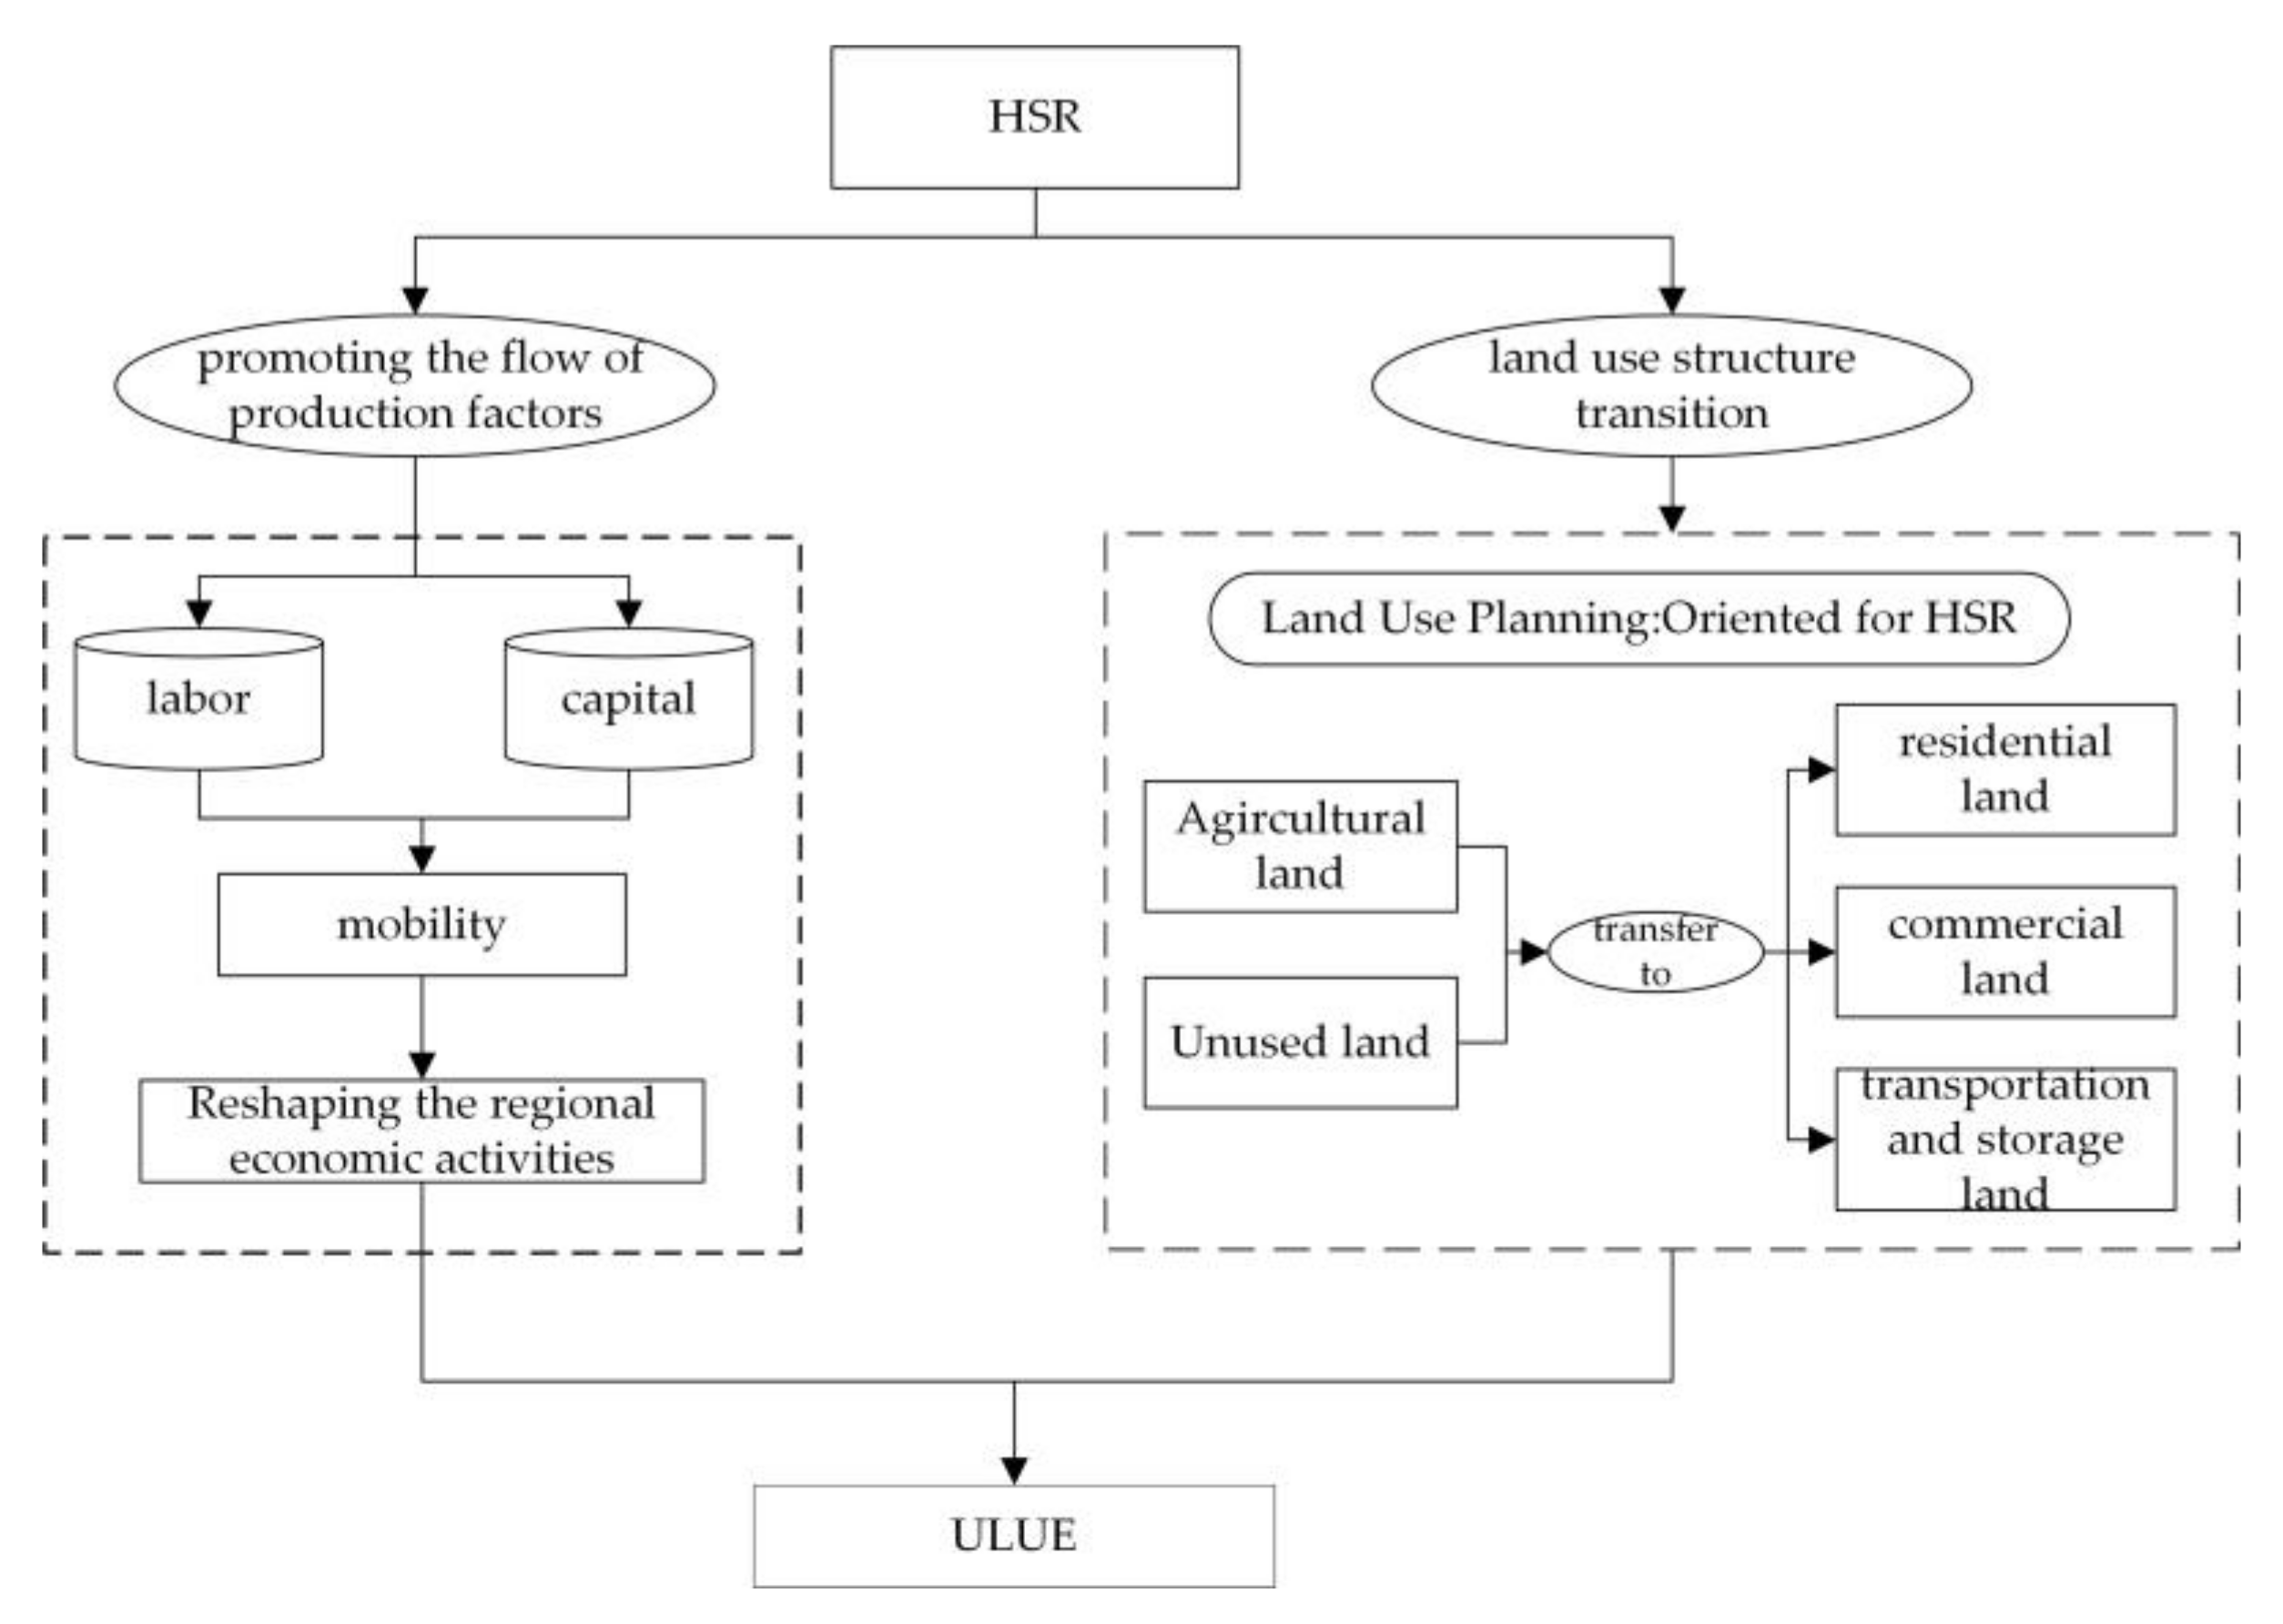
2. Mechanism
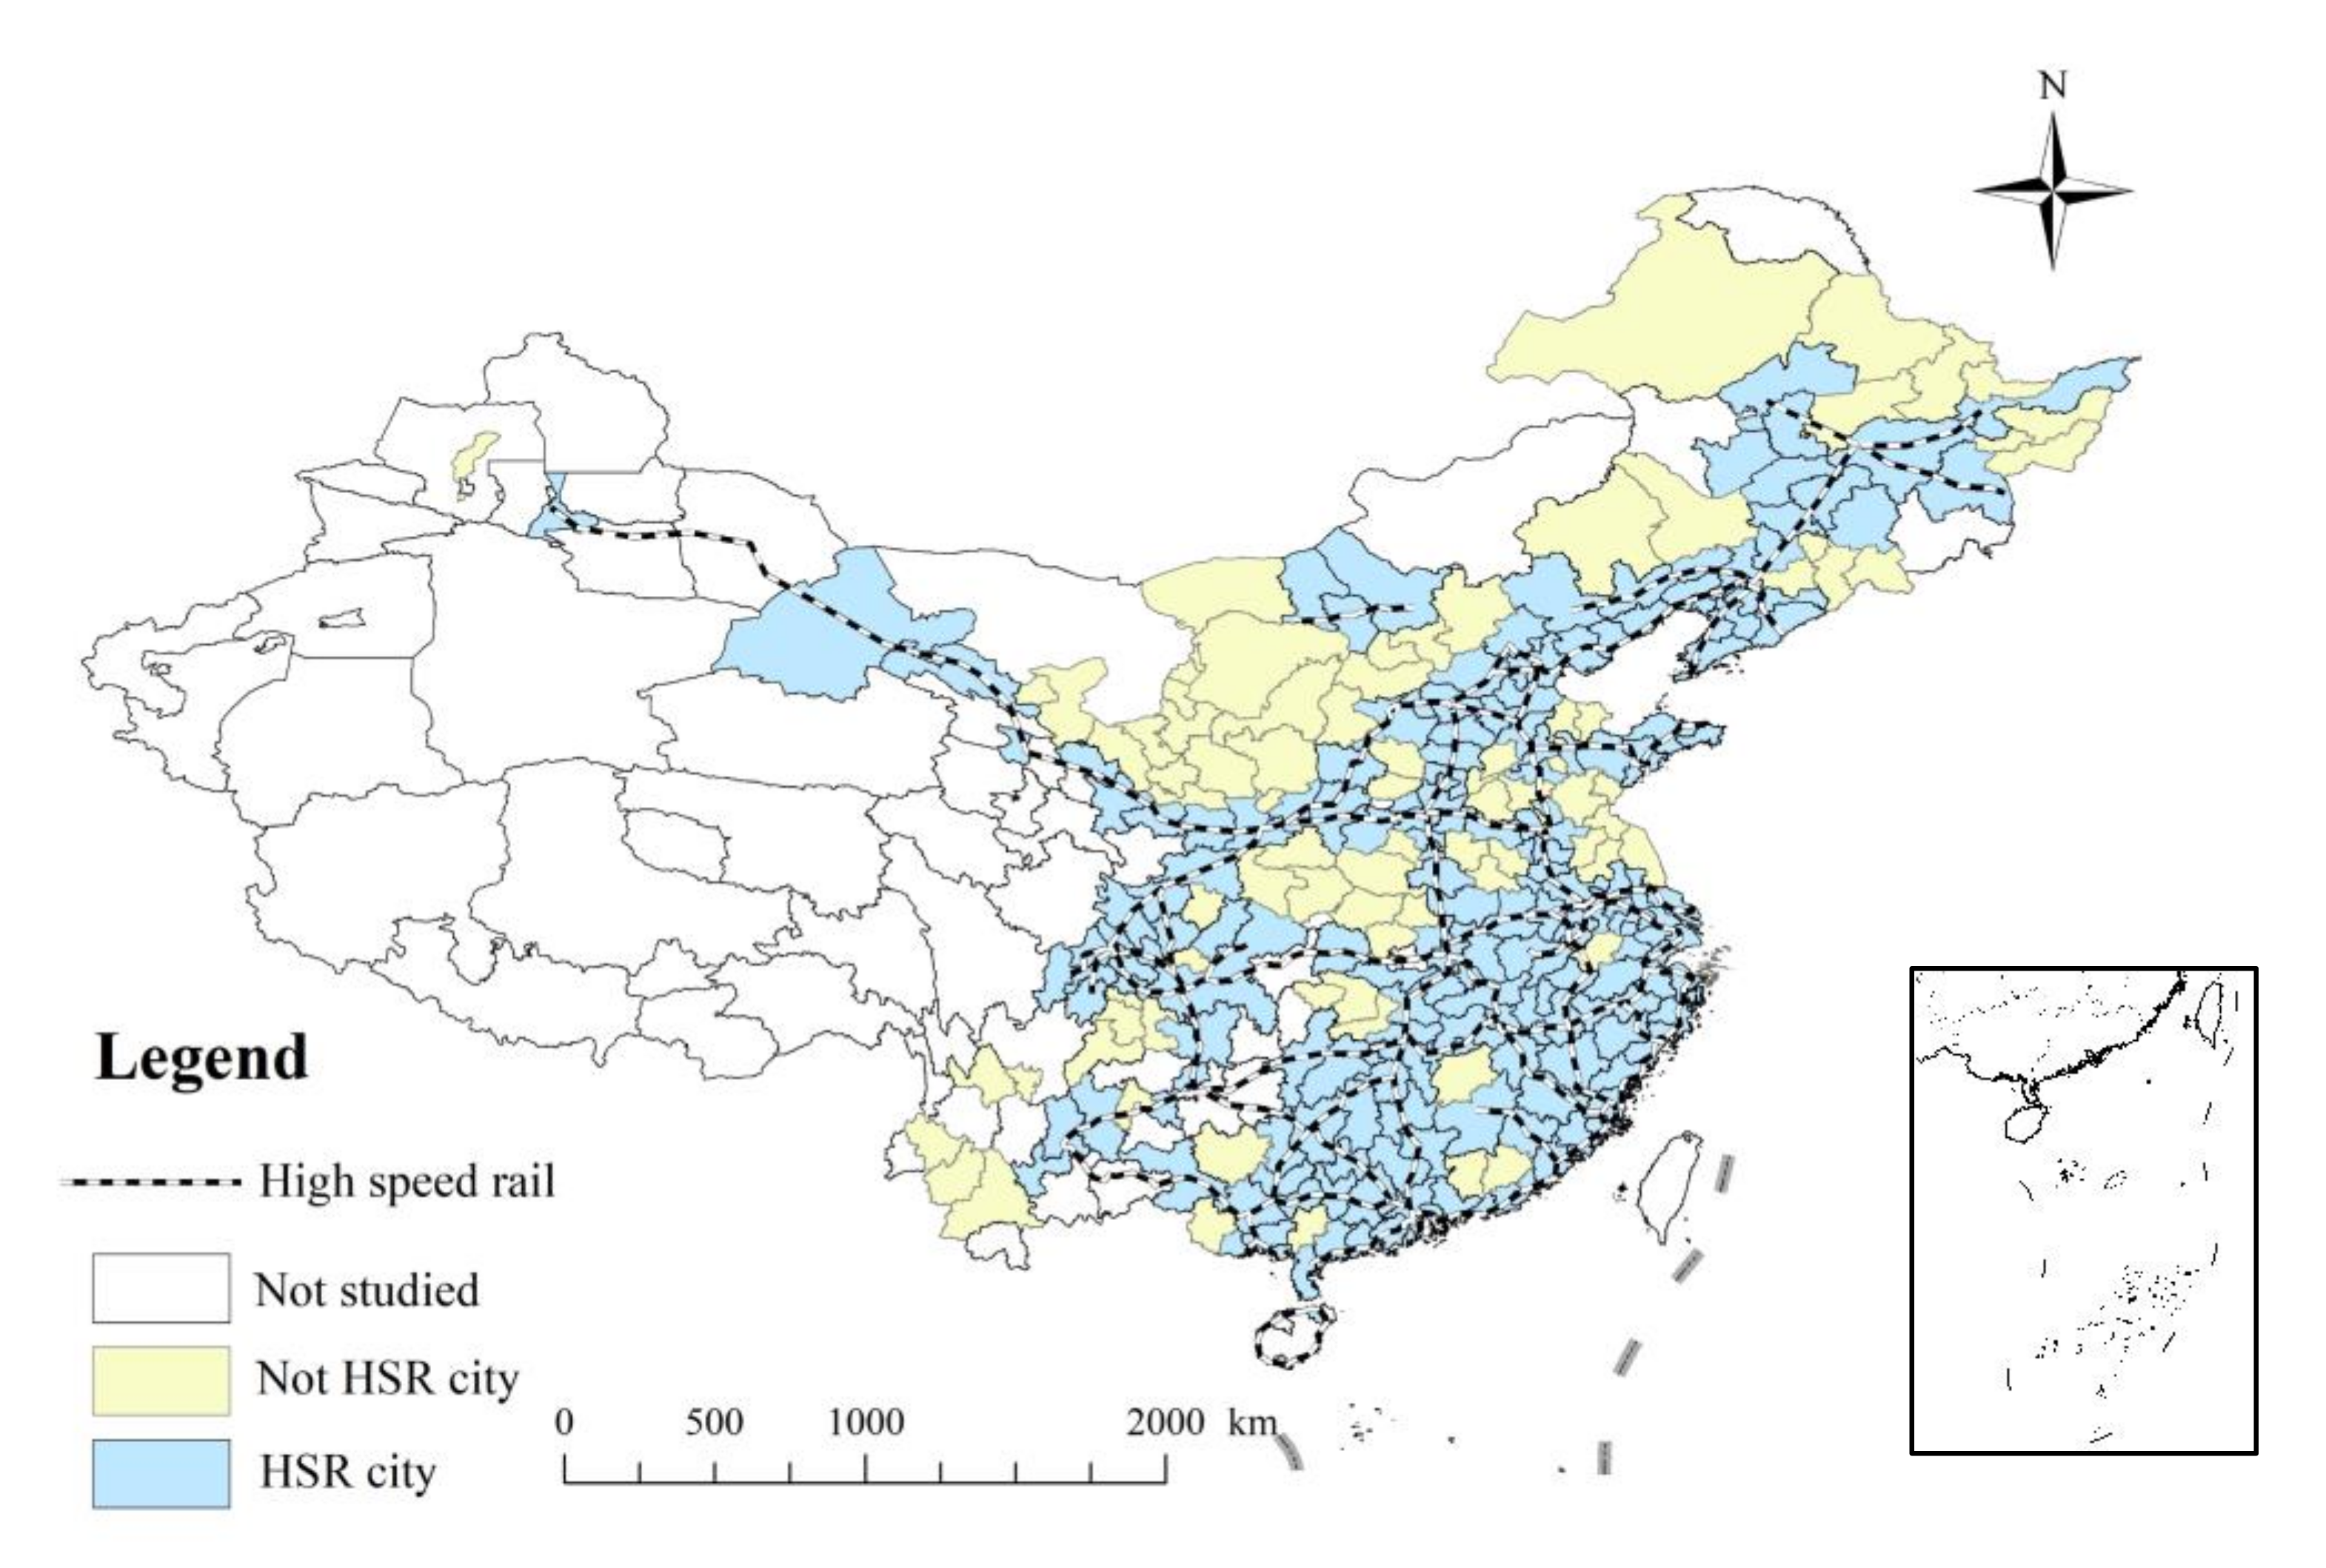
3. The Construction and Operation Condition of HSR in China
4. Methodology and Data Sources
4.1. Differences in Differences (DID)
4.2. Propensity Score Matching (PSM)
4.3. PSM-DID
4.4. Variables and Data Source
5. Results
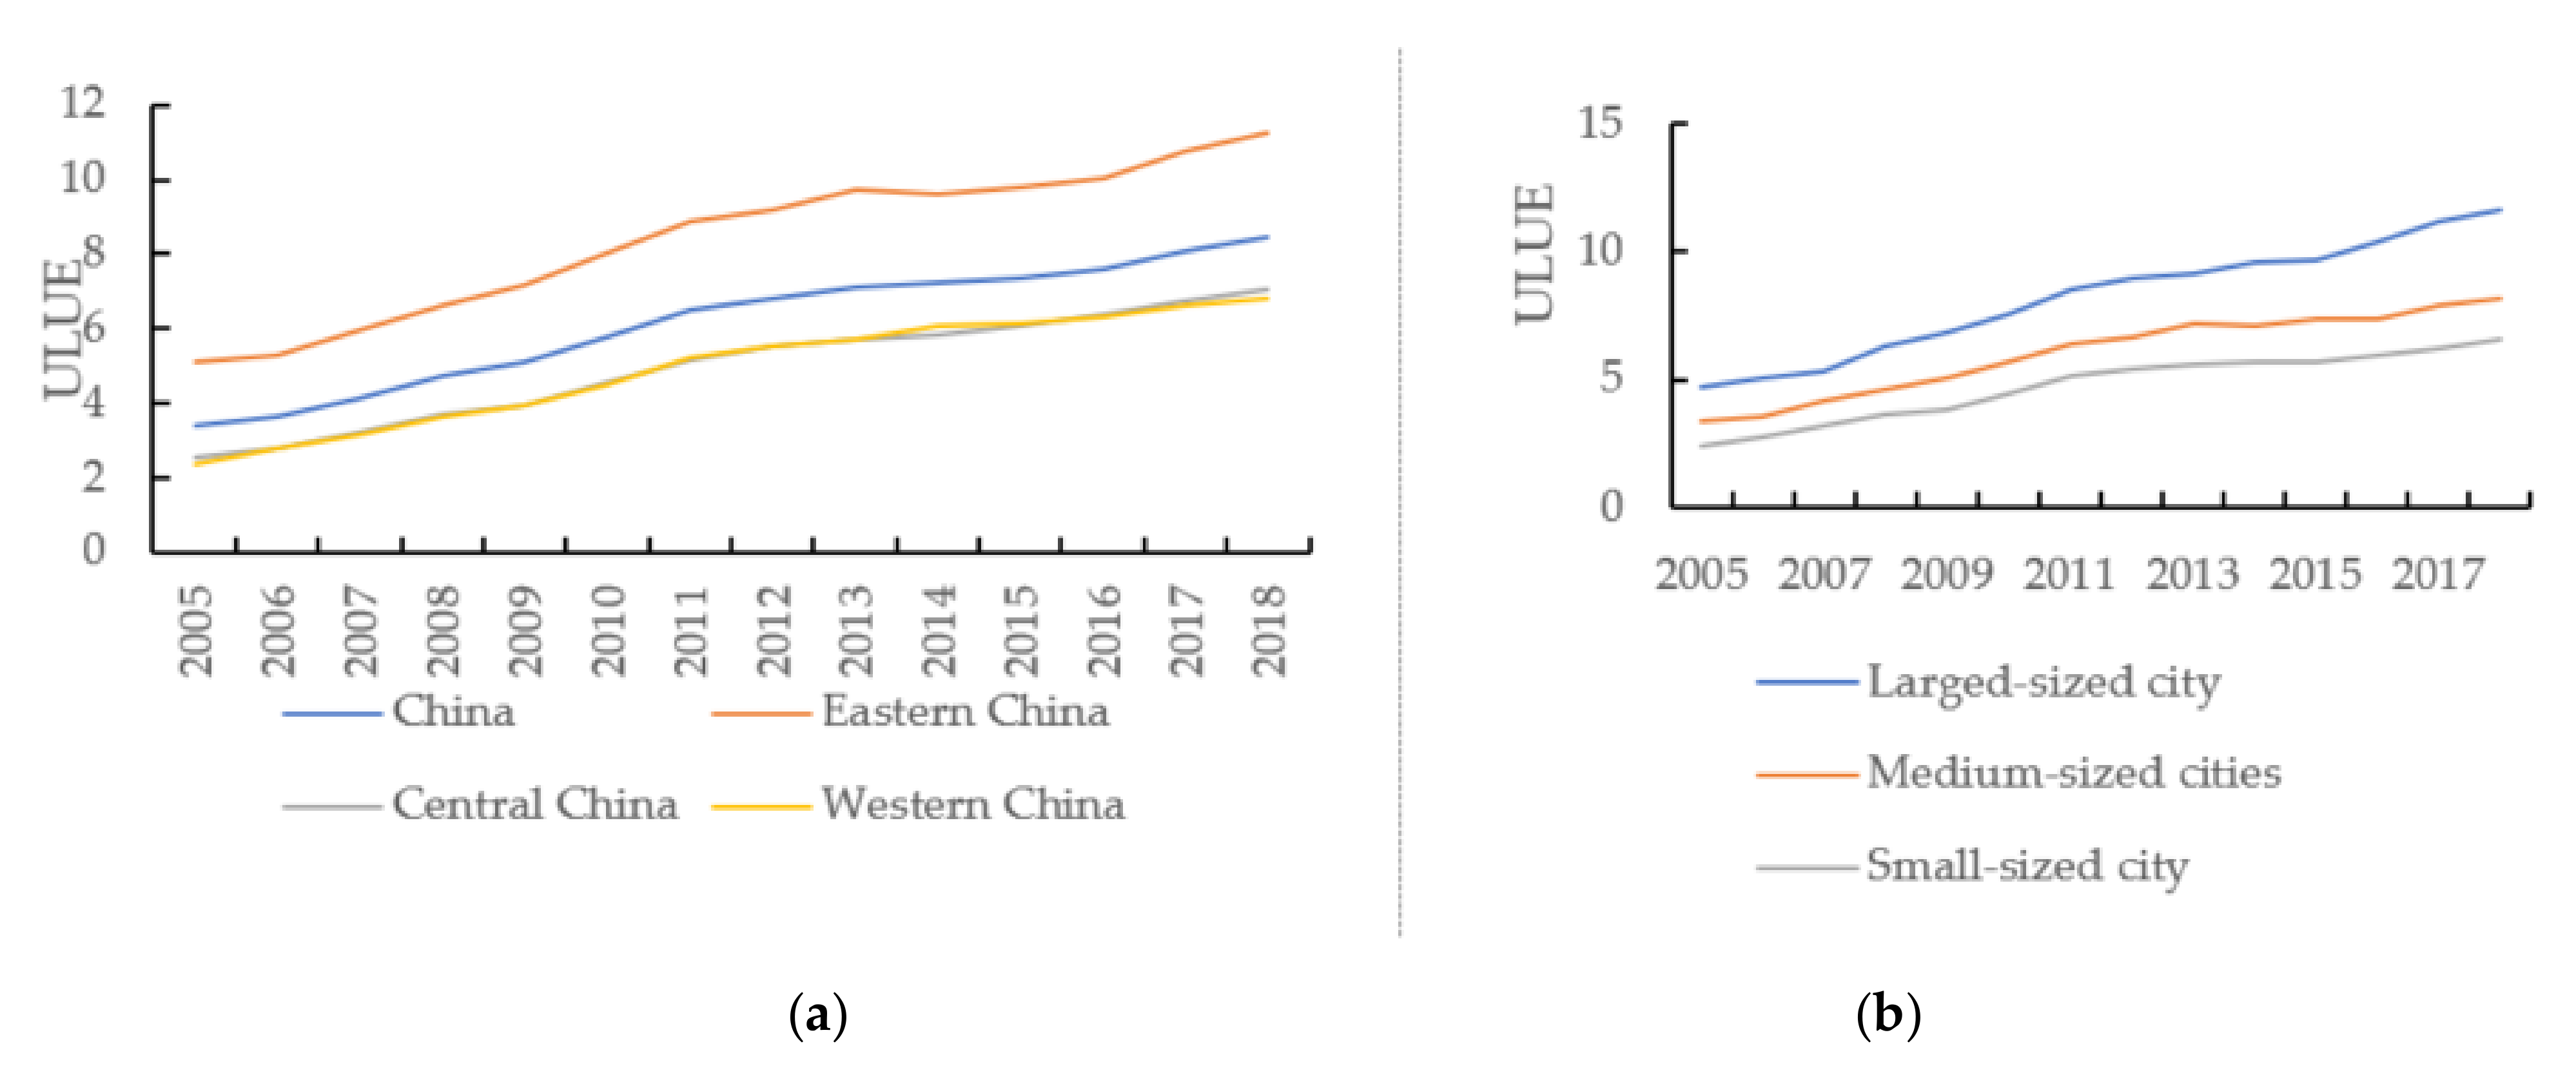
5.1. Change Trends of ULUE
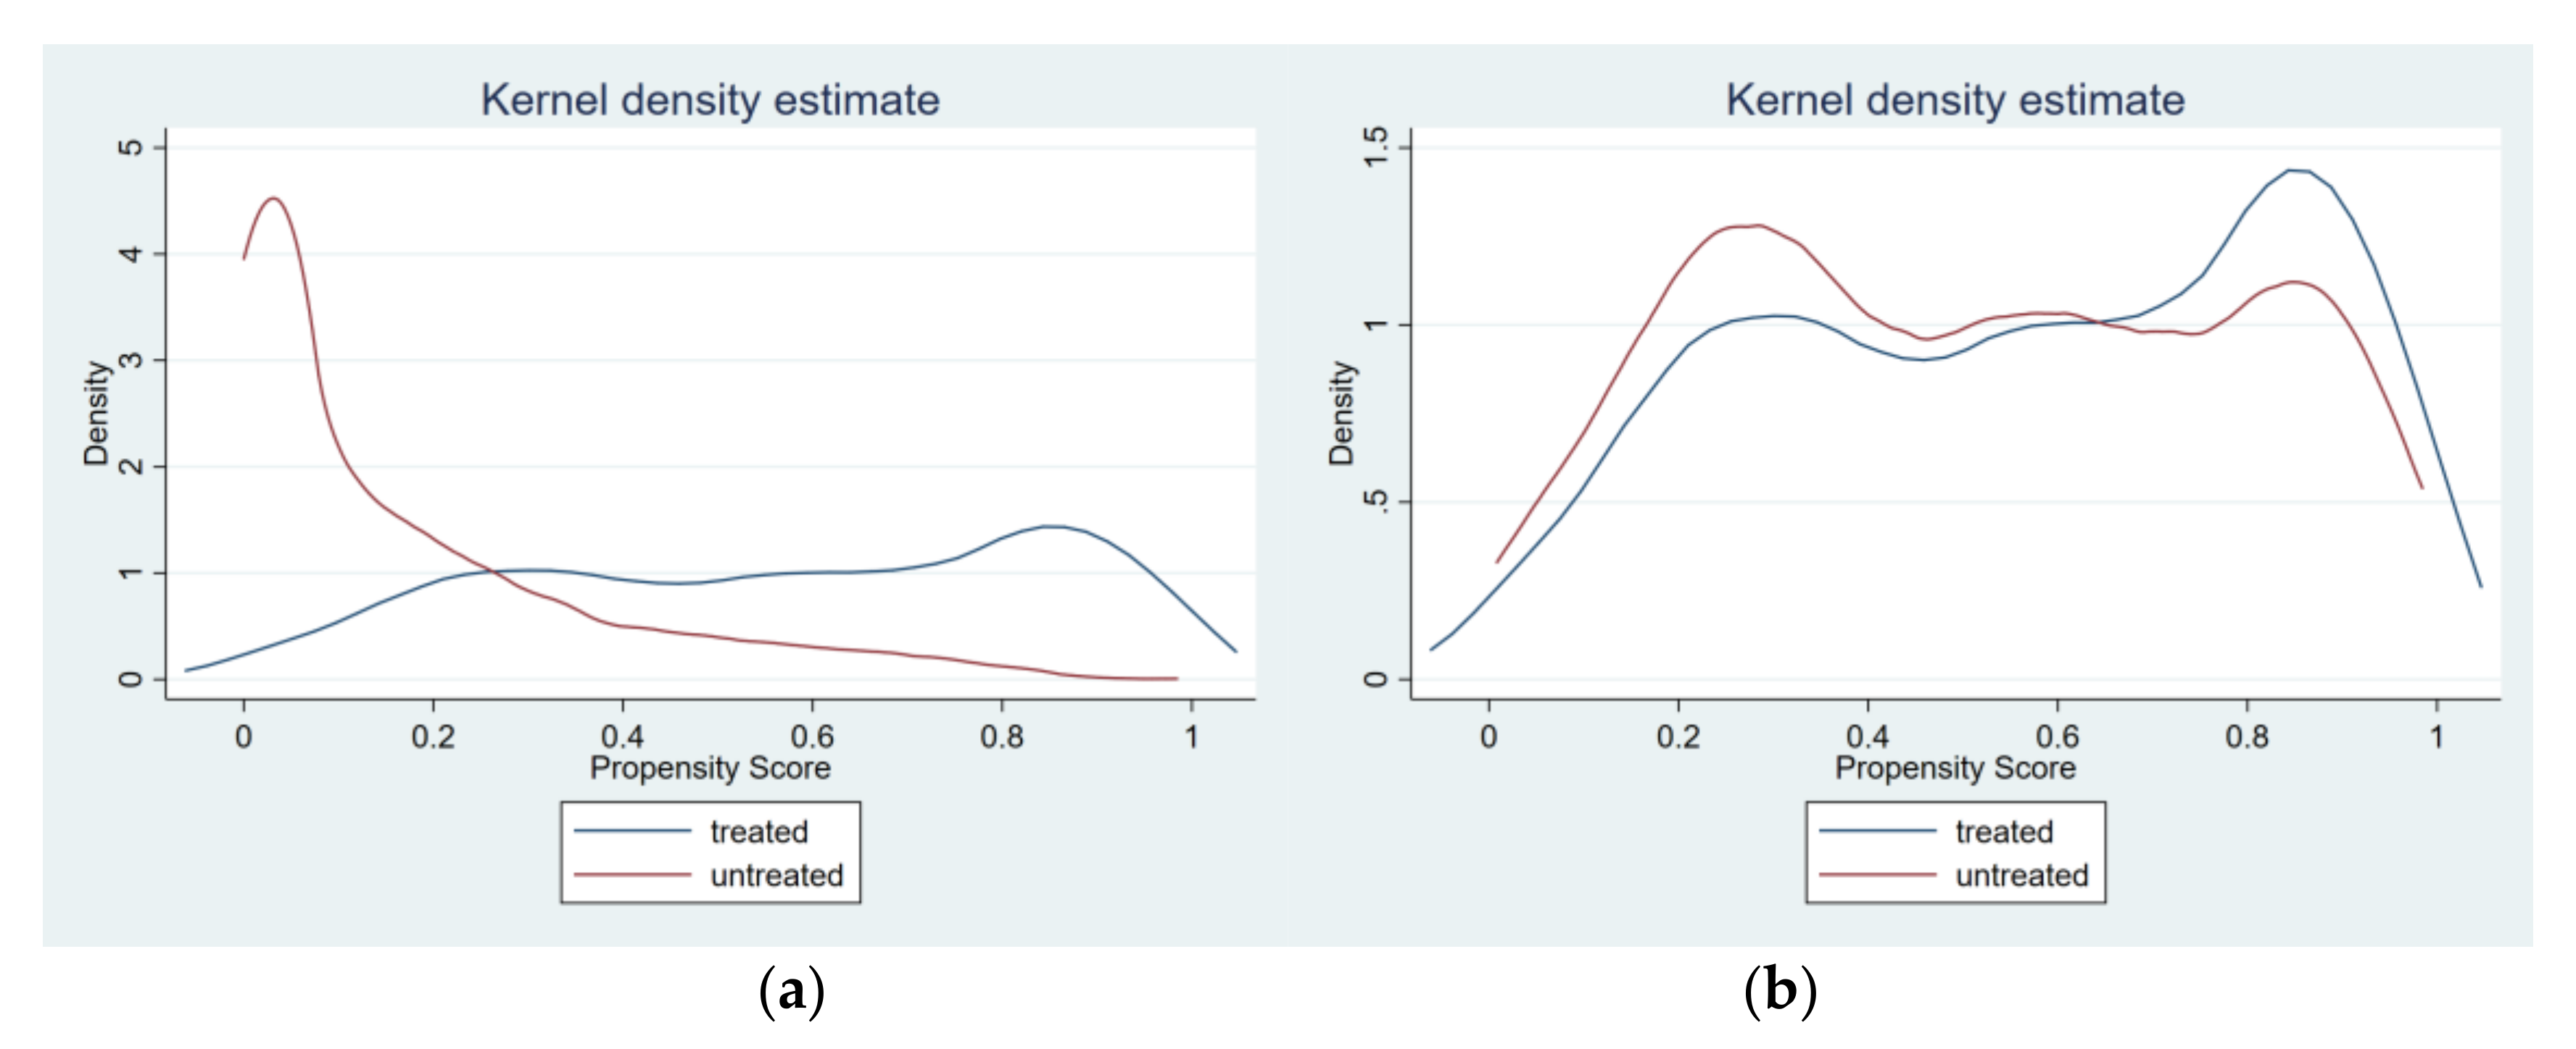
5.2. Sample Matching Results
5.3. Regression Results of Entire China
5.4. Regression Results of Regional Heterogeneity
5.5. Robustness Test
6. Discussion
7. Conclusions
Author Contributions
Funding
Conflicts of Interest
References
- Zitti, M.; Ferrara, C.; Perini, L.; Carlucci, M.; Salvati, L. Long-Term Urban Growth and Land Use Efficiency in Southern Europe: Implications for Sustainable Land Management. Sustainability 2015, 7, 3359. [Google Scholar] [CrossRef]
- Zhang, W.; Zou, J.; Wu, Q. Effect of production factors on urban land use efficiency: Based on the provincial data of different development stages. Resour. Sci. 2020, 42, 1416–1427. [Google Scholar] [CrossRef]
- Li, Y.; Shu, B.; Wu, Q. Urban Land Use Efficency in China: Spatial and Temporal Characteristics, Regional Difference and Influence Factors. Econ. Geogr. 2014, 34, 133–139. [Google Scholar]
- Du, J.; Thill, J.; Peiser, R.B. Land pricing and its impact on land use efficiency in post-land-reform China: A case study of Beijing. Cities 2016, 50, 68–74. [Google Scholar] [CrossRef]
- Wang, L.; Li, H.; Shi, C. Urban land-use efficiency, spatial spillover, and determinants in China. Acta Geogr. Sin. 2015, 70, 1788–1799. [Google Scholar]
- Dong, Y.; Zhu, Y. Can High-Speed Rail Construction Reshape the Layout of China’s Economic Space—Based on the Perspective of Regional Heterogeneity of Employment, Wage and Economic Growth. China Ind. Econ. 2016, 10, 92–108. [Google Scholar]
- Liu, S.; Xiao, W.; Li, L.; Ye, Y.; Song, X. Urban land use efficiency and improvement potential in China: A stochastic frontier analysis. Land Use Policy 2020, 99, 105046. [Google Scholar] [CrossRef]
- Dong, Y.; Jin, G.; Deng, X. Dynamic interactive effects of urban land-use efficiency, industrial transformation, and carbon emissions. J. Clean. Prod. 2020, 270, 122547. [Google Scholar] [CrossRef]
- Zhu, X.; Li, Y.; Zhang, P.; Wei, Y.; Zheng, X.; Xie, L. Temporal-spatial characteristics of urban land use efficiency of China’s 35mega cities based on DEA: Decomposing technology and scale efficiency. Land Use Policy 2019, 88, 104083. [Google Scholar] [CrossRef]
- Gao, X.; Zhang, A.; Sun, Z. How regional economic integration influence on urban land use efficiency? A case study of Wuhan metropolitan area, China. Land Use Policy 2020, 90, 104329. [Google Scholar] [CrossRef]
- Lu, X.; Kuang, B.; Li, J. Regional difference decomposition and policy implications of China’s urban land use efficiency under the environmental restriction. Habitat Int. 2018, 77, 32–39. [Google Scholar] [CrossRef]
- Tone, K. A slacks-based measure of efficiency in data envelopment analysis. Eur. J. Oper. Res. 2001, 130, 498–509. [Google Scholar] [CrossRef]
- Kuang, B.; Lu, X.; Zhou, M.; Chen, D. Provincial cultivated land use efficiency in China: Empirical analysis based on the SBM-DEA model with carbon emissions considered. Technol. Forecast. Soc. Chang. 2020, 151, 119874. [Google Scholar] [CrossRef]
- Yang, B.; Chen, X.; Wang, Z.; Li, W.; Zhang, C.; Yao, X. Analyzing land use structure efficiency with carbon emissions: A case study in the Middle Reaches of the Yangtze River, China. J. Clean. Prod. 2020, 274, 123076. [Google Scholar] [CrossRef]
- Chen, W.; Ning, S.; Chen, W.; Liu, E.; Wang, Y.; Zhao, M. Spatial-temporal characteristics of industrial land green efficiency in China: Evidence from prefecture-level cities. Ecol. Indic. 2020, 113, 106256. [Google Scholar] [CrossRef]
- Wu, C.; Wei, Y.D.; Huang, X.; Chen, B. Economic transition, spatial development and urban land use efficiency in the Yangtze River Delta, China. Habitat Int. 2017, 63, 67–78. [Google Scholar] [CrossRef]
- Tu, F.; Yu, X.; Ruan, J. Industrial land use efficiency under government intervention: Evidence from Hangzhou, China. Habitat Int. 2014, 43, 1–10. [Google Scholar] [CrossRef]
- Sun, Y.; Ma, A.; Su, H.; Su, S.; Chen, F.; Wang, W.; Weng, M. Does the establishment of development zones really improve industrial land use efficiency? Implications for China’s high-quality development policy. Land Use Policy 2020, 90, 104265. [Google Scholar] [CrossRef]
- Chen, W.; Shen, Y.; Wang, Y.; Wu, Q. The effect of industrial relocation on industrial land use efficiency in China: A spatial econometrics approach. J. Clean. Prod. 2018, 205, 525–535. [Google Scholar] [CrossRef]
- Han, W.; Zhang, Y.; Cai, J.; Ma, E. Does Urban Industrial Agglomeration Lead to the Improvement of Land Use Efficiency in China? An Empirical Study from a Spatial Perspective. Sustainability 2019, 11, 986. [Google Scholar] [CrossRef]
- Cui, X.; Fang, C.; Wang, Z.; Bao, C. Spatial relationship of high-speed transportation construction and land-use efficiency and its mechanism: Case study of Shandong Peninsula urban agglomeration. J. Geogr. Sci. 2019, 29, 549–562. [Google Scholar] [CrossRef]
- Yang, T.; Guan, X.; Qian, Y.; Xing, W.; Wu, H. Efficiency Evaluation of Urban Road Transport and Land Use in Hunan Province of China Based on Hybrid Data Envelopment Analysis (DEA) Models. Sustainability 2019, 11, 3826. [Google Scholar] [CrossRef]
- Givoni, M. Development and Impact of the Modern High-speed Train: A Review. Transp. Rev. 2007, 26, 593–611. [Google Scholar] [CrossRef]
- Blum, U.; Haynes, K.E.; Karlsson, C. Introduction to the special issue the regional and urban effects of high-speed trains. Ann. Reg. Sci. 1997, 31, 1–20. [Google Scholar] [CrossRef]
- Wetwitoo, J.; Kato, H. High-speed rail and regional economic productivity through agglomeration and network externality: A case study of inter-regional transportation in Japan. Case Stud. Transp. Policy 2017, 5, 549–559. [Google Scholar] [CrossRef]
- Chen, Z.; Haynes, K.E. Impact of high-speed rail on regional economic disparity in China. J. Transp. Geogr. 2017, 65, 80–91. [Google Scholar] [CrossRef]
- Jia, S.; Zhou, C.; Qin, C. No difference in effect of high-speed rail on regional economic growth based on match effect perspective? Transp. Res. Part A Policy Pract. 2017, 106, 144–157. [Google Scholar] [CrossRef]
- Diao, M. Does growth follow the rail? The potential impact of high-speed rail on the economic geography of China. Transp. Res. Part A Policy Pract. 2018, 113, 279–290. [Google Scholar] [CrossRef]
- Hiramatsu, T. Job and population location choices and economic scale as effects of high speed rail: Simulation analysis of Shinkansen in Kyushu, Japan. Res. Transp. Econ. 2018, 72, 15–26. [Google Scholar] [CrossRef]
- Wang, C.; Chen, N.; Chan, S. A gravity model integrating high-speed rail and seismic-hazard mitigation through land-use planning: Application to California development. Habitat Int. 2017, 62, 51–61. [Google Scholar] [CrossRef]
- Chen, Z.; Zhou, Y.; Haynes, K.E. Change in land use structure in urban China: Does the development of high-speed rail make a difference. Land Use Policy 2020, 104962. [Google Scholar] [CrossRef]
- Zhang, G.; Zheng, D.; Wu, H.; Wang, J.; Li, S. Assessing the role of high-speed rail in shaping the spatial patterns of urban and rural development: A case of the Middle Reaches of the Yangtze River, China. Sci. Total Environ. 2020, 704, 135399. [Google Scholar] [CrossRef]
- Huang, Z.; Du, X. How does high-speed rail affect land value? Evidence from China. Land Use Policy 2020, 101, 105068. [Google Scholar] [CrossRef]
- Lu, D. Bravely take on the historical mission of strengthening the railway with strong transportation and strive to open up a new era for China’s railway reform and development. China Railw. 2019, 1, 1–8. [Google Scholar]
- Cui, X.; Wang, X. Urban land use change and its effect on social metabolism: An empirical study in Shanghai. Habitat Int. 2015, 49, 251–259. [Google Scholar] [CrossRef]
- Guirao, B.; Campa, J.L.; Casado-Sanz, N. Labour mobility between cities and metropolitan integration: The role of high speed rail commuting in Spain. Cities 2018, 78, 140–154. [Google Scholar] [CrossRef]
- Garmendia, M.; de Ureña, J.M.; Ribalaygua, C.; Leal, J.; Coronado, J.M. Urban Residential Development in Isolated Small Cities That Are Partially Integrated in Metropolitan Areas by High Speed Train. Eur. Urban Reg. Stud. 2008, 15, 249–264. [Google Scholar] [CrossRef]
- Yu, Y.; Pan, Y. Does High-speed Rail Reduce the Rural-urban Income Disparity? An Interpretation Based on the Perspective of Heterogeneous Labor Mobility. China Rural Econ. 2019, 37, 79–95. [Google Scholar]
- Wang, F.; Wei, X.; Liu, J.; He, L.; Gao, M. Impact of high-speed rail on population mobility and urbanisation: A case study on Yangtze River Delta urban agglomeration, China. Transp. Res. Part A Policy Pract. 2019, 127, 99–114. [Google Scholar] [CrossRef]
- Duan, L.; Sun, W.; Zheng, S. Transportation network and venture capital mobility: An analysis of air travel and high-speed rail in China. J. Transp. Geogr. 2020, 88, 102852. [Google Scholar] [CrossRef]
- Lu, X.; Ke, S. Evaluating the effectiveness of sustainable urban land use in China from the perspective of sustainable urbanization. Habitat Int. 2018, 77, 90–98. [Google Scholar] [CrossRef]
- Nuworsoo, C.; Deakin, E. Transforming High-speed Rail Stations to Major Activity Hubs: Lessons for California. In Proceedings of the 88th Annual Meeting of the Transportation Research Board, Washington, DC, USA, 11–15 January 2009. [Google Scholar]
- Shaw, S.; Fang, Z.; Lu, S.; Tao, R. Impacts of high speed rail on railroad network accessibility in China. J. Transp. Geogr. 2014, 40, 112–122. [Google Scholar] [CrossRef]
- Deng, T.; Wang, D.; Yang, Y.; Yang, H. Shrinking cities in growing China: Did high speed rail further aggravate urban shrinkage? Cities 2019, 86, 210–219. [Google Scholar] [CrossRef]
- Ashenfelter, O. Estimating the Effect of Training Programs on Earnings. Rev. Econ. Stat. 1978, 60, 47–57. [Google Scholar] [CrossRef]
- Yang, X.; Lin, S.; Li, Y.; He, M. Can high-speed rail reduce environmental pollution? Evidence from China. J. Clean. Prod. 2019, 239, 118135. [Google Scholar] [CrossRef]
- Shao, S.; Tian, Z.; Yang, L. High speed rail and urban service industry agglomeration: Evidence from China’s Yangtze River Delta region. J. Transp. Geogr. 2017, 64, 174–183. [Google Scholar] [CrossRef]
- Heckman, J.J. The common structure of statistical models of truncation, sample selection and limited dependent variables and a simple estimator for such models. Ann. Econ. Soc. Meas. 1976, 5, 475–492. [Google Scholar]
- Rosenbaum, P.R.; Rubin, D.B. The central role of the propensity score in observational studies for causal effects. Biometrika 1983, 70, 41–55. [Google Scholar] [CrossRef]
- He, S.; Yu, S.; Li, G.; Zhang, J. Exploring the influence of urban form on land-use efficiency from a spatiotemporal heterogeneity perspective: Evidence from 336 Chinese cities. Land Use Policy 2020, 95, 104576. [Google Scholar] [CrossRef]
- Lu, M. Cross regional reallocation of construction land use right: The new driving force of China’s economic growth. J. World Econ. 2011, 34, 107–125. [Google Scholar]
- Yu, J.; Zhou, K.; Yang, S. Land use efficiency and influencing factors of urban agglomerations in China. Land Use Policy 2019, 88, 104143. [Google Scholar] [CrossRef]
- Gu, N.; Chen, X. Fiscal constraints, urban expansion and economic agglomeration density, labor productivity changes. Economist 2015, 30–40. [Google Scholar] [CrossRef]
- Bai, Y.; Deng, X.; Jiang, S.; Zhang, Q.; Wang, Z. Exploring the relationship between urbanization and urban eco-efficiency: Evidence from prefecture-level cities in China. J. Clean. Prod. 2018, 195, 1487–1496. [Google Scholar] [CrossRef]
- Liu, S.; Ye, Y.M.; Xiao, W. Spatial-Temporal Differentiation of Urban Land-Use Efficiency in China Based on Stochastic Frontier Analysis. China Land Sci. 2020, 34, 61–69. [Google Scholar]
- Qi, W.; Liu, S.; Jin, H. Applicability of the new standard of city-size classification in China. Prog. Geogr. 2016, 35, 47–56. [Google Scholar]
- Turok, I.; McGranahan, G. Urbanization and economic growth: The arguments and evidence for Africa and Asia. Environ. Urban 2013, 25, 465–482. [Google Scholar] [CrossRef]
- Wang, K.; Xia, W.; Zhang, A. Should China further expand its high-speed rail network? Consider the low-cost carrier factor. Transp. Res. Part A Policy Pract. 2017, 100, 105–120. [Google Scholar] [CrossRef]
- Wang, J.; Jiao, J.; Jin, F. Spatial effects of high-speed rails on interurban economic linkages in China. Acta Geogr. Sin. 2014, 69, 1833–1846. [Google Scholar]
- Zhang, J. High-speed rail construction and county economic development: The research of satellite light data. China Econ. Q. 2017, 16, 1533–1562. [Google Scholar]


| Definition | Mean | Standard Deviation | Minimum | Maximum | |
|---|---|---|---|---|---|
| ULUE | See Equation (4) | 6.17 | 4.85 | 0.04 | 60.81 |
| period | Year After HSR operation, 1 Year Before HSR operation, 0 | 0.57 | 0.49 | 0 | 1 |
| treated | City has HSR, 1 For no HSR, 0 | 0.27 | 0.45 | 0 | 1 |
| economic | per capita GDP | 10.61 | 0.71 | 8.14 | 15.68 |
| capital | total investment of fixed assets | 14.82 | 1.27 | 18.81 | 5.71 |
| labor | the sum of employment in the secondary and tertiary industries | 2.79 | 0.32 | 6.71 | 1.02 |
| urbanization | the proportion of the population of the city district in the total population | 0.35 | 0.24 | 1 | 0.21 |
| policy | the proportion of local fiscal expenditure to GDP | 0.27 | 0.16 | 0.11 | 3.58 |
| Model 1 | Model 2 | Model 3 | |
|---|---|---|---|
| 0.86 *** (0.22) | 1.29 *** (0.28 | 1.70 *** (0.28) | |
| economic | 2.25 *** (0.12) | 1.87 *** (0.14) | 1.21 *** (0.15) |
| capital | 0.62 *** (0.08) | 0.29 ** (0.09) | −0.14 (0.10) |
| labor | −0.17 (0.14) | 0.37 * (0.15) | 0.45 ** (0.20) |
| urbanization | 8.96 *** (0.48) | 6.77 *** (0.58) | 8.13 *** (0.74) |
| policy | −1.25 *** (0.27) | −1.32 ** (0.29) | −1.20 *** (0.29) |
| R2 | 0.46 | 0.56 | 0.58 |
| Geographic Location | Level and Scale | |||||
|---|---|---|---|---|---|---|
| Model 4 | Model 5 | Model 6 | Model 7 | Model 8 | Model 9 | |
| 1.82 *** (0.55) | 1.05 *** (0.33) | 0.31 (0.75) | 2.53 *** (0.73) | 0.52 (0.68) | 0.54 (0.37) | |
| economic | 1.57 *** (0.40) | 1.91 *** (0.22) | 0.95 *** (0.15) | 1.24 ** (0.60) | 0.58 *** (0.19) | 2.10 *** (0.16) |
| capital | −0.37 (0.36) | 0.17 (0.15) | −0.07 (0.09) | −1.26 *** (0.48) | 0.25 ** (0.12) | −0.04 (0.10) |
| labor | −0.79 (0.48) | 1.25 *** (0.24) | 0.19 (0.25) | −0.61 (0.56) | 1.55 *** (0.34) | 0.63 *** (0.18) |
| urbanization | 10.08 *** (1.26) | 4.74 *** (1.06) | 4.98 *** (1.60) | 10.85 *** (1.25) | −0.97 (2.011) | 0.46 (1.09) |
| policy | −1.37 *** (1.27) | −1.48 *** (0.40) | −1.16 *** (0.23) | 0.02 (0.66) | −1.57 ** (0.68) | −1.11 *** (0.27) |
| R2 | 0.57 | 0.70 | 0.67 | 0.61 | 0.67 | 0.66 |
| 2012 | 2013 | 2014 | 2015 | 2016 | 2017 | |
|---|---|---|---|---|---|---|
| 1.18 *** (0.21) | 1.14 *** (0.19) | 1.10 *** (0.18) | 1.20 *** (0.19) | 1.29 *** (0.21) | 1.20 *** (0.28) | |
| economic | 1.18 *** (0.15) | 1.22 *** (0.15) | 1.17 *** (0.15) | 1.16 *** (0.15) | 1.18 *** (0.15) | 1.21 *** (0.15) |
| capital | −0.15 (0.10) | −0.16 (0.10) | −0.15 (0.10) | −0.15 (0.10) | −0.15 (0.10) | −0.15 (0.10) |
| labor | 0.45 ** (0.20) | 0.44 ** (0.19) | 0.42 ** (0.20) | 0.10 ** (0.20) | 0.40 ** (0.20) | 0.43 ** (0.20) |
| urbanization | 8.07 *** (0.74) | 8.07 *** (0.74) | 7.99 *** (0.74) | 8.09 *** (0.74) | 8.24 *** (0.74) | 8.27 *** (0.74) |
| policy | −1.20 *** (0.29) | −1.22 *** (0.29) | −1.23 *** (0.29) | −1.22 *** (0.29) | −1.22 *** (0.29) | −1.20 *** (0.29) |
| R2 | 0.58 | 0.58 | 0.58 | 0.58 | 0.58 | 0.58 |
| Counterfactual Test | |
|---|---|
| −1.70 (0.28) | |
| Control variables | Yes |
| R2 | 0.58 |
Publisher’s Note: MDPI stays neutral with regard to jurisdictional claims in published maps and institutional affiliations. |
© 2021 by the authors. Licensee MDPI, Basel, Switzerland. This article is an open access article distributed under the terms and conditions of the Creative Commons Attribution (CC BY) license (http://creativecommons.org/licenses/by/4.0/).
Share and Cite
Lu, X.; Tang, Y.; Ke, S. Does the Construction and Operation of High-Speed Rail Improve Urban Land Use Efficiency? Evidence from China. Land 2021, 10, 303. https://doi.org/10.3390/land10030303
Lu X, Tang Y, Ke S. Does the Construction and Operation of High-Speed Rail Improve Urban Land Use Efficiency? Evidence from China. Land. 2021; 10(3):303. https://doi.org/10.3390/land10030303
Chicago/Turabian StyleLu, Xinhai, Yifeng Tang, and Shangan Ke. 2021. "Does the Construction and Operation of High-Speed Rail Improve Urban Land Use Efficiency? Evidence from China" Land 10, no. 3: 303. https://doi.org/10.3390/land10030303
APA StyleLu, X., Tang, Y., & Ke, S. (2021). Does the Construction and Operation of High-Speed Rail Improve Urban Land Use Efficiency? Evidence from China. Land, 10(3), 303. https://doi.org/10.3390/land10030303