
The Spatial and Temporal Evolution and Drivers of Habitat Quality in the Hung River Valley


 , , ,
, , , 
Abstract
:1. Introduction
2. Materials and Methods
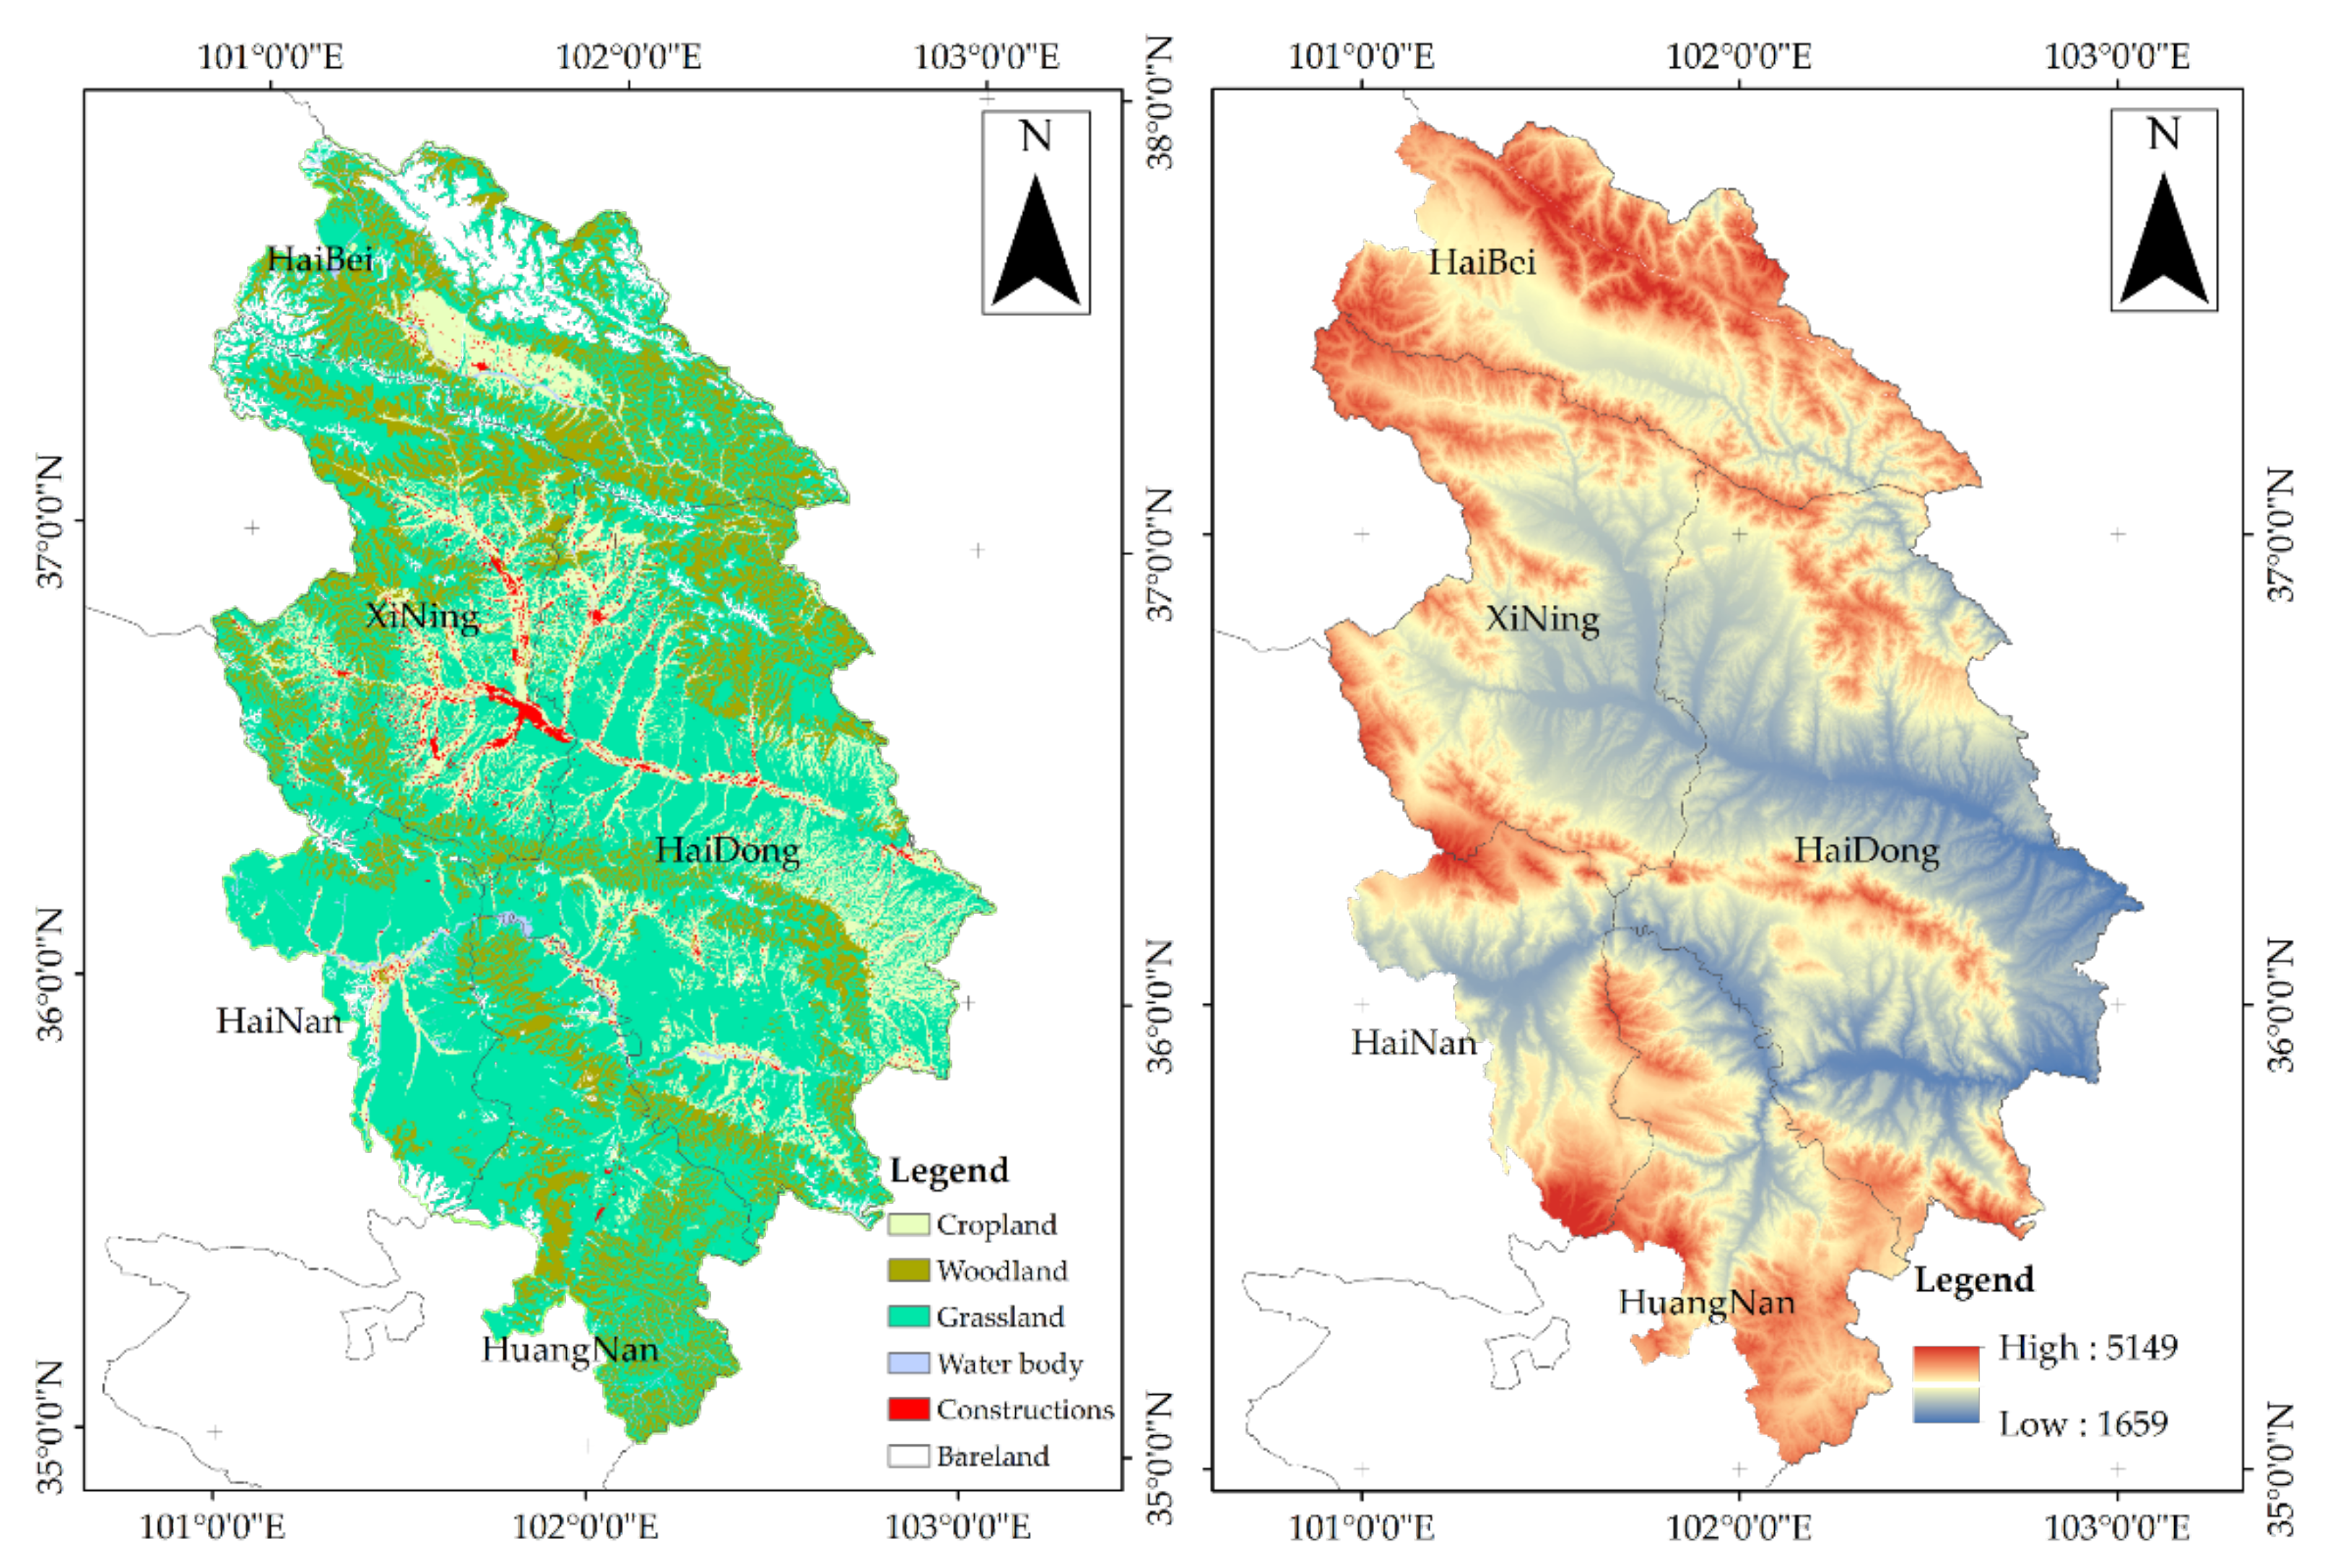
2.1. Study Site
2.2. Data Source
2.3. Research Methodology
2.3.1. InVEST Model
2.3.2. Spatial Autocorrelation Analysis
2.3.3. Hotspot Analysis
2.3.4. Land-Use Change Transfer Matrix and Landscape Pattern Analysis
2.3.5. Geographically Weighted Regression (GWR) Model
3. Results
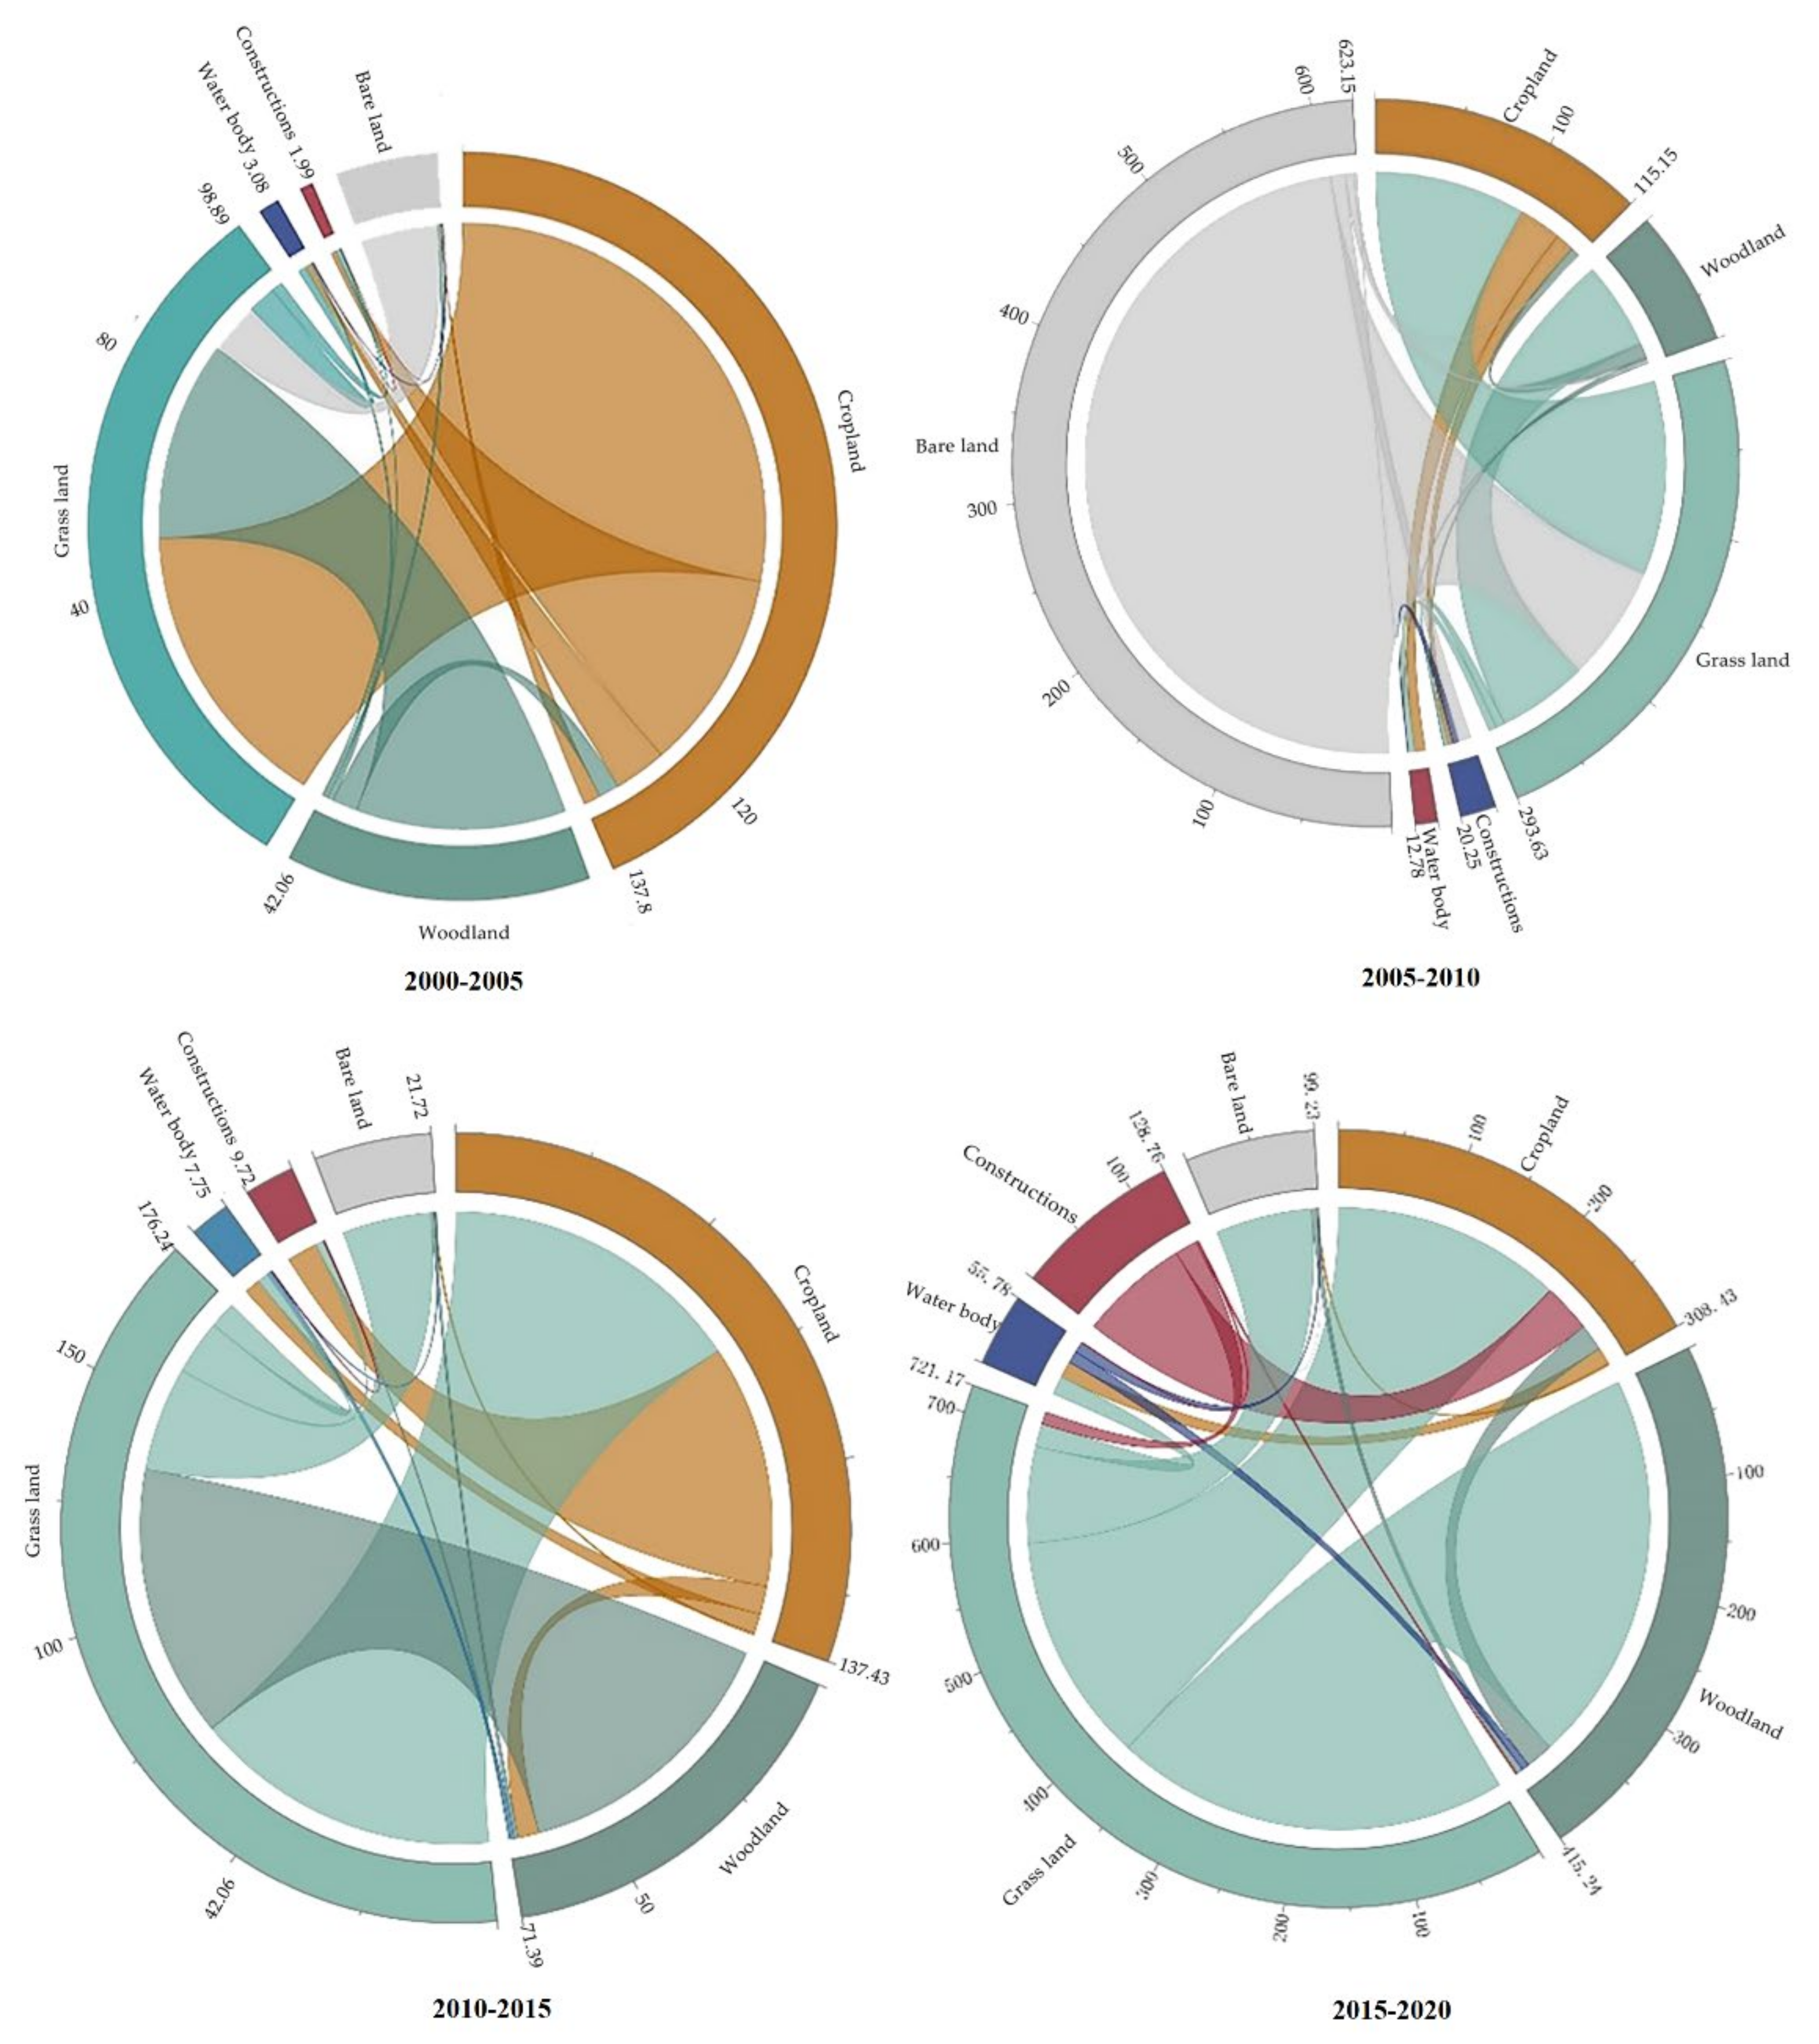
3.1. Land-Use Change Characteristics
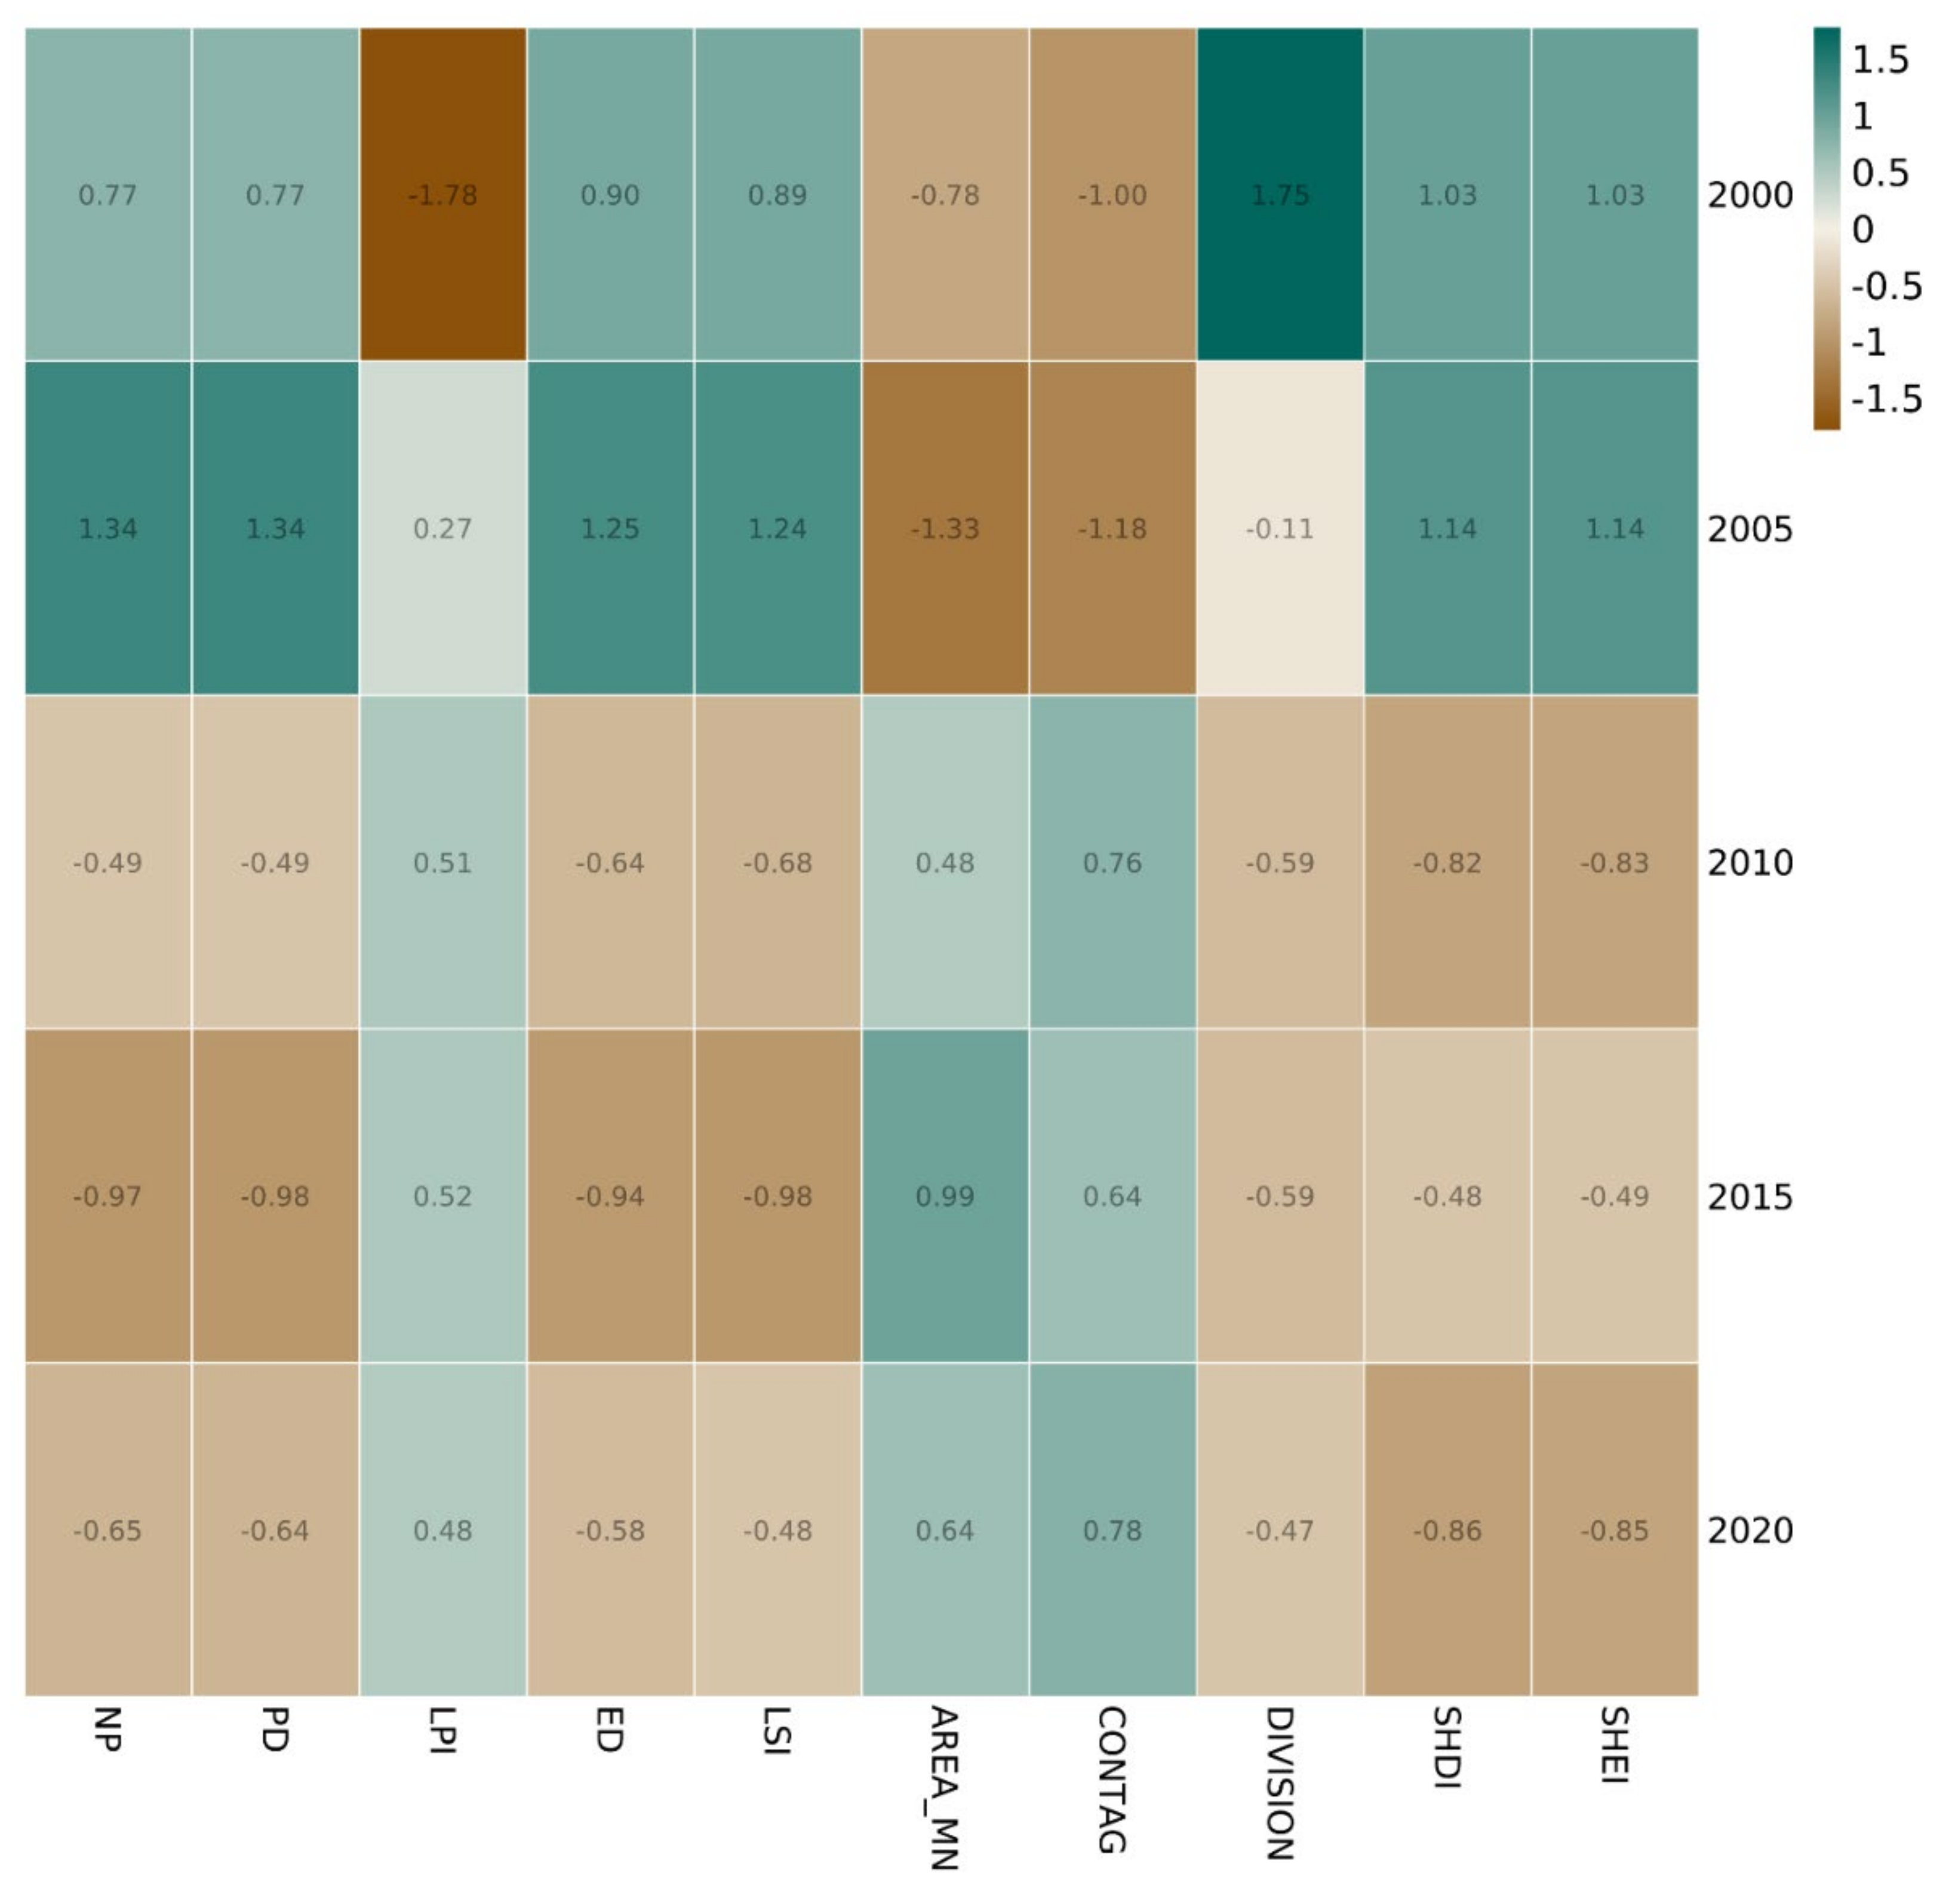
3.2. Analysis of the Evolution of the Landscape Pattern Features
3.3. Spatial and Temporal Variation of Habitat Quality
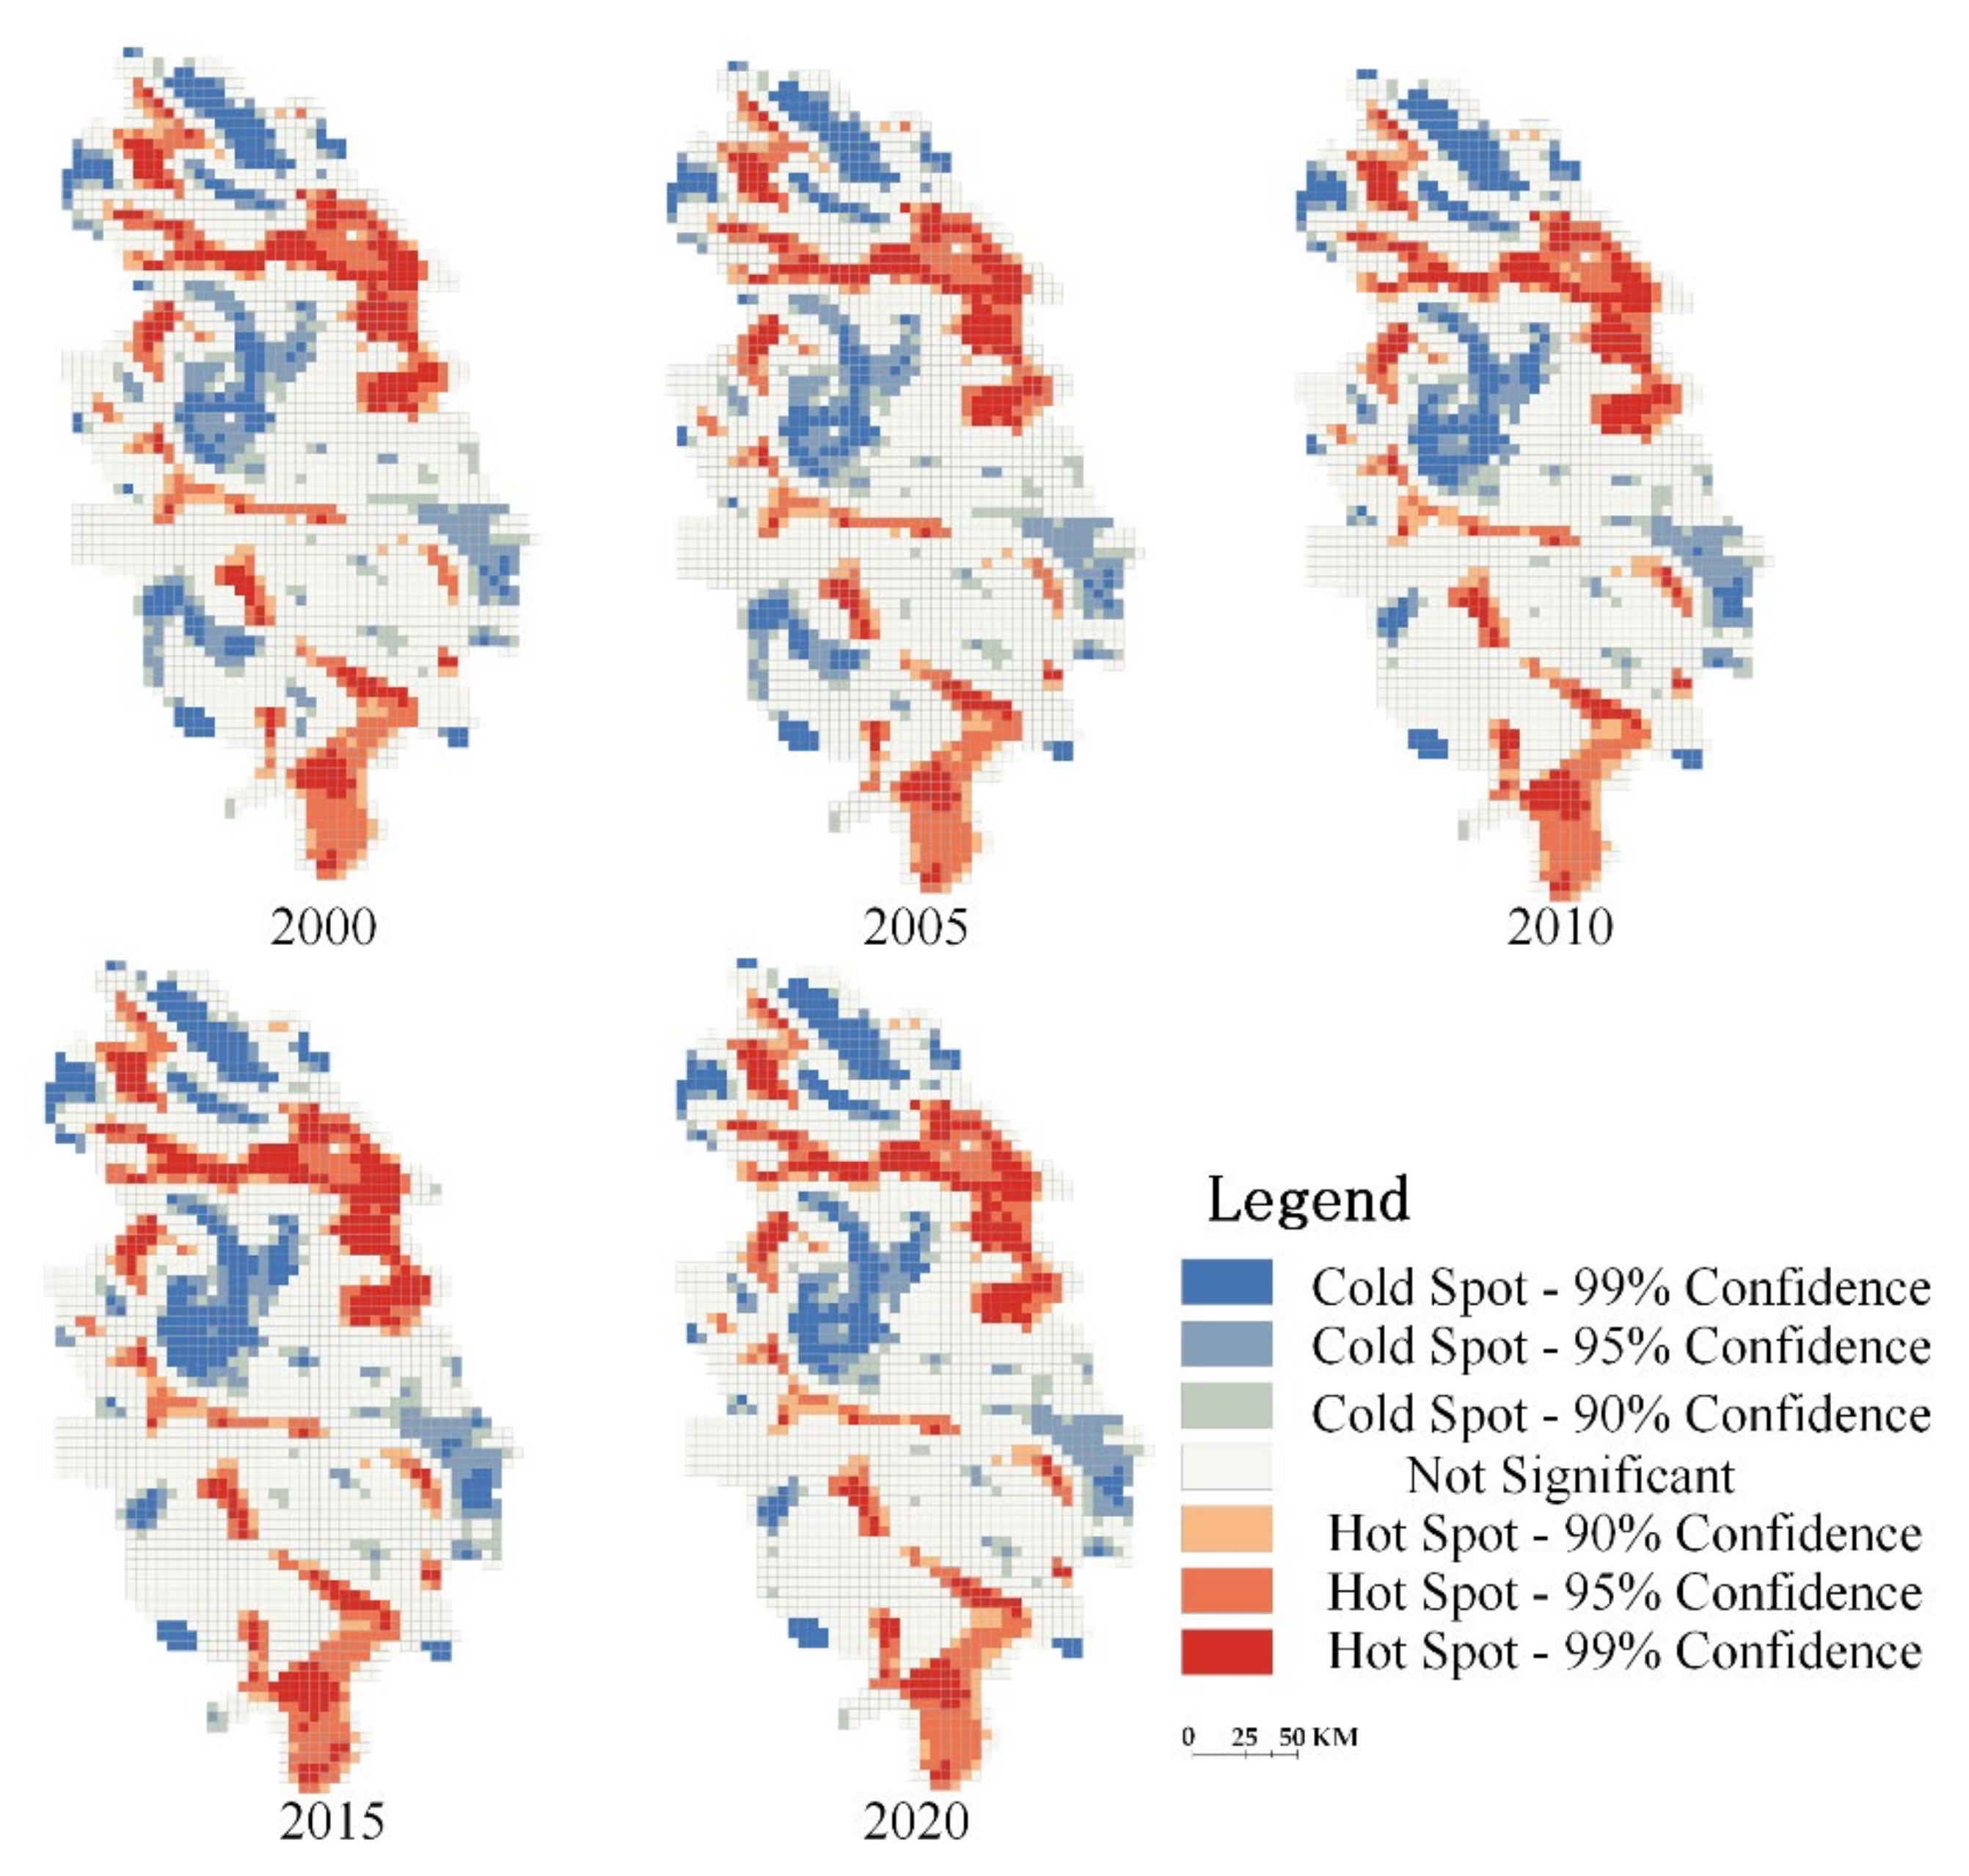
3.4. Hotspot Analysis of the Spatial Distribution of Habitat Quality
3.4.1. Overall Clustering Characteristics
3.4.2. Local Agglomeration Characteristics
3.5. Spatial Response of Habitat Quality to Urbanisation
4. Discussion
4.1. Scaling Effects of Land Characteristics and Habitat Quality
4.2. Research Shortcomings
4.3. Policy Recommendations
5. Conclusions
- (1)
- From 2000 to 2020, the area of grassland, construction land, and watersheds in the Hung River Valley increased year by year. The area of cropland kept decreasing. The woodland and bareland fluctuated and changed, but was basically stable. Among them, the main source of growth in construction land is the occupation of cropland, which is especially obvious in Xining and Haidong; woodland, grassland, water, and other high habitat landscape types increased steadily, thanks to the implementation of policies returning farmland to forest and grass and establishing nature reserves at all levels.
- (2)
- From 2000 to 2020, the Hung River Valley Habitat Quality Index was stable, at around 0.66, with a slight increase. The regional habitat quality changed, and hot and cold states on both sides of the “Guide-Ledu” were differently distributed. The habitat level of Xining showed low-quality characteristics, including decreasing and gathering cold spots, while the habitat quality index of Datong County, Guide County, Mutual County, Menyuan County, and Zunhua County was higher. The ecological protection pressure is relatively small.
- (3)
- The natural elements shaped the overall habitat distribution pattern in the Hung River Valley, with slope, elevation, and habitat quality generally showing a positive relationship, and the effect of slope on habitat was relatively complex. The effects of disturbance on the ecosystem were strong, biodiversity was destroyed, ecosystem imbalance occurred, and habitat quality was significantly degraded.
Author Contributions
Funding
Institutional Review Board Statement
Informed Consent Statement
Conflicts of Interest
References
- Costanza, R.; D’Arge, R.; De Groot, R.; Farber, S.; Grasso, M.; Hannon, B.; Limburg, K.; Naeem, S.; O’Neill, R.V.; Paruelo, J.; et al. The value of the world’s ecosystem services and natural capital. Nature 1997, 387, 253–260. [Google Scholar] [CrossRef]
- Ellis, E.C.; Pascual, U.; Mertz, O. Ecosystem services and nature’s contribution to people: Negotiating diverse values and trade-offs in land systems. Curr. Opin. Environ. Sustain. 2019, 38, 86–94. [Google Scholar] [CrossRef]
- Fellman, J.B.; Hood, E.; Dryer, W.; Pyare, S. Stream physical characteristics impact habitat quality for pacific salmon in two temperate coastal watersheds. PLoS ONE 2015, 10, e0132652. [Google Scholar] [CrossRef] [Green Version]
- Gao, Y.; Ma, L.; Liu, J.; Zhuang, Z.; Huang, Q.; Li, M. Constructing ecological networks based on habitat quality assessment: A case study of Chang-zhou, China. Sci. Rep. 2017, 7, 46073. [Google Scholar] [CrossRef] [PubMed]
- Sharp, R.; Tallis, H.T.; Ricketts, T.; Guerry, D.A.; Wood, A.S.; Chaplin-Kramer, R.; Nelson, E.; Ennaanay, D.; Wolny, S.; Olwero, N.; et al. InVEST 3.2.0 User’s Guide; The Natural Capital Project; Stanford University, University of Minnesota, The Nature Conservancy, World Wildlife Fund: Minneapolis, MN, USA, 2018. [Google Scholar]
- Hillard, E.M.; Nielsen, C.K.; Groninger, J.W. Swamp rabbits as indicators of wildlife habitat quality in bottomland hardwood forest ecosystems. Ecol. Indic. 2017, 79, 47–53. [Google Scholar] [CrossRef]
- Peng, J.; Pan, Y.; Liu, Y.; Zhao, H.; Wang, Y. Linking ecological degradation risk to identify ecological security patterns in a rapidly urbanizing landscape. Habitat Int. 2018, 71, 110–124. [Google Scholar] [CrossRef]
- Barbara, R.; Stefan, L. A spatially explicit patch model of habitat quality, integrating spatio-structural indicators. Ecol. Indic. 2018, 94, 8–14. [Google Scholar]
- Janus, J.; Bozek, P. Land abandonment in Poland after the collapse of socialism: Over a quarter of a century of increasing tree cover on agricultural land. Ecol. Eng. 2019, 138, 106–117. [Google Scholar] [CrossRef]
- Liu, Y.; Huang, X.; Yang, H.; Zhong, T. Environmental effects of land use/cover change caused by urbanization and policies in South-west China Karstarea: A case study of Guiyang. Habitat Int. 2014, 44, 339–348. [Google Scholar] [CrossRef]
- Terrado, M.; Sabater, S.; Chaplin-Kramer, B.; Mandle, L.; Ziv, G.; Acuña, V. Model development for the assessment of terrestrial and aquatic habitat quality in conservation planning. Sci. Total Environ. 2016, 540, 63–70. [Google Scholar] [CrossRef] [Green Version]
- Sala, O.E.; Chapin, F.S.; Armesto, J.J.; Berlow, E.L.; Bloomfield, J.; Dirzo, R.; Hubersanwald, E.; Huenneke, L.F.; Jackson, R.B.; Kinzig, A.P.J.S. Global biodiversity scenarios for the year 2100. Science 2000, 287, 1770–1774. [Google Scholar] [CrossRef] [PubMed]
- Liu, C.H.; Lun, Y. Progress, achievements and prospects of biodiversity protection in Yunnan Province. Biodivers. Sci. 2020, 29, 200. [Google Scholar] [CrossRef]
- Liu, Y.; Zhou, Y.; Du, Y. Study on the Spatio-Temporal Patterns of Habitat Quality and Its Terrain Gradient Effects of the Middle of the Yangtze River Economic Belt Based on InVEST Model. Resour. Environ. Yangtze Basin. 2019, 28, 2429–2440. [Google Scholar]
- Lei, J.C.; Liu, J.X.; Yong, F.; Liu, H.M.; Wu, J.; Ding, H.; Wang, J.M.; Wu, S.Q.; Cheng, S.; Cui, P. Multi- Scenario Ecosystem Service Assessment of Wuma River Valley Based on CLUE- S and InVEST Models. J. Ecol. Rural Environ. 2017, 33, 1084–1093. [Google Scholar]
- Liang, X.; Liu, X.P.; Li, X.; Chen, Y.M.; Tian, H.; Yao, Y. Delineating multi-scenario urban growth boundaries with a CA-based FLUS model and morphological method. Landsc. Urban Plan. 2018, 177, 47–63. [Google Scholar] [CrossRef]
- Koull, N.; Chehma, A. Soil characteristics and plant distribution in saline wetlands of Oued Righ, northeastern Algeria. J. Arid. Land. 2016, 8, 948–959. [Google Scholar] [CrossRef]
- Wei, H.; Zhao, W.W.; Zhang, X.; Wang, X.Z. Regional ecosystem service value evaluation based on land use changes: A case study in Dezhou, Shandong Province, China. Acta Ecol. Sin. 2017, 37, 3830–3839. [Google Scholar]
- Kim, T.; Song, C.; Lee, W.K.; Kim, M.; Lim, C.H.; Jeon, S.W.; Kim, J. Habitat quality valuation using InVEST model in Jeju Island. J. Korea Soc. Environ. Restor. Technol. 2015, 18, 1–11. [Google Scholar] [CrossRef] [Green Version]
- Qamer, F.M.; Shehzad, K.; Abbas, S.; Murthy, M.; Xi, C.; Gilani, H.; Bajracharya, B. Mapping Deforestation and Forest Degradation Patterns in Western Himalaya, Pakistan. Remote Sens. 2016, 8, 385. [Google Scholar] [CrossRef] [Green Version]
- Shalaby, A.; Tateishi, R. Remote sensing and GIS for mapping and monitoring land cover and land-use changes in the Northwestern coastal zone of Egypt. Appl. Geogr. 2007, 27, 28–41. [Google Scholar] [CrossRef]
- Zhang, H.Y.; Wang, L.; Zhao, R.; Liang, Y. Integrating landscape pattern with economic indices to conduct land use two-dimensional division: Taking Qinghai Province as an example. Bull. Surv. Mapp. 2013, 3, 82–85. [Google Scholar]
- Zhao, D.Y.; Zeng, Y.N. Land use changes and ecological risk assessment in eastern Qinghai Plateau: A case study in Haidong, Qinghai, China. J. Desert Res. 2016, 36, 1190–1197. [Google Scholar]
- Wu, B.W.; Yang, S.T.; Shao, N.F.; Peng, R.W.; Guan, Y.B. Effects of land use change on ecosystem service value in fragile ecological area of the Loess Plateau: A case study of Fenhe River Basin. Res. Soil Water Conserv. 2019, 26, 340–345. [Google Scholar]
- Hou, L.W. InVEST habitat quality model parameter assignment discussion. Environ. Dev. 2017, 29, 80–81. [Google Scholar]
- Newbold, T.; Hudson, L.N.; Hill, S.L.L.; Contu, S.; Lysenko, I.; Senior, R.A.; Börger, L.; Bennett, D.J.; Choimes, A.; Collen, B.; et al. Global effects of land use on local terrestrial biodiversity. Nature 2015, 520, 45–50. [Google Scholar] [CrossRef] [PubMed] [Green Version]
- Hennig, E.I.; Schwick, C.; Soukup, T.; Orlitová, E.; Kienast, F.; Jaeger, J.A.G. Multi-scale analysis of urban sprawl in Europe: Towards a European de-sprawling strategy. Land Use Policy 2015, 49, 483–498. [Google Scholar] [CrossRef] [Green Version]
- Xinliang, X.; Jiyuan, L.; Shuwen, Z.; Rendong, L.; Changzhen, Y.; Shixin, W. China Multi-Period Land Use and Land Cover Remote Sensing Monitoring Dataset (CNLUCC); Data Registration and Publishing System of the Resource and Environmental Science Data Center of the Chinese: Shanghai, China, 2020. [Google Scholar] [CrossRef]
- McDonald, R.I.; Weber, K.; Padowski, J.; Flörke, M.; Schneider, C.; Green, P.A.; Gleeson, T.; Eckman, S.; Lehner, B.; Balk, D.; et al. Water on an urban planet: Urbanization and the reach of urban water infrastructure. Glob. Environ. Chang. 2014, 27, 96–105. [Google Scholar] [CrossRef] [Green Version]
- Deng, Y.J.; Yao, S.B.; Hou, M.Y.; Zhang, T.Y.; Lu, Y.N.; Gong, Z.W.; Wang, Y.F. Assessing the effects of the Green for Grain Program on ecosystem carbon storage service by linking the InVEST and FLUS models: A case study of Zichang county in hilly and gully region of Loess Plateau. J. Nat. Resour. Energy 2020, 35, 826–844. [Google Scholar]
- Wu, Y.Z.; Shan, L.P.; Guo, Z.; Peng, Y. Cultivated land protection policies in China facing 2030: Dynamic balance system versus basic farmland zoning. Habitat Int. 2017, 69, 126–138. [Google Scholar] [CrossRef]
- Wang, C.D.; Li, X.; Yu, H.J.; Wang, Y.T. Tracing the spatial variation and value change of ecosystem services in Yellow River Delta, China. Ecol. Indic. 2019, 96, 270–277. [Google Scholar] [CrossRef]
- Shi, H.; Li, X.; Yang, Z.Z.; Li, T.H.; Ren, Y.; Liu, T.T.; Yang, N.D.; Zhang, H.; Chen, G.Z.; Liang, X. Tourism land use simulation for regional tourism planning using POIs and cellular automata. Trans. GIS 2020, 24, 1119–1138. [Google Scholar] [CrossRef]
- Sharma, R.; Nehren, U.; Rahman, S.A.; Meyer, M.; Rimal, B.; Seta, G.A.; Baral, H. Modeling Land Use and Land Cover Changesn and Their Effects on Biodiversity in Central Kalimantan, Indonesia. Land 2018, 7, 57. [Google Scholar] [CrossRef] [Green Version]
- Gustafson E, J. Quantifying landscape spatial pattern: What is the state of the art? Ecosystems 1998, 1, 143–156. [Google Scholar] [CrossRef]
- Van der Biest, K.; Meire, P.; Schellekens, T.; D’hondt, B.; Bonte, D.; Vanagt, T.; Ysebaert, T. Aligning biodiversity conservation and ecosystem services in spatial planning: Focus on ecosystem processes. Sci. Total Environ. 2020, 712, 136350. [Google Scholar] [CrossRef] [PubMed]
- Lin, W.B.; Sun, Y.M.; Nijhuis, S.; Wang, Z.L. Scenario-based flood risk assessment for urbanizing deltas using future land-use simulation (FLUS): Guangzhou Metropolitan Area as a case study. Sci. Total Environ. 2020, 739, 139899. [Google Scholar] [CrossRef]
- Liu, X.J.; Li, X.; Liang, X.; Shi, H.; Ou, J.P. Simulating the Change of Terrestrial Carbon Storage in China Based on the FLUS-InVEST Model. Trop. Geogr. 2019, 39, 397–409. [Google Scholar]
- Di Febbraro, M.; Sallustio, L.; Vizzarri, M.; De Rosa, D.; De Lisio, L.; Loy, A.; Eichelberger, B.; Marchetti, M. Expert-based and correlative models to map habitat quality: Which gives better support to conservation planning? Glob. Ecol. Conserv. 2018, 16, e00513. [Google Scholar] [CrossRef]
- Zhu, J.; Ding, N.; Li, D.; Sun, W.; Xie, Y.; Wang, X. Spatiotemporal Analysis of the Nonlinear Negative Relationship between Urbanization and Habitat Quality in Metropolitan Areas. Sustainability 2020, 12, 669. [Google Scholar] [CrossRef] [Green Version]
- Sun, L.; Yang, L.; Chen, L.D.; Zhao, F.K.; Li, S.J. Hydraulic redistribution and its contribution to water retention during short-term drought in the summer rainy season in a humid area. J. Hydrol. 2018, 566, 377–385. [Google Scholar] [CrossRef]
- Priyadarshini, K.V.R.; Prins, H.H.T.; De Bie, S.; Heitknig, I.M.A.; Woodborne, S.; Gort, G.; Kirkman, K.; Ludwig, F.; Dawson, T.E.; De Kroon, H. Seasonality of hydraulic redistribution by trees to grasses and changes in their water-source use that change tree-grass interactions. Ecohydrology 2016, 9, 218–228. [Google Scholar] [CrossRef]
- Tang, Z.; Ma, J.; Peng, H.; Wang, S.; Wei, J. Spatiotemporal changes of vegetation and their responses to temperature and precipitation in upper Shiyang river basin. Adv. Space Res. 2017, 60, 969–979. [Google Scholar] [CrossRef]
- Hu, Y.N.; Mei, L.; Wei, J.G. Spatial differentiation and dynamic mechanism of regional travel agency efficiency in China based on GWR model. Sci. Geogr. Sin. 2018, 38, 107–113. [Google Scholar]
- Zhai, T.; Wang, J.; Fang, Y.; Qin, Y.; Huang, L.; Chen, Y. Assessing ecological risks caused by human activities in rapid urbanization coastal areas: Towards an integrated approach to determining key areas of terrestrial-oceanic ecosystems preservation and restoration. Sci. Total Environ. 2020, 708, 135153. [Google Scholar] [CrossRef] [PubMed]
- Li, F.; Wang, L.; Chen, Z.; Clarke, K.C.; Li, M.; Jiang, P. Extending the SLEUTH model to integrate habitat quality into urban growth simulation. J. Environ. Manag. 2018, 217, 486–498. [Google Scholar] [CrossRef] [Green Version]
- Gu, X.; Long, A.; Liu, G.; Yu, J.; Wang, H.; Yang, Y.; Zhang, P. Changes in Ecosystem Service Value in the 1 km Lakeshore Zone of Poyang Lake from 1980 to 2020. Land 2021, 10, 951. [Google Scholar] [CrossRef]
- Nematollahi, S.; Fakheran, S.; Kienast, F.; Jafari, A. Application of InVEST habitat quality module in spatially vulnerability assessment of natural habitats (case study: Chaharmahal and Bakhtiari province, Iran). Environ. Monit. Assess. 2020, 192, 1–17. [Google Scholar] [CrossRef] [PubMed]
- Anchang, J.Y.; Ananga, E.O.; Pu, R. An efficient unsupervised index based approach for mapping urban vegetation from IKONOS imagery. Int. J. Appl. Earth Obs. Geoinform. 2016, 50, 211–220. [Google Scholar] [CrossRef]
- Gong, P.; Li, X.; Wang, J.; Bai, Y.; Chen, B.; Hu, T.; Liu, X.; Xu, B.; Yang, J.; Zhang, W.; et al. Annual maps of global artificial impervious area (GAIA) between 1985 and 2018. Remote Sens. Environ. 2020, 236, 111510. [Google Scholar] [CrossRef]
- Ma, Y.; Zhang, S.; Yang, K.; Li, M. Influence of spatiotemporal pattern changes of impervious surface of urban megaregion on thermal environment: A case study of the Guangdong—Hong Kong—Macao Greater Bay Area of China. Ecol. Indic. 2021, 121, 107106. [Google Scholar] [CrossRef]


| Threat Source | Maximum Stress Distance/km | Weight | Attenuation Type |
|---|---|---|---|
| Paddy field | 0.5 | 0.5 | Linear |
| Non-irrigated arable land | 0.5 | 0.5 | Linear |
| Urban land | 10.0 | 1.0 | Exponential |
| Rural settlement | 2.0 | 0.7 | Exponential |
| Industrial and mining land | 1.0 | 0.5 | Exponential |
| Traffic land | 3.0 | 1.0 | Linear |
| Type | Habitat Type | Habitat Suitability | Sensitivity | |||||
|---|---|---|---|---|---|---|---|---|
| Paddy Field | Non-Irrigated Arable Land | Rural Settlement | Urban Land | Industrial and Mining Land | Traffic Land | |||
| Cropland | Paddy field | 0.4 | 0 | 0.3 | 0.35 | 0.5 | 0.1 | 0.1 |
| dry land | 0.4 | 0.3 | 0 | 0.35 | 0.5 | 0.1 | 0.1 | |
| Woodland | Forestland | 1.0 | 0.8 | 0.5 | 0.2 | 0.5 | 0.8 | 0.8 |
| Irrigate forestland | 1.0 | 0.8 | 0.9 | 0.7 | 1.0 | 0.5 | 0.5 | |
| Sparse forestland | 0.7 | 0.7 | 0.8 | 0.8 | 0.9 | 0.6 | 0.6 | |
| Others | 0.7 | 0.7 | 0.8 | 0.8 | 0.8 | 0.6 | 0.6 | |
| Grassland | High coverage | 0.8 | 0.5 | 0.5 | 0.5 | 0.6 | 0.3 | 0.3 |
| Medium coverage | 0.7 | 0.5 | 0.5 | 0.6 | 0.6 | 0.4 | 0.4 | |
| Low coverage | 0.6 | 0.5 | 0.5 | 0.5 | 0.6 | 0.3 | 0.3 | |
| Water areas | Canal | 0.8 | 0.3 | 0.2 | 0.3 | 0.3 | 0.2 | 0.2 |
| lake | 0.8 | 0.3 | 0.2 | 0.3 | 0.3 | 0.2 | 0.2 | |
| Reservoir pond | 0.7 | 0.2 | 0.2 | 0.3 | 0.3 | 0.1 | 0.1 | |
| Snowfield | 0.5 | 0.2 | 0.2 | 0.2 | 0.7 | 0.1 | 0.1 | |
| Beach | 0.5 | 0.2 | 0.2 | 0.2 | 0.7 | 0.1 | 0.1 | |
| Construction | Urban land | 0 | 0 | 0 | 0 | 0 | 0 | 0 |
| Rural settlement | 0 | 0 | 0 | 0 | 0 | 0 | 0 | |
| Others | 0 | 0 | 0 | 0.6 | 0 | 0 | 0 | |
| Bare land | Sandy land | 0.2 | 0.1 | 0.5 | 0.6 | 0.9 | 0.6 | 0.6 |
| Gobi | 0.2 | 0.1 | 0.5 | 0.6 | 0.9 | 0.6 | 0.6 | |
| Marsh land | 0.6 | 0.8 | 0.8 | 0.8 | 1.0 | 0.6 | 0.6 | |
| Bare land | 0.2 | 0.1 | 0.5 | 0.6 | 0.9 | 0.6 | 0.6 | |
| Bare rock land | 0.2 | 0.1 | 0.5 | 0.6 | 0.9 | 0.6 | 0.6 | |
| Alpine desert | 0.2 | 0.1 | 0.5 | 0.6 | 0.9 | 0.6 | 0.6 | |
| Years | Type | Cultivated Land | Forestland | Grassland | Water Areas | Construction | Bare Land |
|---|---|---|---|---|---|---|---|
| 2000–2005 | Cultivated land | — | 4.29 | 49.7 | 0.9 | 0.96 | 0.25 |
| Forestland | 3.44 | — | 33.78 | 0.37 | 0.1 | 0.63 | |
| Grassland | 88.55 | 35.57 | — | 1.49 | 0.8 | 13.32 | |
| Water areas | 8.91 | 1.04 | 4.85 | — | 0.1 | 0.15 | |
| Construction | 33.93 | 0.48 | 2 | 0.09 | — | 0.01 | |
| Bare land | 2.97 | 0.68 | 8.56 | 0.23 | 0.03 | — | |
| 2005–2010 | Cultivated land | — | 10.52 | 135.32 | 3.61 | 7.5 | 2.26 |
| Forestland | 6.61 | — | 63.14 | 0.85 | 0.21 | 5.6 | |
| Grassland | 105.6 | 61.06 | — | 2.55 | 4.56 | 604.67 | |
| Water areas | 13.08 | 2.14 | 6.19 | — | 0.51 | 10.38 | |
| Construction | 29.51 | 0.52 | 5.75 | 4.22 | — | 0.24 | |
| Bare land | 0.35 | 1.54 | 80.23 | 9.02 | — | ||
| 2010–2015 | Cultivated land | — | 4.87 | 70.84 | 3.63 | 7 | 0.36 |
| Forestland | 6.52 | — | 62.74 | 1.06 | 0.21 | 0.69 | |
| Grassland | 70.02 | 64.34 | — | 2.45 | 1.83 | 20.45 | |
| Water areas | 4.41 | 0.85 | 6.07 | — | 0.23 | 0.22 | |
| Construction | 56.04 | 0.46 | 12.62 | 0.2 | — | 0 | |
| Bare land | 0.44 | 0.87 | 23.97 | 0.23 | 0 | — | |
| 2015–2020 | Cultivated land | — | 26.22 | 219.07 | 15.84 | 104.28 | 1.43 |
| Forestland | 25.19 | — | 376.38 | 11.26 | 1.89 | 4.88 | |
| Grassland | 218.72 | 374.21 | — | 17.65 | 21.28 | 91.87 | |
| Water areas | 16.17 | 7.09 | 21.97 | — | 1.26 | 1 | |
| Construction | 46.66 | 1.49 | 11.83 | 0.91 | — | 0.05 | |
| Bare land | 1.69 | 6.23 | 91.92 | 10.12 | 0.05 | — |
| Level | 2000 | 2005 | 2010 | 2015 | 2020 | |||||
|---|---|---|---|---|---|---|---|---|---|---|
| Area/km2 | Percentage/% | Area/km2 | Percentage/% | Area/km2 | Percentage/% | Area/km2 | Percentage/% | Area/km2 | Percentage/% | |
| Very low | 2939.82 | 8.3 | 2972.32 | 8.4 | 2458.76 | 6.9 | 2554.65 | 7.3 | 2485.86 | 7.0 |
| Low | 3803.14 | 10.8 | 3760.62 | 10.7 | 3760.60 | 10.7 | 3714.35 | 10.5 | 3738.7 | 10.6 |
| Medium | 5726.48 | 16.3 | 5754.36 | 16.3 | 6633.74 | 18.8 | 6595.7 | 18.7 | 6632.13 | 18.8 |
| High | 16,038.43 | 45.5 | 16,012.46 | 45.4 | 15,606.80 | 44.3 | 15,583.67 | 44.2 | 15,573 | 44.0 |
| Very high | 6727.01 | 19 | 6735.09 | 19 | 6773.13 | 19.2 | 6786.52 | 19.3 | 6788.54 | 19.3 |
| Year | Global Autocorrelation Index Statistics | Result | ||
|---|---|---|---|---|
| Moran’s I | Z-Score | p-Value | ||
| 2000 | 0.699 | 46.929 | 0.0000 | Gather |
| 2005 | 0.698 | 46.886 | 0.0000 | Gather |
| 2010 | 0.705 | 47.344 | 0.0000 | Gather |
| 2015 | 0.777 | 51.755 | 0.0000 | Gather |
| 2020 | 0.706 | 47.427 | 0.0000 | Gather |
| Model Parameters | 2000 | 2005 | 2010 | 2015 | 2020 |
|---|---|---|---|---|---|
| Bandwidth | 55 | 55 | 55 | 55 | 55 |
| Residual Squares | 230.377 | 238.716 | 233.701 | 228.572 | 228.182 |
| Effective Number | 536.451 | 534.240 | 532.123 | 529.740 | 529.882 |
| Sigma | 0.353 | 0.359 | 0.355 | 0.351 | 0.351 |
| AICC | 6338.648 | 2661.698 | 2604.091 | 2543.320 | 2539.722 |
| R2 | 0.903 | 0.900 | 0.902 | 0.904 | 0.904 |
| Adjusted R2 | 0.875 | 0.871 | 0.874 | 0.877 | 0.877 |
| Global Regression Coefficients | 2000 | 2005 | 2010 | 2015 | 2020 |
|---|---|---|---|---|---|
| DEM (Digital elevation model) | 0.119 | 0.127 | 0.247 | 0.236 | 0.246 |
| SLOPE | 0.324 | 0.352 | 0.344 | 0.343 | 0.342 |
| RAIN | 0.187 | 0.190 | 0.175 | 0.171 | 0.175 |
| TEM | 0.217 | 0.234 | 0.348 | 0.339 | 0.349 |
| GDP | −0.067 | −0.012 | 0.036 | 0.017 | 0.036 |
| LIGHT | −0.030 | −0.089 | −0.177 | −0.187 | −0.176 |
| POP | −0.049 | −0.060 | −0.031 | −0.015 | −0.021 |
Publisher’s Note: MDPI stays neutral with regard to jurisdictional claims in published maps and institutional affiliations. |
© 2021 by the authors. Licensee MDPI, Basel, Switzerland. This article is an open access article distributed under the terms and conditions of the Creative Commons Attribution (CC BY) license (https://creativecommons.org/licenses/by/4.0/).
Share and Cite
Fan, X.; Gu, X.; Yu, H.; Long, A.; Tiando, D.S.; Ou, S.; Li, J.; Rong, Y.; Tang, G.; Zheng, Y.; et al. The Spatial and Temporal Evolution and Drivers of Habitat Quality in the Hung River Valley. Land 2021, 10, 1369. https://doi.org/10.3390/land10121369
Fan X, Gu X, Yu H, Long A, Tiando DS, Ou S, Li J, Rong Y, Tang G, Zheng Y, et al. The Spatial and Temporal Evolution and Drivers of Habitat Quality in the Hung River Valley. Land. 2021; 10(12):1369. https://doi.org/10.3390/land10121369
Chicago/Turabian StyleFan, Xin, Xinchen Gu, Haoran Yu, Aihua Long, Damien Sinonmatohou Tiando, Shengya Ou, Jiangfeng Li, Yuejing Rong, Guiling Tang, Yanjun Zheng, and et al. 2021. "The Spatial and Temporal Evolution and Drivers of Habitat Quality in the Hung River Valley" Land 10, no. 12: 1369. https://doi.org/10.3390/land10121369
APA StyleFan, X., Gu, X., Yu, H., Long, A., Tiando, D. S., Ou, S., Li, J., Rong, Y., Tang, G., Zheng, Y., Shi, M., Wang, M., Wang, X., & Huang, C. (2021). The Spatial and Temporal Evolution and Drivers of Habitat Quality in the Hung River Valley. Land, 10(12), 1369. https://doi.org/10.3390/land10121369