Abstract
The Brazilian Savannah, also known as Cerrado Biome, is a hotspot for Brazilian biodiversity. The hypothesis tested in this study is that there are diverse routes of soil uses for agriculture production in Cerrado, derived mainly from areas with pasture (natural and planted) due to the decrease in Cerrado deforestation in the last 20 years (from 2000 to 2020). The aim of this study was (i) to determine the profile of crop production in Brazilian Cerrado; (ii) to demonstrate the routes of soil uses during the last 20 years; (iii) to demonstrate the increase of soybean and corn production in Cerrado. The design of the study was based on data of (i) the accumulation of biomass and carbon in Cerrado; (ii) production area and yield of corn, soybean, coffee, sugarcane, cotton, and pasture (natural and planted); (iii) Cerrado deforestation. Results showed that the vegetation of Cerrado promotes a higher accumulation of biomass and carbon on the subsurface, followed by accumulation in the surface, deadwood, and litter. In the last 20 years, there has been a reduction of 75% in deforestation and an increase of 66% in crop areas and 78% in crop yield. However, there was no clear reduction in deforestation specifically in the Matopiba region. In Minas Gerais/MG, Goiás/GO, and Mato Grosso/MT, there were higher productions of coffee/MG, soybean/MT, corn/MT, sugarcane/MG-GO, and cotton/MT. Planted pasture (and not natural pasture) covered the larger areas, representing 75% of the total area with pasture. The low routes of soil uses from deforestation to (i) planted pasture and (ii) crop production explained the decrease in deforestation. The increases in yield and crop areas are explained by the routes from pasture (planted and natural) to agriculture. Our results provided clear insights that programs of Cerrado preservation should continue the decrease of deforestation with the sustainable development in agriculture, mainly in the Matopiba region where there was no clear decrease in deforestation in the last 20 years.
1. Introduction
The exploitation and conservation of natural resources are frequently discussed globally, mainly in developing countries (like Brazil), due to the pressure of progress and rapid economic development [1]. Between 1990 and 2000, the deforestation rate was 8 million ha yr−1 in tropical forests [2], and 6 million ha yr−1 in humid tropical forests [3,4]. Meyfroidt and Lambin showed that the global rates of tropical deforestation are decreasing (after 2000) with a tendency to transition from deforestation to reforestation. However, between August 2018 and July 2019, the Amazônia and Cerrado lost 16.1 thousand km2 of forest, both biomes located in Brazil [5].
Cerrado is the Portuguese word that describes central Brazil’s plateau with woodlands, savannas, grasslands, galleries, and dry forests [6]. Cerrado occupies about 24% of the Brazilian territory, with approximately 200 million hectares [7]. The vegetation is formed by the combination of different structural forms divided into five main types: (i) campo limpo (Cerrado grassland); (ii) campo sujo (Cerrado shrubland); (iii) campo Cerrado (low tree and shrub Cerrado); (iv) Cerrado (Cerrado stricto sensu), and (v) and Cerradão (Cerrado woodland) [8]. Cerrado is considered a Brazilian hotspot due to the high biodiversity of plants and animals (endemic), and several anthropogenic threats [9].
In Brazil, the increasing global demand for food, fiber, and energy promotes pressure on Cerrado due to the adequate conditions of climate and vast areas for agricultural production. The total deforested area of Cerrado, considering the original area, represents a loss of approximately 50% (approximately 2 million km2) [7]. The deforestation of Cerrado promotes a drastic reduction in the biodiversity of fauna and flora, mainly caused by the conversion from Cerrado to pasture/agriculture [10]. Deforestation also contributes to increase the greenhouse emissions to the atmosphere [11]. Woodwell et al. showed that the global deforestation between 1860 and 1980 emitted between 135 and 228 1015 g C, and about 80% was due to deforestation in the tropics [3]. Achard et al. estimated that humid tropical forests and tropical forests emitted about 0.64 ± 0.21 and 0.96 Gt C year−1, respectively, from 1990 to 1997. Most of the carbon released into the atmosphere is carbon dioxide (CO2), methane (CH4), and carbon monoxide (CO) [12]. Both CO2 and CH4 are derived by the organic matter decomposition or burning of vegetation [13]. Cerrado is responsible for the storage of about 5.9 billion tons of carbon in its vegetation and another 23.8 billion tons in its soils [14]. Therefore, acts that impact the Cerrado influence climate conditions globally, significantly impacting fauna and flora.
In the opposite direction of preservation, the increase of the world population is expected to achieve 9.7 billion in 2050, and a peak at 11 billion around 2100 [15]. New agricultural areas have been opened to guarantee the food security of the world population [16]. The agriculture production in Cerrado represents around 60% of the Brazilian agricultural production, led by the production of soybean, corn, cotton, and sugarcane [17]. Agriculture production has grown by 6.4% per year since the 1970s in Cerrado and is responsible for approximately 42% of the national Gross Domestic Product, relative to Brazilian agribusiness production [18]. After 1990, new soybean areas began to appear in the regions of Mato Grosso and Matopiba [19]. The Matopiba is the new agricultural frontier in Brazil, with portions of Maranhão, Tocantins, Piauí, and Bahia. During 2003 and 2013, cropland agriculture increased from 1.2 to 2.5 million ha, with 74% of new croplands sourced from previously intact Cerrado vegetation [20]. There is an expectation that grain production will continue to increase in Cerrado in the next years. Studies that demonstrate the profile, alternatives, and possible routes of soil uses to increase the production (or productivity) of food, fiber, and energy are requested to provide clear insights to guide sustainable agriculture and decision-making, which justifies our study.
The hypothesis tested in this study is that there are diverse routes of soil uses for the crop productions in Cerrado, derived mainly from areas with pasture (natural and planted) due to the low deforestation of Cerrado in the last 20 years (from 2000 to 2020). The aim of this study was (i) to determine the profile of crop production in Brazilian Cerrado; (ii) to demonstrate the routes of soil uses during the last 20 years (from 2000 to 2020); (iii) to demonstrate the increase of the main agricultural productions in Brazilian Cerrado.
2. Materials and Methods
2.1. Study Area and Their Characteristics
The study monitored the agriculture production in Cerrado, Brazil, located in the states of Minas Gerais (MG), Goiás (GO), Mato Grosso (MT), Tocantins (TO), Maranhão (MA), Bahia (BA), Mato Grosso do Sul (MS), Piauí (PI), São Paulo (SP), and Distrito Federal. The climate in Cerrado is predominantly classified as Aw (tropical wet and dry or savanna climate), according to the Köppen-Geiger classification, with an annual precipitation average of 1600 mm (from 750 to 2000 mm) and temperature between 22 and 27 °C.
The design of the study was based on data of the production area and yield of corn, soybean, coffee, sugarcane, and cotton. The design also contemplated the pasture areas (natural and planted) and deforestation from 2000 to 2020 (Figure 1). The profile was focused on production of food (corn, soybean, coffee, and sugarcane) and fiber (cotton), and pasture in Minas Gerais, Goiás, Mato Grosso, Tocantins, Maranhão, Bahia, Mato Grosso do Sul, and Piauí. We did not consider São Paulo and Distrito Federal data due to the low percentage of Brazilian Cerrado area.
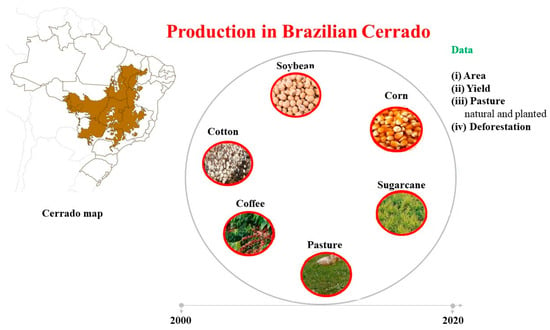
Figure 1.
Design of study with the production profile of food (corn, soybean, sugarcane, and sugarcane) and fiber (cotton), and pasture (natural and planted) in Brazilian Cerrado from 2000 to 2020.
2.2. Cerrado Deforestation
Cerrado characterization was based on the technical report developed by the Brazilian Ministry of the Environment [21]. Data of biomass and carbon were collected to demonstrate the accumulation in the surface, subsurface, deadwood, litter, and total (sum). The biomass ratio in the surface, subsurface, deadwood, and litter was calculated using Equation (1). Where AB is the accumulated biomass (Mg dry matter ha−1); CB is the accumulated carbon in biomass (Mg C ha−1).
Ratio biomass C (Mg C−1) = AB⁄CB
The annual deforestation of Cerrado was monitored from 2000 to 2020. The data from 2000 and 2020 were collected from the PRODES program for monitoring vegetation suppression (PRODES-Cerrado), developed by the INPE (Instituto Nacional de Pesquisas Espaciais), and available in Terrabrasilis [22]. PRODES-Cerrado presents accurate and reliable data [9,23]. We calculated the total deforestation of Cerrado by summing of data from 2000 to 2020 in all states. Deforestation was considered when there was a conversion of natural areas with forest formations into other land use categories using Landsat-5 satellite data images with a spatial resolution of about 30 m by 30 m. The forests were characterized as an area with a predominance of tree species with canopy formation.
2.3. Agriculture Characterization
The data of area and yield were collected from the Brazilian Institute of Geography and Statistics, IBGE [24], and National Supply Company, CONAB [25]. Data of area and yield of sugarcane (stalk yield) and cotton were monitored in the Sidra platform of the IBGE, while the data of area and yield of soybean, corn, and coffee (all grains) were monitored in the historic series in the CONAB. The corn data were separated into corn produced in summer (1st crop) and corn produced in winter (2nd crop).
Data of pasture areas were obtained in the agricultural census of IBGE, separated into natural and planted pasture in Cerrado, considered as (i) natural pasture, areas with no pasture planting, even if it had been cleaned, graded, used, or destined for grazing animals; (ii) planted pasture, corresponding to the planted area or area in preparation for the grazing of animals existing in the establishment. Available data of natural and planted pasture were obtained from 1996, 2006, and 2017, and we used models to demonstrate the reality from 2000 to 2020 (Table S1). Data of pasture separated into natural, no degraded planted pasture, and degraded planted pasture were obtained from 2006 in the IBGE agricultural census in the IBGE Sidra platform. Such monitoring was not performed in other years. No degraded planted pasture included pasture in the process of recovery; degraded pasture included areas with erosion, invasive plants, and termite mounds.
2.4. Calculus and Data Analyses
The quality of the dataset was tested using the data normality (Shapiro–Wilk test; p < 0.05) and homogeneity of variance (Bartlett test; p < 0.05). The annual variabilities of deforestation, agriculture soil used, and pasture were tested by the linear and quadratic models. When the determination coefficient (R2) of the models was higher than 70%, the model more parsimonious to explain the annual dynamics was used.
The routes of deforestation, pasture (natural and planted), and crops were monitored using the data of all years and states. The data of deforestation and pasture were used as roots and correlated with crops (Pearson correlation test; p < 0.01), representing the results in the tree grafo (adapted). The routes between crops were linearly correlated and represented by Hamiltonian Cycle (Hamiltonian route), described as a closed grafo where every k-apex is visited exactly once. The k-apexes in both route analyses were represented by a percentual increase from 2000 to 2020.
All statistical analysis was performed in R (version 4.0.0; R Foundation for Statistical Computing, Vienna, Austria) and Python (version 3.8.3; Python Software Foundation, Wilmington, DE, USA).
3. Results
3.1. Cerrado Vegetation
In Cerrado, there was a total biomass accumulation of 164.5 Mg dry matter ha−1 with higher biomass accumulation on the subsurface (64.3 Mg dry matter ha−1), followed by accumulation in the surface (48.4 Mg dry matter ha−1), litter (26.3 Mg dry matter ha−1), and deadwood (25.7 Mg dry matter ha−1), Figure 2A.
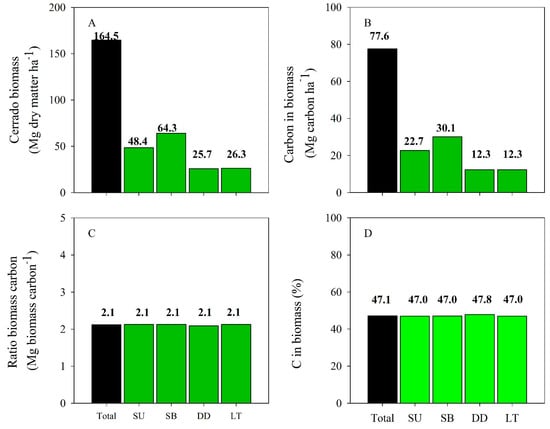
Figure 2.
Biomass (Mg dry matter ha−1), carbon in biomass (Mg carbon ha−1), ratio biomass carbon (Mg biomass carbon−1), and carbon in biomass (%) in Cerrado vegetation in surface (SU), subsurface (SB), deadwood (DD), litter (LT), and total (sum of all).
The biomass accumulated on surface, subsurface, deadwood, and litter represents a percentage of 29%, 39%, 16%, and 16%, respectively, in accumulated total (Figure 2A). As a consequence, the total C stock was 77.6 Mg C ha−1, with higher stocks of C in biomass found on the subsurface (30.1 Mg C ha−1), surface (22.7 Mg C ha−1), deadwood (12.3 Mg C ha−1), and litter (12.3 Mg C ha−1), Figure 2B. The biomass C ratio was 2.1 Mg biomass carbon−1 (Figure 2C), and the C percentual in biomass varied from 47.0% to 47.8% (Figure 2D).
In 20 years, there was total deforestation of 290,631 km2, with higher deforestation in MG, GO, and MT with a total of 45,676, 45,957, and 47,225 km2, respectively. The lower deforestations were noticed in MS and PI with a total of 20,033 and 16,275 km2, respectively (Figure 3A).
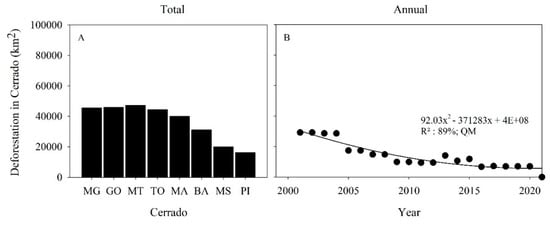
Figure 3.
Total deforestation of Cerrado (km2) in Minas Gerais (MG), Goiás (GO), Mato Grosso (MT), Tocantins (TO), Maranhão (MA), Bahia (BA), Mato Grosso do Sul (MS), and Piauí (PI) from 2000 to 2020. QM represents quadratic model. Total represents the sum of all years between 2000 and 2020.
The annual deforestation fitted a quadratic response with a decrease in deforestation from 2000 to 2020, representing a reduction of 75%, from 29,233 km2 in 2000 to 7038 km2 in 2020 (R2: 89%). The highest deforestation occurred between 2000 and 2004 with a total area of 115,740 km2 deforested, representing 40% of total deforestation in the last 20 years (Figure 3B).
In MG, GO, MT, and MS, there was a quadratic reduction in deforestation from 2000 to 2020 with an R2 higher than 82%, and a respective reduction of 93%, 90%, 77%, and 78% (Figure 4). However, there was a linear reduction in deforestation in BA from 2288 km2 in 2000 to 781 km2 in 2000, representing a reduction of 65%. In contrast, there was constant deforestation in TO, MA, and PI with an annual average of 2217, 2001, and 817 km2, respectively (Figure 4).
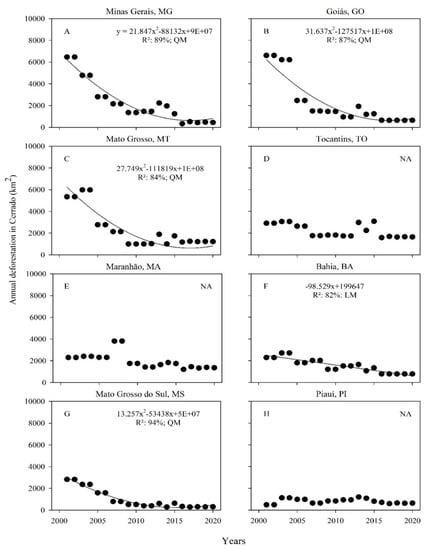
Figure 4.
Annual deforestation (km2) in Minas Gerais, Goiás, Mato Grosso, Tocantins, Maranhão, Bahia, Mato Grosso do Sul, and Piauí from 2000 to 2020. QM and NA represent quadratic and non-adjusted models, respectively.
3.2. Agriculture Characterization
In Cerrado, there was an increase of 66% in agricultural land with soybean, corn, cotton, sugarcane, and coffee from 2000 to 2020, corresponding to 13,630 thousand hectares in 2000 to 40,319 thousand hectares in 2020 (Figure 5).
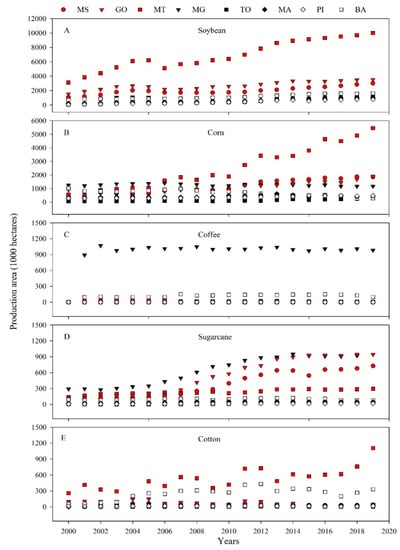
Figure 5.
Production area of the Cerrado (1000 hectares) in Minas Gerais (MG), Goiás (GO), Mato Grosso (MT), Tocantins (TO), Maranhão (MA), Bahia (BA), Mato Grosso do Sul (MS), and Piauí (PI) of soybean, corn, coffee, sugarcane, and cotton from 2000 to 2020.
Soybean and corn occupied the largest crop production areas in the last 20 years, with a total production area of 22,646 and 11,874 thousand hectares in 2020, corresponding to an annual average of 16,168 and 8025 thousand ha year−1 (Table S2).
MT was the main area responsible for the production of soybean and corn with an annual area of 7275 and 2651 thousand ha year−1, respectively (Table S2). In MT, there was a linear increase in the annual production area of soybean and corn from 2000 to 2020, representing a respective increase of 70% and 90% (Figure 5A,B).
For coffee, MG had the higher production area with an average of 1004 thousand hectares year−1 (Table S2; Figure 5C). The areas targeted to sugarcane presented an increase after 2008, mainly in MG, GO, and MS, with 35%, 56%, and 65%, respectively, comparing the data from 2008 to 2020 (Figure 5D).
There were higher areas with cotton in MT and BA with a constant area of 565 and 266 thousand hectares year−1, respectively (Figure 5E). In general, agriculture areas in Cerrado were occupied by soybean > corn > sugarcane > coffee > cotton in the last 20 years (Table S2).
In Cerrado, there was also an increase of 78% in yield of soybean, corn, cotton, sugarcane, and coffee from 2000 to 2020 (Figure 6). Sugarcane led with a total yield of 236,023 thousand tons in 2020 and an annual yield of 154,849 thousand tons year−1 (Table S2).
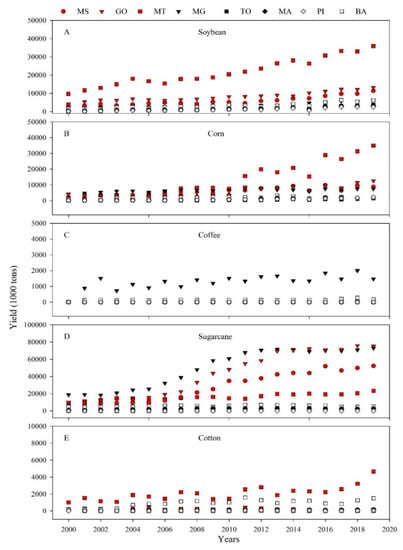
Figure 6.
Annual crop yield of the Cerrado (1000 tons) in Minas Gerais (MG), Goiás (GO), Mato Grosso (MT), Tocantins (TO), Maranhão (MA), Bahia (BA), Mato Grosso do Sul (MS), and Piauí (PI) of soybean, corn, coffee, sugarcane, and cotton from 2000 to 2020.
Annual yields of soybean, corn, and cotton were similar to the production area with higher yields in MT (Figure 6A,B; Table S2). Moreover, there was an increase of sugarcane yield after 2008, mainly in MG, GO, and MS, with an increase of 34%, 56%, and 59% comparing the data of 2008 and 2020, respectively (Figure 6D).
3.3. Pasture Characterization
In Cerrado, the area with pasture (planted and natural) represented a reduction of 11% from 2000 to 2020, corresponding to 115,781 thousand hectares in 2000 to 103,102 thousand hectares in 2020 (Figure 7). If we divided the pasture into planted and natural, there was a reduction of 39% in the natural pasture (from 42,954 to 25,984 thousand hectares) and an increase of 6% in the planted pasture (from 72,827 to 77,118 thousand hectares) in the last 20 years.
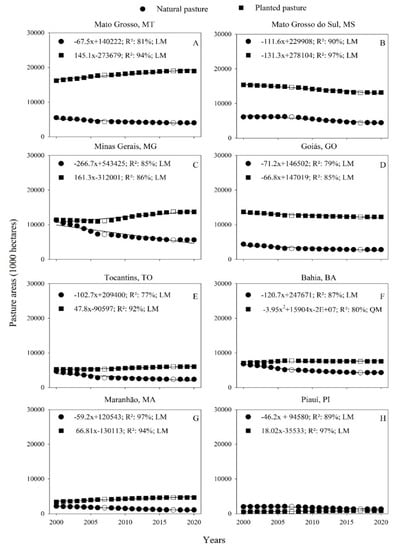
Figure 7.
Pasture areas (natural and planted; 1000 hectares) in Mato Grosso (MT), Mato Grosso do Sul (MS), Minas Gerais (MG), Goiás (GO), Tocantins (TO), Bahia (BA), Maranhão (MA), and Piauí (PI) of soybean, corn, coffee, sugarcane, and cotton from 2000 to 2020. LM and QM: linear and quadratic models. Data of 2006 and 2017 (white color) were not modeled.
Planted pasture covered the larger areas, representing 75% of the total area with pasture in all states, except in PI, where natural pasture was higher than planted pasture (Table S3).
In 20 years, there was a reduction in the area of natural pasture in all states ranging from 676 to 5661 thousand hectares between 2000 and 2020, and fitting linear reductions with R2 higher than 77% (Figure 7).
The higher reductions of natural pasture were noticed in MG, BA, and TO with a reduction of 5661, 2516, and 2304 thousand hectares, respectively, from 2000 to 2020. At the same time, PI presented the lowest reduction of 676 thousand hectares from 2000 to 2020 (Figure 7).
There were increases in the planted pasture in MT, MG, TO, MA, and PI, with areas ranging from 317 to 2814 thousand hectares between 2000 and 2020, and fitting a linear increment with R2 higher than 80%. Interestingly, in MS, GO, and BA, there were reductions of 2231 and 1413 thousand hectares in the planted pasture with a linear reduction in MS (R2: 97%) and GO (R2: 85%), while there was a quadratic reduction in BA with an R2 of 80% (Figure 7).
3.4. Routes of Soil-Uses
In Cerrado, there was a low route of soil uses from deforestation to natural pasture with an r-flux of 0.32. Interestingly, there were no significant routes between deforestation and planted pasture (r-flux: 0.12; p > 0.01), and deforestation with soybean (r-flux: −0.003; p > 0.05), corn (r-flux: −0.13; p > 0.05), sugarcane (r-flux: 0.19; p > 0.05), cotton (r-flux: 0.03; p > 0.05), and coffee (r-flux: 0.14; p > 0.05), Figure 8A.
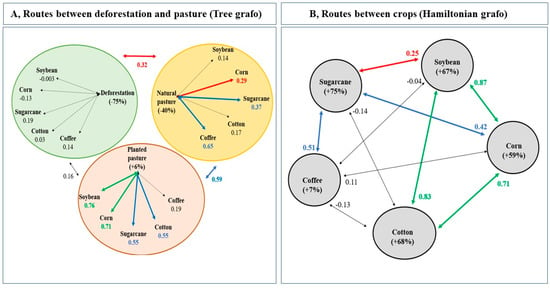
Figure 8.
Routes from deforestation and pasture (natural and planted) to crops ((A) tree grafo, adapted) and the routes between crops ((B) Hamiltonian cycle). The k-apexes in both route analyses were linearly correlated by the Pearson correlation test (p < 0.01). The results of correlation coefficient were separated into three level of routes: (i) low level (r-flux: 0–0.33; red), (ii) median level (r-flux: 0.34–0.66; blue), and high level (r-flux: 0.67–1.0; green).
The flux was medium from natural pasture to planted pasture (r-flux: 0.59; p < 0.05). In addition, there was a median flux from natural pasture to sugarcane (r-flux: 0.19; p > 0.05) and coffee (r-flux: 0.19; p > 0.05), and low flux from natural pasture to corn (r-flux: 0.29; p > 0.05), Figure 8A.
When pasture was planted, there was a high flux of conversion from planted pasture to soybean (r-flux: 0.76; p > 0.05) and corn (r-flux: 0.71; p > 0.05), and median flux from planted pasture to sugarcane (r-flux: 0.55; p > 0.05) and cotton (r-flux: 0.55; p > 0.05), Figure 8A.
The Hamiltonian routes indicated diverse routes of soil uses in the systems of rotation and succession in the last 20 years. The main routes were between soybean, corn, and cotton, with r-flux higher than 0.71 (p < 0.05), Figure 8.
There was no route between coffee and grain productions, but there was a route between coffee and sugarcane (r-flux: 0.51; p < 0.05). Moreover, there was no route of soil uses between sugarcane and cotton (r-flux: −0.14; p > 0.05). However, there were routes between sugarcane and corn (r-flux: 0.42; p < 0.05), and sugarcane and soybean (r-flux: 0.25; p < 0.05), Figure 8B.
4. Discussion
Cerrado was characterized by the high biomass accumulation with 164.5 Mg dry matter ha−1 accumulated mainly on the soil subsurface (39% of total accumulation). The Cerrado forest formations explained the high accumulated biomass with a vegetation predominance of the wooded savanna, submontane semideciduous seasonal forest, and forested savanna, which represent around 51% of the forest formations in the Cerrado biome [26,27,28]. Roquette also showed that the vegetation wooded savanna (in Portuguese: Cerrado restrito) accumulated a total of 66 Mg dry matter ha−1 with a higher accumulation in the subsurface (40 Mg dry matter ha−1) than in the surface (26 Mg dry matter ha−1).
The conditions of climate (high irradiance and air temperature, and low relative humidity) and soil (nutrient-poor, acid soils with high levels of exchangeable aluminum) in Cerrado promote the adaption of species (mainly) with the thick and tortuous trunk, grasses, and shrubs [29,30]. These characteristics of Cerrado (climate, soil, and forest phytophysiognomies) promote a lower biomass accumulation on the surface compared with other tropical biomes (i.e., Amazonia and Mata Atlântica) [31]. The increase of soil C stocks is a consequence of biomass accumulation due to deposition and decomposition of residues in soil (surface and subsurface), and C presents in the biomass of plants, directly impacting C sequestration [32].
Forests are important alternatives to the C sequestration and are considered an important and large terrestrial carbon sink [33,34]. Kauppi et al. estimated that woody vegetation promoted annual sequestration of 75–105 Tg C from 1971 to 1990. In our study, the biomass C stock in the subsurface was 30.1 Mg C ha−1, which was close to the value of soil C stocks found by [35] Bayer et al. in a clayey Oxisol (54.0 Mg ha−1) and sandy clay loam Oxisol (35.4 Mg ha−1) [36,37,38,39,40]. Ferraz-Almeida et al., Mikhael et al., and Wendling et al. showed that the soil C stocks are correlated with the accumulation of residues in surface and subsurface in Cerrado.
In the last 20 years, there has been an annual decrease in Cerrado deforestation with a reduction of 75% (from 2000 to 2020), and a total deforested area of 290,631 km2 or 29 million hectares. The decrease in Cerrado deforestation in the last 20 years was also demonstrated by [22,23,41]. Clemente et al. showed that the deforestation of Cerrado (North of Minas Gerais) was higher between 1986 and 1996, with a respective decrease between 1996 and 2009. However, even with the decrease of deforestation in the last 20 years, the total deforested area of Cerrado, considering the original area, represents a loss of approximately 50% (approximately 2 million km2 or 200 million hectares).
The urban population growth and international demands for agricultural products are the main factors associated with deforestation [42]. Part of this deforested area has been transformed into pasture and agricultural lands to produce food, fiber, and energy [23]. Environment policy with direct action in preserving protected areas, and sustainable agriculture management has been the main act to preserve Cerrado [43].
The continuous reduction of deforestation is essential to preserving Cerrado, which is considered an important hotspot for the Brazilian biodiversity, where 45% of the flora is endemic [9]. The states where there was large deforestation included MG, GO, and MT. These results were expected due to larger crop production in these states in the last 20 years [25]. In contrast, the lower deforestation was noticed in MS and PI, and a constant deforestation in TO, MA, and PI. The states of MA, TO, PI, and BA are part of Matopiba, a new frontier of Brazillian agricultural production. Our data on deforestation in Matopiba are corroborated by Parente et al. [23] and Matricardi et al. [44,45]. Noojipady et al. demonstrated that during 2010–2013, the C emissions from Matopiba contributed 45% of total Cerrado forest C emissions due to high deforestation.
In Cerrado, there was an increase of 66% in agricultural land with soybean, corn, sugarcane, cotton, and coffee from 2000 to 2020. Soybean and corn occupied the largest crop production areas in the last 20 years. Food production is important to growing food demands and advancing global food insecurity [46]. In Cerrado, there is the production of two or three crops during one crop-year in the systems of succession or rotation.
Corn was produced mainly in first crop before 2000, and in 2020 was actually produced mainly in the second crop (Figure 1 and Figure S2). The increase of the second crop is explained by the increase of soybean production in the first crop (occupying the same area), which presents better economic advances [47]. Moreover, adequate technologies have been developed to increase the corn production in the second crop [48,49], demonstrating that the corn production in the second crop will continue to increase in the next years.
In addition, corn and soybean have been planted in succession systems (soybean–corn–soybean) with the planting of soybean in summer (between September and March) and posterior planting of corn (between January and August) [50]. The corn and soybean cropping patterns promoted both crops’ yields with a frequent yield of 25% greater than that of monoculture. These positives effects are explained, mainly, by better use of nutrients [51] and water [29], and the accumulation of residues on the soil surface in systems of no tillage [30].
The production areas of sugarcane and cotton also presented a scenario of increase in the last 20 years. Brazil is considered an important producer of sugarcane and cotton [25]. Sugarcane can be used to produce ethanol and sugar, considered the second most used crop for ethanol production [52]. In 2020, Brazil produced 36 billion L yr−1 of ethanol in an area of 8.5 M hectares, considered the world’s largest sugarcane producer [25]. There is an expectation to keep growing sugarcane production in the upcoming years due to the increase in ethanol consumption [53]. For cotton, even with an increase in cotton production in Brazil, there was a variation in production in the last 20 years that is explained by the world market variation [54]. In South American, Brazil and Argentina are considered the greater players in cotton production, with exportation to countries of Asia [55].
The most important result of this study is the routes of soil uses in the last 20 years. Low routes of soil uses explain the decrease of deforestation, with low routes from deforestation to (i) planted pasture and (ii) crop production with r-fluxes lower than 0.19 (p < 0.05). These results indicated that the crop production and planted pasture were not directly responsible for the deforestation in the last 20 years.
In contrast, there is an intense route from deforestation to natural pasture that may be occurring mainly in the Matopiba region, which explains the increase of production area and the absence of a decrease in deforestation. Klink and Machado showed that ~2 million km2 of Cerrado had been transformed into pasture, cash crop agriculture, and other uses in the past 35 years.
The exploration of natural pasture is common in Cerrado, which started in the 18th century with cattle ranching activities over natural pastures. The conversion of Cerrado to pastures (even that considered natural) decreases carbon stocks and increases greenhouse gas emissions [8,39]. We can consider the route from deforestation to natural pasture is the first cycle in the soil conversion, followed by the route from natural pasture to planted pasture or agriculture uses.
The route from natural pasture to planted pasture indicates that it is common practice in the region [19]. Dias et al. showed that since 1940, planted pasture had been expanded in Brazil, especially in the Cerrado. Areas of planted pasture request fertilizer and lime due to high aluminum levels and low natural levels of nutrients in the soil [56]. The degradation of soil is a consequence of inadequate management and cattle herds [57,58]. Peron and Evangelista estimated that 80% of grassland grown presented some degradation status due to inadequate management (incorrect decision in soil tillage, forage species, and others) [23]. Parente et al. showed that already there is ~104,000 km2 of abandoned land in Cerrado derived from inadequate soil uses.
Considering that there was a reduction of 75% in deforestation (from 29,233 km2 in 2000 to 7038 km2 in 2020) and 40% in natural pasture area, and an increase of 66% in agricultural land with soybean, corn, sugarcane, cotton, and coffee, we can observe with the routes associated with the new open area in Cerrado, mainly, with the conversion of natural pasture area to agriculture land. In addition, there is ~104,000 km2 of abandoned land in Cerrado derived from in adequate soil uses [23], which also might be converted to agriculture use. This exercise demonstrates the environmental and agronomic benefits of the conversion of area with low uses (monoculture and degraded pasture), optimizing the food production and helping to achieve the principles of a circular economy—efficient use of resources with harmony between the economy, environment, and society [59].
5. Conclusions
The vegetation of Cerrado promotes a higher accumulation of biomass and carbon on the subsurface, followed by accumulation in the surface, deadwood, and litter. In the last 20 years, there has been a reduction of 75% in deforestation and an increase of 66% in agricultural land and 78% in yield. In Minas Gerais, Goiás, and Mato Grosso, there were higher productions of coffee, soybean, corn, sugarcane, and cotton. Planted pasture (not natural pasture) covered the larger areas, representing 75% of the total area with pasture.
The low routes of soil uses from deforestation to (i) planted pasture and (ii) crop production explain the decrease of deforestation. The increase in yield and agriculture areas is explained by converting pasture (planted and natural) to agricultural lands, and the intense Hamiltonian routes of soybean, corn, and cotton with the double-crop agricultural production year.
The use of Cerrado demonstrates the environmental and agronomic benefits of the conversion of area with low uses (i.e., monoculture, and degraded pasture), optimizing the food production and helping to achieve the principles of a circular economy with harmony between the economy, environment, and society. However, Cerrado preservation programs are requested to continue the decrease of deforestation with the sustainable development in agriculture, mainly in the Matopiba region where there was no clear decrease in deforestation in the last 20 years.
Supplementary Materials
The following are available online at https://www.mdpi.com/article/10.3390/land10111135/s1, Figure S1. Corn production area and yield (1st crop and 2nd crop) in Minas Gerais (MG), Goiás (GO), Mato Grosso (MT), Tocantins (TO), Maranhão (MA), Bahia (BA), Mato Grosso do Sul (MS), and Piaui (PI) of soybean, corn, coffee, sugarcane, and cotton from 2000 to 2020. Figure S2. Total corn yield and production area (1st crop and 2nd crop) in Minas Gerais (MG), Goiás (GO), Mato Grosso (MT), Tocantins (TO), Maranhão (MA), Bahia (BA), Mato Grosso do Sul (MS), and Piaui (PI) of soybean, corn, coffee, sugarcane, and cotton from 2000 to 2020. Figure S3. Total area with natural pasture (NP), planted pasture (No-degraded, No-DPP; and degraded, DPP) in Minas Gerais (MG), Goiás (GO), Mato Grosso (MT), Tocantins (TO), Maranhão (MA), Bahia (BA), Mato Grosso do Sul (MS), and Piaui (PI) of soybean, corn, coffee, sugarcane, and cotton in 2006. Table S1. Areas with pasture (natural and planted) in Minas Gerais (MG), Goiás (GO), Mato Grosso (MT), Tocantins (TO), Maranhão (MA), Bahia (BA), Mato Grosso do Sul (MS), and Piaui (PI) in 1996, 2006, and 2017. Table S2. Annual production area and yield of the Cerrado in Mato Grosso (MT), Mato Grosso do Sul (MS), Minas Gerais (MG), Goiás (GO), Tocantins (TO), Bahia (BA), Maranhão (MA), and Piauí (PI) of soybean, corn, coffee, sugarcane, and cotton from 2000 to 2020. Table S3. Annual area of the pasture (Natural and planted) in Mato Grosso (MT), Mato Grosso do Sul (MS), Minas Gerais (MG), Goiás (GO), Tocantins (TO), Bahia (BA), Maranhão (MA), and Piauí (PI) of soybean, corn, coffee, sugarcane, and cotton from 2000 to 2020.
Author Contributions
Conceptualization, methodology, formal analysis, data curation, writing, review and editing, R.F.-A., R.P.d.M. All authors have read and agreed to the published version of the manuscript.
Funding
This research received no external funding.
Institutional Review Board Statement
Not applicable.
Informed Consent Statement
Not applicable.
Data Availability Statement
The data can be found here: https://github.com/RiselyFerraz/Routes-of-Soil-Uses-and-Conversions-with-the-Main-Crops-in-Brazilian-Cerrado-A-Scenario-from-2000-t (accessed on 24 June 2020).
Conflicts of Interest
The authors declare no conflict of interest.
References
- Cutter, S.L.; Renwick, W.H. Exploitation Conservation Preservation: A Geographic Perspective on Natural Resource Use, 4th ed.; John Wiley & Sons Inc.: New York City, NY, USA, 2003. [Google Scholar]
- Achard, F.; Beuchle, R.; Mayaux, P.; Stibig, H.J.; Bodart, C.; Brink, A.; Carboni, S.; Desclée, B.; Donnay, F.; Eva, H.D.; et al. Determination of tropical deforestation rates and related carbon losses from 1990 to 2010. Glob. Chang. Biol. 2014, 20, 2540–2554. [Google Scholar] [CrossRef] [PubMed]
- Achard, F.; Eva, H.D.; Stibig, H.J.; Mayaux, P.; Gallego, J.; Richards, T.; Malingreau, J.P. Determination of deforestation rates of the world’s humid tropical forests. Science 2002, 297, 999–1002. [Google Scholar] [CrossRef] [PubMed]
- Meyfroidt, P.; Lambin, E.F. Global Forest Transition: Prospects for an End to Deforestation. Annu. Rev. Environ. Resour. 2011, 36, 343–371. [Google Scholar] [CrossRef]
- Oliveira, E. Desmatamentos na Amazônia e Cerrado atingem área equivalente a 11 cidades de São Paulo de agosto de 2018 a julho de 2019. Natureza, 7 January 2020; p. G1. [Google Scholar]
- Costa, W.; Fonseca, E.; Körting, T. Classifying grasslands and cultivated pastures in the brazilian cerrado using support vector machines, multilayer perceptrons and autoencoders. In Lecture Notes in Computer Science (Including Subseries Lecture Notes in Artificial Intelligence and Lecture Notes in Bioinformatics); Springer Verlag: Berlin/Heidelberg, Germany, 2015; Volume 9166, pp. 187–198. [Google Scholar]
- MMA. Mapeamento do Uso e Cobertura do Cerrado: Projeto Terra Class Cerrado; MMA: Brasilia, DF, Brazil, 2013. [Google Scholar]
- Arantes, A.E.; Ferreira, L.G.; Coe, M.T. The seasonal carbon and water balances of the Cerrado environment of Brazil: Past, present, and future influences of land cover and land use. ISPRS J. Photogramm. Remote Sens. 2016, 117, 66–78. [Google Scholar] [CrossRef]
- Menini Matosak, B.; Vargas Maretto, R.; Sehn Körting, T.; Adami, M.; Matosak, B.M.; Maretto, R.V.; Körting, T.S.; Adami, M.; Fonseca, G.L.M. Mapping Deforested Areas in the Cerrado Biome through Recurrent Neural Networks. In Proceedings of the IEEE International Geoscience and Remote Sensing Symposium, Waikoloa, HI, USA, 26 September–2 October 2020. [Google Scholar]
- Benito, N.P.; Brossard, M.; Pasini, A.; Guimarães, M.D.F.; Bobillier, B. Transformations of soil macroinvertebrate populations after native vegetation conversion to pasture cultivation (Brazilian Cerrado). Eur. J. Soil Biol. 2004, 40, 147–154. [Google Scholar] [CrossRef]
- Woodwell, G.M.; Hobbie, J.E.; Houghton, R.A.; Melillo, J.M.; Moore, B.; Peterson, B.J.; Shaver, G.R. Global deforestation: Contribution to atmospheric carbon dioxide. Science 1983, 222, 1081–1086. [Google Scholar] [CrossRef] [PubMed]
- Ferraz-Almeida, R.; Spokas, K.A.; De Oliveira, R.C. Columns and Detectors Recommended in Gas Chromatography to Measure Greenhouse Emission and O2 Uptake in Soil: A Review. Commun. Soil Sci. Plant Anal. 2020, 51, 582–594. [Google Scholar] [CrossRef]
- Von Arnold, K.; Nilsson, M.; Hånell, B.; Weslien, P.; Klemedtsson, L. Fluxes of CO2, CH4 and N2O from drained organic soils in deciduous forests. Soil Biol. Biochem. 2005, 37, 1059–1071. [Google Scholar] [CrossRef]
- MMA. PPCerrado—Plano de Ação Para Prevenção e Controle do Desmatamento e das Queimadas no Cerrado: 2a Fase (2014–2015); MMA: Brasília, DF, Brazil, 2014. [Google Scholar]
- UN. Our Growing Population. Available online: https://www.un.org/en/sections/issues-depth/population/ (accessed on 30 December 2020).
- Fróna, D.; Szenderák, J.; Harangi-Rákos, M. The Challenge of Feeding the World. Sustainability 2019, 11, 5816. [Google Scholar] [CrossRef]
- CONAB. Conab—Boletim da Safra de Grãos, 8º Levantamento—Safra 2019/20. Available online: https://www.conab.gov.br/info-agro/safras/graos/boletim-da-safra-de-graos (accessed on 24 June 2020).
- Lopes, S.A.; Daher, E. Savanas: Desafios e Estratégias para o Equilíbrio Entre Sociedade, Agronegócio e Recursos Naturais. In Agronegócio e Recursos Naturais no Cerrado: Desafios para uma Coexistência Harmônica; Faleiro, G.F., Farias Neto, A.L.F., Eds.; Embrapa Cerrados: Planaltina, Brazil, 2008; p. 1198. ISBN 978-85-7075-039-6. [Google Scholar]
- Dias, L.C.P.; Pimenta, F.M.; Santos, A.B.; Costa, M.H.; Ladle, R.J. Patterns of land use, extensification, and intensification of Brazilian agriculture. Glob. Chang. Biol. 2016, 22, 2887–2903. [Google Scholar] [CrossRef]
- Spera, S.A.; Galford, G.L.; Coe, M.T.; Macedo, M.N.; Mustard, J.F. Land-use change affects water recycling in Brazil’s last agricultural frontier. Glob. Chang. Biol. 2016, 22, 3405–3413. [Google Scholar] [CrossRef] [PubMed]
- MMA. The Submission of the E. Brazil’s Forest Reference Emission Level for Reducing Emissions from Deforestation in the Cerrado Biome for Results-Based Payments for REDD+ under the United Nations Framework Convention on Climate Change for the Acronym in Portuguese; MMA: Brasilia, DF, Brazil, 2017. [Google Scholar]
- INPE. PRODES. Available online: http://terrabrasilis.dpi.inpe.br/app/map/deforestation (accessed on 20 December 2020).
- Parente, L.; Nogueira, S.; Baumann, L.; Almeida, C.; Maurano, L.; Affonso, A.G.; Ferreira, L. Quality assessment of the PRODES Cerrado deforestation data. Remote Sens. Appl. Soc. Environ. 2021, 21, 100444. [Google Scholar] [CrossRef]
- IBGE. Levantamento Sistemático da Produção Agrícola Estatística da Produção Agrícola. Available online: https://biblioteca.ibge.gov.br/visualizacao/periodicos/2415/epag_2019_dez.pdf (accessed on 11 December 2020).
- CONAB. Conab—National Supply Company. Available online: https://www.conab.gov.br/ (accessed on 2 June 2020).
- IBGE. Censo Agropecuário 2017. Rio Janeiro; 2017. Available online: https://censos.ibge.gov.br/agro/2017/templates/censo_agro/resultadosagro/index.html (accessed on 10 December 2020).
- Eiten, G. The cerrado vegetation of Brazil. Bot. Rev. 1972, 38, 201–341. [Google Scholar] [CrossRef]
- Roquette, J.G. Distribution of biomass in cerrado and its importance for carbon storage. Cienc. Florest. 2018, 28, 1350–1363. [Google Scholar] [CrossRef]
- Teixeira, A.W.; Isabel, D.d.S.Q.; Risely, F.A.; Fernanda, P.M.; Joseph, E.R.M.; Elias, N.B. Hydro-physical properties and organic carbon of a yellow oxysol under different uses. Afr. J. Agric. Res. 2016, 11, 2547–2554. [Google Scholar] [CrossRef]
- Martins, F.P.; Almeida, R.F.; Mikhael, J.E.R.; Queiroz, I.D.d.S.; Teixeira, W.G.; Borges, E.N. Correlação do COT e porosidade em Latossolo com diferentes usos e manejos na região de Uberaba. Rev. Agrogeoambiental 2014, 7, 81–90. [Google Scholar] [CrossRef][Green Version]
- Cunha, G.d.M.; Gama-Rodrigues, A.C.; Gama-Rodrigues, E.F.; Velloso, A.C.X. Biomass, carbon and nutrient pools in montane atlantic forests in the north of Rio de Janeiro state, Brazil. Rev. Bras. Cienc. do Solo 2009, 33, 1175–1185. [Google Scholar] [CrossRef]
- Almeida, R.F.; Sanches, B.C. Disponibilidade de carbono orgânico nos solos do cerrado brasileiro. Sci. Agrar. Paranaensis 2014, 13, 259–264. [Google Scholar] [CrossRef]
- Espírito-Santo, F.D.B.; Gloor, M.; Keller, M.; Malhi, Y.; Saatchi, S.; Nelson, B.; Junior, R.C.O.; Pereira, C.; Lloyd, J.; Frolking, S.; et al. Size and frequency of natural forest disturbances and the Amazon forest carbon balance. Nat. Commun. 2014, 5, 1–6. [Google Scholar] [CrossRef]
- Kauppi, P.E.; Mielikäinen, K.; Kuusela, K. Biomass and carbon budget of european forests, 1971 to 1990. Science 1992, 256, 70–74. [Google Scholar] [CrossRef] [PubMed]
- Amado, T.J.C.; Bayer, C.; Conceição, P.C.; Spagnollo, E.; de Campos, B.-H.C.; da Veiga, M. Potential of Carbon Accumulation in No-Till Soils with Intensive Use and Cover Crops in Southern Brazil. J. Environ. Qual. 2006, 35, 1599–1607. [Google Scholar] [CrossRef] [PubMed]
- Bayer, C.; Martin-Neto, L.; Mielniczuk, J.; Pavinato, A.; Dieckow, J. Carbon sequestration in two Brazilian Cerrado soils under no-till. Soil Tillage Res. 2006, 86, 237–245. [Google Scholar] [CrossRef]
- De-Almeida, R.F.; Silveira, C.H.; Mota, R.P.; Arruda, E.M.; Nave, E.R.; Souza, L.C.; Mendonca, E.S.; Wendling, B. Sugarcane residue incubated in soil at different temperatures and nitrogen fertilization. Aust. J. Crop Sci. 2015, 9, 781–789. [Google Scholar]
- Mikhael, J.E.R.; Almeida, R.F.; Franco, F.d.O.; Camargo, R.O.; Wendling, B. Recalcitrant carbon and nitrogen in agriculture soils with residue accumulation and fertilization under tropical conditions. Biosci. J. 2019, 35, 732–740. [Google Scholar] [CrossRef]
- Wendling, B.; Jucksch, I.; De Sá Mendonça, E.; De Almeida, R.F.; Alvarenga, R.C. Simulação dos estoques de Carbono e Nitrogênio pelo Modelo Century em Latossolos, no Cerrado Brasileiro. Rev. Cienc. Agron. 2014, 45, 238–248. [Google Scholar] [CrossRef]
- Ferraz-Almeida, R.; Silveira, C.H.; Mota, R.P.; Moitinho, M.; Arruda, E.M.; Mendonça, E.D.S.; La Scala, N.; Wendling, B. For how long does the quality and quantity of residues in the soil affect the carbon compartments and CO2-C emissions? J. Soils Sediments 2016, 16, 2354–2364. [Google Scholar] [CrossRef]
- Clemente, C.M.S.; do Espírito-Santo, M.M.; Leite, M.E. Estimates of deforestation avoided by protected areas: A case study in Brazilian tropical dry forests and Cerrado. Landsc. Res. 2020, 45, 470–483. [Google Scholar] [CrossRef]
- Defries, R.S.; Rudel, T.; Uriarte, M.; Hansen, M. Deforestation driven by urban population growth and agricultural trade in the twenty-first century. Nat. Geosci. 2010, 3, 178–181. [Google Scholar] [CrossRef]
- Trigueiro, W.R.; Nabout, J.C.; Tessarolo, G. Uncovering the spatial variability of recent deforestation drivers in the Brazilian Cerrado. J. Environ. Manag. 2020, 275, 111243. [Google Scholar] [CrossRef]
- Matricardi, E.A.T.; Aguiar, A.S.; Miguel, E.P.; Angelo, H.; Gaspar, R.D.O. Modelagem do Desmatamento na Região do Matopiba. Nativa 2018, 6, 198. [Google Scholar] [CrossRef]
- Noojipady, P.; Morton, C.D.; Macedo, N.M.; Victoria, C.D.; Huang, C.; Gibbs, K.H.; Bolfe, L.E. Forest carbon emissions from cropland expansion in the Brazilian Cerrado biome. Environ. Res. Lett. 2017, 12, 025004. [Google Scholar] [CrossRef]
- FAO. Dimensions of Need—Human Nutrition: Key to Health and Development. Available online: http://www.fao.org/3/u8480e/U8480E04.htm (accessed on 22 December 2020).
- Meade, B.; Puricelli, E.; McBride, W.D.; Valdes, C.; Hoffman, L.; Foreman, L.; Dohlman, E. Corn and Soybean Production Costs and Export Competitiveness in Argentina, Brazil, and the United States. USDA Econ. Inf. Bull. 2016, 154, 52. [Google Scholar]
- De Faria, I.K.P.; Vieira, J.L.V.; Tenelli, S.; De Almeida, R.E.M.; Campos, L.J.M.; Da Costa, R.V.; Zavaschi, E.; De Almeida, R.F.; Carneiro, L.D.M.; Otto, R. Optimal plant density and nitrogen rates for improving off-season corn yields in Brazil. Sci. Agric. 2019, 76, 344–352. [Google Scholar] [CrossRef]
- Altarugio, L.M.; Savieto, J.; Machado, B.D.A.; Migliavacca, R.A.; Almeida, R.F.; Zavaschi, E.; Carneiro, L.D.M.E.S.; Vitti, G.C.; Otto, R. Optimal Management Practices for Nitrogen Application in Corn Cultivated During Summer and Fall in the Tropics. Commun. Soil Sci. Plant Anal. 2019, 50, 662–672. [Google Scholar] [CrossRef]
- Duarte, A.P.; Kappes, C. Evolution of Maize Cultivation Systems in Brazil; IPNI: Piracicaba, Brazil, 2015. [Google Scholar]
- Ferraz-Almeida, R.; da Silva, N.L.; Wendling, B. How Does N Mineral Fertilizer Influence the Crop Residue N Credit? Nitrogen 2020, 1, 99–110. [Google Scholar] [CrossRef]
- Yang, L.; Deng, Y.; Wang, X.; Zhang, W.; Shi, X.; Chen, X.; Lakshmanan, P.; Zhang, F. Global direct nitrous oxide emissions from the bioenergy crop sugarcane (Saccharum spp. inter-specific hybrids). Sci. Total Environ. 2021, 752, 141795. [Google Scholar] [CrossRef] [PubMed]
- EPE. Plano Decenal de Expansão de Energia; 2018. Available online: https://www.epe.gov.br/pt/publicacoes-dados-abertos/publicacoes/plano-decenal-de-expansao-de-energia-pde (accessed on 15 January 2021).
- Gillson, I.; Poulton, C.; Balcombe, K.; Page, S. Understanding the Impact of Cotton Subsidies on Developing Countries; MPRA: Munich, Germany, 2004. [Google Scholar]
- Hoffmann, L.V.; Kresic, I.B.; Paz, J.G.; Bela, D.A.; Tcach, N.E.; Lamas, F.M.; Sofiatti, V. Cotton Production in Brazil and Other South American Countries. In Cotton Production; Wiley: Hoboken, NJ, USA, 2019; pp. 277–295. [Google Scholar]
- Ferraz de Almeida, R.; Rodriguez Mikhael, J.E.; Oliveira Franco, F.; Fonesca Santana, L.M.; Wendling, B. Measuring the labile and recalcitrant pools of carbon and nitrogen in forested and agricultural soils: A study under tropical conditions. Forests 2019, 10, 544. [Google Scholar] [CrossRef]
- Pereira, O.; Ferreira, L.; Pinto, F.; Baumgarten, L. Assessing Pasture Degradation in the Brazilian Cerrado Based on the Analysis of MODIS NDVI Time-Series. Remote Sens. 2018, 10, 1761. [Google Scholar] [CrossRef]
- Peron, A.J.; Evangelista, A.R. Degradação de pastagens em regiões de cerrado. Ciência e Agrotecnologia 2004, 28, 655–661. [Google Scholar] [CrossRef]
- Yong, R. The circular economy in China. J. Mater. Cycles Waste Manag. 2007, 9, 121–129. [Google Scholar] [CrossRef]
Publisher’s Note: MDPI stays neutral with regard to jurisdictional claims in published maps and institutional affiliations. |
© 2021 by the authors. Licensee MDPI, Basel, Switzerland. This article is an open access article distributed under the terms and conditions of the Creative Commons Attribution (CC BY) license (https://creativecommons.org/licenses/by/4.0/).