Review

Review of Experience in Recent Studies on the Dynamics of Land Urbanisation

Department of Socio-Economic Geography, Faculty of Geoengineering, University of Warmia and Mazury in Olsztyn, Prawocheńskiego 15, 10-720 Olsztyn, Poland
*
Author to whom correspondence should be addressed.
Land 2021, 10(11), 1117; https://doi.org/10.3390/land10111117
Submission received: 15 September 2021 / Revised: 11 October 2021 / Accepted: 18 October 2021 / Published: 21 October 2021
(This article belongs to the Special Issue Recent Progress in Urbanisation Dynamics Research)

Abstract

:
Urbanisation rapidly accelerated in the 20th century. Along with the increasing dynamics of this phenomenon, the desire to know its origins and its course as well as to anticipate its effects is also growing. Investigations into the mechanisms governing urbanisation have become the subject of numerous studies and research projects. In addition, there has been a rapid increase in the number of tools and methods used to track and measure this phenomenon. However, new methods are still being sought to identify changes in space caused by urbanisation. Some of the indicators of urbanisation processes taking place include quantitative, qualitative and structural changes in land use, occurring at a certain time and place. These processes, related to human activity at a given time and in a given area, are determined by spatial diffusion, usually spreading from the city center towards the peripheral zones. Changes in land use involve the transition from less intensive to more intensive forms of land use. The constant effort to acquire new land for development, the search for alternative solutions for the location of investments and the need to determine the correct direction of development generates the need to constantly apply newer methods in the study of the dynamics of urbanisation processes. This paper presents an overview of recent studies and the most interesting—in the authors’ opinion—methods used in research into the dynamics of urbanisation processes. The main objective of the authors was to produce a compendium to guide the reader through the wide range of topics and to provide inspiration for their own research.

1. Introduction

Urbanisation is one of the most visible manifestations of global change occurring for anthropogenic reasons [1]. It can be defined as a process of population concentration, mainly in urban areas, which also determines the growth of the urban population and its share in the population of a given area. Urbanisation is described as a cultural and civilizational process reflected in the development of cities, the increase in their number, the expansion of their area, the progressive concentration of the population in their immediate vicinity, the expansion of non-agricultural sources of income, the acceptance and assimilation of urban standards, customs, etc. It is a complex and diversified process, taking place with differing intensity and speed and with different effects in various countries and regions of the world [2].
Urbanisation is both a process and a state [3]. As a process, it involves the changes in human activities and socio-economic behavior described above, etc. As a state, i.e., the result of a process, urbanisation most often refers to the number and size of urban settlement units, the proportion of the urban population in relation to the total population of the country or region (urbanisation coefficient), the concentration of the population in large cities or its dispersion, and the area occupied by city buildings [4]. These two dimensions are interrelated and are dependent on each other. It should also be noted that urbanisation is a global phenomenon, which is irreversible and inherent within human development. It is associated with the scientific and technological revolution, with the concentration of productive forces and forms of social relations, with the spread of the urban style of life, with changes in social relations and ties, with the transformation of the rural population into diversified non-agricultural groups and with the modernization of the entire settlement network [5,6].
Nowadays, urbanisation is approached as a multidimensional complex of economic, social, demographic, cultural and spatial events and phenomena leading to the growth of cities and an increase in the share of the urban population, the population concentration in spatially expanding urban areas, the concentration of economic and administrative activities generating an increase in the importance of cities, shaping specific cultural patterns of urban lifestyle and specific arrangements of landscape and architecture [7].
The study of urbanisation processes can be based on each of these dimensions. The demographic dimension of urbanisation is related to the increase in the number of city residents, caused both by rural population migration to cities and by natural growth in cities and the creation of new settlement units. With regard to rural areas, demographic urbanisation, especially in the suburban zones of highly developed countries, is related to the population outflow from cities to the countryside. The social dimension of urbanisation is expressed in the spread and deepening of the “urban lifestyle”, i.e., in attitudes, skills, behavioral patterns and even personality traits that are characteristic of metropolitan communities, both in the city area and in the countryside [8,9,10]. The economic dimension of urbanisation involves changes in occupational structure and employment. The occupational diversification of the population is becoming more pronounced in the city. The number of people employed in various services is growing at the expense of agriculture and crafts. The proportion of employment in traditional agricultural jobs is changing in rural areas in favor of non-farm jobs. All of the above dimensions of urbanisation are linked by spatial changes in the appearance and organization of the surrounding areas. Therefore, the spatial dimension of this phenomenon is one of the most interesting topics for research into the dynamics of urbanisation, since it provides a basis for inferring the causes and effects of the aforementioned aspects. The spatial dimension of urbanisation applies to both urban and rural areas. Spatial urbanisation is understood as the expansion of the urban landscape [11,12,13,14,15] and includes an increase in the urban investment area as well as the saturation of villages with urban-like infrastructure and buildings. In rural areas, spatial changes are associated with transformations in land use. The area of land used for farming is decreasing in favor of other, non-agricultural forms of use. Changes are taking place in the physiognomy of the buildings and the village morphology, as well as in the modernization of the technical infrastructure.
Current research primarily focuses on demographic and spatial urbanisation. It should be stressed that these are essentially just objectively separated manifestations of the same phenomenon. However, no spatial effects of urbanisation exist without demographic changes. The anthropogenic background of this phenomenon makes the demographic aspect an overriding factor in understanding the causes of spatial change. In practice, demographic urbanisation is measured and expressed, first of all, in the form of census-based statistics, the purpose of which is (at least in principle) is to distinguish the inhabitants of cities and towns from those living in rural areas [16]. The demographic dimension of urbanisation is related to the increase in the proportion of the urban population. Nevertheless, quantitative changes are also accompanied by qualitative ones. Changes are taking place in the gender and age structures of the population, the level of population growth, the balance of migration, the occupational structure of the population, the size of the family and its socio-professional status, and the size of the household, etc. [17] Accordingly, in recent studies, demographic urbanisation is examined in a much broader context, taking into account all the transformations occurring in demographic structures and processes, not only in quantitative but also in qualitative terms [4,18,19].
Spatial urbanisation is most often reflected in the rapid growth of cities, which has exerted pressure on land, local resources and especially on rural areas in their immediate vicinity [20,21]. The concentration of human activity in specific locations and regions favors the development of large cities and various forms of urban settlement [22]. Urban growth and transformation are driven by the forces of attraction between specific locations. This process of spatial diffusion results from interactions between multiple factors and contributes to the development of new spatial patterns [23]. This is primarily due to the specific topography of the city surroundings, the existing road network, the land ownership structure and the pace of its development. These changes are catalyzed by the development of transport networks, as well as the advantages arising from the spatial agglomeration of resources, including human resources. Urbanisation is viewed as a process of organic growth, starting in the city center and leading to the spontaneous formation of ‘mini’ urban areas, especially throughout the transport network [24]. The majority of these processes are very dynamic and cause rapid changes in the structure and organization of land use [23]. The process of urbanisation, particularly spatial urbanisation, requires the application of continuously evolving research methods and techniques, which render it possible to grasp its essence and pace. The aim of this paper is to present the most interesting, according to the authors, methods used in research on the dynamics of the spatial urbanisation processes. Sources of information employed in the analyses of urbanisation processes are described and a number of examples of the use of spatial data in analyses of urbanisation processes are presented. The solutions described apply to multiple countries and continents and the issue is a common one. Studies addressing this subject usually test new methods for a universal understanding of the urbanisation phenomenon. The added value of this paper is in the fact that it describes ready-to-use solutions in a single publication, in the form of data sources and their use in analysing urbanisation processes. This should facilitate the selection of an appropriate method and its application in research on the dynamics of urbanisation processes for many researchers. The paper presents an overview of recent research and the most interesting, according to the authors, methods used in research on the dynamics of urbanisation processes. The main aim of the article was to produce a compendium that would guide the reader through the wide range of topics and provide inspiration for their own research. The first chapter defines the concept of urbanisation. Chapter 2 presents demographic changes and the spatial dimension of urbanisation from a global perspective. Chapter 3 describes recent trends in research on urbanisation processes. Sources of information used in the analyses of urbanisation processes are described in detail in Section 3.1. Section 3.2 presents examples of applying spatial data in analyses of urbanisation processes. Section 3.3 examines the possibilities of using spatial data in the study of urbanisation processes. Discussion, conclusions and further directions for research are presented in Chapter 4.

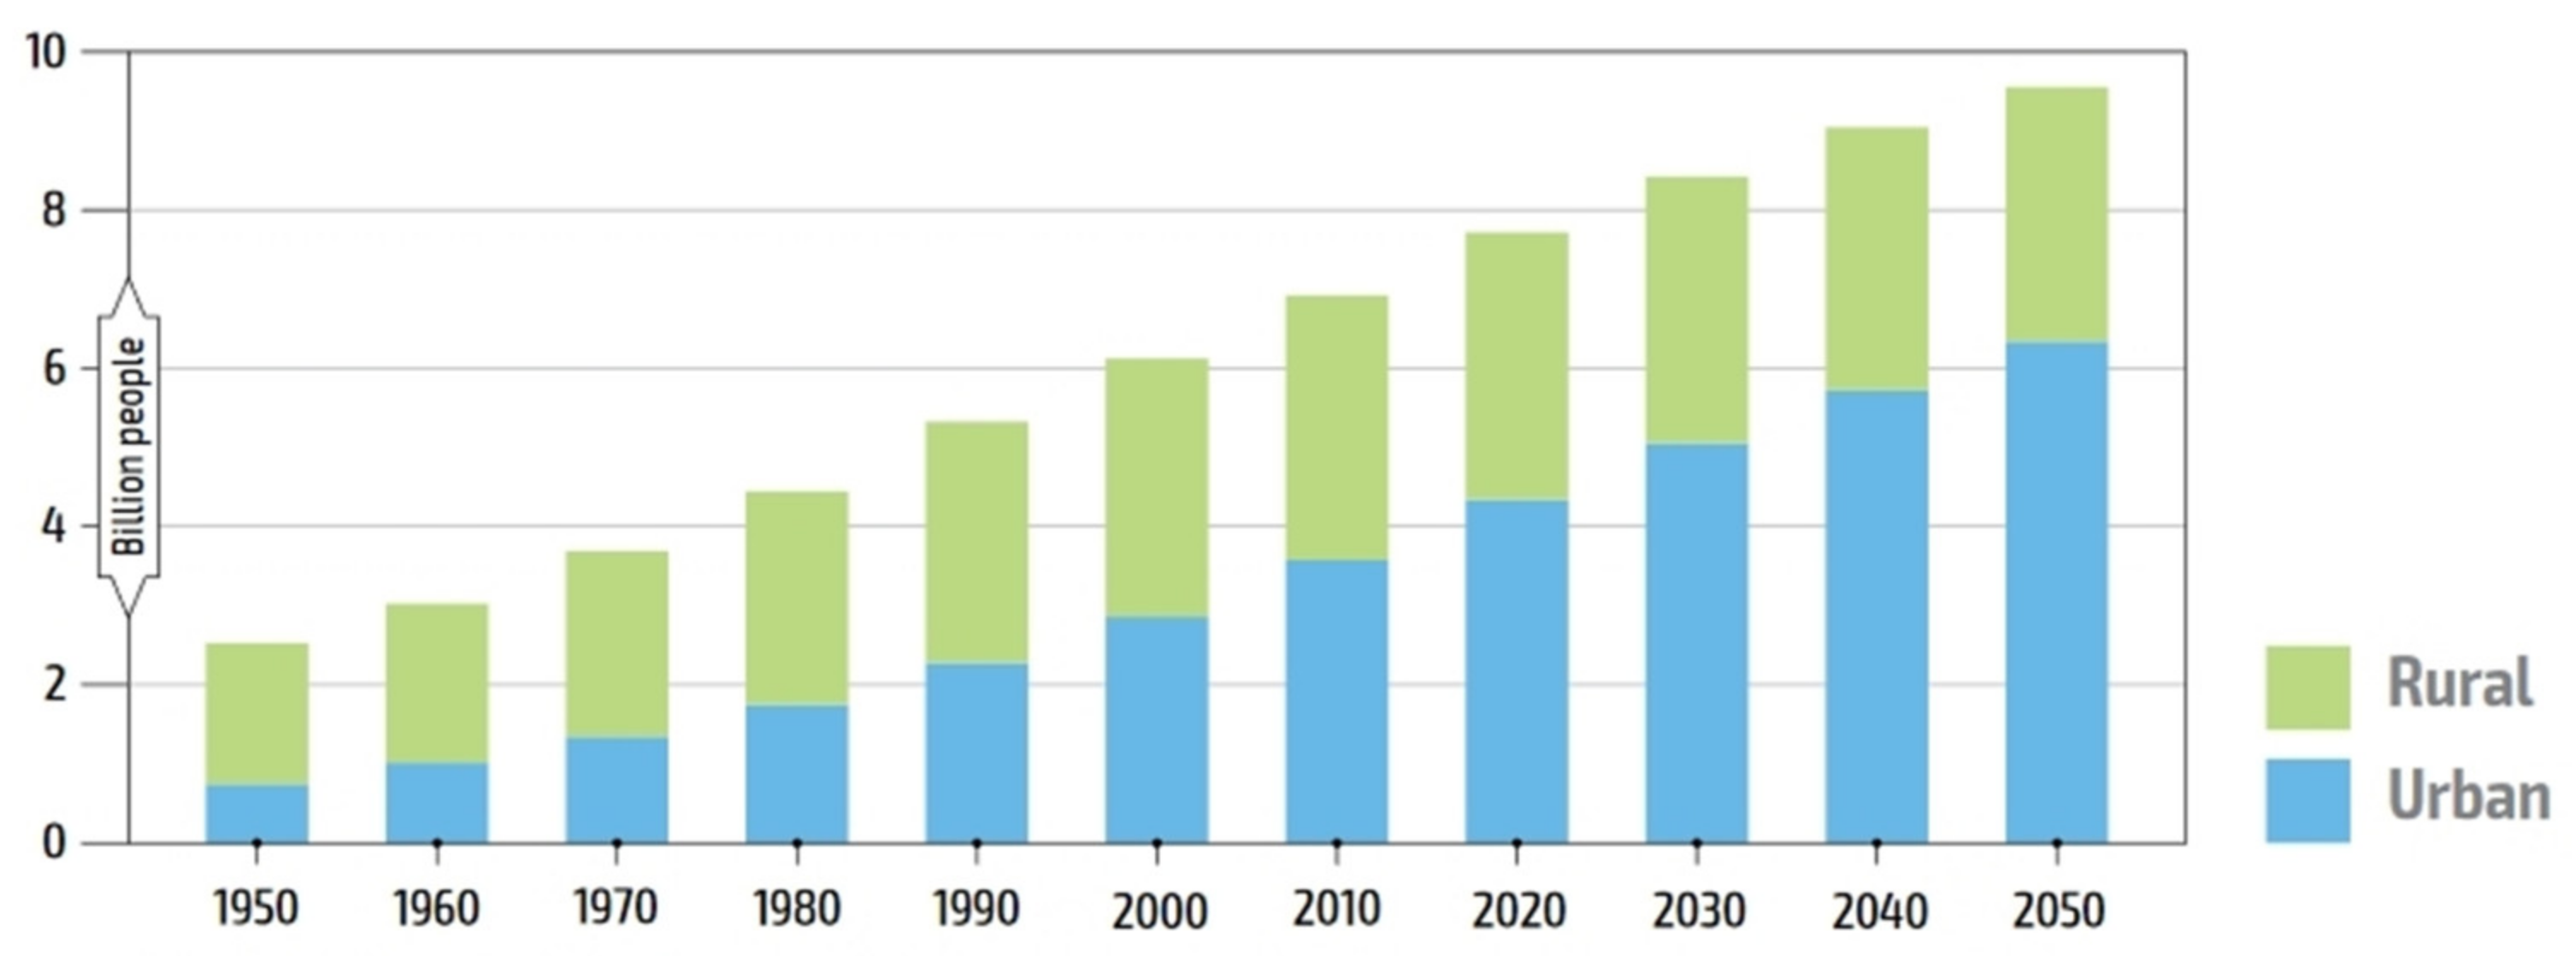
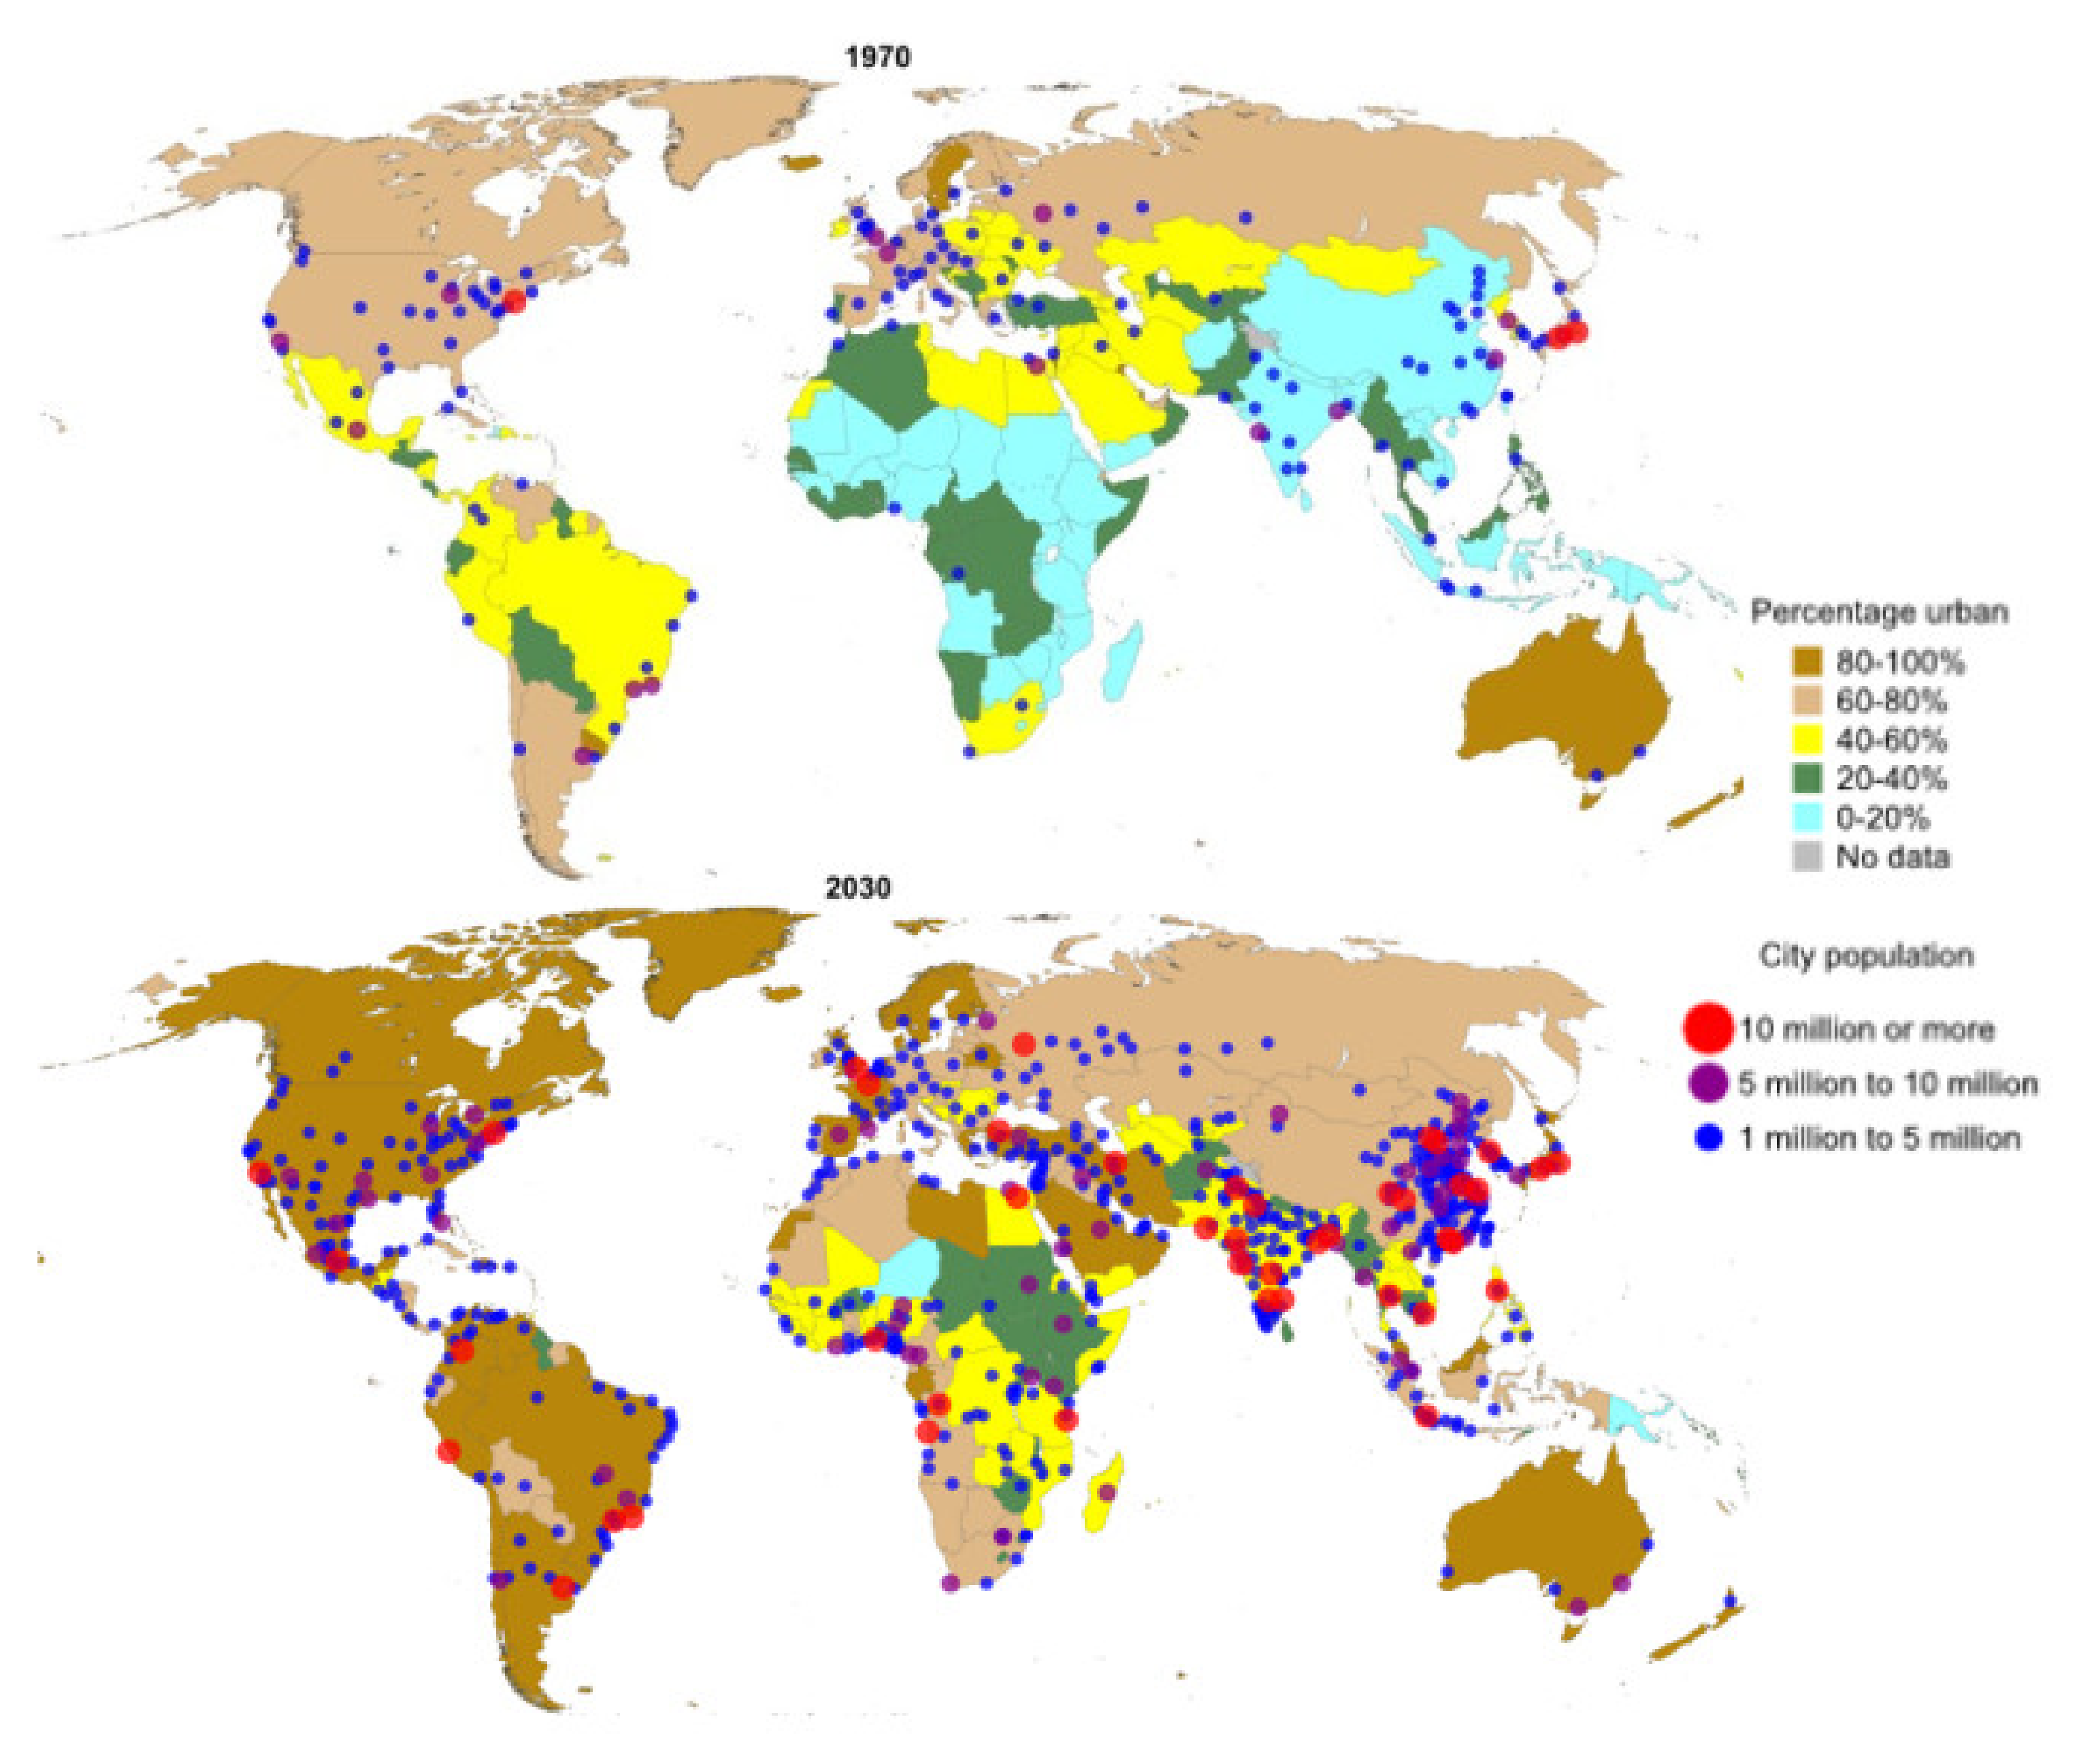
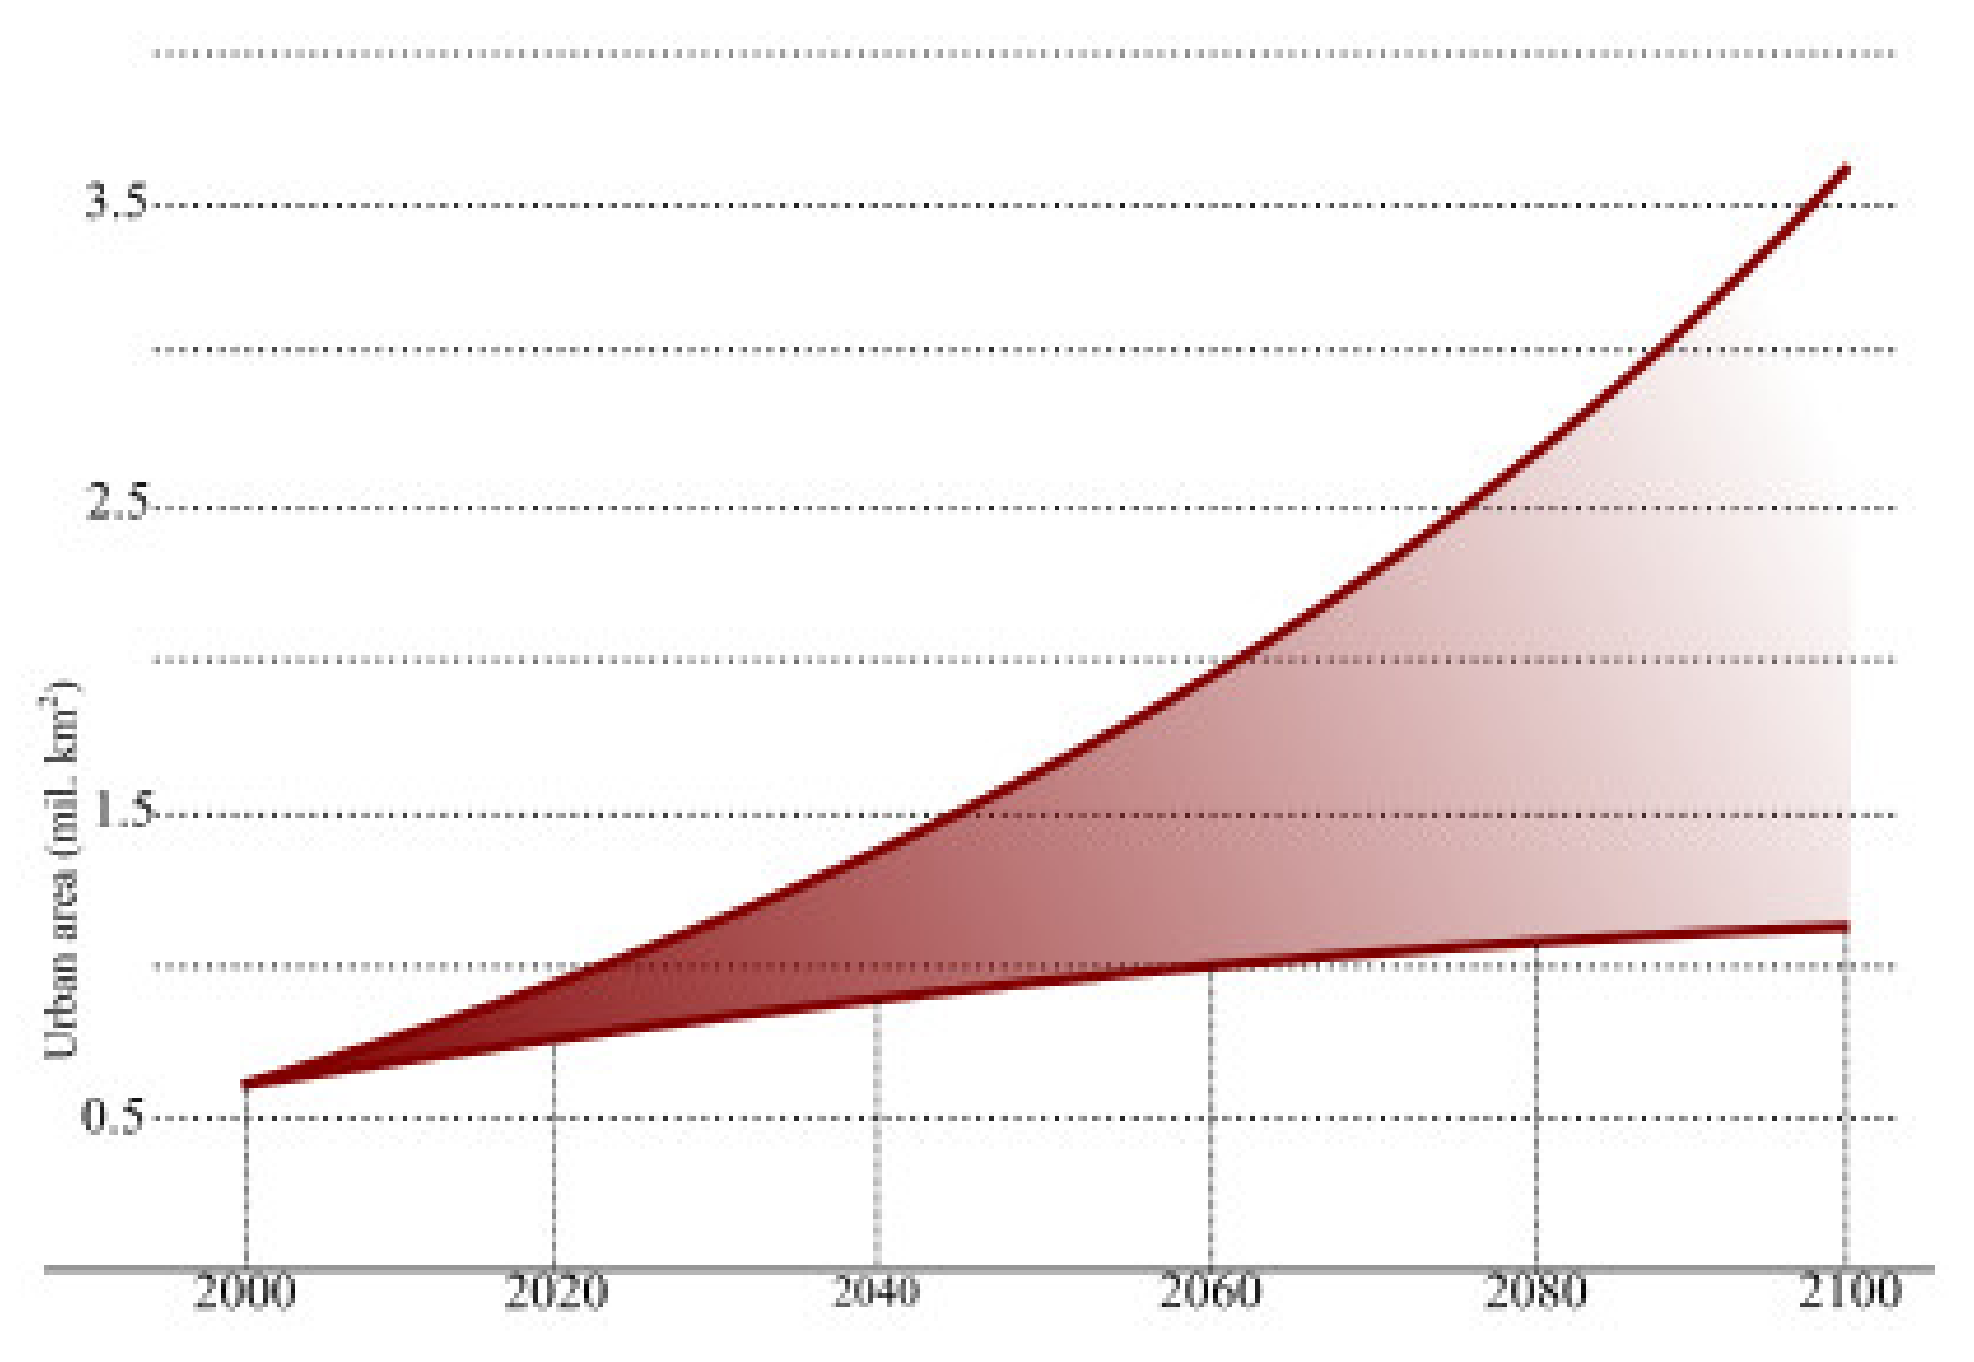
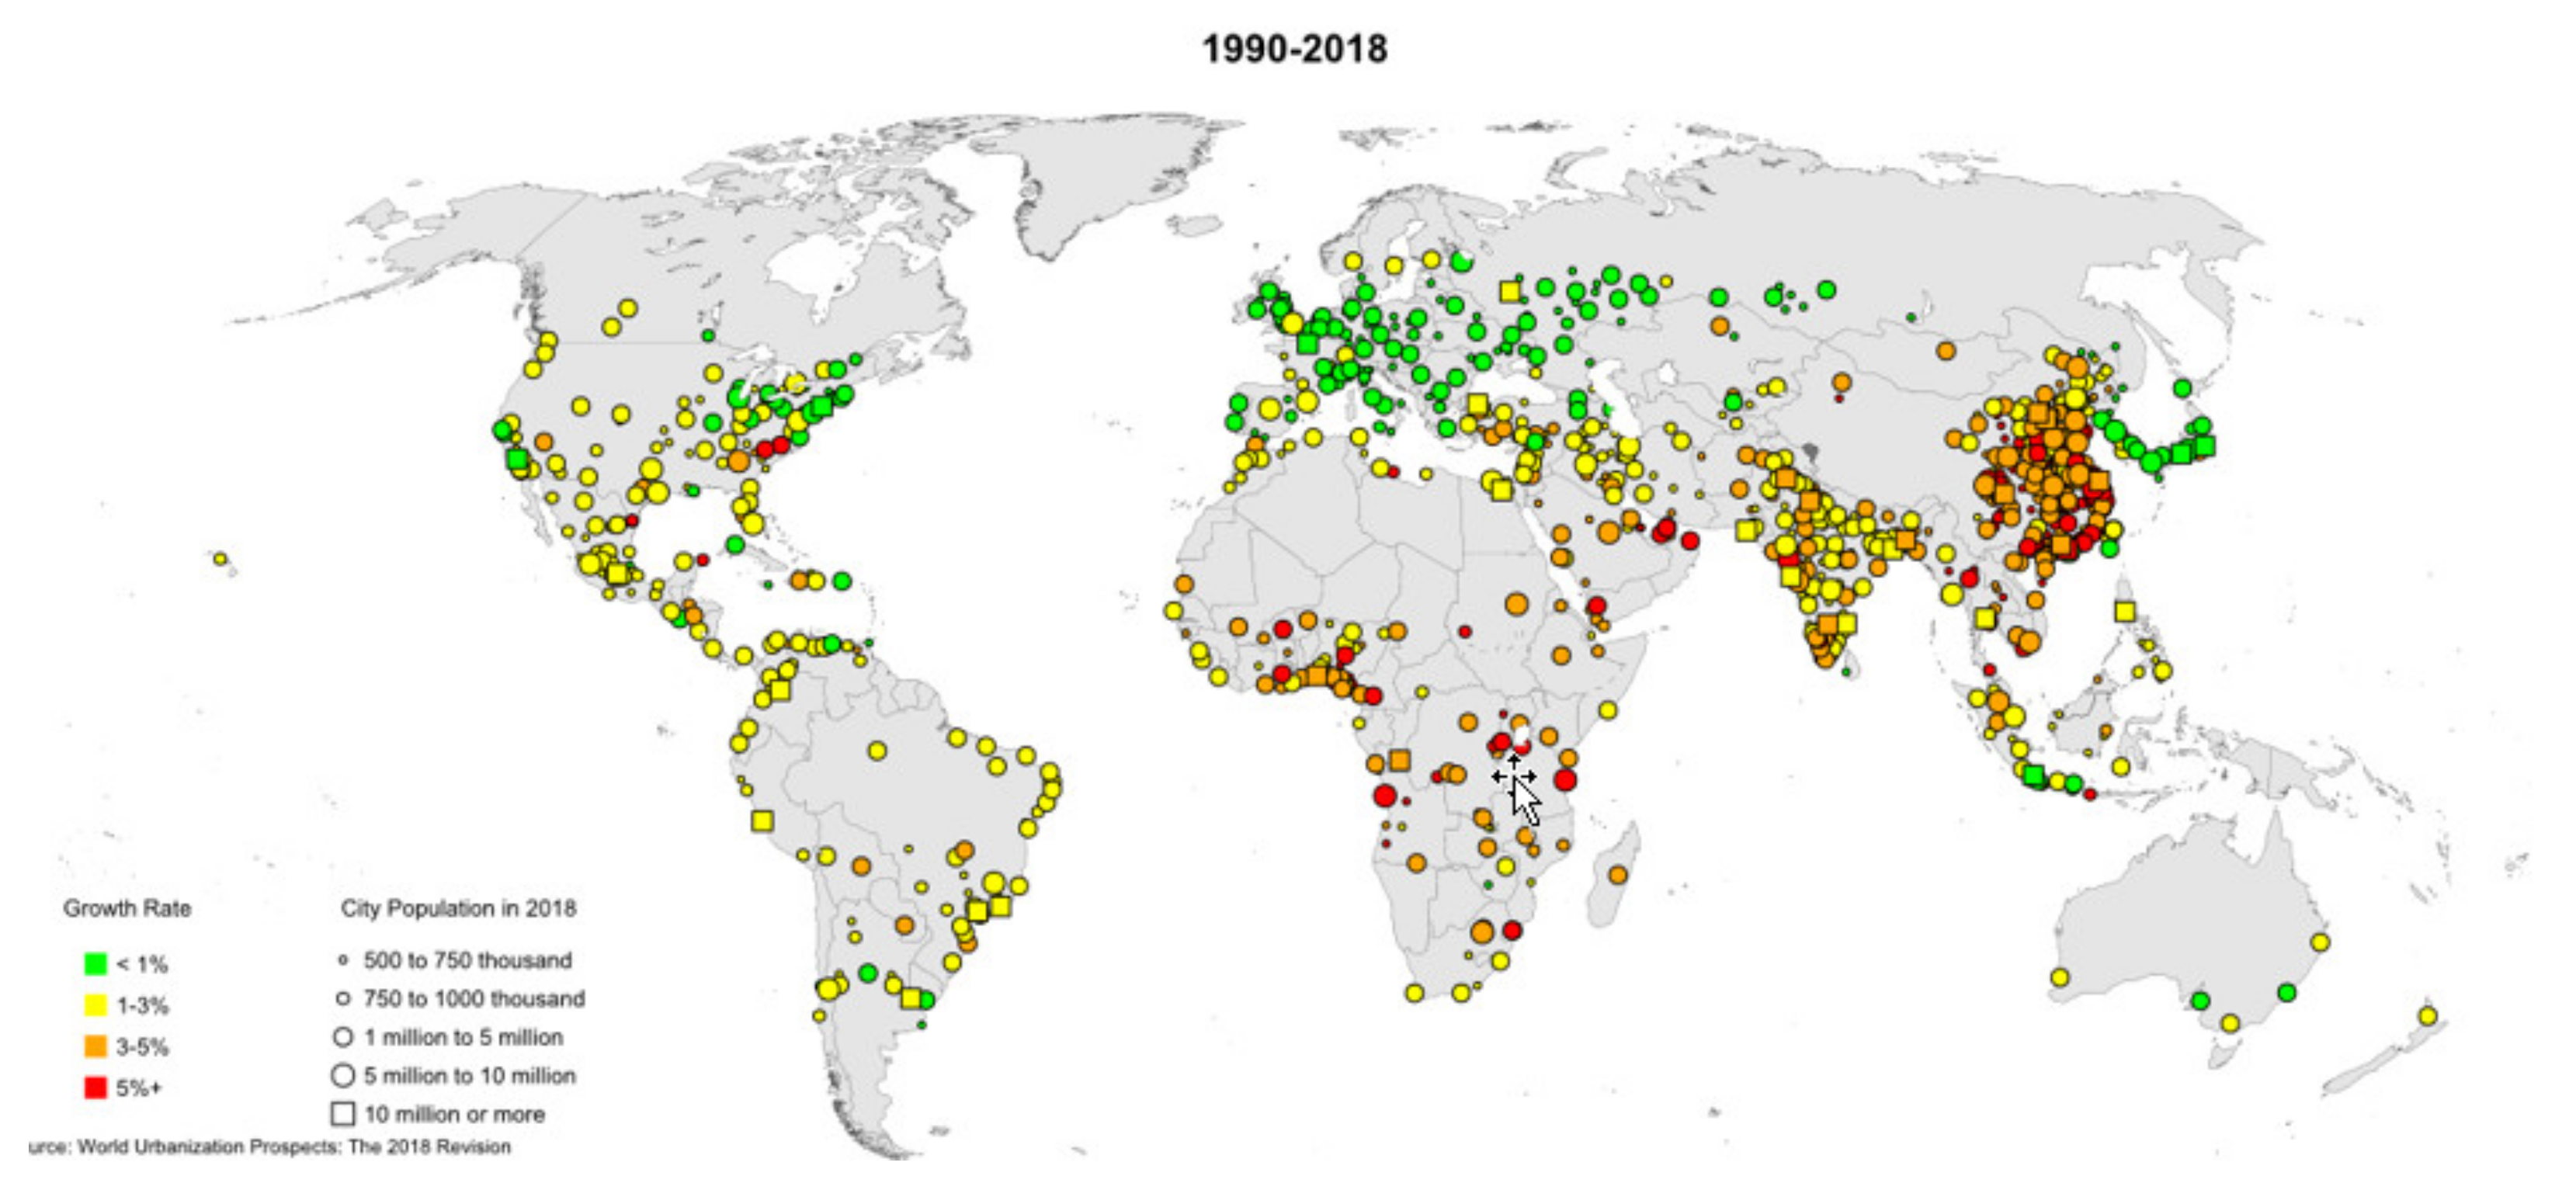
2. Demographic Changes and the Spatial Dimension of Urbanisation from a Global Perspective

Demographic processes are the driving force behind urbanisation. According to data published in World Urbanisation Prospects—The 2018 Revision [1]—approximately 55% of the world’s population lived in towns and cities in 2013. It is projected that this value will reach 68% by 2050. This is due to changing lifestyles and a gradual reduction in agricultural employment in favor of the endogenous functions of cities [25]. According to the data published by the United Nations, two-thirds of the world’s population will live in urban areas (Figure 1).
In the second half of the 20th century, urbanisation rapidly accelerated. Dynamic growth of cities was observed in the more developed regions of the world, such as Europe and later North America. Yet, in recent decades, it has been Asia that has been urbanising at a tremendous rate—it now has more than half of the world’s 40 megacities (with more than 10 million inhabitants). Africa is also gaining urbanisation momentum and now has three megacities in Cairo, Lagos and Kinshasa [26]. People migrate in search of a higher standard of living and the benefits of an urban lifestyle [27,28,29]. This process is particularly visible in Asia and Africa (90% urban population growth), where the highest rates of population growth are also found [30,31]. The migration of people to towns and cities was particularly high after 1950. From the level of 751 million, the urban population grew to 4.2 billion in 2018. It is predicted that by 2050 this number could rise by another 2.5 billion [32] (Figure 2).
Today, the most urbanised areas include North America (82% of the population live in urban areas), Latin America and the Caribbean (81%), Europe (71%) and Oceania (68%). Although these percentages are much lower in Asia (50%) and Africa (43%) in view of the relatively lower numbers of cities and towns, these are the areas with the largest cities (over 10 million) [1]. It is expected that by 2030, the number of cities with over 10 million inhabitants will rise to 43, while in 1970, there were only three such locations. The scale of these changes is shown in Figure 3.
Urban areas are the focal point of economic activity in most areas of the globe. Cities provide driving forces for development, bringing economies of scale, developing markets, creating jobs and encouraging new forms of business. As economies progress from basic activities—agriculture, fishing and mining—to industrial production and then services, the role of cities in the global economy expands with each transition. At present, about 55% of the world’s population (4.2 billion people) live in cities, and by 2050, almost 7 out of 10 people worldwide will live in urban areas. According to the figures provided by the World Bank, more than 80% of global GDP is generated in cities. Major urban areas, particularly in developed countries, are economic giants [33]. The 600 largest urban centres, with a fifth of the world’s population, generate 60 per cent of global GDP. The 380 largest cities in the top 600 in terms of GDP accounted for 50 per cent of global GDP [34].
Research studies conducted on the phenomenon of urbanisation are usually based on an analysis of statistical data concerning demographic and investment growth in administrative units. They are very significant as they clearly show the scale of the phenomenon. However, these studies often lack a spatial reference indicating the direction and the territorial extent of the changes.
The development of towns and cities is no longer controlled. The main reason behind this is the scale of economic and social change. The increased population mobility, the development of technology and the exchange of information have also resulted in city boundaries becoming indistinct [35]. The constantly growing urban population needs more space and the rate of growth results in a low level of space urbanisation processes [20,36]. This poses a serious threat to the spatial order and ultimately reduces the quality of this space and, consequently, the quality of people’s lives [37]. Housing land, which accounts for over 70% of land use in most urban areas, determines the form and density of cities, provides employment and contributes to their growth. Housing policy and the provision of adequate infrastructure to residents for their safety and health is one of the most important challenges for these cities. In addition, it should be remembered that the shortage of space causes price increases in the property markets, which leads to an increase in the number of residents living in extremely poor conditions or slums [22,38]. It is estimated that 881 million urban dwellers live in slums, a number that has increased globally by 28% in the last 24 years. Although the share of urban populations living in slums has declined over the past two decades, the number of slum dwellers continues to rise [24,39].
Forecasts show that the amount of urban land on Earth by 2100 may range from around 1.1 million to 3.6 million km2 depending on the approach and the application of sustainable development principles—Figure 4.
Transformations of land use triggered by new human demand affects many aspects of the environment at spatial and temporal scales, including freshwater quality and availability, extreme precipitation and flooding, biodiversity and habitat loss, and global warming [40]. Although cities around the world are the driving forces for economic value creation and income generation, fulfilling an essential role in many aspects of society, the spatial changes they induce and do not control can pose a huge threat to human beings.
Uncontrolled urban growth is clearly visible in the surroundings of metropolitan cities and often results from insufficient space that can be allocated for investment purposes within the city to satisfy the needs of an economically and demographically expanding metropolis. The spatial dimension of urbanisation applies to both urban and rural areas, which is reflected in the amount of space used in a characteristic urban manner. Rural areas, in particular, are experiencing a constant transformation, which is caused by the interest in these areas of urban dwellers. These processes are usually very dynamic and produce rapid changes, based mainly on the principle of reorganisation of the structure of space, and manifest themselves as advanced suburbanisation and exurbanisation [35]. In the literature, this phenomenon has become known as ‘urban sprawl’, denoting the process of spreading and the enlargement of big cities [41,42]. This phenomenon is seen as a process resulting from socio-economic changes due to spontaneous and disorderly urban expansion [43]. For this reason, it is extremely important to monitor the direction, the level and the pace of spatial urbanisation. Urban sprawl is often measured by the population density gradient (as the percentage decrease in density over increasing distance from the city centre) [44] or by the spatial size of the urban area [45]. The analysis of these values shows a disproportionate increase in urban space to the increase in urban population [46].
Suburbanisation is of particular importance in a period of rapid urban growth. Areas under direct urbanisation pressure are described in the literature as the urban–rural transition zone [47,48], the urban–rural continuum [49,50,51,52,53] or the suburban zone [54,55,56,57]. Studies of these areas focus not only on the progressive integration of new land into the urban sphere of influence, but also on changing land use, the extent of infrastructure, access to services and markets, and exposure to urban production processes and environmental pollution [58]. Changes in land use in areas are referred to as a rural–urban fringe [59,60,61,62,63,64], in so-called “green belts” surrounding the city [65,66,67] and areas referred to as “urban villages” [68] are also explored. Areas under urbanisation pressure are also investigated in terms of investment attractiveness [69,70] or real estate market analyses [71,72,73,74,75].

3. Methodology of Proceeding and the Determination of Recent Trends in Research on Urbanisation Processes

In order to describe the investigated area of knowledge, based on an extensive literature review, a number of methods and techniques used to study the dynamics of urbanisation processes were examined. The variety of attributes and the large range of data make the process of analysing spaces under urbanisation pressure both complex and time-consuming. The key to the choice of the spatial data presented and the methods applied in the research on the dynamics of urbanisation processes was their availability, the difficulty of classifying certain forms of development, the time of implementation, costs and their spatial and temporal continuity. The main focus of the paper is on the use of photogrammetric and remote sensing sources to study urbanisation changes. Among these, sources were separated according to the type of information and their spatial scope. The examined sources demonstrate land cover changes, which can be divided into four classes: land-use change analyses, environmental change analyses and demographic and economic change analyses. The spatial extent of the data gathered is highly diverse. Its scope can be classified as local, regional, national or global. Taking into account these two aspects, the most interesting examples of applying particular databases created with photogrammetric and remote sensing sources for the purpose of analysing the dynamics of urbanisation processes were identified by a literature review. The presented research results are based on data from 1990–2020. The classification of spatial data sources and the selection procedure of application cases are shown in Figure 5.

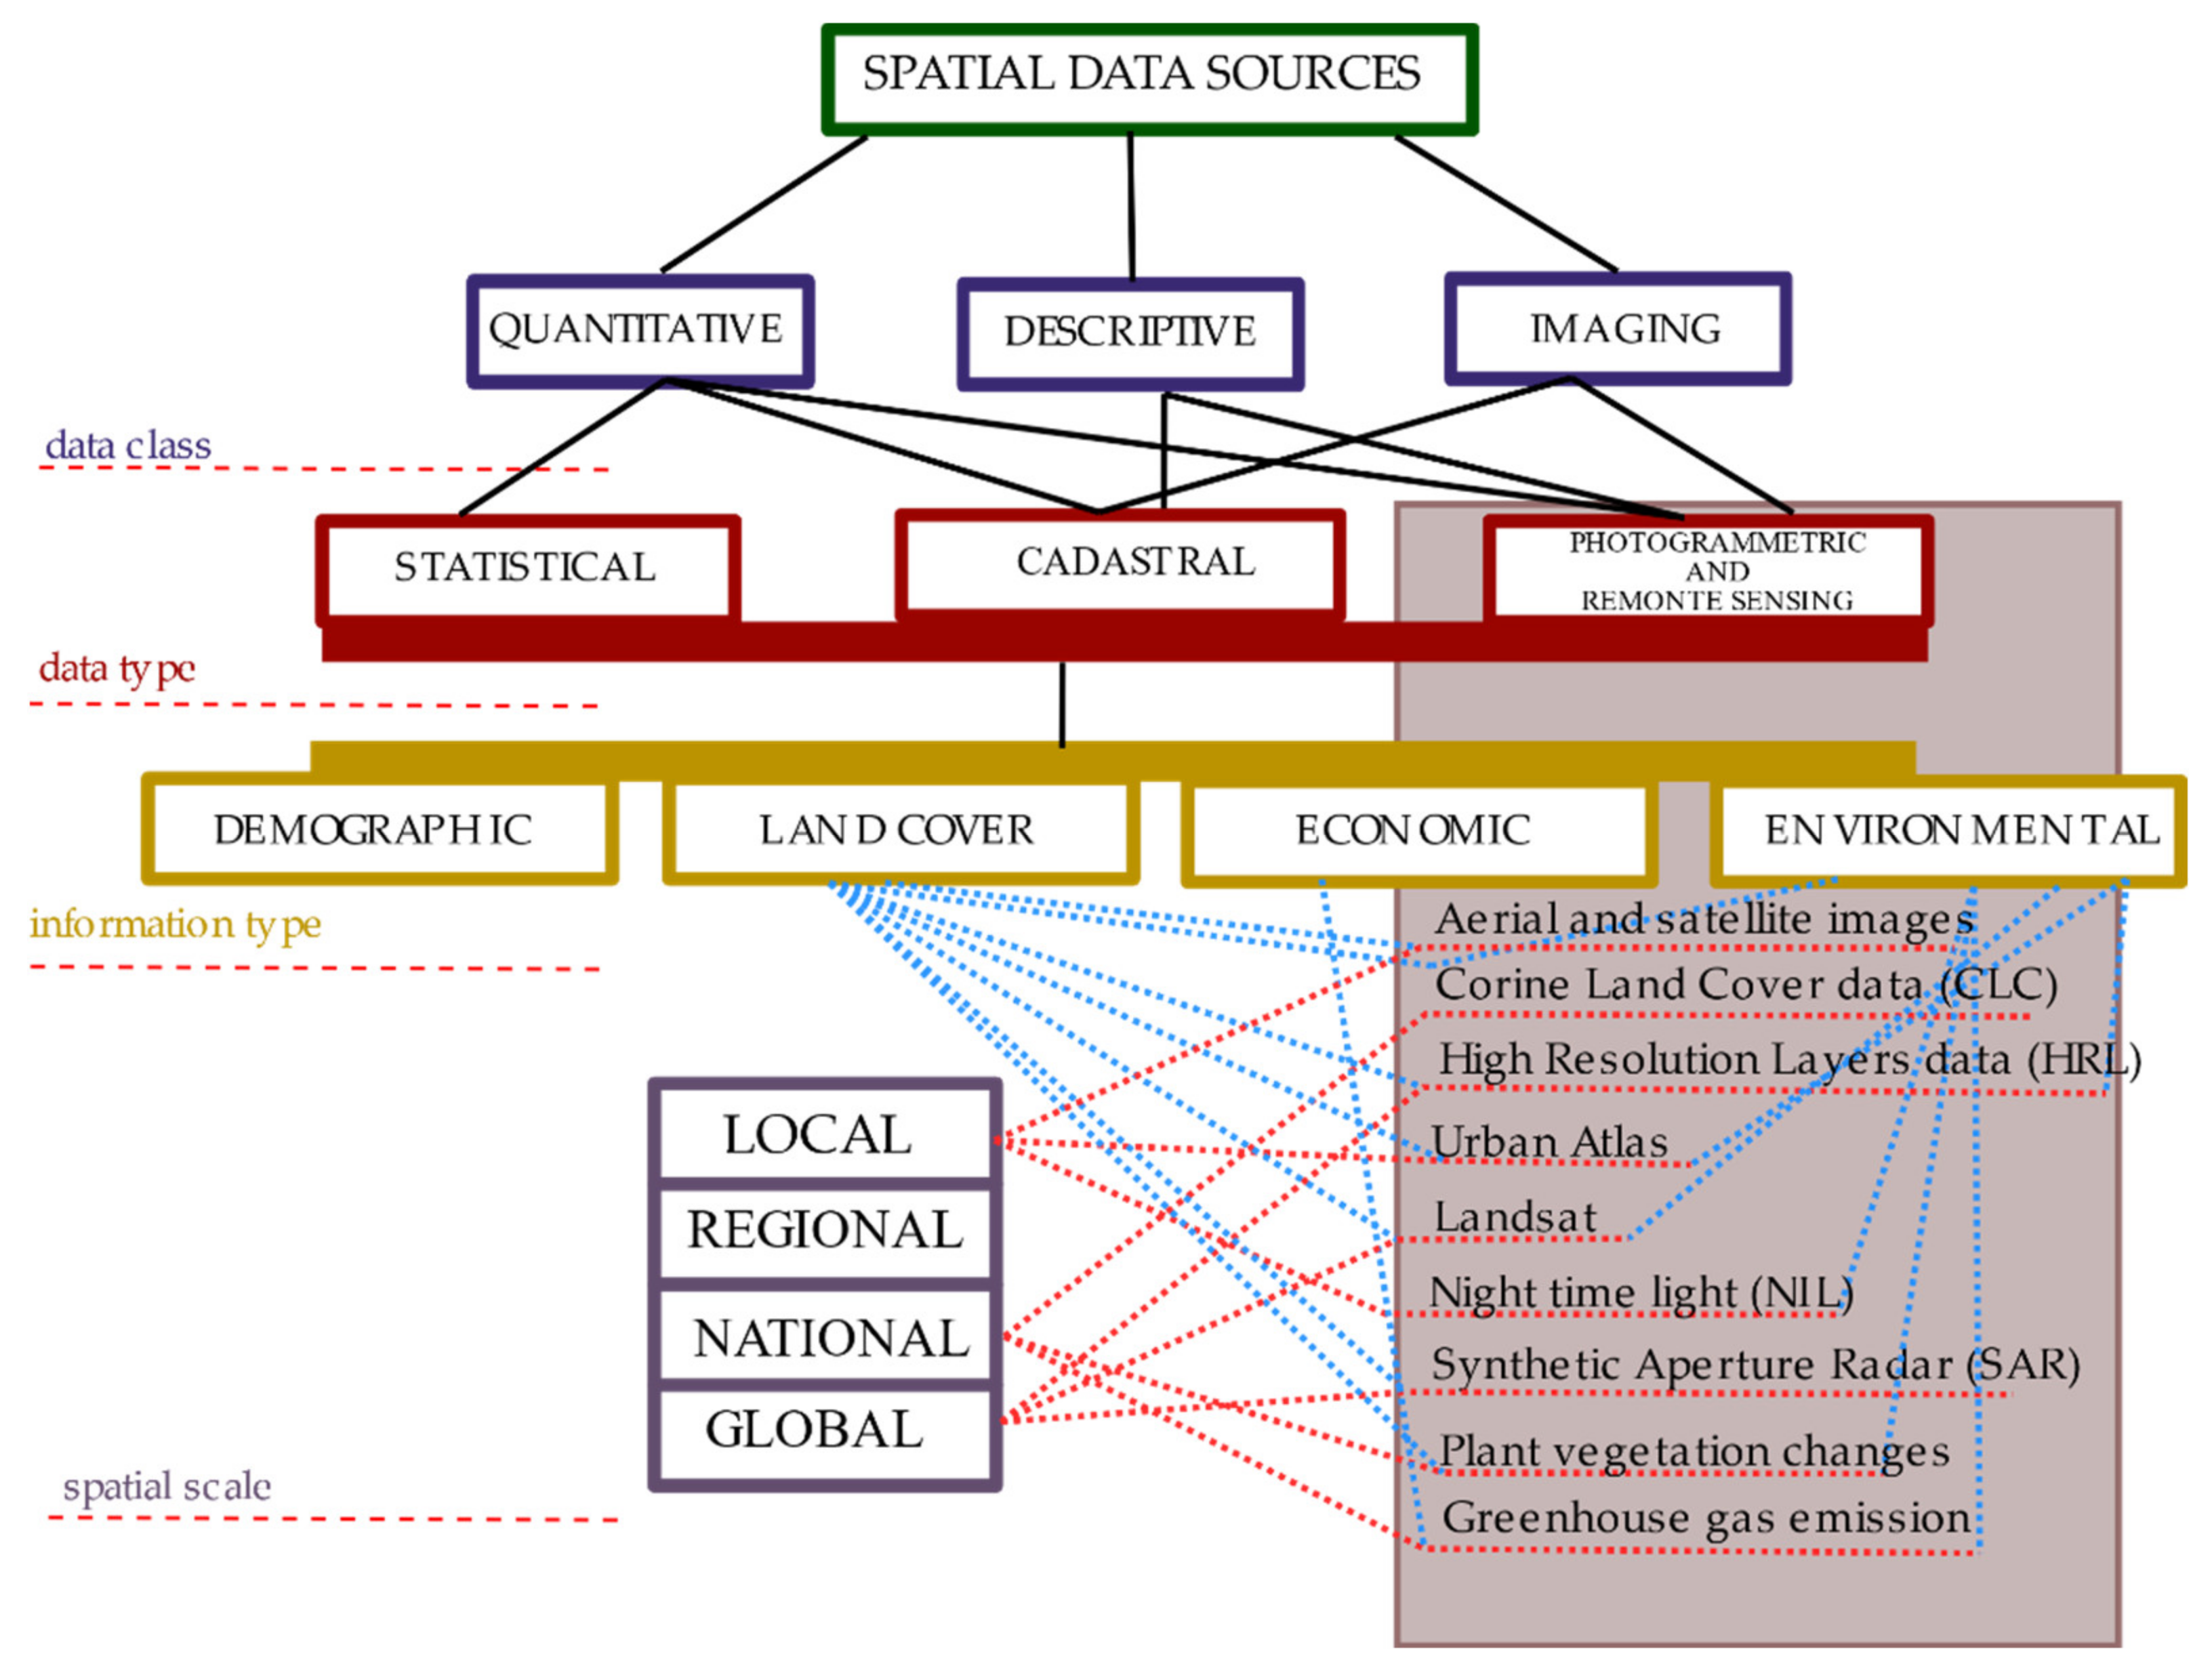
3.1. Sources of Information Used in Analyses of Urbanisation Processes

Urbanisation produces profound changes in space and gradually modifies the structure of land use. There is a great need to monitor urban space, as well as the changes that are taking place in areas subject to the direct pressure of urbanisation. The development of science and technology provides many new tools to observe urbanisation processes and to analyse and draw conclusions regarding this phenomenon. Sources of information data used in analyses of urbanisation processes can be generally divided into statistical, cadastral, photogrammetric and remote sensing.
Statistical data used in analyses of urbanisation processes take into account changes occurring over time in land-use forms, settlement unit boundaries, changes in the territorial division, in the number of towns and cities, as well as in the area, population and structure. Statistical data collected and processed, e.g., by the European Statistical Office (Eurostat) and governmental statistical offices (Statistics Poland), also refer to internal and external population migration processes.
Cadastral data used in an analyses of urbanisation processes are gathered in public registers and cartographic studies. The data in the registers include, among others, information on persons, their rights, legal transactions, obligations, goods, etc. For example, in Poland there are about 280 public registers serving different purposes, e.g., the registration of the actual state of real estate is assigned to the land and building register, while the registration of the legal status of real estate belongs to the scope of the land and mortgage register [76]. Descriptive and spatial attributes of real estate used in an analyses of urbanisation processes include the number of parcels, numerical description of boundaries, surface areas, land use contours and soil classes, designation of the land and mortgage register or sets of documents defining the legal status of the real estate, street names and ordinal numbers of buildings, names of physiographic objects, GESUT (geodetic records of public utilities) data, providing information on ground, aboveground and underground technical infrastructure. Data from cartographic studies also contain information on the condition, distribution and interrelationships of various types of terrain objects and phenomena, their qualitative and quantitative characteristics, as well as their names and descriptions. The analysis of urbanisation processes with the use of digital or analogue cartographic works, such as a topographic map, takes into account surface elements of the landscape, such as residential estates, industrial and agricultural facilities, water and related facilities, vegetation, crops, land, boundaries, landforms, etc. In general, cadastral data can be divided into qualitative (describing the type, equipment, buildings, utilities), quantitative (area, volume) and situational information (location, access).
Photogrammetric and remote sensing data seem to be particularly important in the analysis of urbanisation processes. Photogrammetry (terrestrial and aerial) is used to develop and update various types of maps, orthophotomaps, digital elevation models and spatial information systems. Remote sensing data (data on phenomena and objects acquired without direct contact with them), which are produced at various altitudes and by various sensors, can be divided into active (radars-SAR, scanners-LiDAR) and passive data (cameras or thermal scanners-placed on the board of satellites, aircraft and drones). The sensors provide images in various ranges of electromagnetic radiation. The resulting databases, complemented by spatial databases, which are already common today, provide enormous research material and make it possible to study the phenomenon of urbanisation with greater intensity and in a more up-to-date context.
Photogrammetric and remote sensing (RS) data and GIS tools provide accurate information on land use and land cover changes. Currently, the main sources of data are the Copernicus (program supervised by ESA) and Landsat (program supervised by NASA) satellites. The data acquired and shared from the Copernicus (in particular Sentinel-2 and Sentinel-1) and Landsat satellites provide a high level of detail. The use of a variety of sensors, including optical and radar, facilitate monitoring land cover and support crisis management. Additionally, the photogrammetry and remote-sensing products obtained through the Copernicus and Landsat programs, generating high-resolution images of land cover [77], make it possible to monitor urbanisation processes [78,79,80]. Monitoring land cover with high-resolution imagery, especially in urban areas, is a key task and has applications in many fields, such as land development planning, urban planning and architecture, ecology and environmental protection, etc. These data are also of fundamental importance for understanding spatial urbanisation processes. With the availability of urbanisation data, photogrammetry and remote sensing techniques are becoming increasingly popular for monitoring changes in land use processes. The Copernicus program services, coordinated by the European Environment Agency, provide information on land cover and land use on a European, national and local scale. The pan-European component includes, among others, the uniform land cover databases (CLC1990, CLC2000, CLC2006, CLC2012 and CLC2018) and High Resolution Layers (HRL).
The CORINE Land Cover database includes all land cover forms occurring on the European continent, leaving no unclassified areas (clc.gios.gov.pl, access date: 1 February 2018). The database contains information on both land cover and land use. In the CLC, land cover forms are hierarchically divided into three levels. The database distinguishes five basic forms of land cover: anthropogenic land (built-up areas, used for housing, services, industry or mines, and municipal green spaces), agricultural land (arable land, permanent crops, meadows and pastures, and wooded and shrubby land used for agriculture), forests and ecosystems (land covered with or partially devoid of forest vegetation), wetlands (inland marshes, peat bogs, salt marshes and mudflats) and water areas (inland waters and sea waters). These forms are further subdivided into levels two and three, which specify the form of land use within the group [81]. The CLC database is a tool for conducting complex spatial analyses based on diverse land-use types. One of the greatest advantages of the CLC dataset is that it is regularly updated, which makes this resource particularly useful for analysing the rate of changes in land use and developing forecasts. HRLs contain detailed information on characteristic land cover forms: impervious areas, wooded areas, areas with grass cover, water bodies and wetlands. These layers are complementary to the Corine Land Cover databases.
The local component also offers Urban Atlas, Riparian Zones and Natura 2000. The Urban Atlas data represents the functional zones of urban areas and contains detailed data on land cover (land use) compiled for the most populous European cities (for most cities with more than 50,000 inhabitants). The classification recognises 17 urban classes (including five classes of mixed-density development) and ten other classes associated with other land cover forms. The Urban Atlas project currently comprises nine products, including land cover data from 2006, 2012, 2018 and Urban Atlas Change 2006–2012 and 2012–2018. Riparian Zones data concern land cover and land use in areas along rivers, i.e., riparian areas. The primary objective is the need to monitor biodiversity at the European level, including as part of the improvement of ’green’ and ’blue’ infrastructure in the European Union. Natura 2000 data relate to grassland-rich areas and their assessment for conservation efficiency. Coastal Zones data are used to monitor the dynamics of land-use change in coastal zones.
The above-mentioned types of sources of information on urbanisation processes are merged to create Spatial Information Systems (SIP). The data necessary for analyses of urbanisation processes can be found in various databases of this system, such as EuroGeographics. EuroGeographics facilitates access to official, comparable and verifiable geospatial data from European national authorities responsible for maps, cadaster and land and mortgage registers. EuroGlobalMap is a geodatabase at a 1:1,000,000 accuracy level covering 45 European countries and territories. The thematic scope of the data includes administrative boundaries, transport and hydrographic networks, landforms, settlements and anthropogenic objects. EuroGlobalMap provides an ideal background for a wide range of activities, from network planning, monitoring and analysis to the presentation of environmental policies.
Access to key data is also provided by all types of national spatial information systems. Spatial information refers here to information on the location (coordinates in an assumed reference system), geometric properties, and spatial relationships of objects that are identified in relation to the Earth and that can be used in an analyses of urbansation processes. In Poland, for example, the National Geographic Information System (KSIG) consists of standardised reference databases containing information on objects located on and below the Earth’s surface, together with their location, situated in the territory of Poland, as well as procedures and techniques for the systematic collection, updating, processing and disseminating of the data. The most important components of KSIG include vector map level 2 (VMAP2), topographic database (TBD), topographic and base maps, general geographic database (BDO), photogrammetric database, orthophotomaps and the land and building register (EGIB). The most important feature distinguishing the spatial information systems in operation, which is the consequence of the presence of spatial information contained in them, is the possibility of its cartographic presentation and of an analysis allowing answers to be obtained regarding the real world modelled by the system [82].

3.2. Examples of Using Spatial Data in Analyses of Urbanisation Processes

The examples presented below reflect the latest and, in the authors’ opinion, the most interesting trends in the research on the dynamics of spatial urbanisation processes.

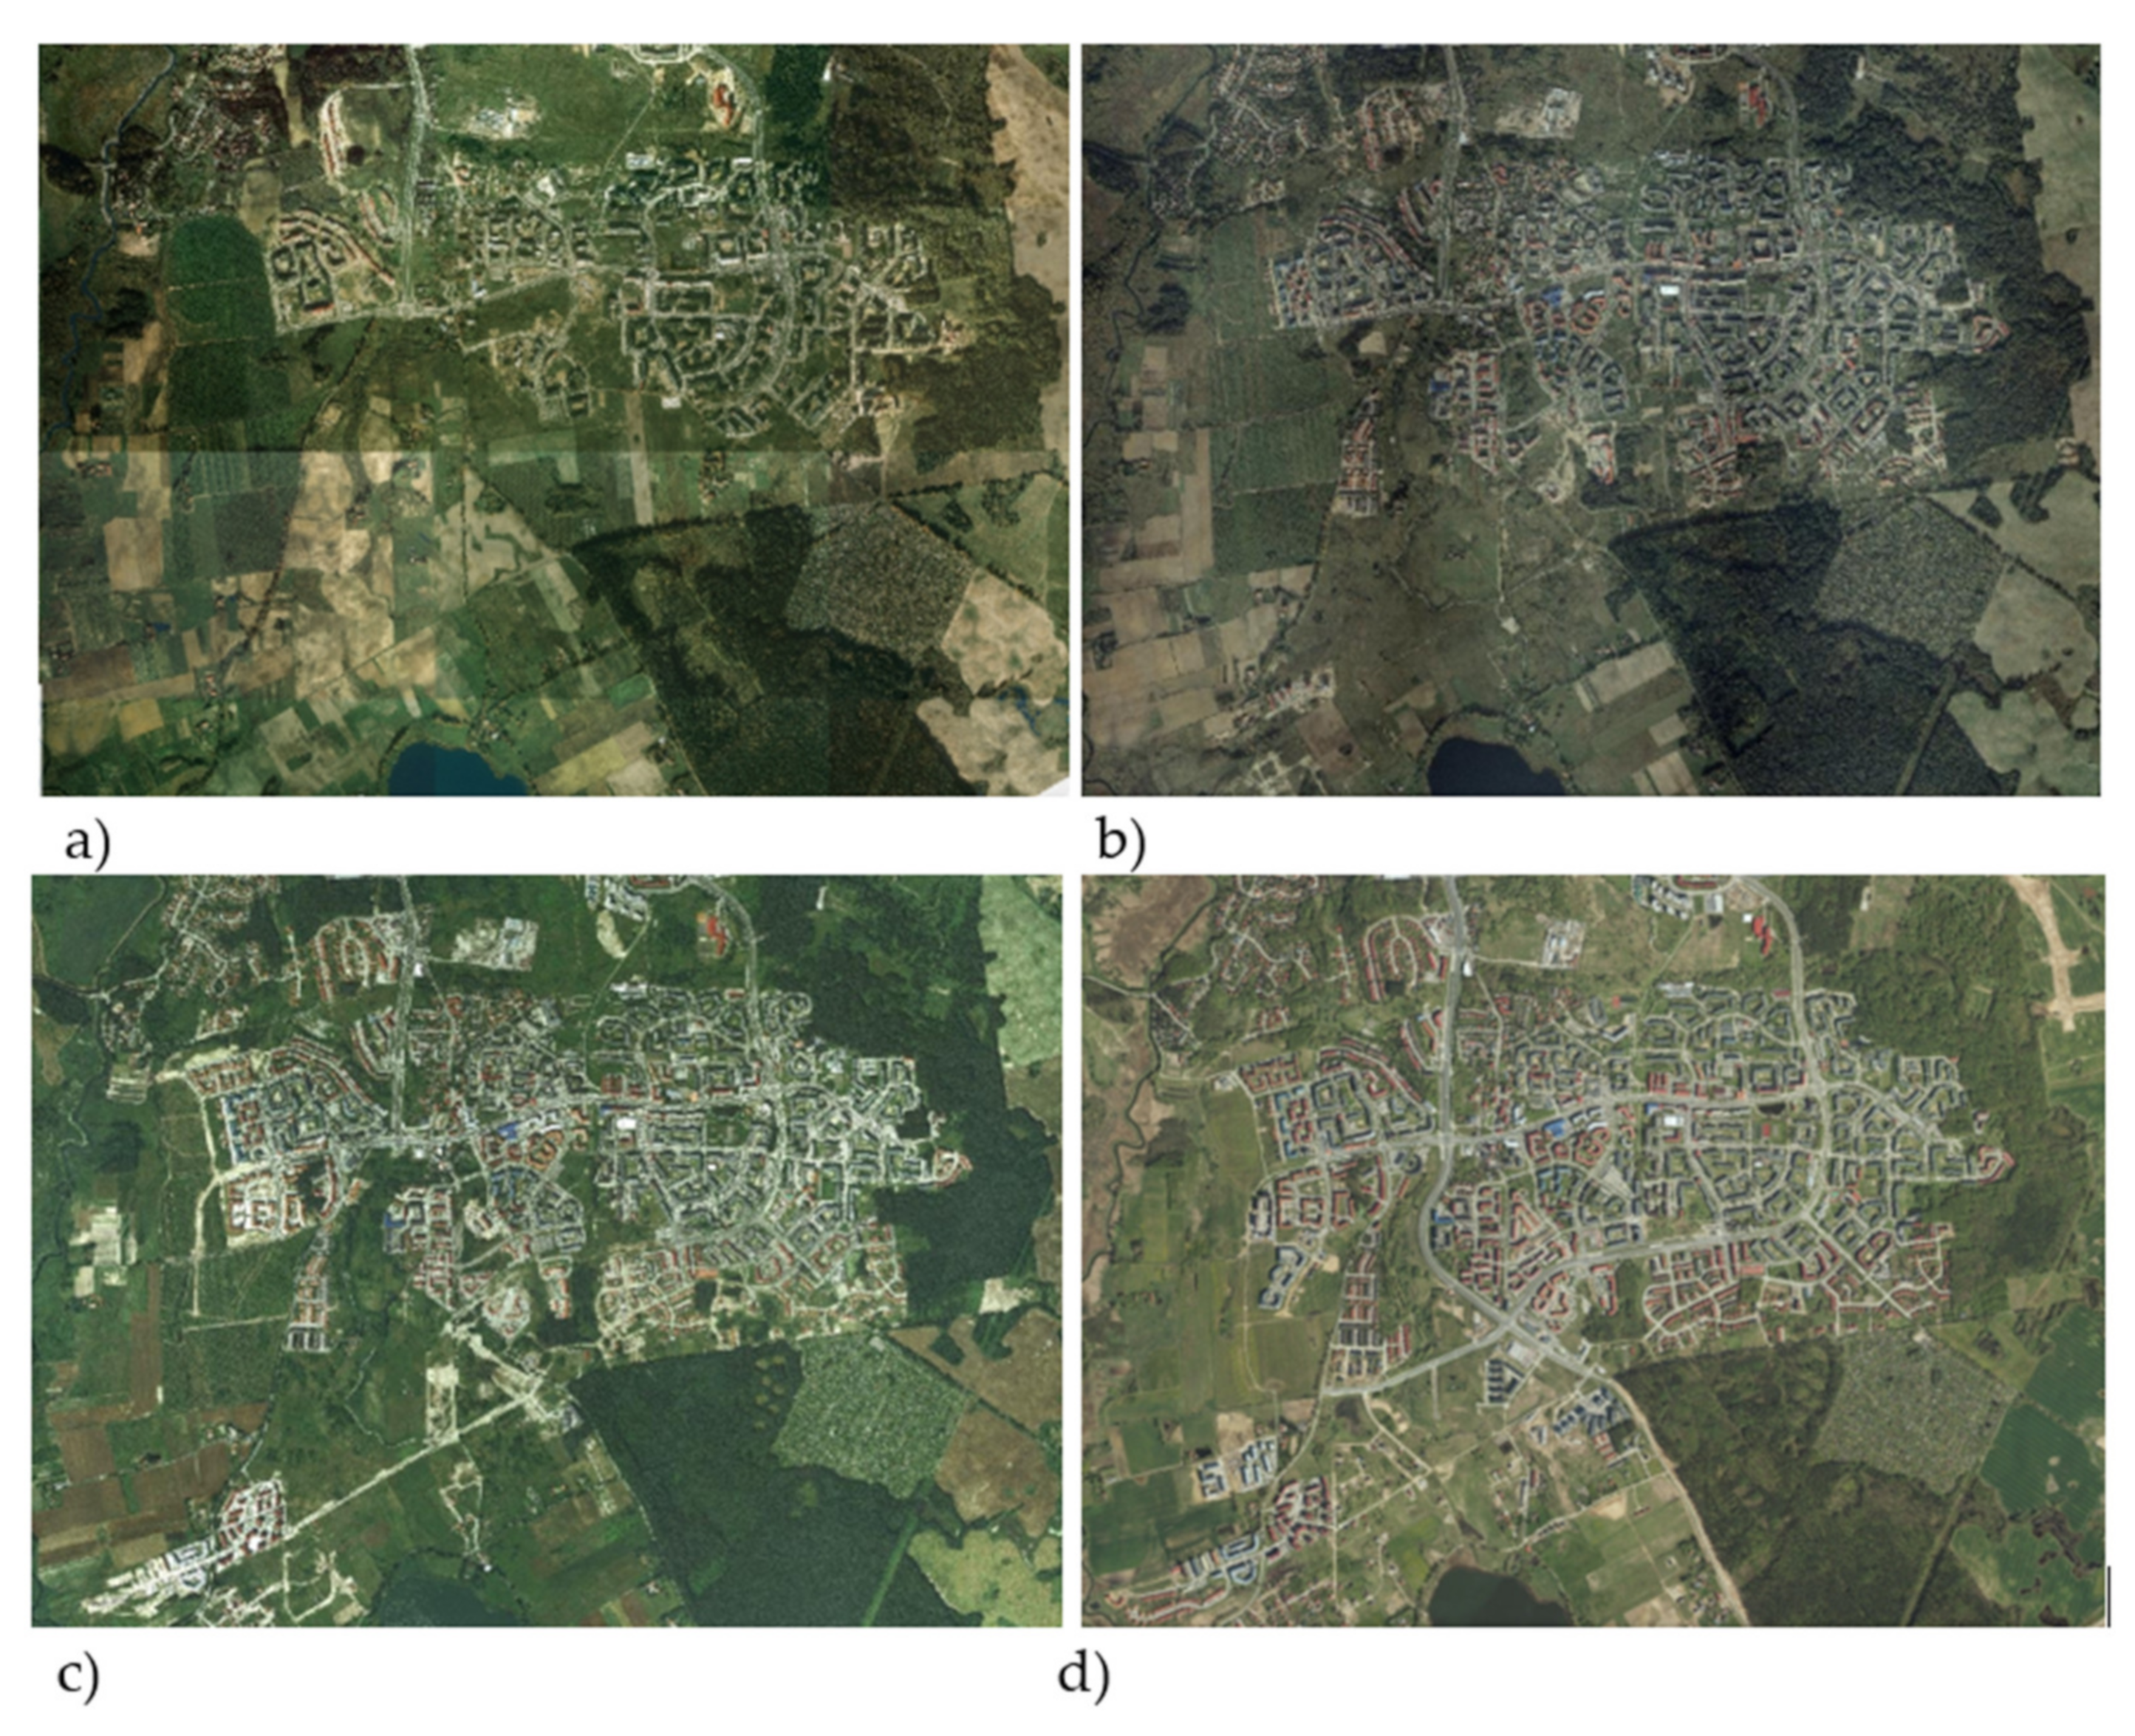
3.2.1. The Analysis of Urbanisation Processes Using Aerial and Satellite Images

Aerial and satellite imagery is very often used in spatial analyses. The result of processing these images is an orthophotomap, which, unlike a traditional map, presents the state of land cover and land use in the most realistic way. The use of publicly available orthophotomaps enables the identification and location of the urban investment boundary, the degree and rate of urbanisation of the area (Figure 6).
The expert method of visual interpretation of the orthophotomap (photointerpretation) and additional data—e.g., from the land and building register and from the field visits, make it possible to identify current and historical land-use forms (Figure 7).
At present, orthophotomaps are produced with a field resolution of 10 cm, which allows the precise identification of objects. Orthophotomaps are successfully used as separate layers in geographic systems and form the background for spatial planning and the creation of thematic studies.

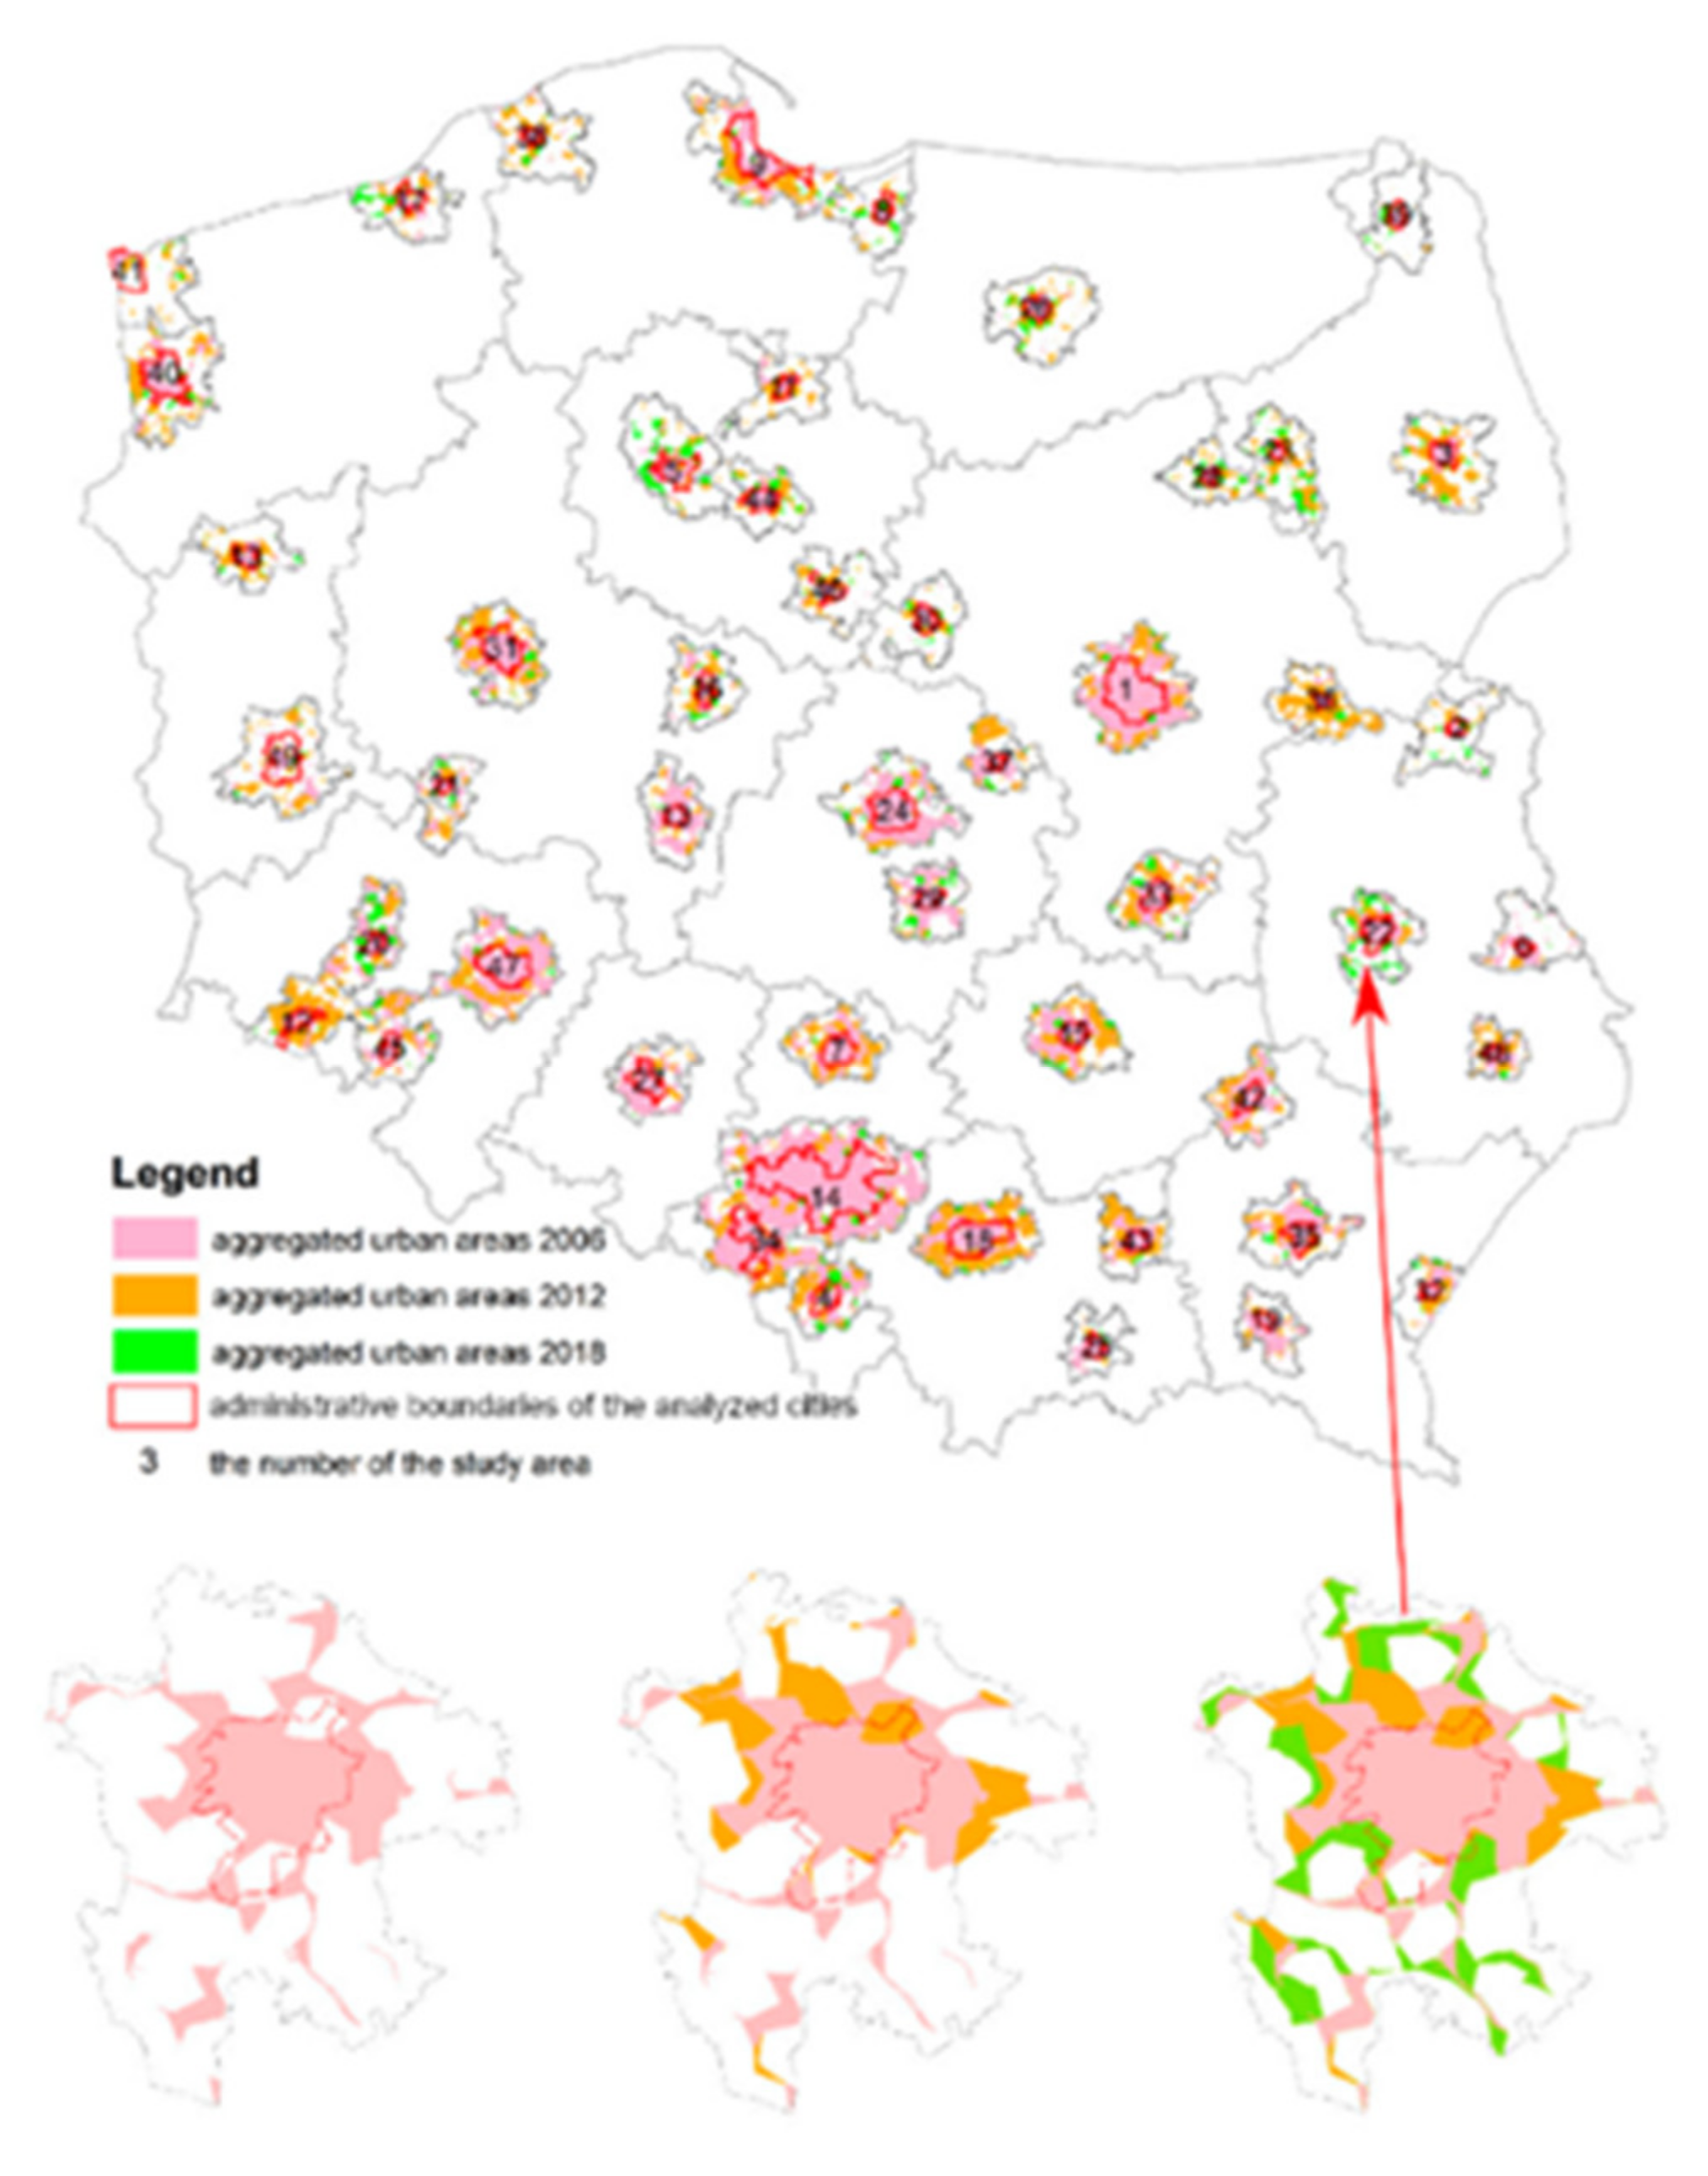
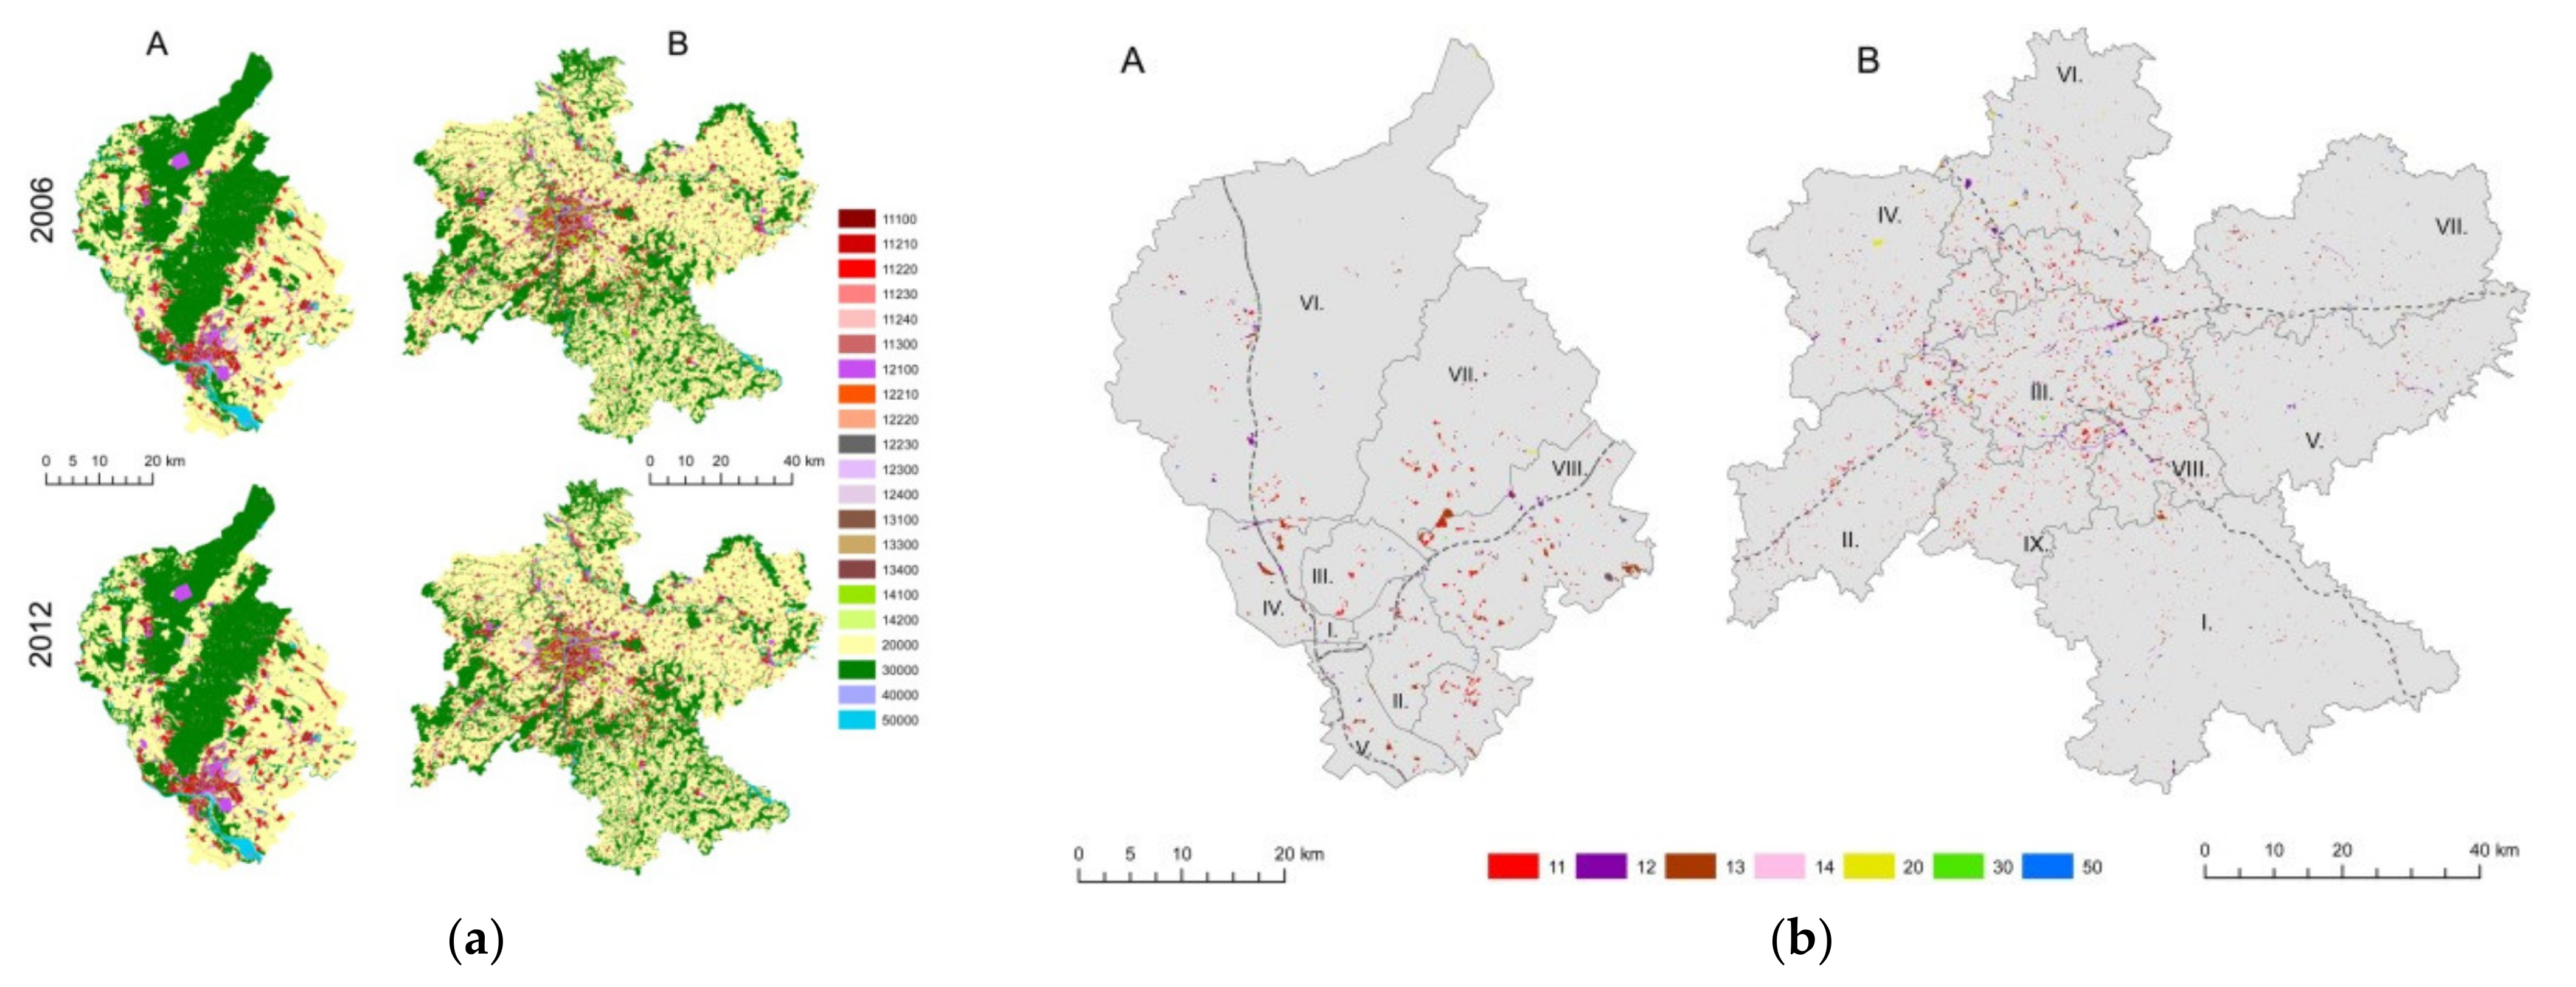
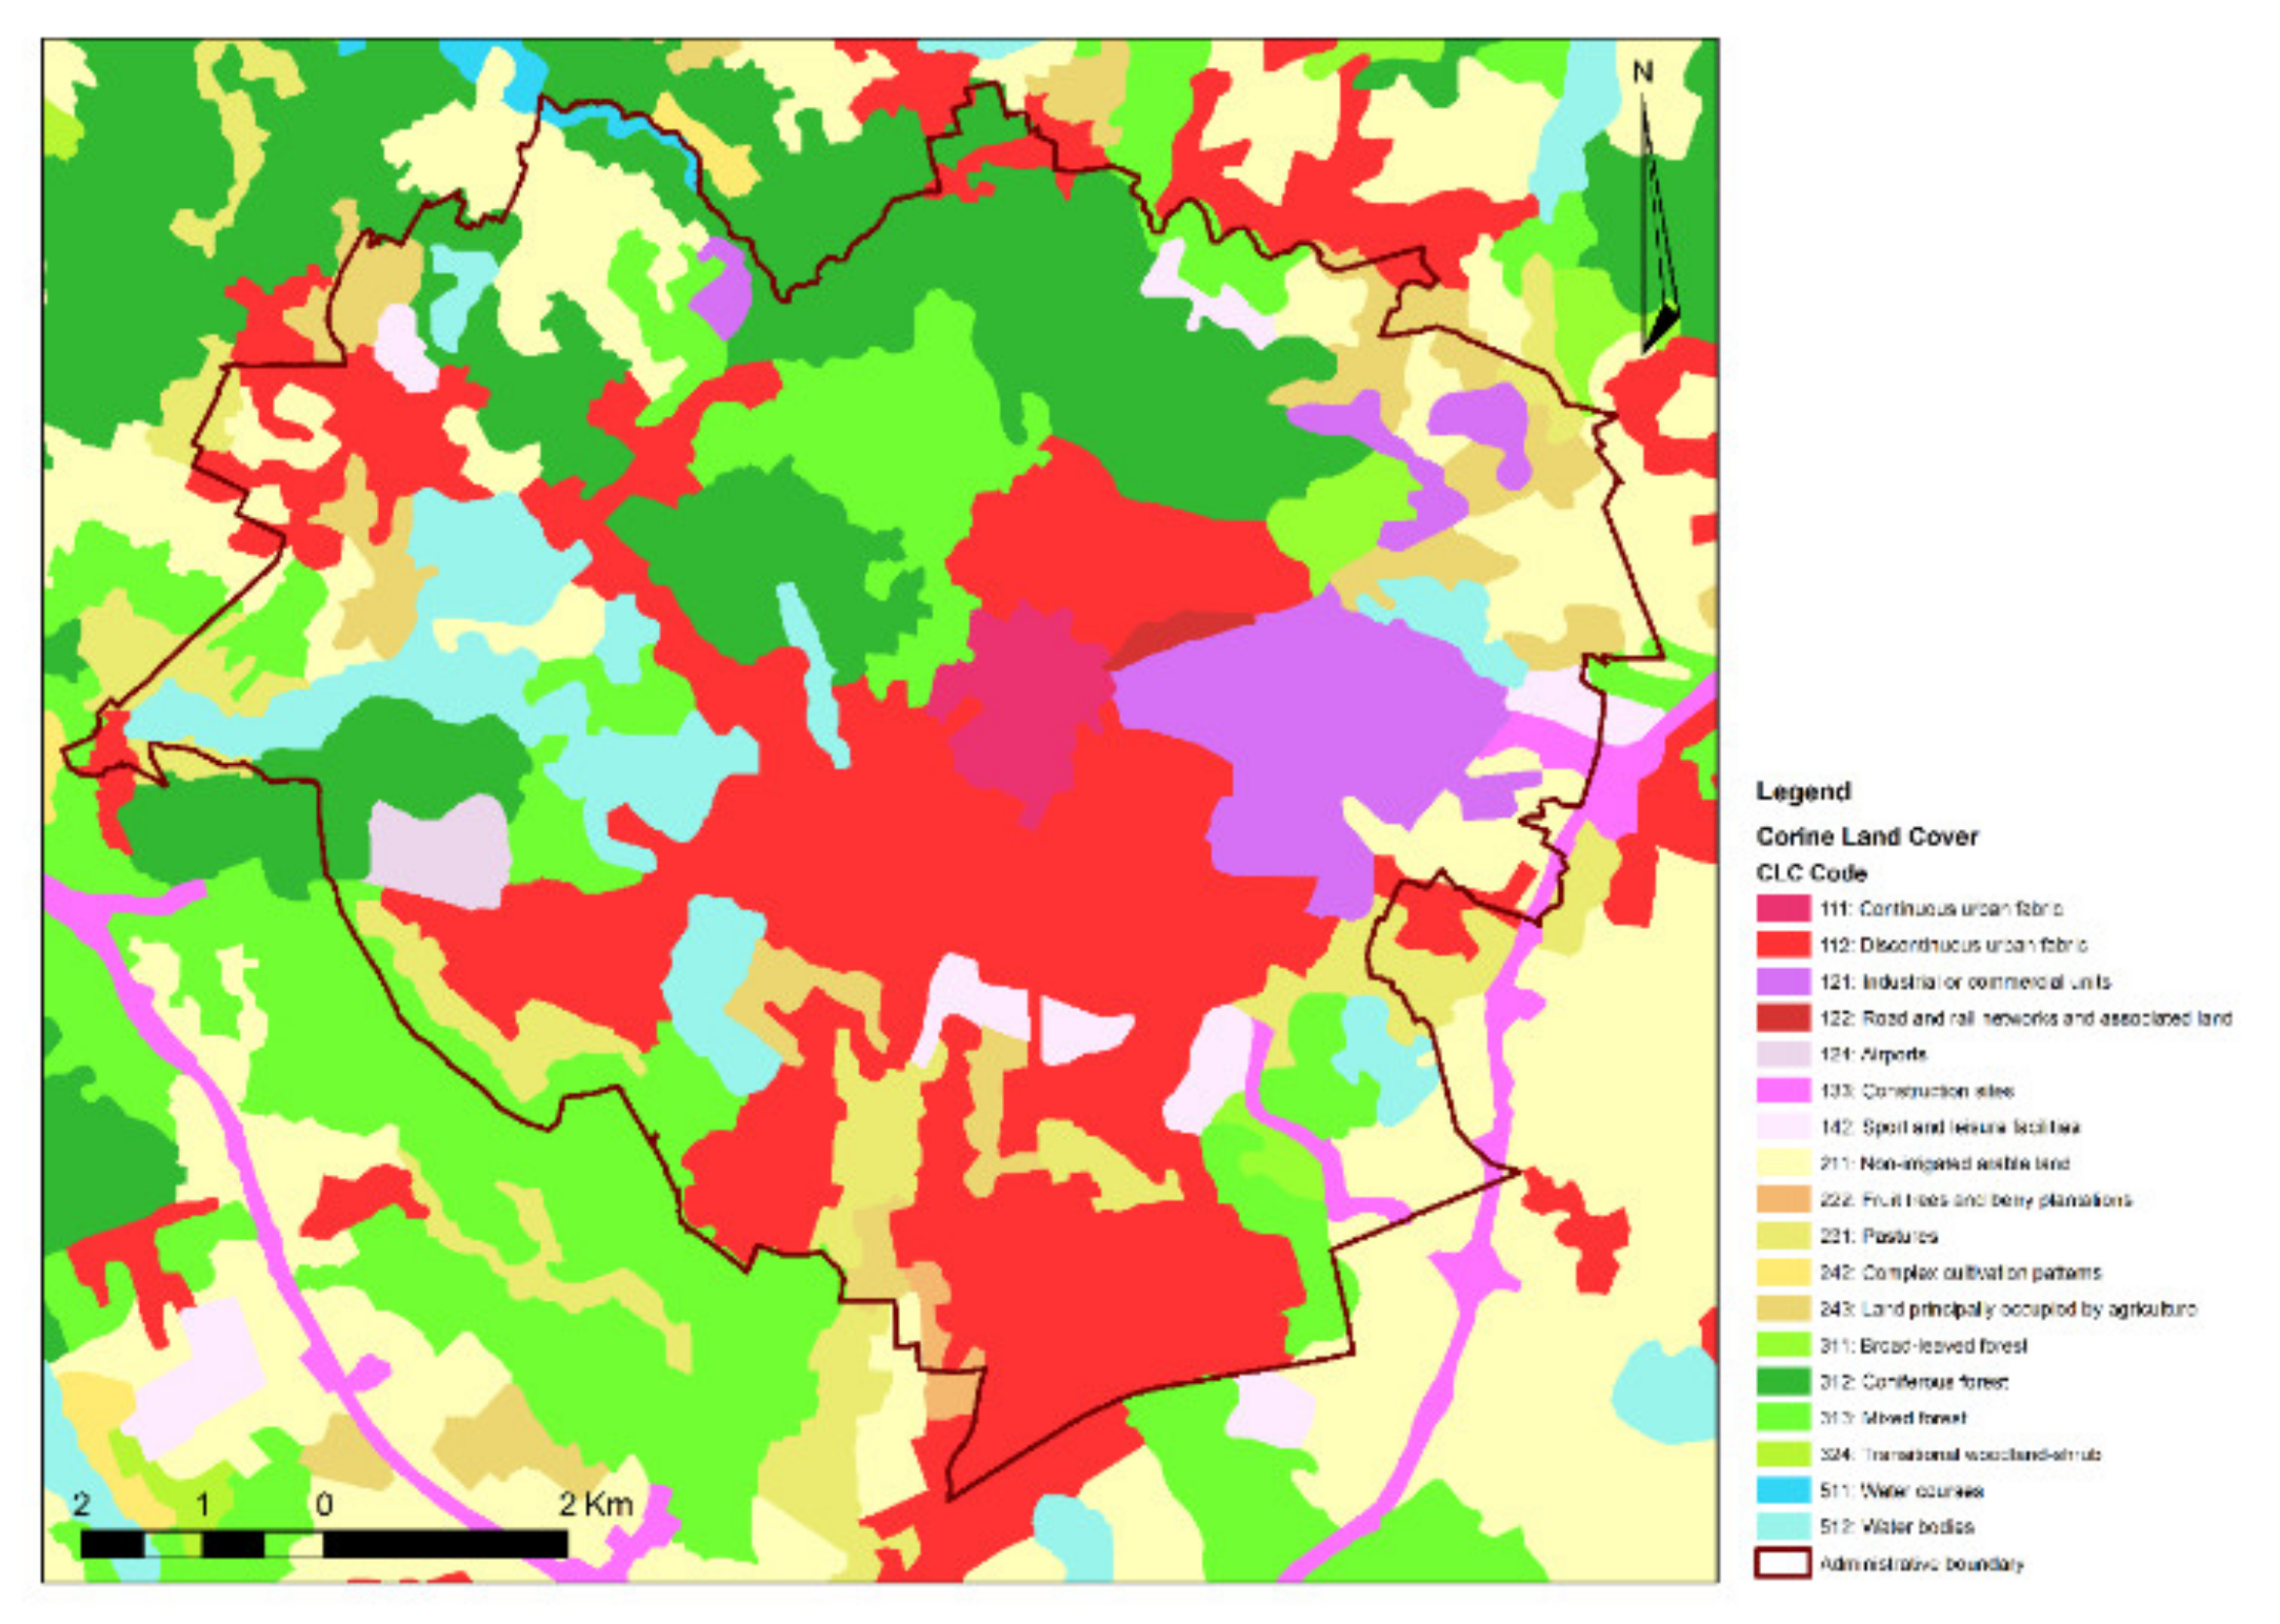
3.2.2. The Analysis of Urbanisation Processes Using Corine Land Cover Data (CLC) Data

The European Earth observation program known as Copernicus Land Monitoring provides two datasets on land cover characteristics in Corine Land Cover data (CLC) and High Resolution Layers (HRL). The Corine Land Cover initiated in 1985, updated in 2018, provides information for the whole area of the European Union—39 countries. Mainly, the identification of land cover is mapped by a visual interpretation of high-resolution satellite images. The CLC dataset is divided into 44 classes, which describe five categories: artificial surfaces, agricultural areas, forest and seminatural areas, open spaces with little or no vegetation and wetlands and water bodies [23,48,83,84].
A land cover model based on Corine Land Cover data (CLC) is presented in a study conducted by Biłozor A. et al. (Identification and Location of a Transitional Zone between an Urban and a Rural Area Using Fuzzy Set Theory, CLC, and HRL Data). The result of the aggregation of individual CLC data classes defining the range of land uses for the selected area is shown in Figure 8.
The CORINE Land Cover (CLC) databases compiled for the period 1990–2000–2006–2012–2018 provide another reliable source of information about ongoing urbanisation processes. One of the uncontrolled urbanisation phenomena is suburbanisation connected with the emergence of urbanised areas far beyond the city limits in the form of often chaotically located buildings. This is common practice but is undesirable due to the quality of these areas, which tend to be poorly equipped with technical infrastructure and significantly increase the cost of commuting to work and of basic services. An example of using the CLC database, Geographical Information System (GIS) tools and the over-urbanisation (OU) indicator described in the publication: The Use of the CORINE Land Cover (CLC) Database for Analyzing Urban Sprawl [84] is presented in Figure 9.

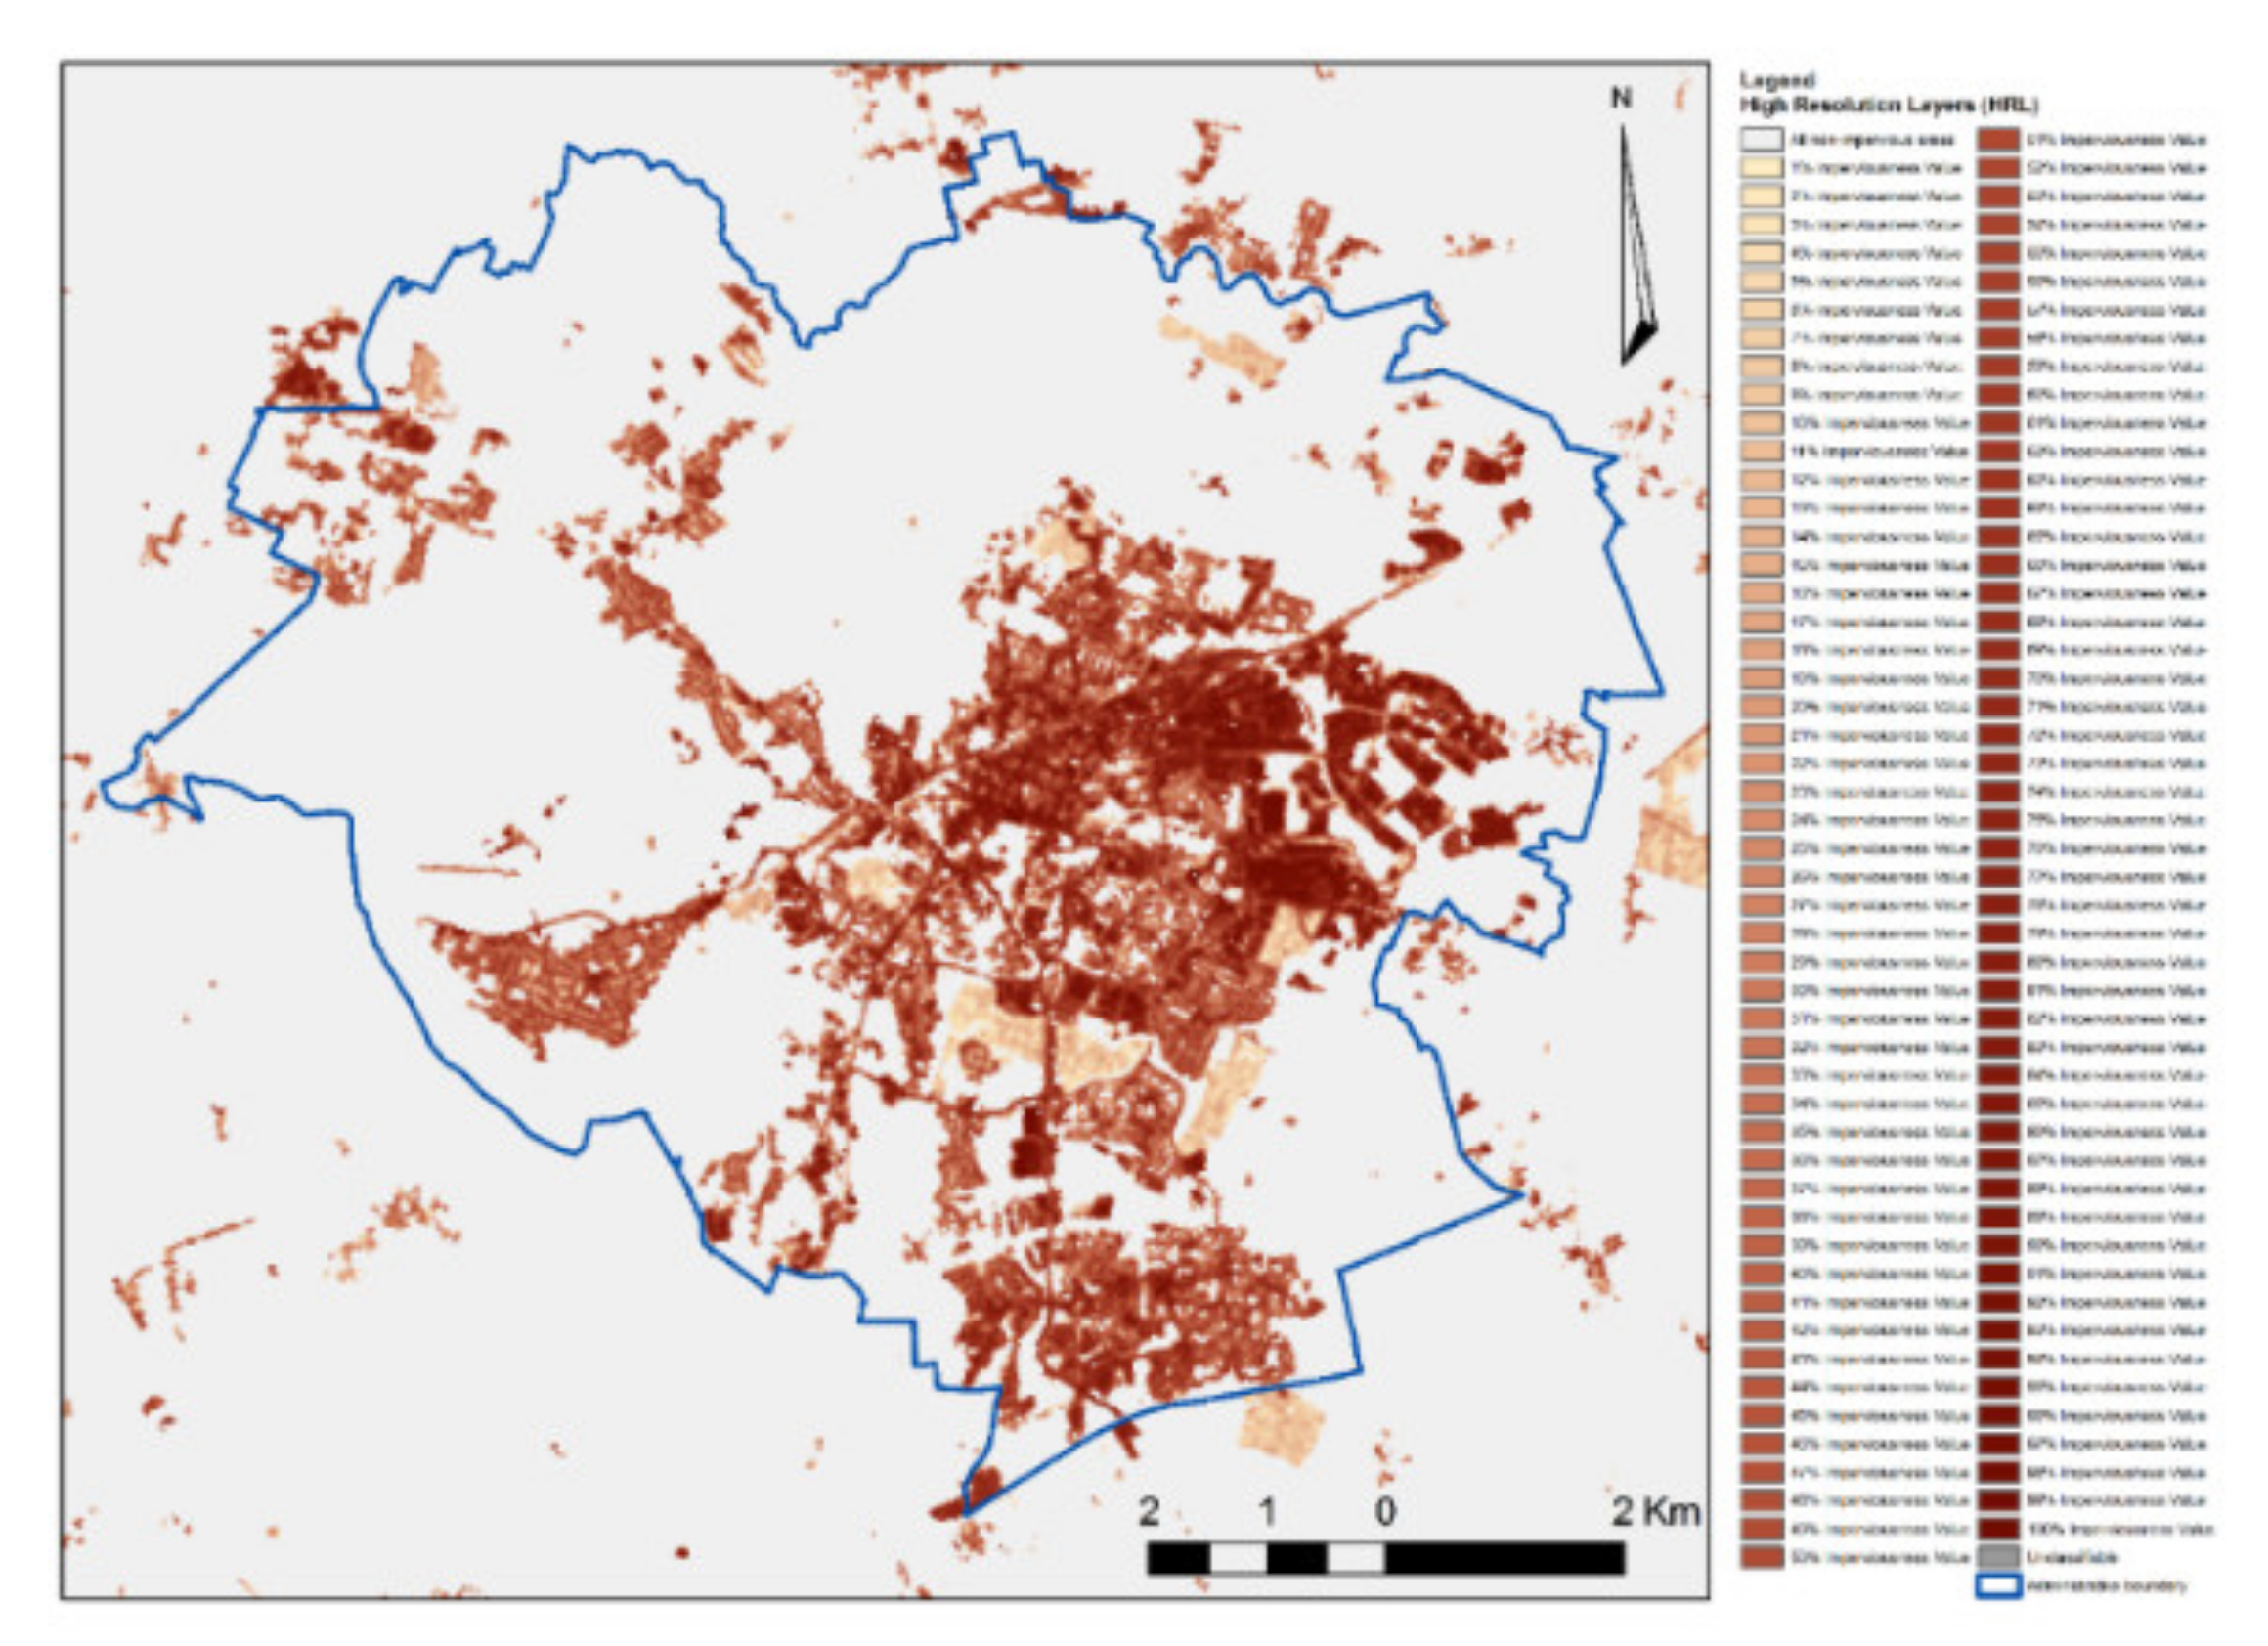
3.2.3. The Analysis of Urbanisation Processes Using High Resolution Layers Data (HRL)

Another type of data-High Resolution Layers (HRL) provides more detailed information about land cover than CLC. This dataset was first produced in 2012 from satellite imagery through a combination of automatic processing and interactive rule-based classification. Currently, the main source of data are satellites created in the Sentinel project, in particular, Sentinel-2 and Sentinel-1, which allows the use of different sensors, including optical and radar. In this dataset, which is presented in spatial resolution of 20 × 20 m for 39 countries in the EU, five themes can be identified which correspond with the main categories in CLC. The level of sealed soil (imperviousness degree 1–100%) which is produced using a semi-automated classification based on calibrated NDVI, captures the different types of specific land cover. Those five products capture the spatial distribution of Imperviousness, Forest, Natural Grassland, Wetlands, Permanent Water-bodies, Wetness and Water and Small Woody Features [85,86,87]. The land cover model based on HRL Imperviousness data is presented in Biłozor A., Czyża Sz., Bajerowski T.-Identification and Location of a Transitional Zone between an Urban and a Rural Area Using Fuzzy Set Theory, CLC, and HRL Data [48] (Figure 10). The conducted analyses included raster reclassification followed by the polygonization of urbanised areas. The measures taken enabled the indication of the boundary of the urban area, which, according to the adopted assumptions, determined areas with imperviousness at a level of 30%.
HRL databases are also a reliable source of information about ongoing urbanisation processes. In their research, Liua X. et al. (High-resolution multi-temporal mapping of global urban land using Landsat images based on the Google Earth Engine Platform) used the Normalized Urban Areas Composite Index (NUACI) method and utilised the Google Earth Engine to facilitate the global urban land classifications from an extensive number of Landsat images [87]. High-resolution multi-period mapping (with a 5-year interval) of global urban areas using Landsat imagery based on the Google Earth Engine platform is shown in Figure 11.

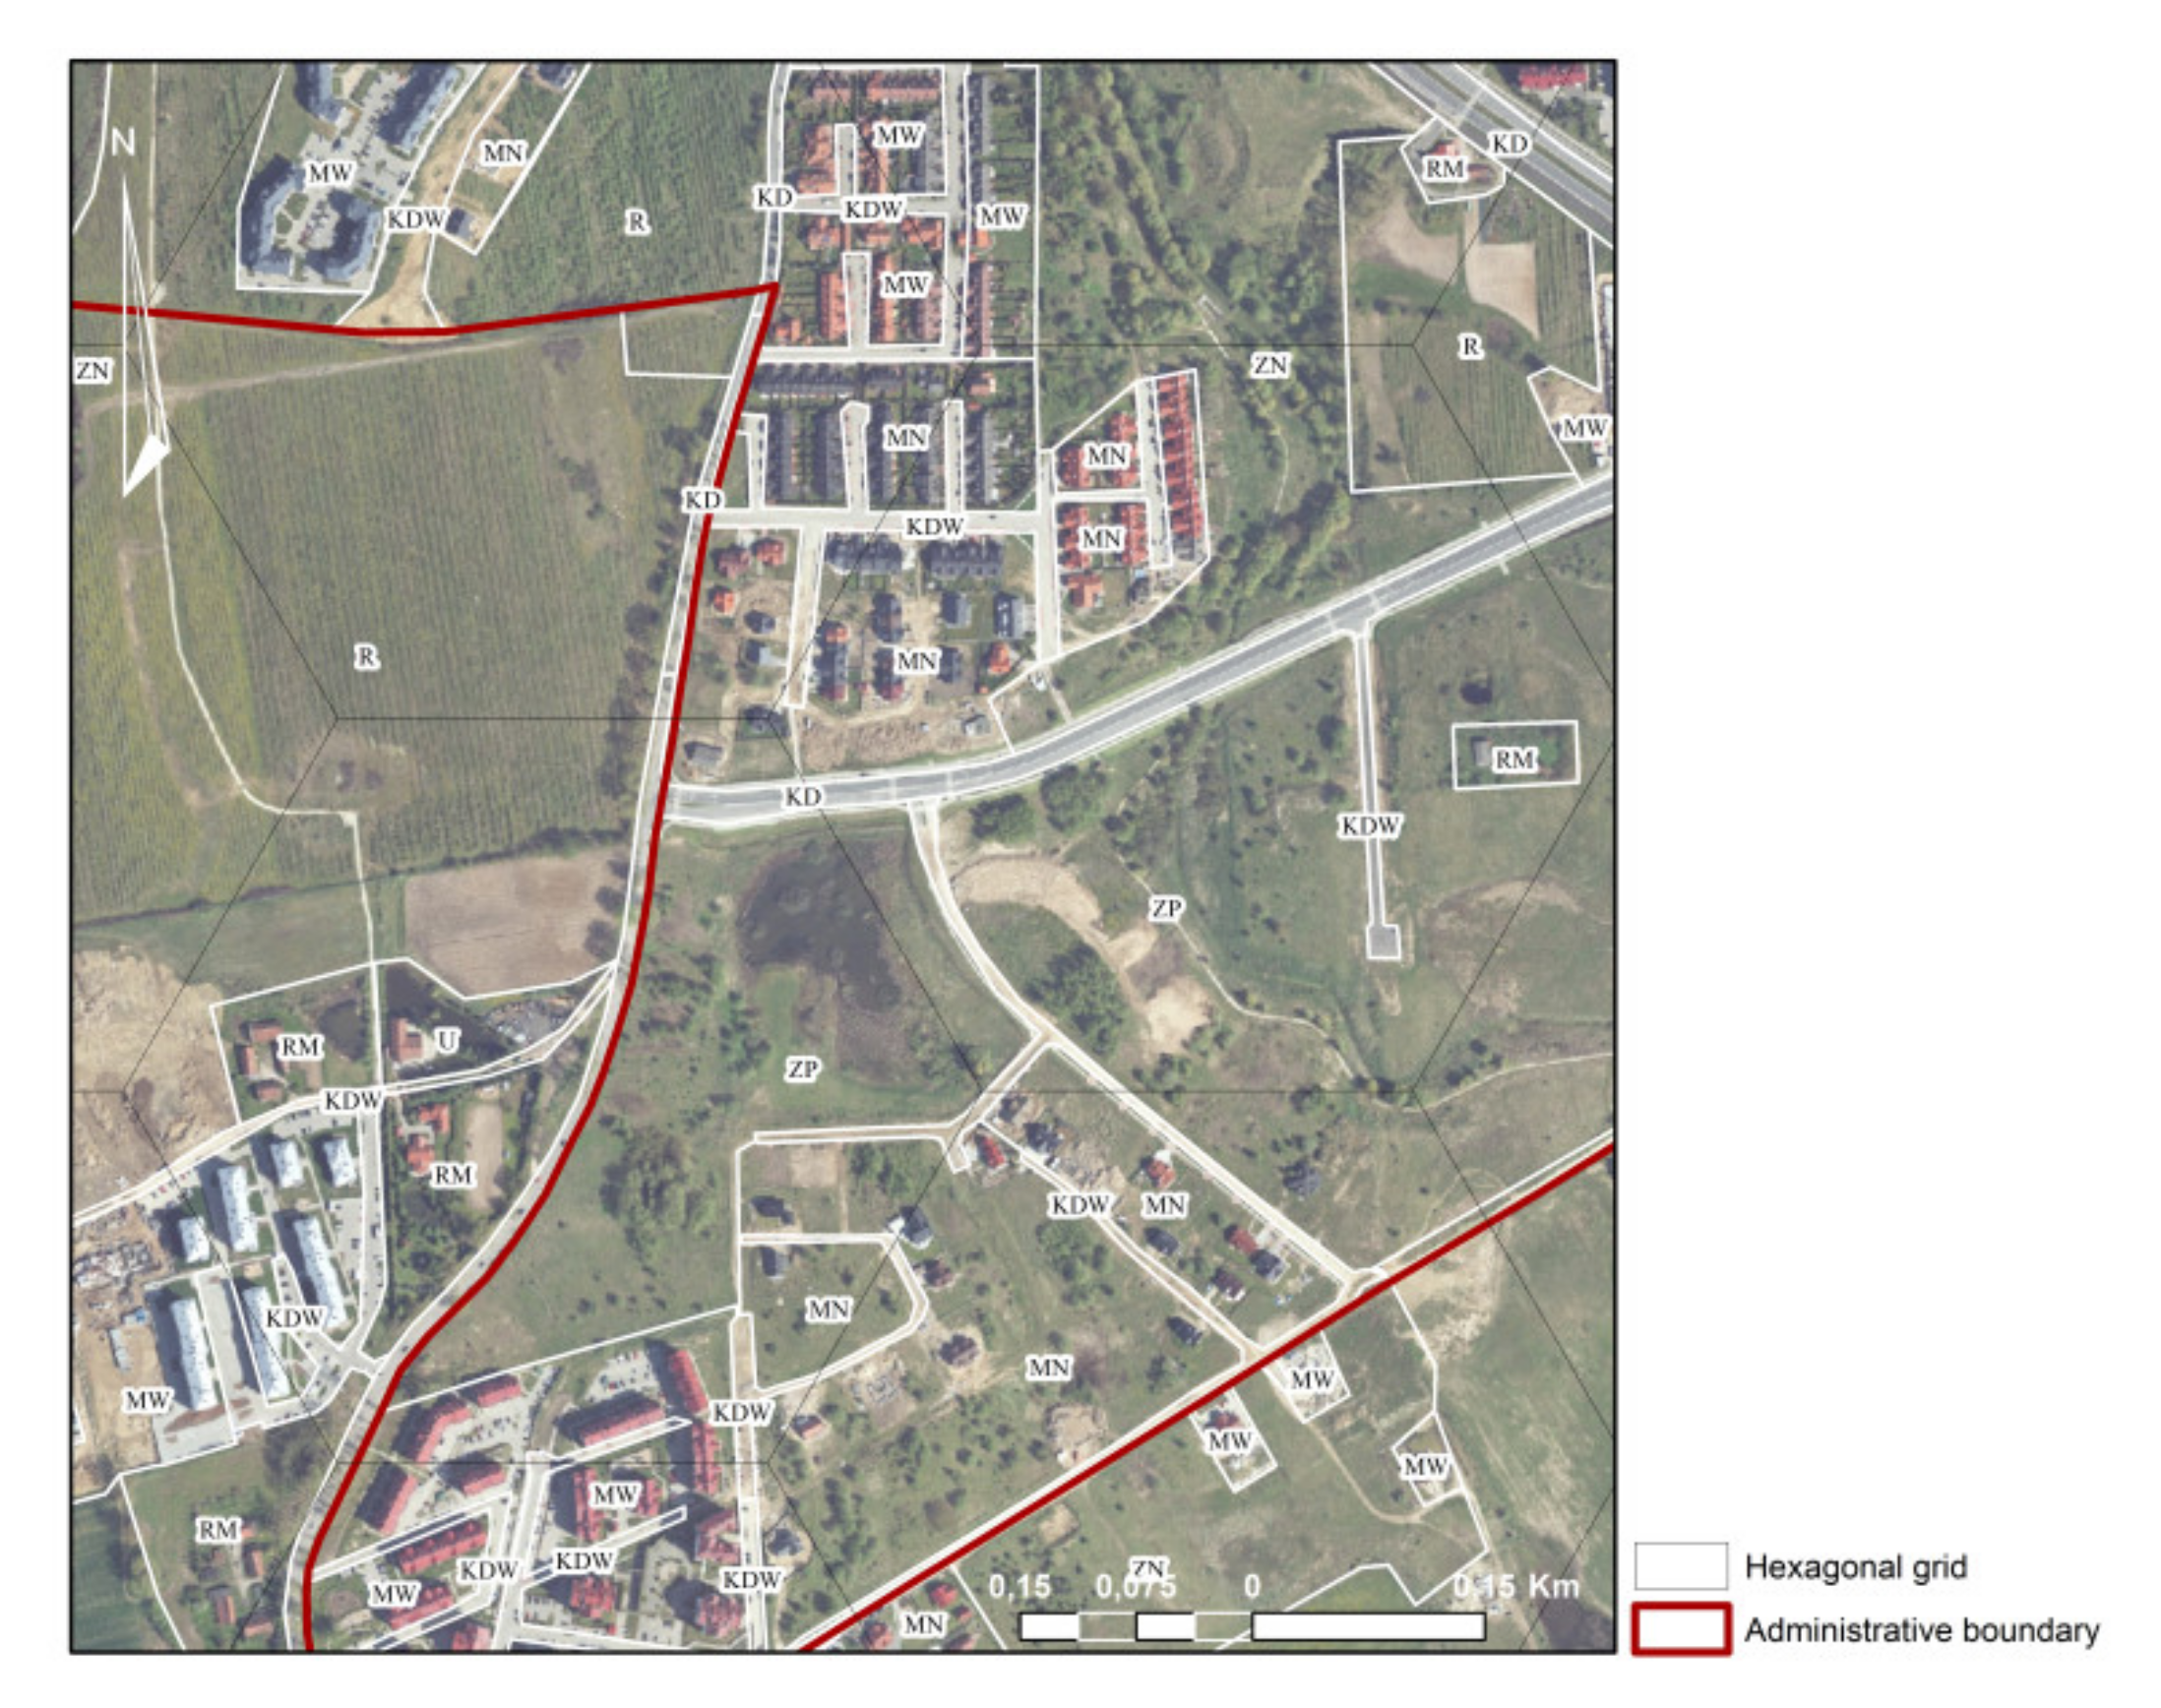
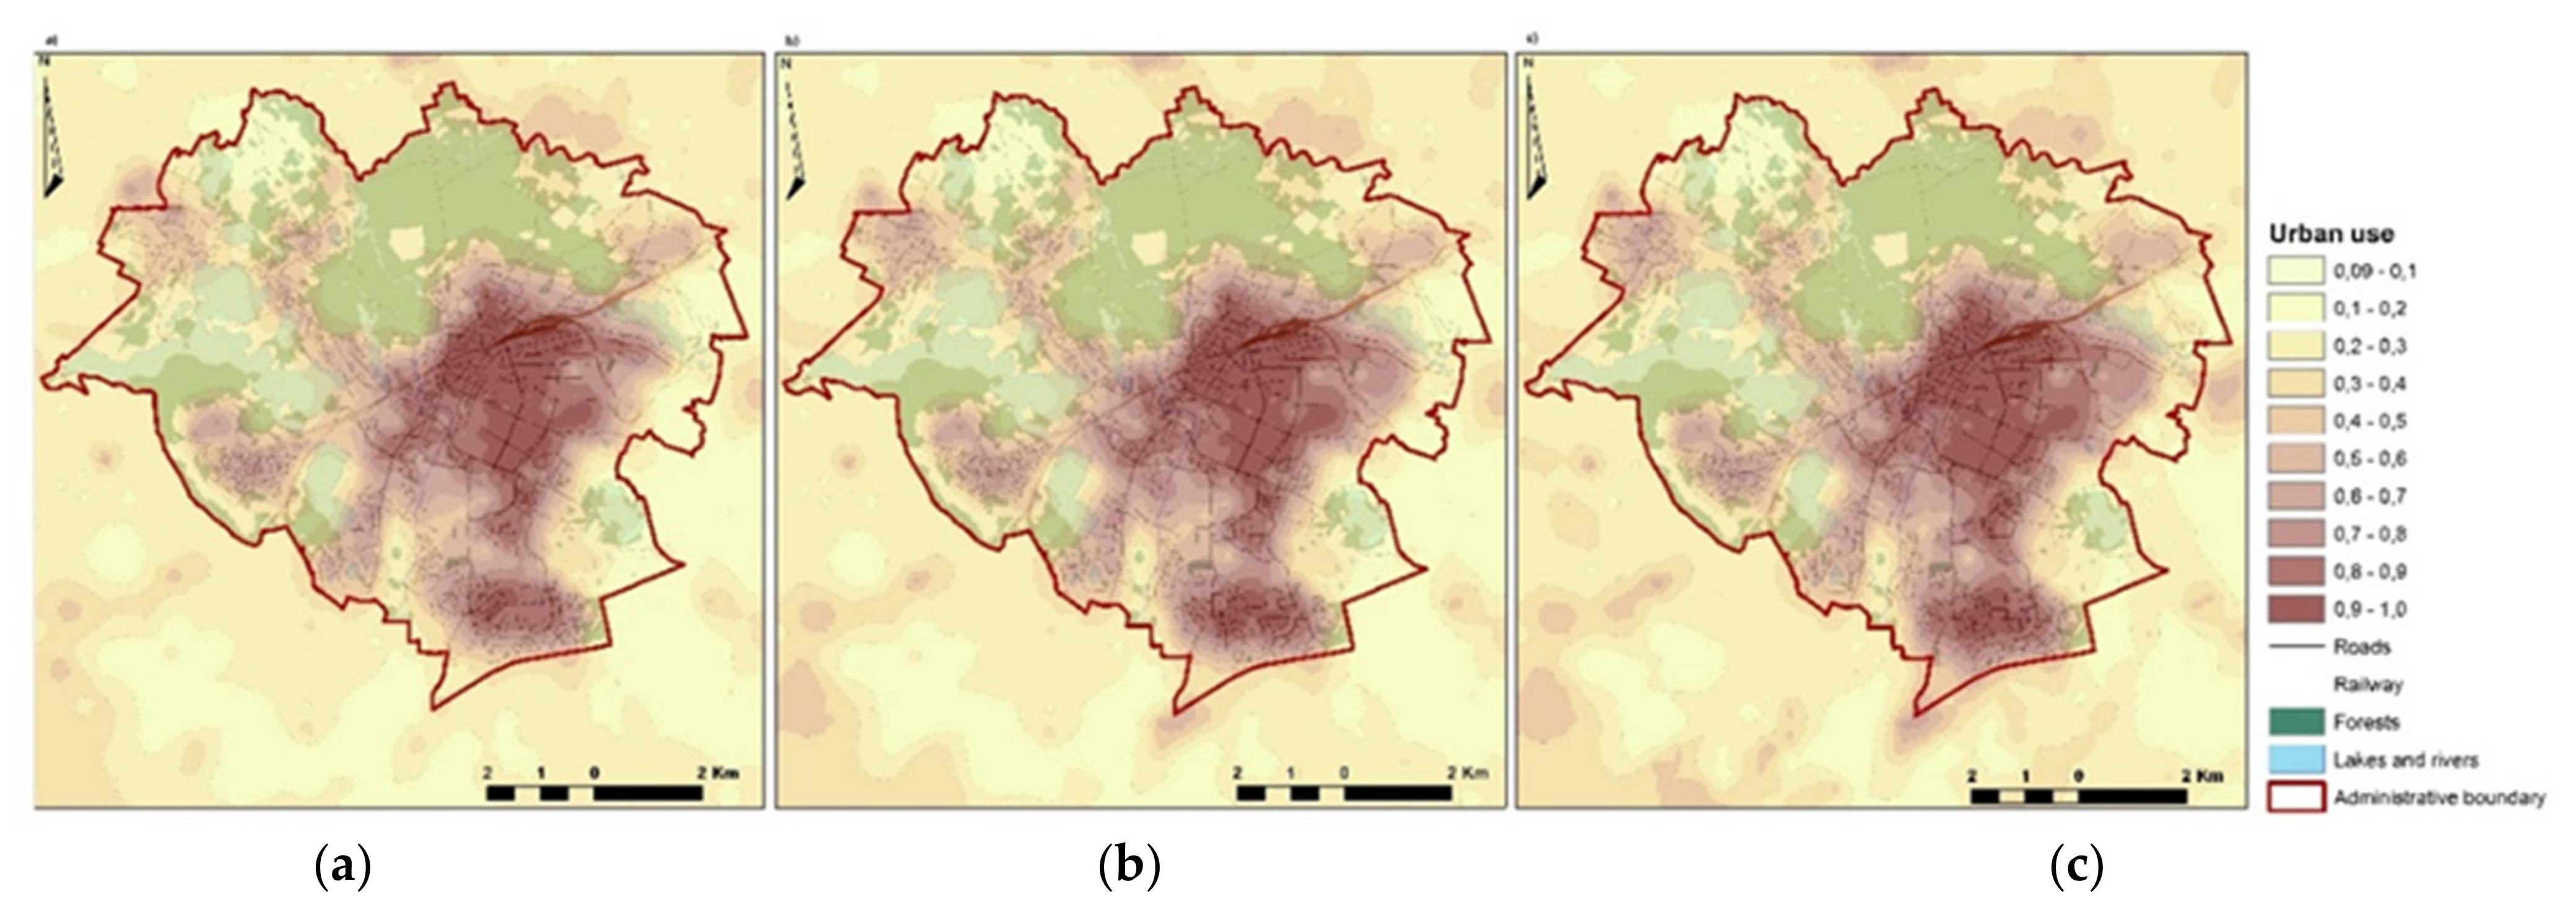
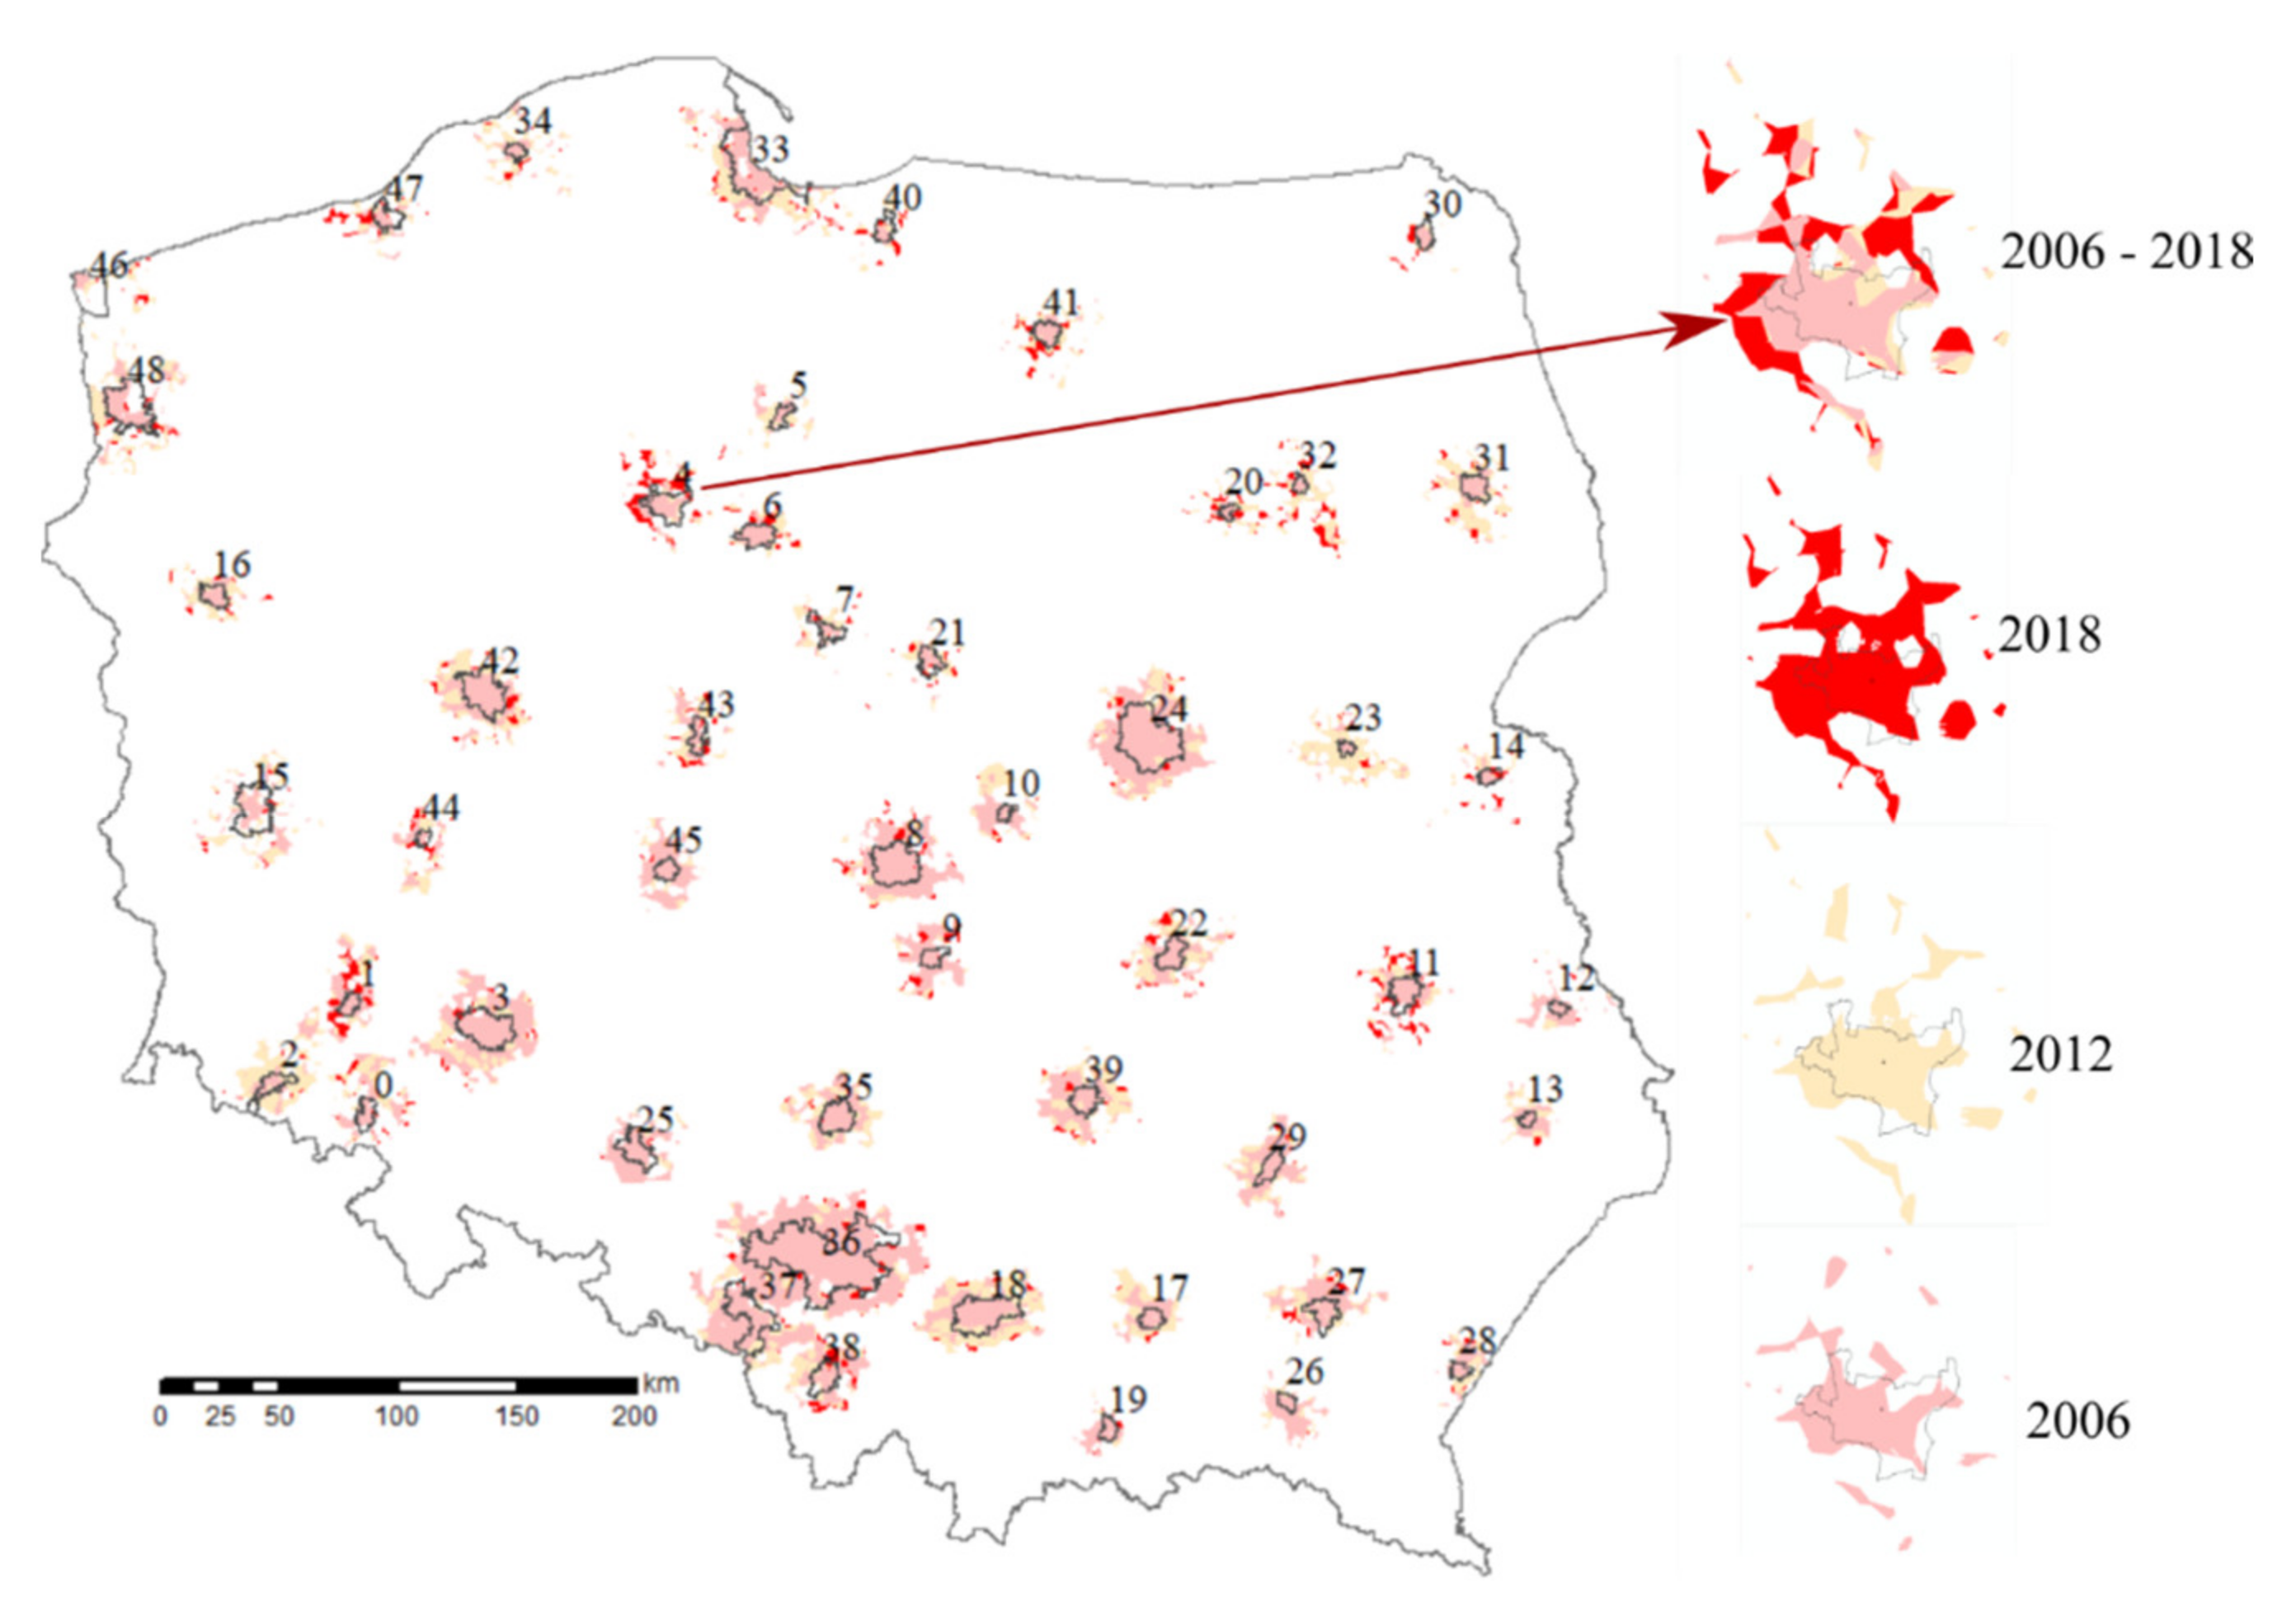
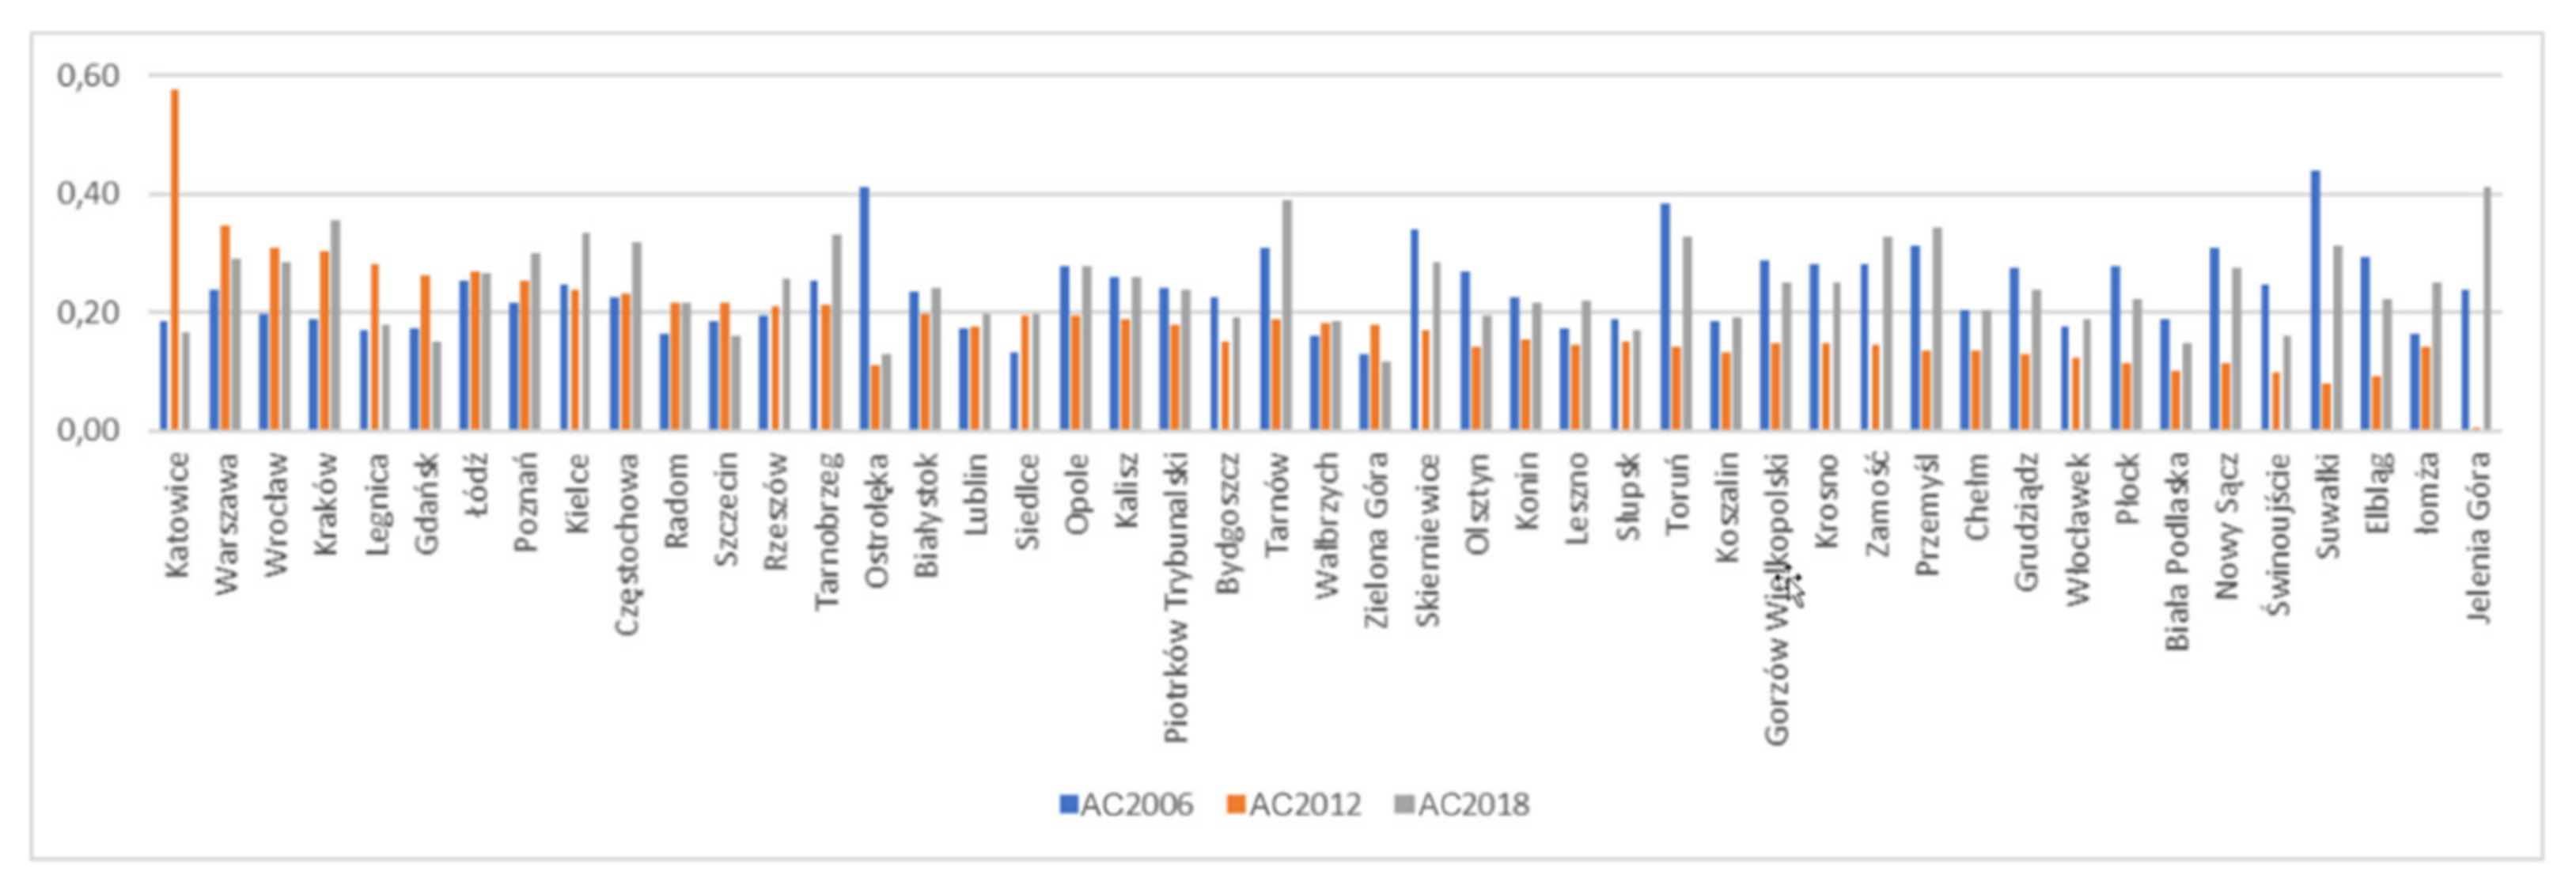
3.2.4. The Analysis of Urbanisation Processes Using Urban Atlas Data

The Urban Atlas contains pan-European comparable data on land cover and land use comprising a range of functional urban areas. The presented example describes changes to the urban landscape identified and assessed using the Urban Atlas data. The aim of the research conducted by Pazúr R. et al. (Changes of urbanised landscape identified and assessed by the Urban Atlas data: Case study of Prague and Bratislava [88]) was to document, examine and compare changes in land use/cover (LUCC) of LUZ (Large Urban Zones) in Bratislava and Prague in 2006–2012 using the UA data, and to demonstrate how these changes are recorded in official statistics—Figure 12.

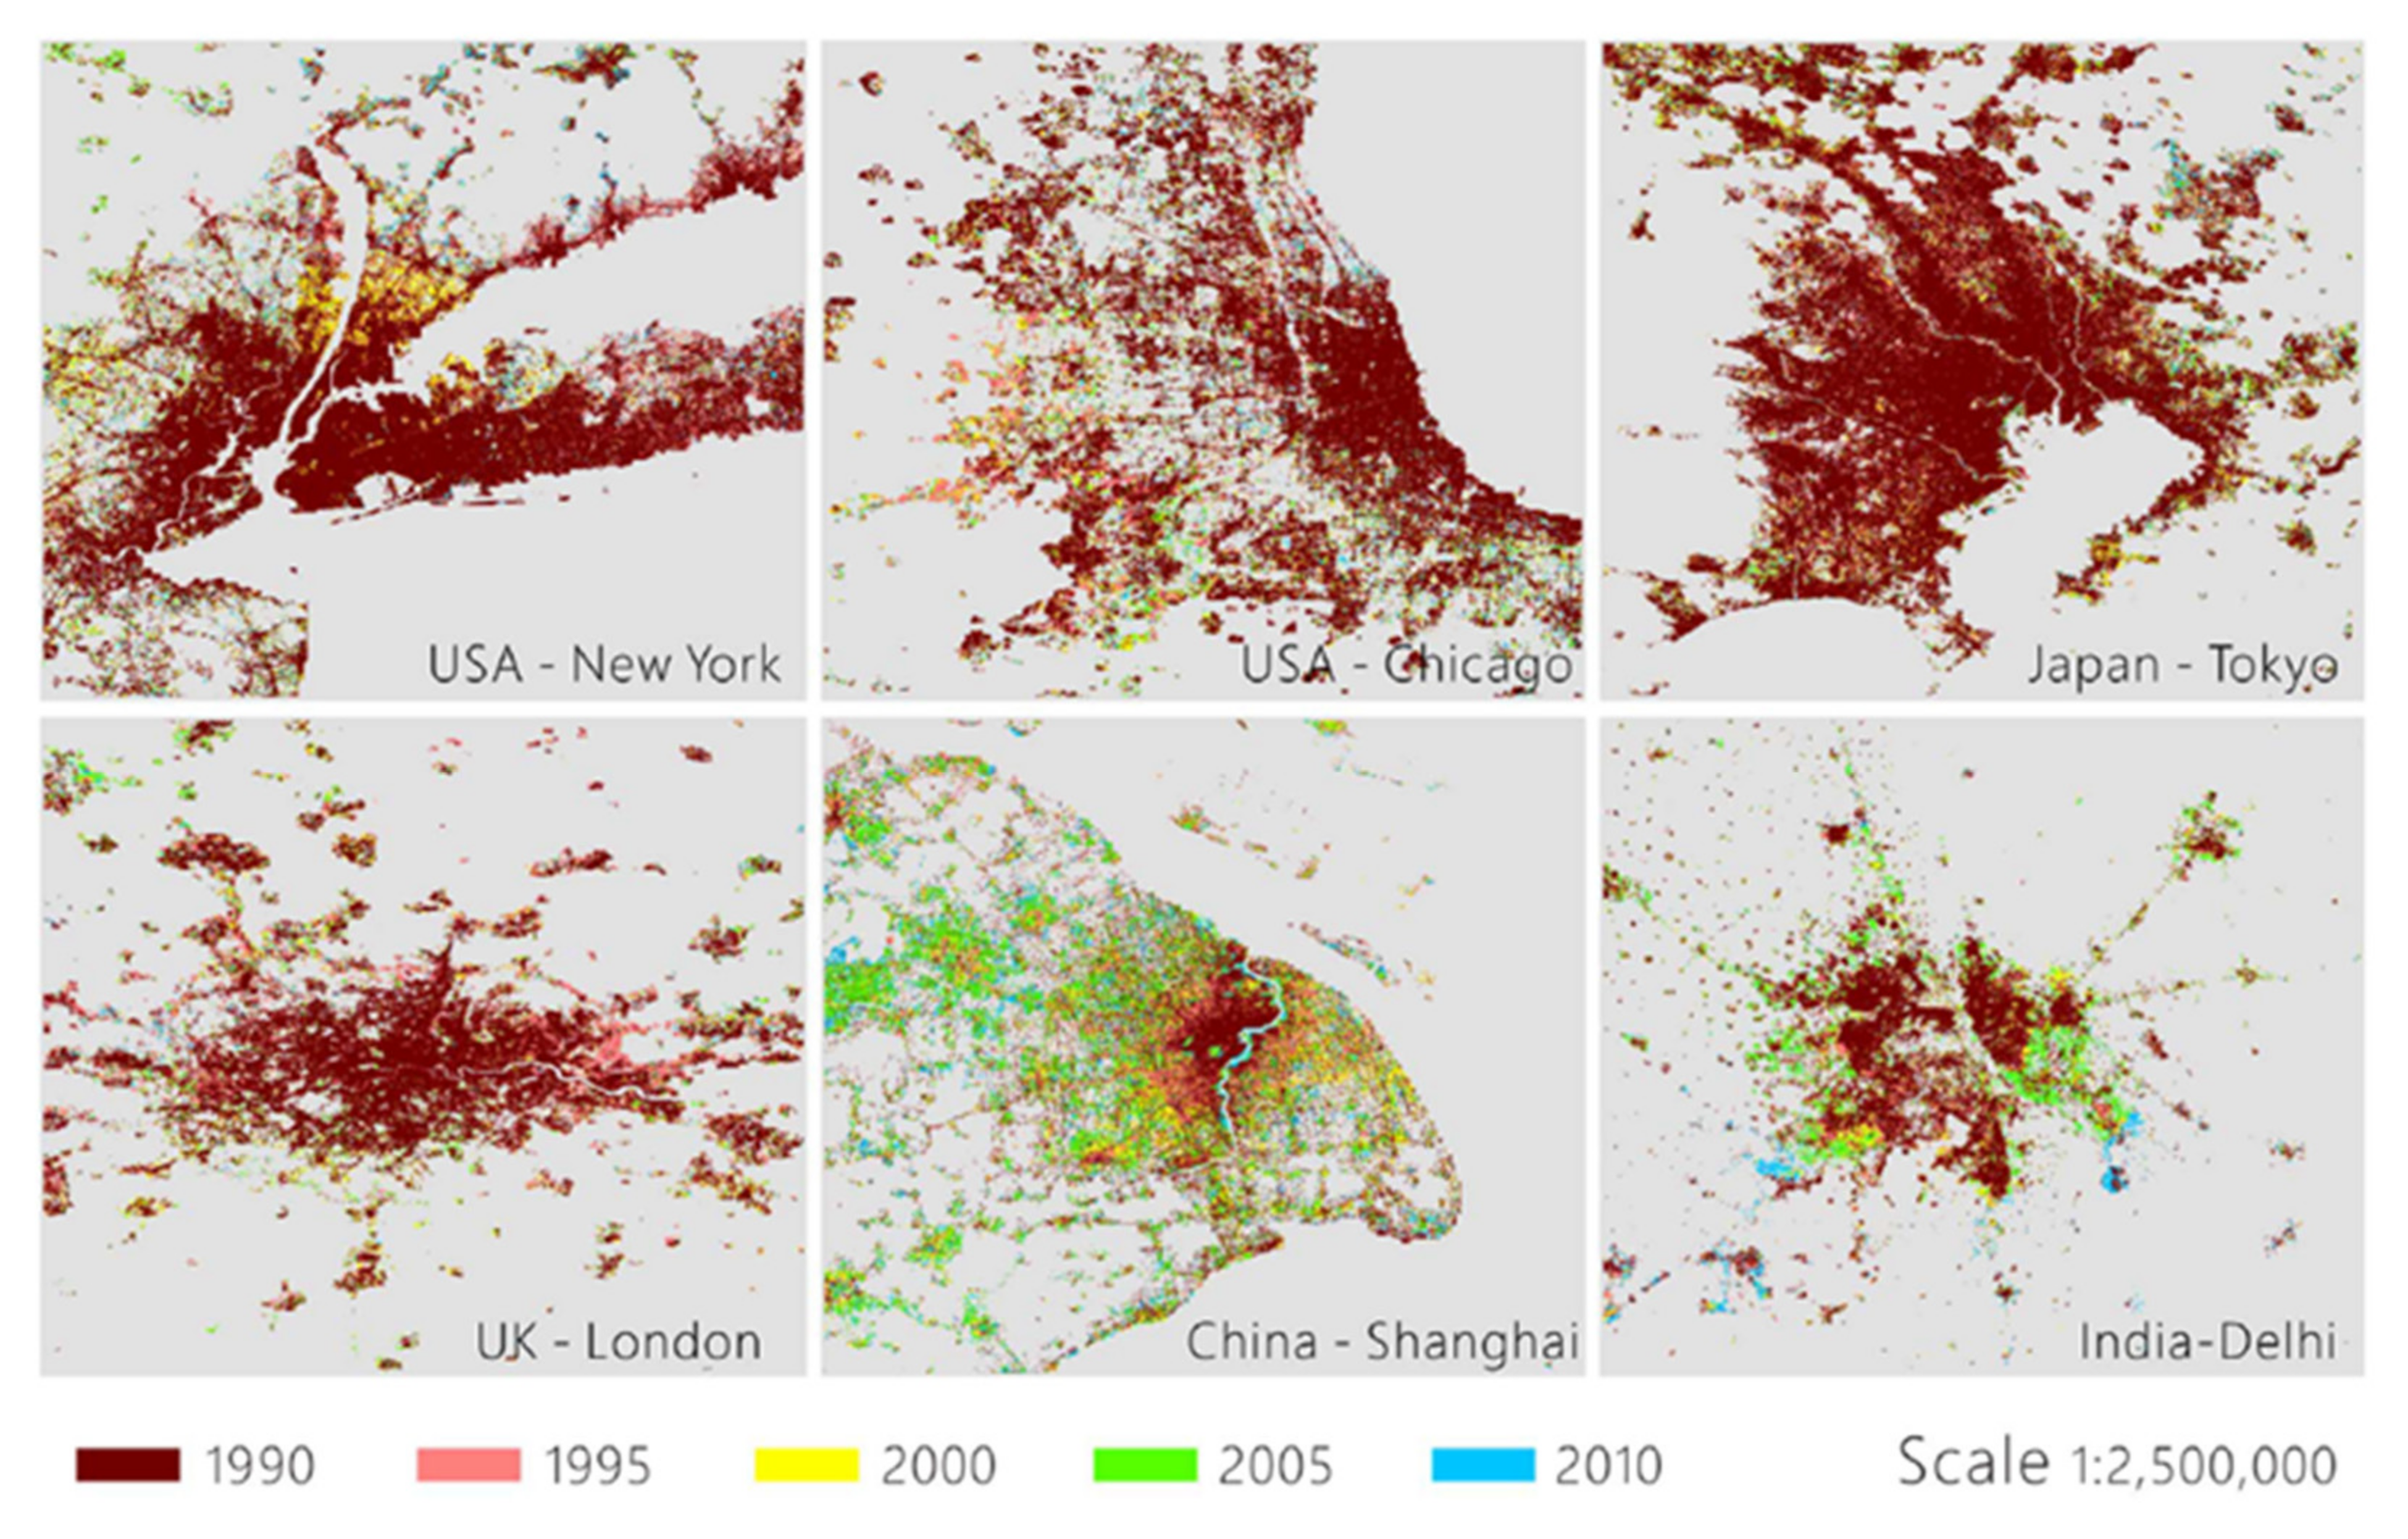
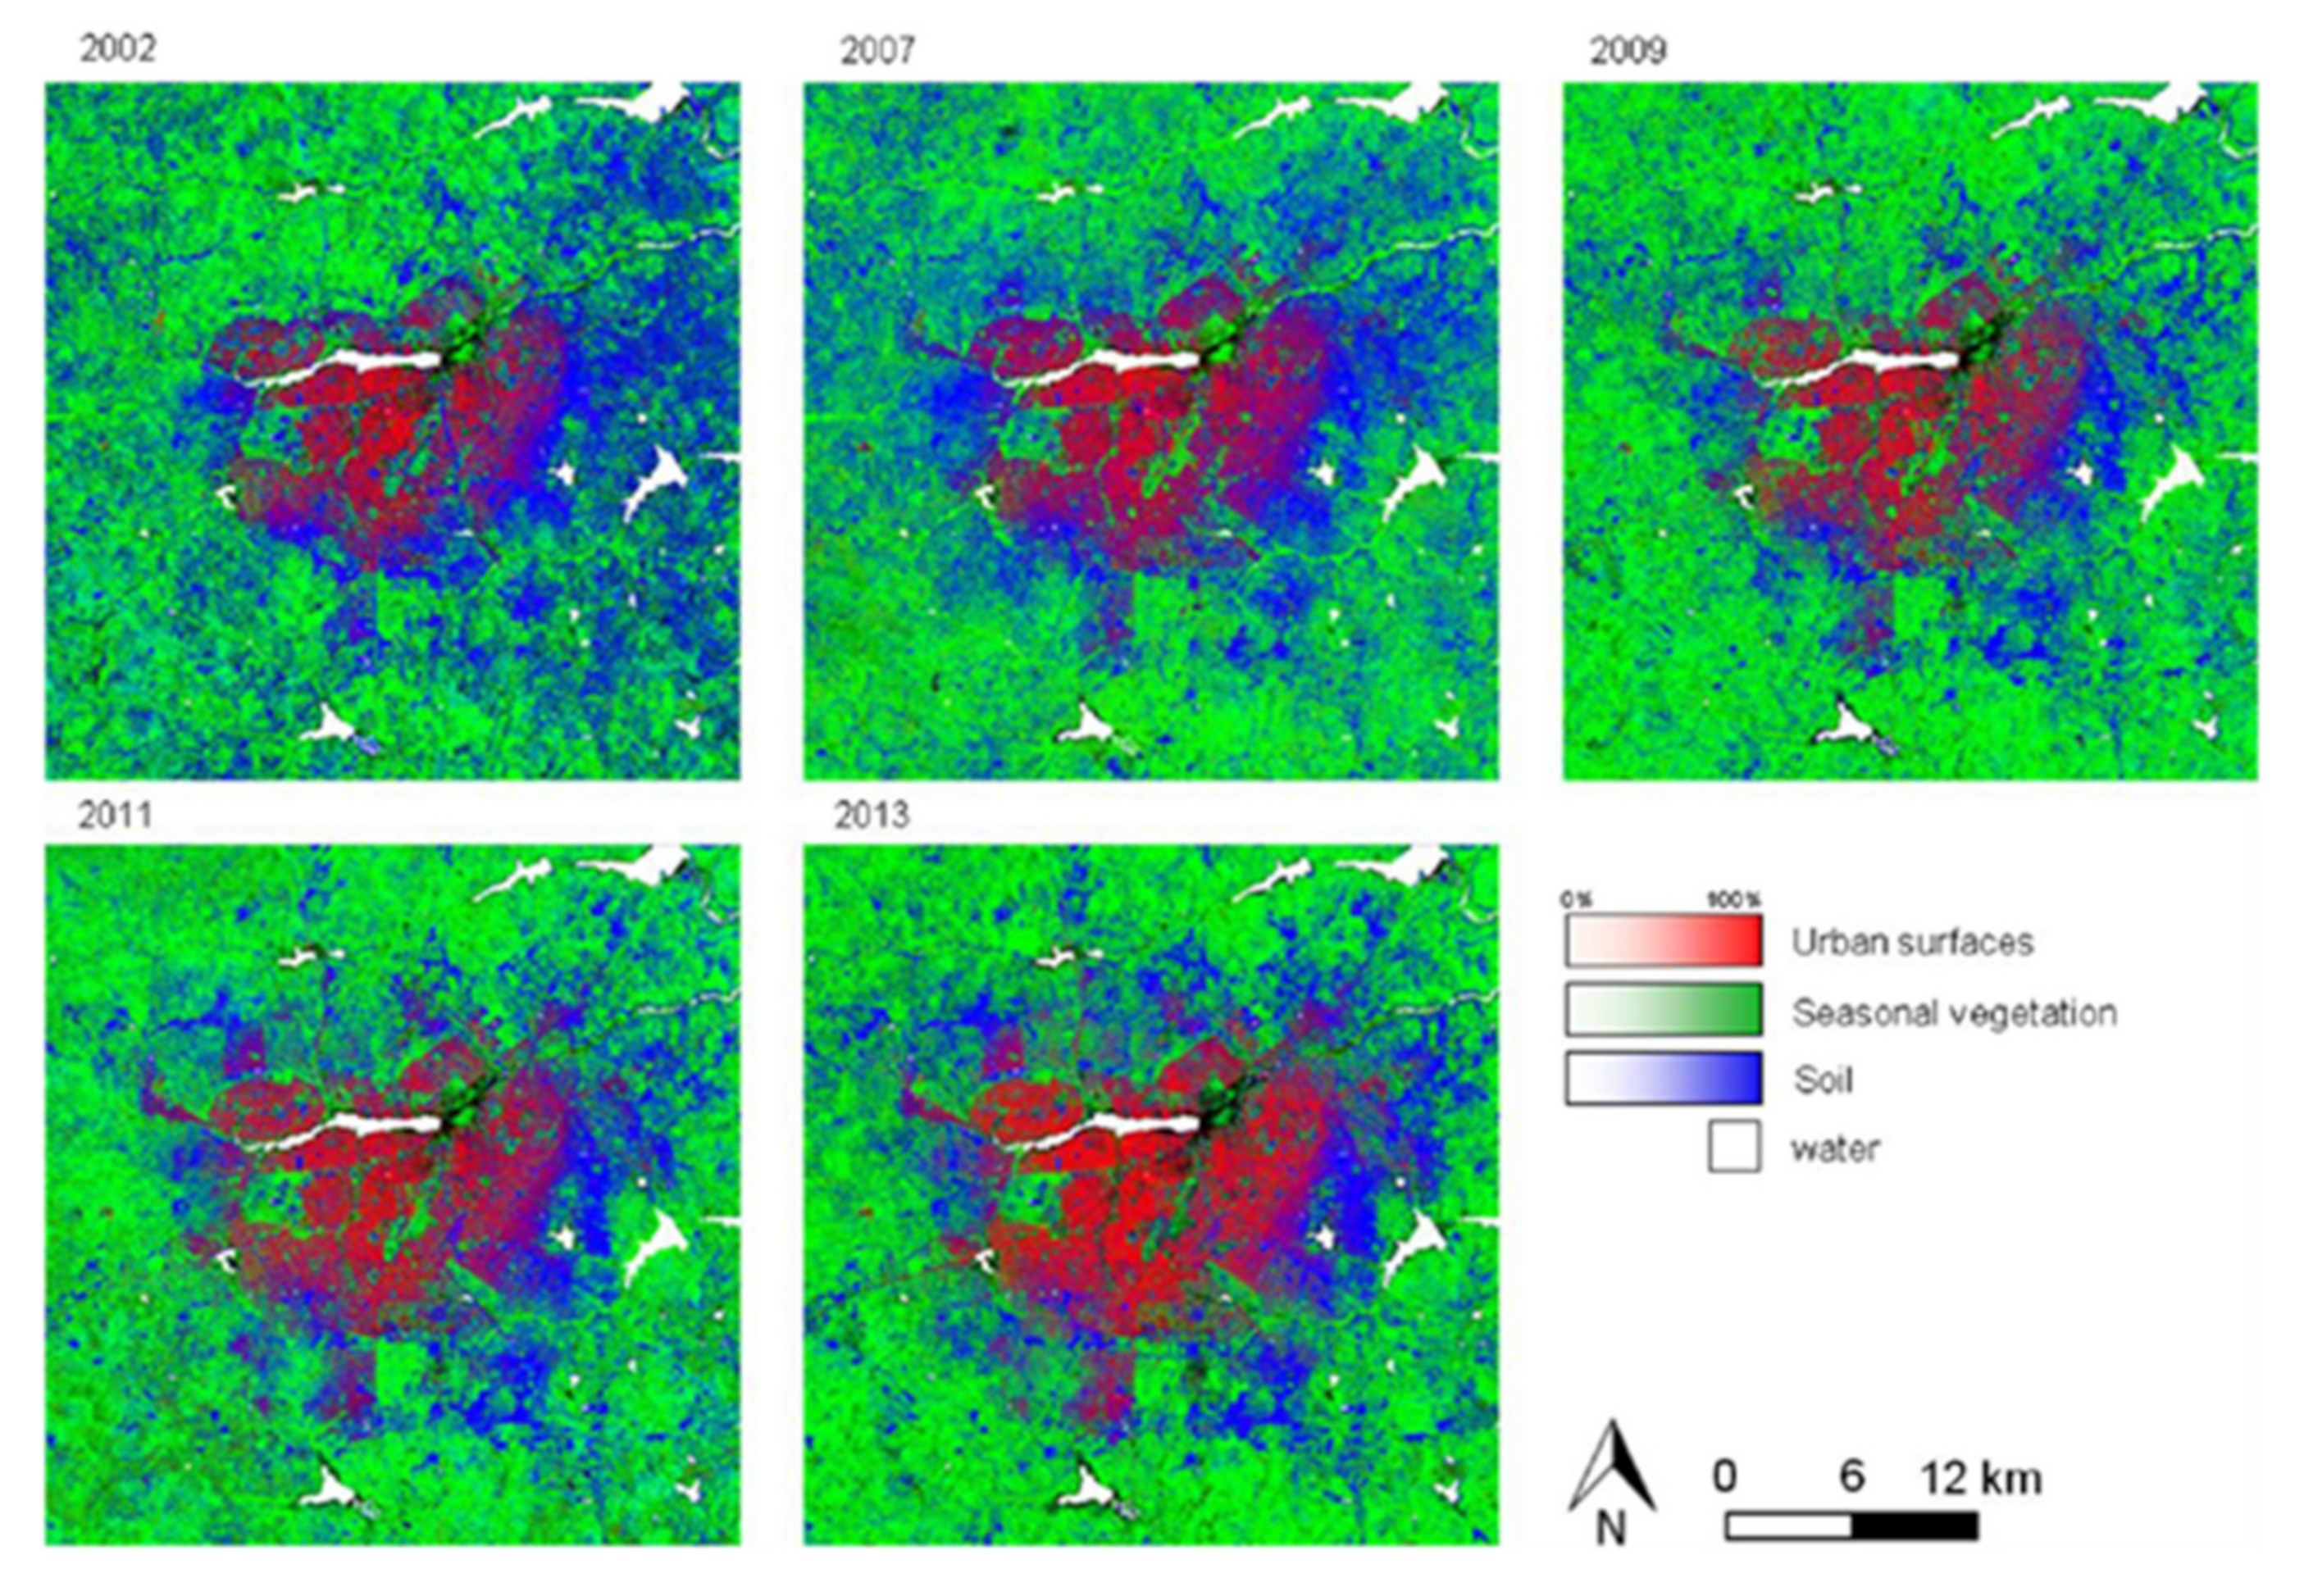
3.2.5. Monitoring Changes in Land Use with Landsat Time Series

The presented example shows the mapping of urban development patterns in Ouagadougou, Burkina Faso, using machine learning regression modelling with Landsat two-season time series [89]—Figure 13. The study was designed to quantify land cover for the Ouagadougou metropolitan area from 2002 to 2013 using Landsat-TM/ETM + /OLI time series.

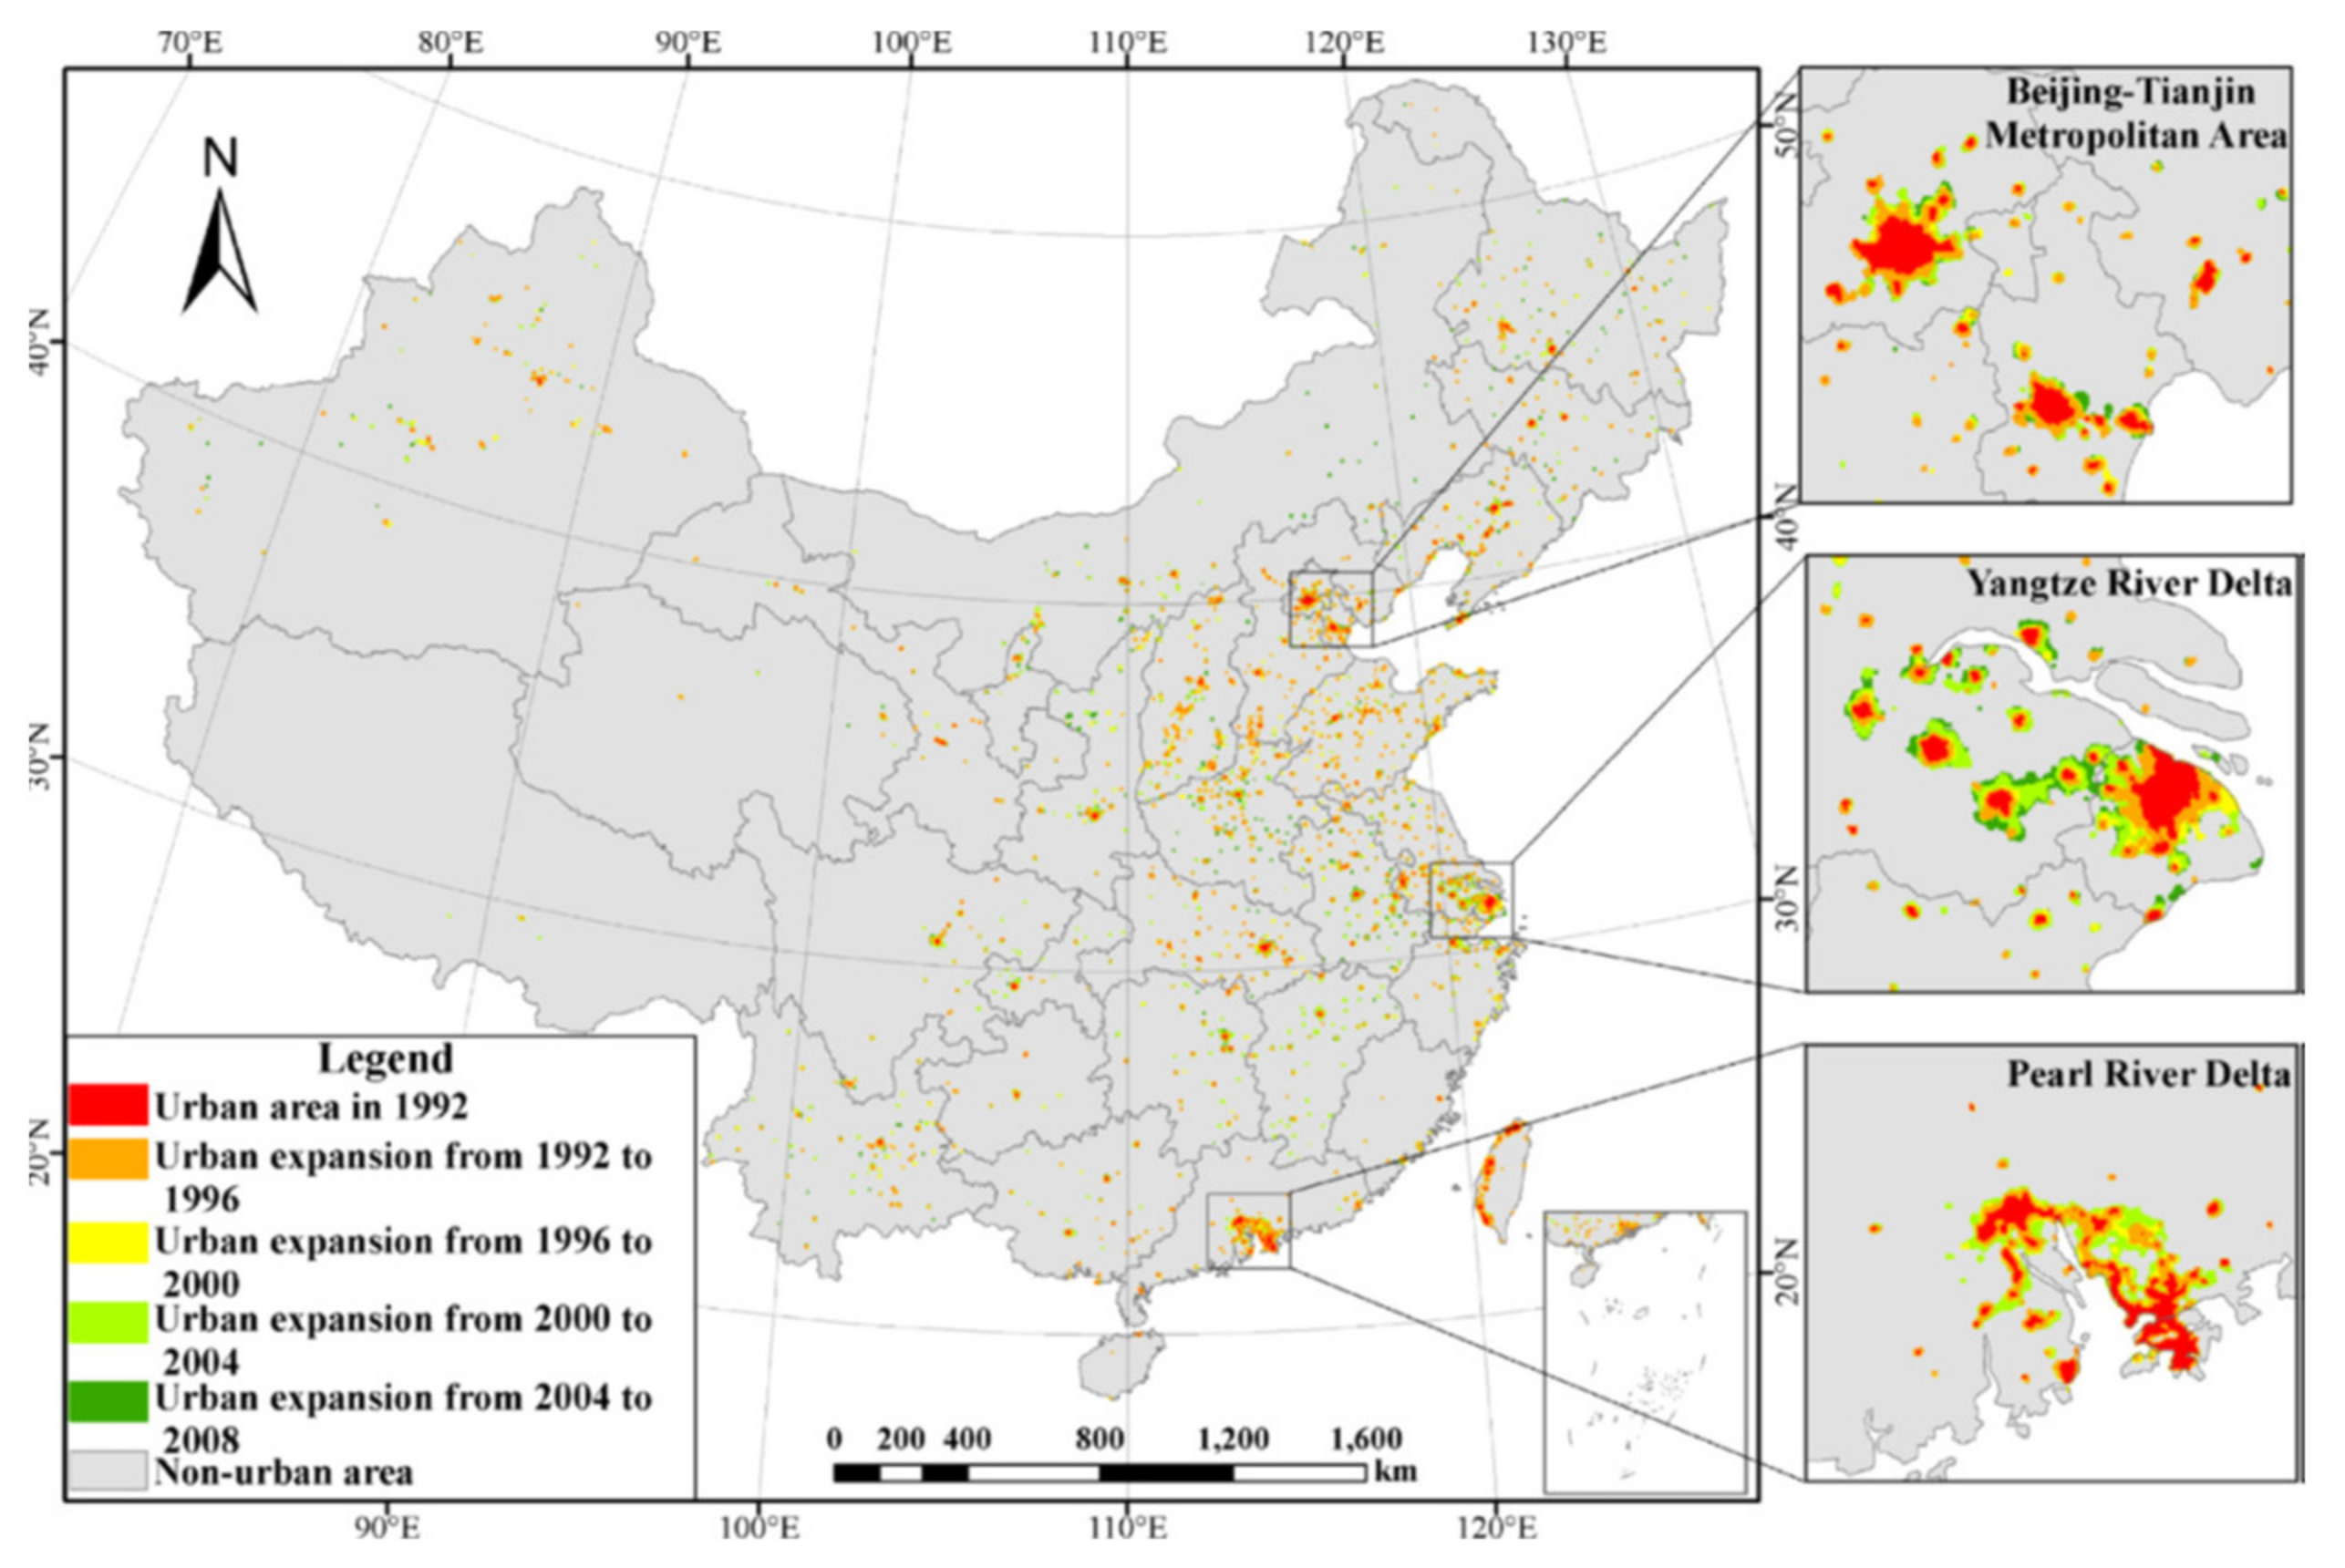
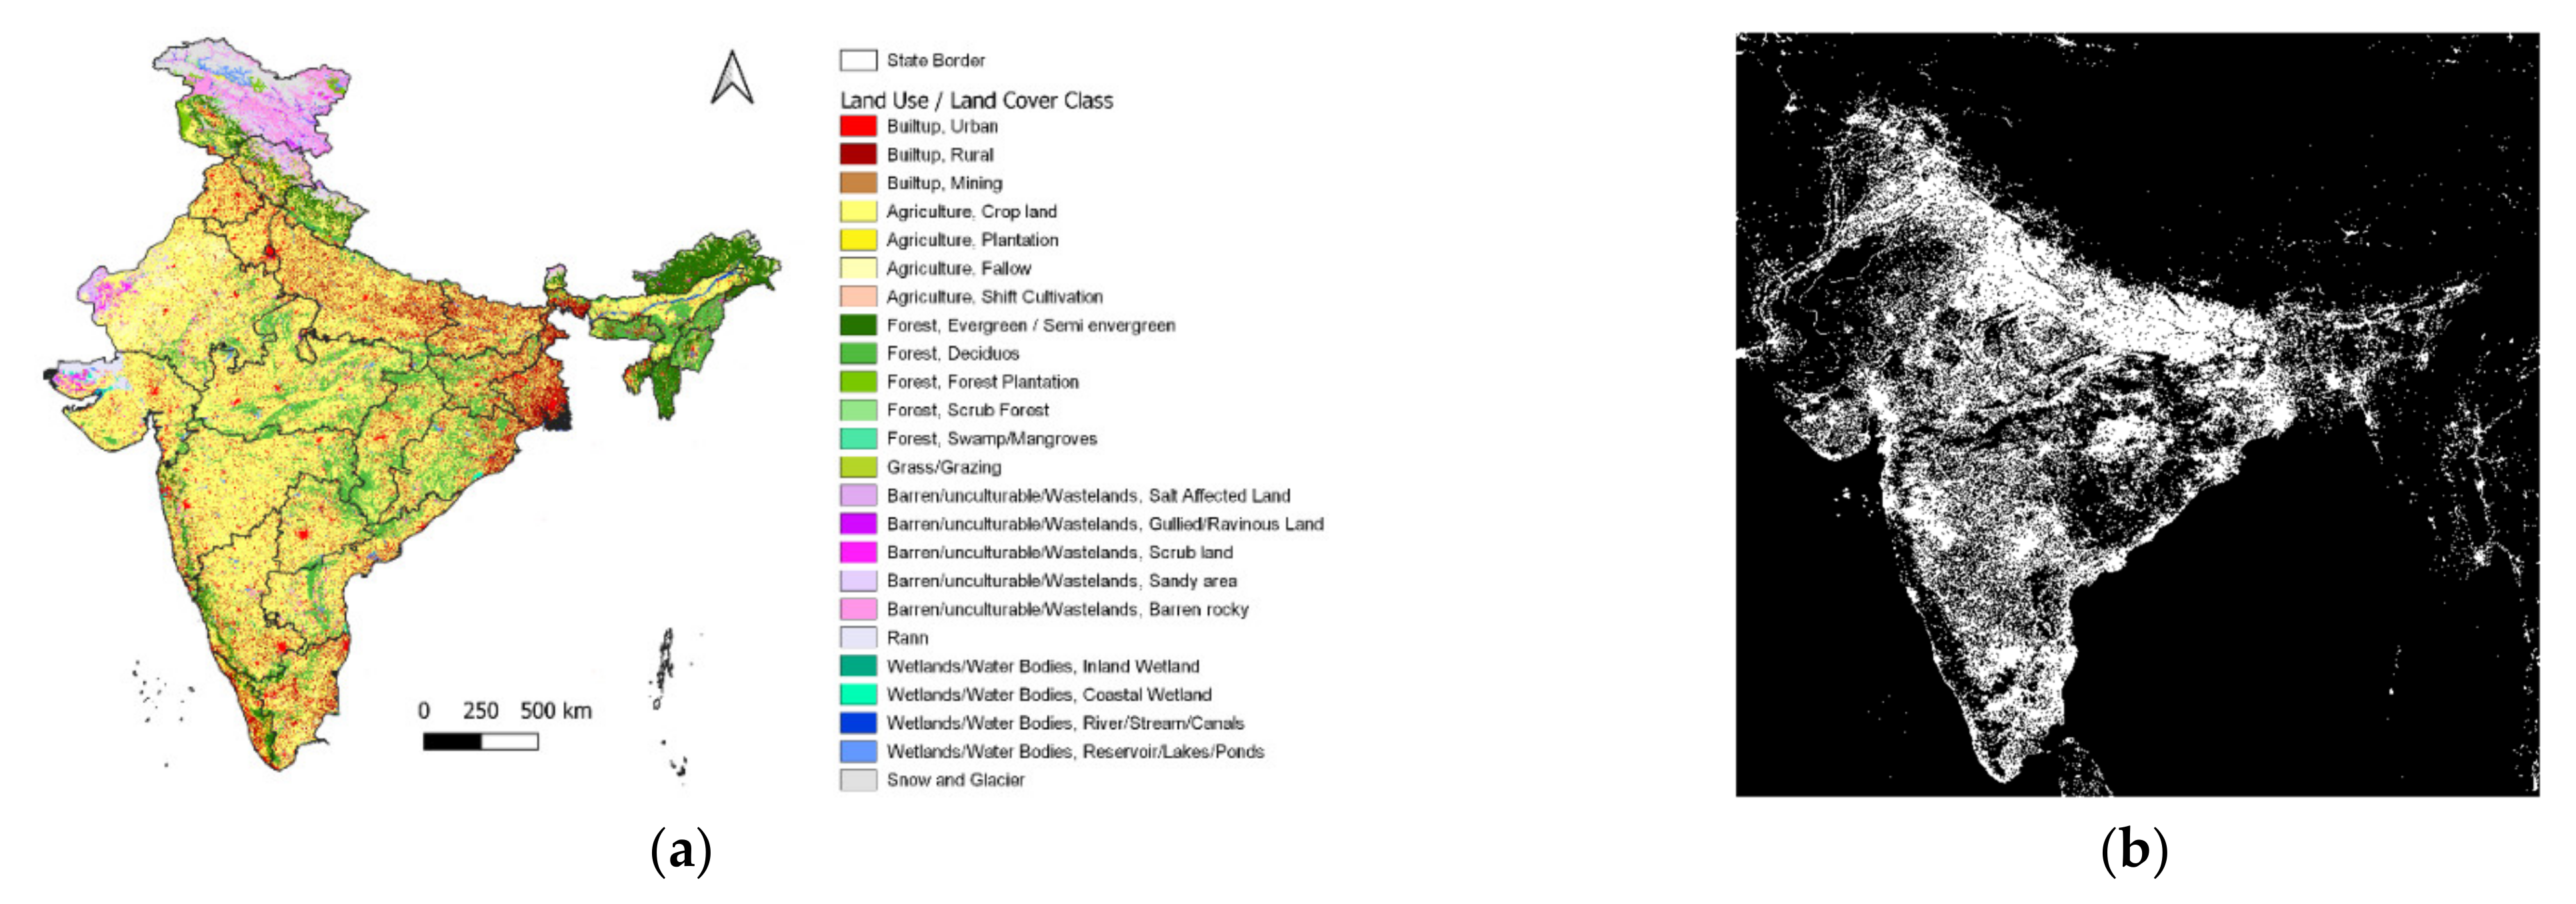
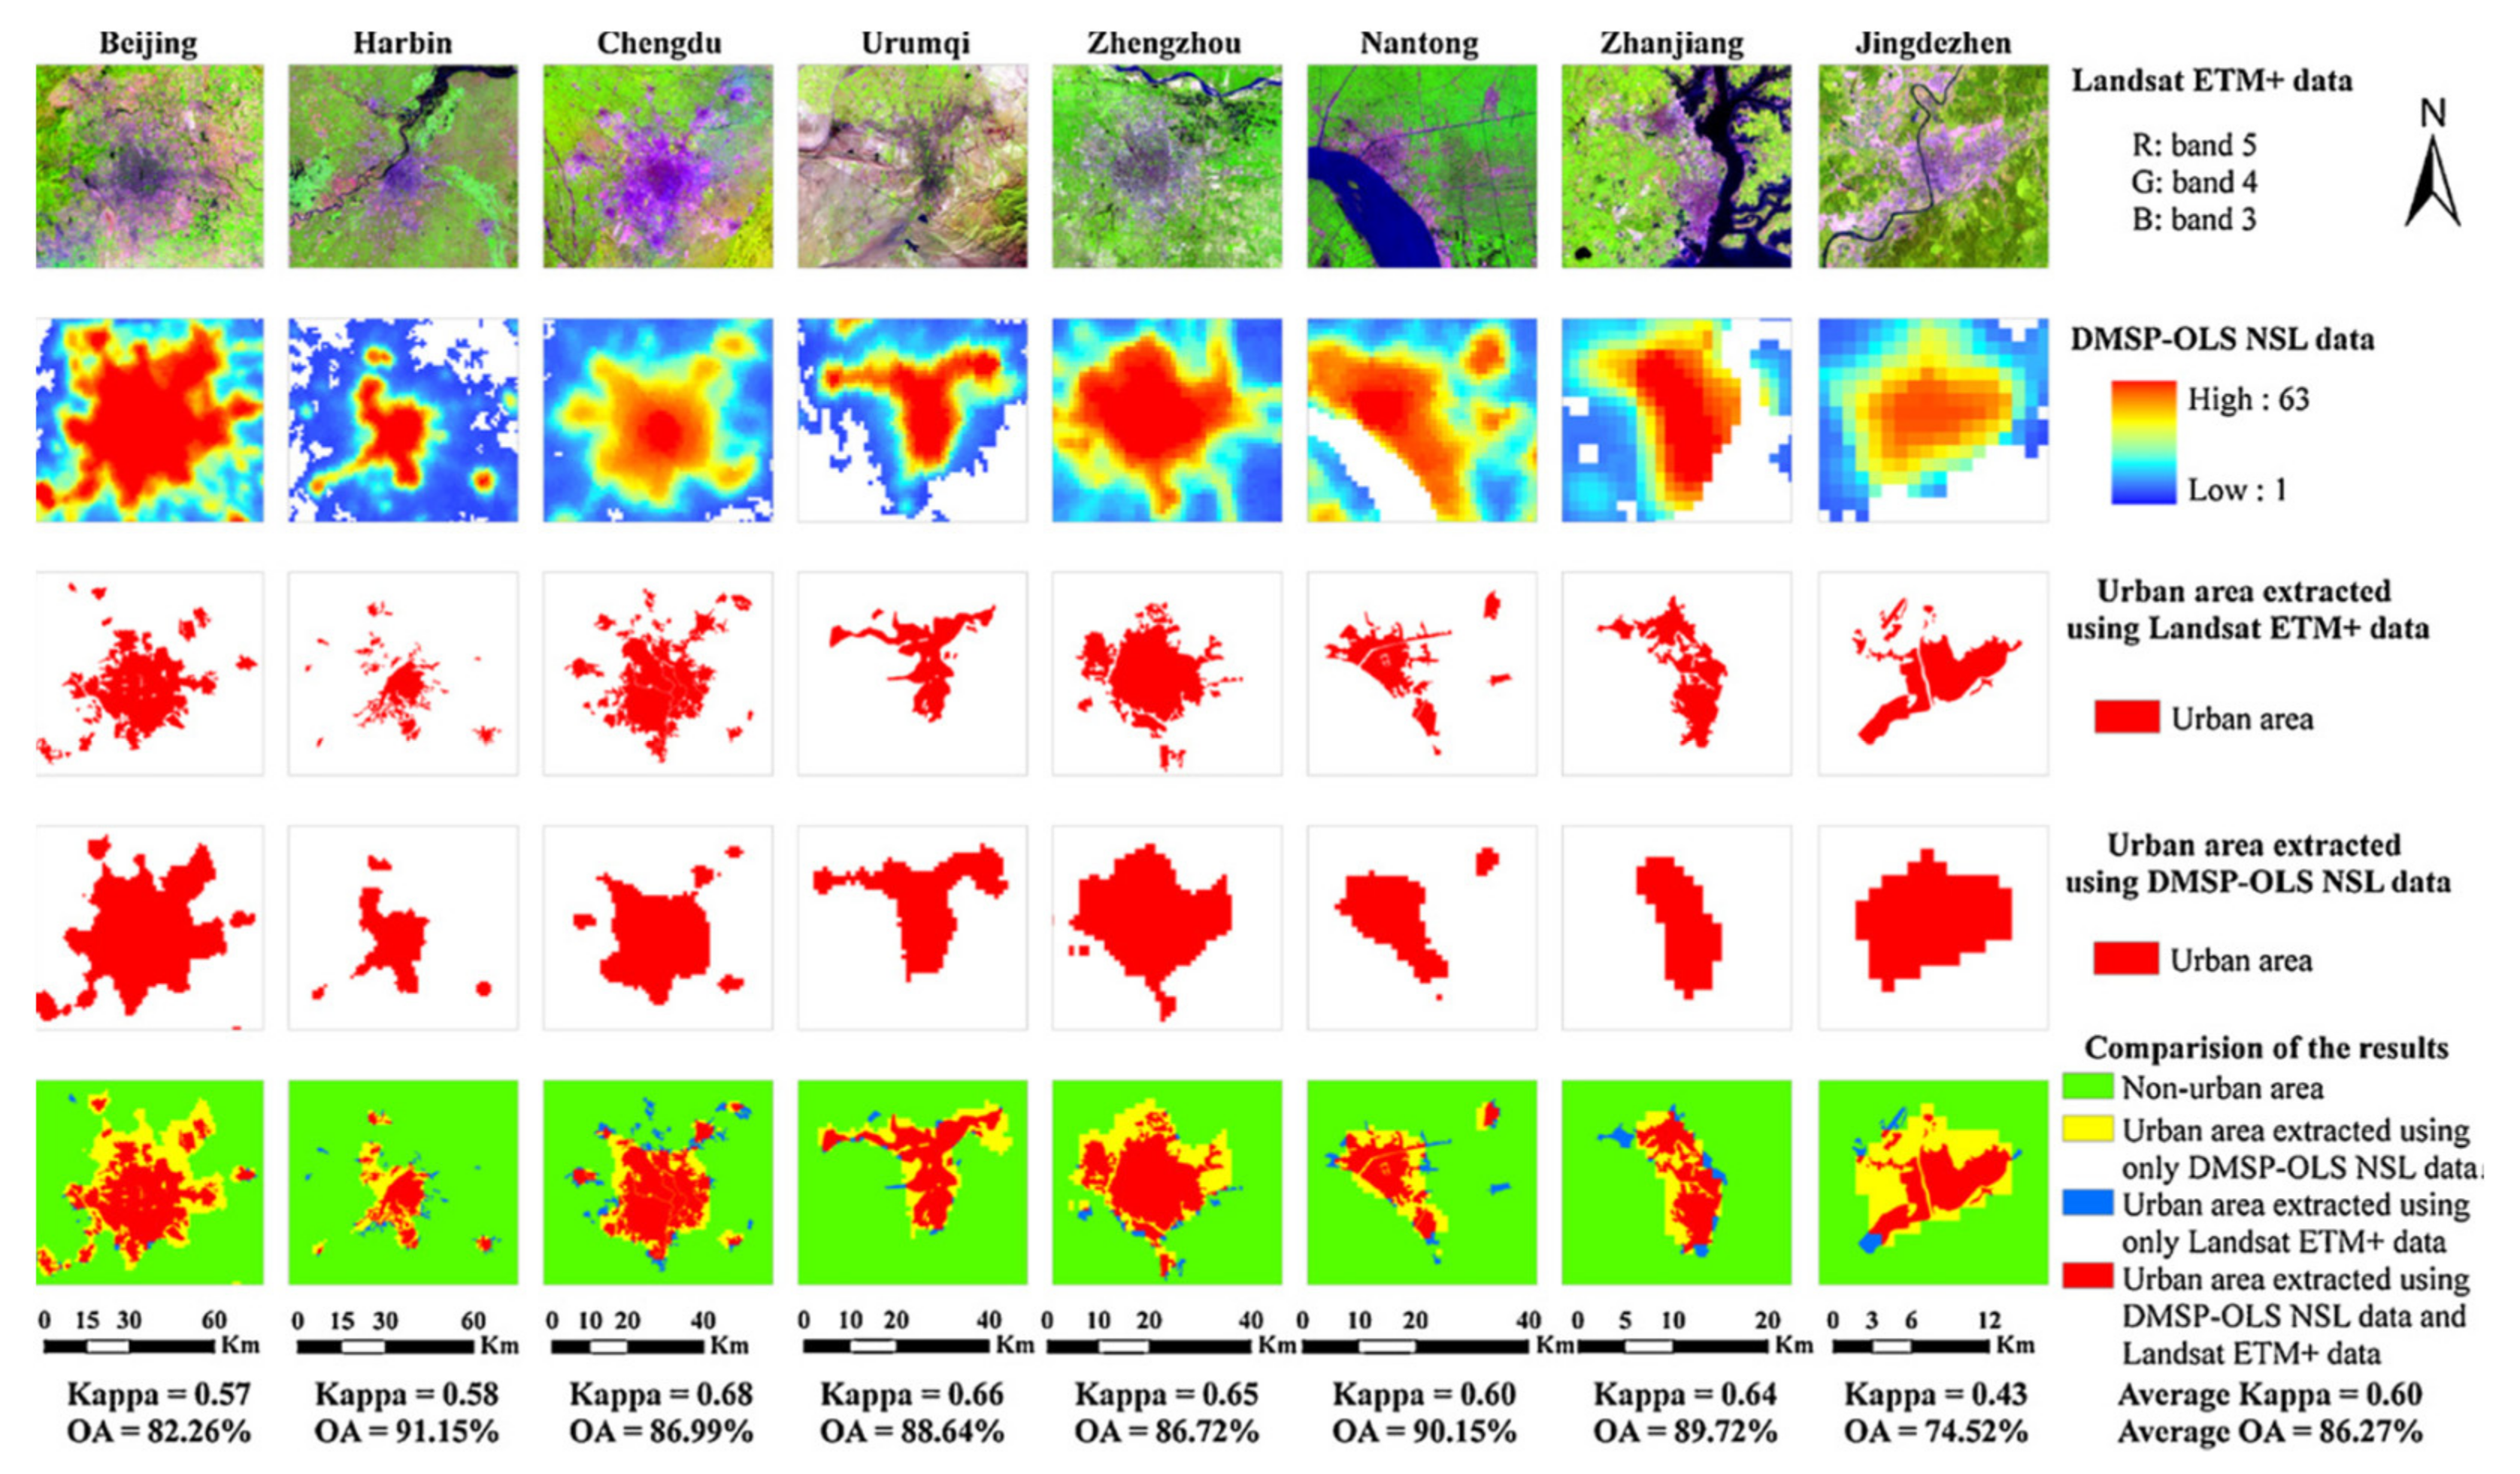
3.2.6. The Use of Nighttime Light (NTL) Data in Analyses of Urbanisation Processes

Nighttime Light (NTL) data are increasingly often used in an analyses of urbanisation processes because of their strong relationship with human activities. Systems such as the Visible Infrared Imaging Radiometer Suite (VIIRS) Day/Night Band (DNB) onboard the Joint Polar Satellite System (JPSS) are designed with very high sensitivity to detect even the faintest light in the visible range. This makes them ideal for observing the lighting on the ground. An example of the use of these data is presented in The Annual Cycling of Nighttime Lights in India [90]—Figure 14. By classifying the ACF (autocorrelation function) profiles for each pixel location, interesting spatial patterns were revealed in different regions.
Up-to-date and accurate information on the dynamics of urban expansion is essential to reveal the relationship between this phenomenon and the ecosystem in order to optimise land-use patterns and to promote efficient urban development. A publication entitled “Extracting the dynamics of urban expansion in China using DMSP-OLS nighttime light data from 1992 to 2008” [91] describes a method for systematically correcting multi-year stable night light (NSL) data from multiple satellites and rapidly extracting urban expansion dynamics based on the corrected data—Figure 15.
The dynamics of city expansion in China from 1992 to 2008 were extrapolated with an overall average accuracy of 82.74% and a mean Kappa value of 0.40—Figure 16.

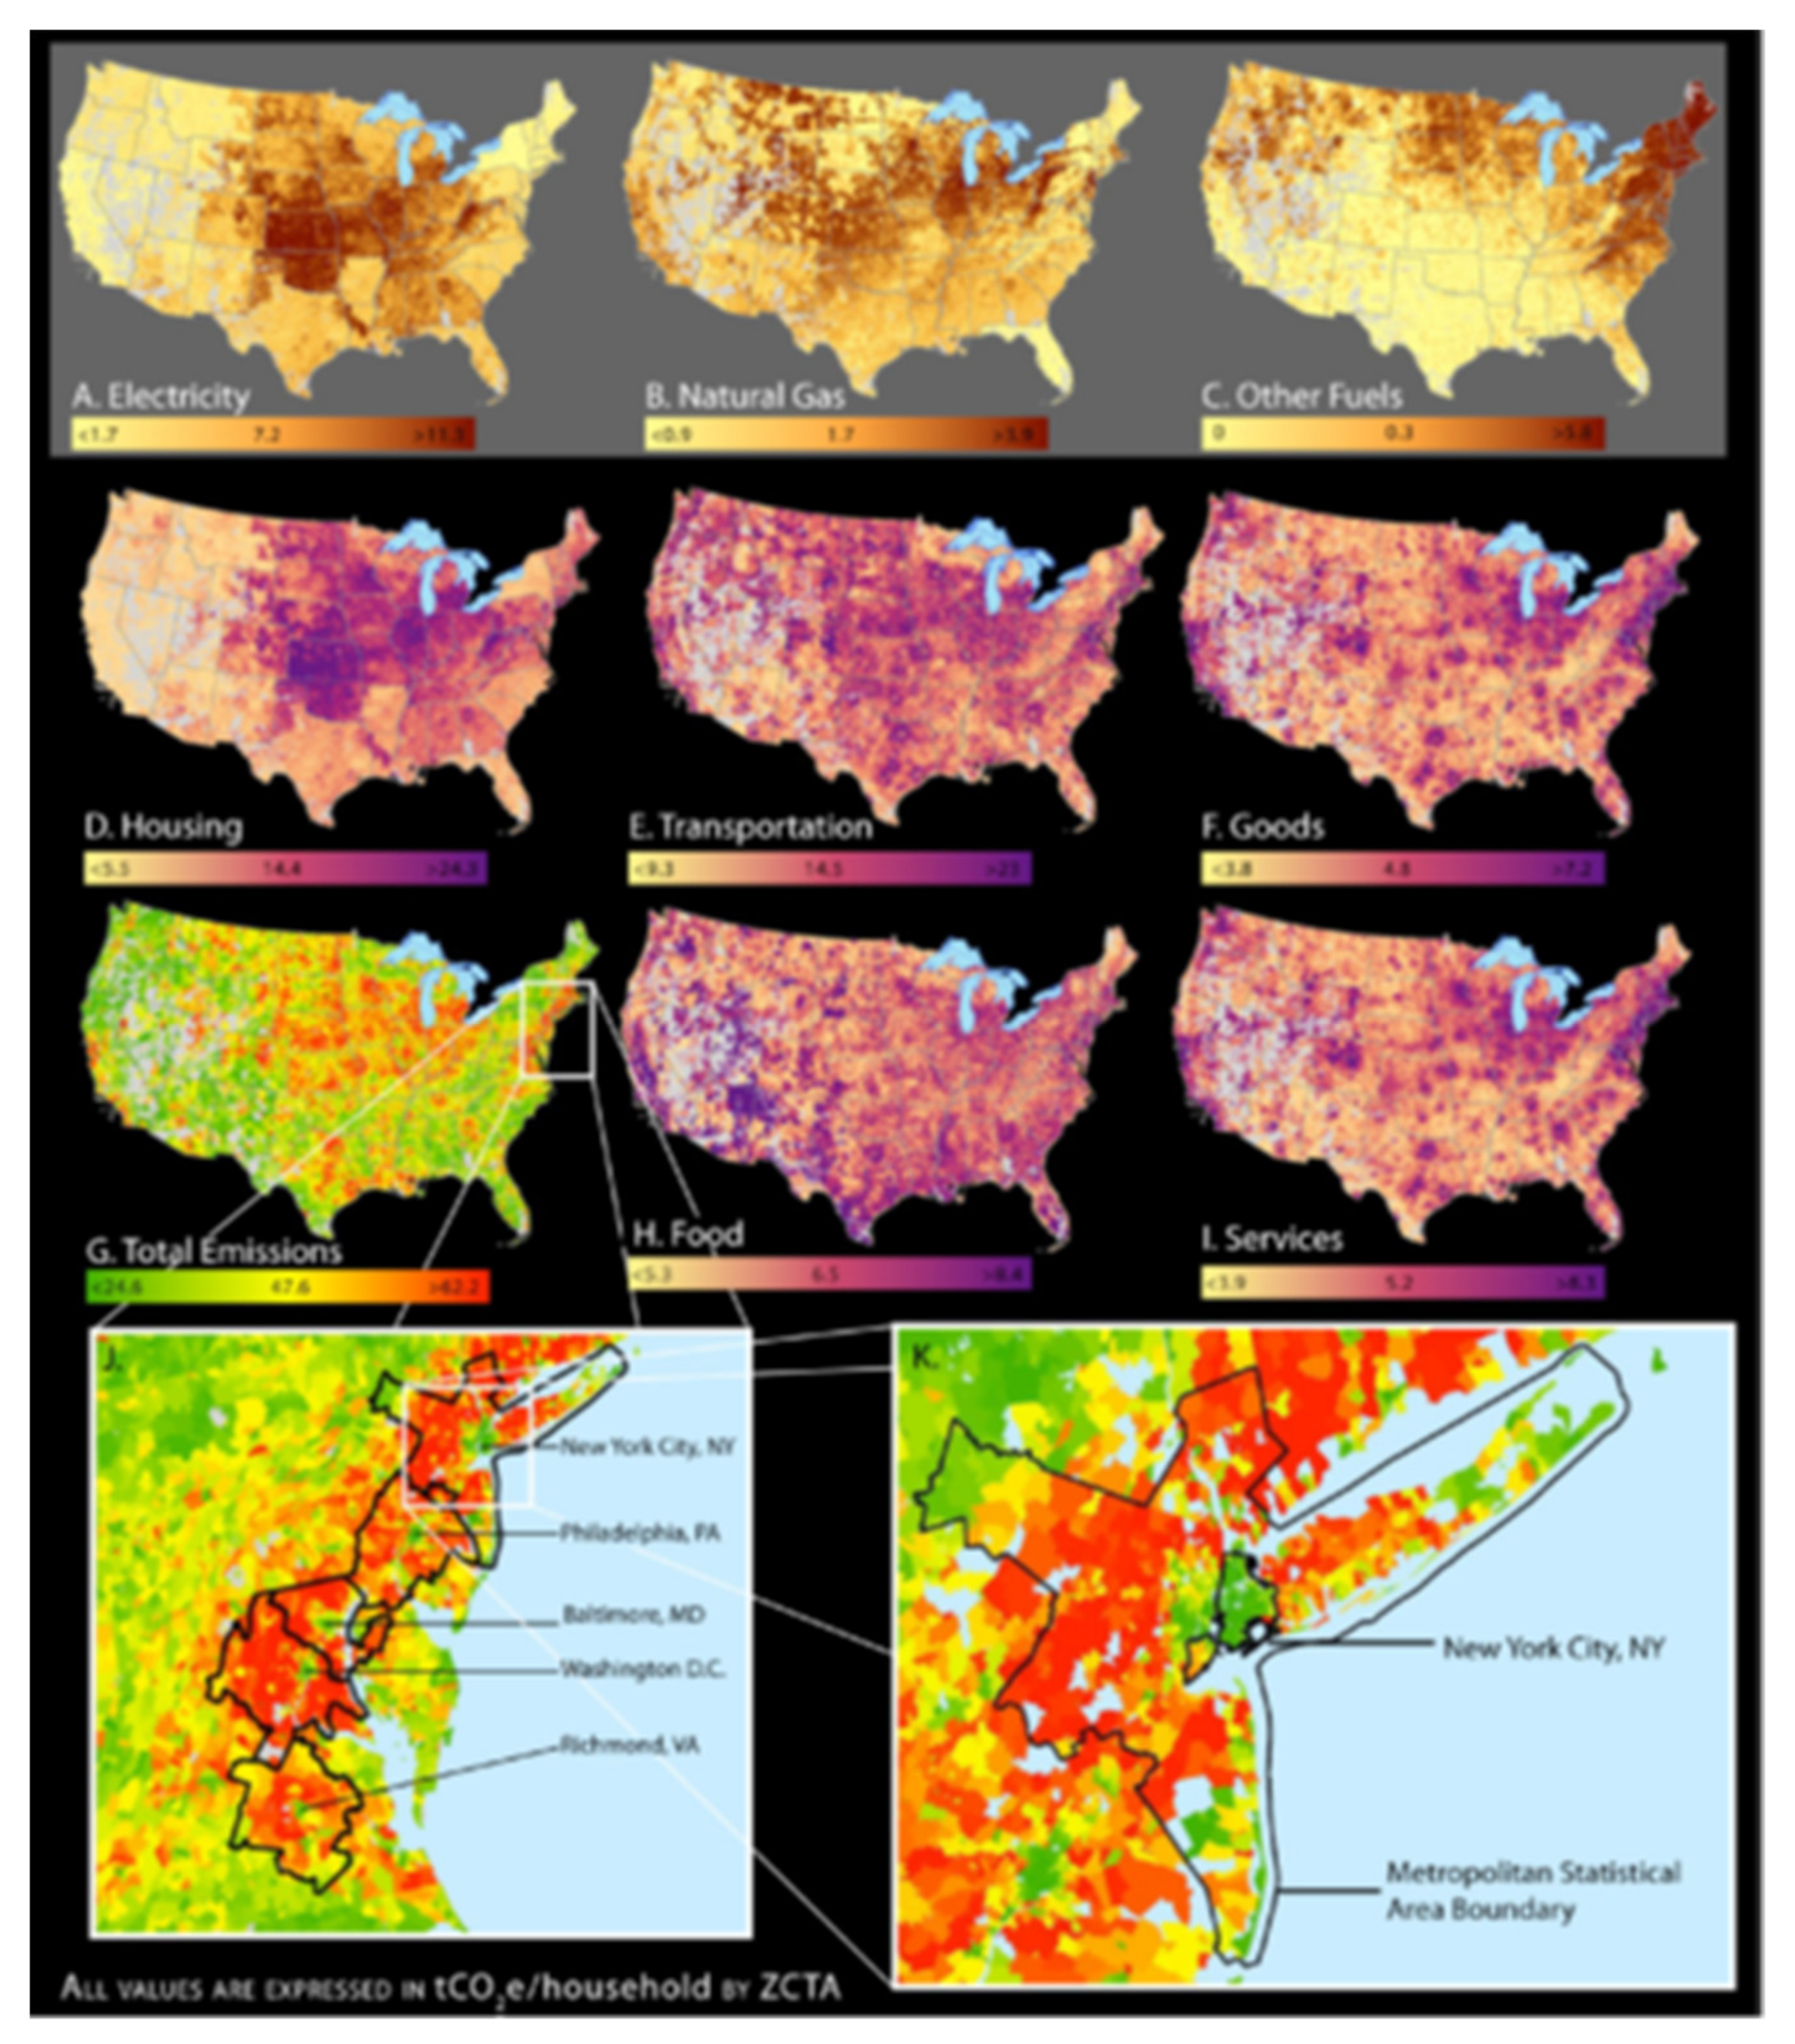
3.2.7. The Use of Greenhouse Gas Emission Data in Analyses of Urbanisation Processes

The research conducted by Christopher Jones and Daniel M. Kammen in the USA revealed that the spatial distribution of household carbon footprints identifies a process of suburbanisation by analysing the effects of greenhouse gas emissions linked to urban density [92]. The econometric models of demand for energy, transportation, food, goods and services were developed using national household surveys and were used to determine the average household carbon footprint (HCF) for U.S. zip codes, cities, counties and metropolitan areas. A lower HCF was observed in city centres and a higher carbon footprint in the peripheries (~50 tCO2e), ranging from ~25 to > 80 tCO2e in the 50 largest metropolitan areas. Population density demonstrates a weak, though positive, correlation with HCF until a density threshold is reached, after which the range, mean and standard deviation of HCF decrease. Population density contributes to the relatively low HCF in the urban centres of large metropolitan areas. In contrast, more extensive suburbanisation in these regions contributes to an overall net increase in HCF—Figure 17.

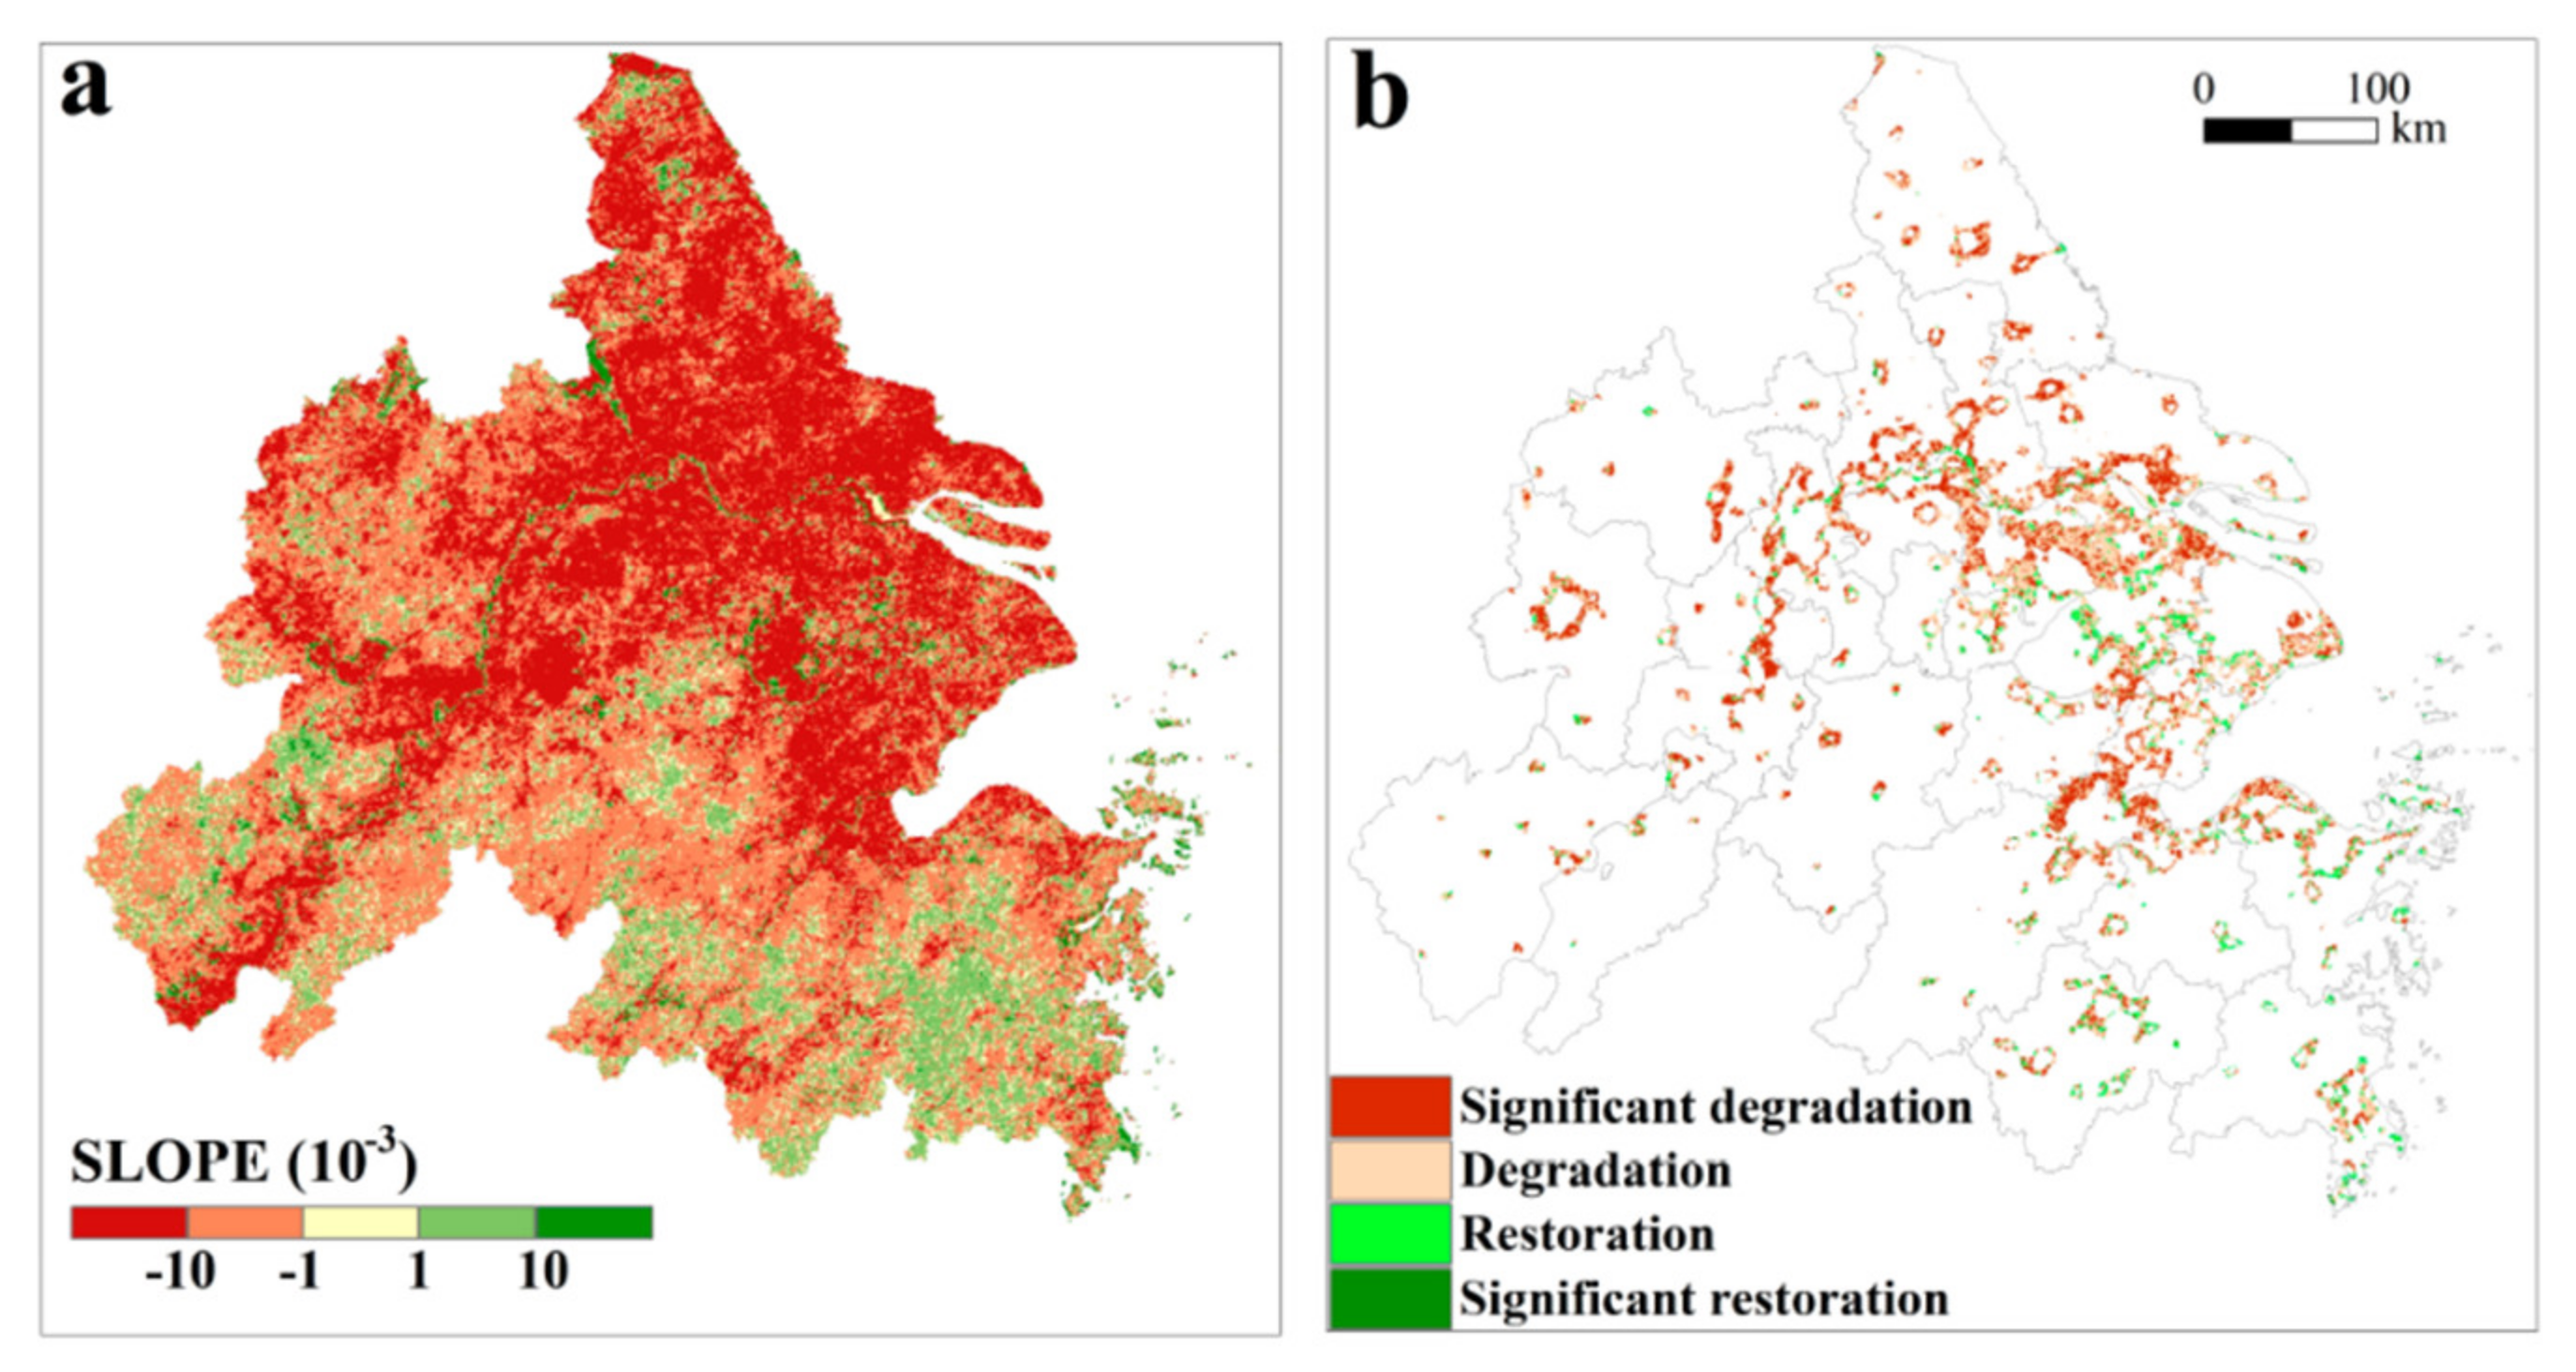
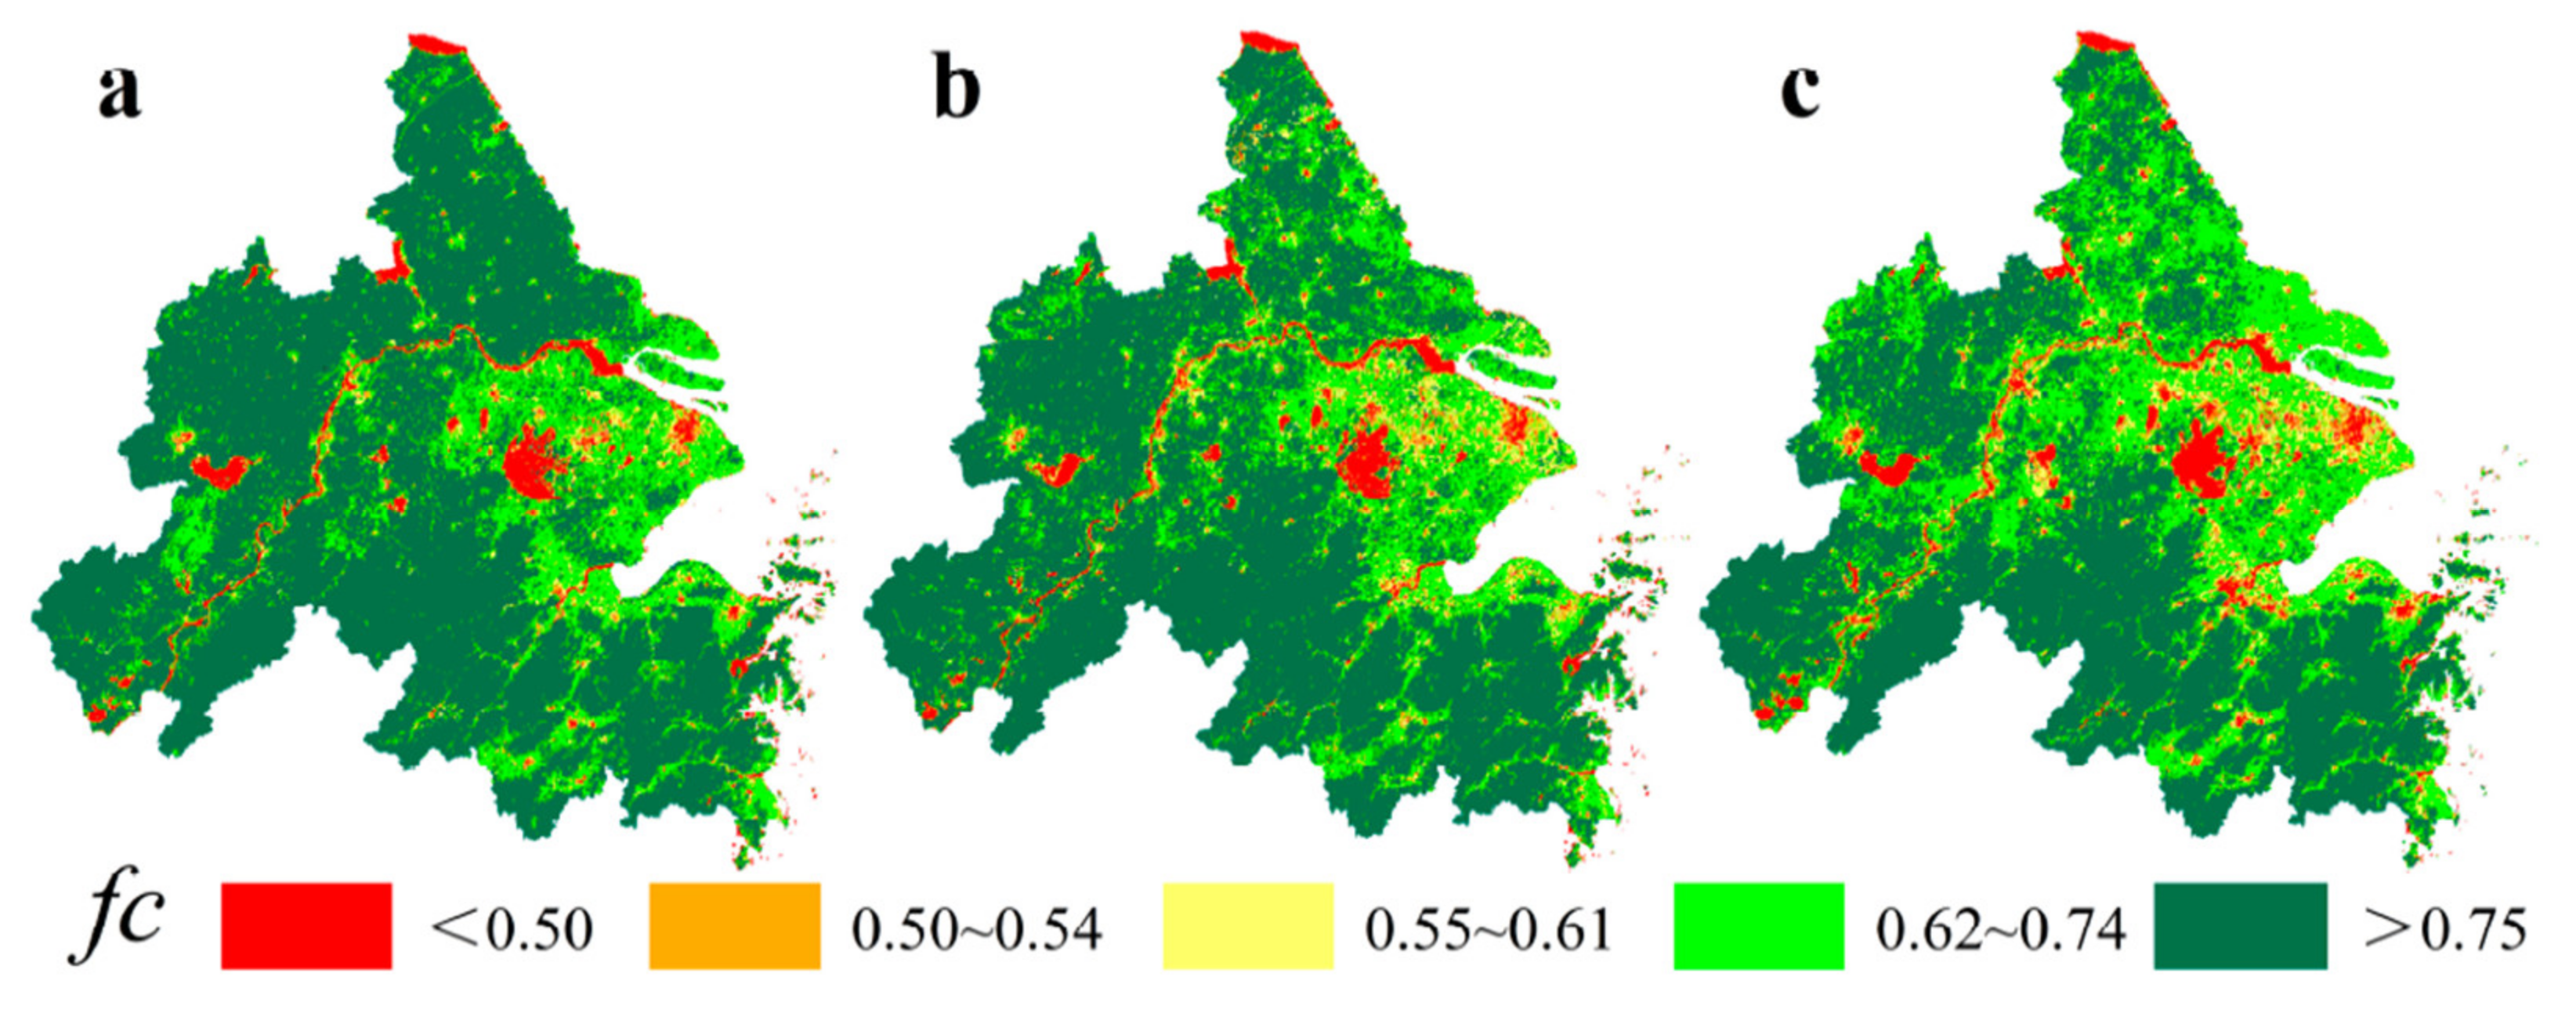
3.2.8. The Use of Data on Plant Vegetation Changes in Analyses of Urbanisation Processes

Urbanisation destroys and divides large amounts of natural habitats, with serious consequences for ecosystems, which is particularly evident in developing countries. The term ‘urban landscape’ refers to a region where specific landscape elements within an urban area prevail, including buildings, roads, infrastructure and green spaces. A number of studies have been carried out to monitor the dynamics of urban landscape changes and the ecological impact of urbanisation. Sufficient evidence has been found to demonstrate that changes in the spatial arrangement of urban landscapes (e.g., distribution, composition and configuration) lead to mass plant die-offs [93], a decrease in biodiversity [94], a reduction in atmospheric humidity [95] and a change in ground surface temperature [96,97], and an increase in fine particulate pollution [98]. Therefore, the change in the urban landscape pattern is one of the most striking aspects of urbanisation, with a negative impact on ecosystems. The presented example describes the response of vegetation to a change in the urban landscape spatial pattern in the Yangtze River Delta, China [99]. Figure 18 depicts the spatial patterns of vegetation cover in 2004, 2008, and 2013 in the Yangtze River Delta Urban Agglomeration (YRDUA). The remote sensing datasets used in this study include the Defense Meteorological Satellite Program’s Operational Linescan System (DMSP/OLS) and the normalised difference vegetation index (NDVI) obtained from a Moderate Resolution Imaging Spectroradiometer (MODIS) dataset. The vegetation level with a fc (fractional vegetation cover) value higher than 0.75 extended over a large part of the study area, which was mostly dominated by trees, shrubs or green plants. Scattered vegetation in the northern and central parts of the YRDUA experienced the most notable reduction. It should be noted that since these two regions mainly consist of arable land and building land, the decline in fc can be attributed to land use transformation caused by intensive human activities, and vice versa, as the fc values in the southern part of the YRDUA, i.e., most of Zhejiang Province, have basically remained unchanged. Until 2013, the fc value for the entire area under investigation presented a clear spatial disproportion between the north and the south.
The spatial pattern of the vegetation change trend is shown in Figure 19.

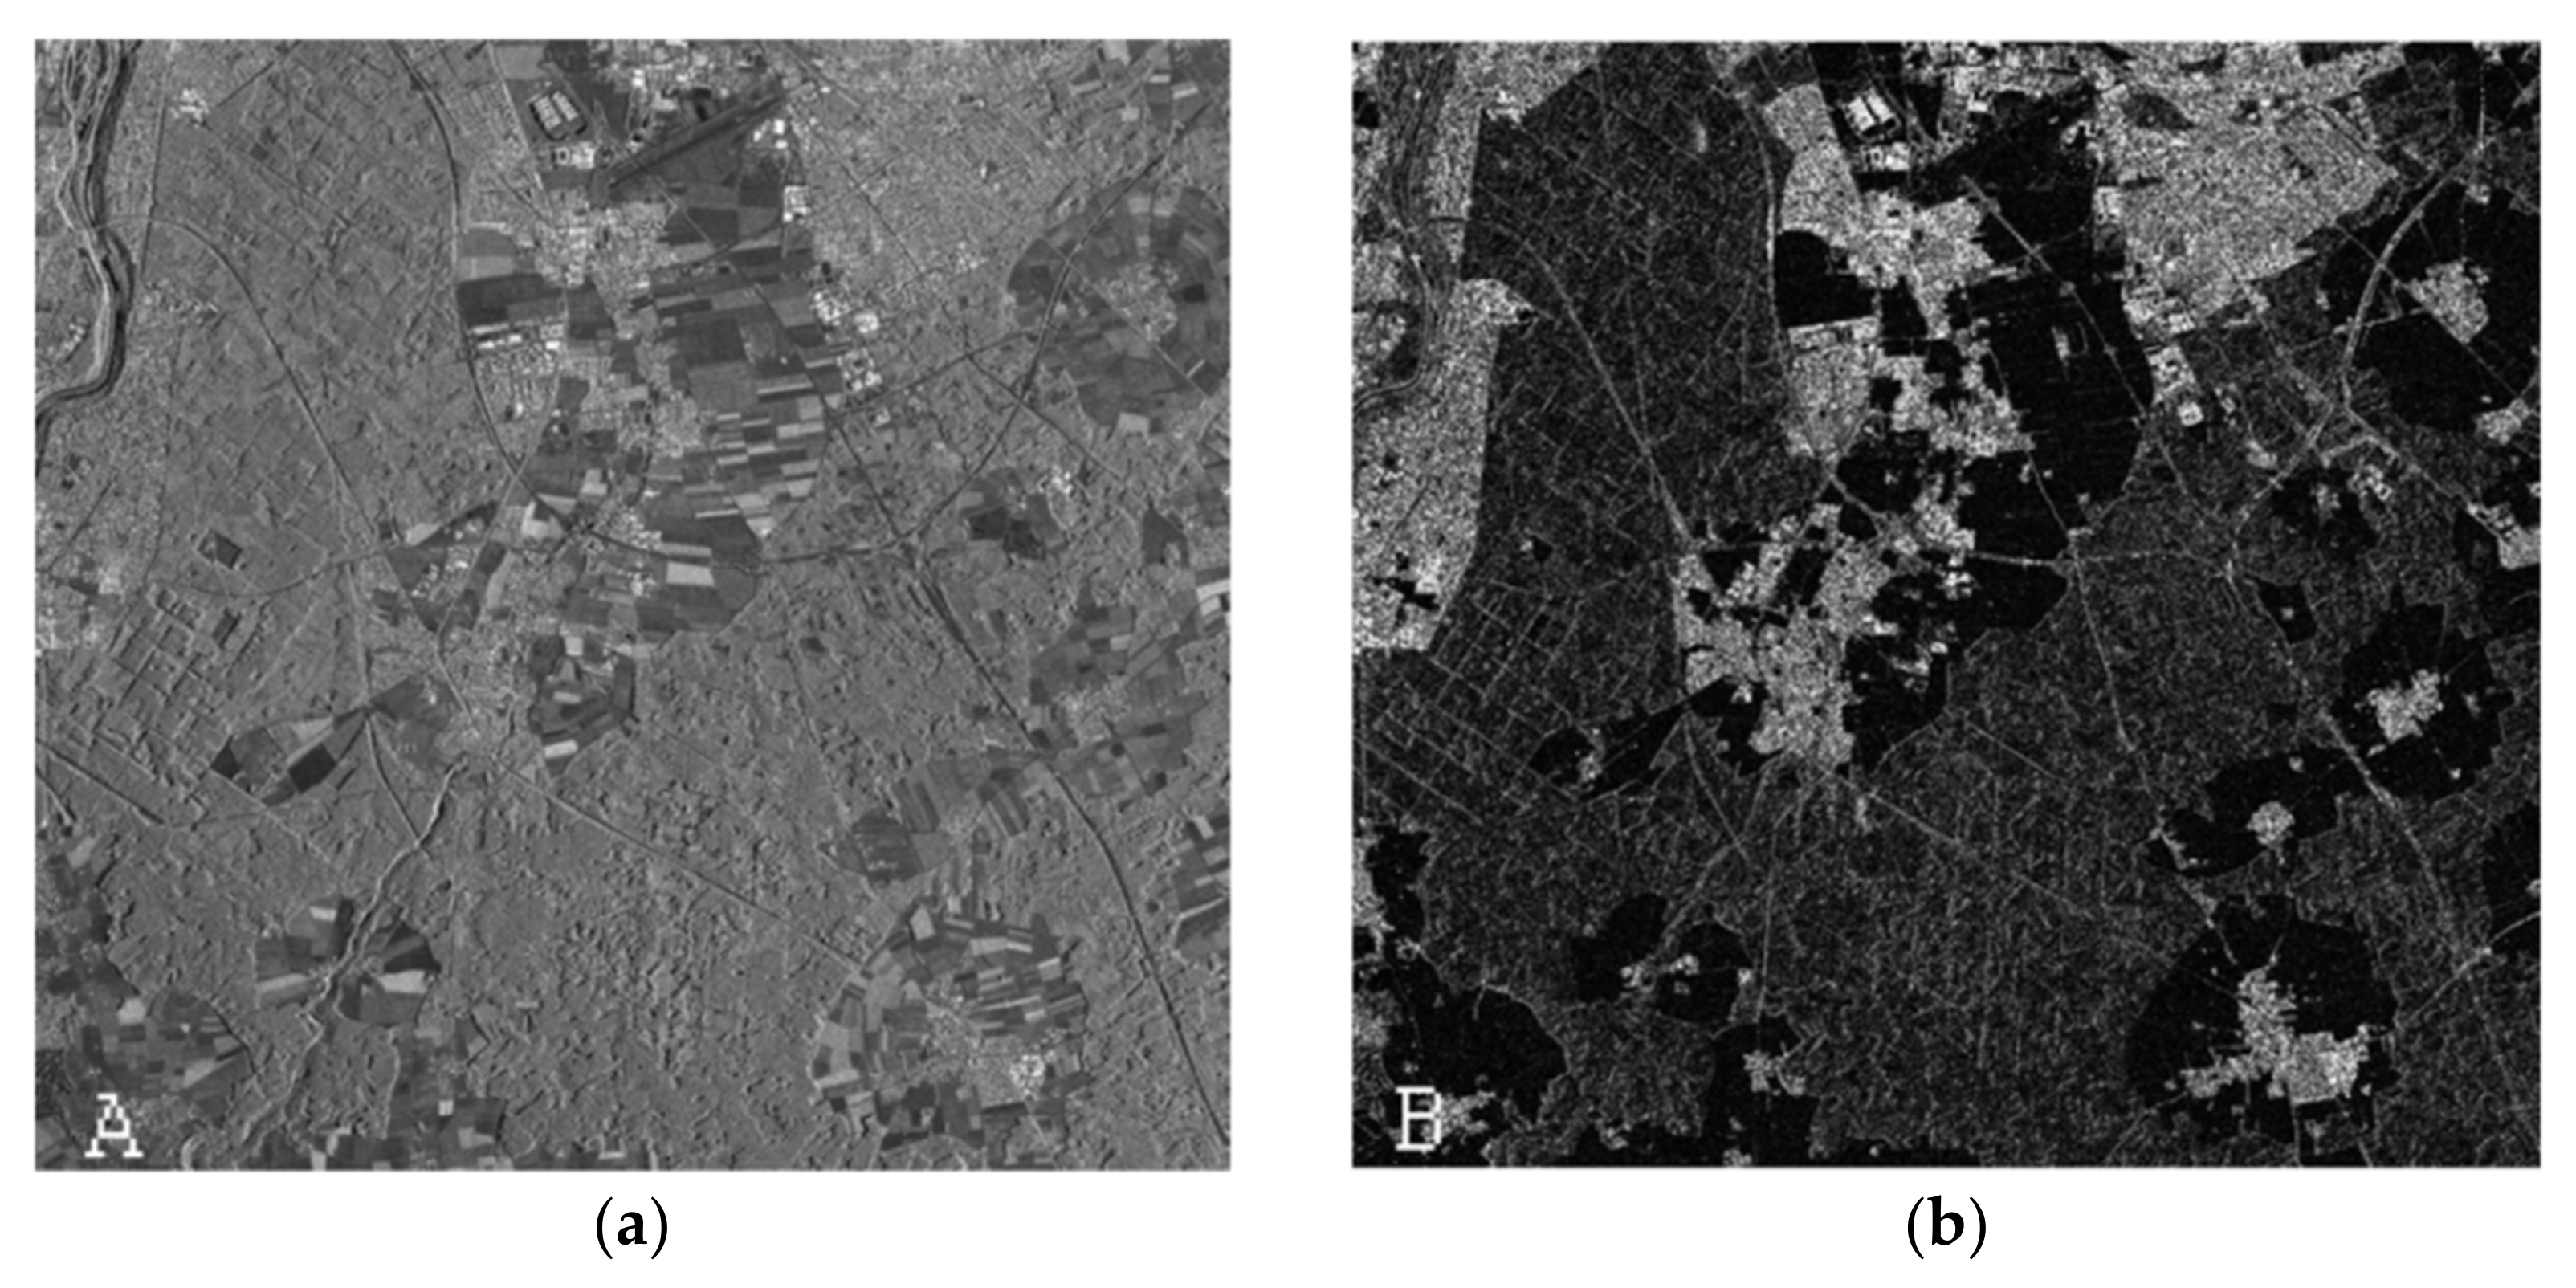
3.2.9. The Use of Synthetic Aperture Radar (SAR) in the Analysis of Urbanisation Processes

Synthetic Aperture Radar (SAR) for high-resolution images of stationary objects is used to create images of the land surface, of the Earth and other planets using remote sensing techniques. Remote sensing satellites, especially the German TerraSAR-X radar system, independent of weather and time of day, and which takes up to three days to revisit a particular area, have been successfully providing short-term data on urbanisation processes for many years. The presented example investigates the potential and limitations of TerraSAR-X in the context of automated, object-based detection of human settlements. The approach presented by Thiel M. et al. (Object-oriented detection of urban areas from TERRASAR-X DATA) [100] for urban detection using TerraSAR-X data, achieves an overall accuracy of around 95% and 89%—an indication of the high potential of TerraSAR-X data to identify developed areas—Figure 20.

3.3. Possibilities of Using Spatial Data in the Research on Urbanisation Processes

The development of a relatively simple measure of urban sprawl based on the observation of changes in actual land cover using GIS and a tool supporting rational land management provides a substantive basis for city planning. An example is the research described in a study entitled “An analysis of urbanisation dynamics with the use of the fuzzy set theory—A case study of the city of Olsztyn”, enabling the application of fuzzy set theory as a tool supporting rational space management and provides a substantive basis for urban spatial planning [20]. The established degrees of membership determine which forms of space use have a so-called “more city-like” character than the others, i.e., have more characteristics of urban space. The results according to the assumptions of the fuzzy set theory are determined in the interval [0, 1]. The determined degrees of membership in urban-type uses and the data from the inventory of the existing state of development (interpretation of satellite images) in 2005, 2010 and 2018 enable the development of a fuzzy city model—Figure 21.
Boundaries of urbanised areas determined by the developed method based on the fuzzy set theory for 2005, 2010 and 2018 make it possible to determine the degree of urbanisation of the area in the interval [0, 1] and the dynamics of changes in urbanisation processes in the years of 2005–2010–2018 (Figure 22).
The spatial development of cities and the related population growth has become a subject of broadly understood spatial management research. Planners and geographers are replacing previous models of cities that described the process of their development with new models that express how uncoordinated local decisions affect their global growth [101]. Urban compactness studies can identify cities which are expanding to make optimal use of suburban areas and those where suburban sprawl is chaotic. An example of research into the compactness of urban systems is the establishment of a compactness index based on the spatial length of the boundaries of the area covered with a particular form of development [84]. Studies of this type can apply GIS-type data; in this case, the Corine Land Cover Data CLC databases. Such data, for example, was used to examine the compactness of the urbanised areas of 49 district towns in Poland. For the 49 urban areas, the zone of the neighbouring municipalities was separated as the area most exposed to suburbanisation, and subsequently, using the CLC databases according to the developed research methodology, the areas related to urban use were separated for the three moments of time 2006, 2012 and 2018—Figure 23.
Based on the data concerning the area of these zones, the area compactness index AC was calculated, which is equal to the ratio of the circumference of a circle with the surface area equal to that of the urbanised areas to the length of the boundaries of these zones. The index ranges from 0 to 1. The values closer to zero indicate lower compactness. The value of 1 is theoretical and would represent the area of the city with an urbanised area forming a dense circular surface.
This indicator increases for most cities in 2018 as compared to previous years, indicating that areas that were heavily dispersed between 2006 and 2012 are becoming more compact—Figure 24. Unfortunately, for all towns, the index for the years 2006, 2012 and 2018 included in the analysis is very low (apart from 4 examples, it does not exceed the value of 0.4, and for more than a half, it is below 0.2), which indicates a strong dispersion of development in the vicinity of the towns under analysis. The examples provided in the discussion illustrate how spatial data can be used to assess the level and pace of urbanisation. As spatial databases become more accurate, complete and accessible, with images taken and made available at a better resolution, more refined and novel methods for mapping and analysing urbanisation processes will emerge.

4. Discussion and Conclusions

The dynamics of urbanisation processes have been the subject of multiple studies differing in both scale and aspect. Some interesting publications on this subject include works which are well known to researchers in this field, such as [102], but also some other very interesting items [103,104]. These include some studies that use land cover information, such as [105,106]. In the majority of these papers, the authors identify specific methods for environmentally, economically or demographically oriented research. Contrary to other manuscripts of this kind, this paper shows the wide possibilities of using spatial data to study urbanisation processes at different scales and with different underlying meaning.
The analytical methods and databases discussed above differ in their availability, ease of classification of selected land uses, labour intensity, cost, spatial and temporal continuity. Most frequently, they also require a specialised knowledge and dedicated algorithms to process the collected data. Automatic classification can result in errors in identifying and separating different land-use types when a large number of similar and overlapping land cover types are processed, such as single-family homes and multi-family housing. In view of the variety of colours, structures and textures in urban areas, spatial conditions in the vicinity of the identified areas should also be taken into account. The interpretation of aerial and satellite photographs alone is time-consuming and requires a team of several researchers. However, from a longer perspective, such analyses are less time- and cost-intensive and can be carried out on a large number of cities to generate sufficient data to draw conclusions concerning the degree and nature of urbanisation.
Urbanisation is a global phenomenon, irreversible and inherent within human development. The inevitability of these processes stimulated by developing cities requires systematic research into the characteristics and parameters that form them and the various processes of transformation taking place. Urban development significantly affects areas located at the interface between urban and rural uses, resulting in the permeation and overlapping of different land-use forms in the fringe zone. Spatial development of cities manifested by an increased demand for new land exerts a significant impact on the surrounding grassland and agricultural areas. The demand for new non-urbanised building land, much cheaper than property in cities, is triggering a response from municipal governments, environmentalists, farmers and the non-agricultural rural population. Identifying the specific nature of urbanisation processes occurring in and around cities can minimise the uncontrolled and unplanned creation of zones of chaotic development, degrading natural resources and could limit uncontrolled and unplanned city growth. This is also of fundamental importance in the context of sustainable urban development. New methods of urban management, environmental protection, uncontrolled suburbanisation, acquisition of new urban land (agricultural as well as post-industrial) transport, social participation, etc., are new challenges for sustainable urban areas and practices. Planning for sustainable urban development requires a knowledge of the individual elements of the city system and its surroundings and the relationships between them, the adoption of certain assumptions and goals leading to sustainability, and the adaptation of these assumptions to local conditions. This is particularly important from a spatial perspective [107,108,109,110,111,112,113,114].
Rapid urban growth and the resulting challenges require precise techniques for identifying and locating urbanised areas and for their mapping in order to represent complex land cover characteristics in adequate detail. Geospatial data provide a rich source of knowledge and a reference for the development of new tools for identifying and monitoring urbanisation processes. This applies in particular to areas subject to urbanisation pressures which cannot be clearly classified as urban or rural. These discrepancies are reflected in the existing land use and land cover types. For this reason, the degree and rate of urbanisation can be most effectively analysed by monitoring land cover changes. Virtually unlimited access to land cover data provided by current and historical orthophotomaps and databases, as well as developing GIS techniques, enable the rapid processing of spatial information. Research on spatial urbanisation consumes much less time and concerns a large number of cities, which may provide new sources for drawing conclusions about the scale and nature of this phenomenon.
The possibilities and constraints related to decision-making regarding the spatial development of the city are primarily attributable to the multidimensional nature of the spatial development space and its probabilistic and fuzzy nature. The variety of spatial features (attributes) and the wide range of data result in the process of investigating and planning a suburban area, which is complex and lengthy and, consequently, subject to high risk. Studies of urbanisation processes must take into account the nature of the explored component, characteristics, as well as the frequency, pace and magnitude of these changes. The analyses presented in this paper provide an attempt to further define current trends, methods, techniques and databases used in the analysis of the ongoing urbanisation processes.

Author Contributions

Conceptualisation, A.B. and I.C.; methodology, A.B. and I.C.; software, A.B. and I.C.; validation, A.B. and I.C.; formal analysis A.B. and I.C.; investigation A.B. and I.C.; resources, A.B. and I.C.; data curation, A.B. and I.C.; writing—original draft preparation, A.B.; writing—review and editing, I.C.; visualisation, A.B. and I.C.; supervision, A.B. and I.C.; project administration, A.B. and I.C.; funding acquisition, A.B. and I.C. All authors have read and agreed to the published version of the manuscript.

Funding

This research received no external funding.

Institutional Review Board Statement

Not applicable.

Informed Consent Statement

Not applicable.

Data Availability Statement

Not applicable.

Conflicts of Interest

The authors declare no conflict of interest.

References

  1. United Nations. World Urbanization Prospects—Population Division; United Nations: New York, NY, USA, 2019. [Google Scholar]
  2. Parysek, J. Duże Miasta Europy i ich rola w Procesie Urbanizacji, Rozwoju Społeczno-Gospodarczego i Europejskiej Integracji u Schyłku XX Wieku. Przegląd Geogr. Pol. Akad. Nauk. 1995, 67, 3–4. [Google Scholar]
  3. Müller, N.L. Brazil. In Essays on World Urbanization; Ronald, J.E., Ed.; George Philip and Son Limited: London, UK, 1975; pp. 212–222. [Google Scholar]
  4. Szymańska, D.; Biegańsk, J. The Phenomenon of Urbanizationand Processes Connected with It; Studia Miejskie; University of Opole Publishing House: Opole, Poland, 2011; Volume 4, pp. 13–38. (In Polish) [Google Scholar]
  5. Szymańska, D. Zjawisko Urbanizacji i jej Konsekwencje. In Badania Środowiska; Turło, J.E., Ed.; Wyd. Naukowe UMK: Toruń, Poland, 1995; pp. 71–79. [Google Scholar]
  6. Szymańska, D. Urbanizacja na Świecie; Wyd. Naukowe PWN: Warszawa, Poland, 2007; p. 392. [Google Scholar]
  7. Węcławowicz, G. Geografia Społeczna Miast. Zróżnicowania Społeczno-Przestrzenne; Wyd. Naukowe PWN SA: Warszawa, Poland, 2003; p. 163. [Google Scholar]
  8. Ziółkowski, J. Miejsce i rola procesu urbanizacji w prZeobrażeniach społecznych w polsce ludowej. In Procesy Urbanizacyjne w Powojennej Polsce; Nowakowski, S., Ed.; PWN: Warsaw, Poland, 1967. [Google Scholar]
  9. Nowak, S. Obiektywne i Psychologiczne Parametry Przemian Struktury Społecznej; Materiały III Ogólnopolskiego Zjazdu Socjologicznego, z: Warsaw, Poland, 1967; p. 2. [Google Scholar]
  10. Gałęski, B. Innowacje a Społeczność Wiejska; Wyd. Książka i Wiedza: Warszawa, Poland, 1971. [Google Scholar]
  11. Smiraglia, D.; Salvati, L.; Egidi, G.; Salvia, R.; Giménez-Morera, A.; Halbac-Cotoara-Zamfir, R. Toward a New Urban Cycle? A Closer Look to Sprawl, Demographic Transitions and the Environment in Europe. Land 2021, 10, 127. [Google Scholar] [CrossRef]
  12. Divigalpitiya, P.; Nurul Handayani, K. Measuring the Urban Expansion Process of Yogyakarta City in Indonesia Urban expansion process and spatial and temporal characteristics of growing cities. Int. Rev. Spat. Plan. Sustain. Dev. 2015, 3, 18–32. [Google Scholar] [CrossRef] [Green Version]
  13. Meng, L.; Sun, Y.; Zhao, S. Comparing the spatial and temporal dynamics of urban expansion in Guangzhou and Shenzhen from 1975 to 2015: A case study of pioneer cities in China’s rapid urbanization. Land Use Policy 2020, 97, 104753. [Google Scholar] [CrossRef]
  14. Antrop, M. Landscape change and the urbanization process in Europe. Landsc. Urban Plan. 2004, 67, 9–26. [Google Scholar] [CrossRef]
  15. Ramachandra, T.V.; Bharath, H. Aithal Durgappa, D. Sanna. Insights to urban dynamics through landscape spatial pattern analysis. Int. J. Appl. Earth Obs. Geoinf. 2012, 18, 329–343. [Google Scholar] [CrossRef]
  16. Smailes, A.E. The Definition and Measurement of Urbanization, [w:] Essays on World Urbanization; Jones, R., Ed.; George Philip and Son Ltd.: London, UK, 1975; pp. 1–19. [Google Scholar]
  17. Szymańska, D. Geografia Osadnictwa; Wyd. Naukowe PWN: Warszawa, Poland, 2009. [Google Scholar]
  18. You, H. Quantifying the coordinated degree of urbanizationin Shanghai, China. Qual. Quant. 2016, 50, 1273–1283. [Google Scholar] [CrossRef]
  19. Sato, Y.; Yamamoto, K. Population concentration, urbanization, and demographic transition. J. Urban Econ. 2005, 58, 45–61. [Google Scholar] [CrossRef]
  20. Biłozor, A.; Cieślak, I.; Czyza, S. An analysis of urbanisation dynamics with the use of the fuzzy set theory—A case study of the city of Olsztyn. Remote Sens. 2020, 12, 1784. [Google Scholar] [CrossRef]
  21. Wojtkun, G. Do Cities Really Expand? Czas. Tech. Archit. 2010, 107, 311–317. [Google Scholar]
  22. Mulder, C.H. Population and housing: A two-sided relationship. Demogr. Res. 2006, 15, 401–412. [Google Scholar] [CrossRef] [Green Version]
  23. Cieślak, I.; Szuniewicz, K.; Pawlewicz, K.; Czyza, S. Land Use Changes Monitoring with CORINE Land Cover Data. IOP Conf. Ser. Mater. Sci. Eng. 2017, 245, 052049. [Google Scholar] [CrossRef] [Green Version]
  24. UN-Habitat, Urbanization and Development: Emerging Futures. 2016. Available online: https://unhabitat.org/world-cities-report (accessed on 15 July 2021).
  25. Montgomery, M.R.; Stren, R.; Cohen, B.; Reed, H.E. National Research Council. Cities Transformed: Demographic Change and Its Implications in the Developing World; The National Academies Press: Washington, DC, USA, 2003. [Google Scholar] [CrossRef]
  26. Pictet. The Role of Cities in the Global Economy. Available online: https://www.group.pictet/wealth-management/role-cities-global-economy (accessed on 2 September 2021).
  27. Weinstein, E. Migration for the benefit of all: Towards a new paradigm for economic immigration. Int. Labour Rev. 2002, 141, 225. [Google Scholar] [CrossRef]
  28. Kruszyna, M.; Śleszyński, P.; Rychlewski, J. Dependencies between Demographic Urbanization and the Agglomeration Road Traffic Volumes: Evidence from Poland. Land 2021, 10, 47. [Google Scholar] [CrossRef]
  29. Schneider, C.; Achilles, B.; Merbitz, H. Urbanity and Urbanization: An Interdisciplinary Review Combining Cultural and Physical Approaches. Land 2014, 3, 105–130. [Google Scholar] [CrossRef] [Green Version]
  30. Hou, B.; Nazroo, J.; Banks, J.; Marshall, A. Are cities good for health? A study of the impacts of planned urbanization in China. Int. J. Epidemiol. 2019, 48, 1083–1090. [Google Scholar] [CrossRef]
  31. Güneralp, B.S.; Lwasa, H.; Masundire, S.; Parnell, S.; Seto, K.C. Urbanization in Africa: Challenges and opportunities for conservation. Environ. Res. Lett. 2018, 13, 015002. [Google Scholar] [CrossRef]
  32. United Nations. The World’s Cities 2018-Data Booklet; Book Series: Statistical Papers-United Nations (Ser. A), Population and Vital Statistics Report; United Nations: New York, NY, USA, 2018. [Google Scholar] [CrossRef]
  33. The World Bank. Urban Development. Available online: https://www.worldbank.org/en/topic/urbandevelopment/overview (accessed on 2 September 2021).
  34. Dobbs, R.; Smit, S.; Remes, J.; Manyika, J.; Roxburgh, C.; Restrepo, A. Urban World: Mapping the Economic Power of Cities. McKinsey Global Institute. March 2011. McKinsey & Company 2011. Available online: https://www.mckinsey.com/~/media/McKinsey/Featured%20Insights/Urbanization/Urban%20world/MGI_urban_world_mapping_economic_power_of_cities_full_report.ashx (accessed on 15 July 2021).
  35. Cieślak, I. Identification of areas exposed to land use conflict with the use of multiple-criteria decision-making methods. Land Use Policy 2019, 89, 104225. [Google Scholar] [CrossRef]
  36. Cieślak, I.; Biłozor, A.; Źróbek-Sokolnik, A.; Zagroba, M. The use of geographic databases for analyzing changes in land cover—A case study of the Region of Warmia and Mazury in Poland. ISPRS Int. J. Geo-Inf. 2020, 9, 358. [Google Scholar] [CrossRef]
  37. Wojtkun, G. Współczesne osadnictwo osiedlowe-aspekt metodyczny. Sr. Mieszk. 2009, 3, 159–161. [Google Scholar]
  38. Mikolai, J.; Kulu, H.; Mulder, C.H. Family life transitions, residential relocations, and housing in the life course: Current research and opportunities for future work: Introduction to the Special Collection on “Separation, Divorce, and Residential Mobility in a Comparative Perspective. Demogr. Res. 2020, 43, 35–58. [Google Scholar] [CrossRef]
  39. Caprotti, F.; Cowley, R.; Datta, A.; Broto, V.C.; Gao, E.; Georgeson, L.; Herrick, C.; Odendaal, N.; Joss, S. The New Urban Agenda: Key opportunities and challenges for policy and practice. Urban Res. Pract. 2017, 10, 367–378. [Google Scholar] [CrossRef] [Green Version]
  40. Gao, J.; O’Neill, B.C. Mapping global urban land for the 21st century with data-driven simulations and Shared Socioeconomic Pathways. Nat. Commun. 2020, 11, 2302. [Google Scholar] [CrossRef] [PubMed]
  41. Czerny, M. Globalizacja i Rozwój. Wybrane Zagadnienia Geografii Gospodarczej Świata; Wydawnictwo Naukowe PWN: Warsaw, Poland, 2005. [Google Scholar]
  42. Parysek, M.; Parysek, J.J.; Mierzejewska, L.; Jażdżewska, I. Między Dezurabnizacją a Reurbanizacją: Nowe Oblicze Urbanizacji w Pol-sce, [w:] Współczesne Procesy Urbanizacji i Ich Skutki; Wyd. UŁ: Łódź, Poland, 2005. [Google Scholar]
  43. Degórska, B. Spatial Urbanization of Rural Areas in the Warsaw Metropolitan Area. Ecological and Landscape Context; Instytut Geografii I Przestrzennego Zagospodarowania im. Stanisława Leszczyckiego, Polska Akademia Nauk: Warsaw, Poland, 2017. (In Polish) [Google Scholar]
  44. Mils, E. Studiesin fhe Structureofthe Urban Economy; Johns Hopkins Press: Baltimore, MD, USA, 1972. [Google Scholar]
  45. O’sullivan, A. Urban Economics; McGraw-Hill/Irwin: New York, NY, USA, 2007; pp. 225–226. [Google Scholar]
  46. Geshkov, M. Urban sprawl in Eastern Europe: The Sofia City example. Econ. Altern. 2015, 2, 101–116. [Google Scholar]
  47. Biłozor, A. Urban land use changes forecasting. In Proceedings of the 9th International Conference on Environmental Engineering. Section: Sustainable Urban Development, Vilnius, Lithuania, 22–23 May 2014; ISBN 978-609-457-640-9. [Google Scholar]
  48. Biłozor, A.; Czyża, S.; Bajerowski, T. Identification and Location of a Transitional Zone between an Urban and a Rural Area Using Fuzzy Set Theory, CLC, and HRL Data. Sustainability 2019, 11, 7014. [Google Scholar] [CrossRef] [Green Version]
  49. Simon, D. Urban Environments: Issues on the Peri-Urban Fringe. Annu. Rev. Environ. Resour. 2008, 33, 167–185. [Google Scholar] [CrossRef]
  50. Siemiński, J. Rural-urban continuum and some of its infrastructural problems. Infrastruct. Ecol. Rural. Areas 2010, 2, 215–228. [Google Scholar]
  51. Sobotka, S. Transformation of the historical spatial arrangements of the villages in the suburban area of Olsztyn, with particular emphasis on Brąswałd, Dorotowo and Jonkowo. Acta Sci. Pol. Adm. Locorum 2014, 13, 39–68. (In Polish) [Google Scholar]
  52. Szmytkie, R. Methods of Analysis of the Morphology and Physiomic of Sedate Units; Scientific Hearings of the Institute of Geography and Regional Development of the University of Wrocław no. 35; Institute of Geography and Regional Development of the University of Wrocław: Wrocław, Poland, 2014; Available online: http://www.geogr.uni.wroc.pl/data/files/publikacje-rozprawy-naukowe-igrr/rozprawy_35.pdf (accessed on 15 July 2021). (In Polish)
  53. Konecka-Szydłowska, B. The smallest cities in Poland in terms of the concept of urban-rural continuums. Reg. Dev. Reg. Policy 2018, 41, 151–165. (In Polish) [Google Scholar]
  54. Degórska, B. Spatial urbanization of rural areas in the metropolitan area of Warsaw. Ecological and landscape context. In Institute of Geography and Spatial Development im. Stanisława Leszczyckiego, Polish Academy of Sciences, Geographic Work, no 262; Institute of Geography and Spatial Development: Warsaw, Poland, 2017. (In Polish) [Google Scholar]
  55. Ravetz, J.; Warhurst, P. Manchester: Re-inventing the local–global in the peri-urban city-region. In Peri-Urban Futures: Scenarios and Models for Land Use Change in Europe; Nilsson, K., Pauleit, S., Bell, S., Aalbers, C., Sick Nielsen, T., Eds.; Springer: Berlin/Heidelberg, Germany, 2013. [Google Scholar] [CrossRef]
  56. Loibl, W.; Piorr, A.; Ravetz, J. Concepts and methods. In Peri-Urbanisation in Europe: Towards a European Policy to Sustain Urban-Rural Futures; Piorr, A., Ravetz, J., Tosics, I., Eds.; University of Copenhagen, Academic Books Life Sciences: Copenhagen, Denmark, 2011; pp. 24–29. [Google Scholar]
  57. Labbé, D. Facing the Urban Transition in Hanoi: Recent Urban Planning Issues and Initiatives; Institut National de la Reherche scientifique Centre-Urbanisation Culture Société: Québec City, QC, Canada, 2010; Available online: http://espace.inrs.ca/id/eprint/4986/1/HanoiUrbanization.pdf (accessed on 15 July 2021).
  58. Acevedo, W.; Masuoka, P. Time-series animation techniques for visualizing urban growth. Comput. Geosci. 1997, 23, 423–435. [Google Scholar] [CrossRef]
  59. Csatári, B.; Farkas, J.Z.; Lennert, J. Land Use Changes in the Rural-Urban Fringe of Kecskemét after the Economic Transition. J. Settl. Spat. Plan. 2013, 4, 153–159. [Google Scholar]
  60. Nabielek, K.; Kronberger-Nabielek, P.; Hamers, D. The rural-urban fringe in the Netherlands: Recent developments and future challenges. SPOOL 2013, 1, 1–18. [Google Scholar] [CrossRef]
  61. Simon, D.; McGregor, D.; Nsiah-Gyabaah, K. The changing urban–rural interface of African cities: Definitional issues and an application to Kumasi, Ghana. Environ. Urban. 2004, 16, 235–248. [Google Scholar]
  62. Tacoli, C. The links between rural and urban development. Environ. Urban. 2003, 15, 3–12. [Google Scholar] [CrossRef] [Green Version]
  63. Hoffmann, E.; Jose, M.; Nölke, N.; Möckel, T. Construction and Use of a Simple Index of Urbanisation in the Rural–Urban Interface of Bangalore, India. Sustainability 2017, 9, 2146. [Google Scholar] [CrossRef] [Green Version]
  64. Gallent, N. The Rural–Urban fringe: A new priority for planning policy? Plan. Pract. Res. 2006, 21, 383–393. [Google Scholar] [CrossRef]
  65. Hao, P.; Geertman, S.; Hooimeijer, P.; Sliuzas, R. The land-use diversity in urban villages in Shenzhen. Environ. Plan. 2012, 44, 2742–2764. [Google Scholar] [CrossRef]
  66. Gallent, N.; Shaw, D. Spatial planning, area action plans and the rural-urban fringe. J. Environ. Plan. Manag. 2001, 50, 617–638. [Google Scholar] [CrossRef]
  67. Gant, R.; Robinson, G.; Shahab, F. Land-use change in the ‘edgelands’: Policies and pressures in London’s rural–urban fringe. Land Use Policy 2011, 28, 266–279. [Google Scholar] [CrossRef]
  68. Datta, R. Territorial Integration: An approach to address urbanising villages in the planning for Delhi metropolitan area, India. In Proceedings of the Territorial Integration of Urbanising Villages 40th ISoCaRP Congress, Geneva, Switzerland, 22 September 2004. [Google Scholar]
  69. Biłozor, A.; Renigier-Biłozor, M.; Cellmer, R. Assessment Procedure of Suburban Land Attractiveness and Usability for Housing. In Proceedings of the Baltic Geodetic Congress, Olsztyn, Poland, 21–23 June 2018. [Google Scholar] [CrossRef]
  70. Renigier-Bilozor, M.; Bilozor, A. Optimization of the Variables Selection in the Process of Real Estate Markets Rating. Oeconomia Copernic. 2015, 6, 139–157. [Google Scholar] [CrossRef]
  71. Renigier-Biłozor, M.; Biłozor, A.; Wiśniewski, R. 2017. Real estate markets rating engineering as the condition of urban areas assessment. Land Use Policy 2017, 61, 511–525. [Google Scholar] [CrossRef]
  72. Ready, R.; Abdalla, C. GIS Analysis of Land Use on the Rural-Urban Fringe: The Impact of Land Use and Potential Local Disamenities on Residential Property Values and on the Location of Residential Development in Berks County, Pennsylvania; Final Report; Staff Paper 364; Pennsylvania State University: State College, PA, USA, 2003. [Google Scholar]
  73. Renigier-Bilozor, M.; Wisniewski, R.; Bilozor, A. Rating attributes toolkit for the residential property market. Int. J. Strateg. Property Manag. 2017, 21, 307–317. [Google Scholar] [CrossRef]
  74. Renigier-Bilozor, M. Modern classification system of real estate markets. Geodetski Vestnik 2017, 61, 441–460. [Google Scholar] [CrossRef]
  75. Renigier-Biłozor, M.; Walacik, M.; Źróbek, S.; d’Amato, M. Forced sale discount on property market—How to assess it? Land Use Policy 2018, 78, 104–115. [Google Scholar] [CrossRef]
  76. Konieczna, J.; Trystuła, A. Źródłą danych geoprzestrzennych na potrzeby waloryzacji. In Współczesna Waloryzacja Przestrzeni Zurbanizowanej; Iwona, C., Ed.; Wydawnictwo UWM w Olsztynie: Olsztyn, Poland, 2012. [Google Scholar]
  77. Lefebvre, A.; Sannier, C.; Corpetti, T. Monitoring Urban Areas with Sentinel-2A Data: Application to the Update of the Copernicus High Resolution Layer Imperviousness Degree. Remote Sens. 2016, 8, 606. [Google Scholar] [CrossRef] [Green Version]
  78. Zhang, M.; Chen, F.; Tian, B.; Liang, D. Multi-temporal SAR image classification of coastal plain wetlands using a new feature selection method and random forests. Remote Sens. Lett. 2019, 10, 312–321. [Google Scholar] [CrossRef]
  79. Renigier-Biłozor, M.; Biłozor, A. The use of geoinformation in the process of optimization the use of land. In Proceedings of the 9th International Conference on “Environmental Engineering”, Vilnius, Lithuania, 22–23 May 2014. Section: Sustainable Urban Development Vilnius, Lithuania, eISSN 2029-7092/eISBN 978-609-457-640-9. [Google Scholar]
  80. Lisini, G.; Salentinig, A.; Du, P.; Gamba, P. SAR-Based Urban Extents Extraction: From ENVISAT to Sentinel-1. IEEE J. Sel. Top. Appl. Earth Obs. Remote Sens. 2018, 11, 2683–2691. [Google Scholar] [CrossRef]
  81. Bielecka, E.; Ciołkosz, A. CLC-2006-Database of Land Cover in Poland; PPK t. 41; 2009; Volume 3, pp. 227–236. [Google Scholar]
  82. Kantak, T. Spatial Information Systems (Auditory). Self-Study Support Materials for 3rd Year Part-Time Students of Navigation Major 2013/2014. Available online: https://gisplay.pl/gis/definicje-gis.html (accessed on 16 July 2021).
  83. Heymann, Y.; Steenmans, C.; Croisille, G.; Bossard, M. Corine Land Cover; Technical Guide 1994; Office for Official Publications of European Communities: Luxembourg, 1994. [Google Scholar]
  84. Cieślak, I.; Biłozor, A.; Szuniewicz, K. The Use of the CORINE Land Cover (CLC) Database for Analyzing Urban Sprawl. Remote Sens. 2020, 12, 282. [Google Scholar] [CrossRef] [Green Version]
  85. Kuc, G.; Chormański, J. Sentinel-2 imagery for mapping and monitoring imperviousness in urban areas. Int. Arch. Photogramm. Remote Sens. Spat. Inf. Sci. 2019, 42, 43–47. [Google Scholar] [CrossRef] [Green Version]
  86. Furberg, D.; Ban, Y.; Nascetti, A. Monitoring of Urbanization and Analysis of Environmental Impact in Stockholm with Sentinel-2A and SPOT-5 Multispectral Data. Remote Sens. 2019, 11, 2408. [Google Scholar] [CrossRef] [Green Version]
  87. Liu, X.; Hu, G.; Chen, Y.; Li, X.; Xu, X.; Shaoying, L.; Pei, F.; Wang, S. 2018. High-resolution multi-temporal mapping of global urban land using Landsat images based on the Google Earth Engine Platform. Remote Sens. Environ. 2018, 209, 227–239. [Google Scholar] [CrossRef]
  88. Pazúr, R.; Feranec, J.; Štych, P.; Kopecká, M.; Holman, L. 2017. Changes of urbanised landscape identified and assessed by the UrbanAtlas data: Case study of Prague and Bratislava. Land Use Policy 2017, 61, 135–146. [Google Scholar] [CrossRef]
  89. Schug, F.; Okujeni, A.; Hauer, J.; Hostert, P.; Nielsen, J.; van der Linden, S. Mapping patterns of urban development in Ouagadougou, Burkina Faso, using machine learning regression modeling with bi-seasonal Landsat time series. Remote Sens. Environ. 2018, 210, 217–228. [Google Scholar] [CrossRef]
  90. Hsu, F.; Zhizhin, M.; Ghosh, T.; Elvidge, C.; Taneja, J. The Annual Cycling of Nighttime Lights in India. Remote Sens. 2021, 13, 1199. [Google Scholar] [CrossRef]
  91. Liua, Z.; Hea, C.; Zhangc, O.; Huangd, O.; Yang Yanga, Y. 2012. Extracting the dynamics of urban expansion in China using DMSP-OLS nighttime light data from 1992 to 2008. Landsc. Urban Plan. 2012, 106, 62–72. [Google Scholar] [CrossRef]
  92. Jones, C.; Kammen, D.M. 2014. Spatial Distribution of U.S. Household Carbon Footprints Reveals Suburbanization Undermines Greenhouse Gas Benefits of Urban Population Density. Environ. Sci. Technol. 2014, 48, 895–902. [Google Scholar] [CrossRef]
  93. Hahs, A.K.; Mcdonnell, M.J.; Mccarthy, M.A.; Vesk, P.A.; Corlett, R.T.; Norton, B.A.; Clemants, S.E.; Duncan, R.P.; Thompson, K.; Schwartz, M.W. A global synthesis of plant extinction rates in urban areas. Ecol. Lett. 2010, 12, 1165–1173. [Google Scholar] [CrossRef]
  94. Ives, C.D.; Lentini, P.E.; Threlfall, C.G.; Ikin, K.; Shanahan, D.F.; Garrard, G.E.; Bekessy, S.A.; Fuller, R.A.; Mumaw, L.; Rayner, L.; et al. Cities are hotspots for threatened species. Glob. Ecol. Biogeogr. 2016, 25, 117–126. [Google Scholar] [CrossRef]
  95. Luo, M.; Lau, N.C. Urban Expansion and Drying Climate in an Urban Agglomeration of East China. Geophys. Res. Lett. 2019, 46, 6868–6877. [Google Scholar] [CrossRef]
  96. Fan, H.; Yu, Z.; Yang, G.; Liu, T.Y.; Liu, T.Y.; Hung, C.H.; Vejre, H. How to cool hot-humid (Asian) cities with urban trees? An optimal landscape size perspective. Agr. For. Meteorol. 2019, 265, 338–348. [Google Scholar] [CrossRef]
  97. Jenerette, G.D.; Harlan, S.L.; Brazel, A.; Jones, N.; Larsen, L.; Stefanov, W.L. Regional relationships between surface temperature, vegetation, and human settlement in a rapidly urbanizing ecosystem. Landsc. Ecol. 2007, 22, 353–365. [Google Scholar] [CrossRef]
  98. Tu, M.; Liu, Z.; He, C.; Fang, Z.; Lu, W. The relationships between urban landscape patterns and fine particulate pollution in China: A multiscale investigation using a geographically weighted regression model. J. Clean Prod. 2019, 237, 117744. [Google Scholar] [CrossRef]
  99. Cao, Y.; Wang, Y.; Li, G.; Fang, X. 2019. Vegetation Response to Urban Landscape Spatial Pattern Change in the Yangtze River Delta, China. Sustainability 2020, 12, 68. [Google Scholar] [CrossRef] [Green Version]
  100. Thiel, M.; Esch, T.; Schenk, A. Object-oriented detection of urban areas from terrasar-x data. 2008. The International Archives of the Photogrammetry. Remote Sens. Spat. Inf. Sci. 2008, XXXVII Pt B8, 23–26. [Google Scholar]
  101. Batty, M. New ways of looking at cities. Nature 1995, 377, 574. [Google Scholar] [CrossRef]
  102. Antrop, M. Changing patterns in the urbanized countryside of Western Europe. Landsc. Ecol. 2000, 15, 257–270. [Google Scholar] [CrossRef]
  103. Zhu, Y. Changing urbanization processes and in situ rural-urban transformation: Reflections on China’s settlement definitions. In New forms of Urbanization; Routledge: London, UK, 2017; pp. 207–228. [Google Scholar]
  104. Das, M.; Das, A. Dynamics of Urbanization and its impact on Urban Ecosystem Services (UESs): A study of a medium size town of West Bengal, Eastern India. J. Urban Manag. 2019, 8, 420–434. [Google Scholar] [CrossRef]
  105. Wang, J.; Lin, Y.; Glendinning, A.; Xu, Y. Land-use changes and land policies evolution in China’s urbanization processes. Land Use Policy 2018, 75, 375–387. [Google Scholar] [CrossRef]
  106. Petrişor, A.I.; Ianoş, I.; Tălângă, C. Land cover and use changes focused on the urbanization pro-cesses in Romania. Environ. Eng. Manag. J. 2010, 9, 765–771. [Google Scholar] [CrossRef]
  107. Morano, P.; Guarini, M.R.; Tajani, F.; Anelli, D. Sustainable redevelopment: The cost-revenue analysis to support the urban planning decisions. In International Conference on Computational Science and Its Applications; Springer: Cham, Switzerland, 2020; pp. 968–980. [Google Scholar]
  108. BenDor, T.K.; Metcalf, S.S.; Paich, M. The dynamics of brownfield redevelopment. Sustainability 2011, 3, 914–936. [Google Scholar] [CrossRef] [Green Version]
  109. BenDor, T.; Metcalf, S. Conceptual Modeling and Dynamic Simulation of Brownfield Redevelopment. In Proceedings of the 23rd International System Dynamics Conference, Boston, MA, USA, 17–21 July 2005. [Google Scholar]
  110. Attardi, R.; Cerreta, M.; Sannicandro, V.; Torre, C.M. Non-compensatory composite indicators for the evaluation of urban planning policy: The land-use policy efficiency index (LUPEI). Eur. J. Oper. Res. 2018, 264, 491–507. [Google Scholar] [CrossRef]
  111. Cerreta, M.; Panaro, S.; Poli, G. A spatial decision support system for multifunctional landscape assessment: A transformative resilience perspective for vulnerable inland areas. Sustainability 2021, 13, 2748. [Google Scholar] [CrossRef]
  112. Burkhard, B.; Kroll, F.; Müller, F.; Windhorst, W. Landscapes’ capacities to provide ecosystem services—A concept for land-cover based assessments. Landsc. Online 2009, 15, 1–22. [Google Scholar] [CrossRef]
  113. Sutton, P.C.; Costanza, R. Global estimates of market and non-market values derived from nighttime satellite imagery, land cover, and ecosystem service valuation. Ecol. Econ. 2002, 41, 509–527. [Google Scholar] [CrossRef]
  114. Mierzejewska, L. Sustainable urban development—Selected understandings, concepts and models. Problems of Urban Development. Probl. Rozw. Miast. 2015, 3, 5–11. (In Polish) [Google Scholar]
Figure 1. Global urban and rural populations: historical and projected. Source: [1].
Land 10 01117 g001
Figure 2. Growth rates of urban agglomerations by size class. Source: https://population.un.org/wup/Maps/ (accessed on 2 August 2021).
Land 10 01117 g002
Figure 3. The projected growth of urban population and cities in 2030 compared to 1970. Source: https://population.un.org/wup/Maps/ (accessed on 2 August 2021).
Land 10 01117 g003
Figure 4. Projected growth of urban areas between 2000 and 2100. Source: https://population.un.org/wup/Maps/ (accessed on 2 August 2021).
Land 10 01117 g004
Figure 5. Classification of spatial data sources.
Land 10 01117 g005
Figure 6. An orthophotomap of the southern part of Olsztyn: (a)—1995, (b)—2005, (c)—2009, (d)—2017. Source: https://msipmo.olsztyn.eu/imap/ (accessed on 20 July 2021).
Land 10 01117 g006
Figure 7. Inventory of the existing development—an example, 2017. Source: [20].
Land 10 01117 g007
Figure 8. Land cover model in the area under investigation based on the CLC data. Source: [48].
Land 10 01117 g008
Figure 9. Aggregated urban areas. Source: [84].
Land 10 01117 g009
Figure 10. Land cover model in the area under investigation based on HRL Imperviousness data Source: [48].
Land 10 01117 g010
Figure 11. Urban land expansion from 1990 to 2010 in the representative cities. Source: [87].
Land 10 01117 g011
Figure 12. (a) LUC in (A) FUA Bratislava and B) FUA Prague in the years 2006 and 2012 according to the UA data; (b) LUC gains in (A) FUA Bratislava and (B) FUA Prague in the period 2006–2012 according to the UA data. Source: [88].
Land 10 01117 g012
Figure 13. Fraction development of urban surfaces, seasonal vegetation and soil from 2002 to 2013. Source: [89].
Land 10 01117 g013
Figure 14. (a). Land use/land cover map for India. (b). Binary background mask from the 2019 annual VIIRS Nighttime Light (VNL) product. Source: [90].
Land 10 01117 g014
Figure 15. Accuracy assessment of selected urban areas in China in 2008 extracted using NSL data. Source: [91].
Land 10 01117 g015
Figure 16. The dynamics of urban expansion in China from 1992 to 2008. Source: [91].
Land 10 01117 g016
Figure 17. HCF from (A) electricity, (B) natural gas, (C) fuel oil and other fuels, (D) housing = A + B + C + water, waste, and home construction, (E) transportation, (F) goods, (H) food, (I) services, and (G) total = D + E + F + H + I. Transportation includes motor vehicle fuel, lifecycle emissions from fuel, motor vehicle manufacturing, air travel direct and indirect emissions, and public transit. Scales below each map show gradients of 30 colours, with labels for the upper value of lowest of quantile, median value and lowest value of highest quantile, in metric tons CO2e per household, for zip code tabulation areas (ZCTAs). East Coast metropolitan statistical areas (J), with a larger map of New York metropolitan area (K, outer line) and New York City (K, inner line), highlight the consistent pattern of relatively low GHG urban core cities and high GHG suburbs. Source: [92].
Land 10 01117 g017
Figure 18. Spatial patterns of vegetation cover for (a) 2004, (b) 2008, and (c) 2013. Source: [99].
Land 10 01117 g018
Figure 19. Trends of vegetation change in (a) YRDUA and (b) urban sprawl area in 2004–2013. Source: [99].
Land 10 01117 g019
Figure 20. Filtered TerraSAR-X intensity layer (a) and calculated speckle divergence layer (b) of a subset of the region of Munich. The built-up areas are characterised by high values of speckle divergence. Source: [100].
Land 10 01117 g020
Figure 21. Urban use in the study area in the degree of membership interval of [0.00–1.00]: (a)—2005; (b)—2010; (c)—2018. Source: [20].
Land 10 01117 g021
Figure 22. Changes to land use in the years: (a): 2005–2010; (b): 2010–2018; (c): 2005–2018. Source: [20].
Land 10 01117 g022
Figure 23. The areas related to urban use separated for the three moments of time 2006, 2012 and 2018. Source: own elaboration.
Land 10 01117 g023
Figure 24. The AC index in the analysed cities in Poland. Source: own elaboration.
Land 10 01117 g024
Publisher’s Note: MDPI stays neutral with regard to jurisdictional claims in published maps and institutional affiliations.

