1. Introduction
Many studies have been conducted in various countries to predict the pressure generated inside pipes in order to evaluate the performance of water supply and drainage systems [
1]. In Japan, SHASE-S 218 [
2,
3,
4] (Heating, Air-Conditioning, and Sanitary Standard) stipulates the test method for the drainage capability of drainage stack systems. The judging criteria consists of the following two conditions: that the allowable pressure (the pneumatic pressure or pressure referred in the article indicates the airflow pressure) in a pipe should fall within ±400 Pa, and that the seal loss should be less than 25 mm. Although discharge from fixtures with varying flow rates occurs in actual drainage systems, constant discharge has been the standard discharge mode used in testing to circumvent the problem of selecting a representative fixture for testing. However, there have only been a few quantitative comparisons [
5,
6,
7,
8,
9] of pressure vibration in pipe and seal loss in water-saving sanitary fixtures widely used today and in constant discharge in test conditions, and therefore drainage capability may not have been properly evaluated.
In view of this, we conducted discharge experiments in a real-scale drainage tower to analyze pressure vibration in pipes and seal water fluctuations, and clarified the effect of a WC connection on pressure vibrations in pipes, as well as the relationship between pressure and seal loss as they occur in constant discharge and fixture discharge.
2. Outline of Real-Scale Drainage Tower Experiment
2.1. Purpose
Experiments were conducted to collect data of pressure vibrations in pipes in horizontal branch drainages on each floor, as well as seal water fluctuations and residual seal depths in various test traps when a constant discharge load based on SHASE-S218 was applied.
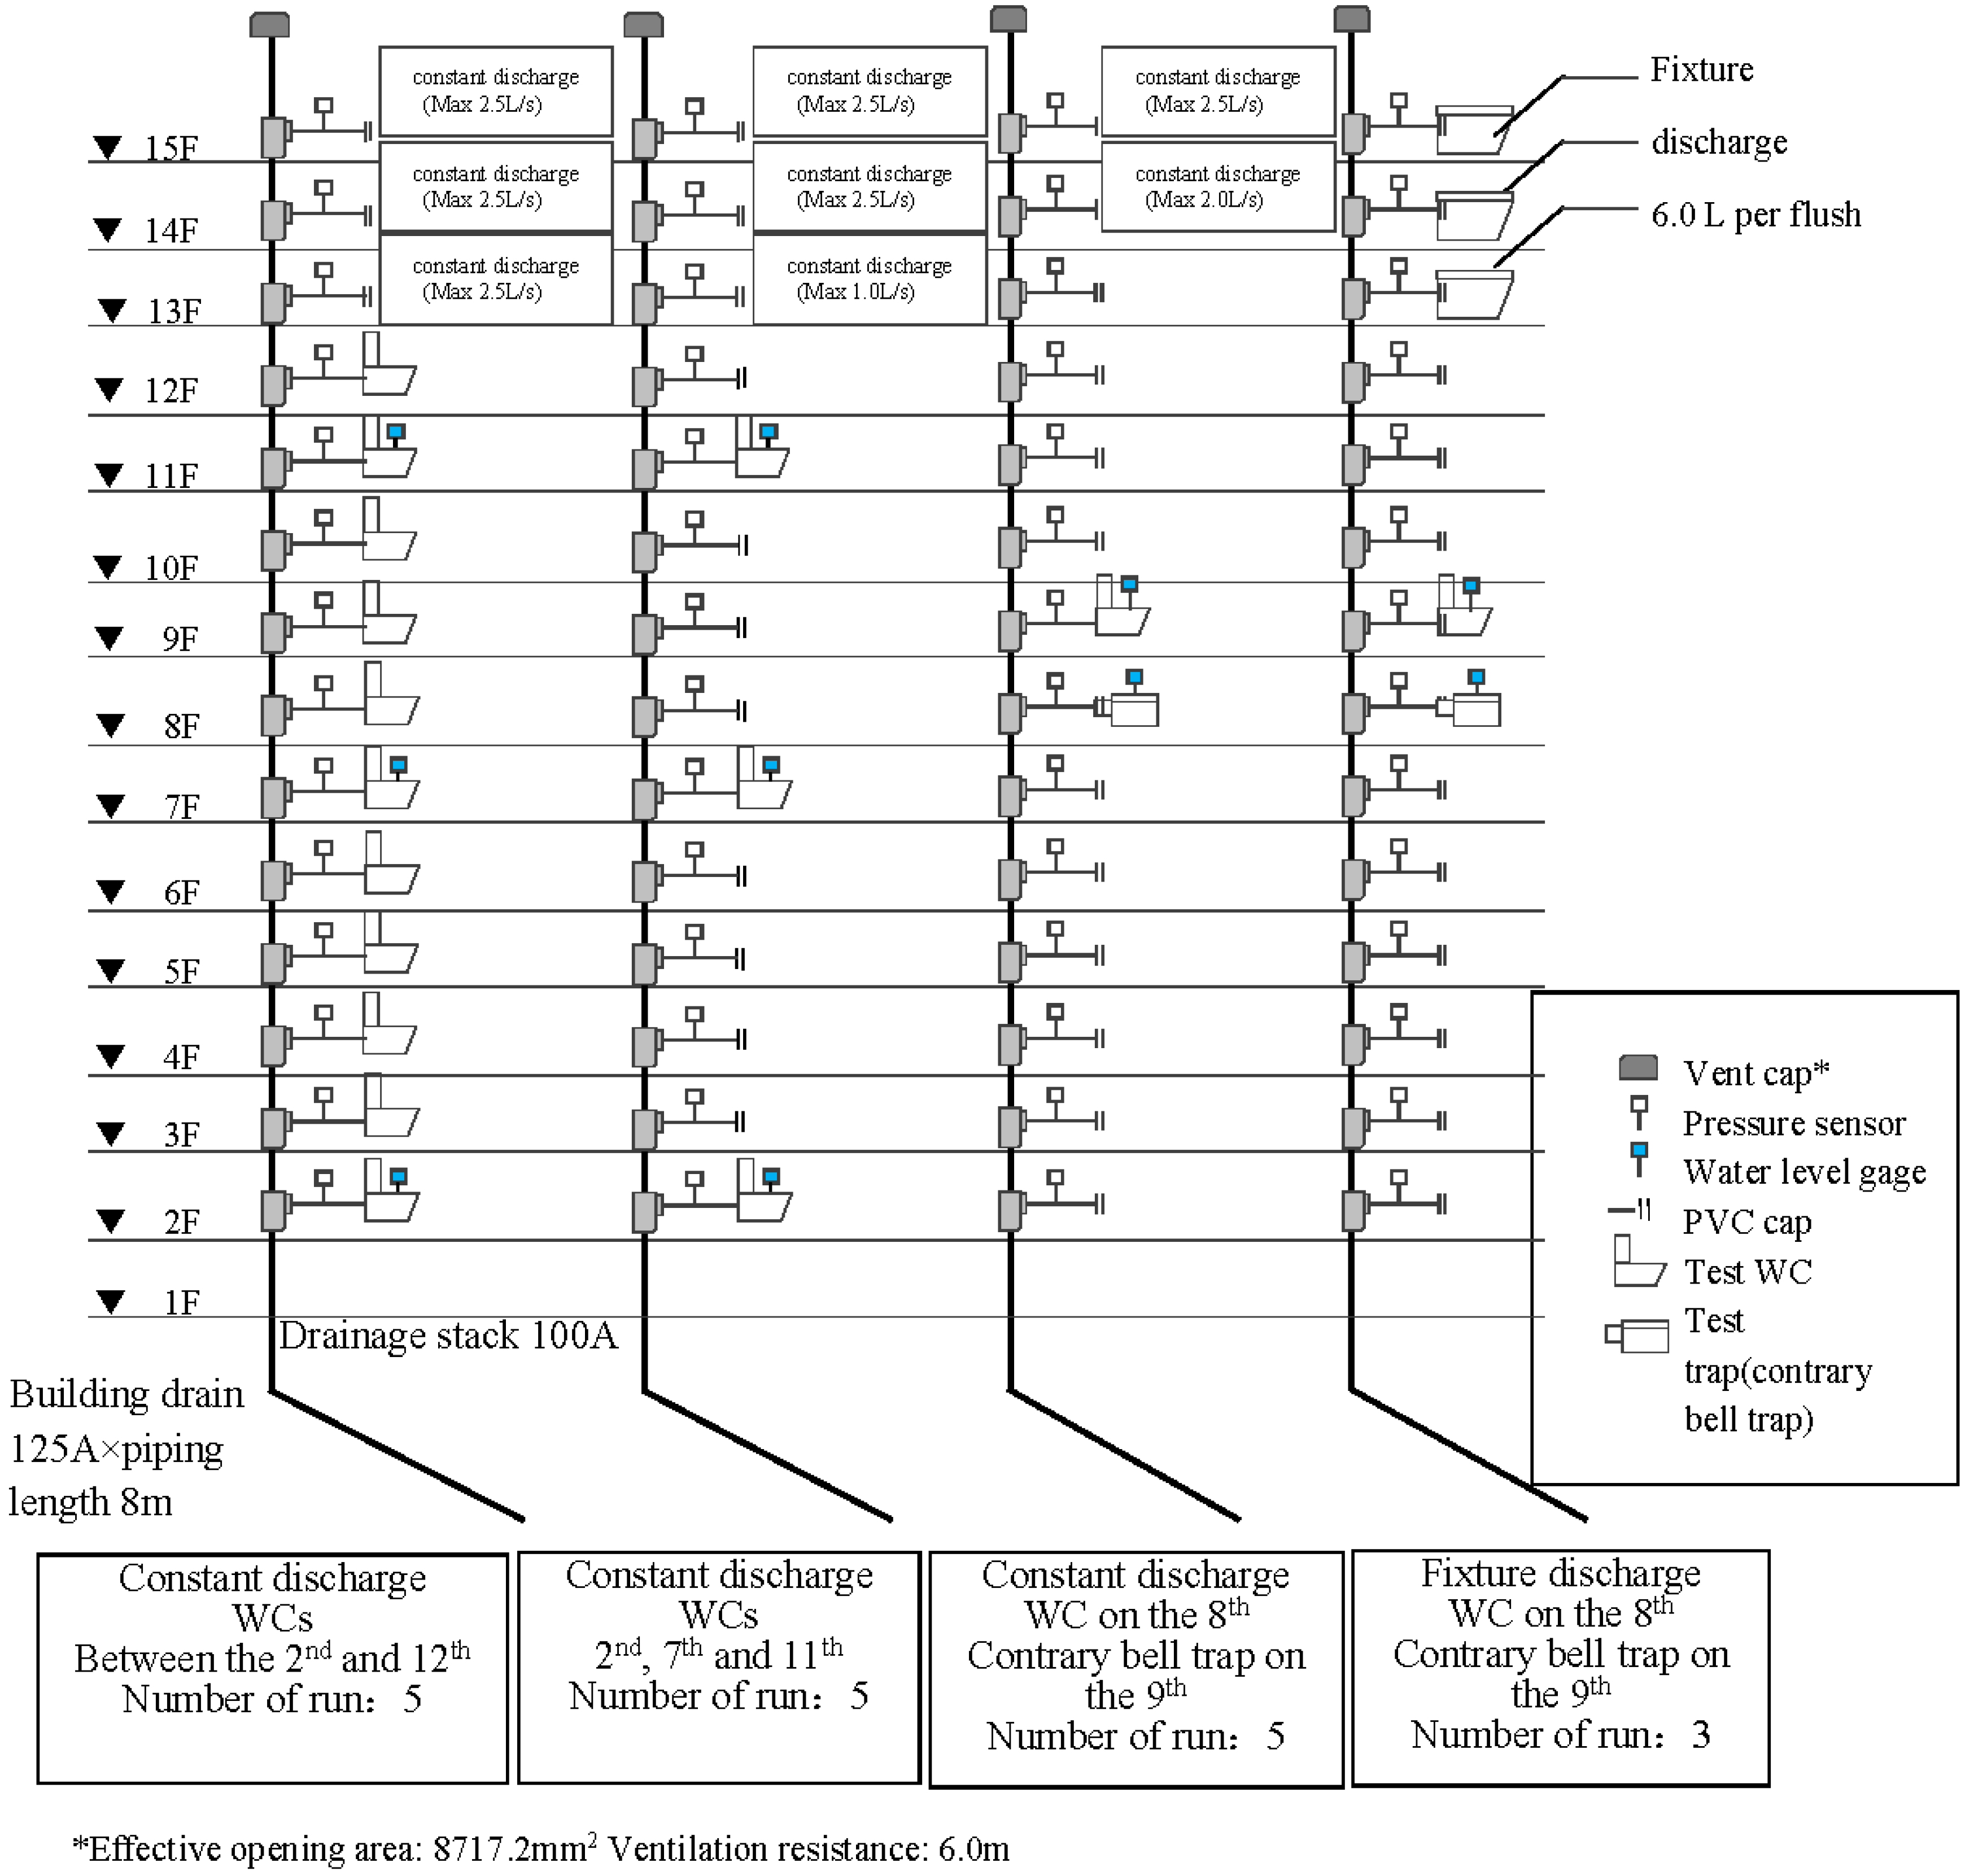
2.2. Experimental Drainage System
The outline of the experimental drainage system is shown in
Figure 1; dates of experiments and weather conditions are shown in
Table 1; and the specification of measurement devices is given in
Table 2. The system used in the experiments is a special fitting drainage system equivalent to a fifteen-story building. Test WCs were installed either on each floor between the 2nd and 12th floors, or on 2nd, 7th, and 11th floors. When a WC was used in combination with a contrary bell trap, the trap was placed on the 8th floor and the WC on the 9th.
Caps made of Polyvinyl chloride (hereinafter, referred to as “PVC caps”) were placed at the ends of horizontal branch drainage on the floors where no traps were connected. Discharge load was made from the 13th to 15th floors, and load variations were made in terms of load type and flow rate.
2.3. Measuring Conditions
Based on SHASE-S218, constant discharge loads (1.5 L/s, 3.0 L/s, 4.0 L/s, 4.5 L/s, 6.0 L/s) and fixture discharge loads from one to three WCs were applied. Discharge was made 5 s after measuring commenced. Pressure vibrations in pipes, seal water fluctuations, and residual seal depths were measured at a sampling cycle of 20 m/s (50 Hz) without low-pass filters. Measurements were made for one minute after the target flow rate was reached in constant discharge, and for 40 s in fixture discharge. In both conditions discharging started 5 s after the beginning of measurement.
2.4. Test WC and Test Trap
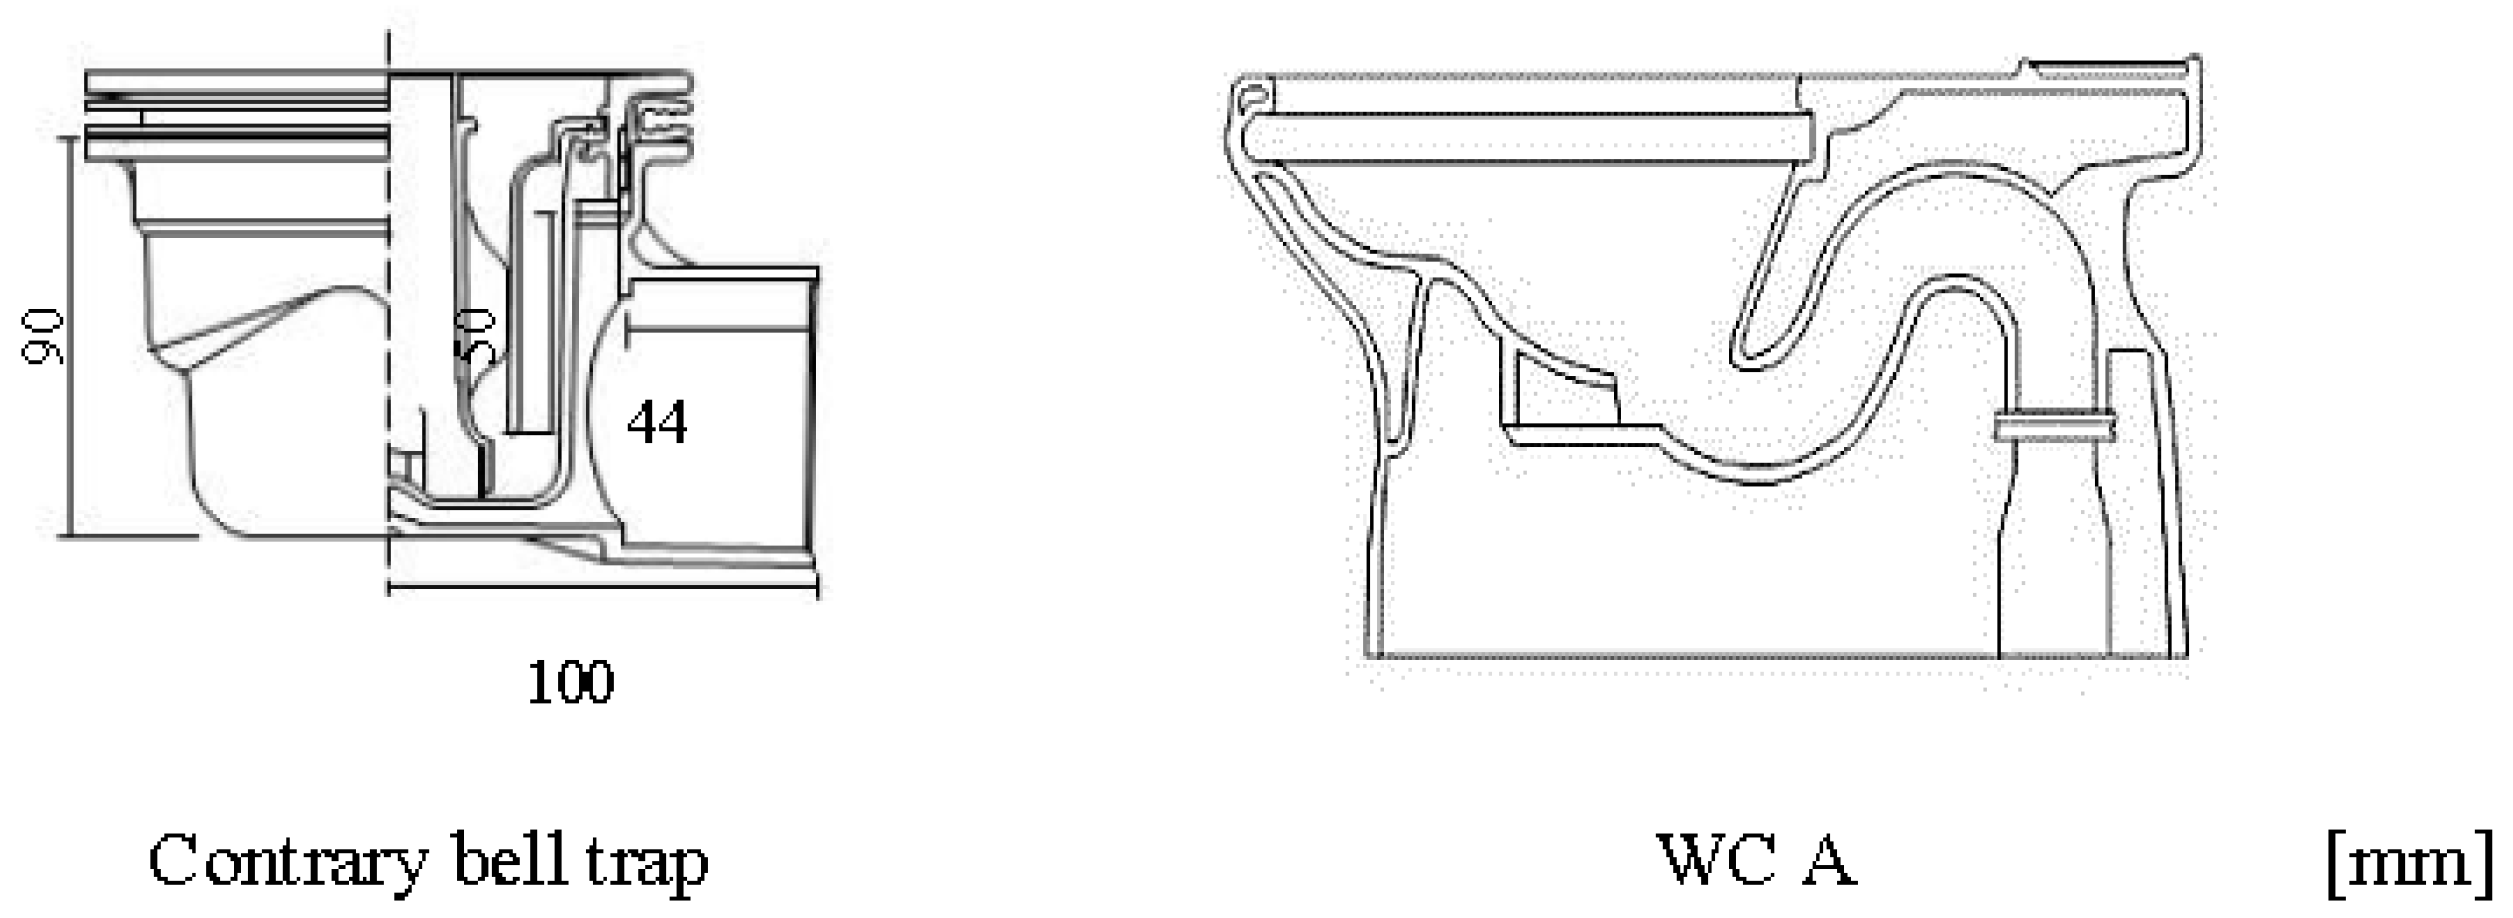
The cross-sectional views of a test trap with a water level sensor and a test WC are shown in
Figure 2; their basic parameters are given in
Table 3. A siphonic drainage type WC with 6.0 L per flush was used as the test WC. All traps were filled as default.
3. Effects of Load Type on Pressure Vibrations in Pipes and Seal Water Fluctuations
3.1. Purpose
Fluctuation wave patterns were analyzed to clarify the pressure vibrations in pipes for each load type and the characteristics of seal water fluctuation.
3.2. Method of Analysis
The wave patterns of pressure vibrations in pipes and seal water fluctuation were compared for each load type. Standard deviations (SD) were calculated and the pressure vibrations in the pipes and the seal water fluctuation were quantitatively compared.
3.3. Results
3.3.1. Constant Discharge Load
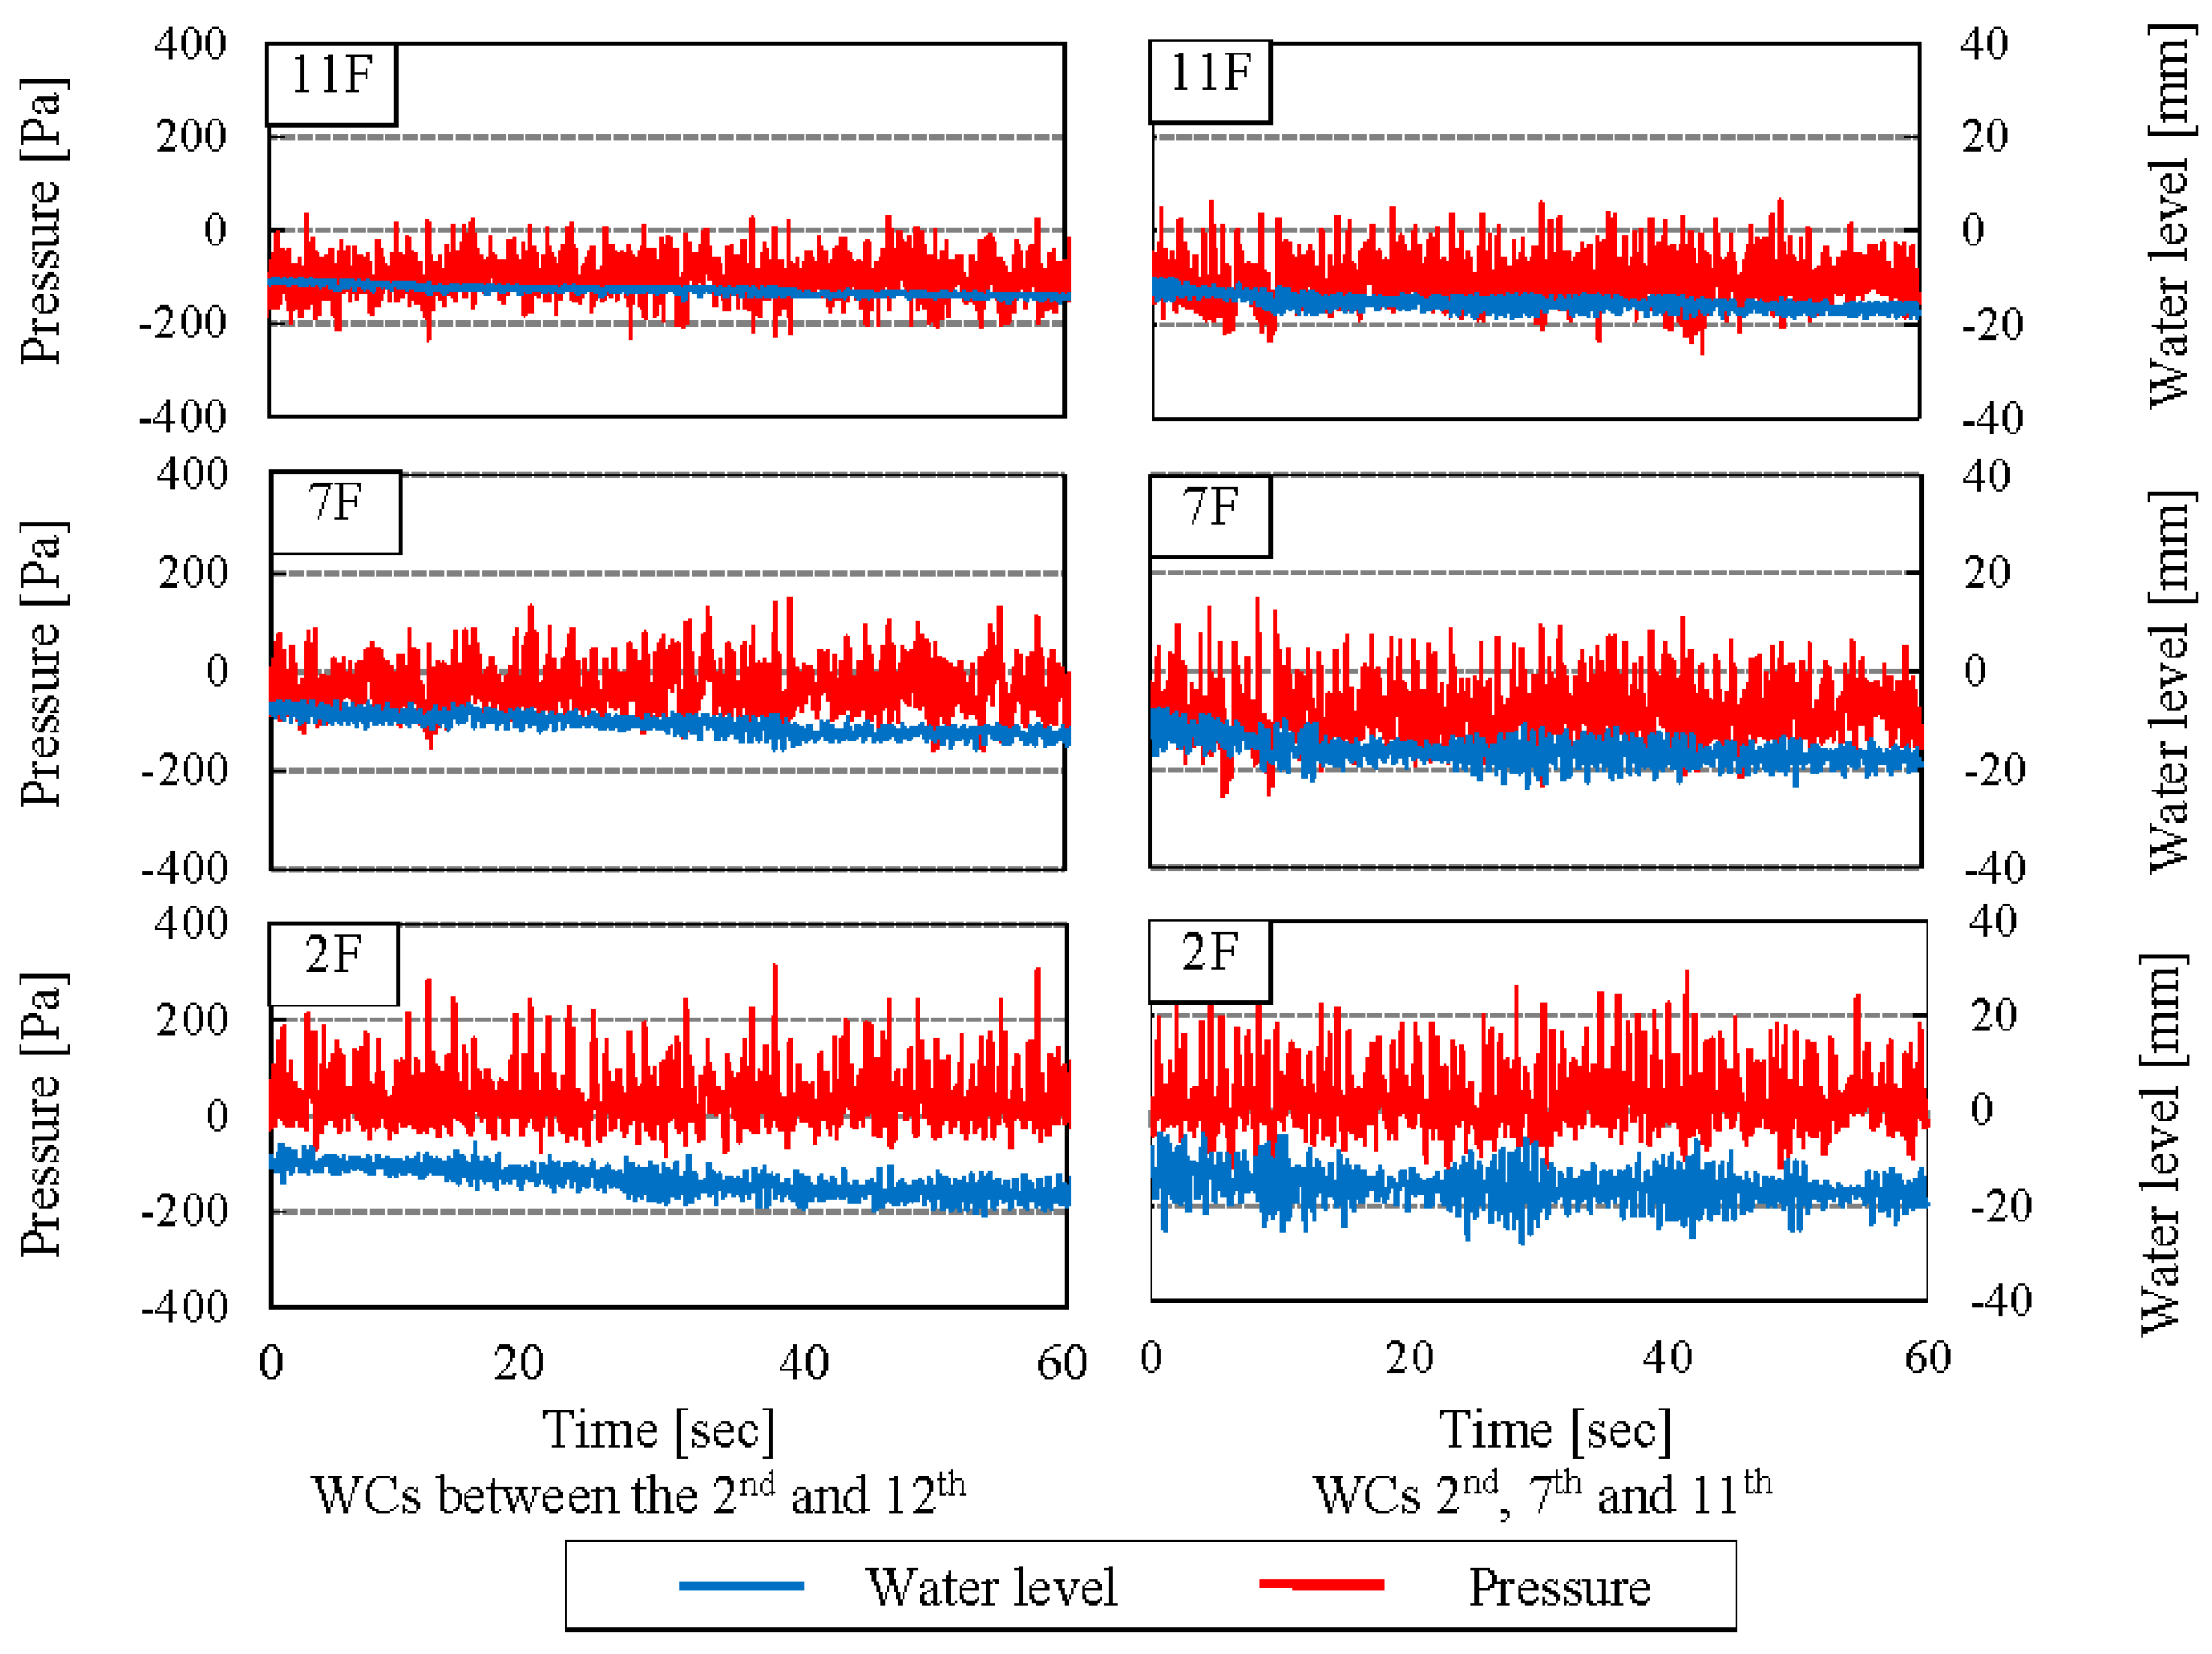
Figure 3 shows the representative wave patterns of the pressure vibrations and seal water fluctuations when WCs were placed on all the floors and on only three floors.
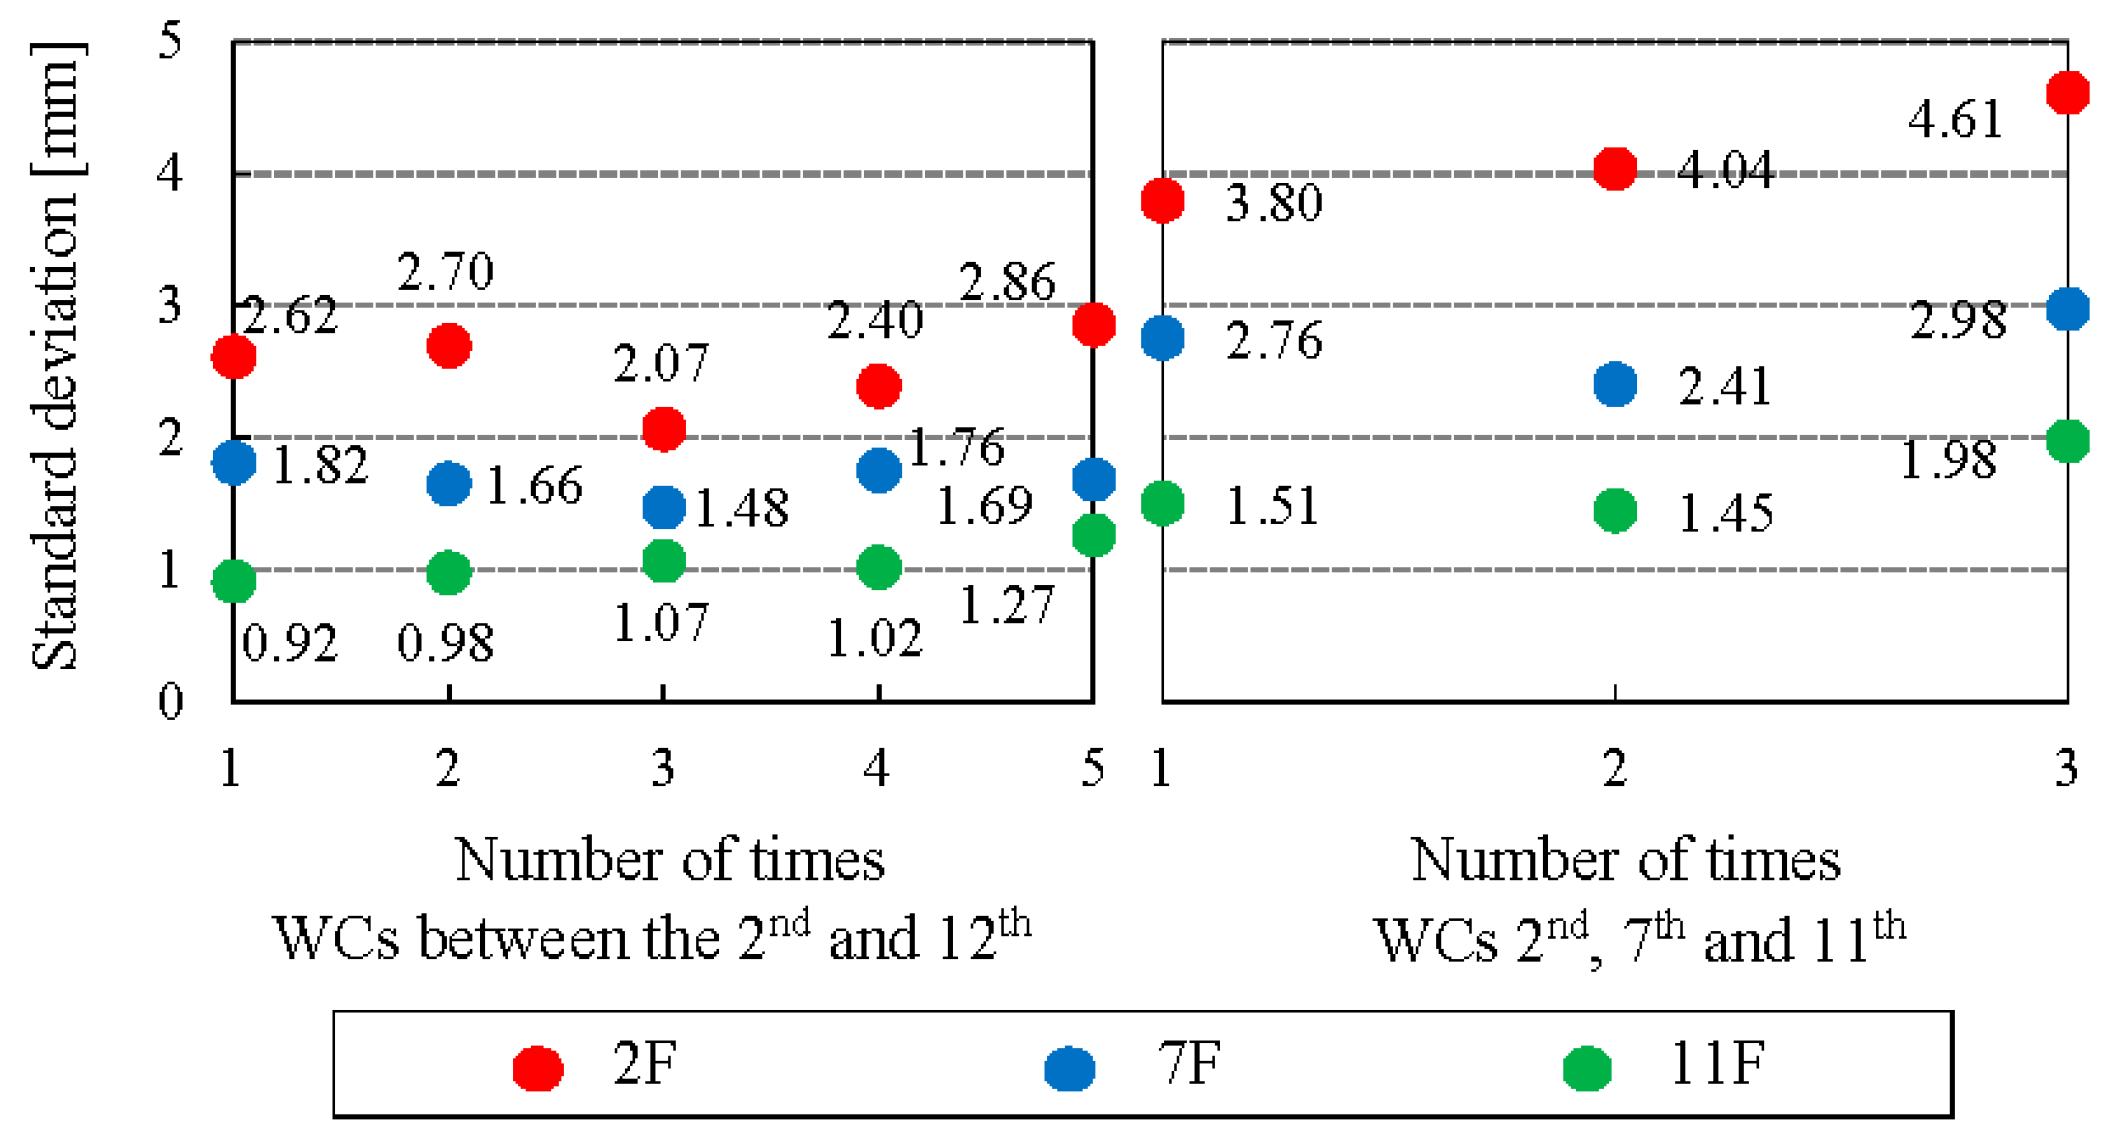
Figure 4 illustrates the SD of seal water fluctuation when the fixed flow rate load was 4.0 L/s.
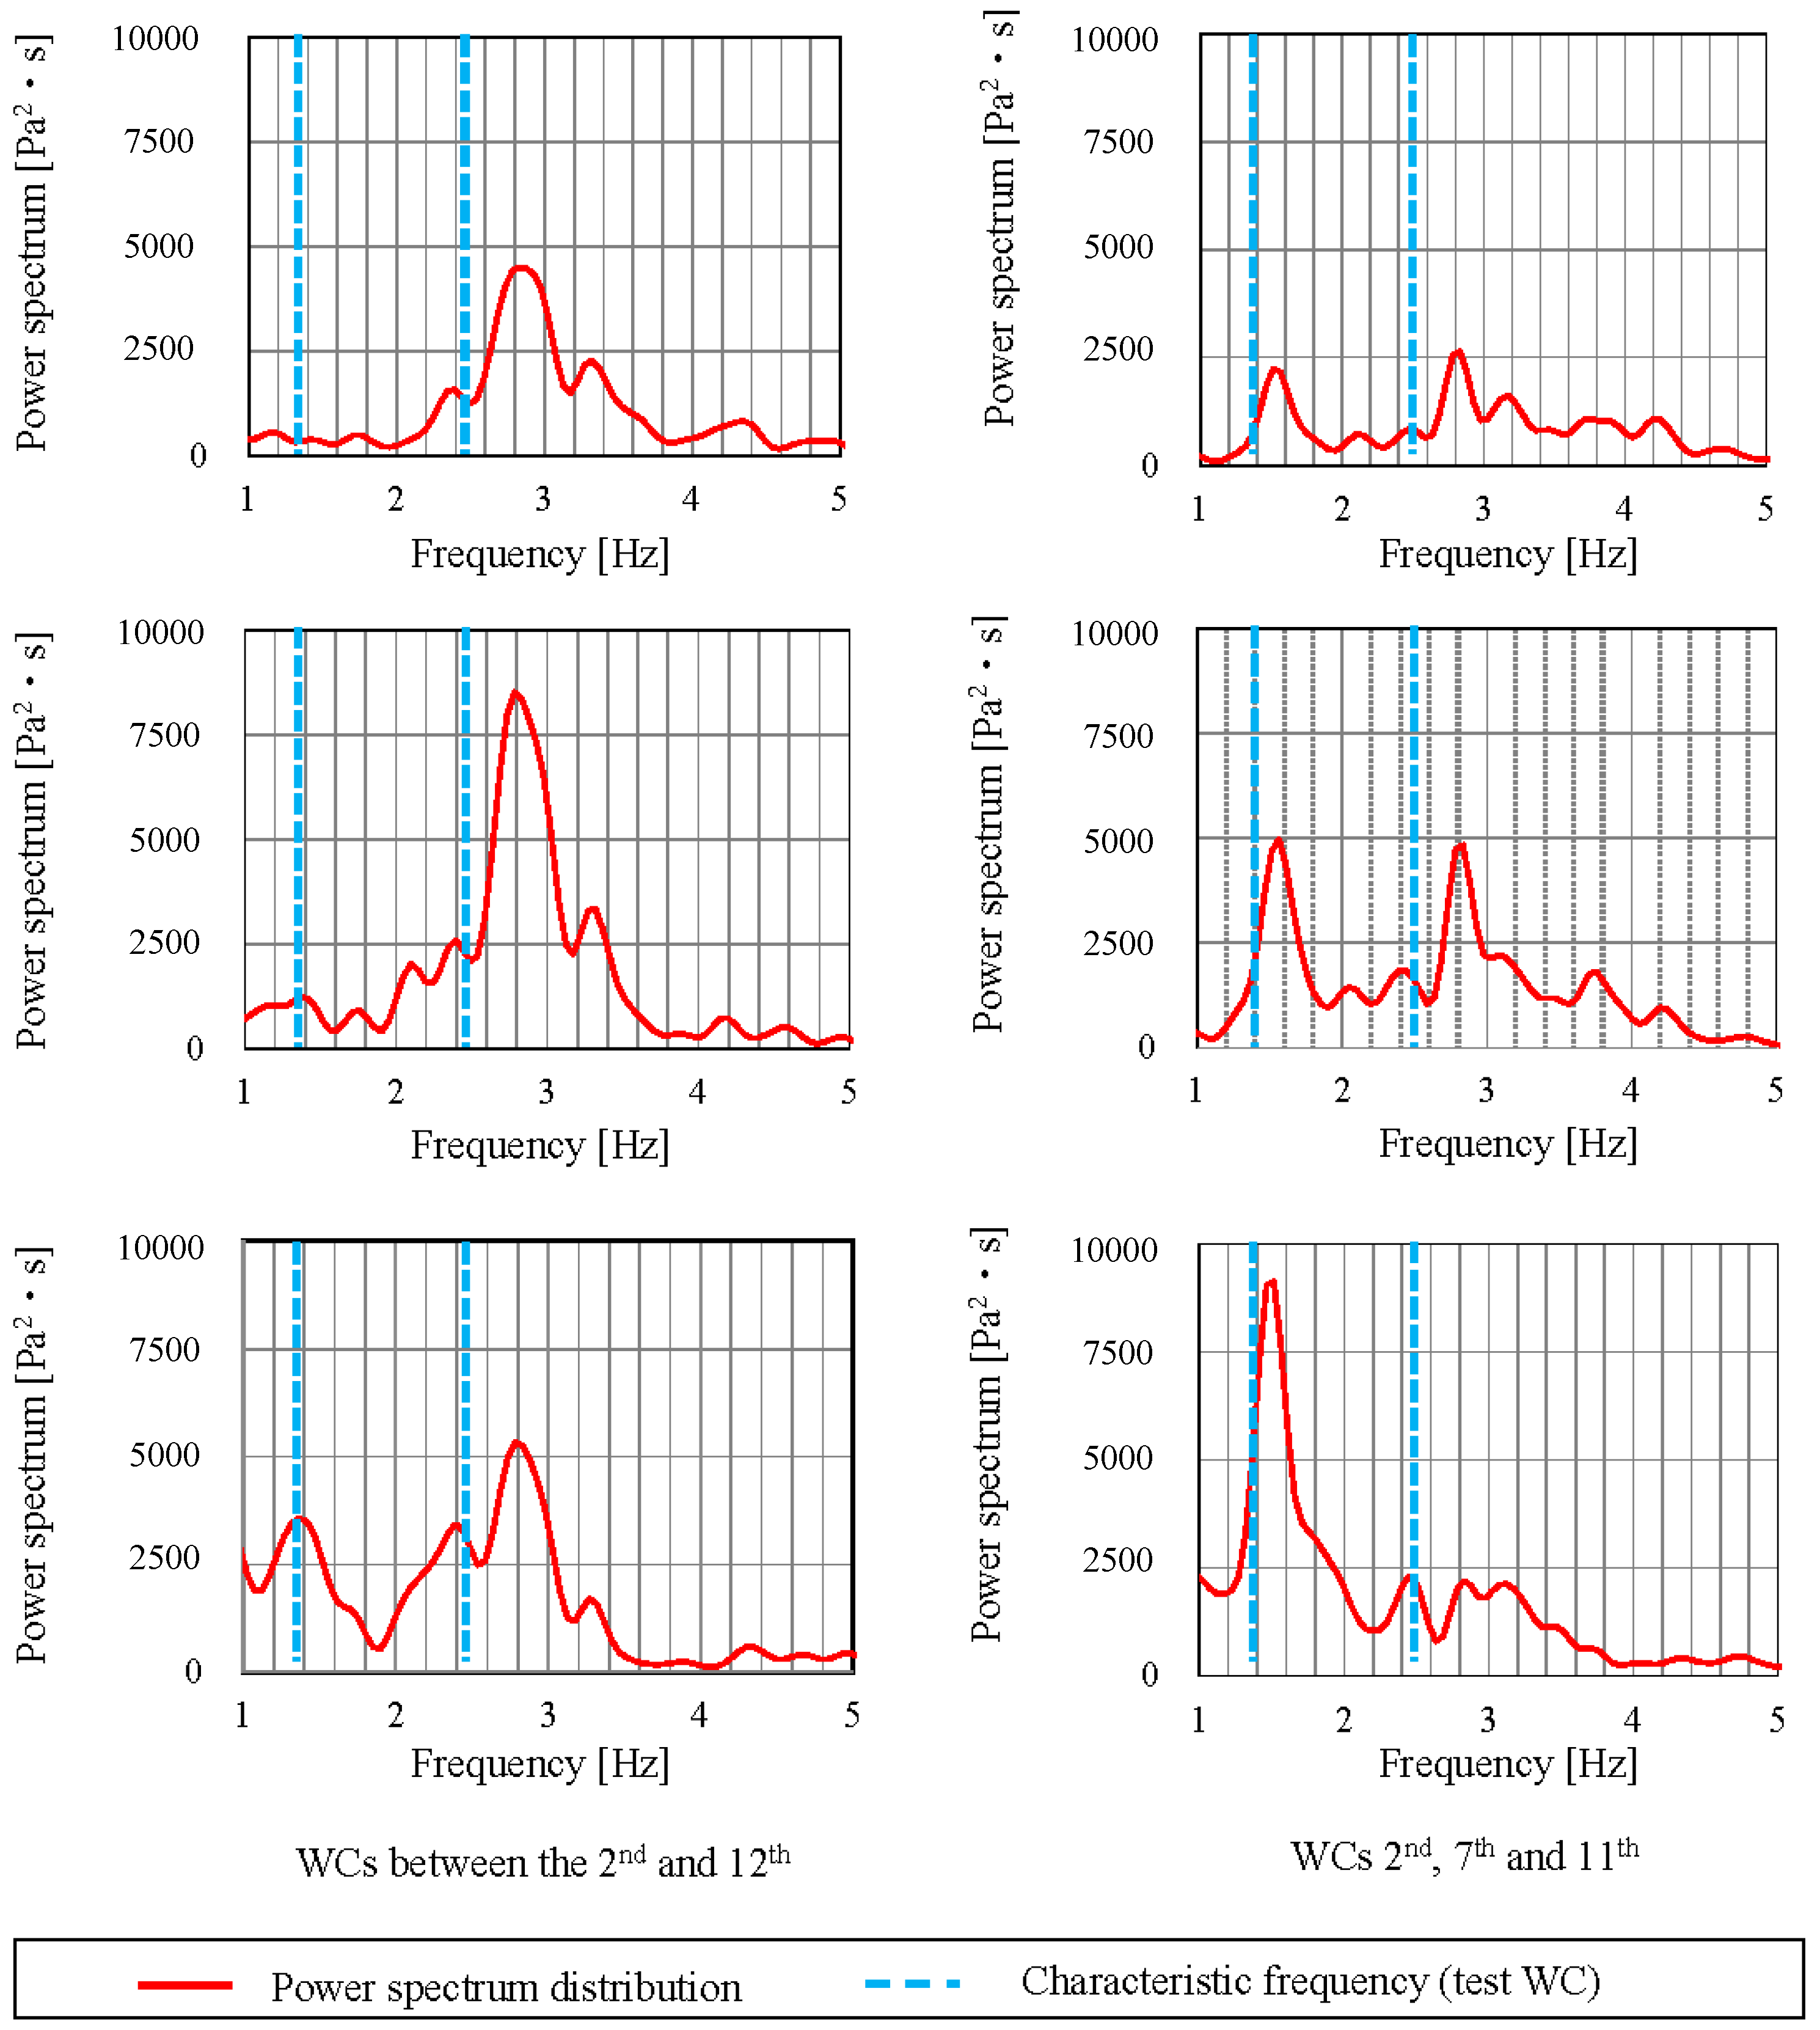
Figure 5 shows the power spectrum density distribution of pneumatic pressure vibration by the constant discharge load (4.0 L/s).
The ranges of seal water fluctuation wave patterns for each discharge type increased as the discharging floor decreased. This can be clearly seen in
Figure 4. The SDs of seal water fluctuation on the 2nd floor for both all-floor WC placement and three-floor placement were approximately 2.5 times larger than those on the 11th floor. This can be attributed to the fact that the pressure vibration in the pipes on the lower floors mainly consisted of positive pressure as opposed to those on the higher floors that consisted of negative pressure.
Figure 4 also indicates that the range of the seal water fluctuation wave patterns in the all-floor WC placement was smaller than that in the three-floor placement. It can be assumed that in the all-floor placement, the seal water on each floor had an influence on the pressure vibration in the pipes, and as a result the pressure in the pipes was reduced near the floors where traps were connected.
Figure 5 also indicates that the power spectral density distribution of the pressure fluctuation was larger in the case of installing test WCs on three floors (2nd, 7th, 11th) than in the case of installing test WCs through the whole building (between 2nd and 12th). Many pressure components of the frequency were close to the natural frequency of the test toilet. Therefore, the partial resonance phenomenon seems to have increased the seal water fluctuation in the case of installing WCs on three floors compared to the case of installing toilets on every floor in the building.
3.3.2. Fixture Discharge Load
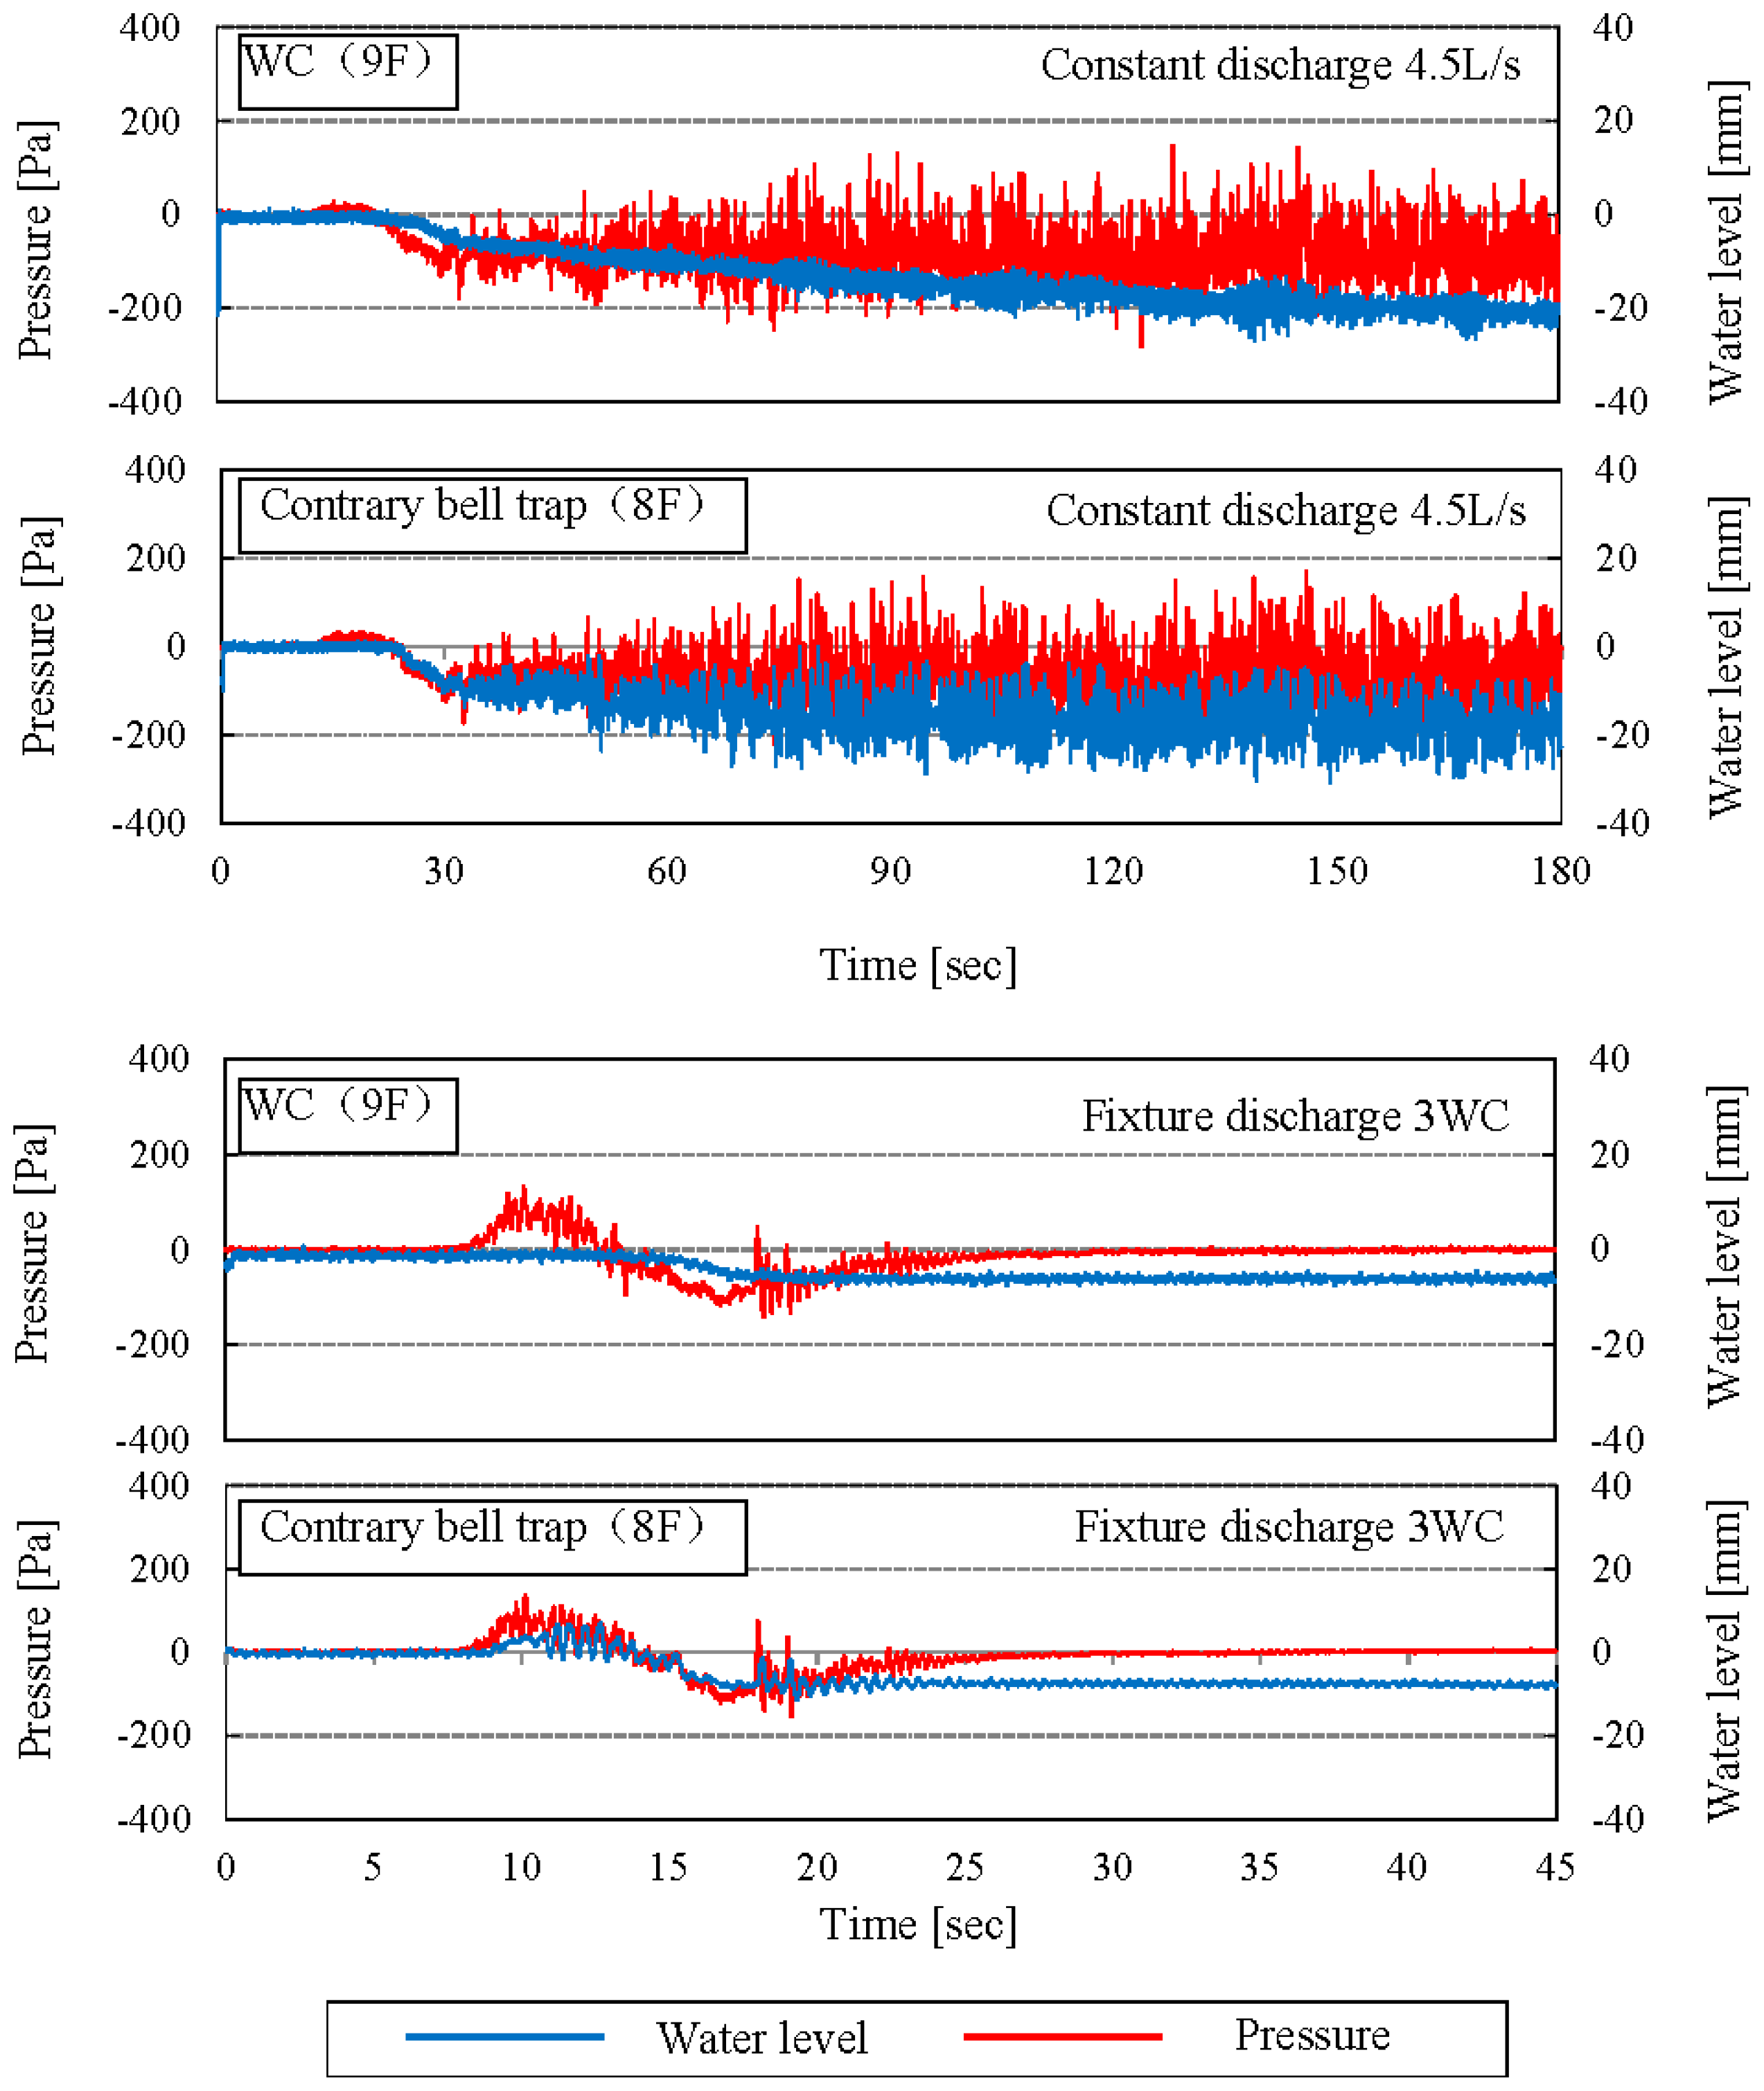
Figure 6 shows some examples of the wave patterns of pressure vibration in pipes and seal water fluctuation. The wave patterns of the seal water fluctuation corresponded with the pressure vibration as the seal water fluctuated in response to the pressure in the pipes; when the maximum pressure was produced right before discharged water passed through, then seal loss occurred. Seal water in a contrary bell trap had a larger range of fluctuation than that in a WC.
3.3.3. Comparison between Constant Discharge Load and Fixture Discharge Load
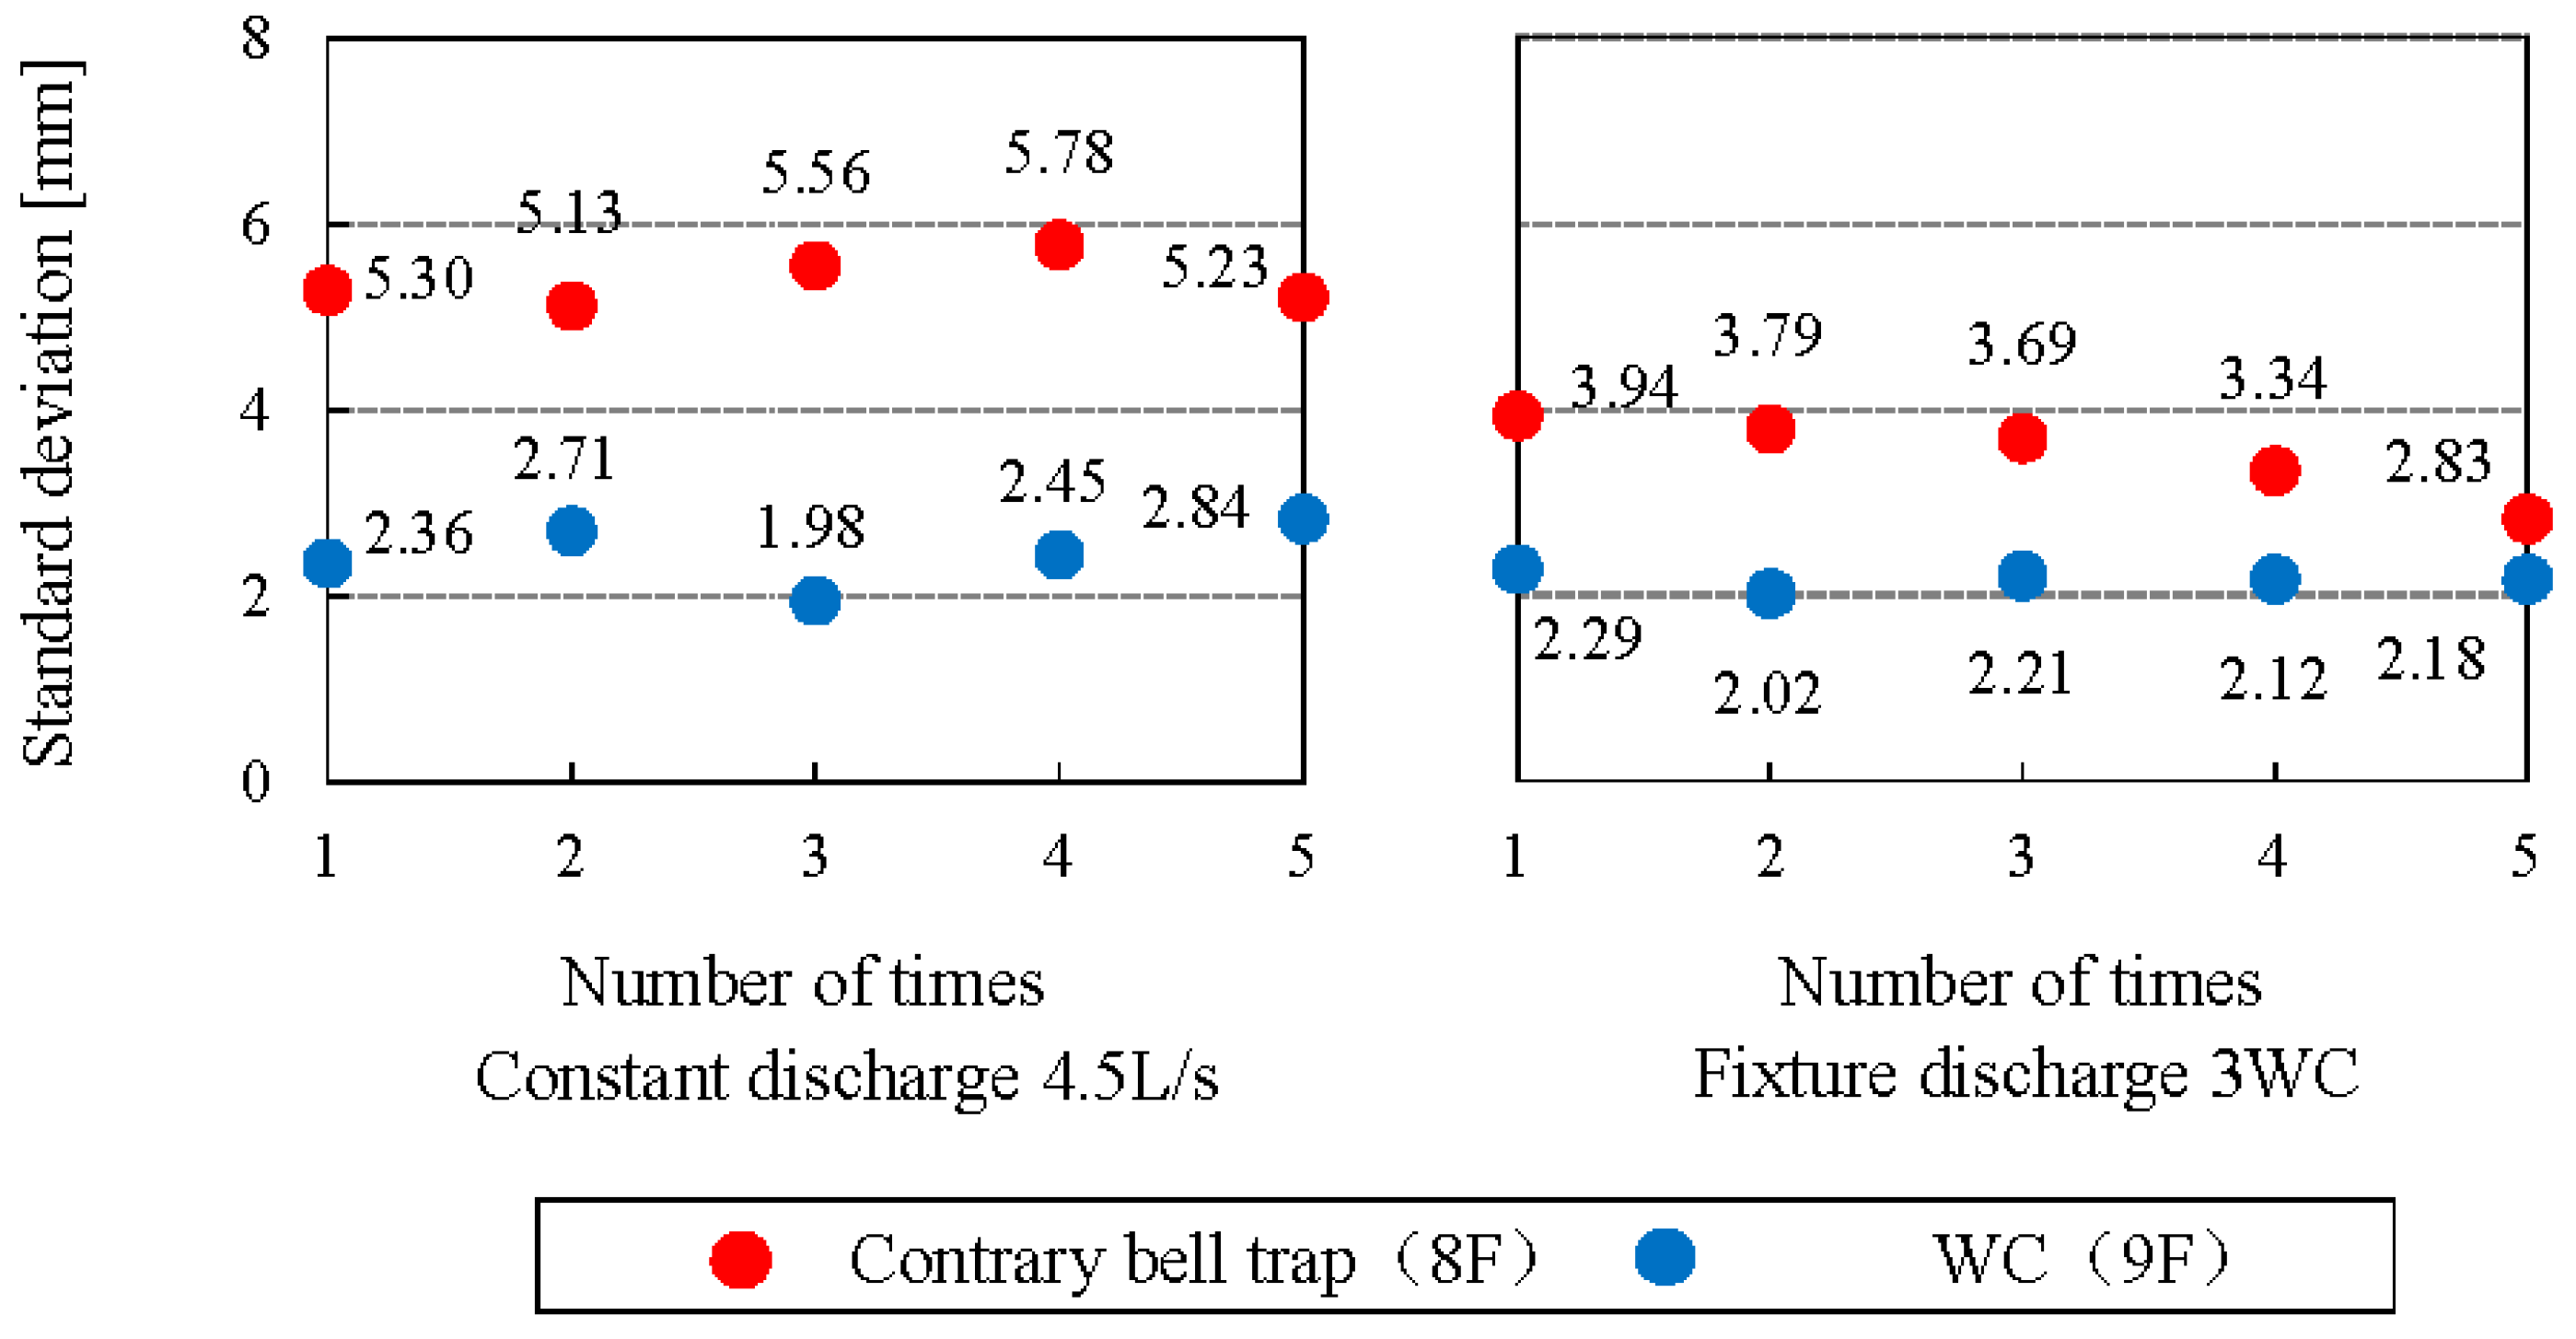
The SD of the seal water fluctuation is shown in
Figure 7. Seal water fluctuation wave patterns differed greatly depending on the load type.
Figure 7 clearly shows this, as the SD of the seal water fluctuation in the contrary bell trap was two to three times larger than that in the WC. The structure and water seal of the trap may have been the cause of the difference in the seal water fluctuation among traps.
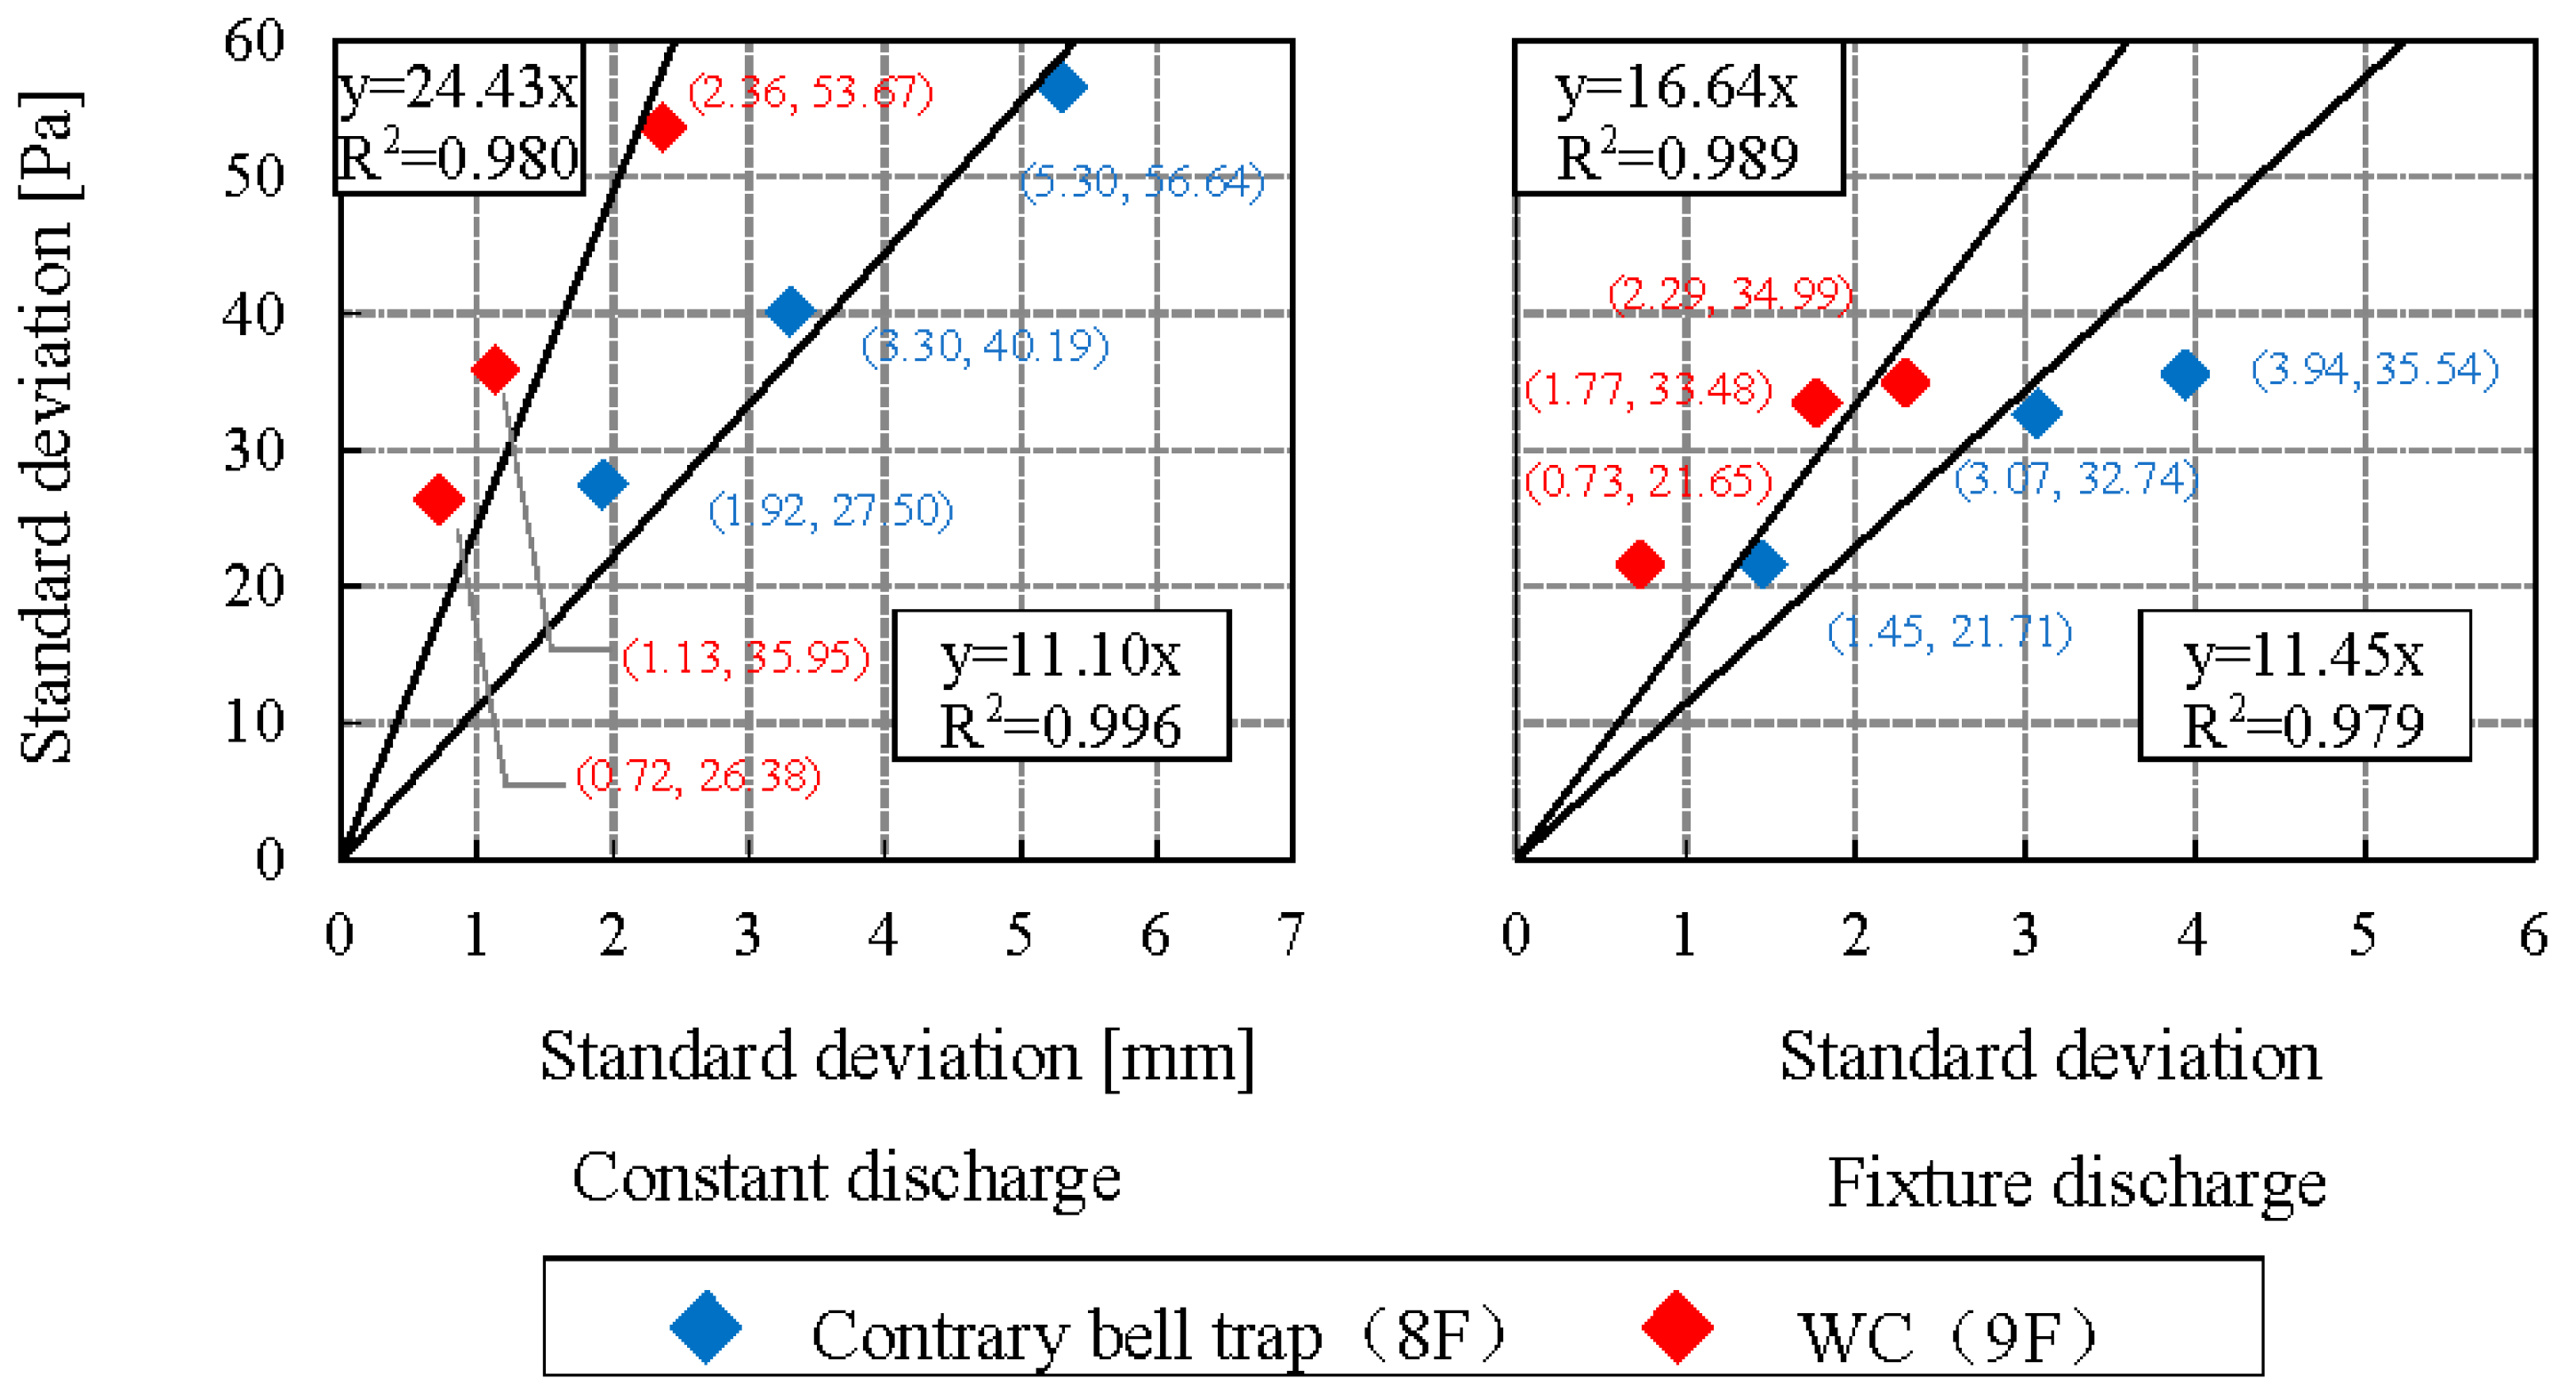
The scatter diagrams of the SDs of the pressure vibration in the pipes and the seal water fluctuation, in addition to their primary regression equations, are shown in
Figure 8. The regression coefficient
a and the ratio of regression coefficient of the constant discharge to the fixture discharge α are shown in
Table 3. From
Figure 8, it was found that there is a high correlation between the SD of the pressure vibration in the pipes and the SD of the seal water fluctuation, as the determination coefficient R
2 was 0.979–0.996, which is quite high for both constant discharge and fixture discharge. By comparing these regression coefficients, it is possible to quantitatively evaluate the influence of the fixture drainage load on seal water relative to the constant discharge load.The ratio of regression coefficient α was 0.97 for the contrary bell trap on the 8th floor and 1.47 for the WC on the 9th floor (
Table 4).
4. Effects of Load Type on Pressure in Pipe and Seal Loss
4.1. Purpose
We conducted experiments in a real-scale drainage tower and analyzed the pressure in pipes and the seal loss to clarify the relationship between discharge type and seal loss on each floor according to the number of WCs installed, and to quantitatively compare the pressure in pipes and the seal loss between fixture discharge load and constant discharge load.
4.2. Method
Seal losses in each type of discharge and load were compared. The correlation of the seal loss of a trap with minimum pressure on the floors where traps were placed was also examined.
4.3. Results
4.3.1. Constant Discharge Load
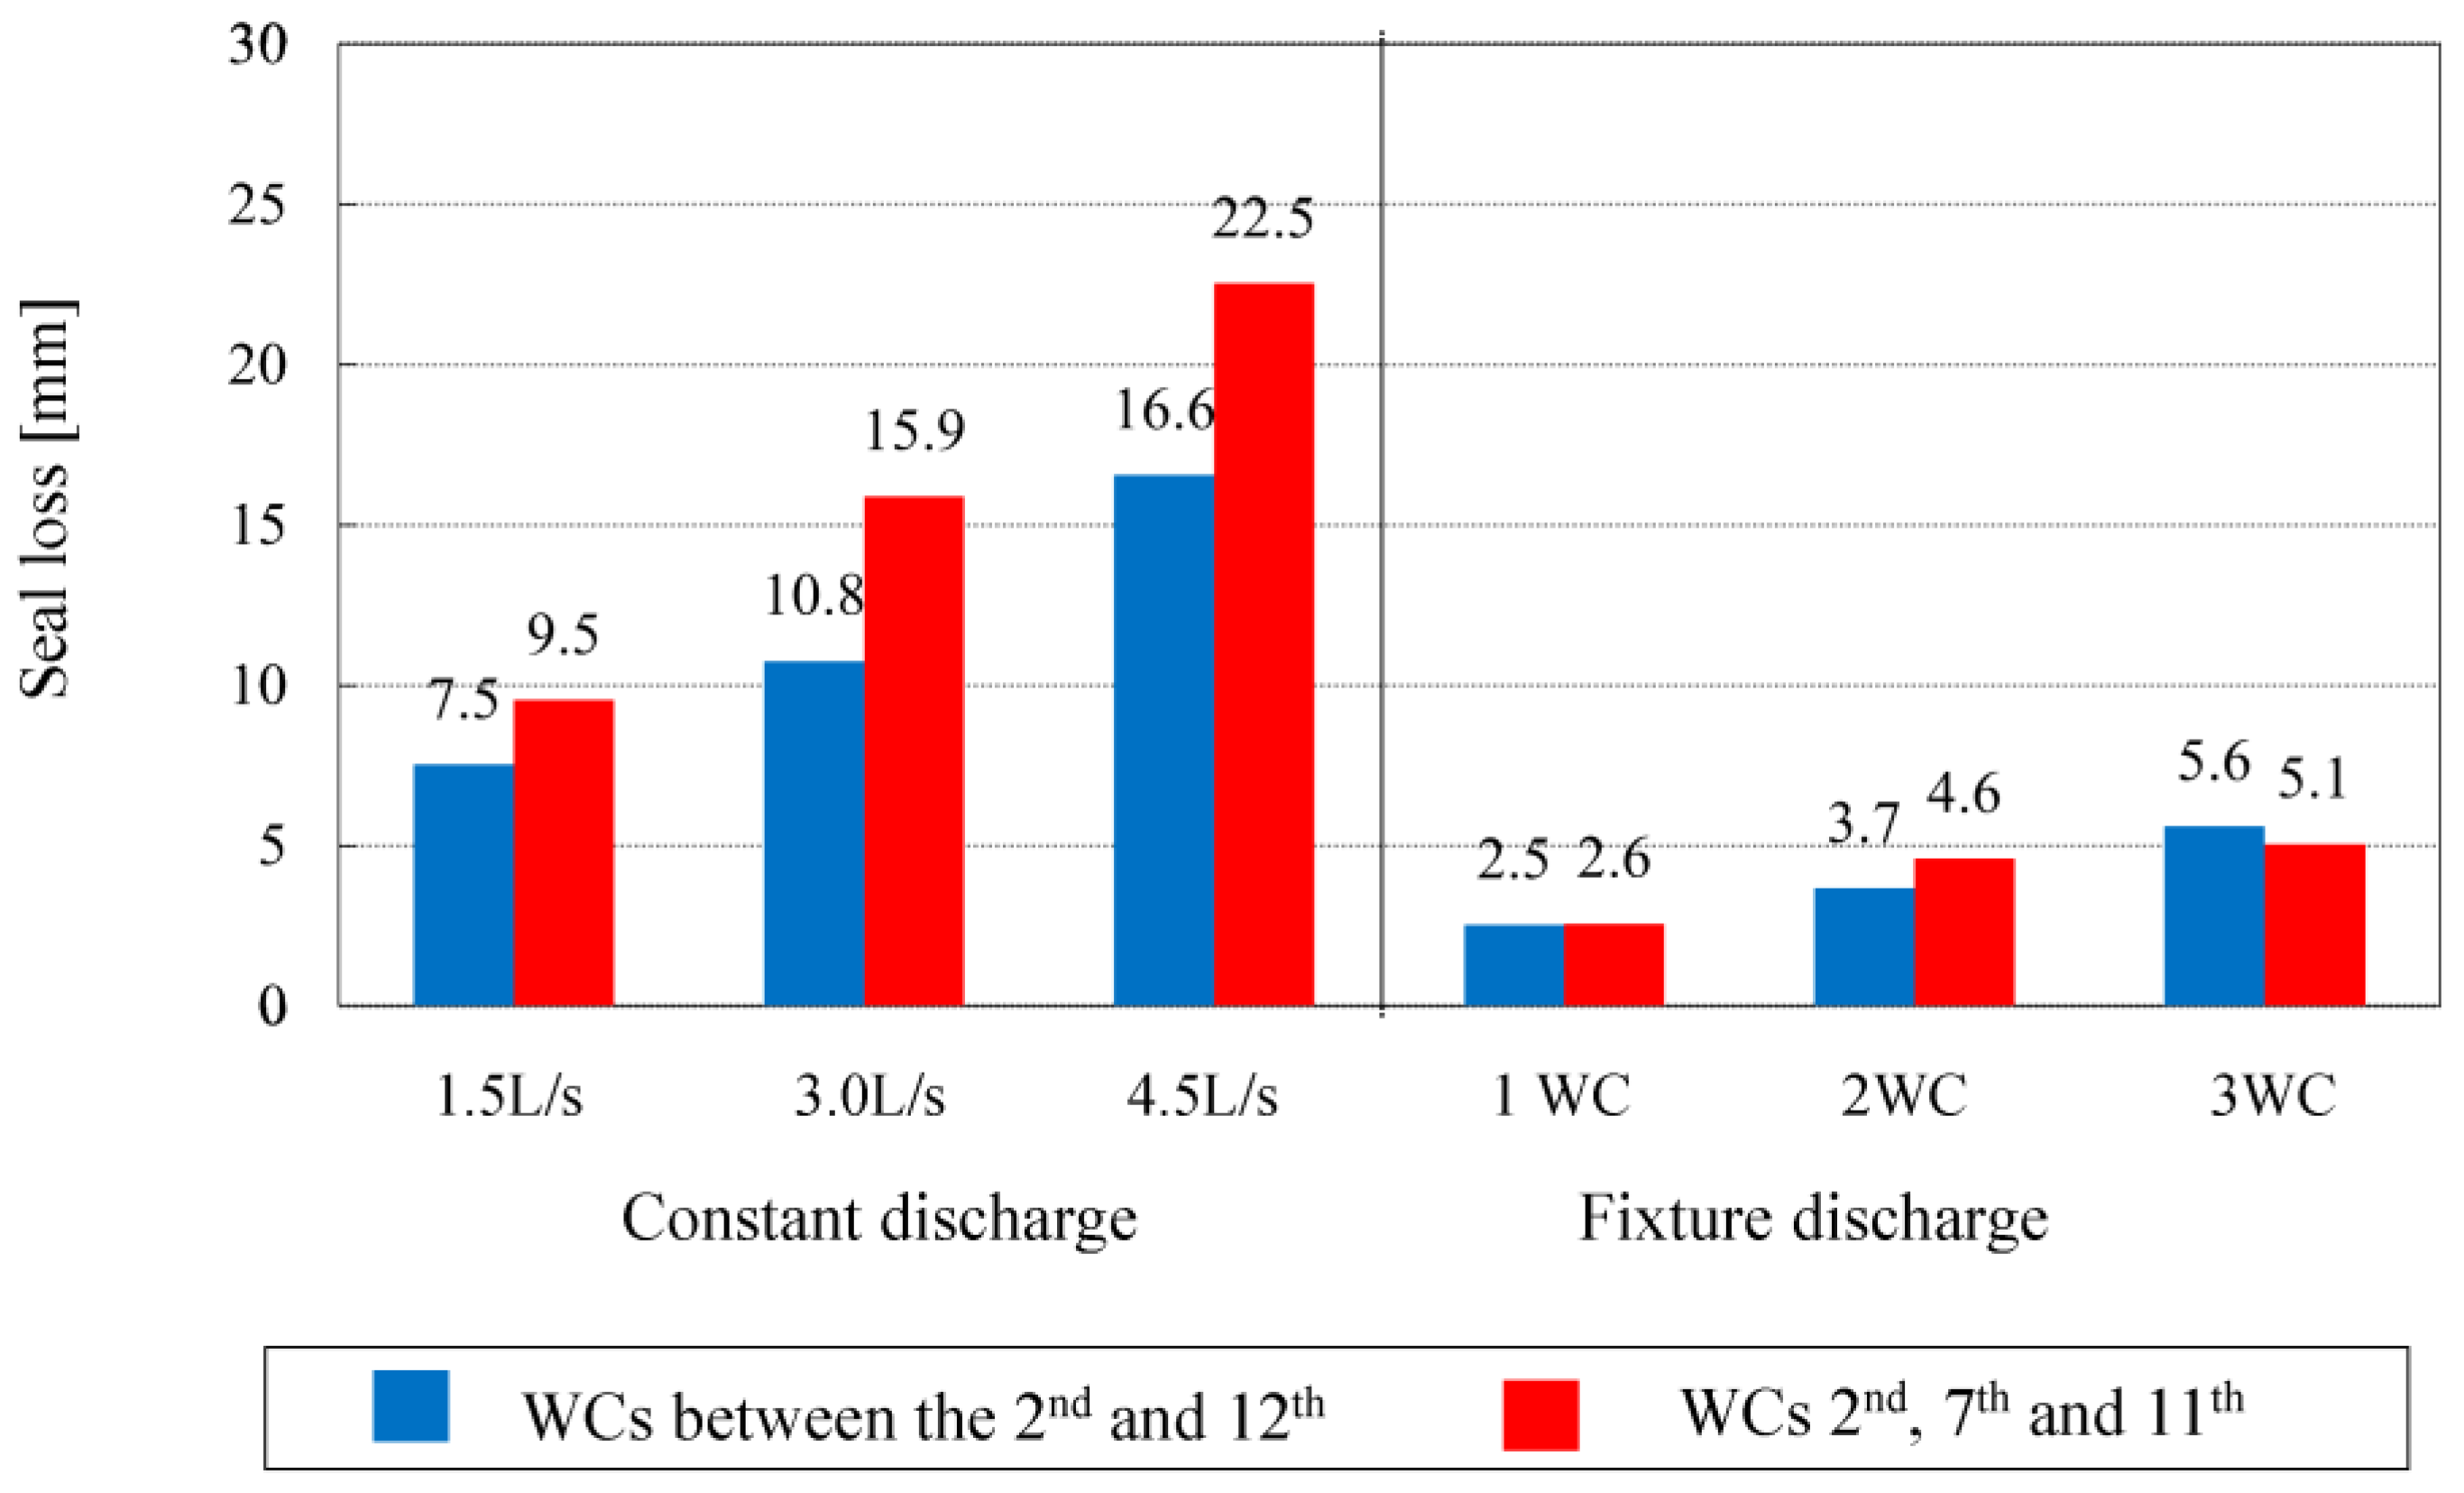
The relationship of the seal loss on each floor in each type of discharge is shown in
Figure 9. In a constant discharge of 4.0 L/s, the seal loss was largest on the 2nd floor and smallest on the 11th floor. This may be explained by the fact that positive pressures dominated on the 2nd floor and, as seen in
Figure 3, that seal loss from locally-produced positive pressures of 300 Pa overrode seal loss produced by negative pressures. In a constant discharge of 6.0 L/s, seal losses tended to be roughly equal on the 2nd, 7th, and 11th floors. This seems to have been caused by the comparable negative pressure produced on these floors when the discharge flow rate was 6.0 L/s.
4.3.2. Comparison of Constant Discharge Load and Fixture Discharge Load
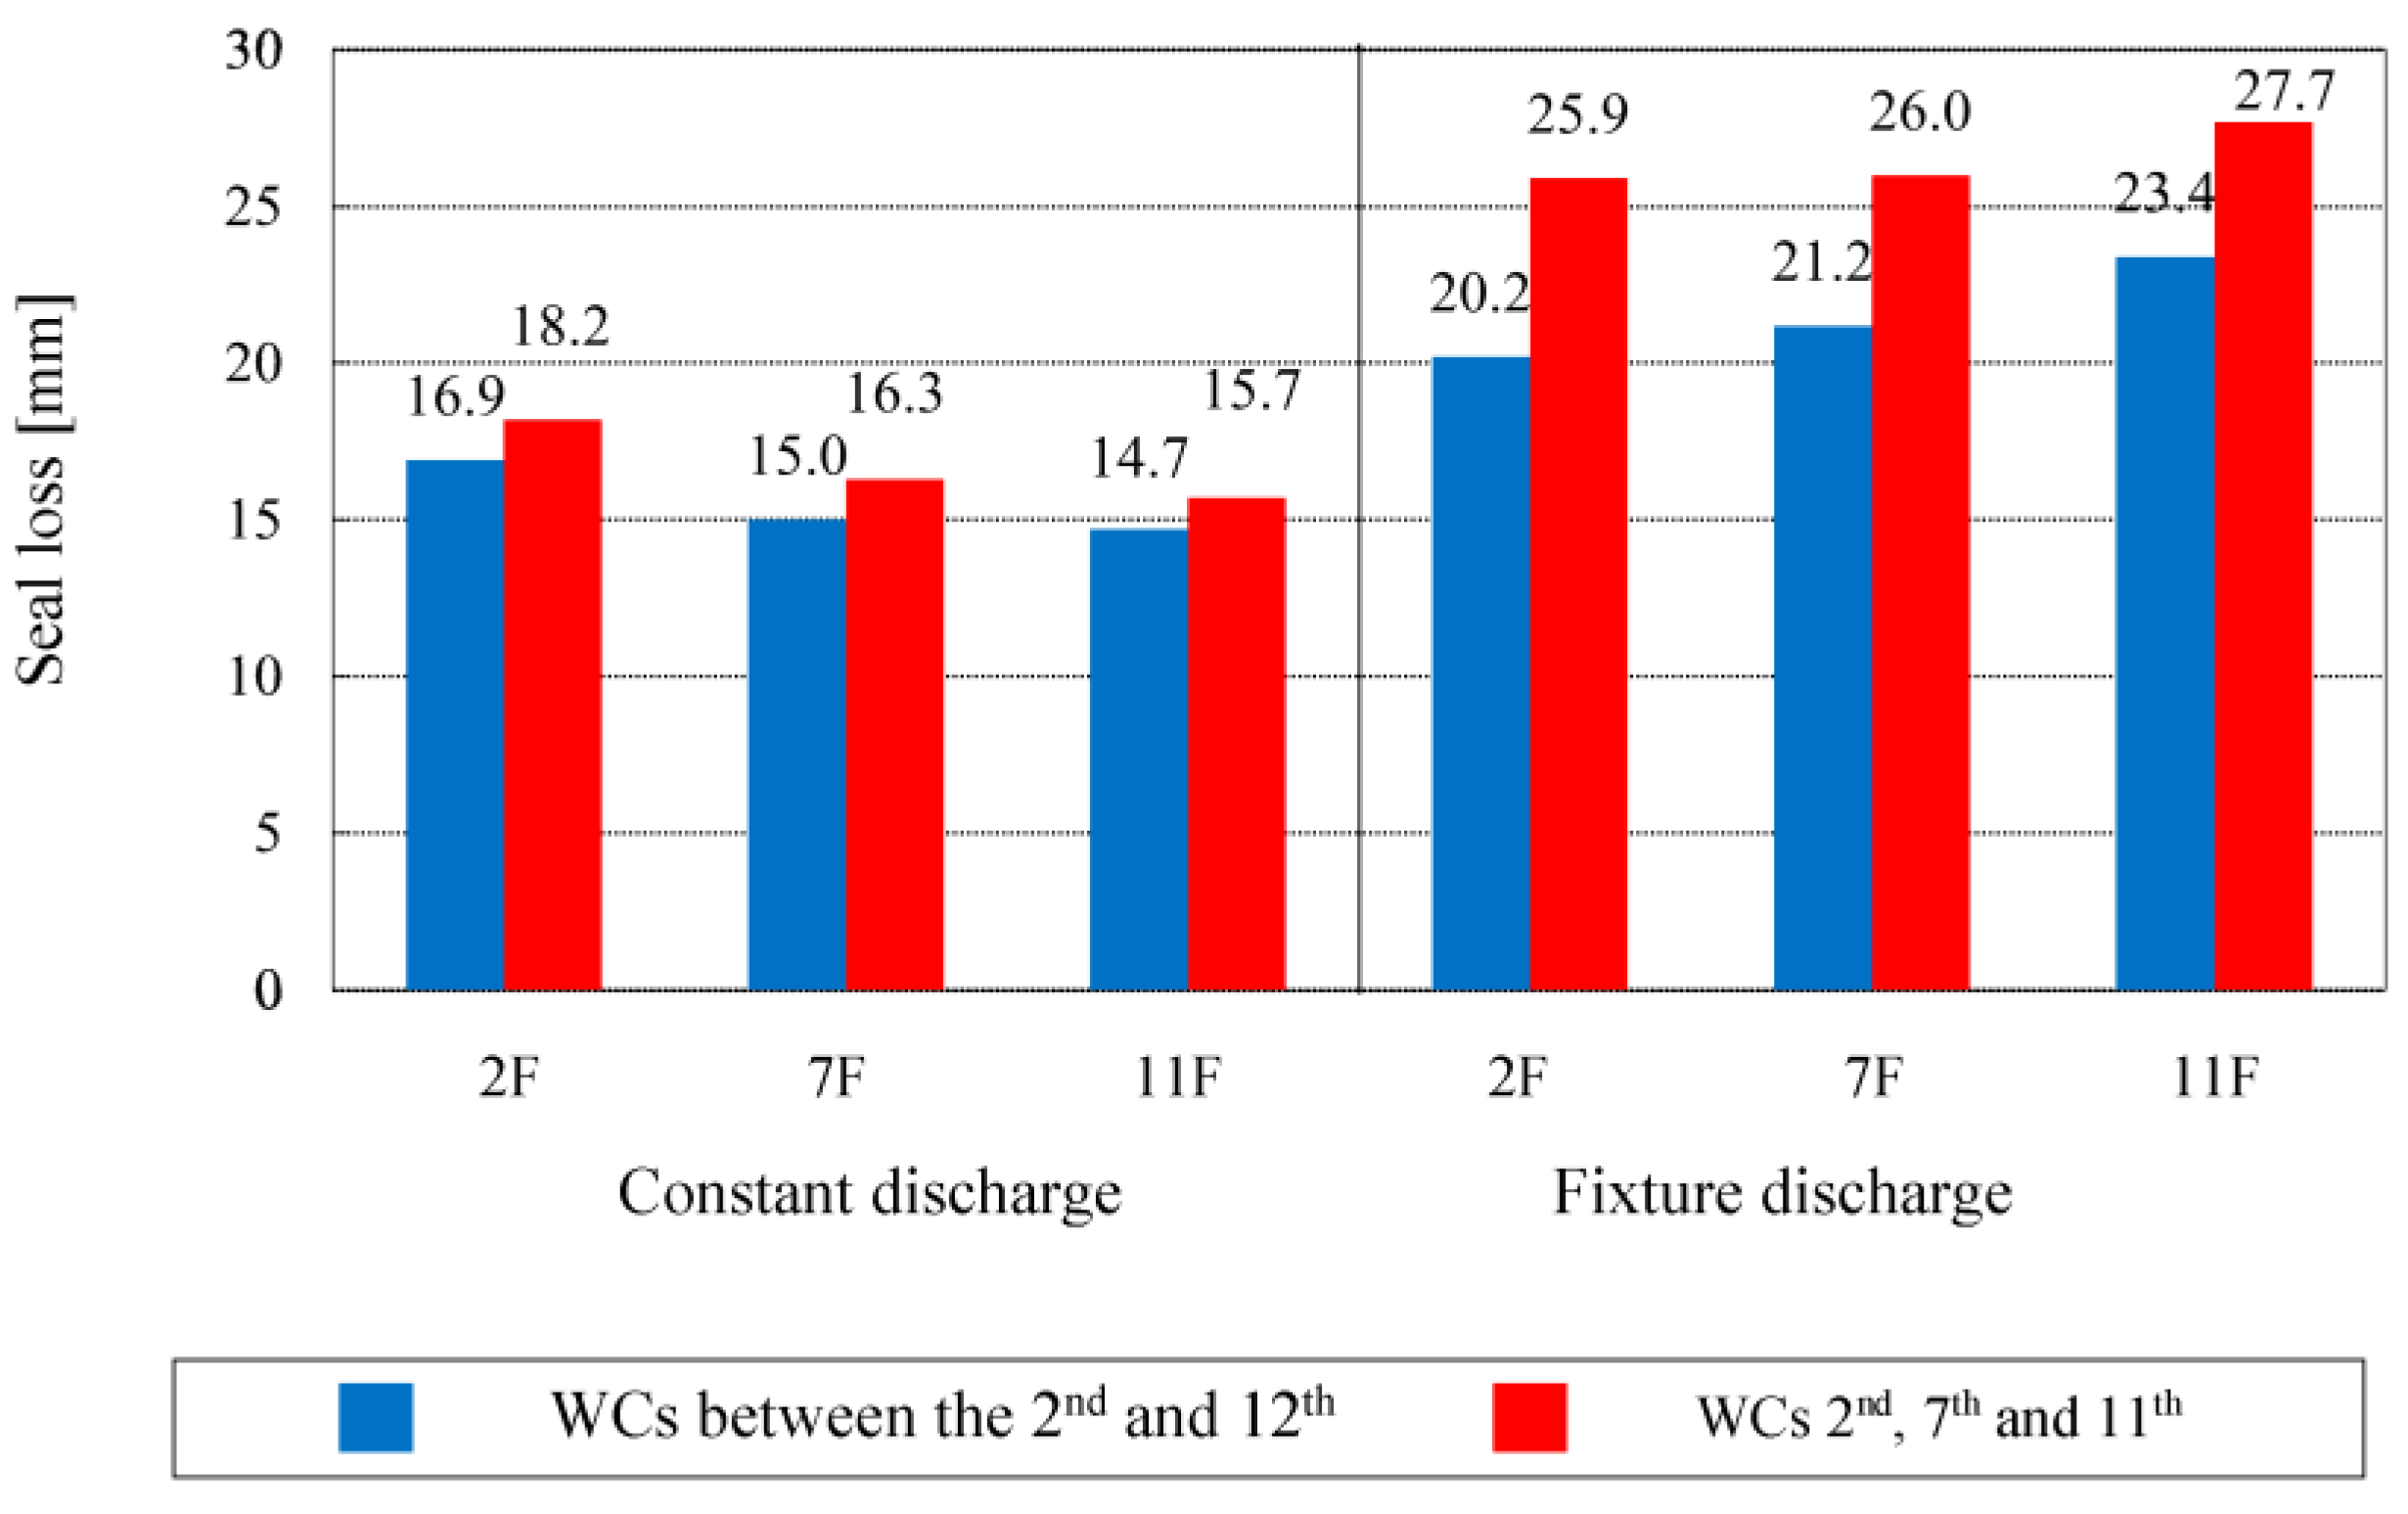
Seal loss on each floor for each discharge type is shown
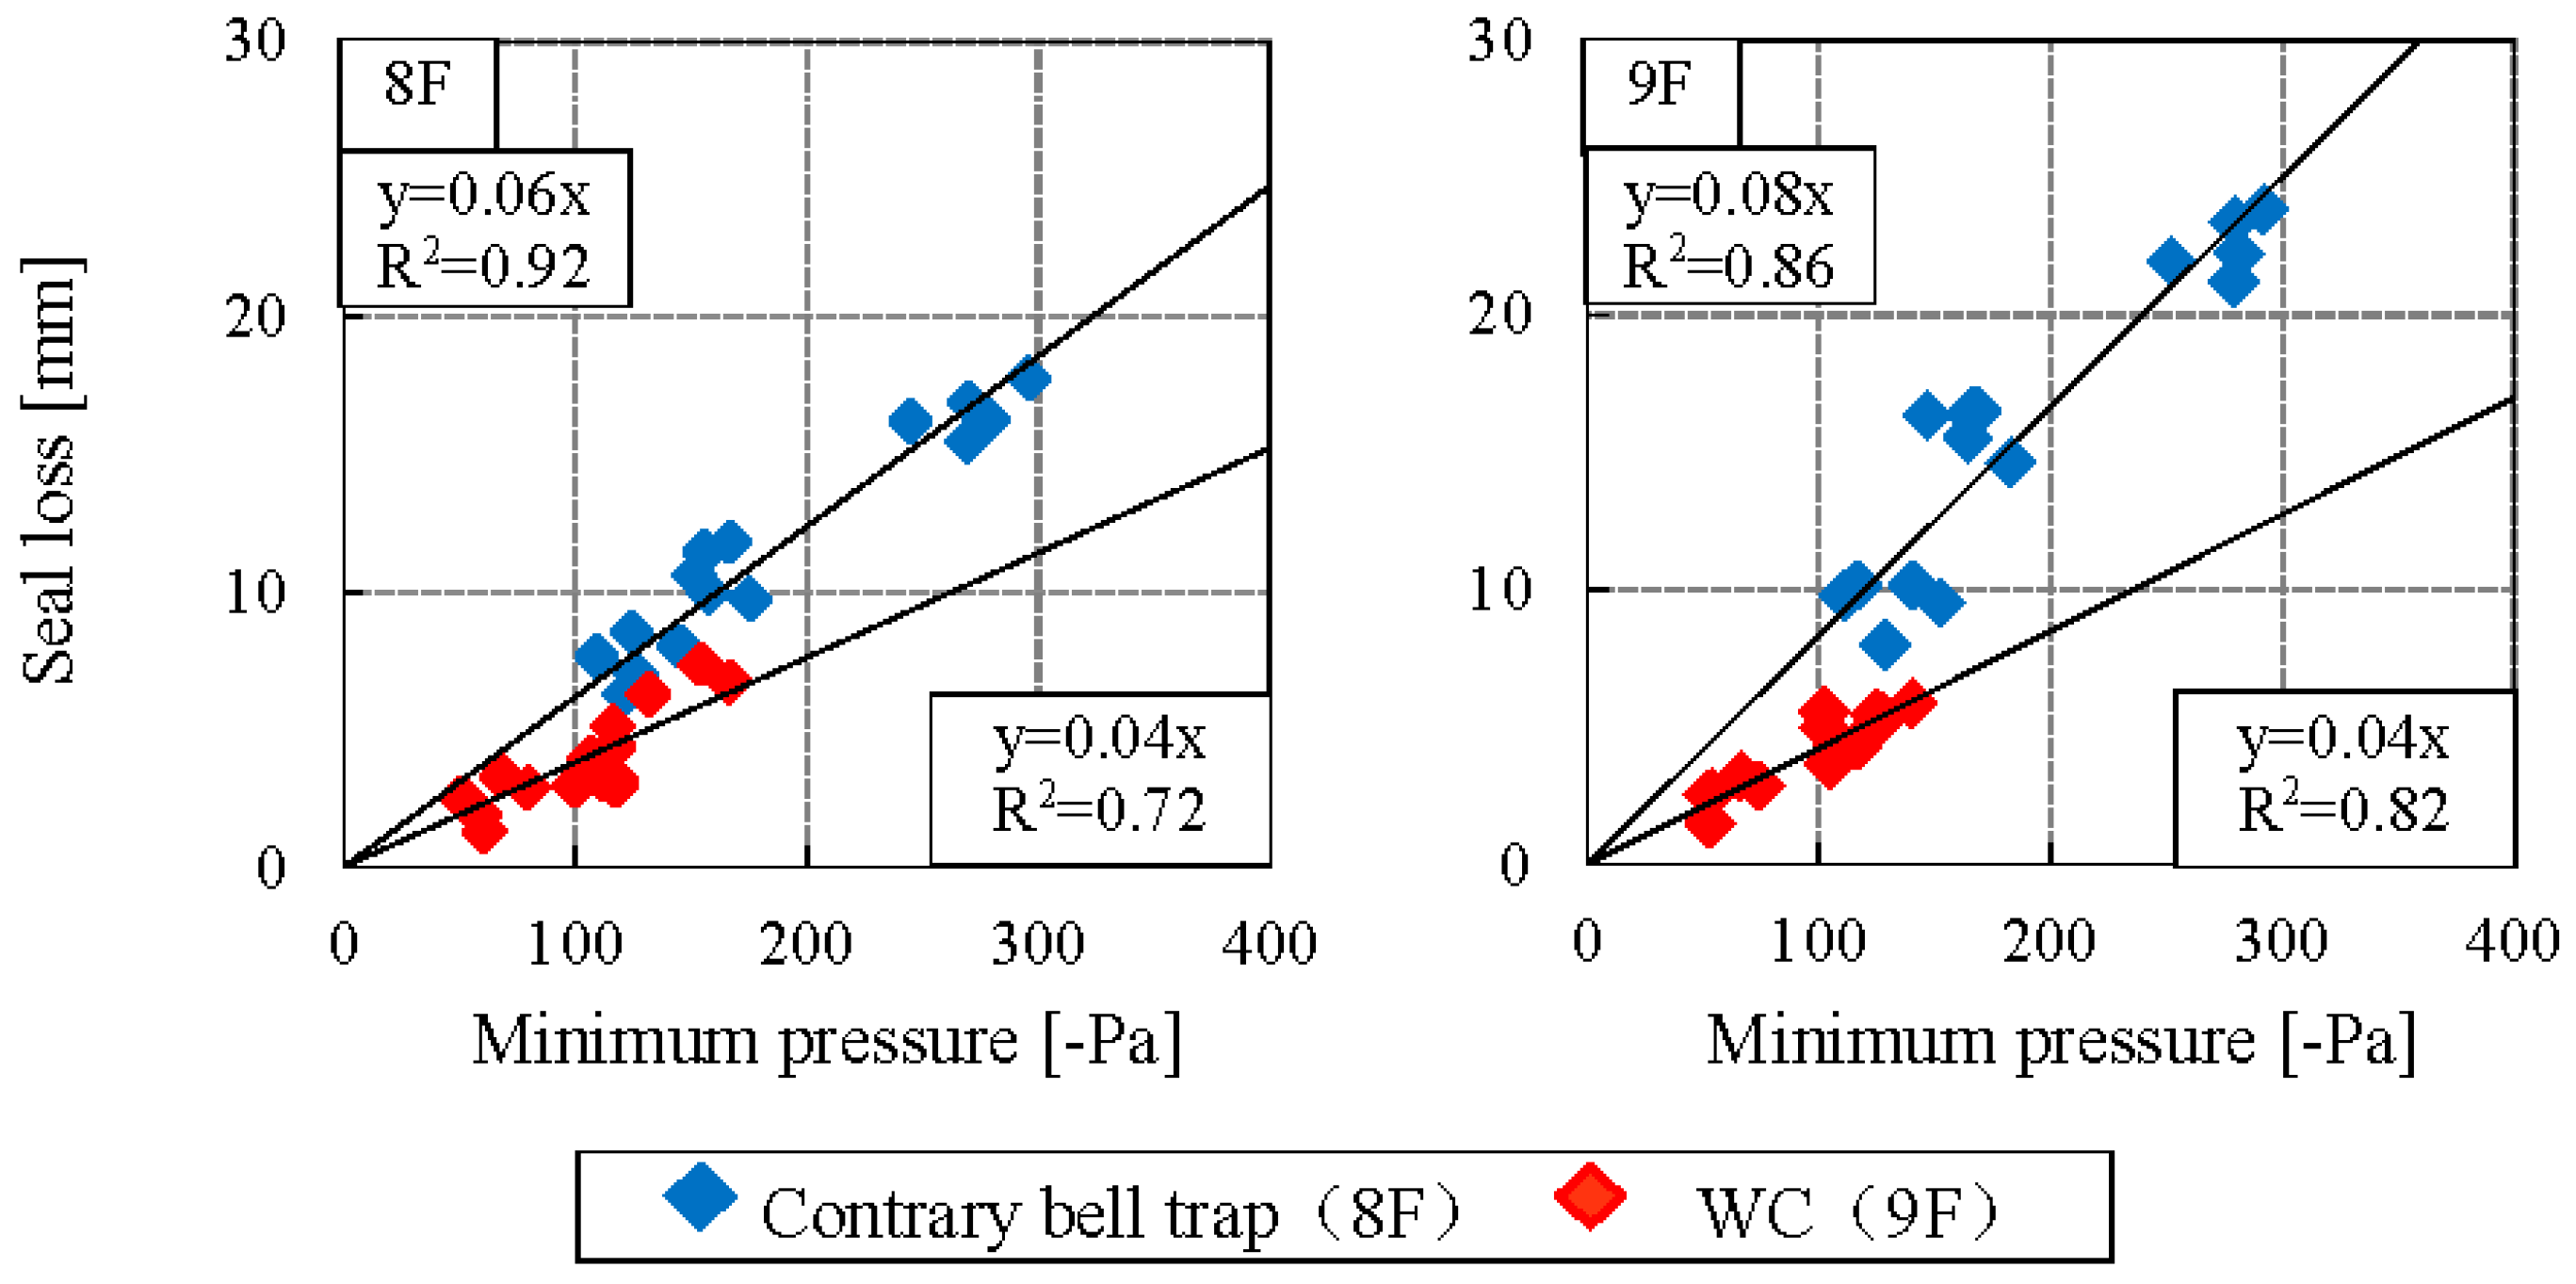
Figure 10. For both the contrary bell trap and WC, seal loss in constant discharge was larger than that in fixture discharge. The scatter diagram and primary regression equation for the minimum pressure in the pipe and the seal loss in each load type are shown in
Figure 11. The regression coefficient
a and the ratio of regression coefficient of the constant discharge to the fixture discharge α are shown in
Table 5.
Figure 11 shows the determination coefficient.
R
2 was high (0.72–0.92), indicating a high correlation between the minimum pressure in the pipe and the seal loss. In
Table 5, the ratios of regression coefficient for the contrary bell trap (8th floor) and WC (9th floor) were 1.63 and 1.98, respectively. From this, it can be expected that the seal loss in a contrary bell trap would be about 1.6 times, and that in a WC is about twice as large in constant discharge as in fixture discharge, given a similar level of negative pressure. Also, there seems to be a significant difference in the ratio of regression coefficient α among the test traps.
5. Conclusions
In this study, the pressure vibration in pipes and the seal water fluctuation data collected in real-scale drainage tower experiments were analyzed. The results can be summarized as follows:
- (1)
The greater the number of WCs installed, the less likely the occurrence of seal loss. The factor here seems to be the water seal of traps that are connected.
- (2)
The range of seal water fluctuation wave patterns tended to be larger on the lower floors than on the higher floors.
- (3)
Seal loss in a contrary bell trap is approximately 1.5–2 times larger in constant discharge than in fixture discharge. However, no significant differences in seal loss due to load type were observed in a WC.
In this research, in order to improve the evaluation method of the drainage system stipulated in Japan more properly, various experiments are carried out and the existing knowledge is expanded upon.
The problem of reducing seal loss and seal water fluctuation SDs with increasing water seal is yet to be resolved in the future. We also need to give consideration to the method of evaluating the effects of seal loss on pressure vibration in pipes.


