
Thermal and Physical Investigations into Lake Deepening Processes on Spillway Lake, Ngozumpa Glacier, Nepal

Abstract
:1. Introduction
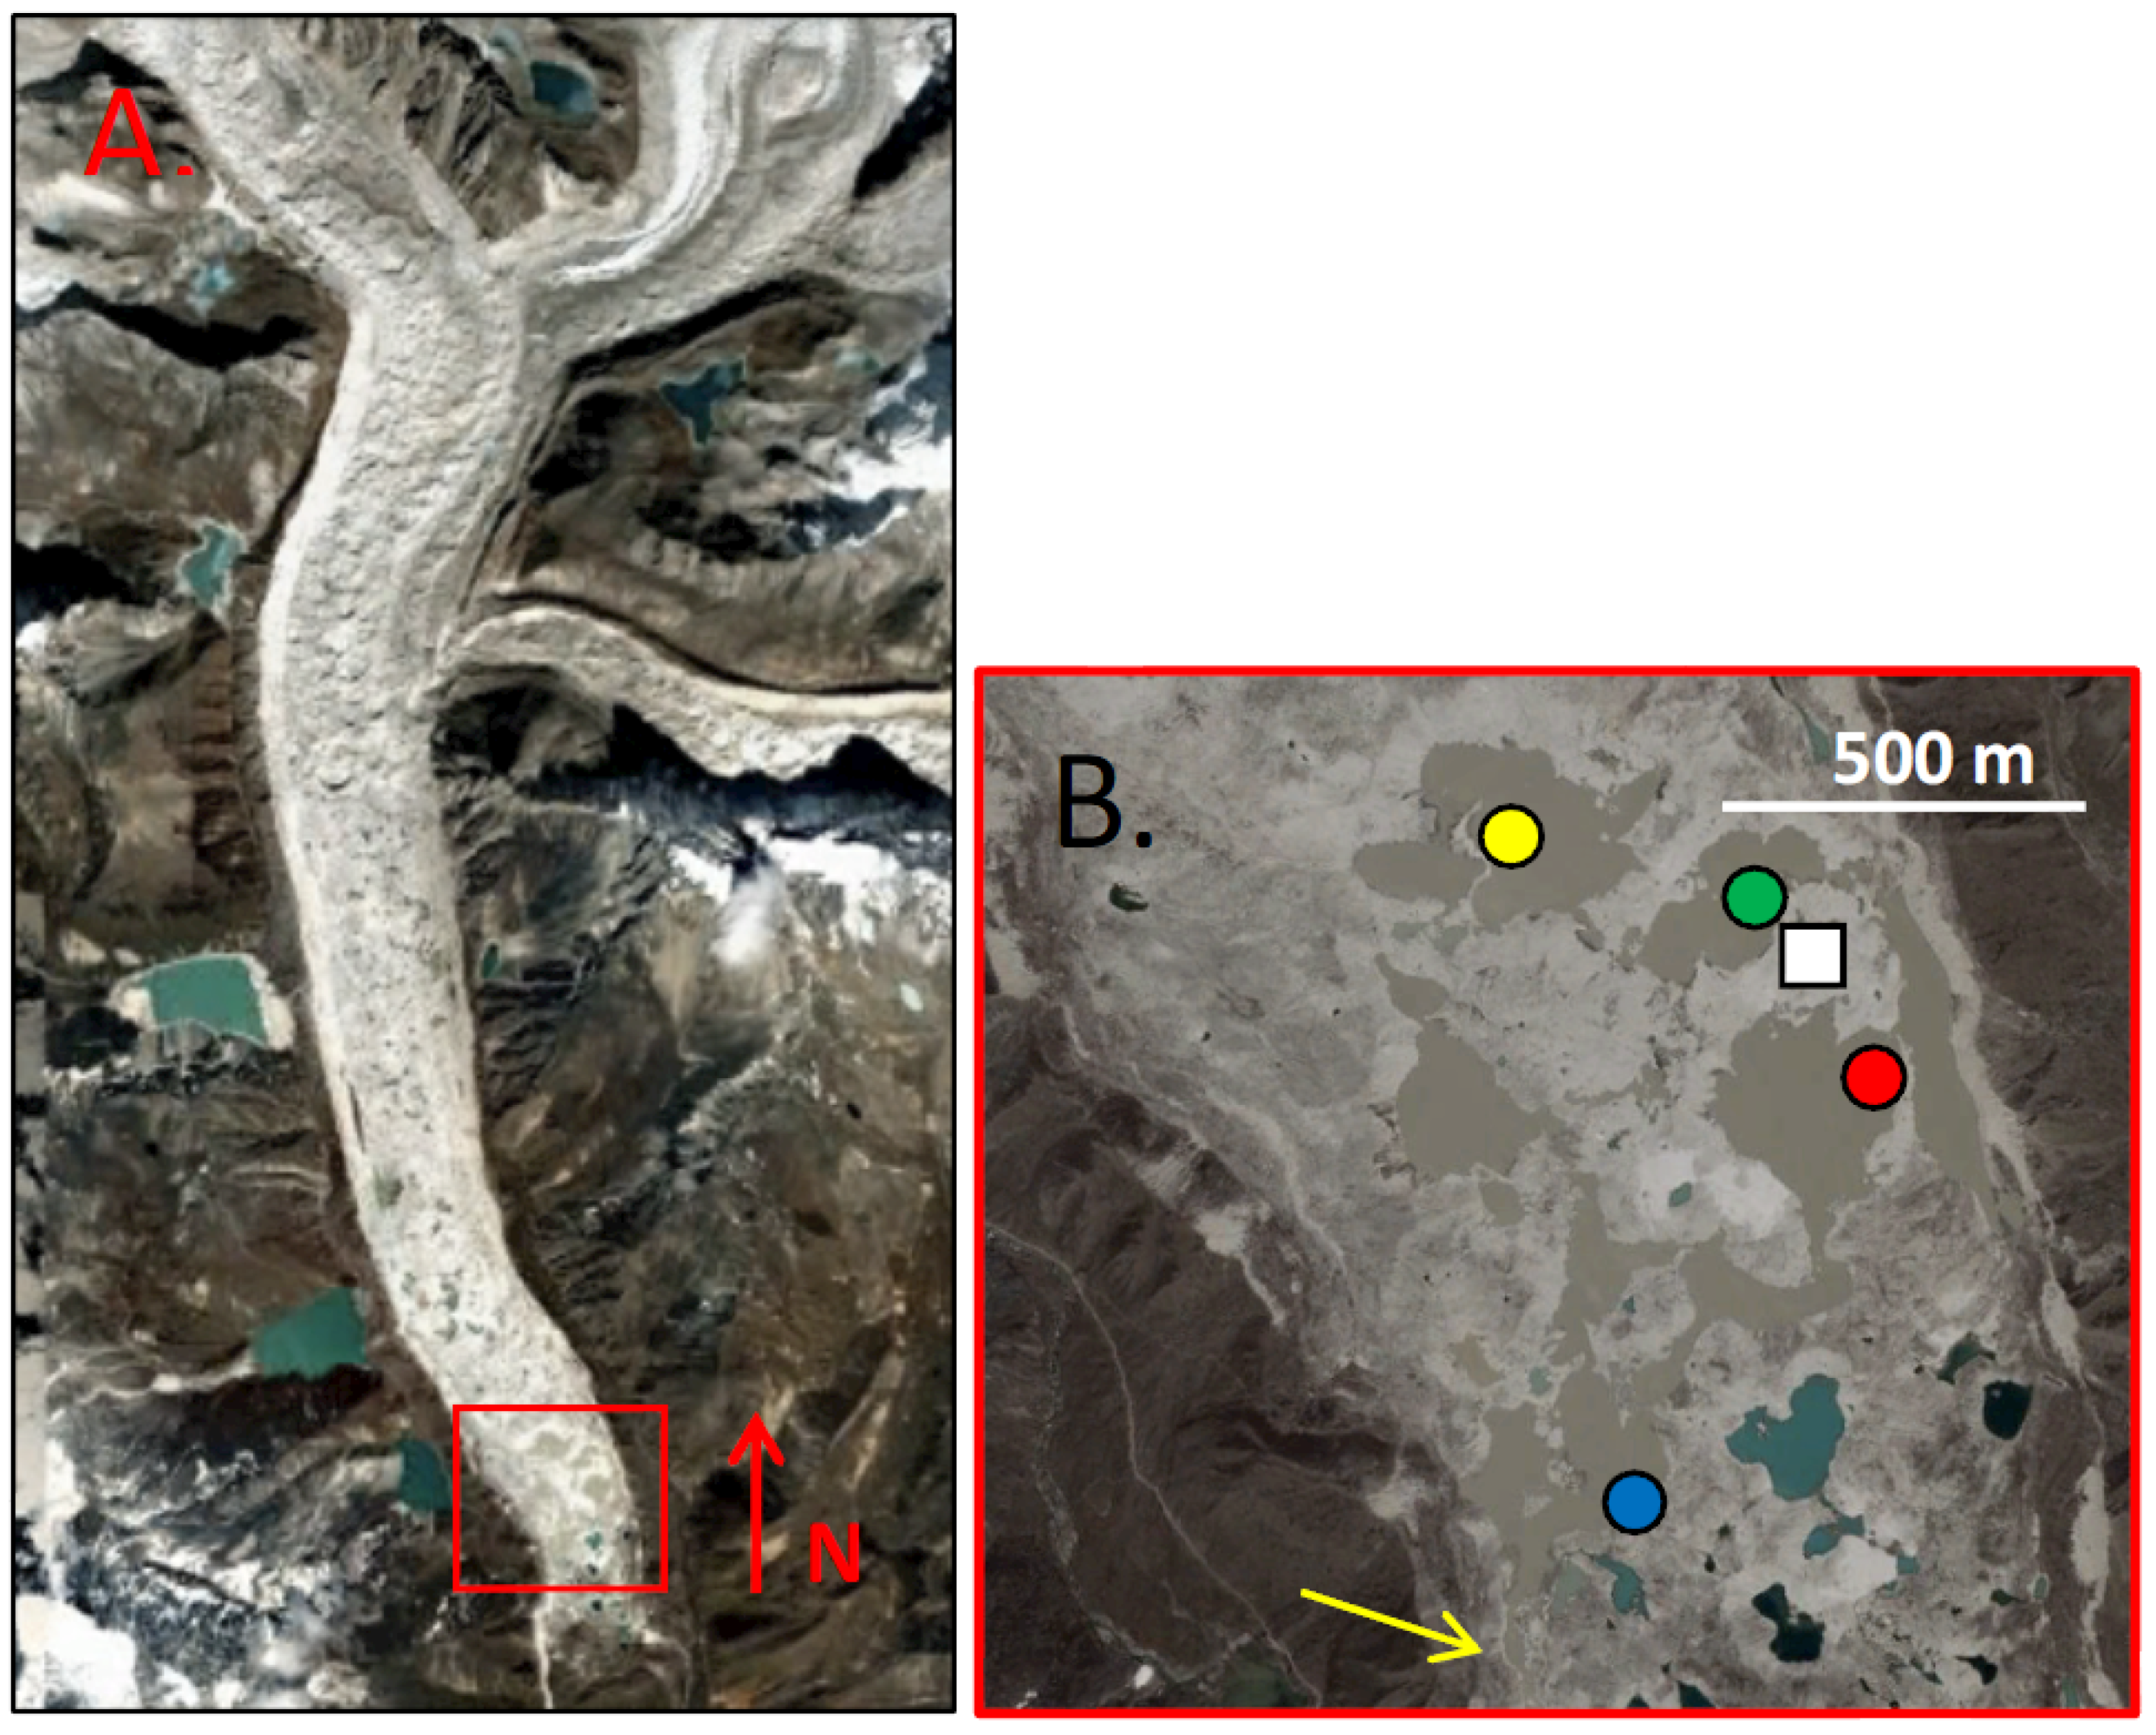
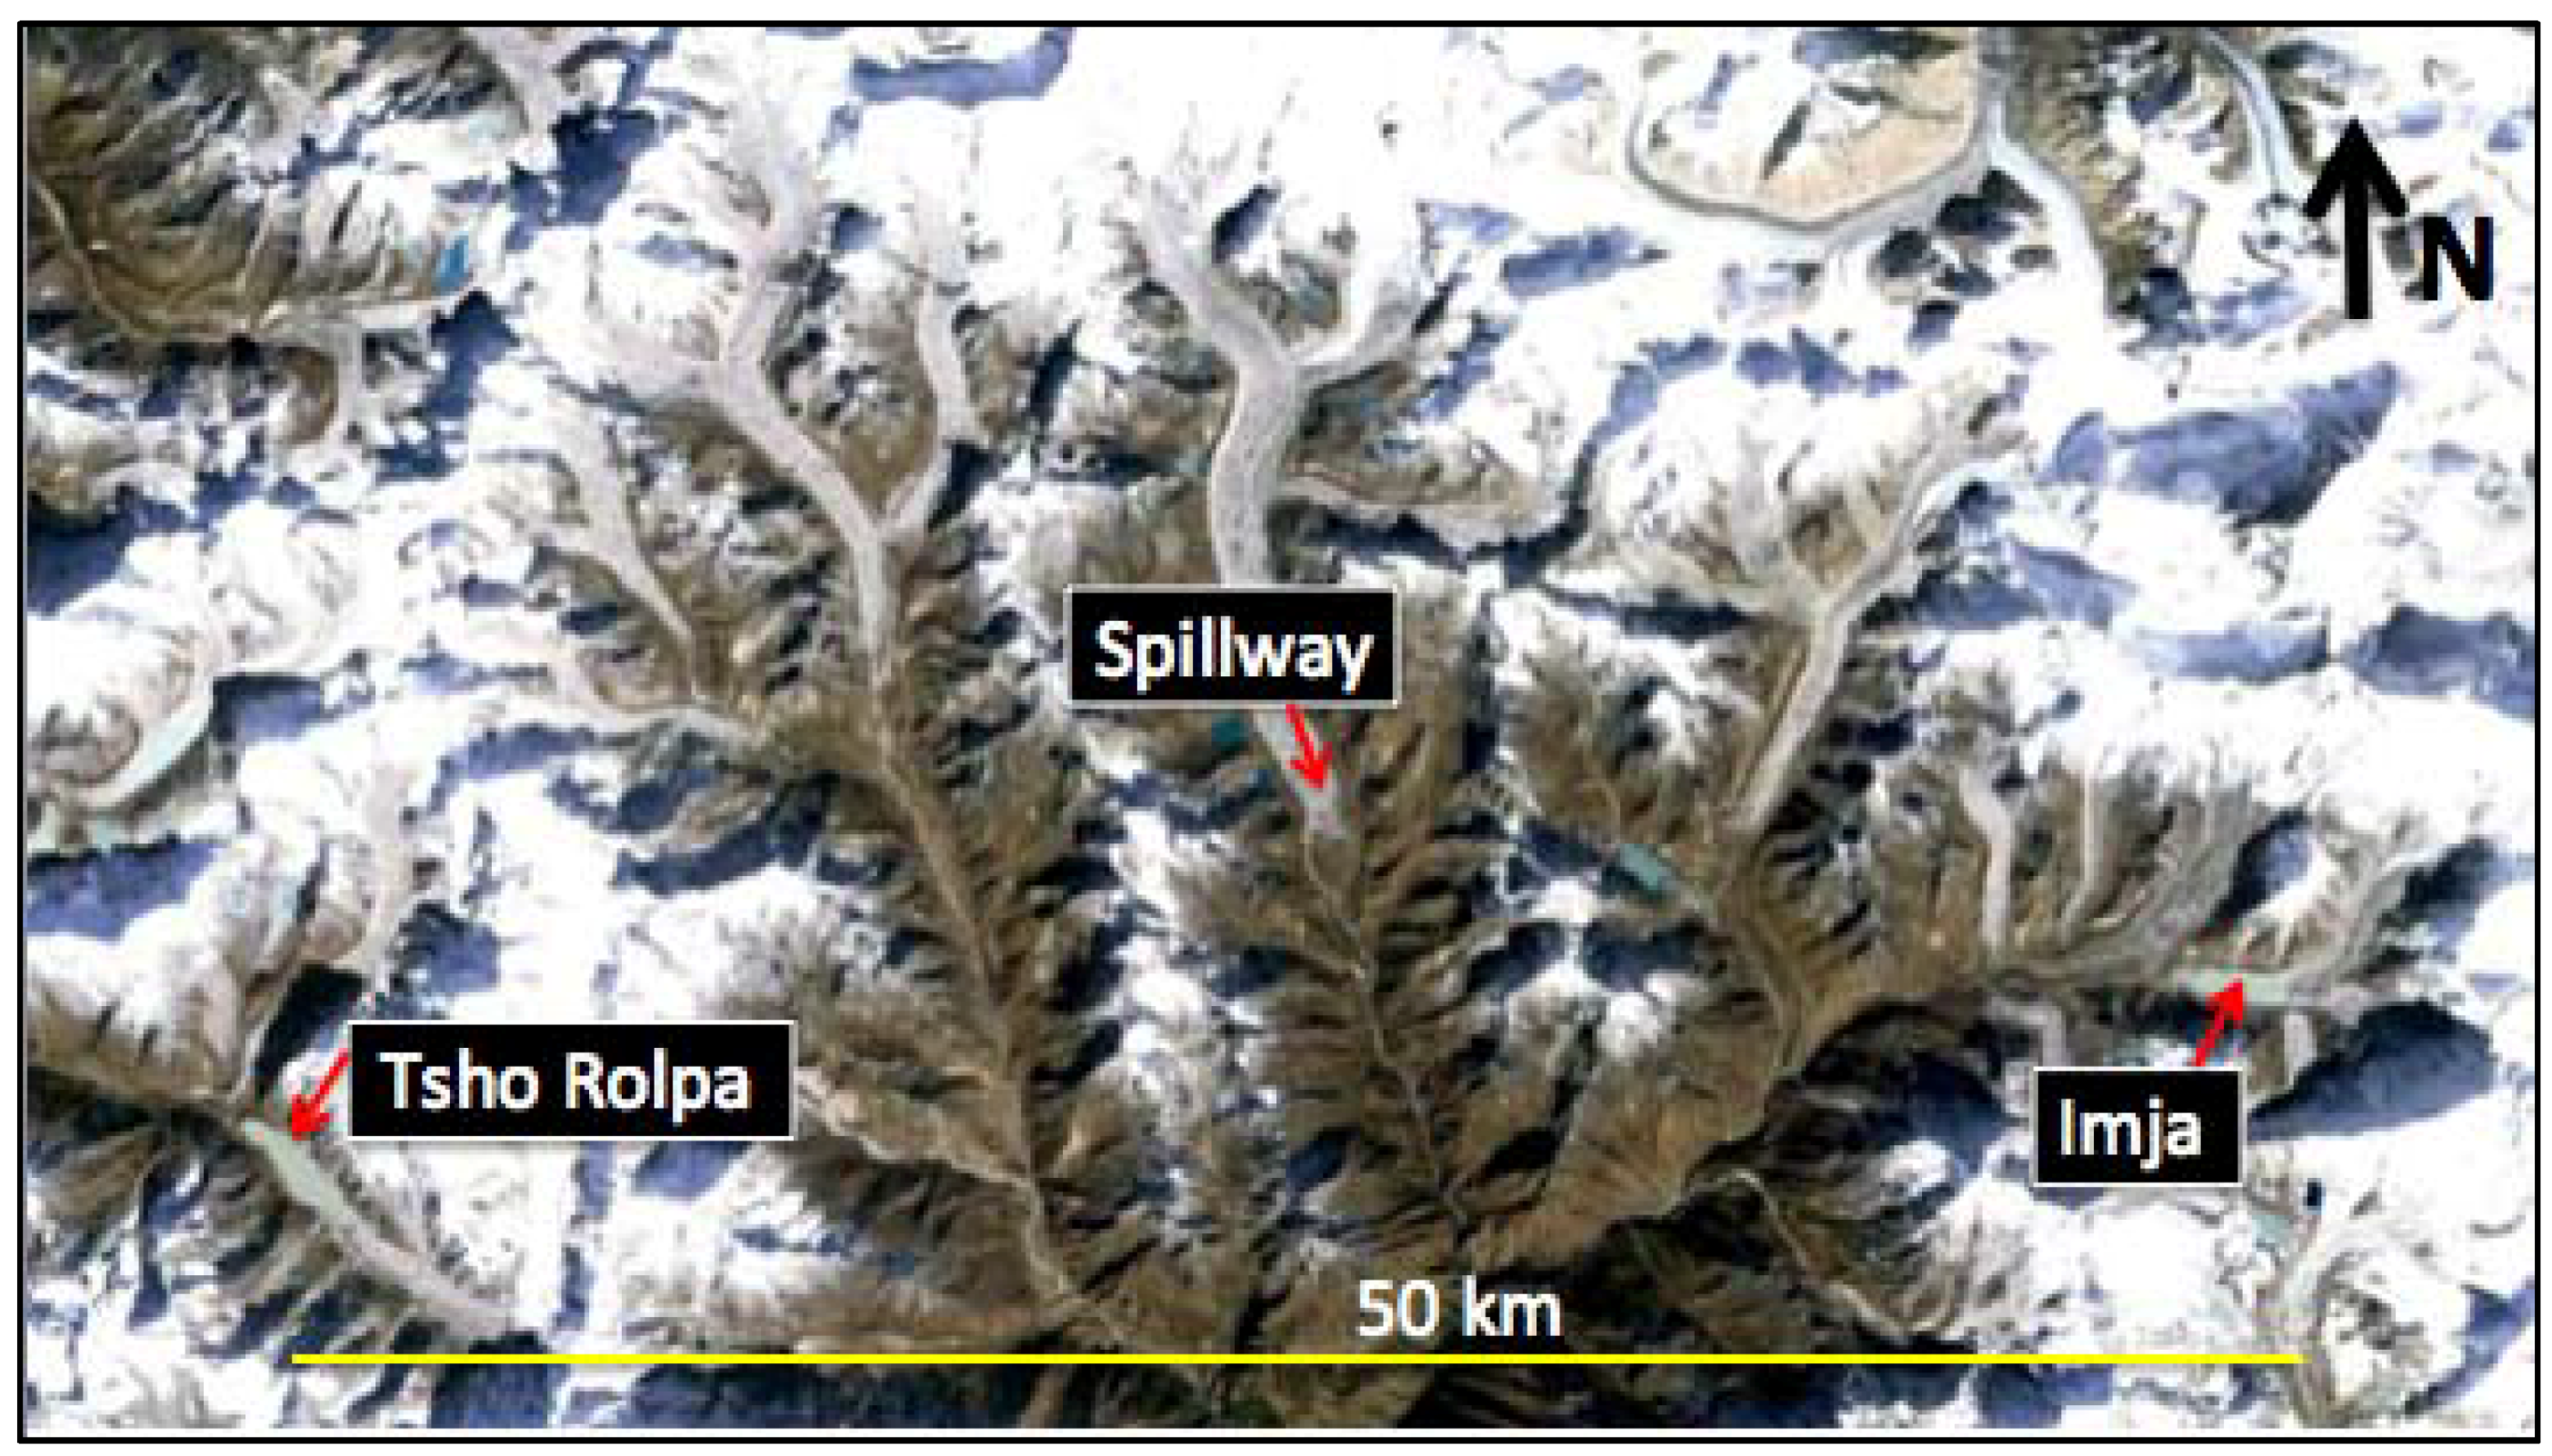
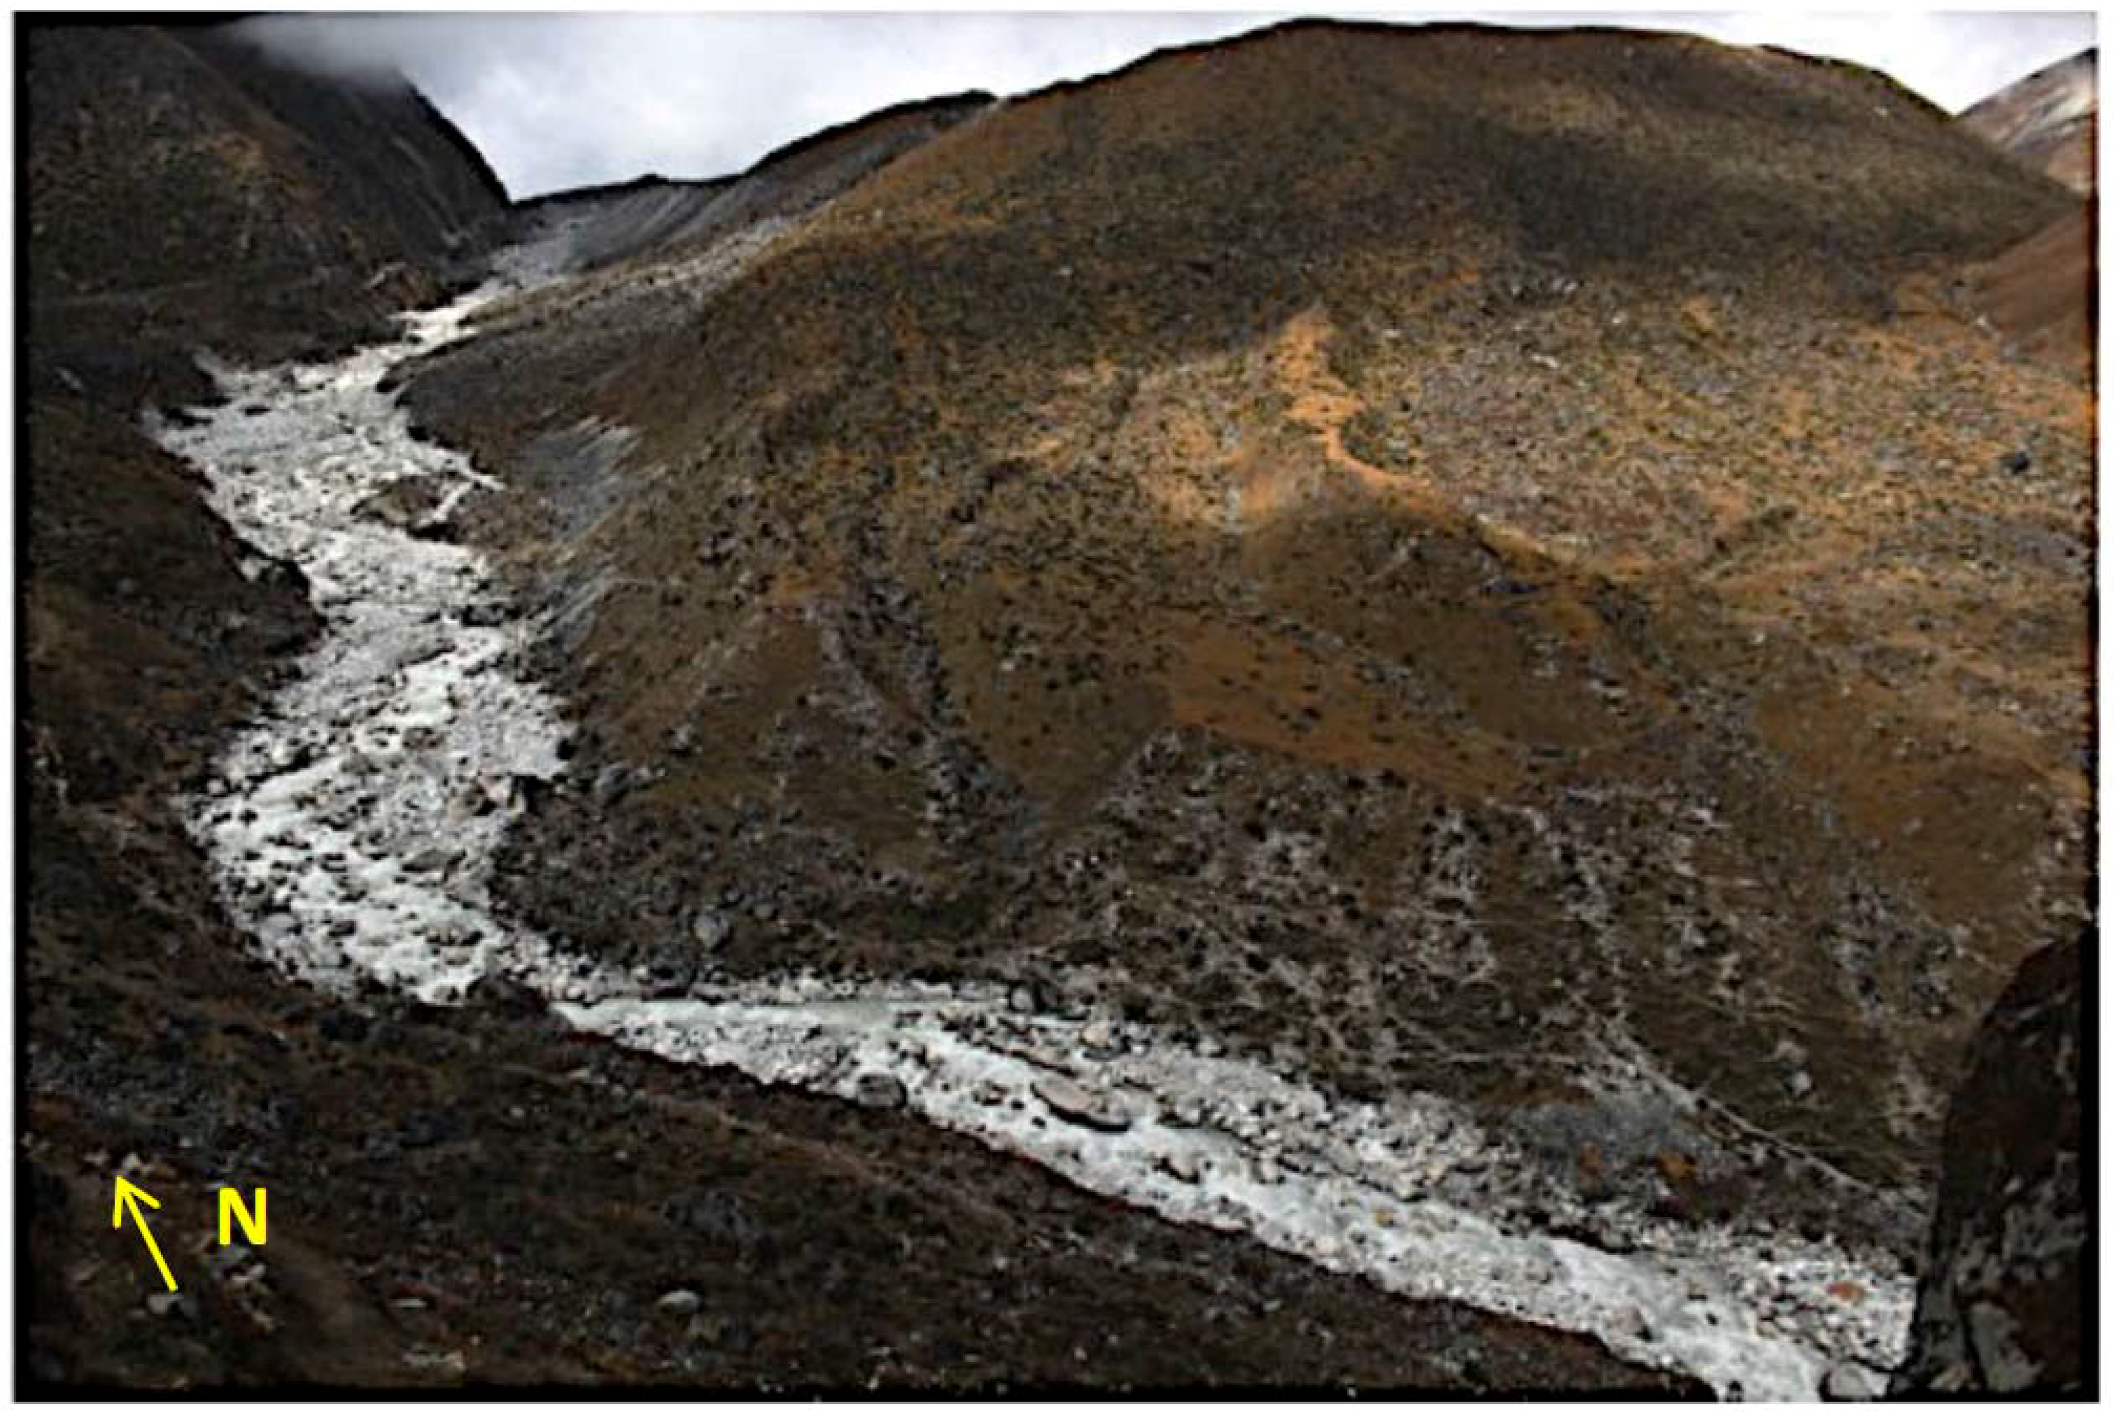
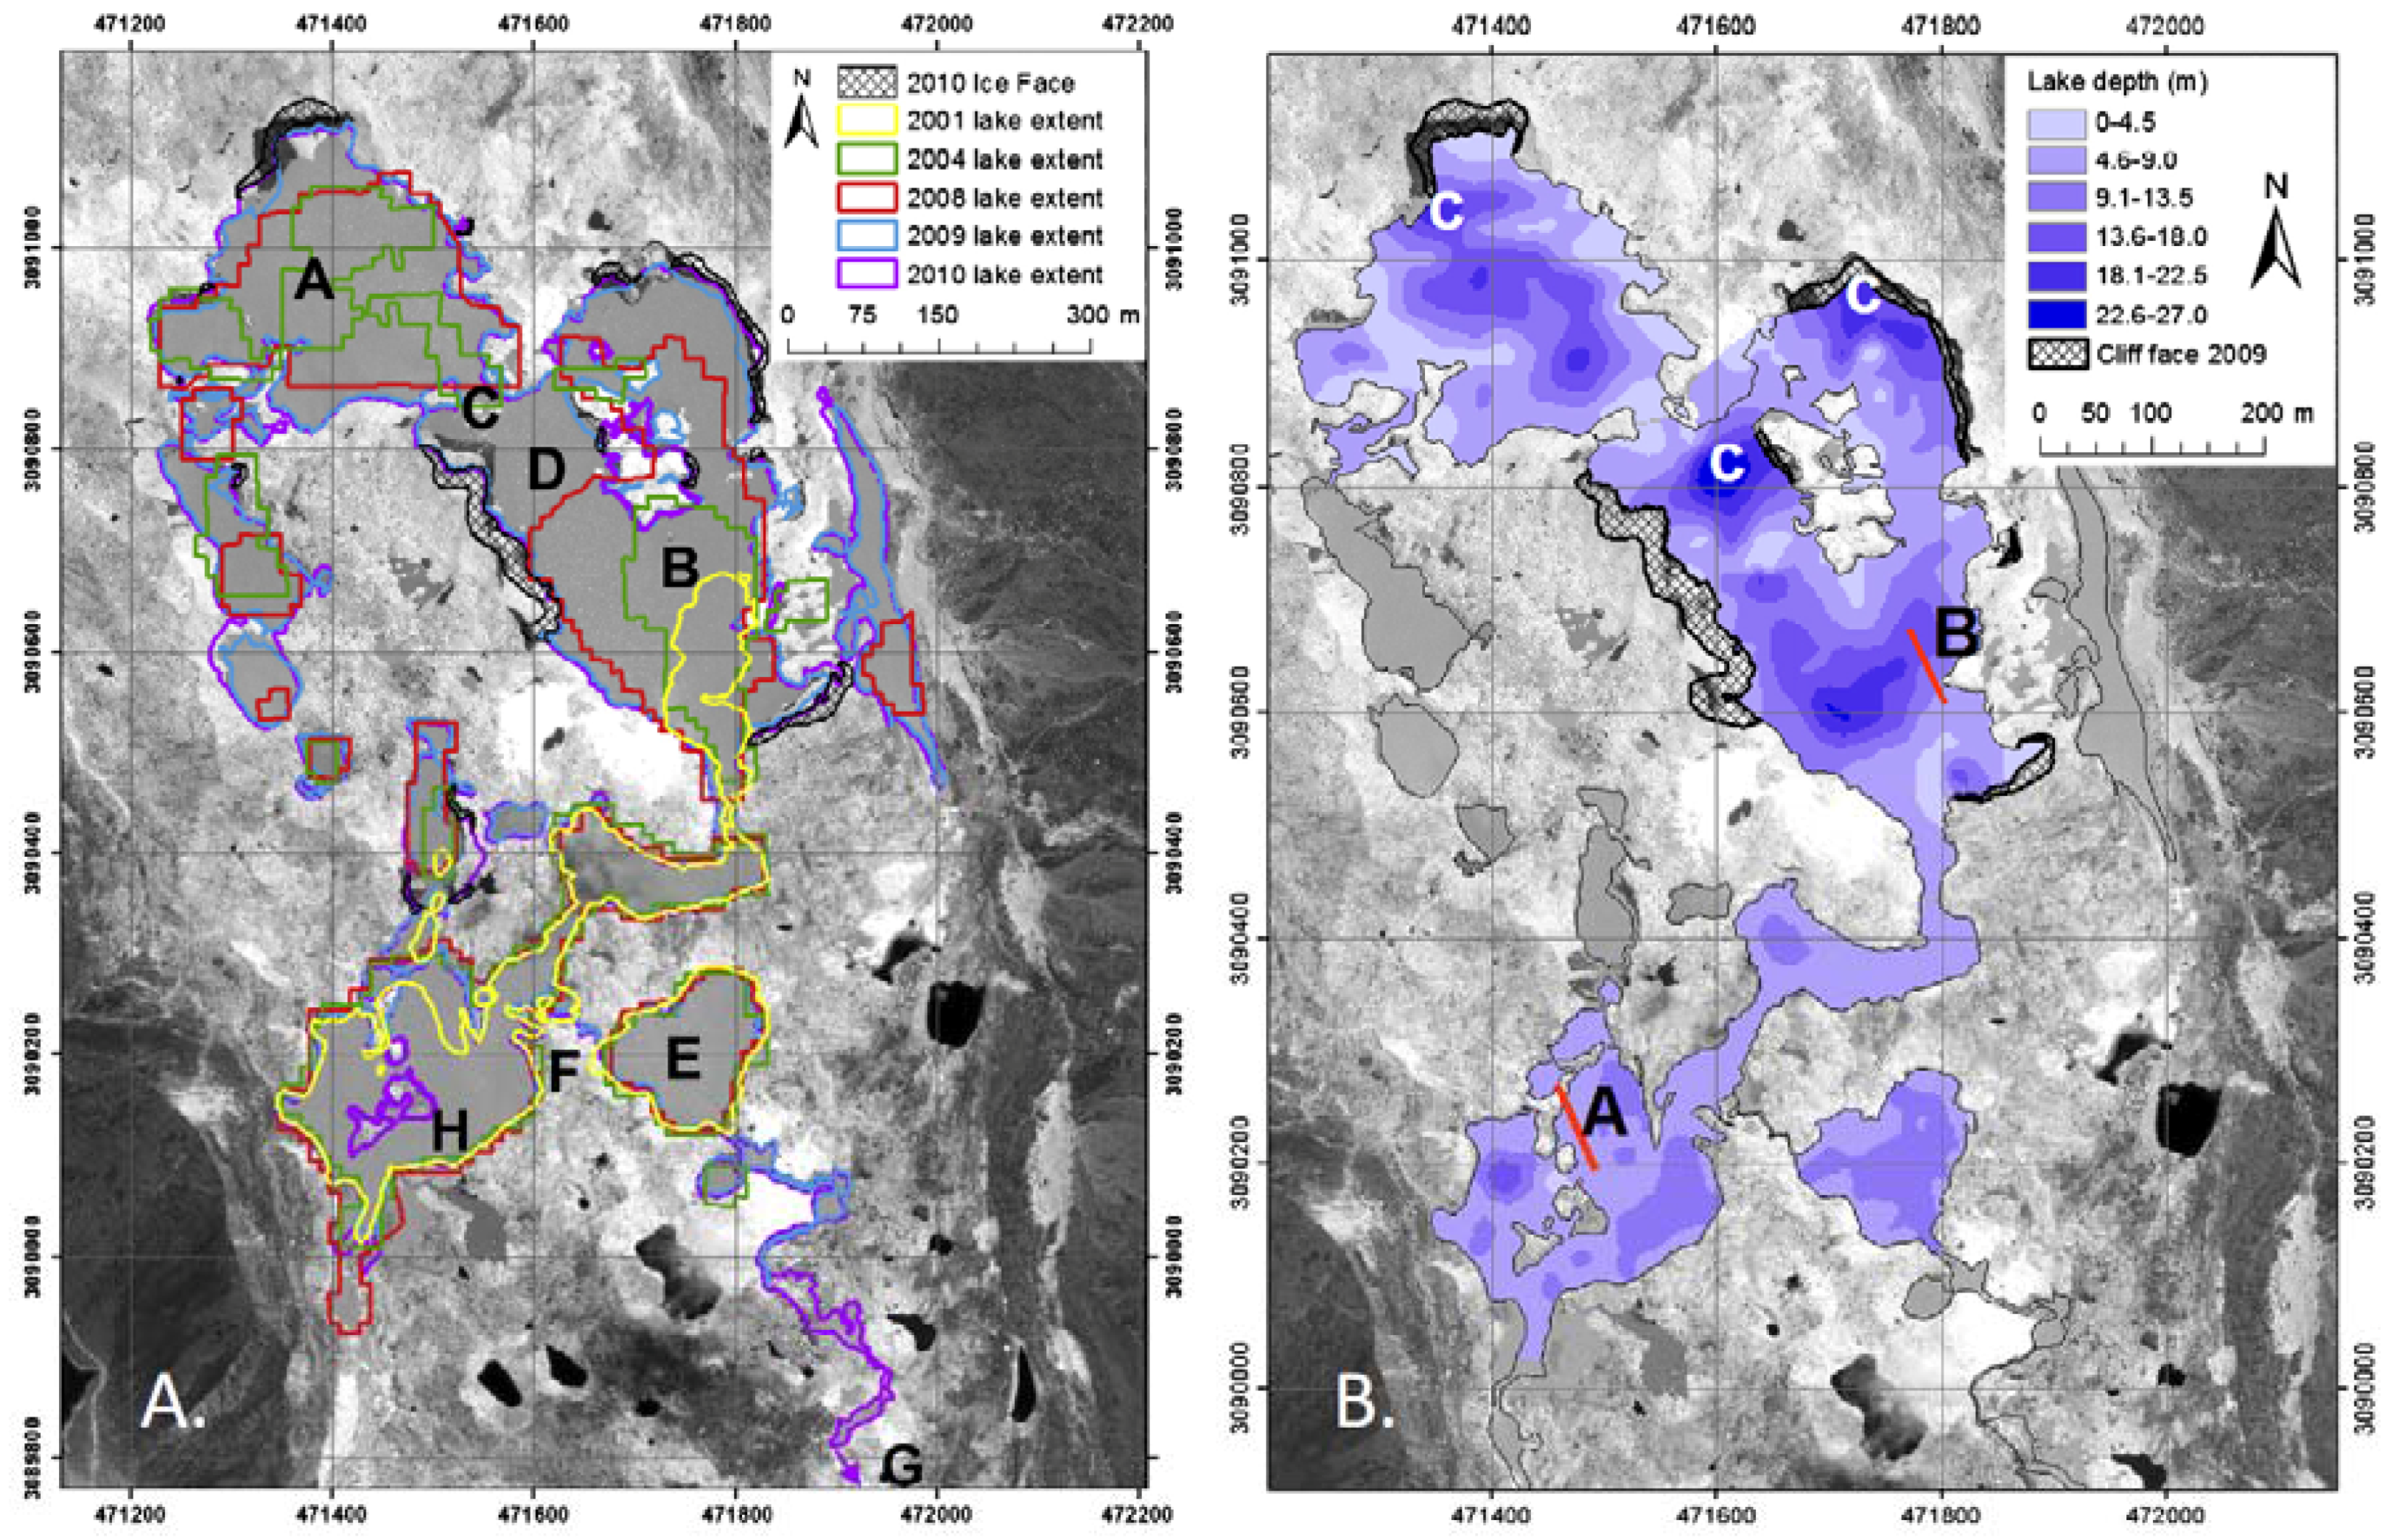
2. Site Description
3. Field Methods
3.1. Temperature and Water Level Buoys
3.2. Time-Lapse Imagery and Meteorological Data
3.3. Turbidity and Water Properties
3.4. Sediment Properties
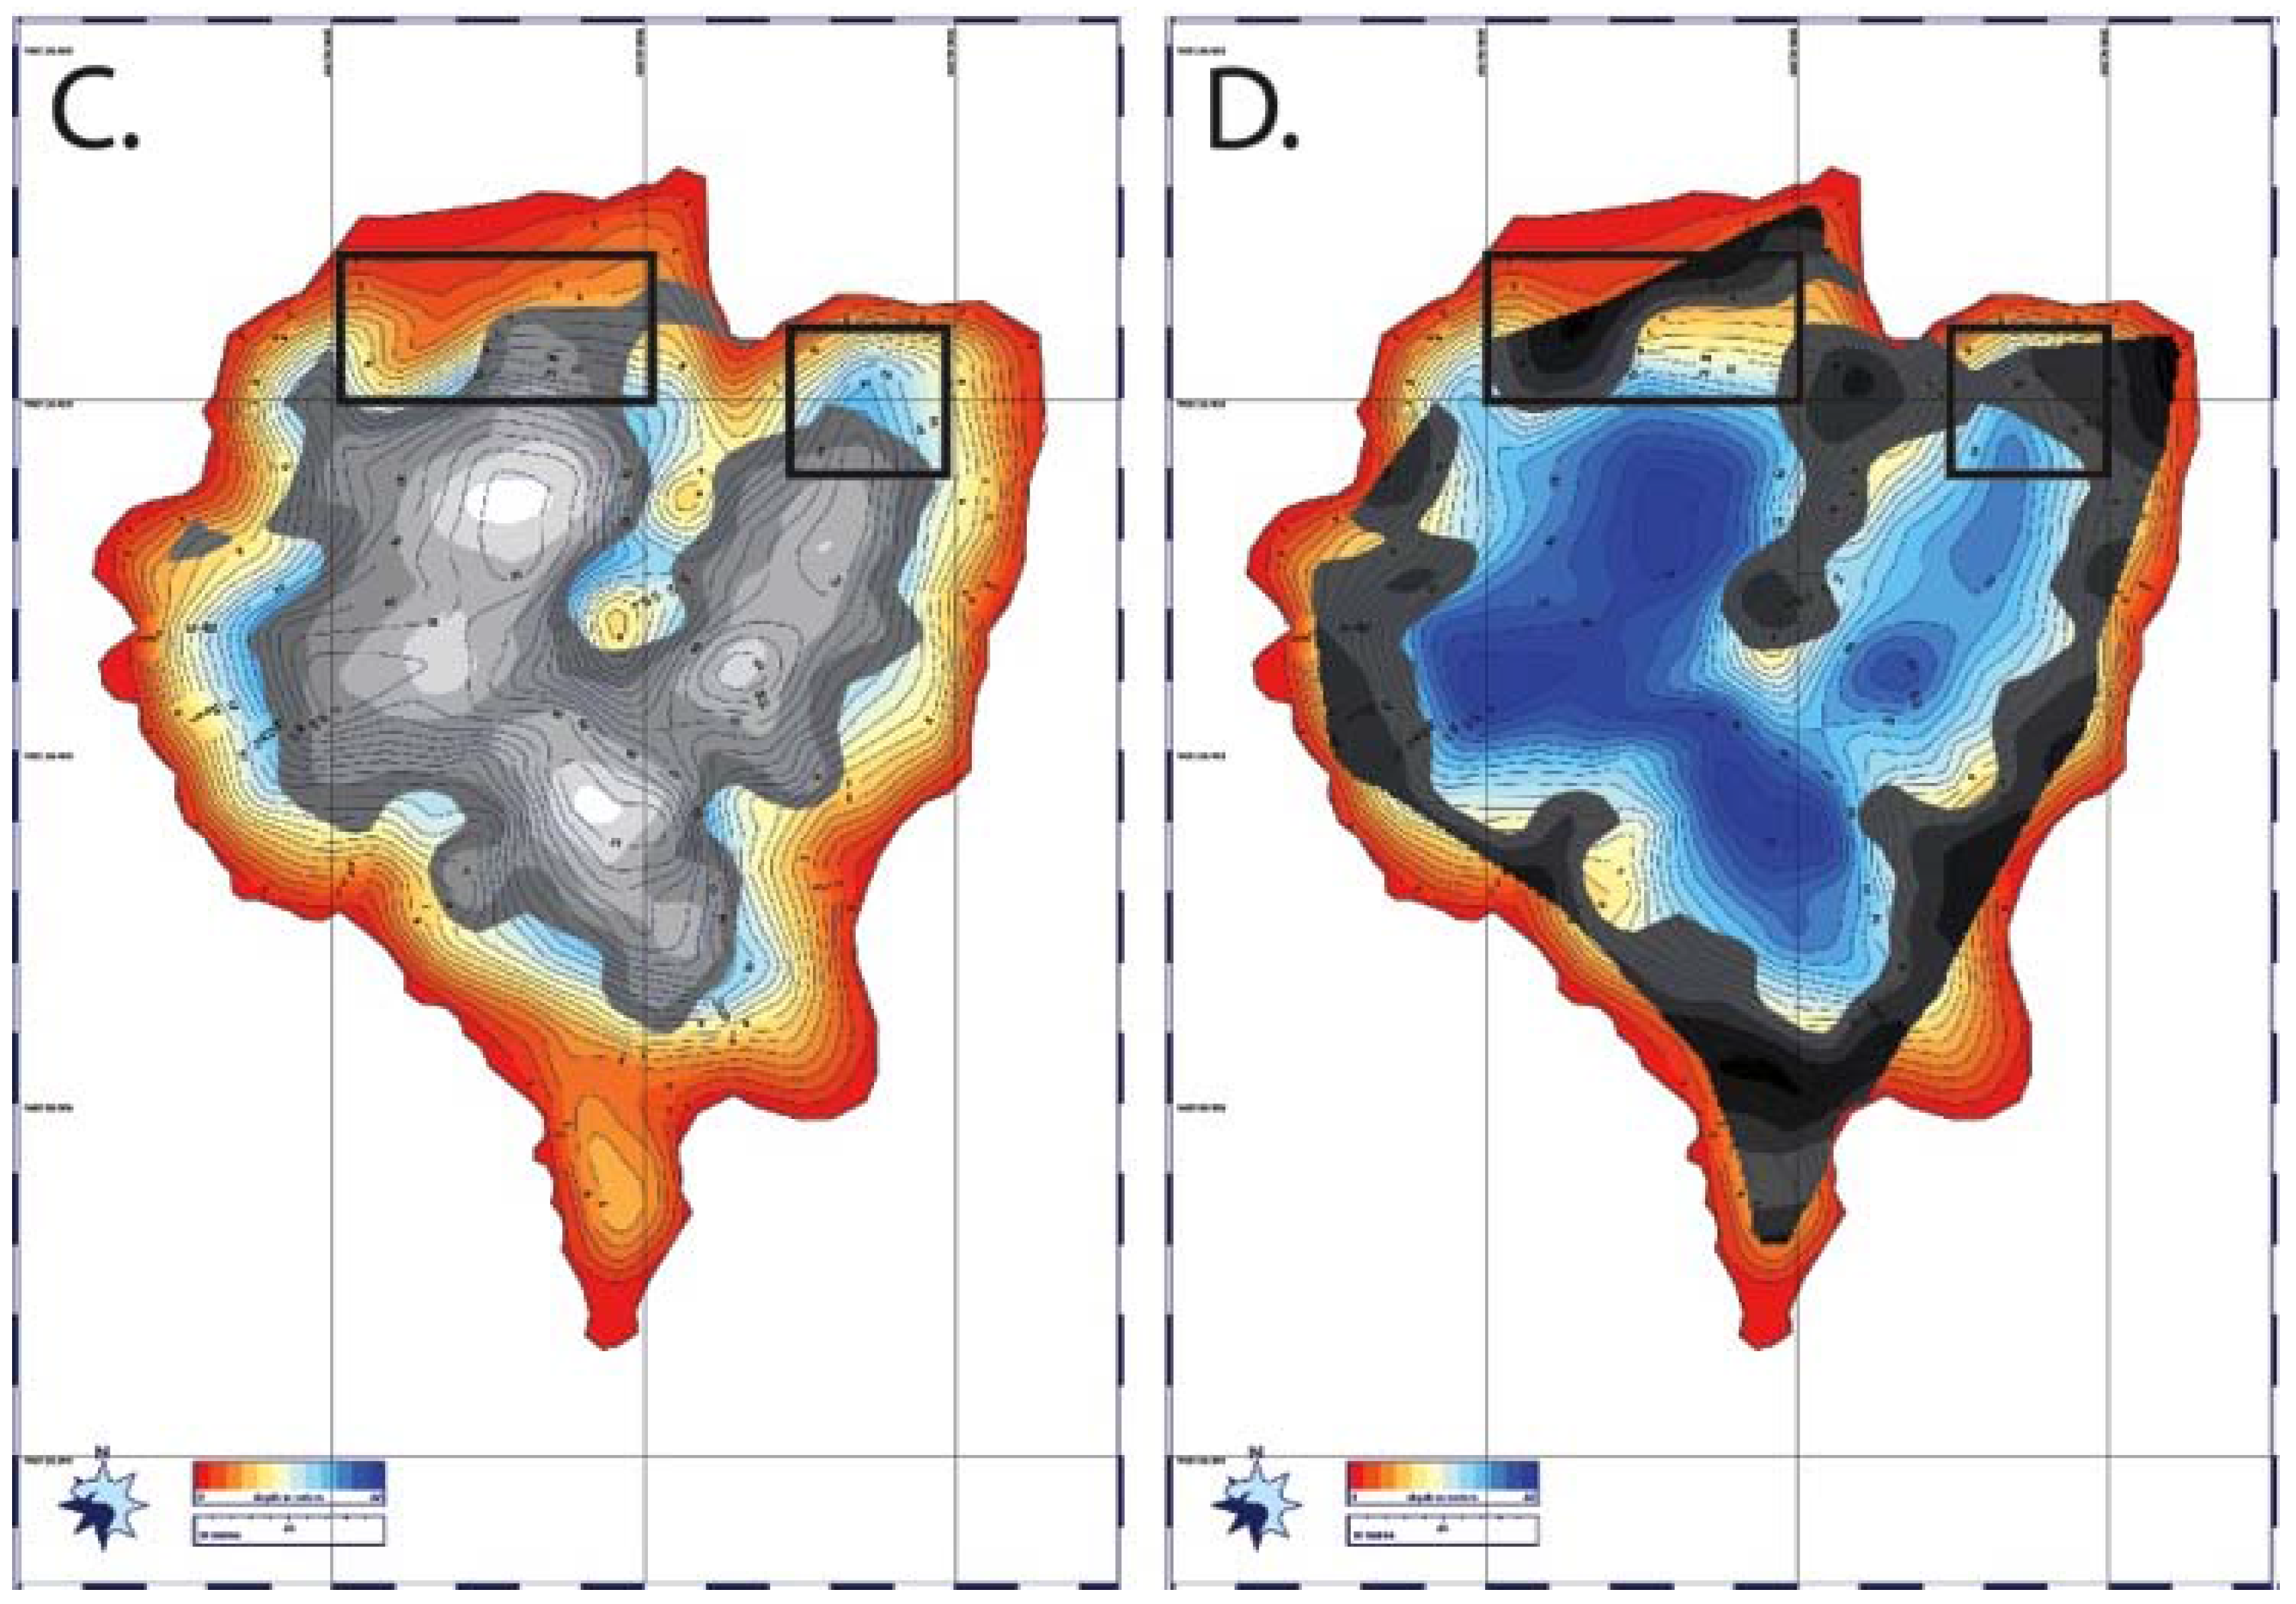
3.5. Lake Floor Structure
4. Results
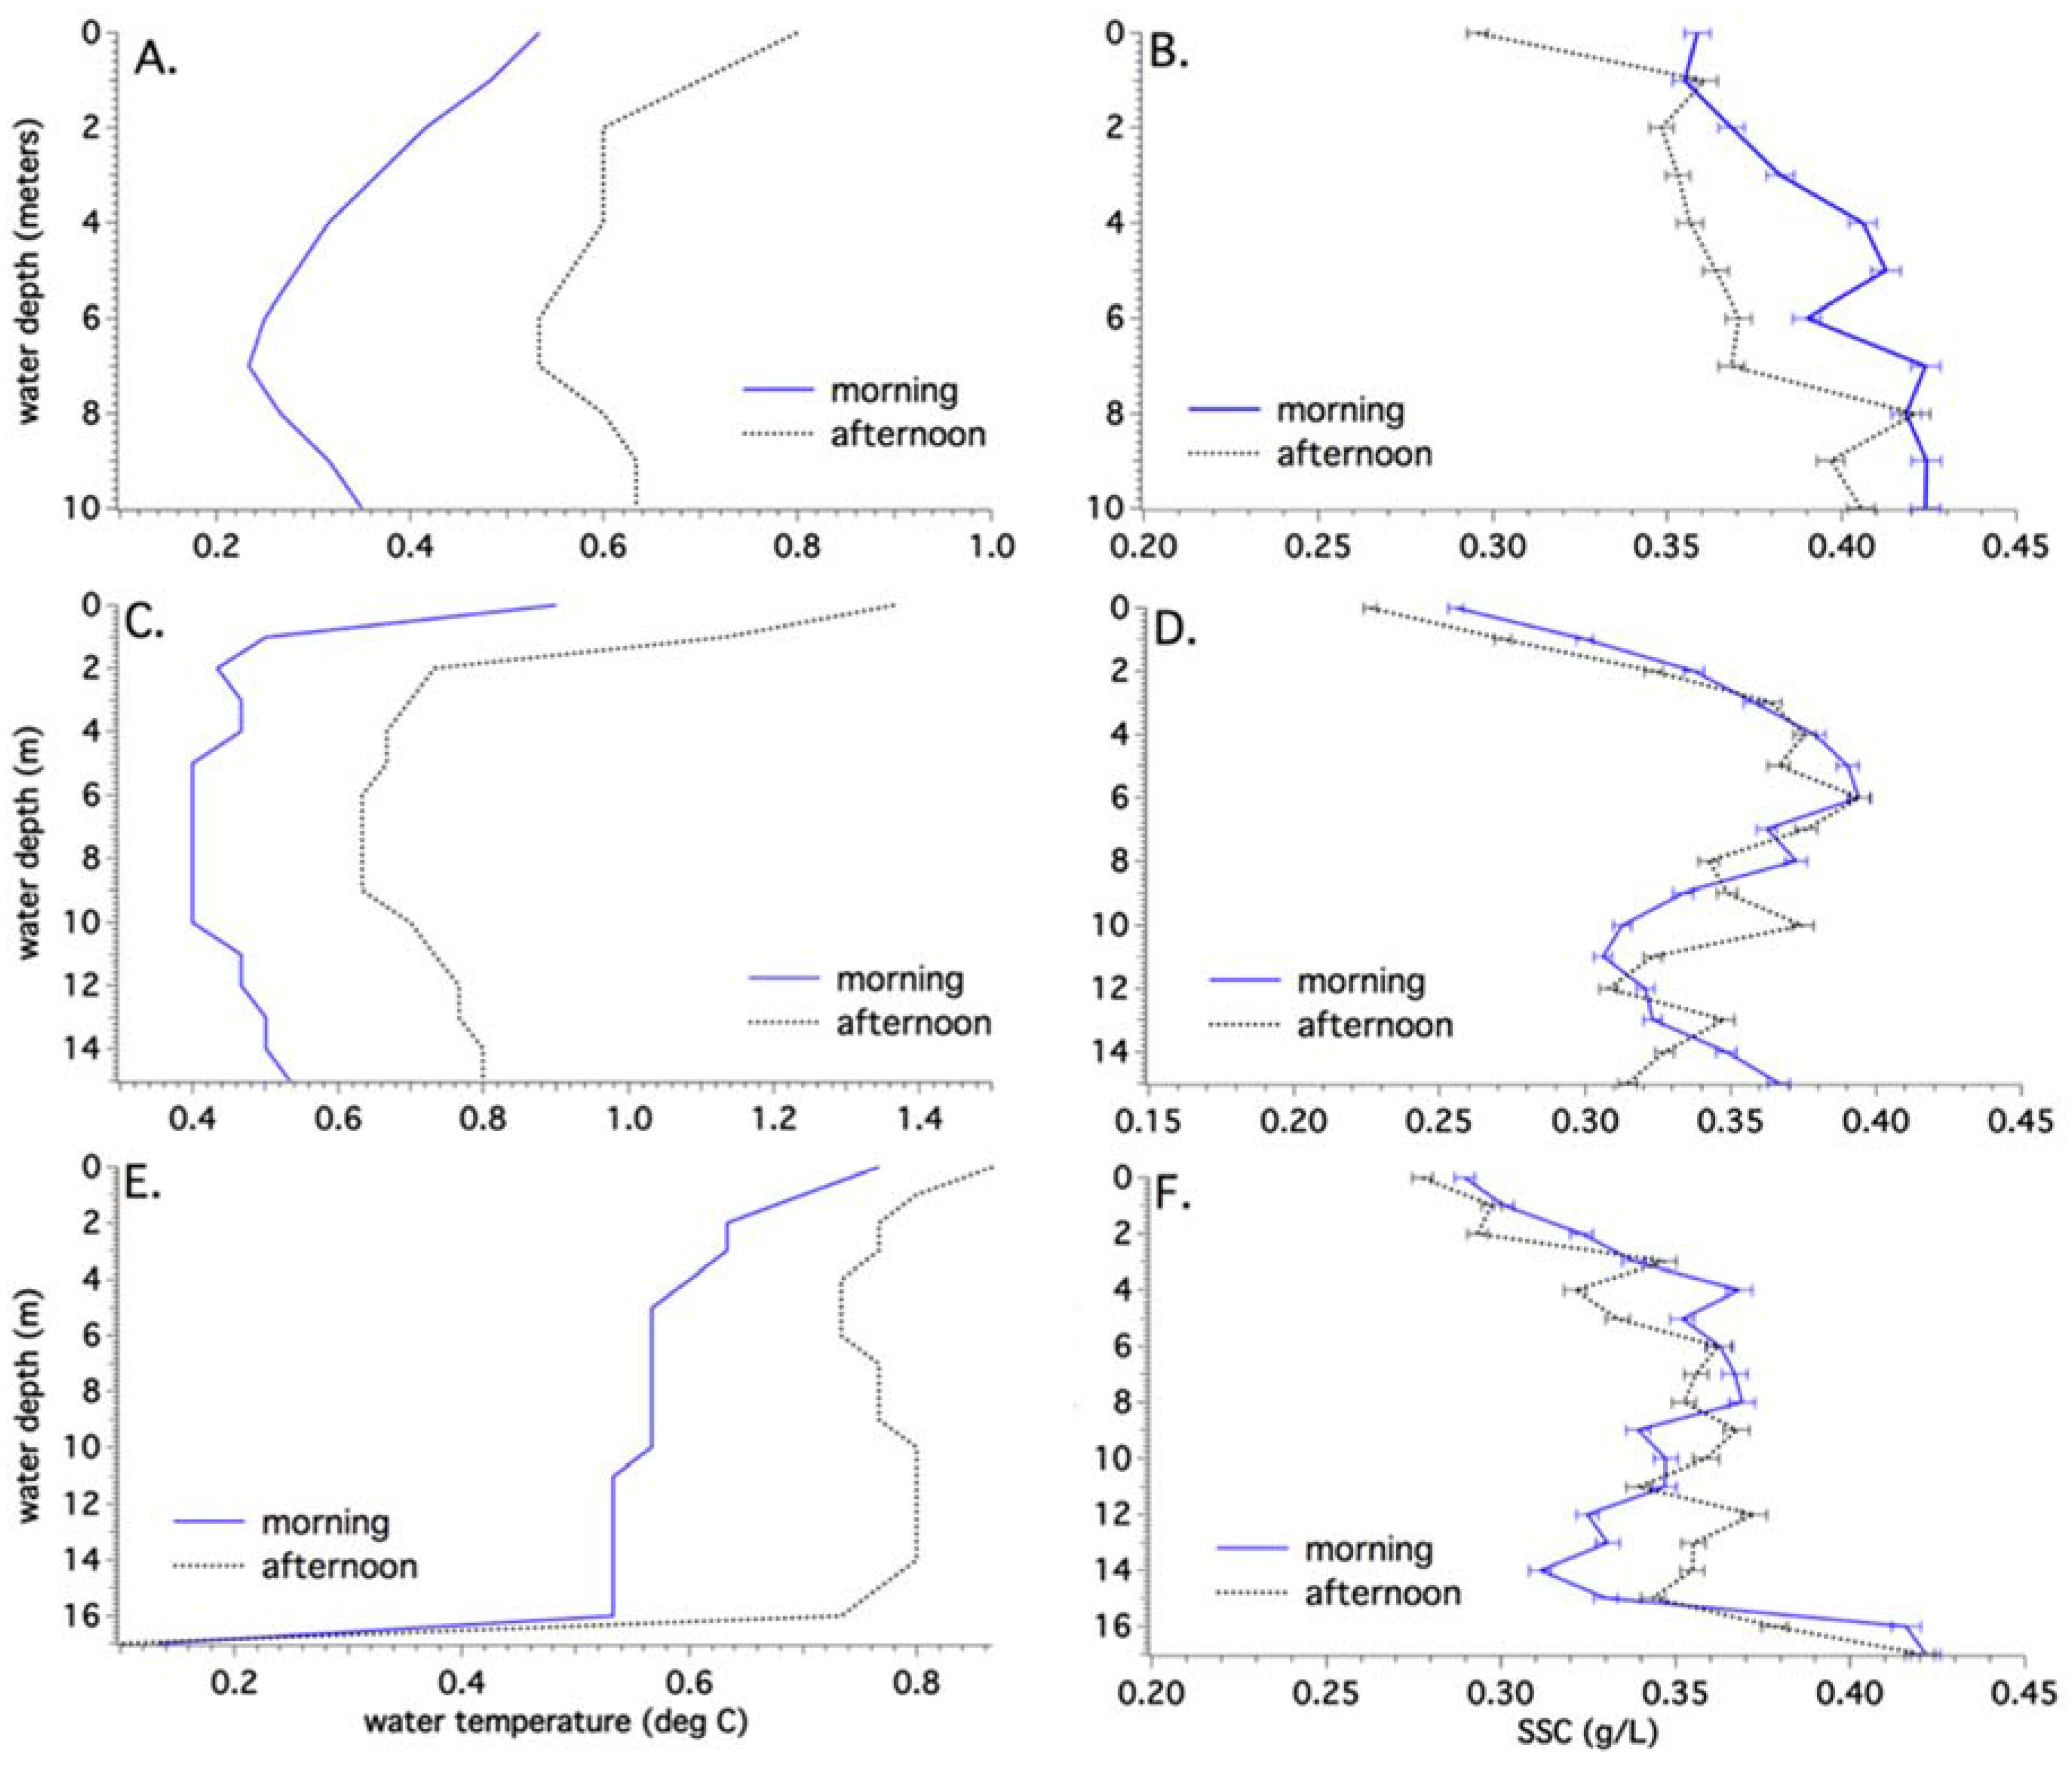
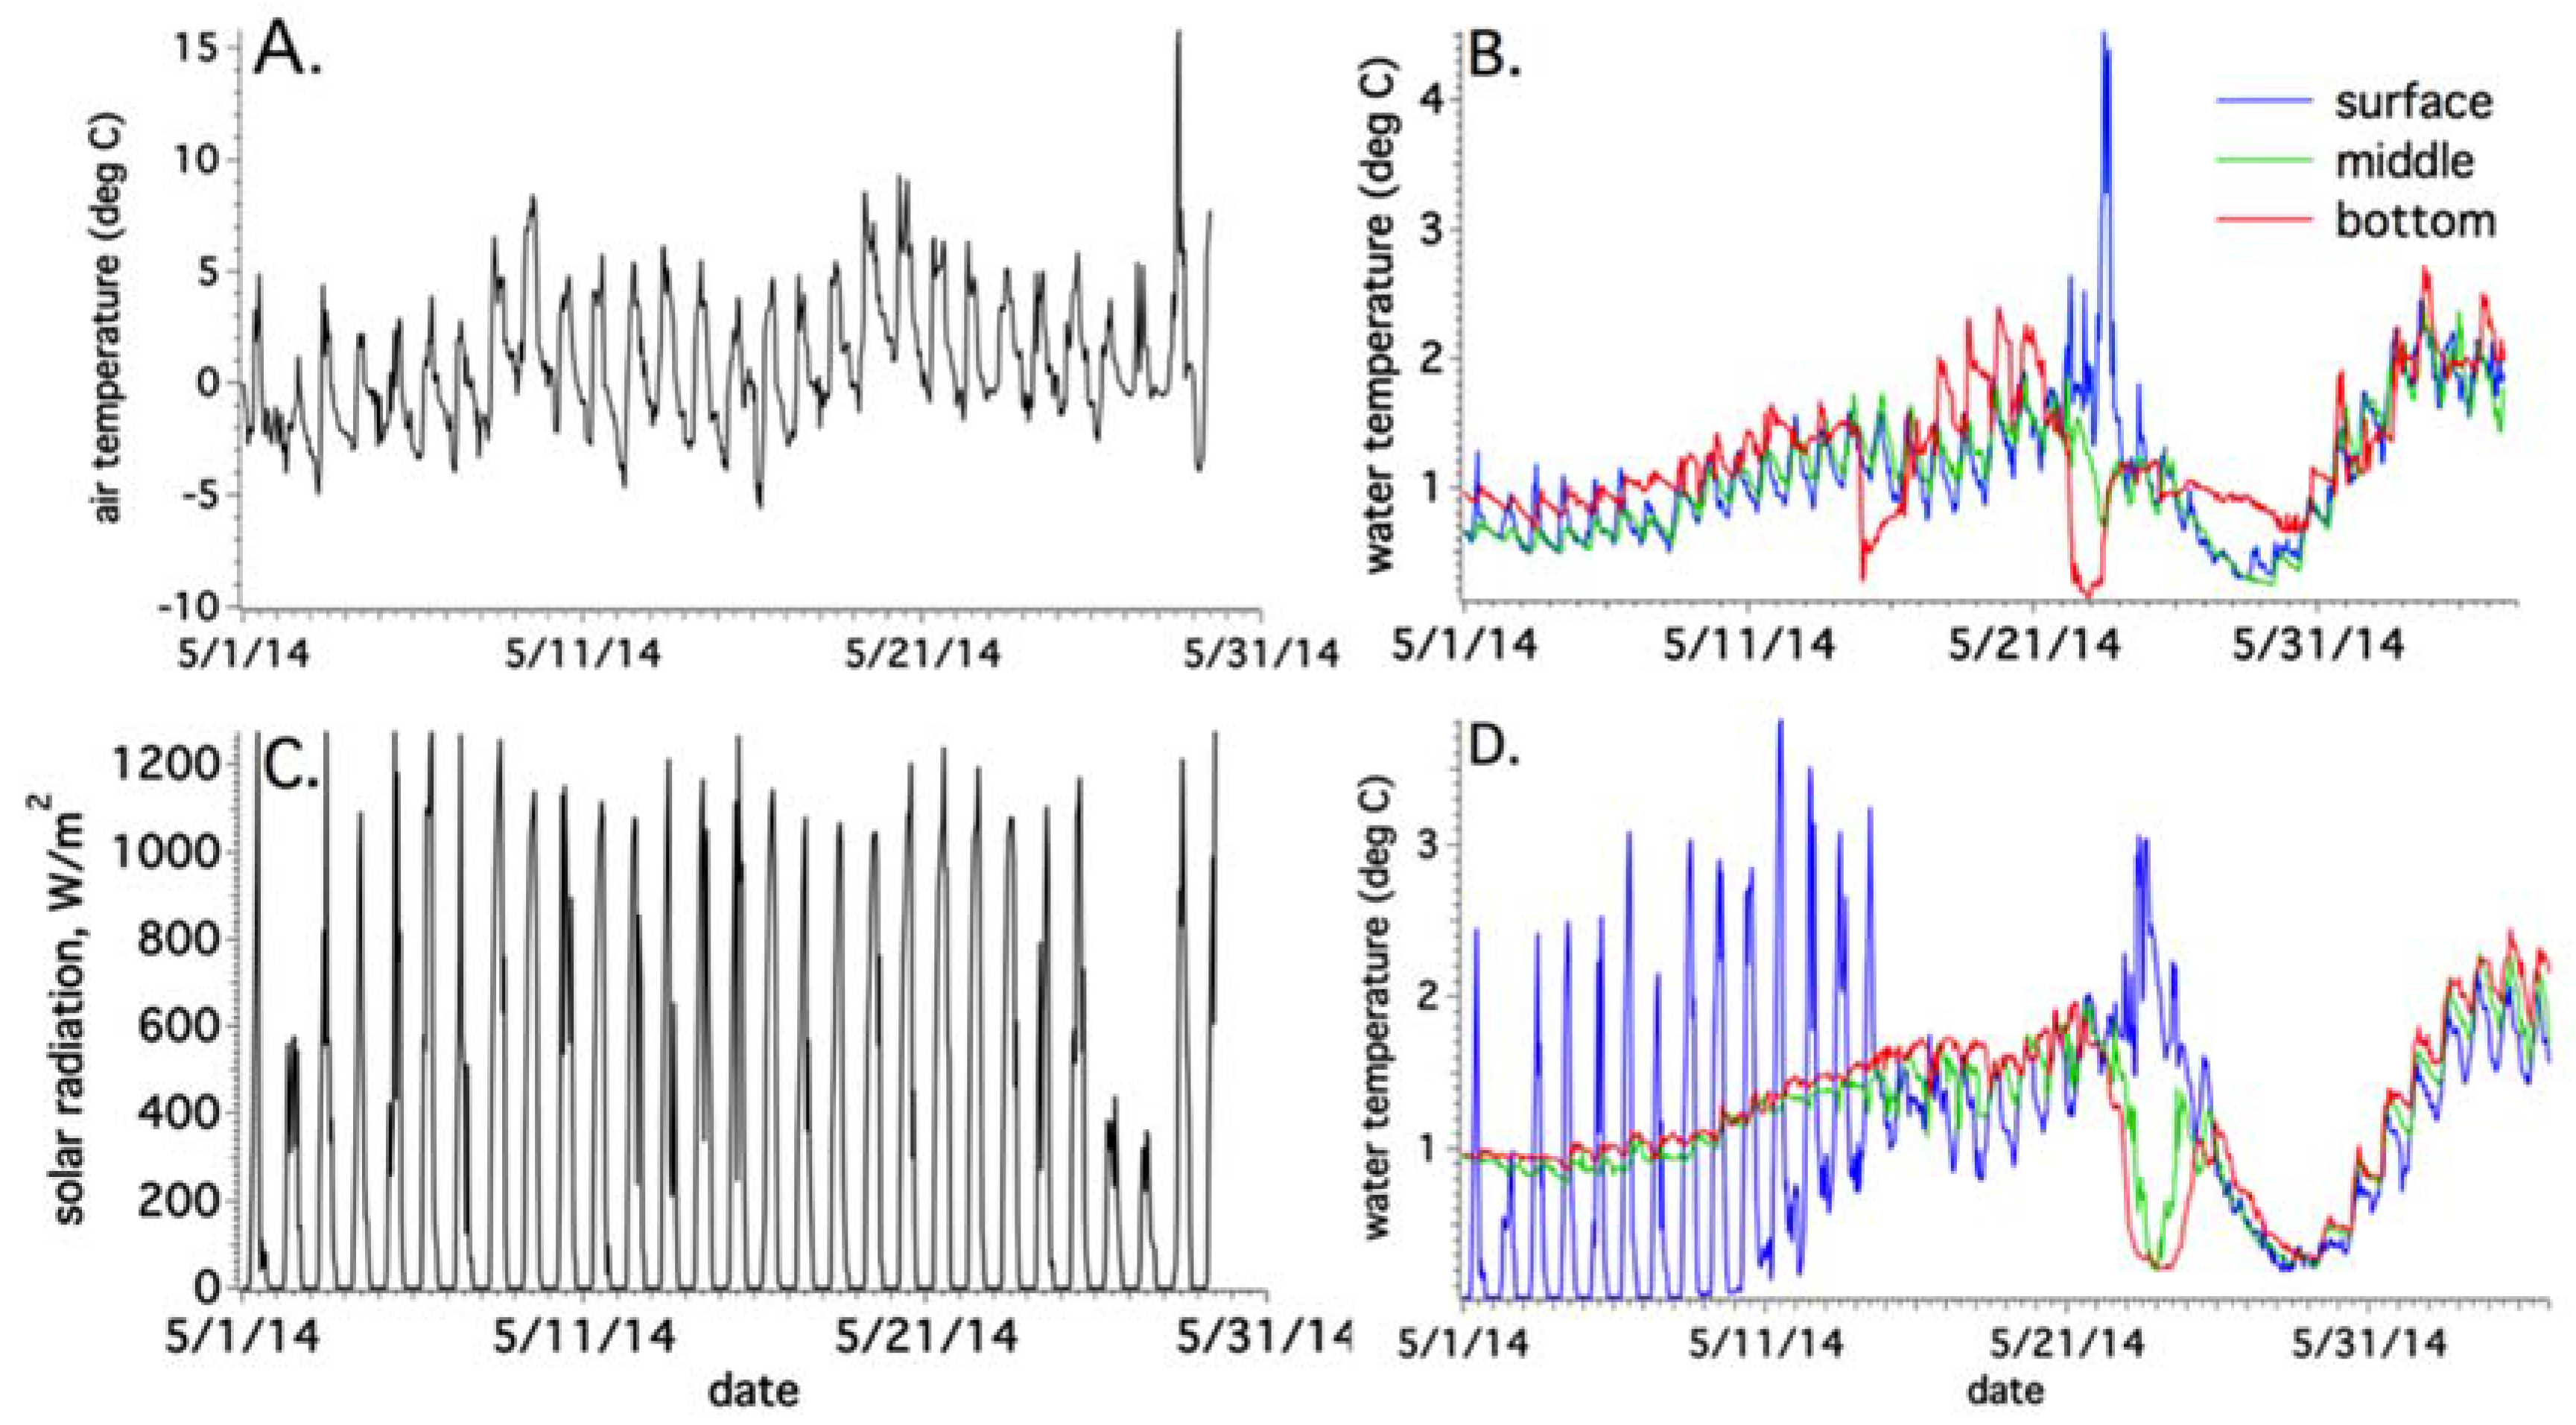
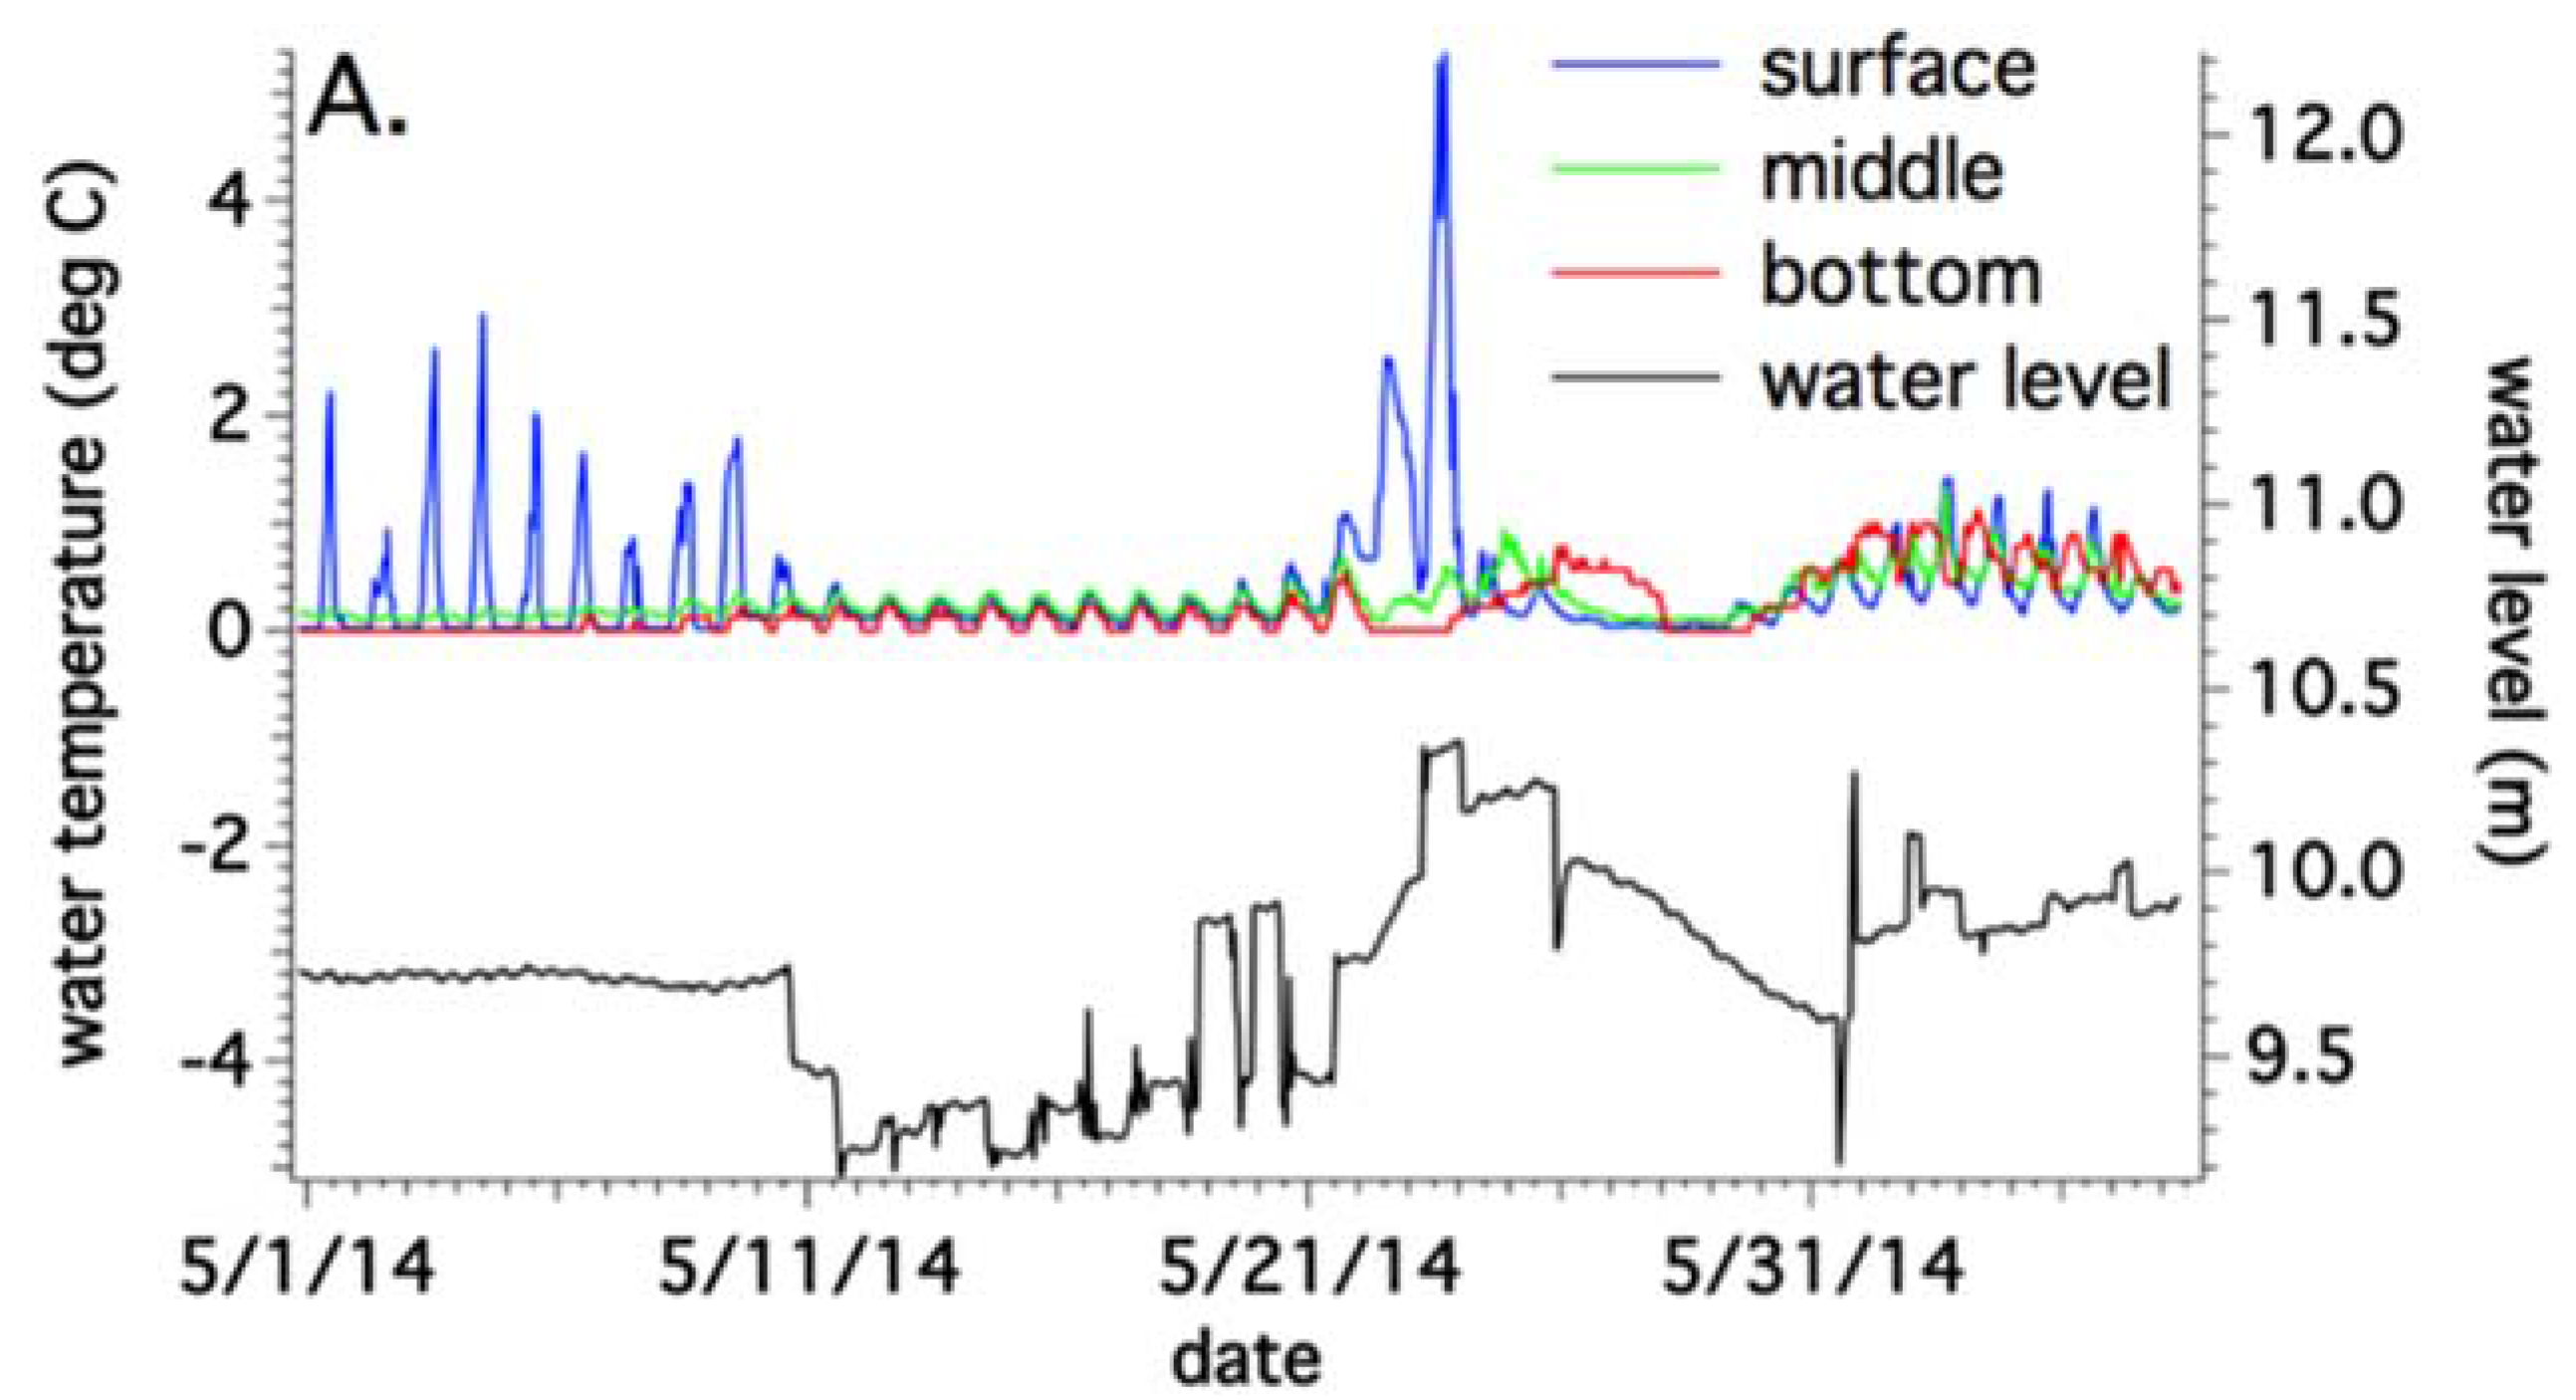
4.1. Sub-Basin Vertical Temperatures and Suspended Sediment Content
4.2. Water Properties
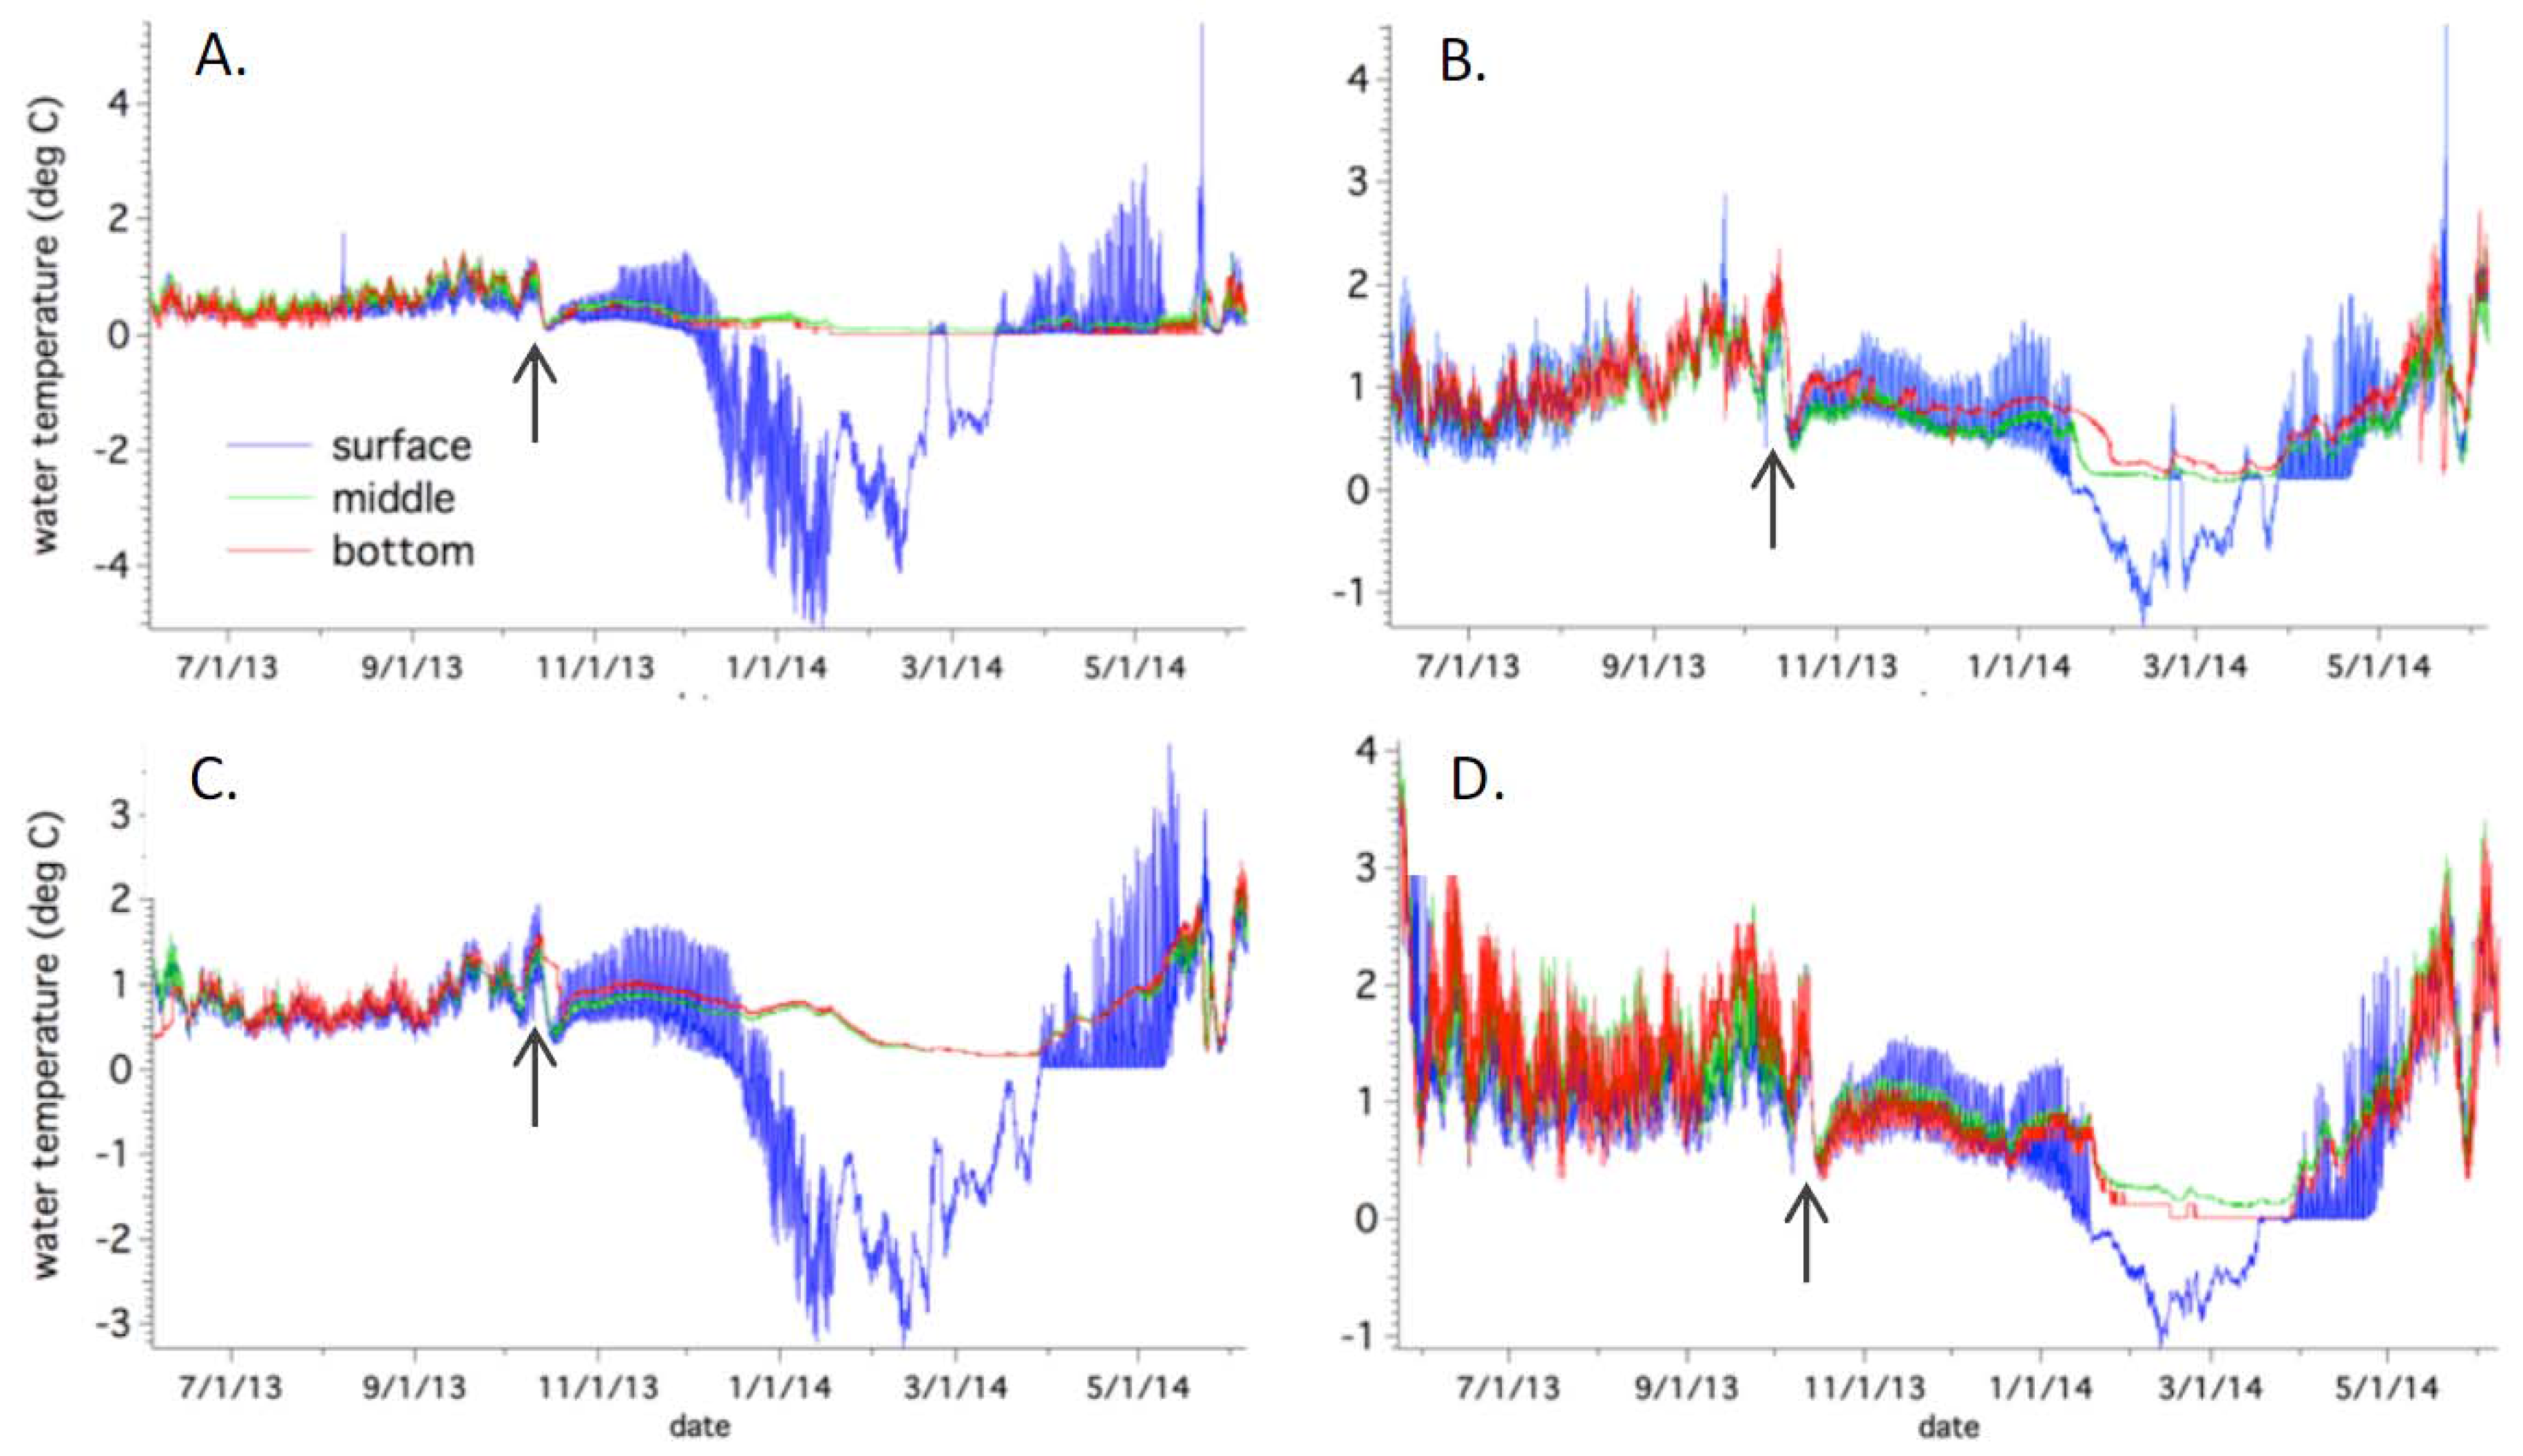
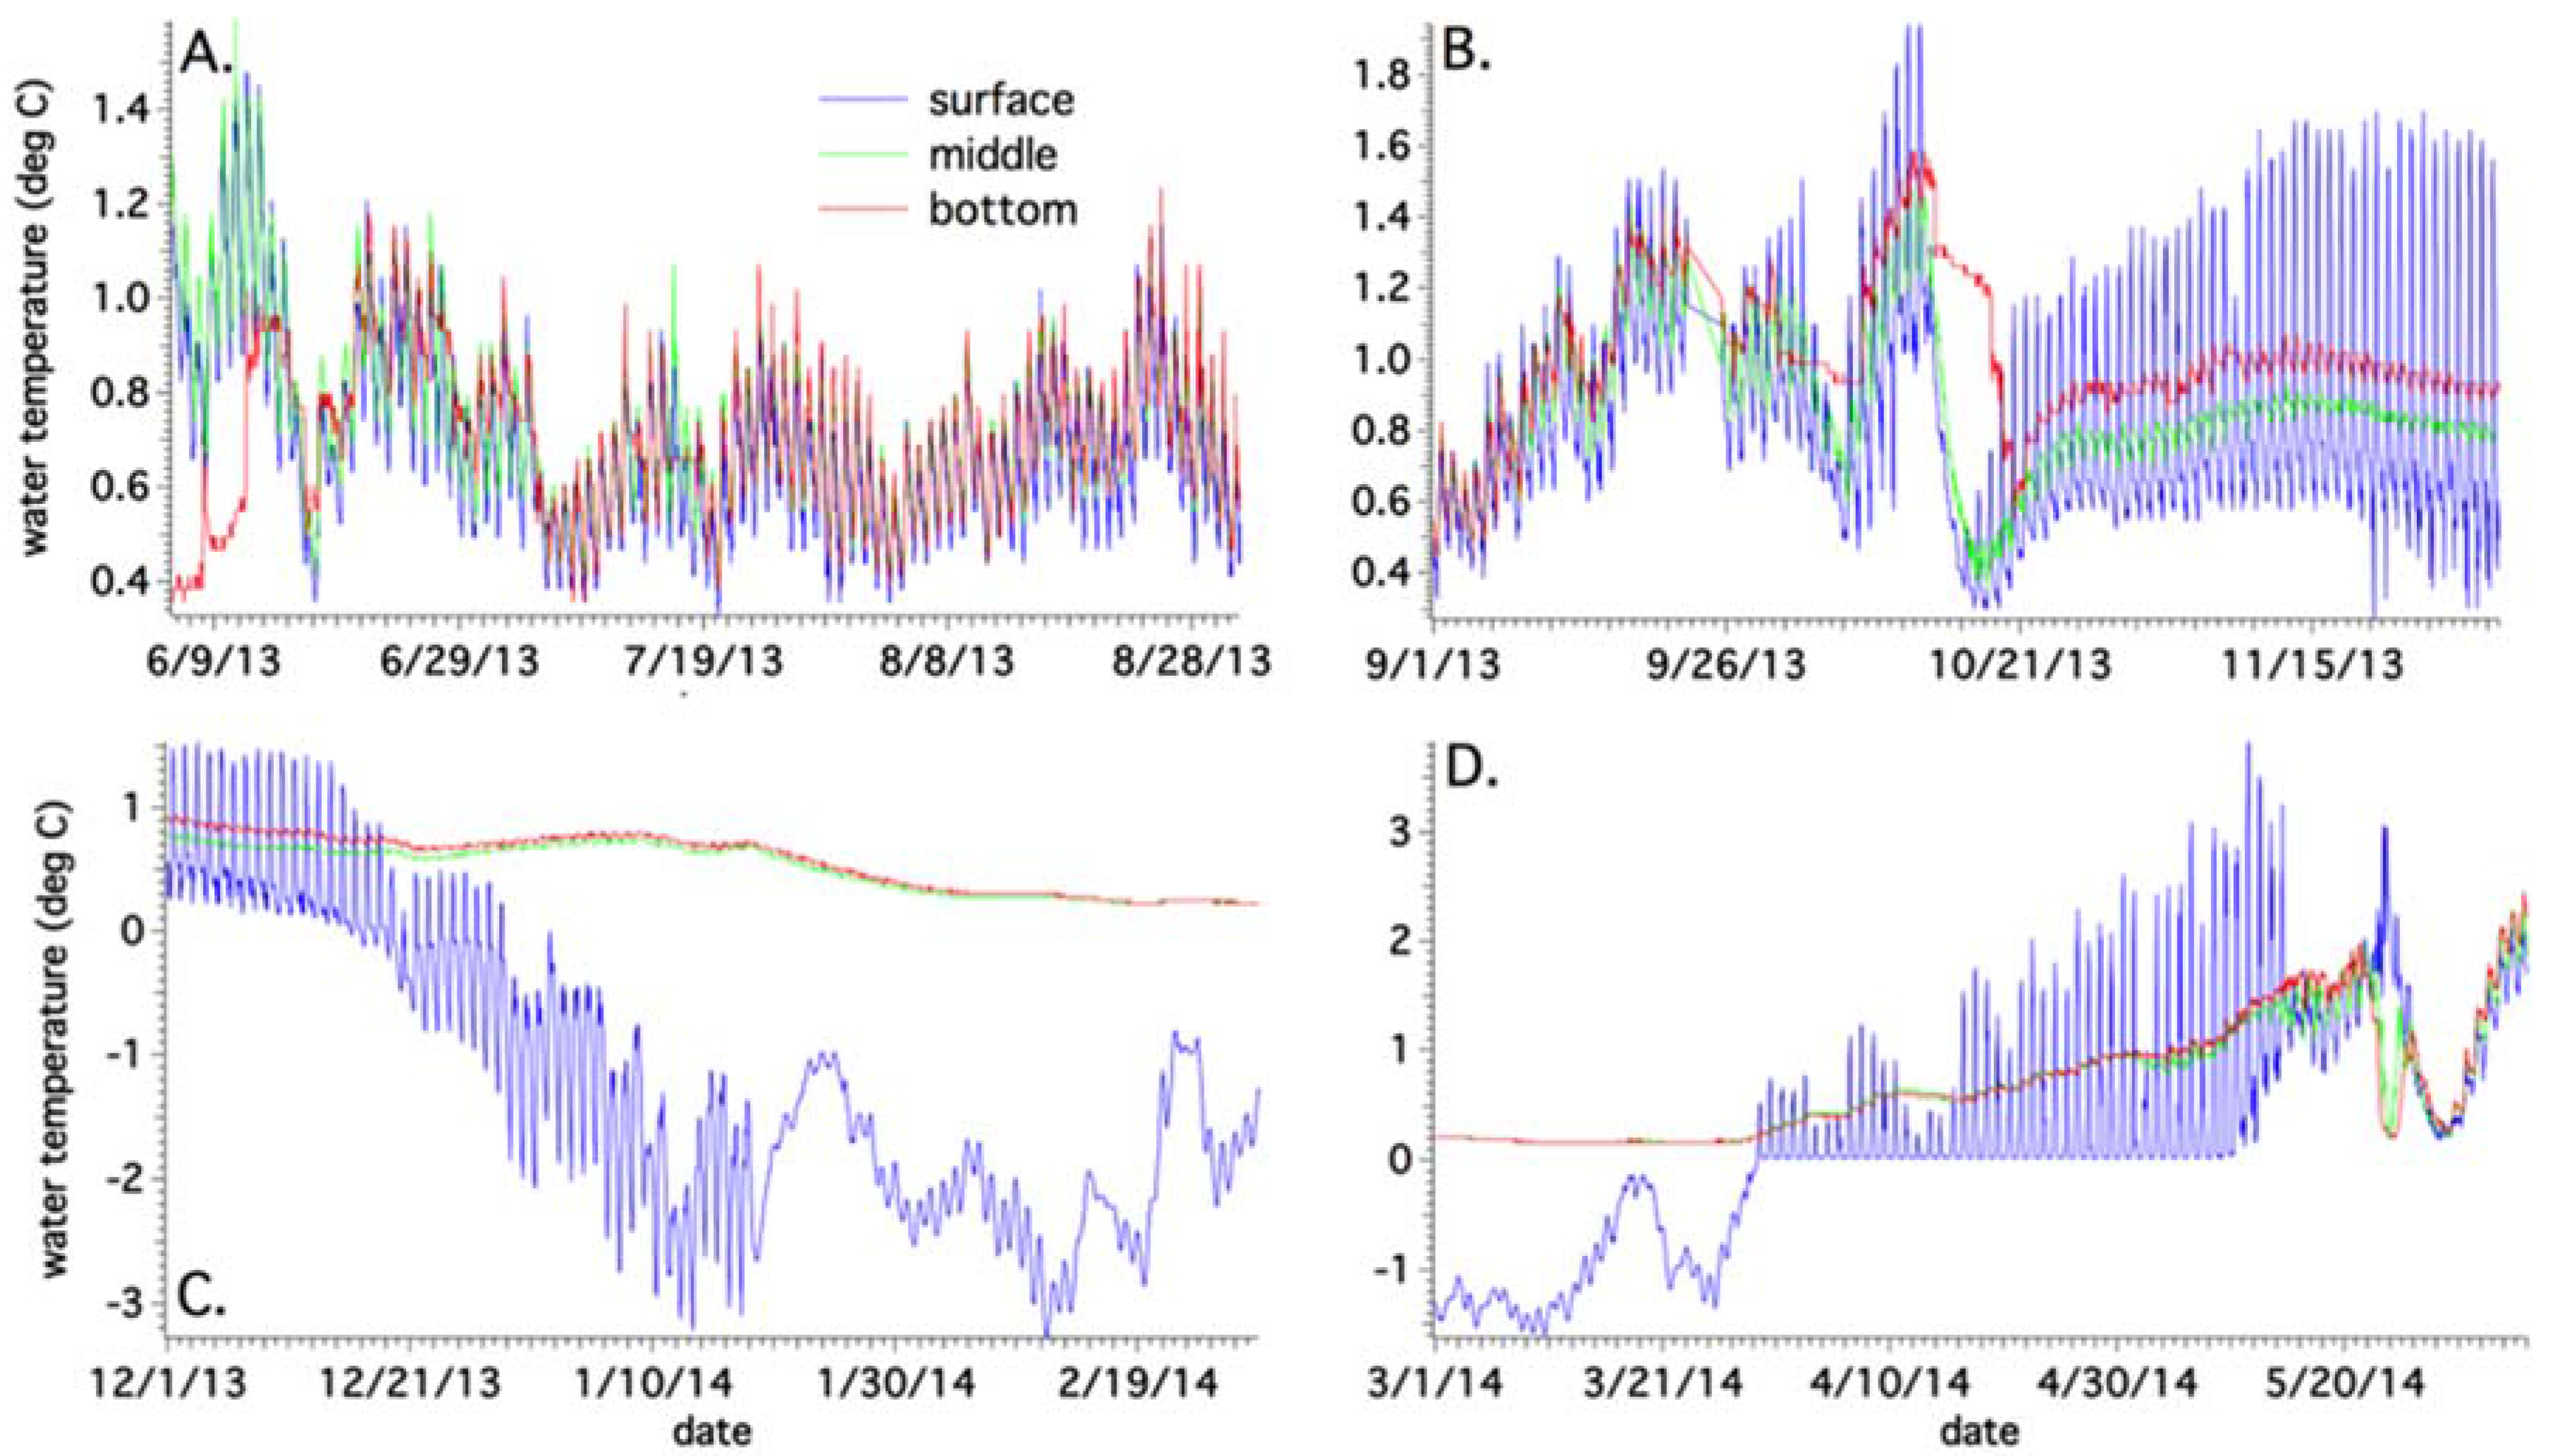
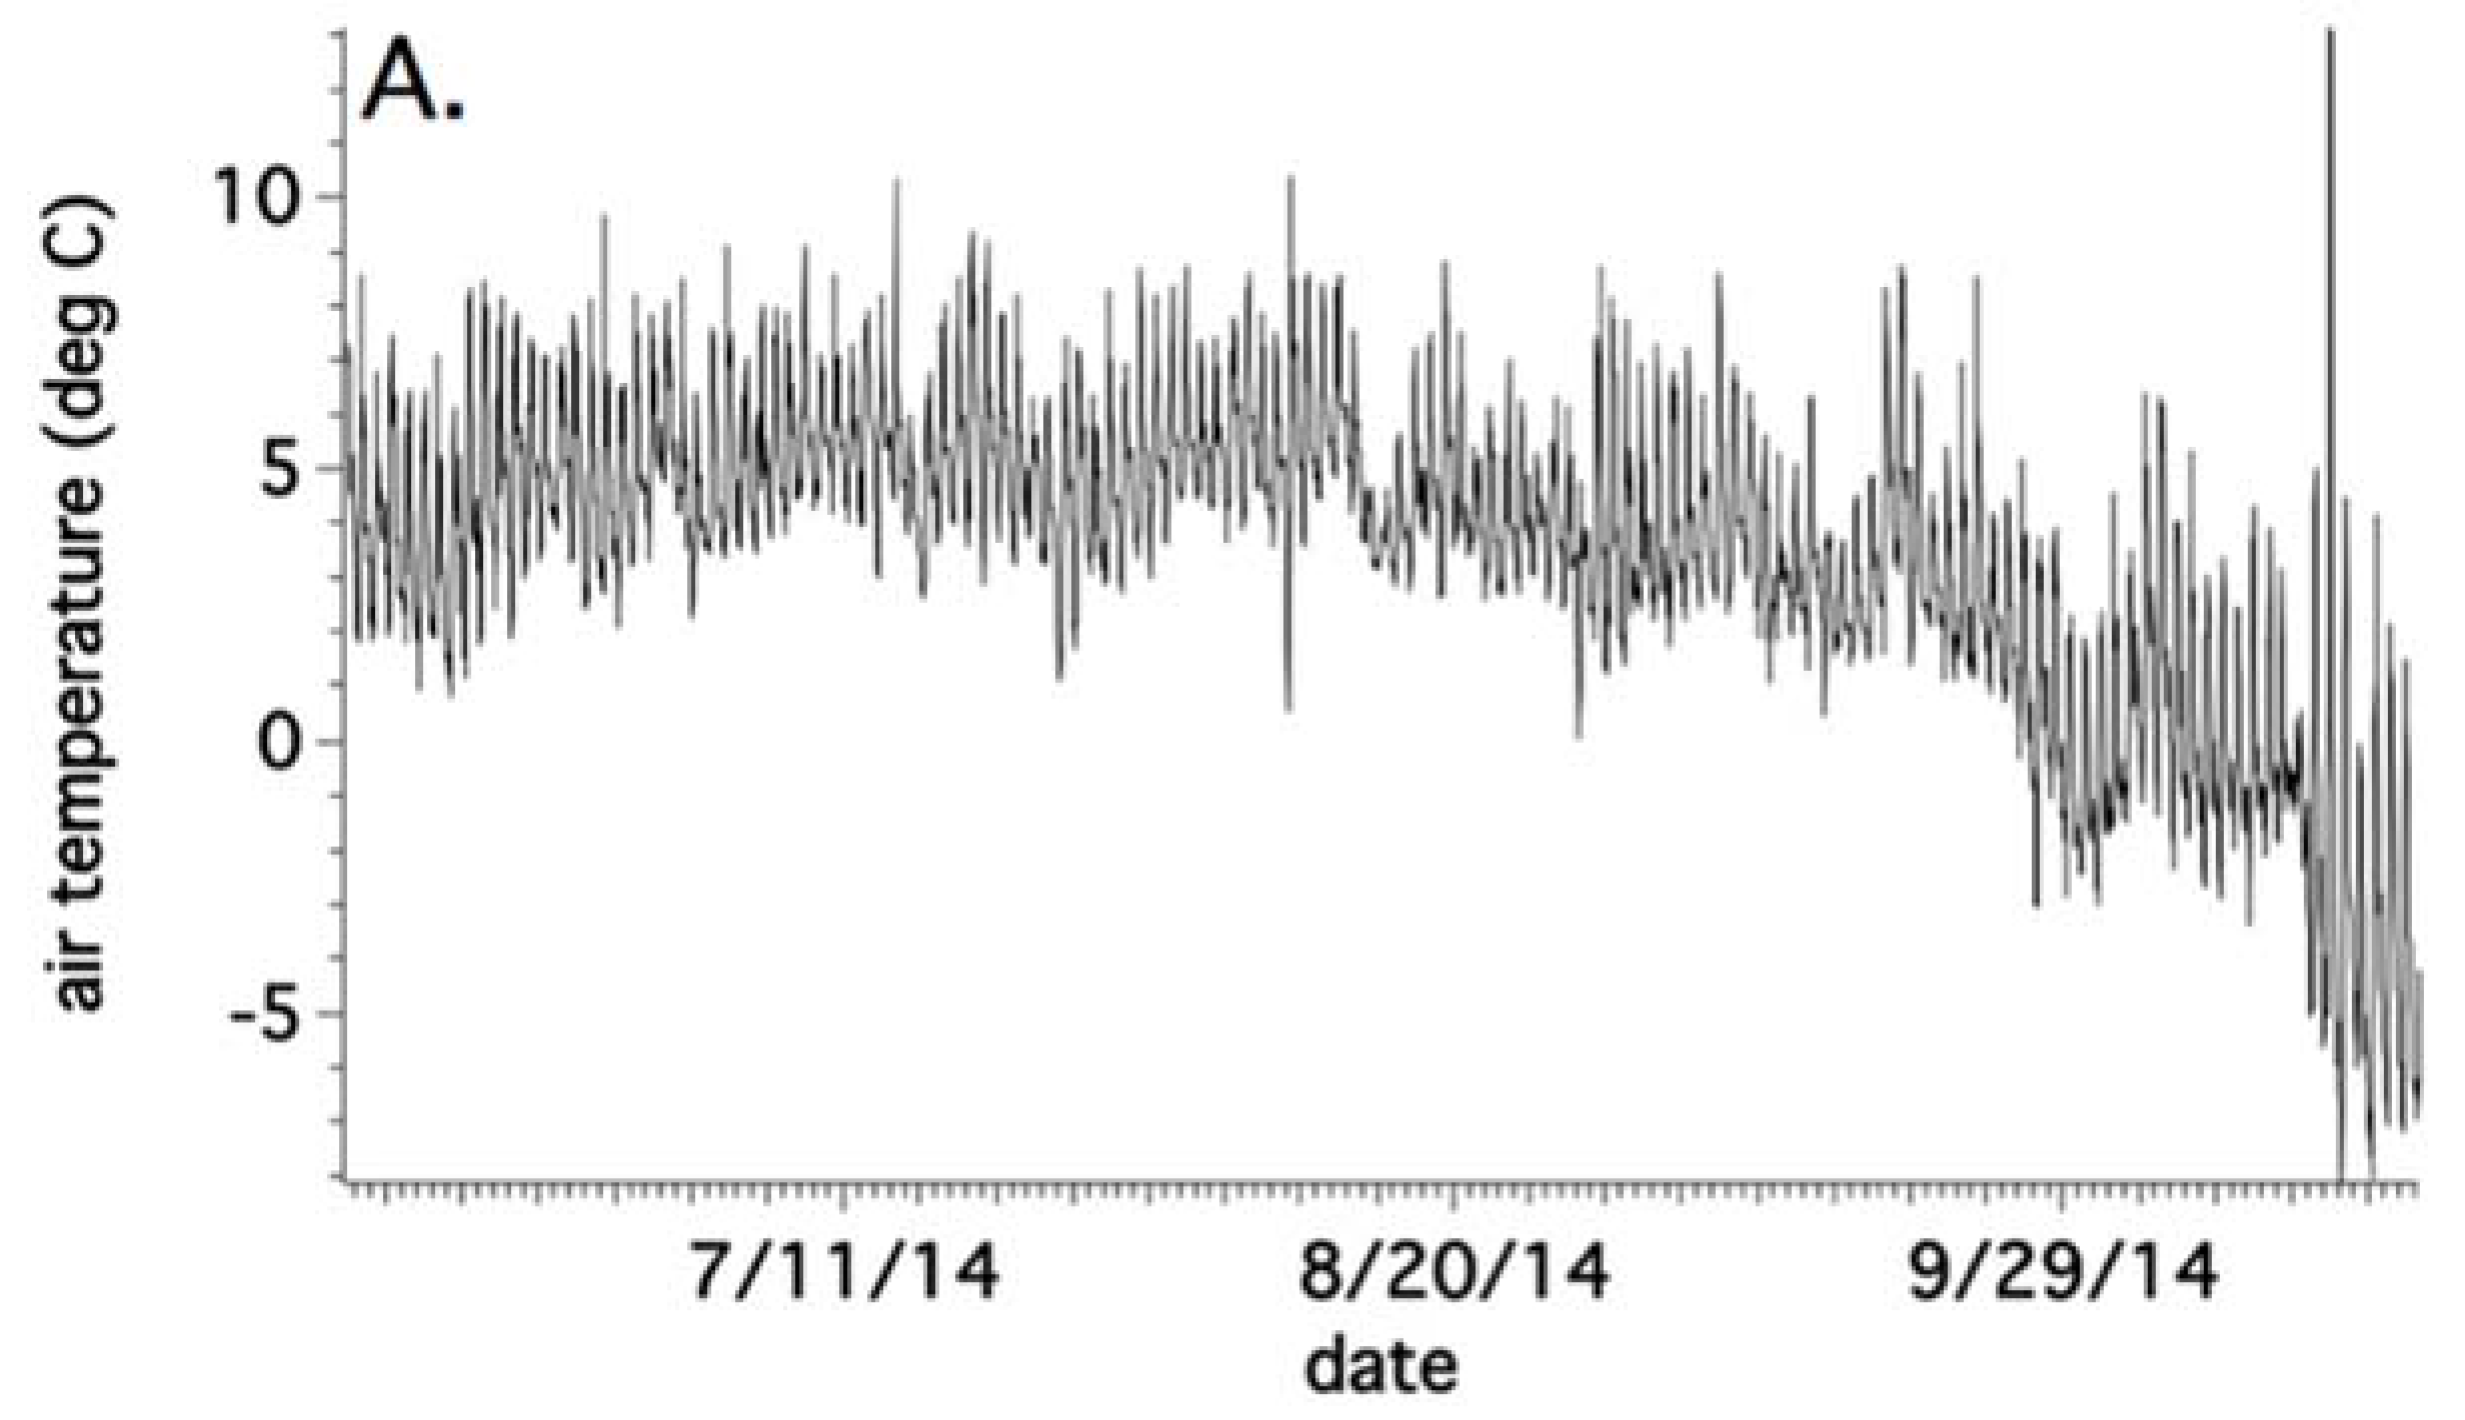
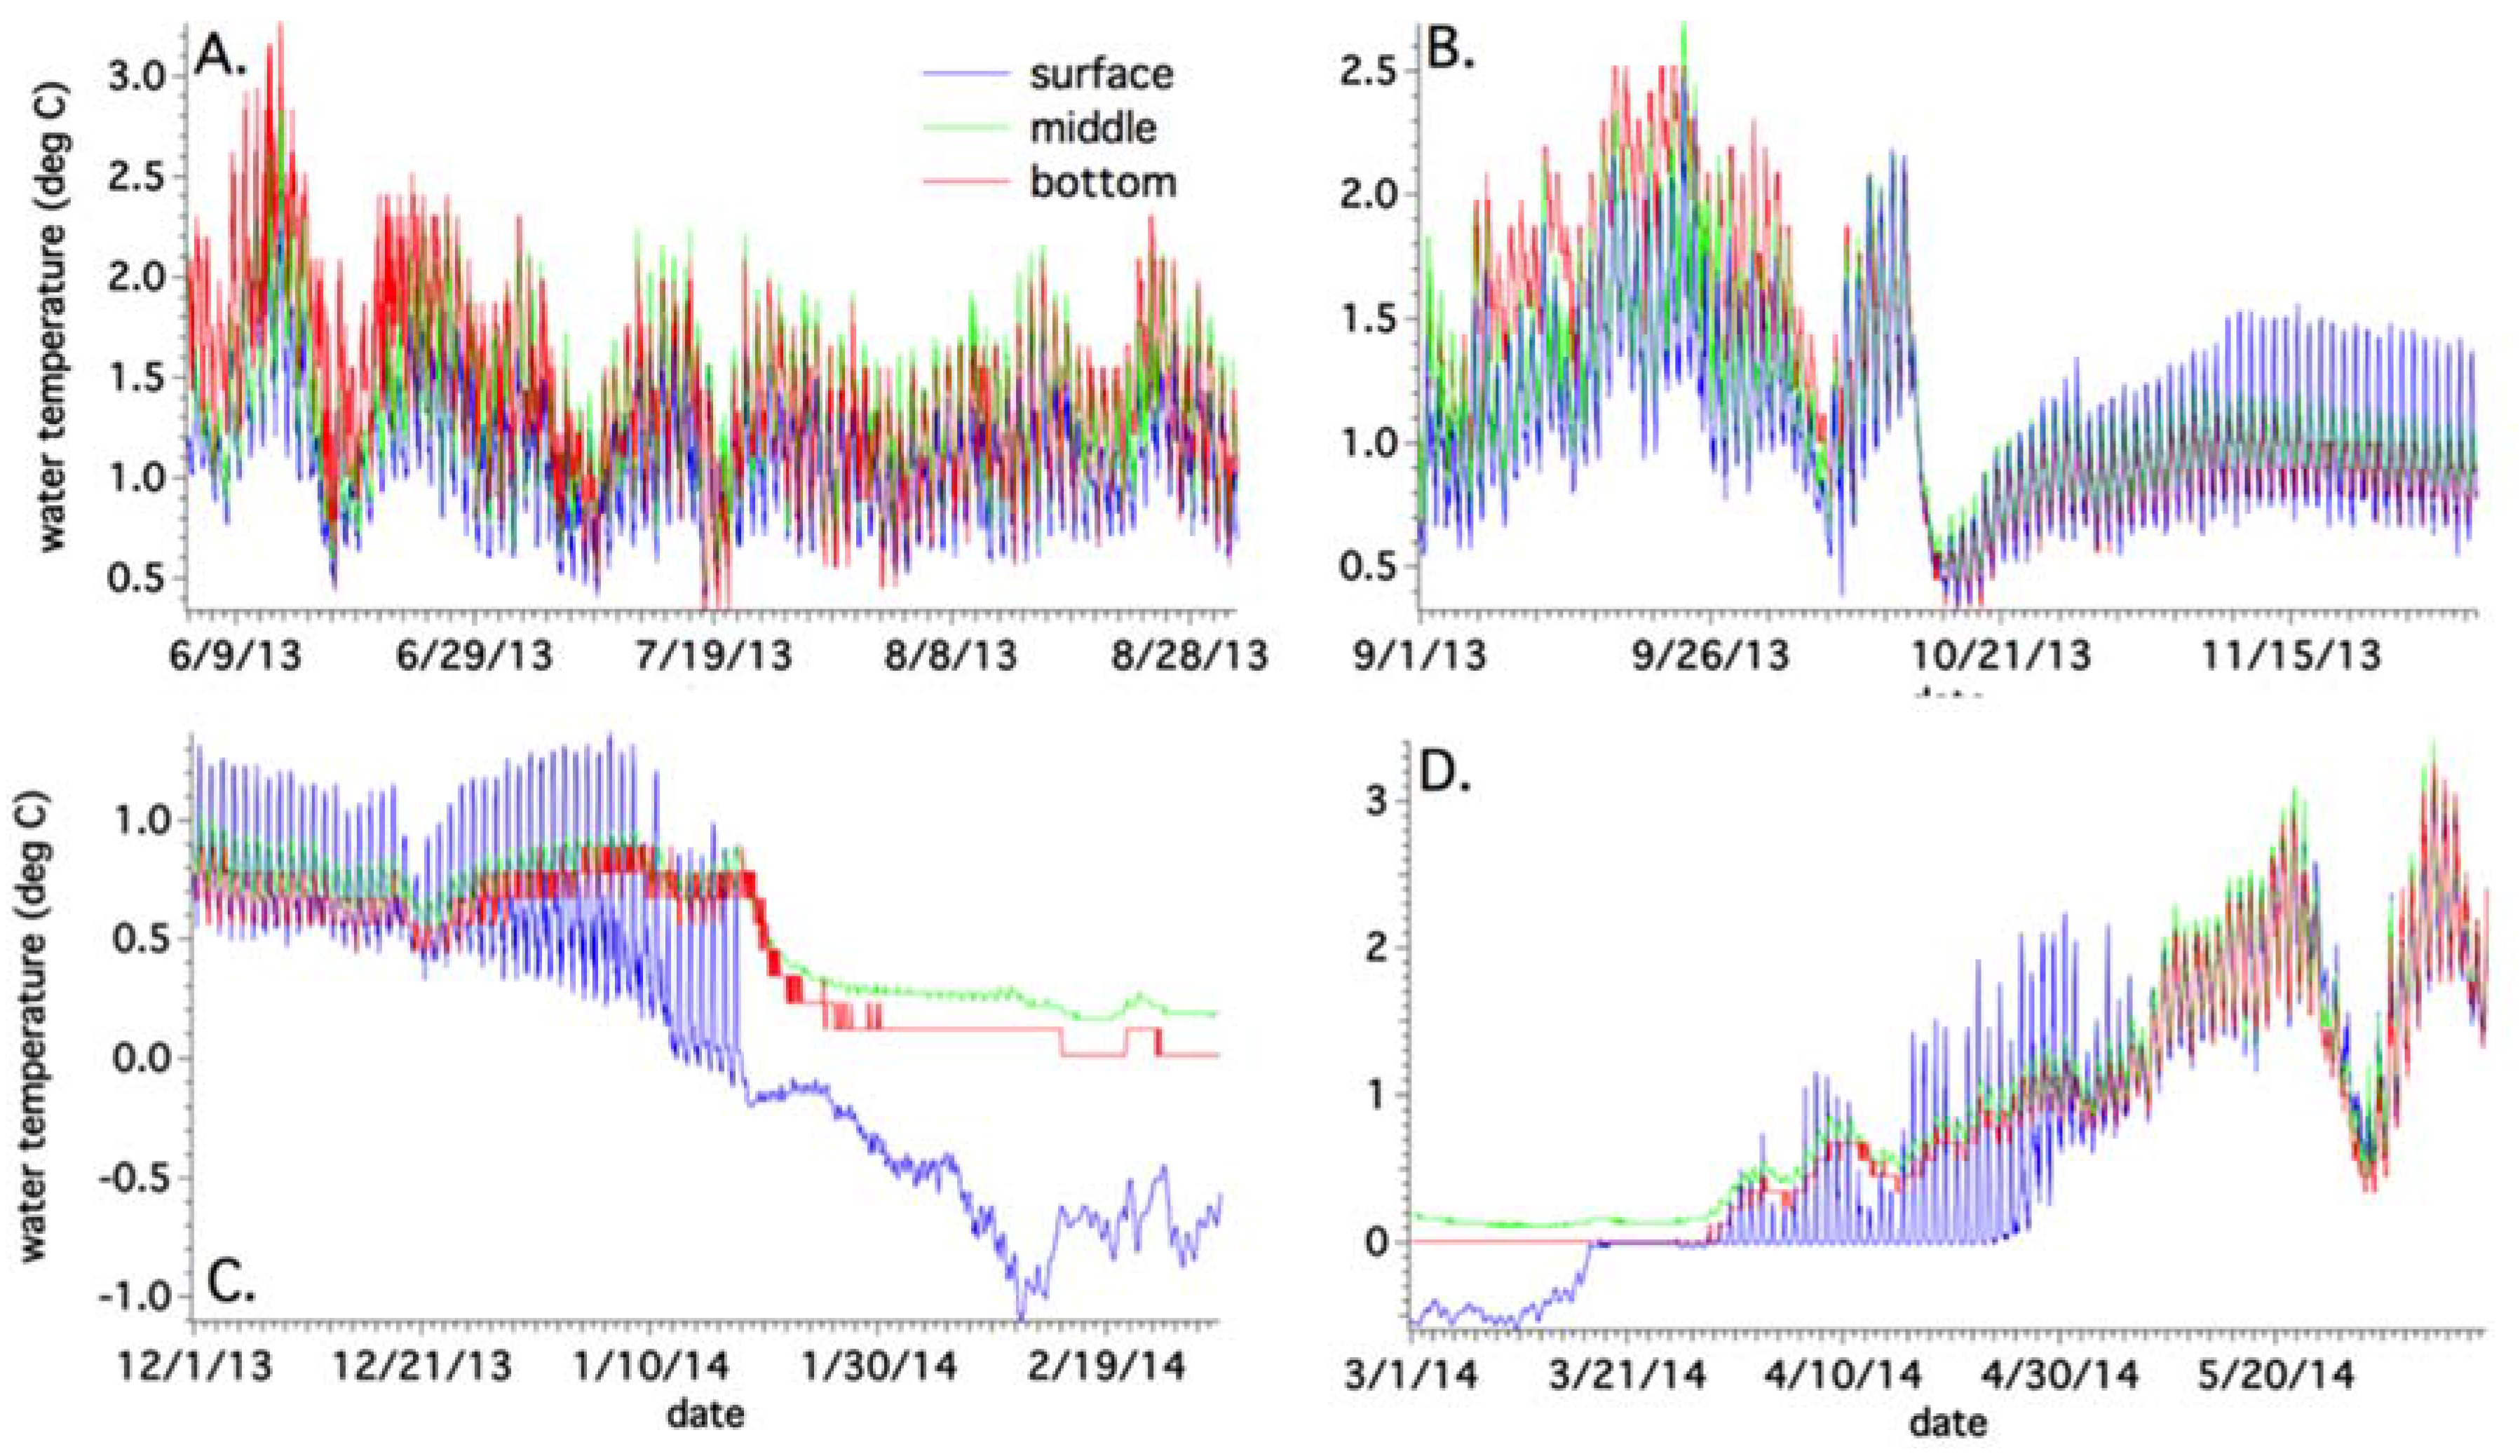
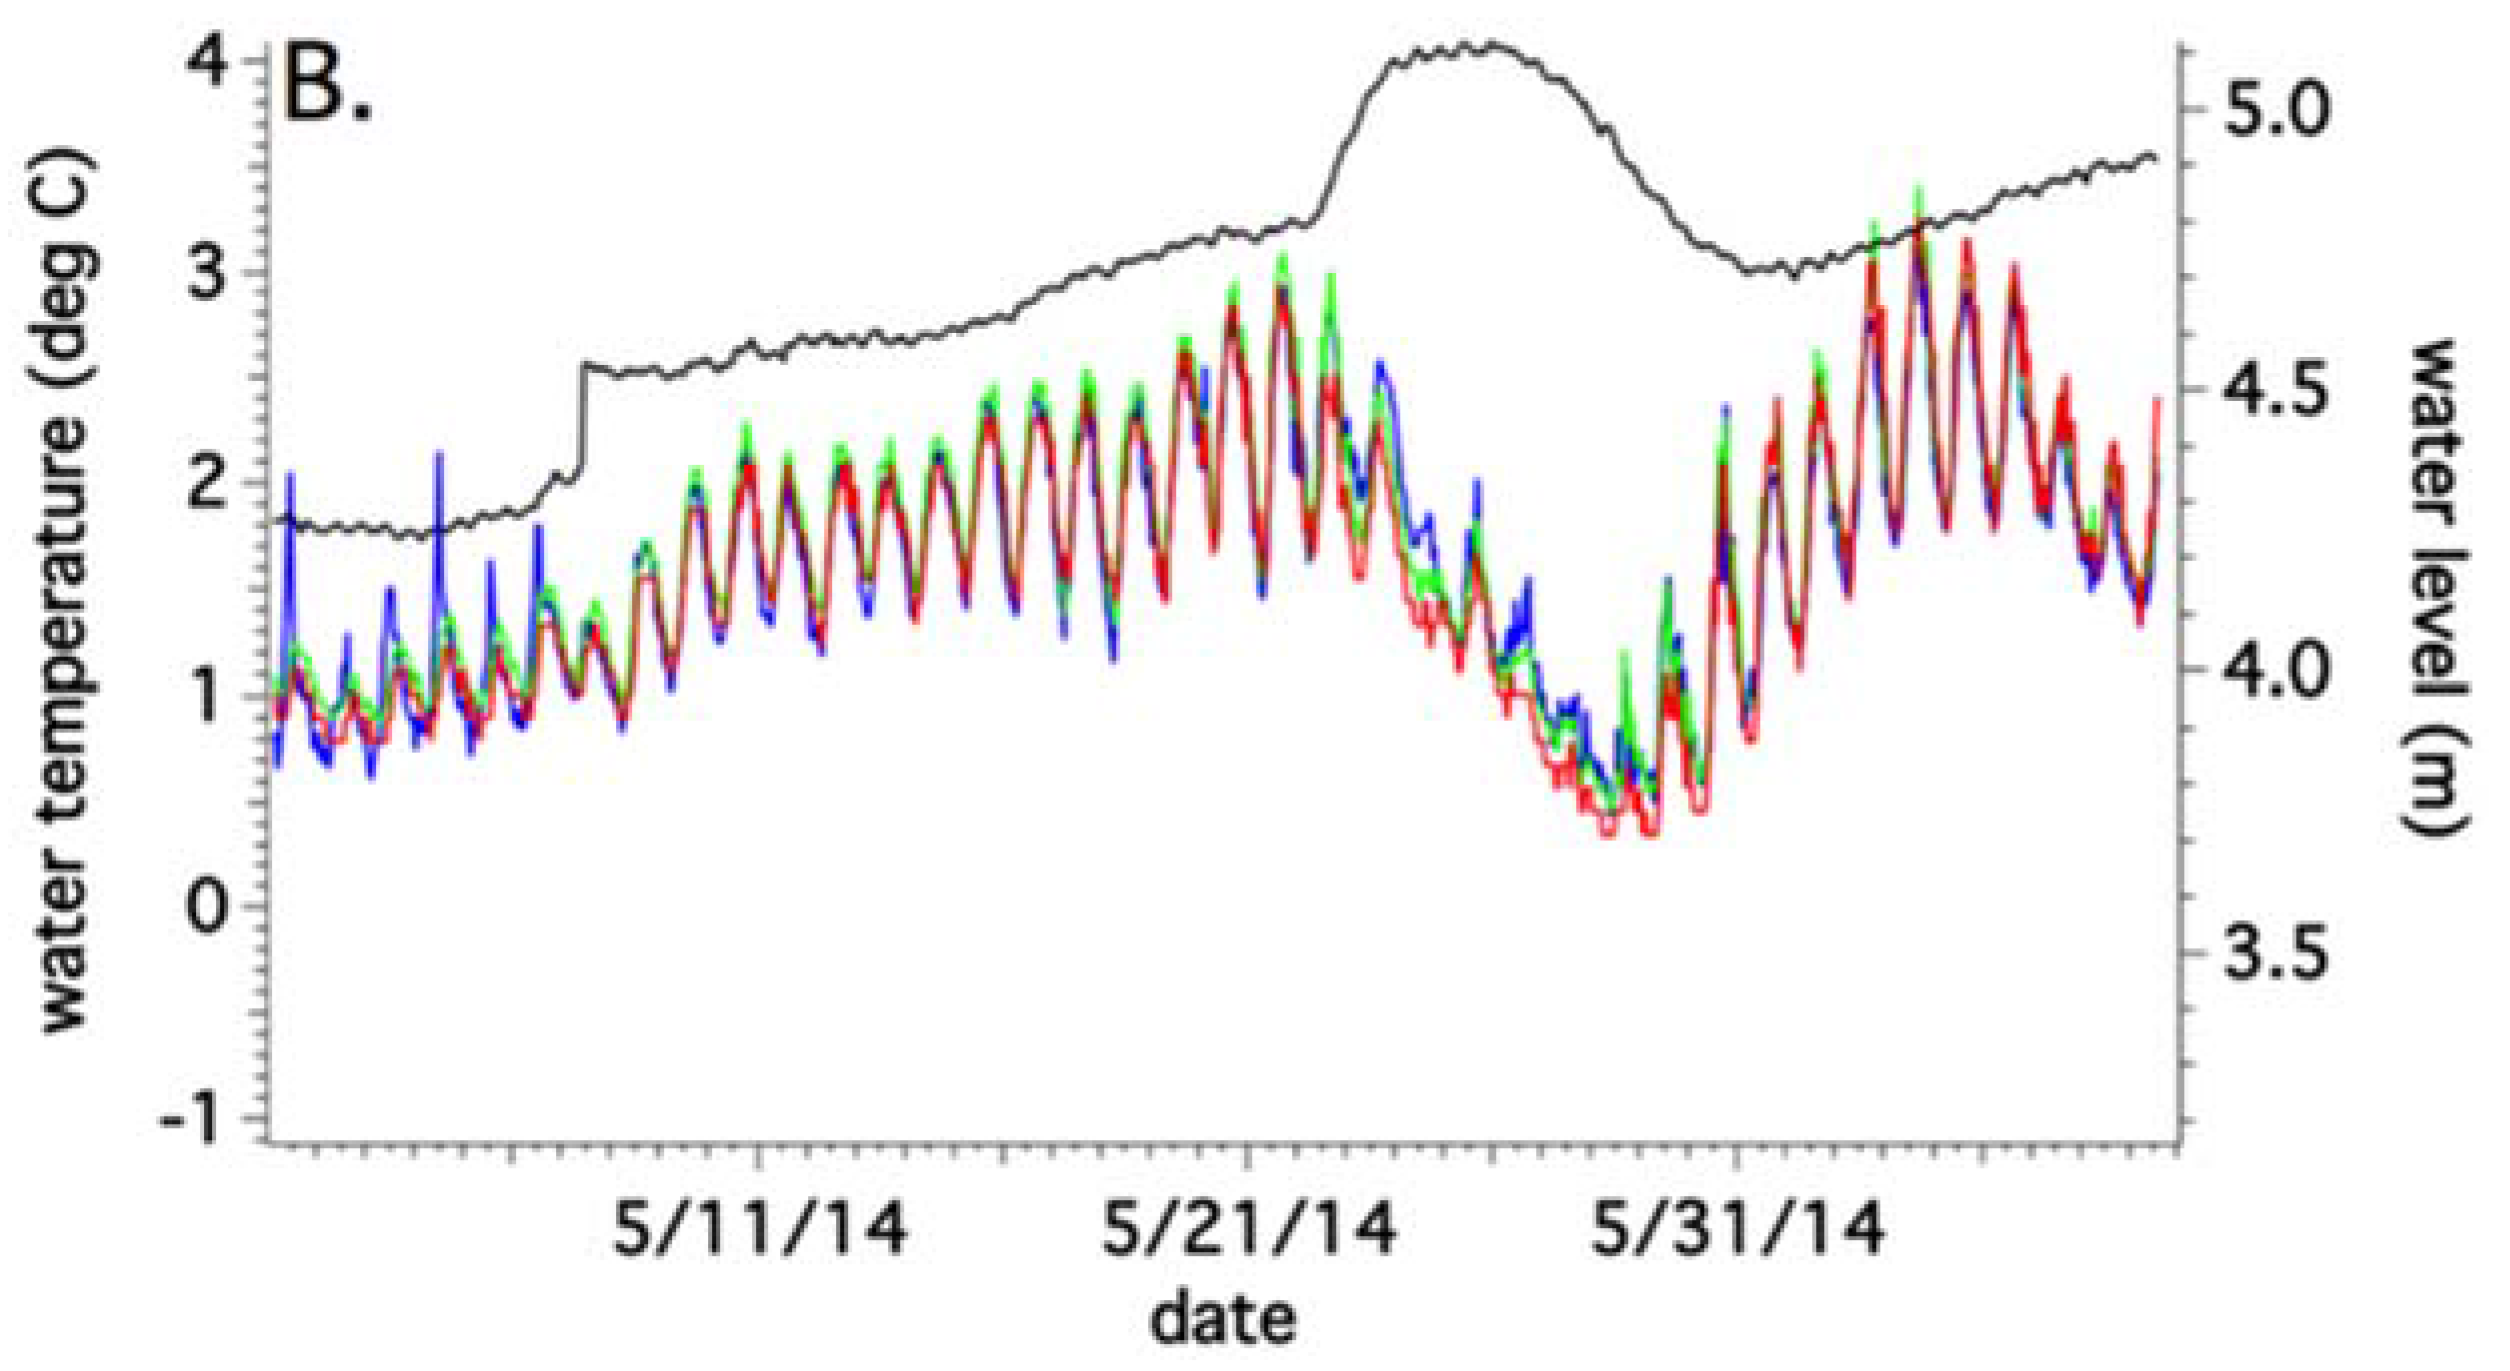
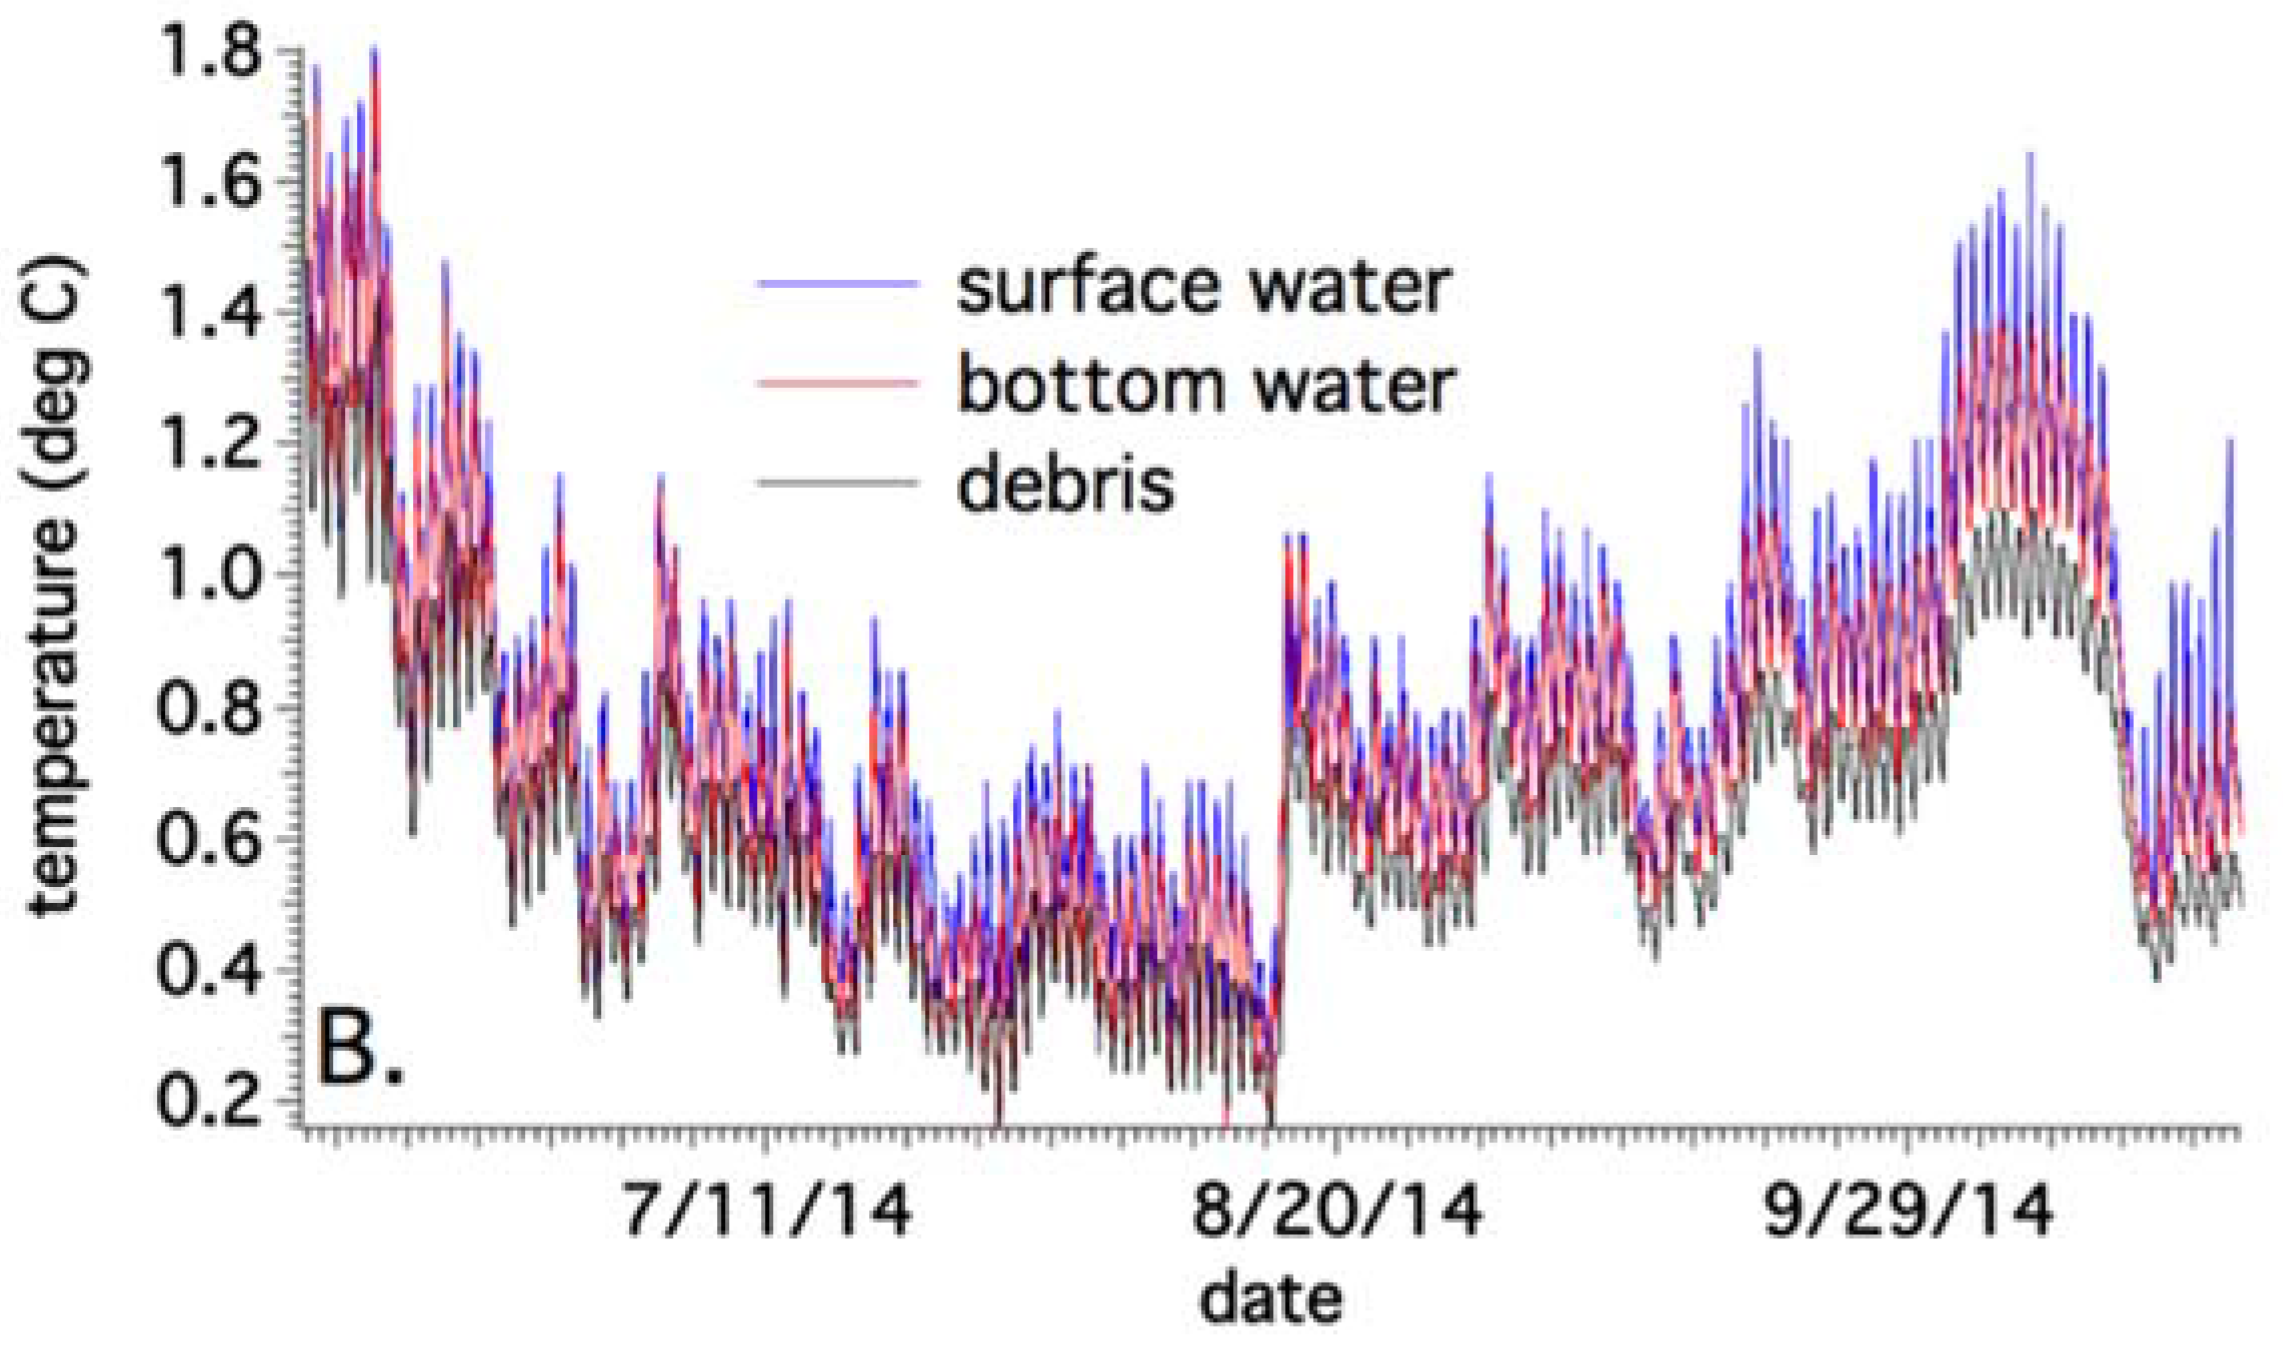
4.3. Annual Temperature Variations
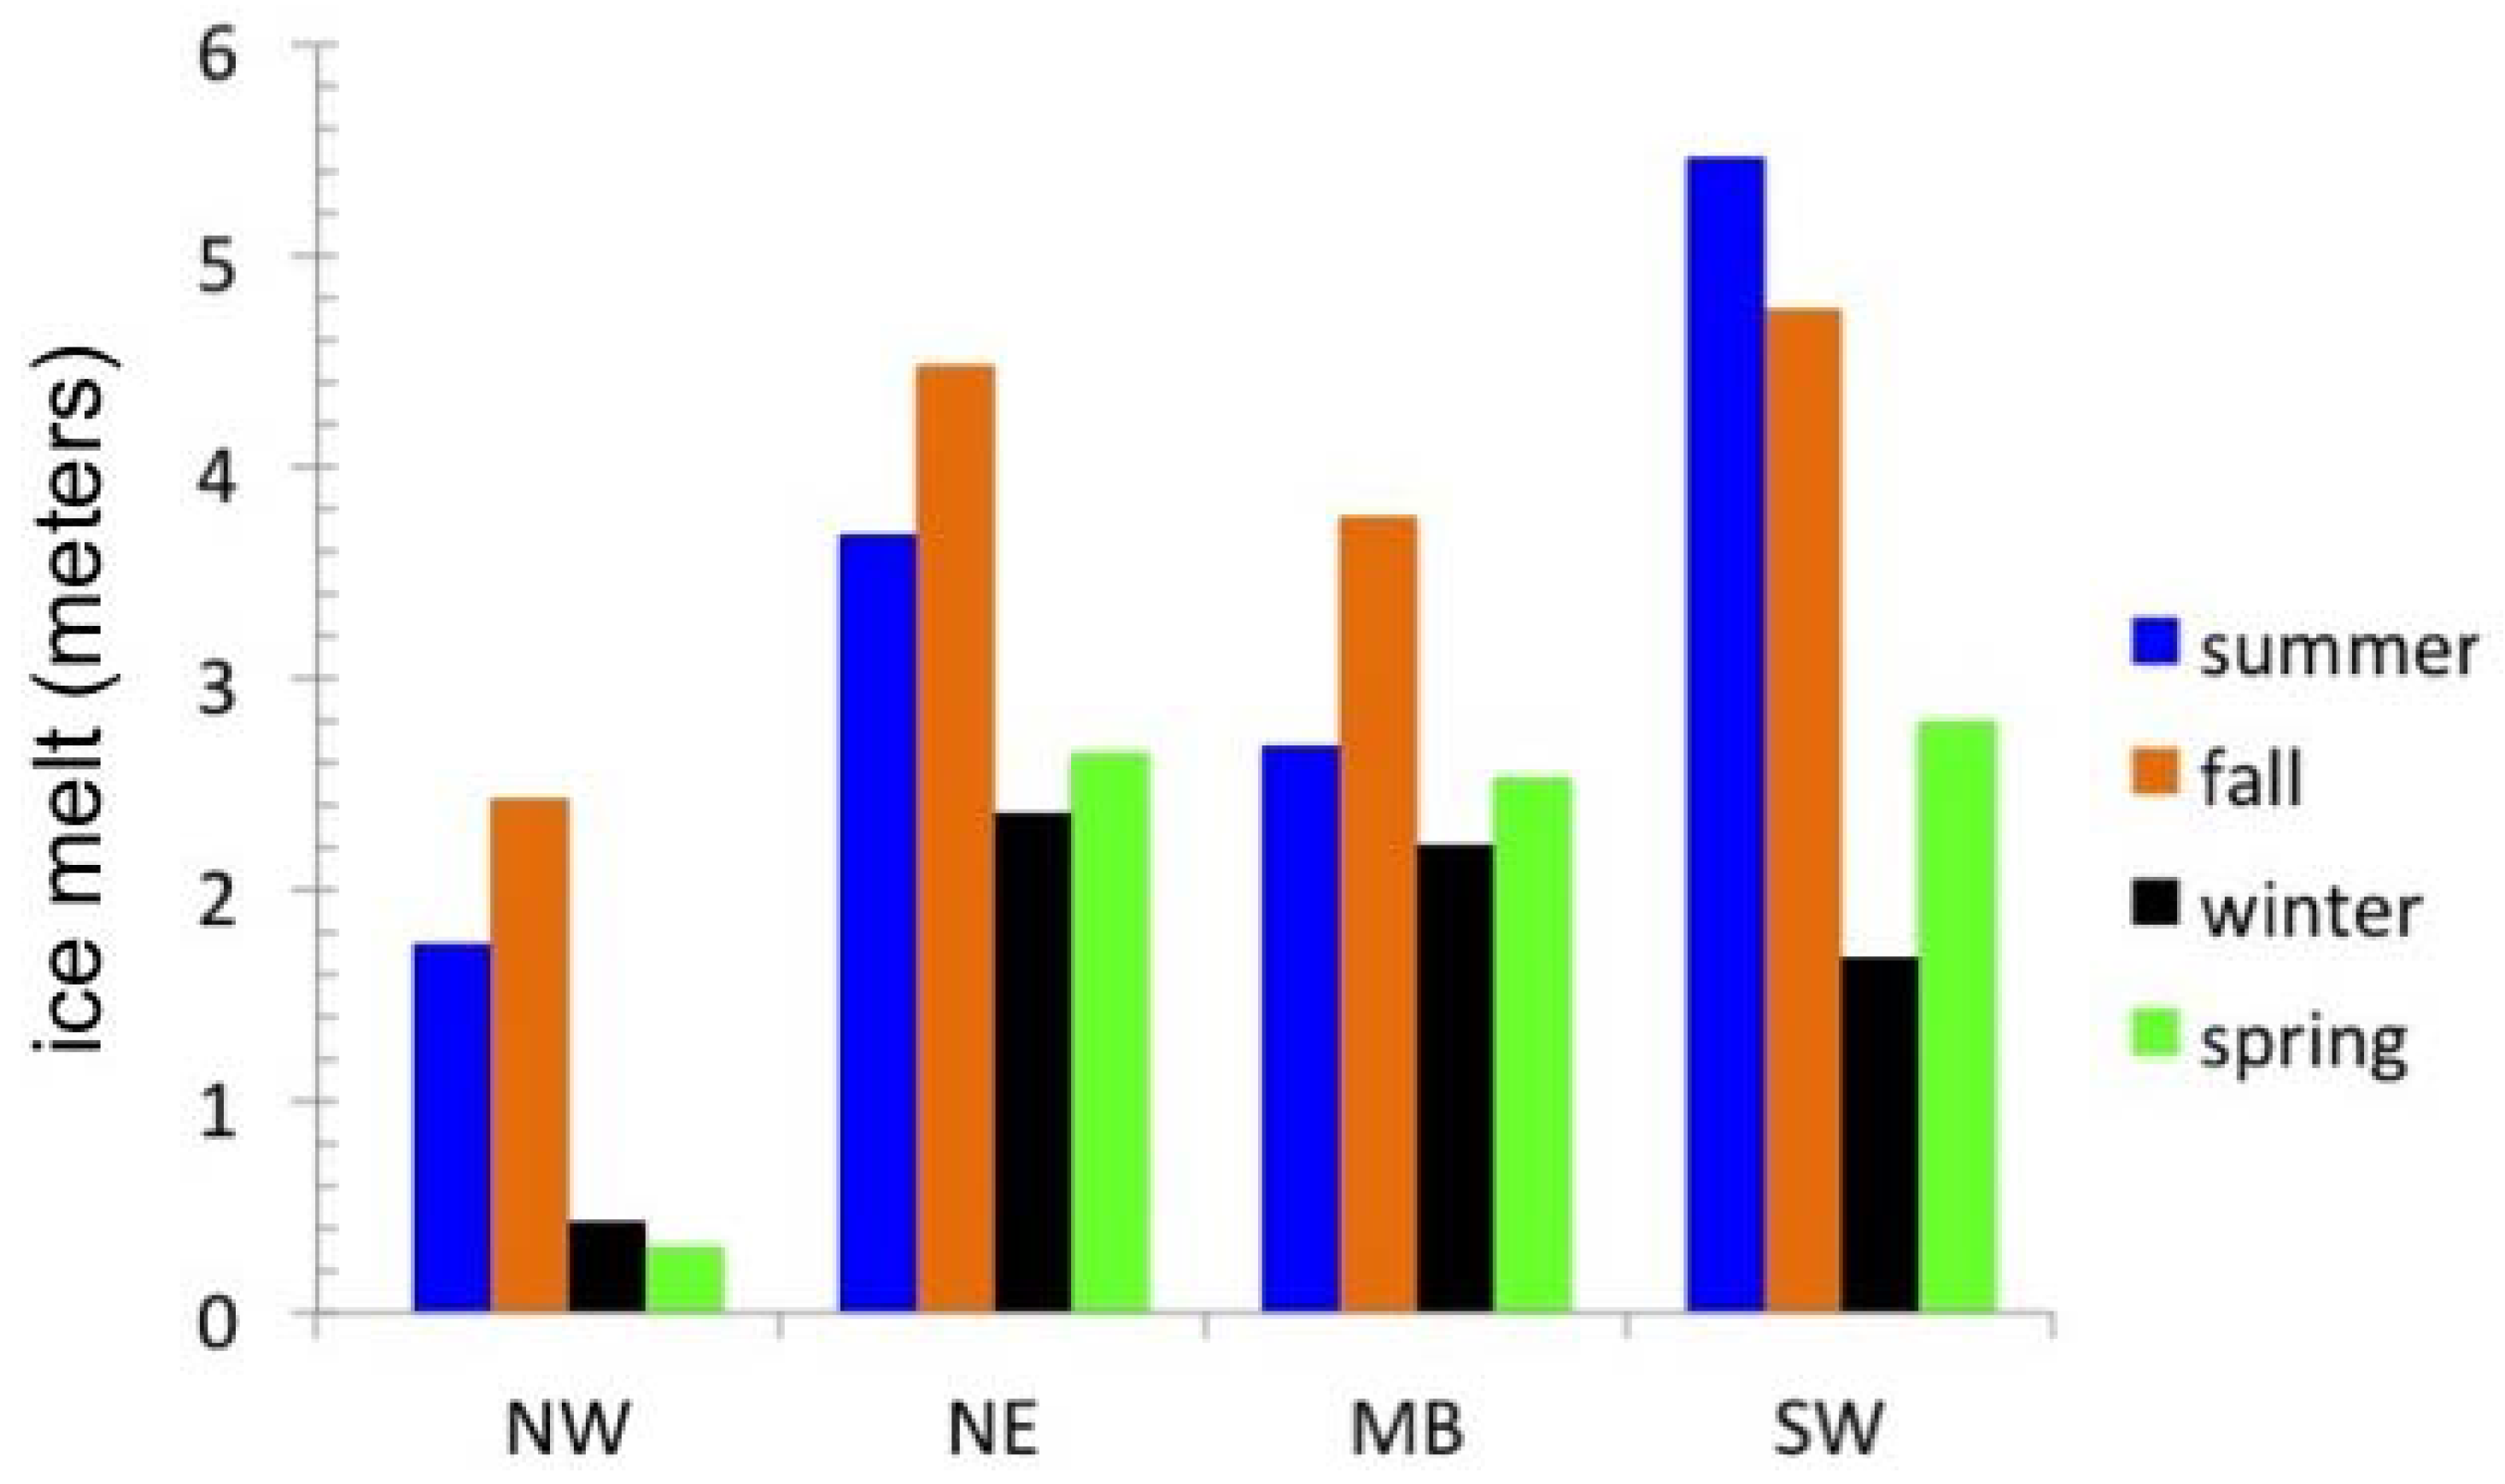
4.4. Sediment Properties and Ice Melt Rates
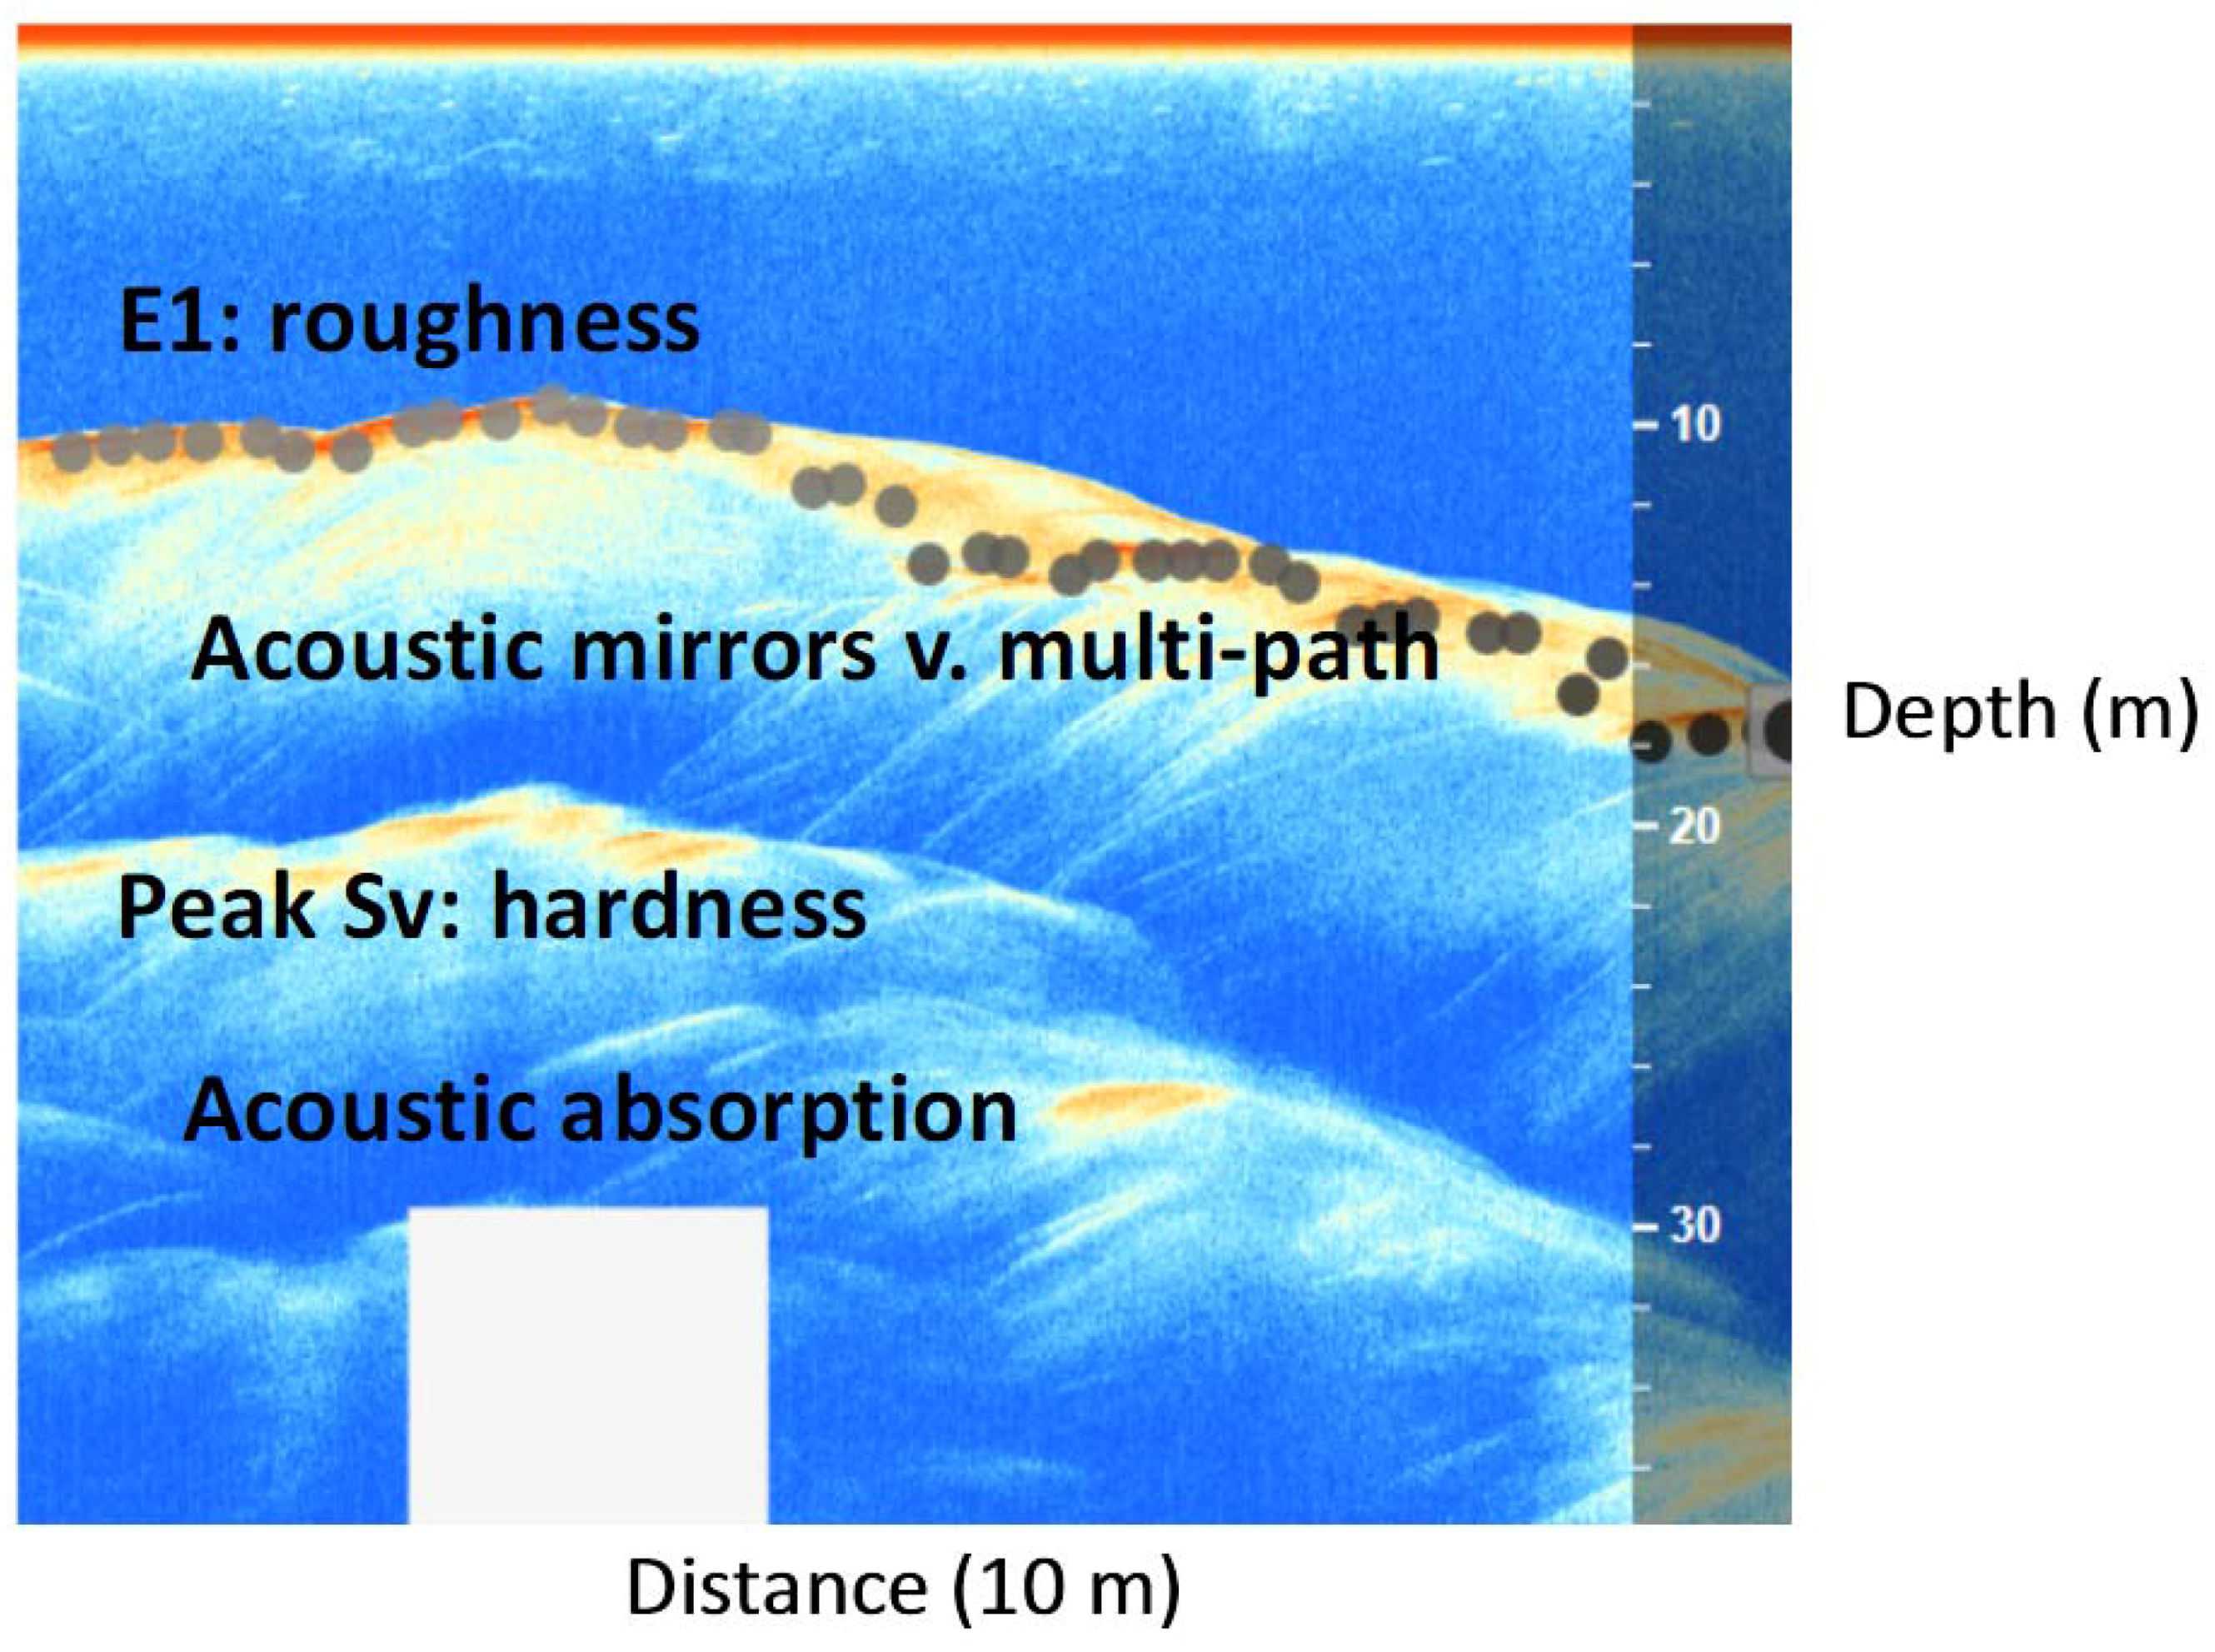
4.5. Sonar and Structure
5. Discussion
5.1. Sub-Basins of Spillway
5.2. Tsho Rolpa, Imja and Spillway
6. Conclusions
Supplementary Materials
Acknowledgments
Conflicts of Interest
References
- Yamada, T. Glacier Lake and Its Outburst Flood in the Nepal Himalaya. Monograph No. 1. Data Centre for Glacier Research; Japanese Society of Snow and Ice: Tokyo, Japan, 1998; p. 96. [Google Scholar]
- Komori, J. Recent expansion of glacial lakes in Bhutan Himalayas. Quat. Int. 2008, 184, 177–186. [Google Scholar] [CrossRef]
- Sakai, A.; Nishimura, K.; Kadota, T.; Takeuchi, T. Onset of calving at supraglacial lakes on debris-covered glaciers of the Nepal Himalaya. J. Glaciol. 2009, 55, 909–917. [Google Scholar] [CrossRef]
- Thompson, S.; Benn, D.I.; Dennis, K.; Luckman, A. A rapidly growing moraine dammed glacial lake on Ngozumpa Glacier, Nepal. Geomorphology 2012, 75, 266–280. [Google Scholar] [CrossRef]
- Shrestha, A.B.; Wake, C.P.; Mayewski, P.A.; Dibb, J.E. Maximum temperature trends in the Himalaya and vicinity: An analysis based on temperature records from Nepal for the period 1971–94. J. Clim. 1999, 12, 2775–2786. [Google Scholar] [CrossRef]
- Kadota, T. Report for the Field Investigation on the Tsho Rolpa Glacier Lake, Rolwaling Valley, February 1993–June 1994; WECS: Kathmandu, Nepal, 1994. [Google Scholar]
- Richardson, S.D.; Reynolds, J.M. An overview of glacial hazards in the Himalayas. Quat. Int. 2000, 65, 31–47. [Google Scholar] [CrossRef]
- Reynolds, J.M. On the Formation of Supraglacial Lakes on Debris-Covered Glaciers. Proceedings of Symposium at Seattle 2000—Debris Covered Glaciers, Seattle, WA, USA, September 2000; International Association of Hydrological Sciences Publication: Seattle, WA, USA, 2000; Volume 264, pp. 153–161. [Google Scholar]
- Quincey, D.J.; Richardson, S.D.; Luckman, A.; Lucas, R.M.; Reynolds, J.M.; Hambrey, M.J.; Glasser, N.F. Early recognition of glacial lake hazards in the Himalaya using remote sensing datasets. Glob. Planet. Chang. 2007, 56, 137–152. [Google Scholar] [CrossRef]
- Chikita, K.A.; Jha, J.; Yamada, T. Hydrodynamics of a supraglacial lake and its effect on the basin expansion: Tsho Rolpa, Rolwaling Valley, Nepal Himalaya. Arct. Antarct. Alp. Res. 1999, 31, 58–70. [Google Scholar] [CrossRef]
- Chikita, K.A.; Jha, J.; Yamada, T. Sedimentary effects on the expansion of a Himalayan supraglacial lake. Glob. Planet. Chang. 2001, 28, 23–34. [Google Scholar] [CrossRef]
- Watanabe, T.; Kameyama, S.; Sato, T. Imja glacier dead-ice melt rates and changes in a supraglacial lake, 1989–1994, Khumbu Himal, Nepal: Danger of lake drainage. Mt. Res. Dev. 1995, 15, 293–300. [Google Scholar] [CrossRef]
- Sakai, A.; Chikita, K.; Yamada, T. Expansion of a moraine-dammed lake, Tsho Rolpa, in Rolwaling Himal, Nepal Himalaya. Limnol. Oceanogr. 2000, 45, 1401–1408. [Google Scholar] [CrossRef]
- Fujita, K.; Sakai, A.; Nuimura, T.; Yamaguchi, S.; Sharma, R.R. Recent changes in Imja glacial lake and its damming moraine in the Nepal Himalaya revealed by in situ surveys and multi-temporal ASTER imagery. Environ. Res. Lett. 2009, 4, 045205. [Google Scholar] [CrossRef]
- Hambrey, M.J.; Quincey, D.J.; Glasser, N.F.; Reynolds, J.M.; Richardson, S.D.; Clemmens, S. Sedimentological, geomorphological and dynamic context of debris mantled glaciers, Mount Everest region, Nepal. Quat. Sci. Rev. 2008, 27, 2361–2389. [Google Scholar] [CrossRef]
- Benn, D.I.; Bolch, T.; Hands, K.; Gulley, J.; Luckman, A.; Nicholson, L.I.; Quincey, D.; Thompson, S.; Toumi, R.; Wiseman, S. Response of debris-covered glaciers in the Mt. Everest region to recent warming, and implications for outburst flood hazards. Earth-Sci. Rev. 2012, 114, 156–174. [Google Scholar]
- Benn, D.I.; Wiseman, S.; Hands, K.A. Growth and drainage of supraglacial lakes on the debris-mantled Ngozumpa Glacier, Khumbu Himal, Nepal. J. Glaciol. 2001, 47, 626–638. [Google Scholar] [CrossRef]
- Thompson, S.; Benn, D.I.; Mertes, J.; Luckman, A. Stagnation and mass loss on a Himalayan debris-covered glacier: Processes, patterns and rates. J. Glaciol. 2016, 62, 467–485. [Google Scholar] [CrossRef]
- Nicholson, L.A.; Benn, D.I. Calculating ice melt beneath a debris layer using meteorological data. J. Glaciol. 2006, 52, 463–470. [Google Scholar] [CrossRef]
- Chikita, K.A.; Yamada, T. The expansion of Himalayan glacial lakes due to global warming: Field observations and numerical simulation. In Regional Hydrological Impacts of Climatic Change – Impact Assessment and Decision Making in Seventh IAHS Scientific Assembly; IAHS Publication 295: Foz do Iguacu, Brazil, 2005. [Google Scholar]
- Preisendorfer, R.W. Secchi disk science: Visual optics of natural waters. Limnol. Oceanogr. 1986, 31, 909–926. [Google Scholar] [CrossRef]
- Chivers, R.C.; Emerson, N.; Burns, D.R. New acoustic processing for underway surveying. Hydrogr. J. 1990, 56, 8–17. [Google Scholar]
- Kloser, R.J.; Bax, N.J.; Ryan, T.; Williams, A.; Barker, B.A. Remote sensing of seabed types in the Australian Southeast Fishery; development and application of normal-incident acoustic techniques and associated ground truthing. Mar. Freshw. Res. 2001, 52, 475–489. [Google Scholar] [CrossRef]
- Smith, A.H.; Lingas, E.O.; Rahman, M. Contamination of drinking water by arsenic in Bangladesh: A public health emergency. Bull. World Health Organ. 2000, 78, 1093–1103. [Google Scholar] [PubMed]
- Sakai, A.; Takeuchi, N.; Fujita, K.; Nakawo, M. Role of Supraglacial Ponds in the Ablation Process of a Debris-Covered Glacier in the Nepal Himalayas. Proceedings of Symposium at Seattle 2000—Debris Covered Glaciers, Seattle, WA, USA, September 2000; International Association of Hydrological Sciences: Seattle, WA, USA, 2000; Volume 264, pp. 119–130. [Google Scholar]
- Kraus, H. An Energy Balance Model for Ablation in Mountainous Areas. Proceedings of Snow and Ice Symposium, Moscow, Russia, August 1971; IAHS Publication: Moscow, Russia, 1975; pp. 74–82. [Google Scholar]
- Nakawo, M.; Young, G.J. Field experiments to determine the effect of a debris layer on ablation of glacier ice. Ann. Glaciol. 1981, 2, 85–91. [Google Scholar] [CrossRef]
- Röhl, K. Characteristics and evolution of supraglacial ponds on debris-covered Tasman Glacier, New Zealand. J. Glaciol. 2008, 54, 867–880. [Google Scholar] [CrossRef]


| Samples | Si (ppm) | Fe (ppm) | Mg (ppm) | Ca (ppm) | Al (ppm) | Na (ppm) | As (ppm) | SSC (g/L) |
|---|---|---|---|---|---|---|---|---|
| NW basin | 14.88 | 7.00 | 2.80 | 10.43 | 8.00 | 12.10 | 13.465 | 0.43 |
| NW inflow | 18.64 | 0.15 | 0.24 | 12.93 | 0.31 | 0.61 | 10.873 | 0.22 |
| Ice wall | 4.32 | 0.12 | 0.08 | 0.64 | 0.20 | 0.23 | DL | 0.07 |
| NE basin | 20.81 | 5.62 | 1.93 | 10.73 | 10.03 | 16.23 | 13.763 | 0.21 |
| NE inflow | 12.93 | 0.02 | 0.33 | 15.73 | 0.04 | 0.34 | 0.880 | 0.06 |
| Main basin | 16.57 | 4.69 | 1.71 | 10.00 | 8.00 | 25.13 | 16.363 | 0.40 |
| SW basin | 22.18 | 6.18 | 2.14 | 11.15 | 10.99 | 19.77 | 14.393 | 0.40 |
| Outflow | 15.96 | 6.00 | 3.00 | 11.08 | 9.00 | 13.60 | 14.681 | 0.46 |
| Blue lake | 2.92 | 0.19 | 0.27 | 20.06 | 0.40 | 19.73 | 45.456 | 0.04 |
| Sub-basin | pH | Conductivity (µS) | Optical Depth (cm) |
|---|---|---|---|
| NW basin | 8.59 | 68.87 | 18 |
| NE basin | 8.39 | 70.37 | 32 |
| Main basin | 8.21 | 69.23 | 17.5 |
| SW basin | 8.32 | 68.47 | 15 |
| Sub-basin | Debris Thickness (m) | Seasonal Bottom Ice Melt (in Meters) | |||
|---|---|---|---|---|---|
| Summer (m) | Fall (m) | Winter (m) | Spring (m) | ||
| NW sub-basin | 0.01 | 2.1 | 2.92 | 0.51 | 0.37 |
| 0.02 | 1.05 | 1.46 | 0.26 | 0.19 | |
| 0.05 | 0.42 | 0.58 | 0.1 | 0.07 | |
| 0.1 | 0.21 | 0.29 | 0.05 | 0.04 | |
| 0.15 | 0.14 | 0.19 | 0.03 | 0.02 | |
| 0.3 | 0.07 | 0.1 | 0.02 | 0.01 | |
| 0.5 | 0.04 | 0.06 | 0.01 | 0.01 | |
| 1 | 0.02 | 0.03 | 0.01 | 0 | |
| Main sub-basin | 0.01 | 3.23 | 4.53 | 2.66 | 3.02 |
| 0.02 | 1.6 | 2.25 | 1.31 | 1.51 | |
| 0.05 | 0.64 | 0.9 | 0.52 | 0.52 | |
| 0.1 | 0.32 | 0.45 | 0.26 | 0.3 | |
| 0.15 | 0.21 | 0.3 | 0.17 | 0.2 | |
| 0.3 | 0.11 | 0.15 | 0.09 | 0.1 | |
| 0.5 | 0.06 | 0.09 | 0.05 | 0.06 | |
| 1 | 0.03 | 0.04 | 0.03 | 0.03 | |
| NE sub-basin | 0.01 | 4.42 | 5.39 | 2.84 | 3.18 |
| 0.02 | 2.21 | 2.67 | 1.4 | 1.58 | |
| 0.05 | 0.88 | 1.07 | 0.56 | 0.63 | |
| 0.1 | 0.44 | 0.53 | 0.28 | 0.32 | |
| 0.15 | 0.29 | 0.36 | 0.19 | 0.21 | |
| 0.3 | 0.15 | 0.18 | 0.09 | 0.11 | |
| 0.5 | 0.09 | 0.11 | 0.06 | 0.06 | |
| 1 | 0.04 | 0.05 | 0.03 | 0.03 | |
| SW sub-basin | 0.01 | 6.58 | 5.71 | 2.02 | 3.37 |
| 0.02 | 3.29 | 2.85 | 1.01 | 1.68 | |
| 0.05 | 1.32 | 1.14 | 0.4 | 0.67 | |
| 0.1 | 0.66 | 0.57 | 0.2 | 0.34 | |
| 0.15 | 0.44 | 0.38 | 0.13 | 0.22 | |
| 0.3 | 0.22 | 0.19 | 0.07 | 0.11 | |
| 0.5 | 0.13 | 0.11 | 0.04 | 0.07 | |
| 1 | 0.07 | 0.06 | 0.02 | 0.03 | |
© 2017 by the author. Licensee MDPI, Basel, Switzerland. This article is an open access article distributed under the terms and conditions of the Creative Commons Attribution (CC BY) license (http://creativecommons.org/licenses/by/4.0/).
Share and Cite
Horodyskyj, U.N. Thermal and Physical Investigations into Lake Deepening Processes on Spillway Lake, Ngozumpa Glacier, Nepal. Water 2017, 9, 362. https://doi.org/10.3390/w9050362
Horodyskyj UN. Thermal and Physical Investigations into Lake Deepening Processes on Spillway Lake, Ngozumpa Glacier, Nepal. Water. 2017; 9(5):362. https://doi.org/10.3390/w9050362
Chicago/Turabian StyleHorodyskyj, Ulyana Nadia. 2017. "Thermal and Physical Investigations into Lake Deepening Processes on Spillway Lake, Ngozumpa Glacier, Nepal" Water 9, no. 5: 362. https://doi.org/10.3390/w9050362
APA StyleHorodyskyj, U. N. (2017). Thermal and Physical Investigations into Lake Deepening Processes on Spillway Lake, Ngozumpa Glacier, Nepal. Water, 9(5), 362. https://doi.org/10.3390/w9050362