Abstract
The upper reach of the Yangtze River is an ecologically sensitive region where water loss, soil erosion, and nonpoint source (NPS) pollution are serious issues. In this drainage area, regosol is the most widely distributed soil type. Cultivation on regosol is extensive and total nitrogen (TN) has become a common NPS pollutant. Artificial rainfall experiments were conducted to reveal the influence mechanisms of rainfall and terrain on TN losses from regosol. The results showed that there were positive correlations between precipitations and TN loads but negative ones between precipitations and TN concentrations. Furthermore, negative correlations were more obvious on fields with slopes of 5° and 25° than on other slopes. With increasing rainfall intensity, TN loads rose simultaneously. However, TN concentration in runoff-yielding time presented a decline over time. As far as terrain was concerned, TN loads grew generally but not limitlessly when slopes increased. Similarly, TN concentrations also rose with rising slopes; upward trends were more obvious for steeper slopes. Furthermore, the initial runoff-yielding time became longer for steeper slopes and the differences under various rainfall intensity conditions diminished gradually.
1. Introduction
With economic and social development, water contamination has become a serious problem in many countries [1,2,3]. With control of point source contamination, nonpoint source (NPS) contamination has become dominant cause of water contamination due to its multi-source, wide distribution, the difficulty of controlling it and so on [4,5,6]. Nowadays, identifying effect factors and their mechanisms of influence on NPS pollutant exports have become research hotspots in the field of NPS pollution control [7,8,9].
Rainfall is known as the driving force of NPS pollution, while terrain is the main effect factor in the generation and transport of NPS pollutants [10,11]. Where NPS pollutants are concerned, total nitrogen (TN) is critical, being dissolved in runoff and adsorbed in sediment with soil and water loss [12,13,14].
The Yangtze River is the third longest river in the world and the longest in China. Its drainage area accounts for 18.8% of the land area in China [15,16,17]. The upper reach of the Yangtze River is defined from the source of the Yangtze River to the Three Gorges Dam (the largest dam in the world) and with a length of 4504 km and a drainage area of 106 km2 [18]. Water pollution control for the upper reach of the Yangtze River plays a significant role in water and soil conservation, maintaining biodiversity, and ensuring water environment security in the whole river basin [19,20,21]. In the upper reach of the Yangtze River, regosol is the dominant soil; it is suitable for cultivation but erodible [22]. Therefore, understanding the influence mechanisms of rainfall and terrain on total nitrogen losses from regosol is essential for NPS pollution research, pollution control and the environmental protection of the Yangtze River’s water [23].
In recent decades, a great deal of research concerning the influence of rainfall and terrain on NPS nitrogen pollution has been carried out worldwide [24,25,26]. A comparative study of the effects of rainfall events on the removal of NPS nitrogen determined the efficiency ratio indexes, load summation and load regression in the Kyeong—a stream basin, South Korea [27]. Rainfall shortly after the surface application of poultry manure was shown to have the potential to significantly increase surface runoff TN concentration in Iowa, United States [28]. A study carried out in a typical rain field of black soil in Northeast China indicated that different tilling systems led to distinctively different concentrations of losses of water-soluble nitrogen and particulate nitrogen, and loss of water-soluble nitrogen and particulate nitrogen per unit area [29]. Land use, sediment and sand content play dominant roles in affecting NPS pollutant export and contribute to the high heterogeneity of TN in regosol in the Sichuan Province in the upper reach of the Yangtze River [30]. Wilson and Weng found that concentrations of TKN, nitrate, nitrite and TN in surface water depended heavily on the spatiotemporal distribution of land use/land cover in the Lake Calumet area near Chicago, United States [31]. However, previous studies have mostly concentrated on the effects of land use and sand content on nitrogen loss in watersheds, while the influence mechanisms of rainfall and terrain with respect to nitrogen losses have not been thoroughly discussed. Therefore, these influence mechanisms need to be better understood; one method involves artificial rainfall experiments on regosol under simulated rainfall and terrain conditions.
The objective of this study is to reveal the influence mechanisms of rainfall and terrain characteristics on TN losses from regosol. This research aims to reflect how TN losses from regosol are affected by rainfall and terrain characteristics such as precipitation, rainfall intensity, rainfall duration, and slope conditions. For this study, artificial rainfall experiments were conducted in which rainfall and terrain conditions were divided into different levels. The first part of this paper shows the relationships between rainfall conditions and TN load, TN concentration, and the initial runoff-yielding time. The effects of terrain conditions on TN load, TN concentration, and the initial runoff-yielding time will also be discussed. Our goal is to give researchers a reference in understanding transport processes, establishing simulation models, and identifying parameters for modeling NPS pollution. This research may also provide support for decision making by administrators of NPS pollution control and land management.
2. Materials and Methods
2.1. Experimental Materials
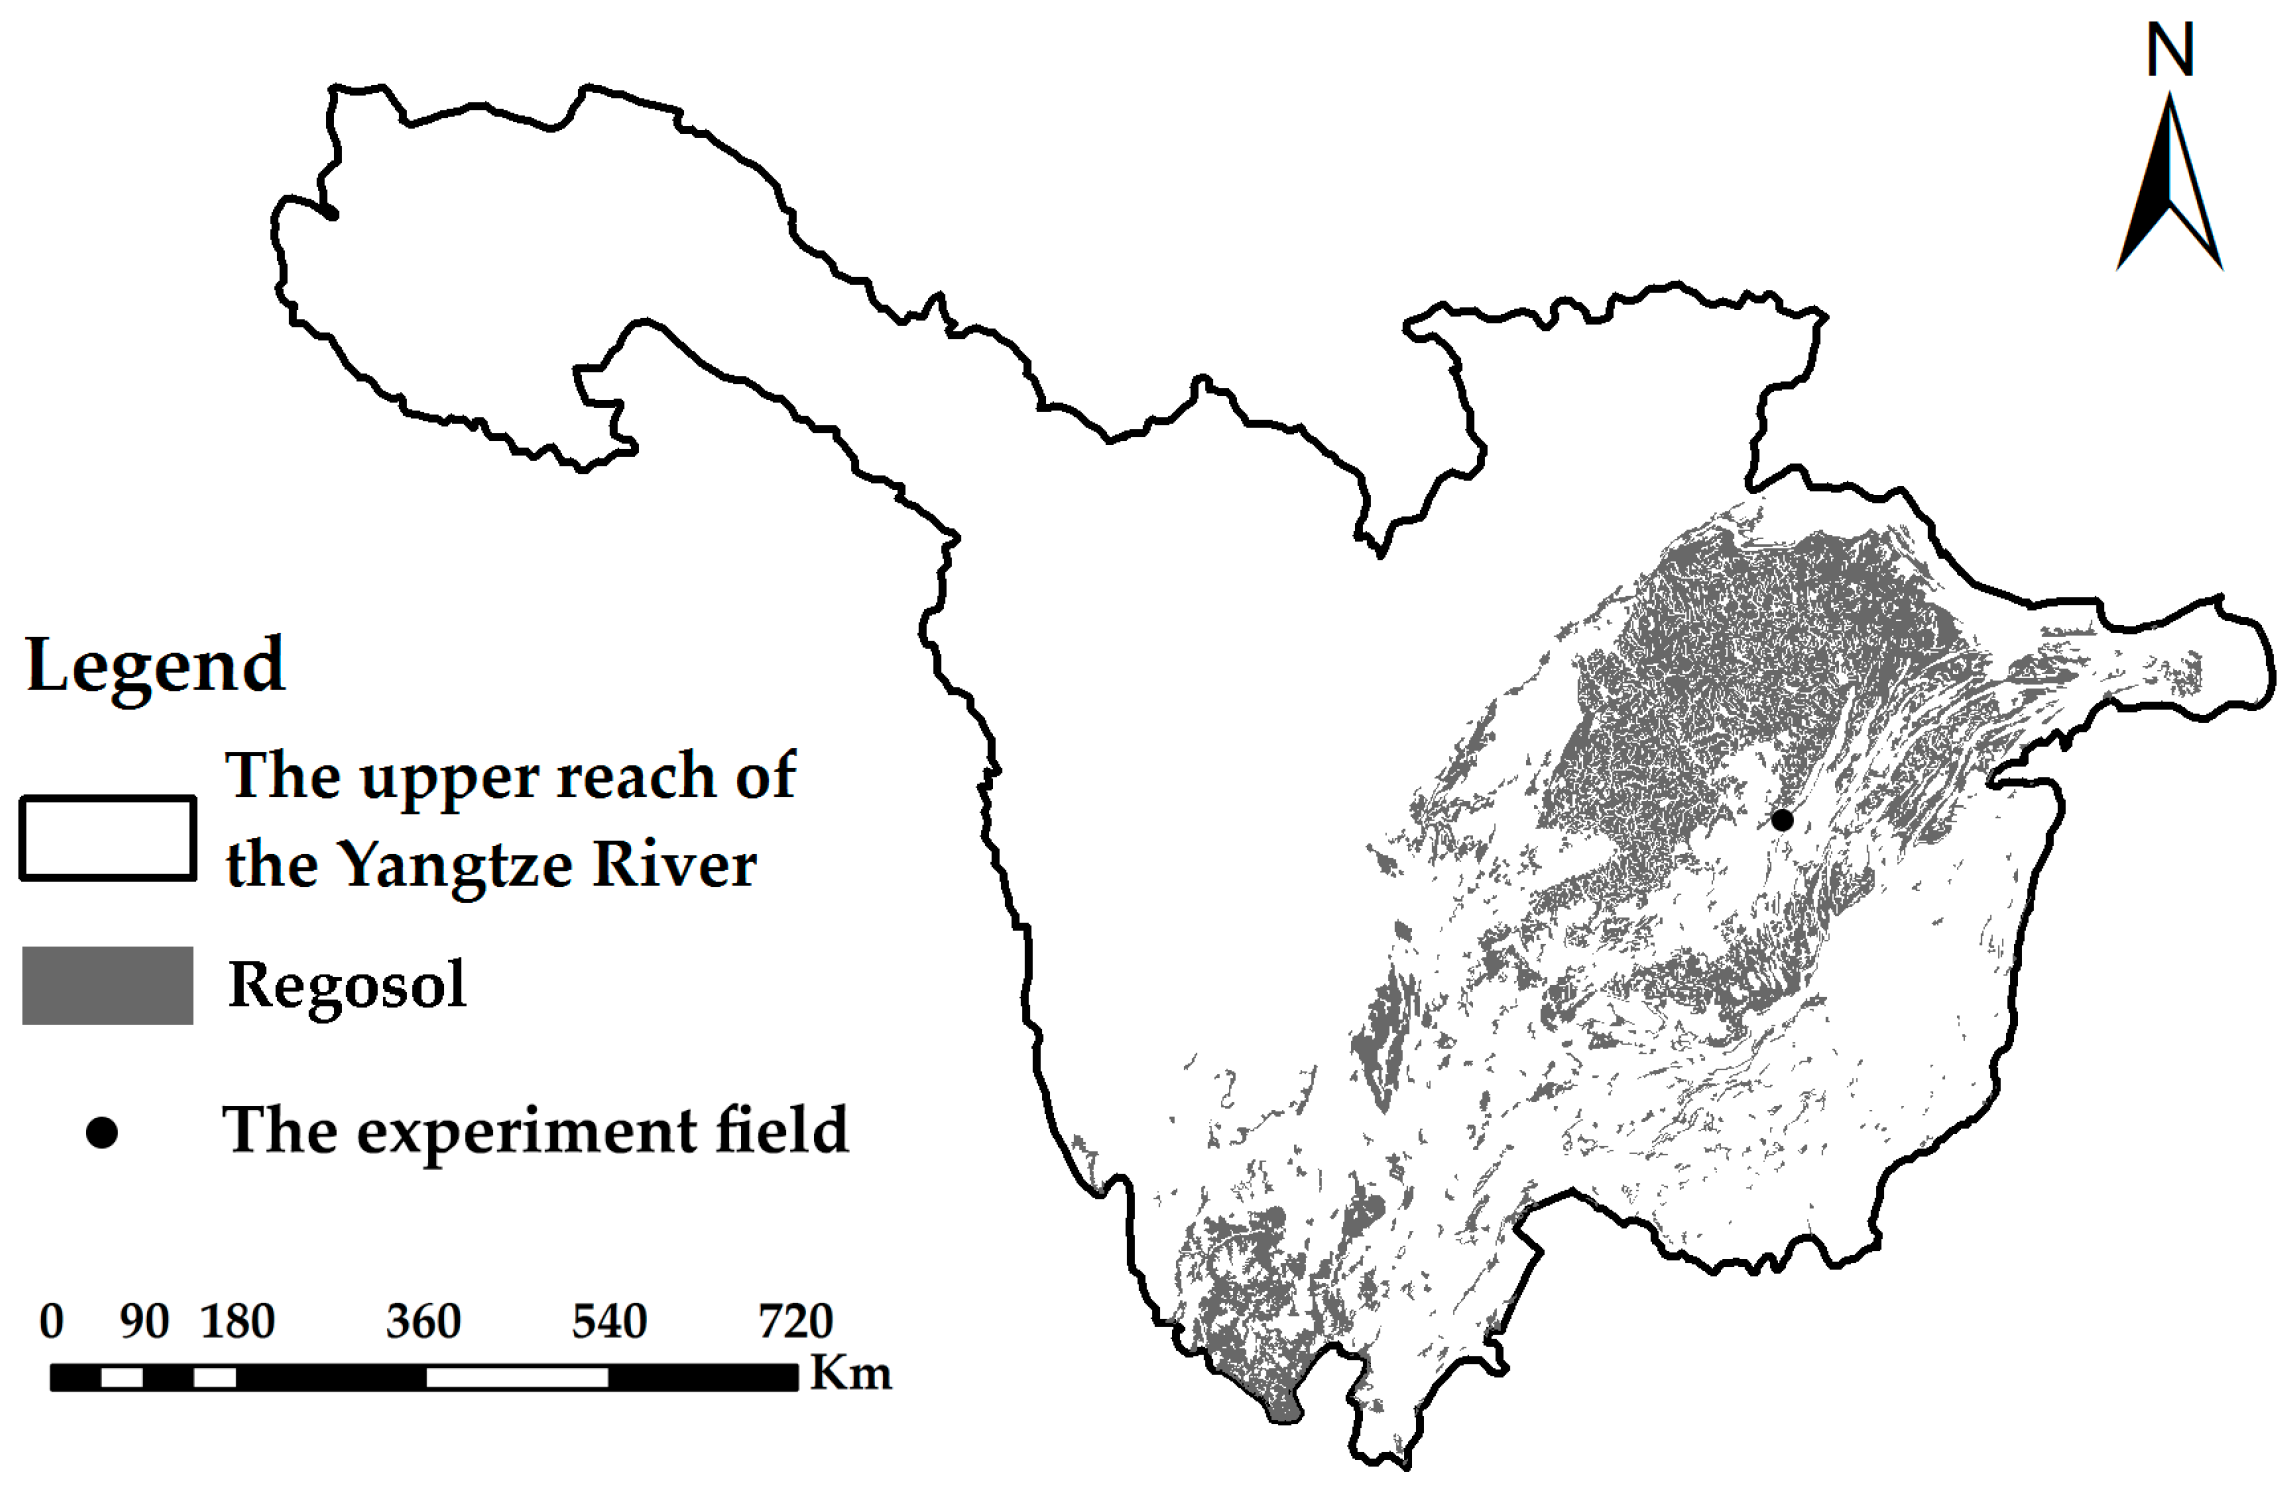
Regosol soil, which accounts for 13.18% of the upper reach of the Yangtze River, has the characteristics of abundant fertility but high erodibility, resulting from hillslope in the drainage area (Figure 1) [32]. In our research, the experimental field was located in Chongqing City in the upper reach of the Yangtze River, where soil and water loss and NPS pollution are serious problems because of abundant rainfall and steep slopes [33]. The experimental field (106°43′ E, 29°53′ N) was located on a hillside of the Beibei district of Chongqing City where the soil type is regosol. Precipitation and rainfall intensity in that location were the factors representing rainfall characteristics, and the slope was chosen to represent typical terrain, one that has significant effects on TN losses.
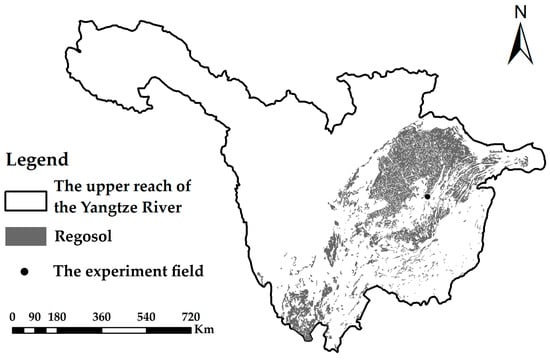
Figure 1.
Distribution of regosol in the upper reach of the Yangtze River.
The 20 cm of topsoil was selected as soil samples to eliminate the spatial heterogeneity of physical and chemical properties for various soil samples. The regosol was crushed gently, passed through a 7 mm sieve to remove stones and impurities, air-dried by the oven drying method to reduce initial soil water content rate to 12.16%, and then mixed thoroughly. The physical and chemical properties of the soil samples are listed in Table 1. Regosol is thin, usually less than 50 cm; little was more than 1 m deep. Generally, regosol contains calcium carbonate, showing a neutral or slightly alkaline reaction. The sample had a clay mineral content of 7%–12% smectite, 8%–10% illite, 7%–11% chlorite, 35%–40% quartz, 27%–31% feldspar, 3% haematite, and 3% others. The microbiological component was composed of 7.0 × 10⁶ bacteria per gram of dry soil, 6.7 × 10⁴ actinomycetes per gram of dry soil, and 2.1 × 10³ fungi per gram of dry soil. Other components also influence nitrogen retention, such as organic matter content, soil texture, and so on.

Table 1.
Physical and chemical properties of soil samples.
Microbes have effects on the forms of nitrogen in soil. For example, the existence of nitrogen-fixing bacteria and phosphorus bacteria could add available nitrogen content in soil, denitrifying bacteria could slow the conversion of available nitrogen to ineffective nitrogen, and, in soil, some bacteria activate nitrogen and turns it into nutrients that plants can absorb [34]. Furthermore, other soil components have effects of the background value of nitrogen; for instance, the content of clay particles in soil could affect the mass fraction of TN in soil [35]. Meanwhile, those impacts mainly related to temperature [36]. However, in this study, TN was taken as the pollutant, which included various forms of nitrogen; therefore, the impacts of the conversion among various forms of nitrogen on TN concentrations and TN loads could be ignored. In addition, the background value of TN in soil and temperature were constant in the experiments. Therefore, it could be deduced that microbes and other soil component were not the key factors that caused changes of TN concentrations and TN loads in the rainfalls.
Precipitation and rainfall intensity were selected as the variables to study rainfall characteristics, and the slope was based on the typical terrain in order to study their significant effects on TN losses.
2.2. Experimental Devices
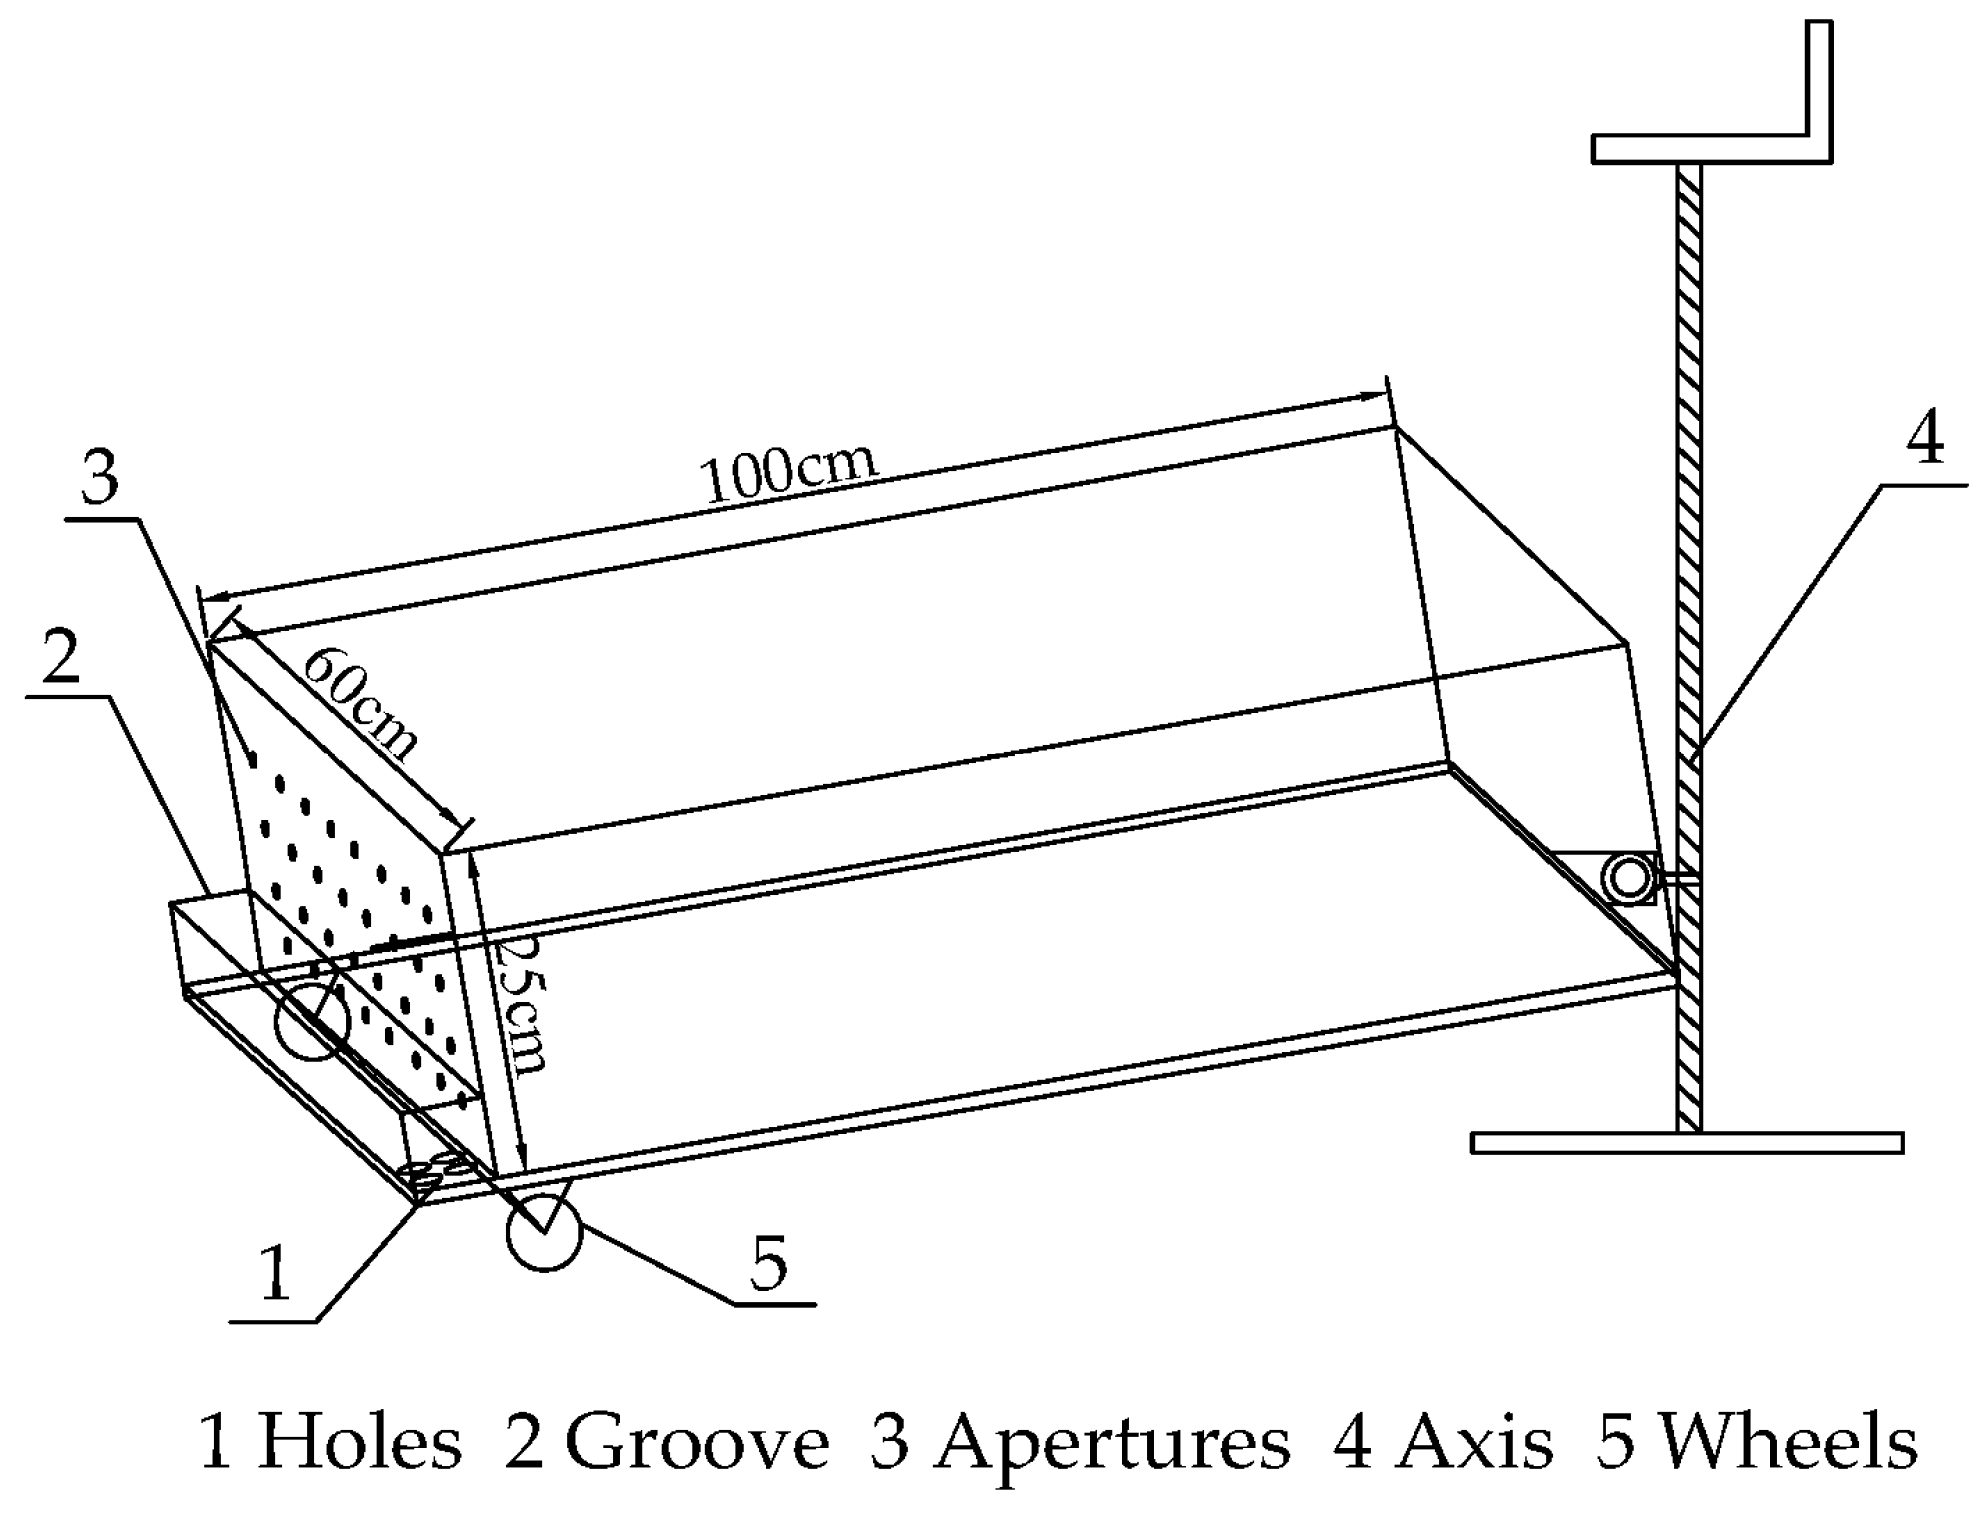
For a small-scale artificial rainfall experiment, the experimental plot is usually less than 5 m2 with the length, width and depth of the soil box at 1–2 m, 0.5–1 m and 0.22–0.5 m, respectively [37]. In our experiments, three identical steel soil boxes, each 1.0 × 0.6 × 0.25 m and with two wheels at the base, were designed to minimize experimental error. Each soil box had apertures on the side near the wheels to allow runoff and sediment to transport freely. The bottom of the box was extended 0.1 m outward along the long side and a groove with small holes was set on the right-hand side of the extension to collect runoff and sediment. On the opposite side of the groove, a regulating screw was attached so that the slope angle of each soil box could be adjusted from 0° to 65°. The structure of the soil boxes is shown in Figure 2.
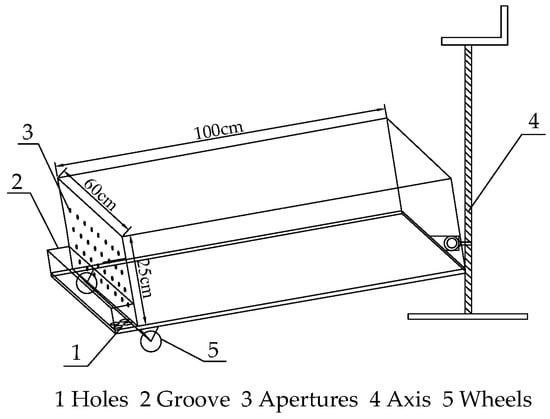
Figure 2.
Structure of the soil box.
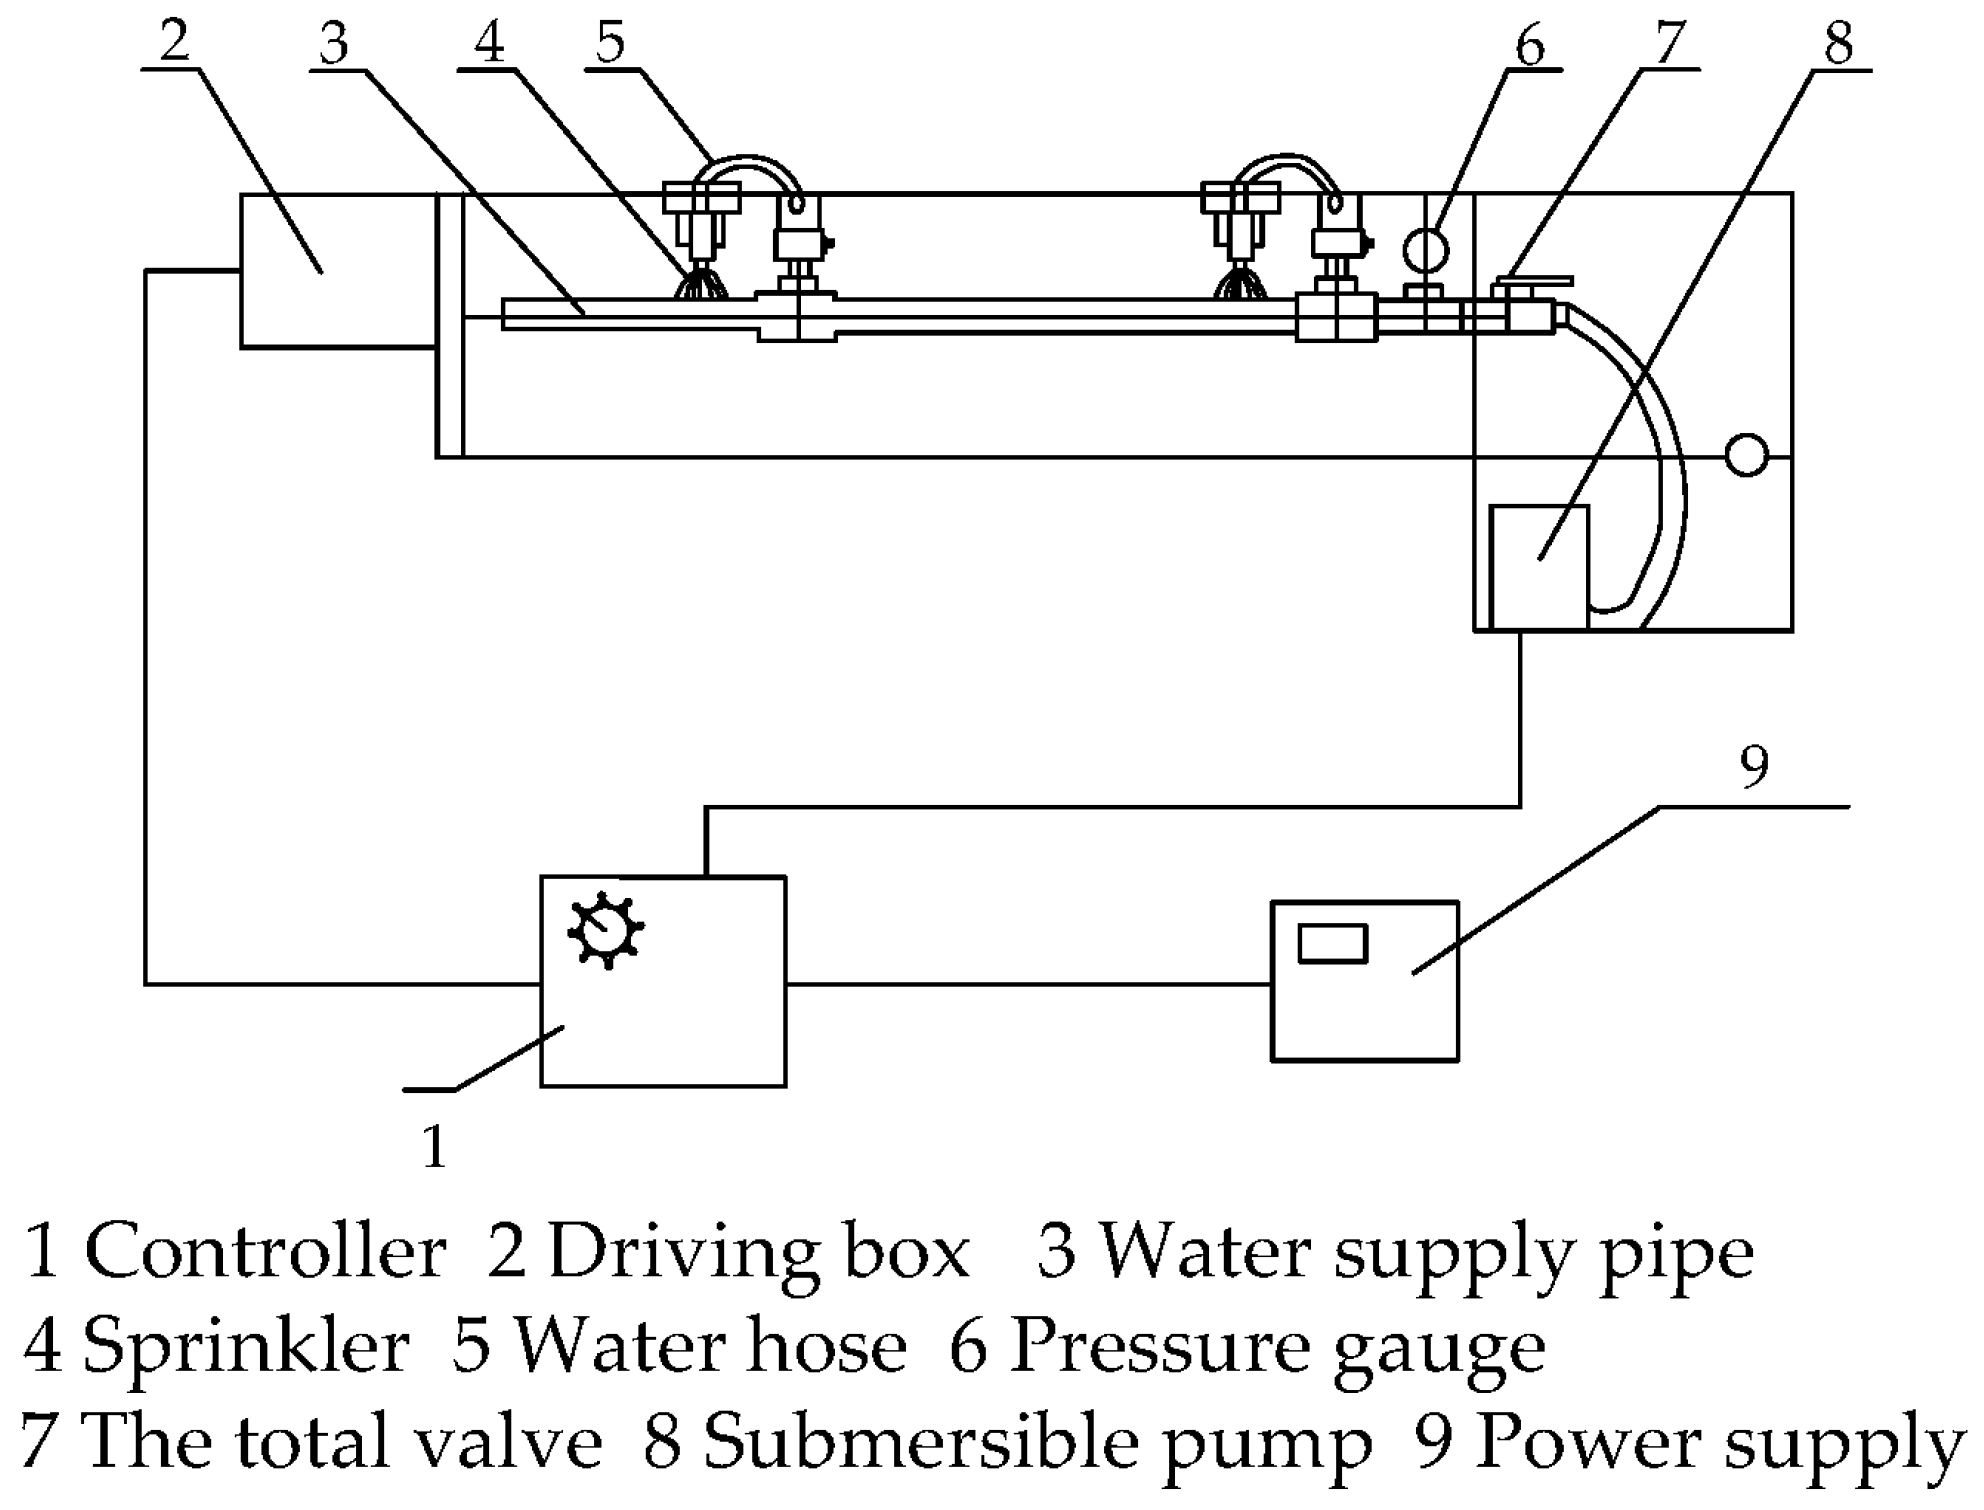
In our experiments, a Norton nozzle-type rainfall simulator was adopted, consisting of a water supply system as well as a spraying system and produced in the United States (Figure 3). The height of the nozzle was 2.5 m and the hydraulic pressure was 0.04 M Pa, which made the sizes and distribution of raindrops were similar to those in nature. The rainfall intensity could be set at different levels by changing the frequency of nozzle swings and was stable to maintain a consistent condition.
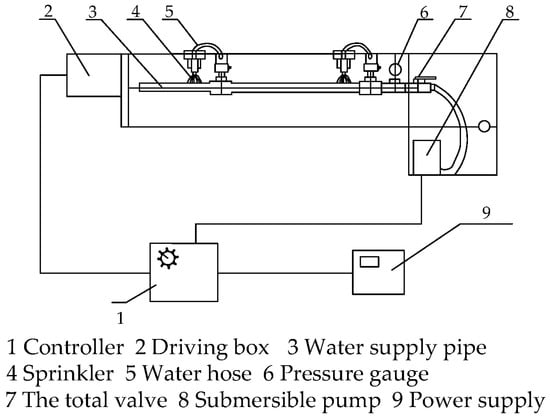
Figure 3.
Structure of the Norton nozzle-type rainfall simulator.
2.3. Experimental Design
As mentioned in Section 2.1, taking soil from a hillside where the soil type was regosol and the preprocessing of the regosol included crushing, sieving, air drying, and mixing. Afterwards, five 5-cm soil layers were compacted in a soil box so that the lower soil layer was loosed before the upper one was filled, to prevent soil stratification. After the filling was completed, a cutting ring method was used to guarantee the soil bulk density was about 1.30 g/cm3, similar to that in nature. Domestic water with a TN concentration of 1.68 mg/L was used as an artificial rainfall source to simulate rainfall. In Chongqing City, the pH of domestic water is 7.93, that of rainwater is 5.64, and difference can be found between them. Previous researches have demonstrated that pH has impacts on adsorption-desorption reactions [38,39]. In this research, the major form of TN was the dissolved one and the durations of experiments were relatively short, which led to a relatively weak adsorption-desorption effect. For those concerns, experimental error caused by such difference is regarded as acceptable.
The artificial rainfall source was assumed to have a composition similar to that of natural rainwater. According to precipitation data supplied by the National Meteorological Information Center, maximum rainfall intensity in Chongqing City in recent decades has exceeded 100 mm/h. Therefore, four rainfall intensities were adopted in this study: 30 mm/h, 60 mm/h, 90 mm/h and 120 mm/h. Normal precipitation from one rainfall would not usually exceed 80 mm; in combination with the designed rainfall intensities, we set rainfall duration at 40 min to simulate natural conditions and make the comparison and analysis more intuitive. Five slopes (5°, 10°, 15°, 20° and 25°) were designed representing regional terrain; moreover, the Water and Soil Conservation Law of the People's Republic of China prohibits cultivation or crop planting on fields with a slope of 25° or more. The 20 experimental scenarios with various rainfall intensities and slopes are shown in Table 2.

Table 2.
Scheme of artificial rainfall experiments.
In this research, runoff-yielding times for all scenarios were 40 min; specifically, rainfall times were between 41.55 and 52.43 min. After runoff occurred on the soil surface of the soil boxes, it was collected by water butts. Specifically, the runoff occurring within 5 min was gathered in a water butt; therefore, all runoff for one scenario was collected in 8 water butts because runoff-yielding time for each scenario lasted 40 min. By this means, runoffs in all scenarios were measured. The soil was reloaded for each experiment to avoid influence caused by variations of soil water content and bulk density. The runoff and its TN concentration were measured and monitored after each simulated rainfall. As far as TN loss in regosol was concerned, dissolved nitrogen was the main form. Specifically, dissolved nitrogen was mainly nitrite, and ammonium nitrogen was the major component of the adsorbed nitrogen.
2.4. Data
In this study, the independent variables included precipitation, rainfall intensity, and slope, while the dependent ones contained TN load, TN concentration, and the initial runoff-yielding time. To ensure runoff-yielding time was 40 min for each rainfall, precipitations varied from 23.09 to 86.36 mm due to different rainfall intensities and the initial runoff-yielding times. Rainfall intensity was 30 mm/h, 60 mm/h, 90 mm/h and 120 mm/h, and slopes of 5°, 10°, 15°, 20°, and 25° were adopted to reveal the influence mechanisms of rainfall and terrain on TN in various scenarios in the study area.
The TN load measured in these experiments contained not only dissolved nitrogen in the rainfall runoff but also adsorbed nitrogen on the sediments. The general measure processes were as follows. Firstly, water samples were filtrated, by which the supernatant containing dissolved nitrogen and the sediments carrying adsorbed nitrogen were divided. Afterwards, the concentrations of dissolved nitrogen in water samples and those of adsorbed nitrogen in sediment samples were measured. Finally, TN concentration was achieved as the sum of dissolved nitrogen concentration and adsorbed one, while mg/L was adopted as the unit. The initial runoff-yielding time took into account the interval between rainfall and runoff generation, because soil water content did not reach the saturation point or generate runoff at the beginning of rainfall.
As mentioned above, the runoff occurring within one 5-min period was gathered in one water butt. In order to measure TN concentration, water was sampled in each water butt, which indicated that a measured TN concentration represented the average value in a corresponding 5 min. As far as dissolved nitrogen in the water samples was concerned, its concentration was measured by alkaline potassium persulfate digestion-UV spectrophotometric method [40]. The processes for determining concentration of dissolved nitrogen were as follows. Firstly, a calibration curve was obtained to calculate the difference between the corrected absorbance of the standard solution and that of a zero concentration solution. Secondly, a 10 mL water sample and a 10 mL pure water were measured to correct absorbance. Afterwards, the concentrations of water samples were achieved by the equation (national standard water quality-determination of total nitrogen-alkaline potassium persulfate digestion UV spectrophotometric method HJ 636-2012):
where ρ was mass concentration of TN in water sample (mg/L), Ar was the difference between the corrected absorbance of water sample and that of blank test, a was the intercept of the calibration curve, b was the slope of the calibration curve, V was the volume of water sample (mL), and f was dilution ratio of the water sample. For quality control and quality assurance, the digestion temperature was assured between 120 °C and 124 °C, and the digestion time was guaranteed as 50 min.
As for adsorbed nitrogen, its concentration was measured by semi-micro Kjeldahl method. Firstly, 1.0000 g of air-dried sediment sample was took, and its water content was tested. Secondly, the sediment sample went through heating digestion, which included ones concerned and not concerned nitrate and nitrite nitrogen. Blank tests of heating digesting were also taken. Thirdly, ammonia was distilled, distillate was titrated with a 0.005 mol/L sulfuric acid standard solution, and the volume of the acid standard solution was recorded. Lastly, the equation was adopted to calculate the concentration of adsorbed nitrogen in sediment samples (national standard method for the determination of soil total nitrogen (semi-micro Kjeldahl method) HY/T 53-1987):
where ρ was the concentration of adsorbed nitrogen in the sediment sample (mg/L), V was the volume of sulfuric acid standard solution when distillate was titrated (mL), V0 was the volume of the sulfuric acid standard solution when blank water was titrated (mL), CH was the concentration of the sulfuric acid standard solution (mol/L), 0.014 was the millimol mass of nitrogen atom, and m was the mass of the air-dried soil sample. Meanwhile, the pH of distillate was assured as alkaline to release the ammonia completely so that accurate results would be attained. In addition, TN loads were obtained as the products of runoffs and TN concentrations, which were based on those of dissolved nitrogen and adsorbed one.
SPSS, software specialized for correlation analysis, linear, and nonlinear regression analysis [41], was used to process the experimental data. The method of correlation analysis was adopted to analyze the relationships between precipitation and TN load, precipitation and TN concentration, rainfall intensity and TN concentration, rainfall intensity and the initial runoff-yielding time, slope and TN load, slope and TN concentration, and slope and the initial runoff-yielding time. By analyzing TN loads and TN concentrations under different rainfall intensities and slopes in the artificial rainfall experiments, the effects of rainfall and terrain on TN load, TN concentration, and the initial runoff-yielding time were revealed by correlation analysis.
3. Results and Discussion
3.1. Effects of Precipitation on TN Losses
3.1.1. Effects of Precipitation on TN Load in Runoff
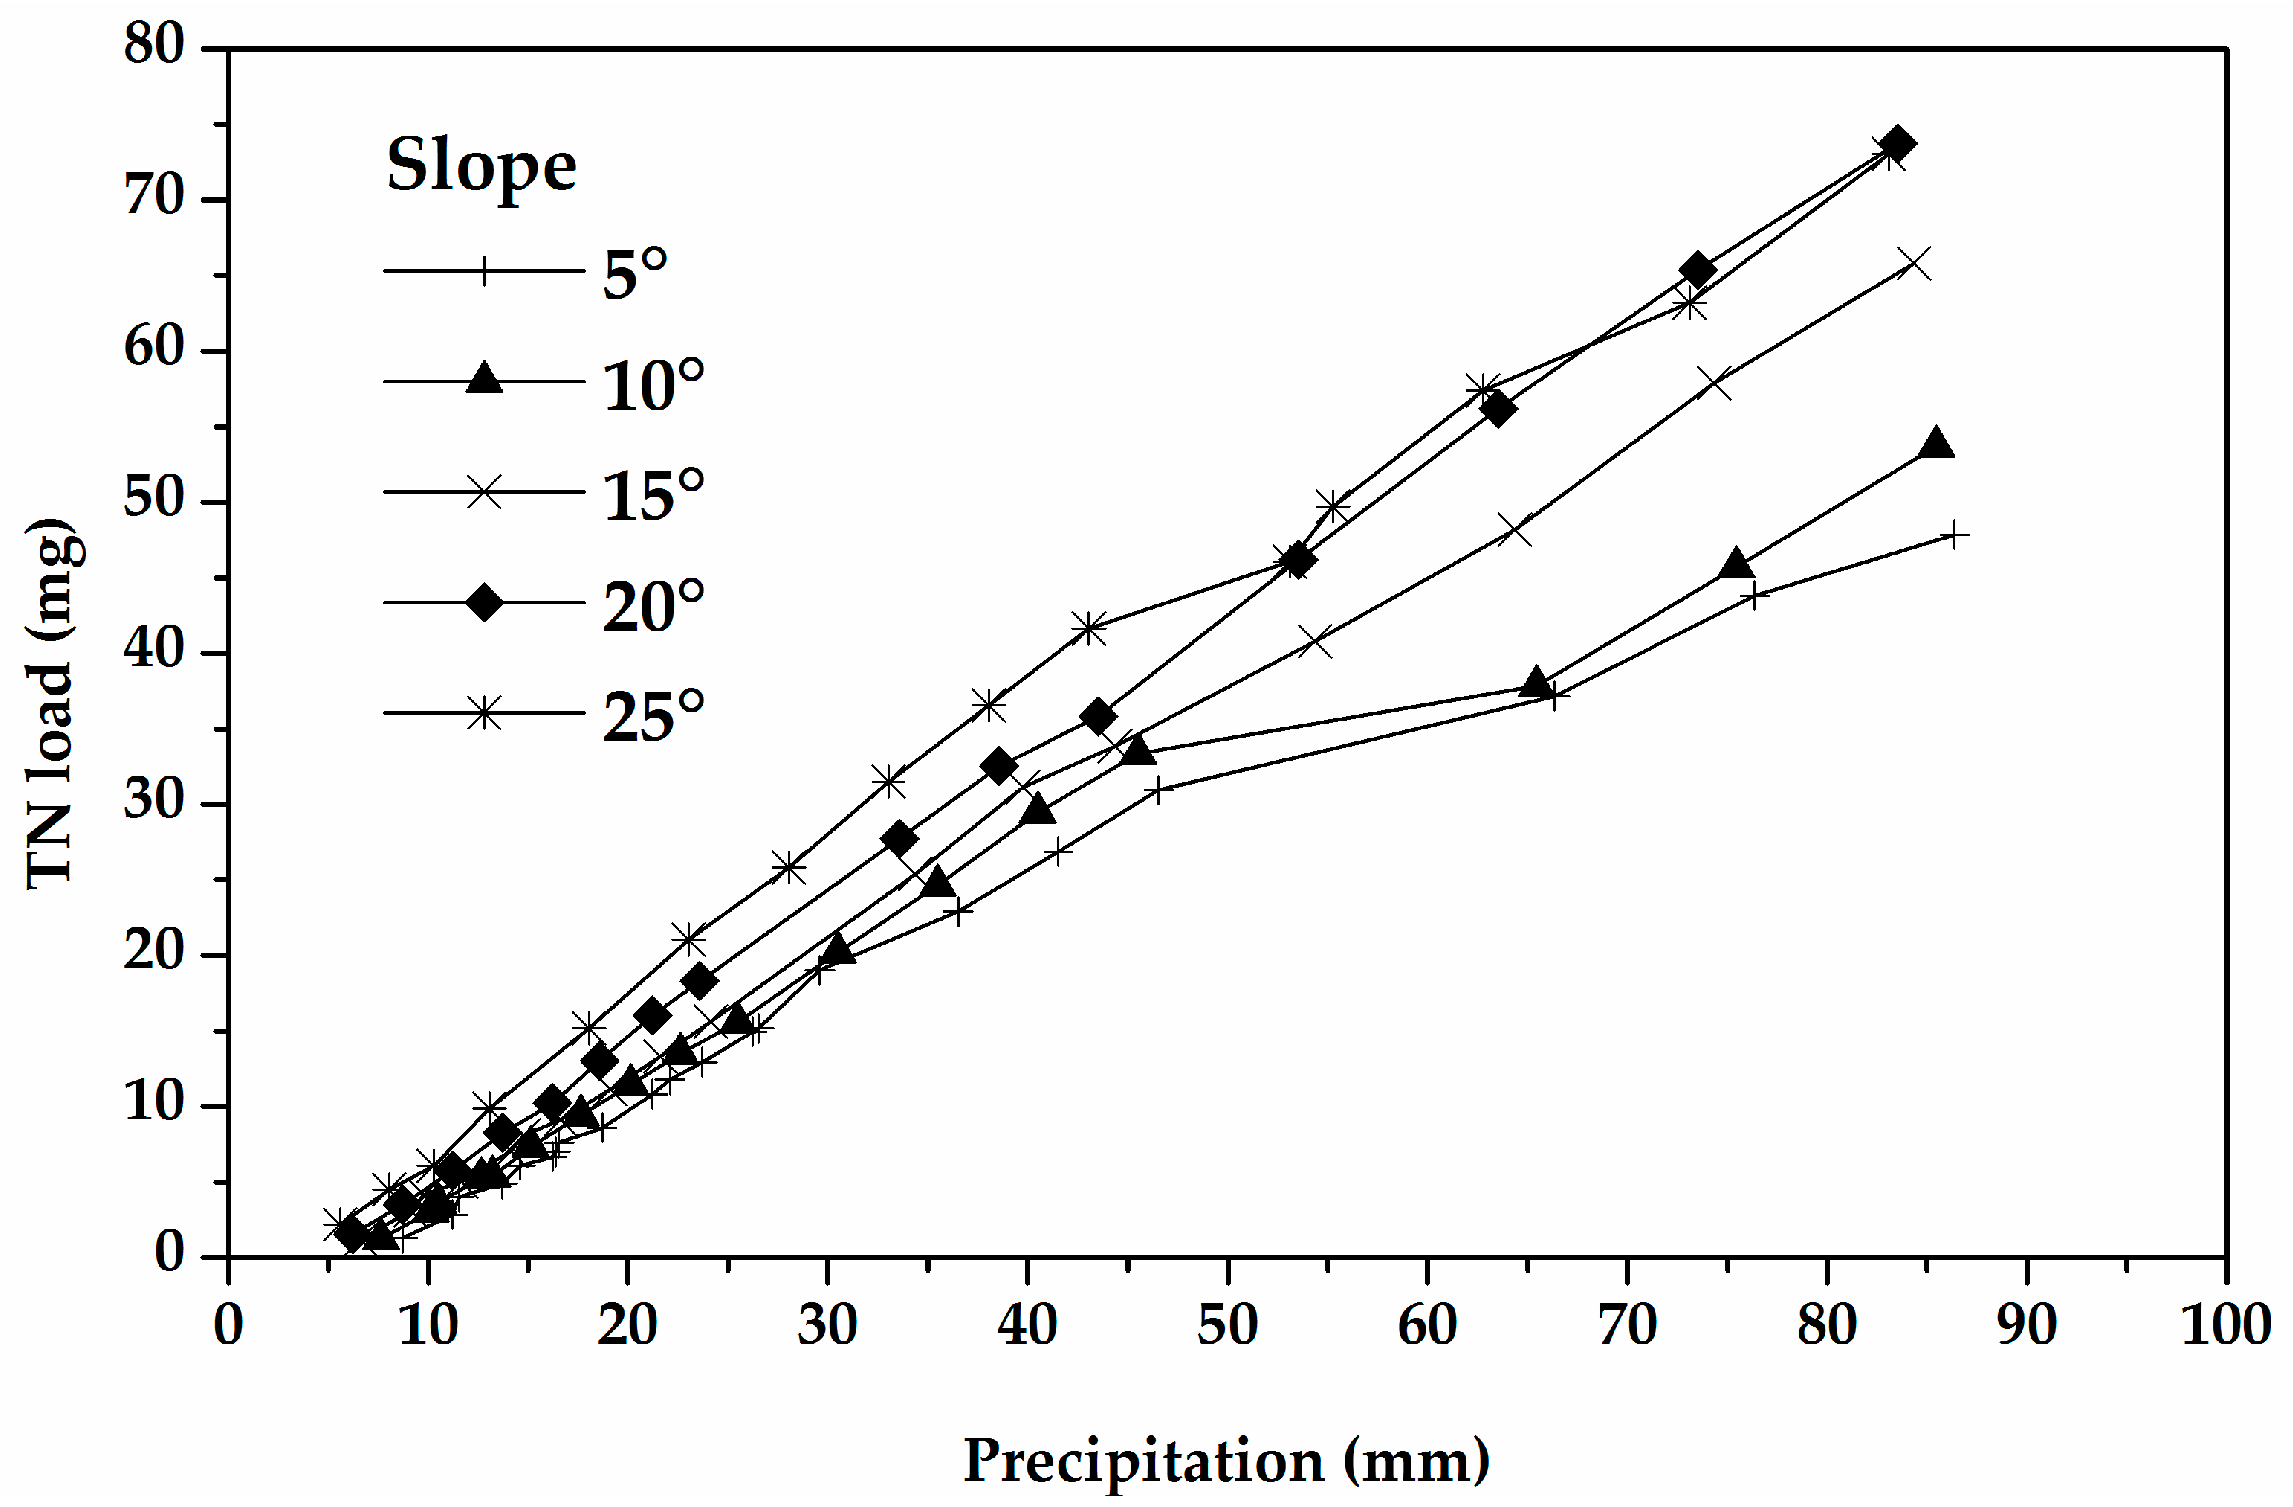
During the process of rainfall, dissolved nitrogen, including dissolved organic nitrogen, nitrate nitrogen, and ammonium nitrogen were carried by rainfall runoff. Meanwhile, adsorbed nitrogen was adsorbed on soil sediments and then transported by water and soil loss. In the experiments, the correlations between precipitations and TN loads under five slopes were obtained, as shown in Figure 4.
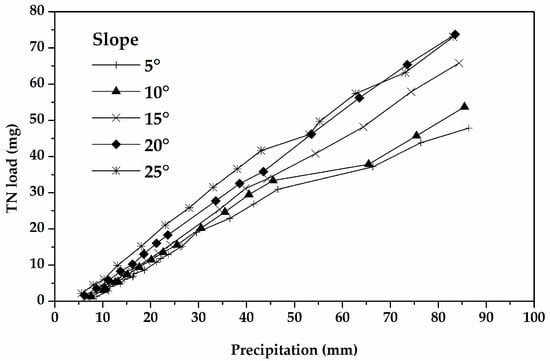
Figure 4.
Correlations between precipitations and TN loads under different slopes.
Generally, we found that there were positive linear relationships between precipitation and TN loads on different slopes, i.e., TN loads rose with increased precipitation. Table 3 shows the correlations between TN loads and precipitations under different slopes.

Table 3.
Correlations of TN loads and precipitations under different slopes.
It can be seen that runoff increased and more dissolved nitrogen was generated when precipitation increased. In addition, more sediment was transported by the runoff and adsorbed nitrogen loss became more serious. Therefore, the heavier the rainfall was, the more nitrogen the rainfall runoff and sediment generated, and the severer the TN loss became. TN load losses were slightly different for different slopes, indicating that slope is an important factor affecting TN loss, which will be discussed thoroughly in Section 3.3.1.
In Figure 4, the existence of the initial runoff-yielding times demonstrates that there is an interval between the beginning of rainfall and runoff generation. Rainfall merely infiltrated into the soil at the beginning of rainfall and runoff did not begin immediately, because soil water content was relatively low initially. With increased precipitation, soil water content reached the saturation point, and then runoff generation as well as TN loss began to occur from the scouring effect of rainfall runoff.
3.1.2. Effects of Precipitation on TN Concentration in Runoff
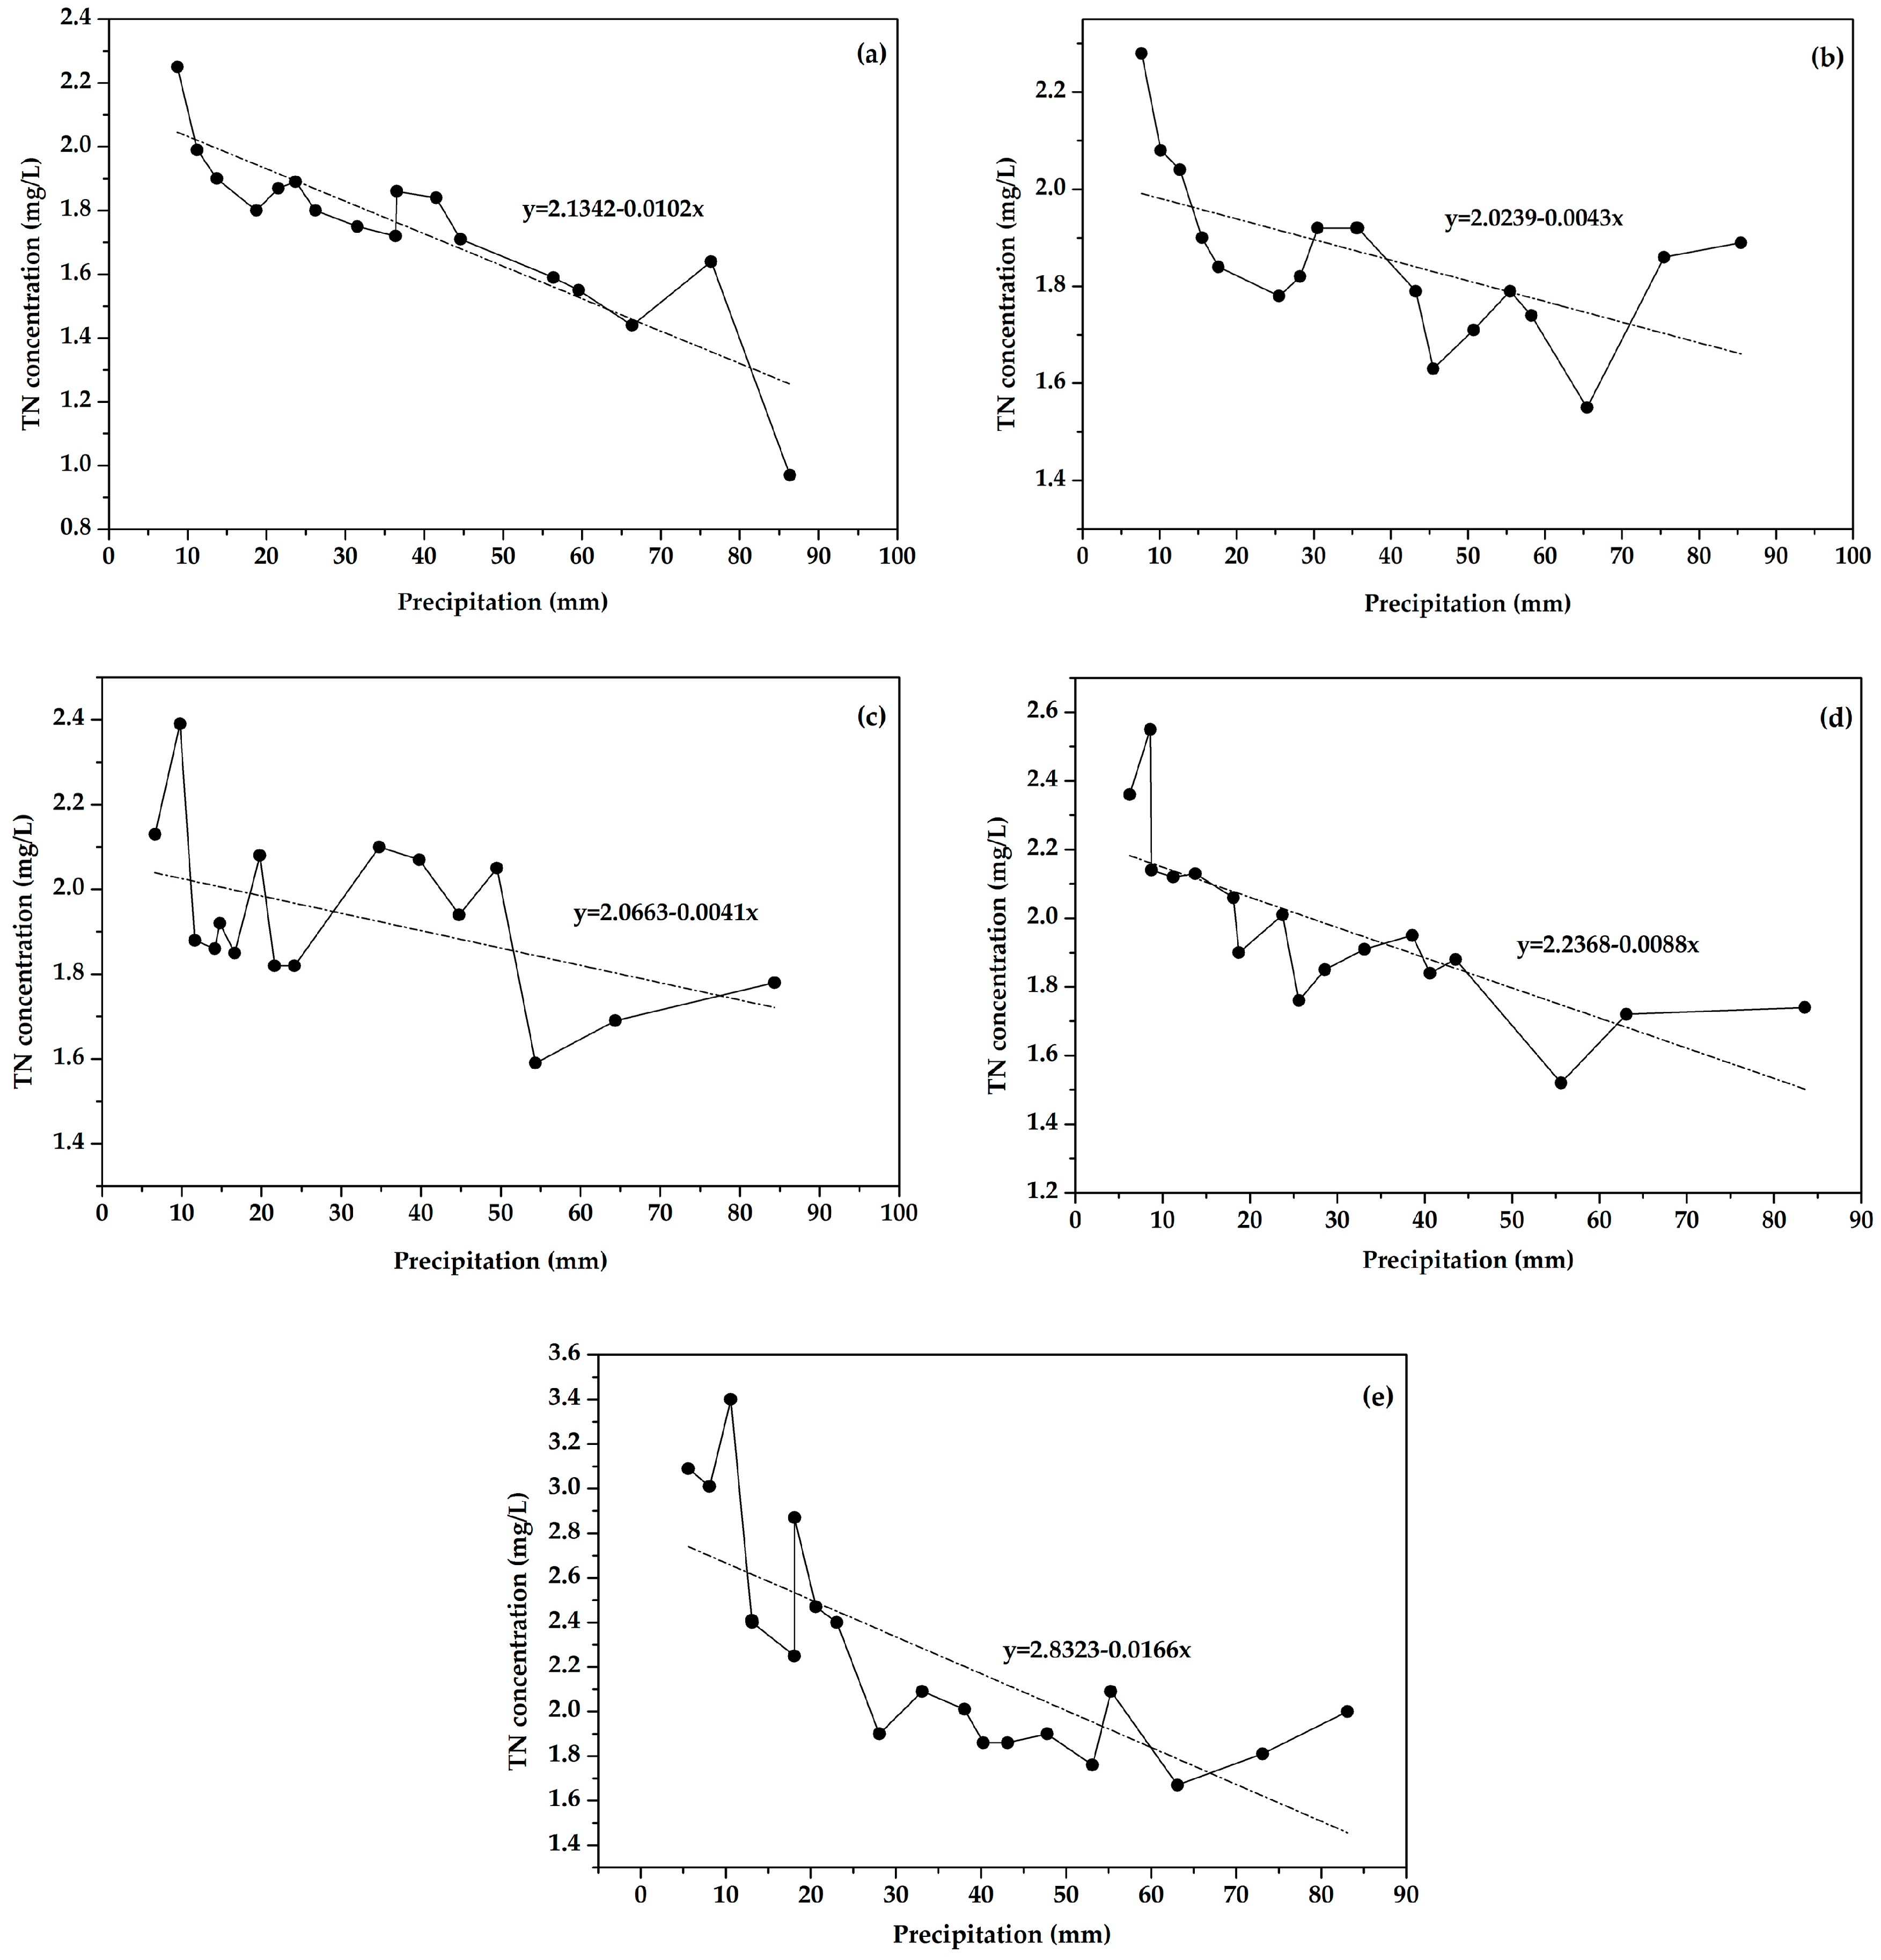
The correlations between precipitations and TN concentrations in runoff under various slopes are shown in Figure 5. Those under slope 5°, 10°, 15°, 20° and 25° are shown as Figure 5a–e, respectively. The downward sloping lines in Figure 5 show that TN concentration declines with increasing precipitation, though this is not the case for TN load.
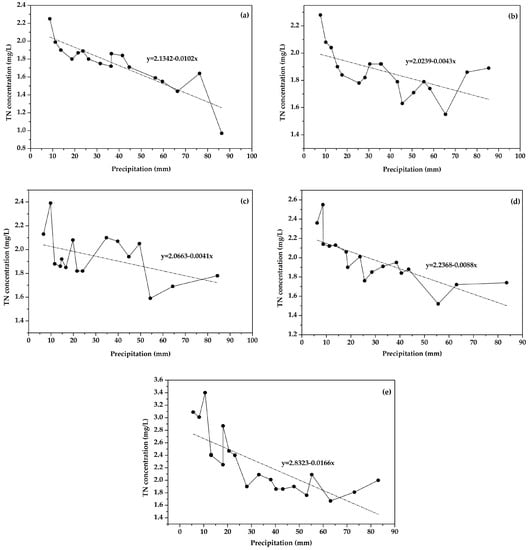
Figure 5.
Correlations between precipitations and TN concentrations under slopes of (a) 5°; (b) 10°; (c) 15°; (d) 20°; (e) 25°.
At the start of rainfall, TN load accumulation in the soil was relatively high, and more nitrogen could dissolve in the rainfall water and adsorb on sediments. Therefore, TN went through the processes of dissolution and adsorption for several minutes before runoff began. Once soil water content reached the saturation point, the initial runoff carried the dissolved and adsorbed nitrogen, so that the TN concentration was relatively high at first. As the rainfall continued, the decline of TN concentration was caused by the decreasing background value of TN in soil, so that less nitrogen was dissolved in the runoff and adsorbed on the sediment.
Moreover, the declines on various slopes differed slightly. Compared to other slopes, TN concentrations declined most obviously on those at 5° and 25°. For a gentle slope (5°), rainfall infiltration lasted a relatively long time before runoff generation, so that nitrogen in soil dissolved sufficiently. Therefore, TN concentration on a gentle slope at the initial runoff-yielding time was relatively high. After that, the scouring effect become weaker and resulted in less dissolved and adsorbed nitrogen carried by runoff and sediment, which caused TN concentration to decrease rapidly. For a steep slope (25°), the reason of TN concentration at the initial runoff-yielding time was relatively high was that the runoff velocity was relatively small owing to gravity, the runoff infiltration rate was low, the runoff on the sloping field was large, and more TN was transported by runoff and sediment within a short time. With scouring, the background value of TN in the soil decreased, so that TN removed by runoff also diminished.
3.2. Effects of Rainfall Intensity on TN Losses
3.2.1. Effects of Rainfall Intensity on TN Concentration in Runoff
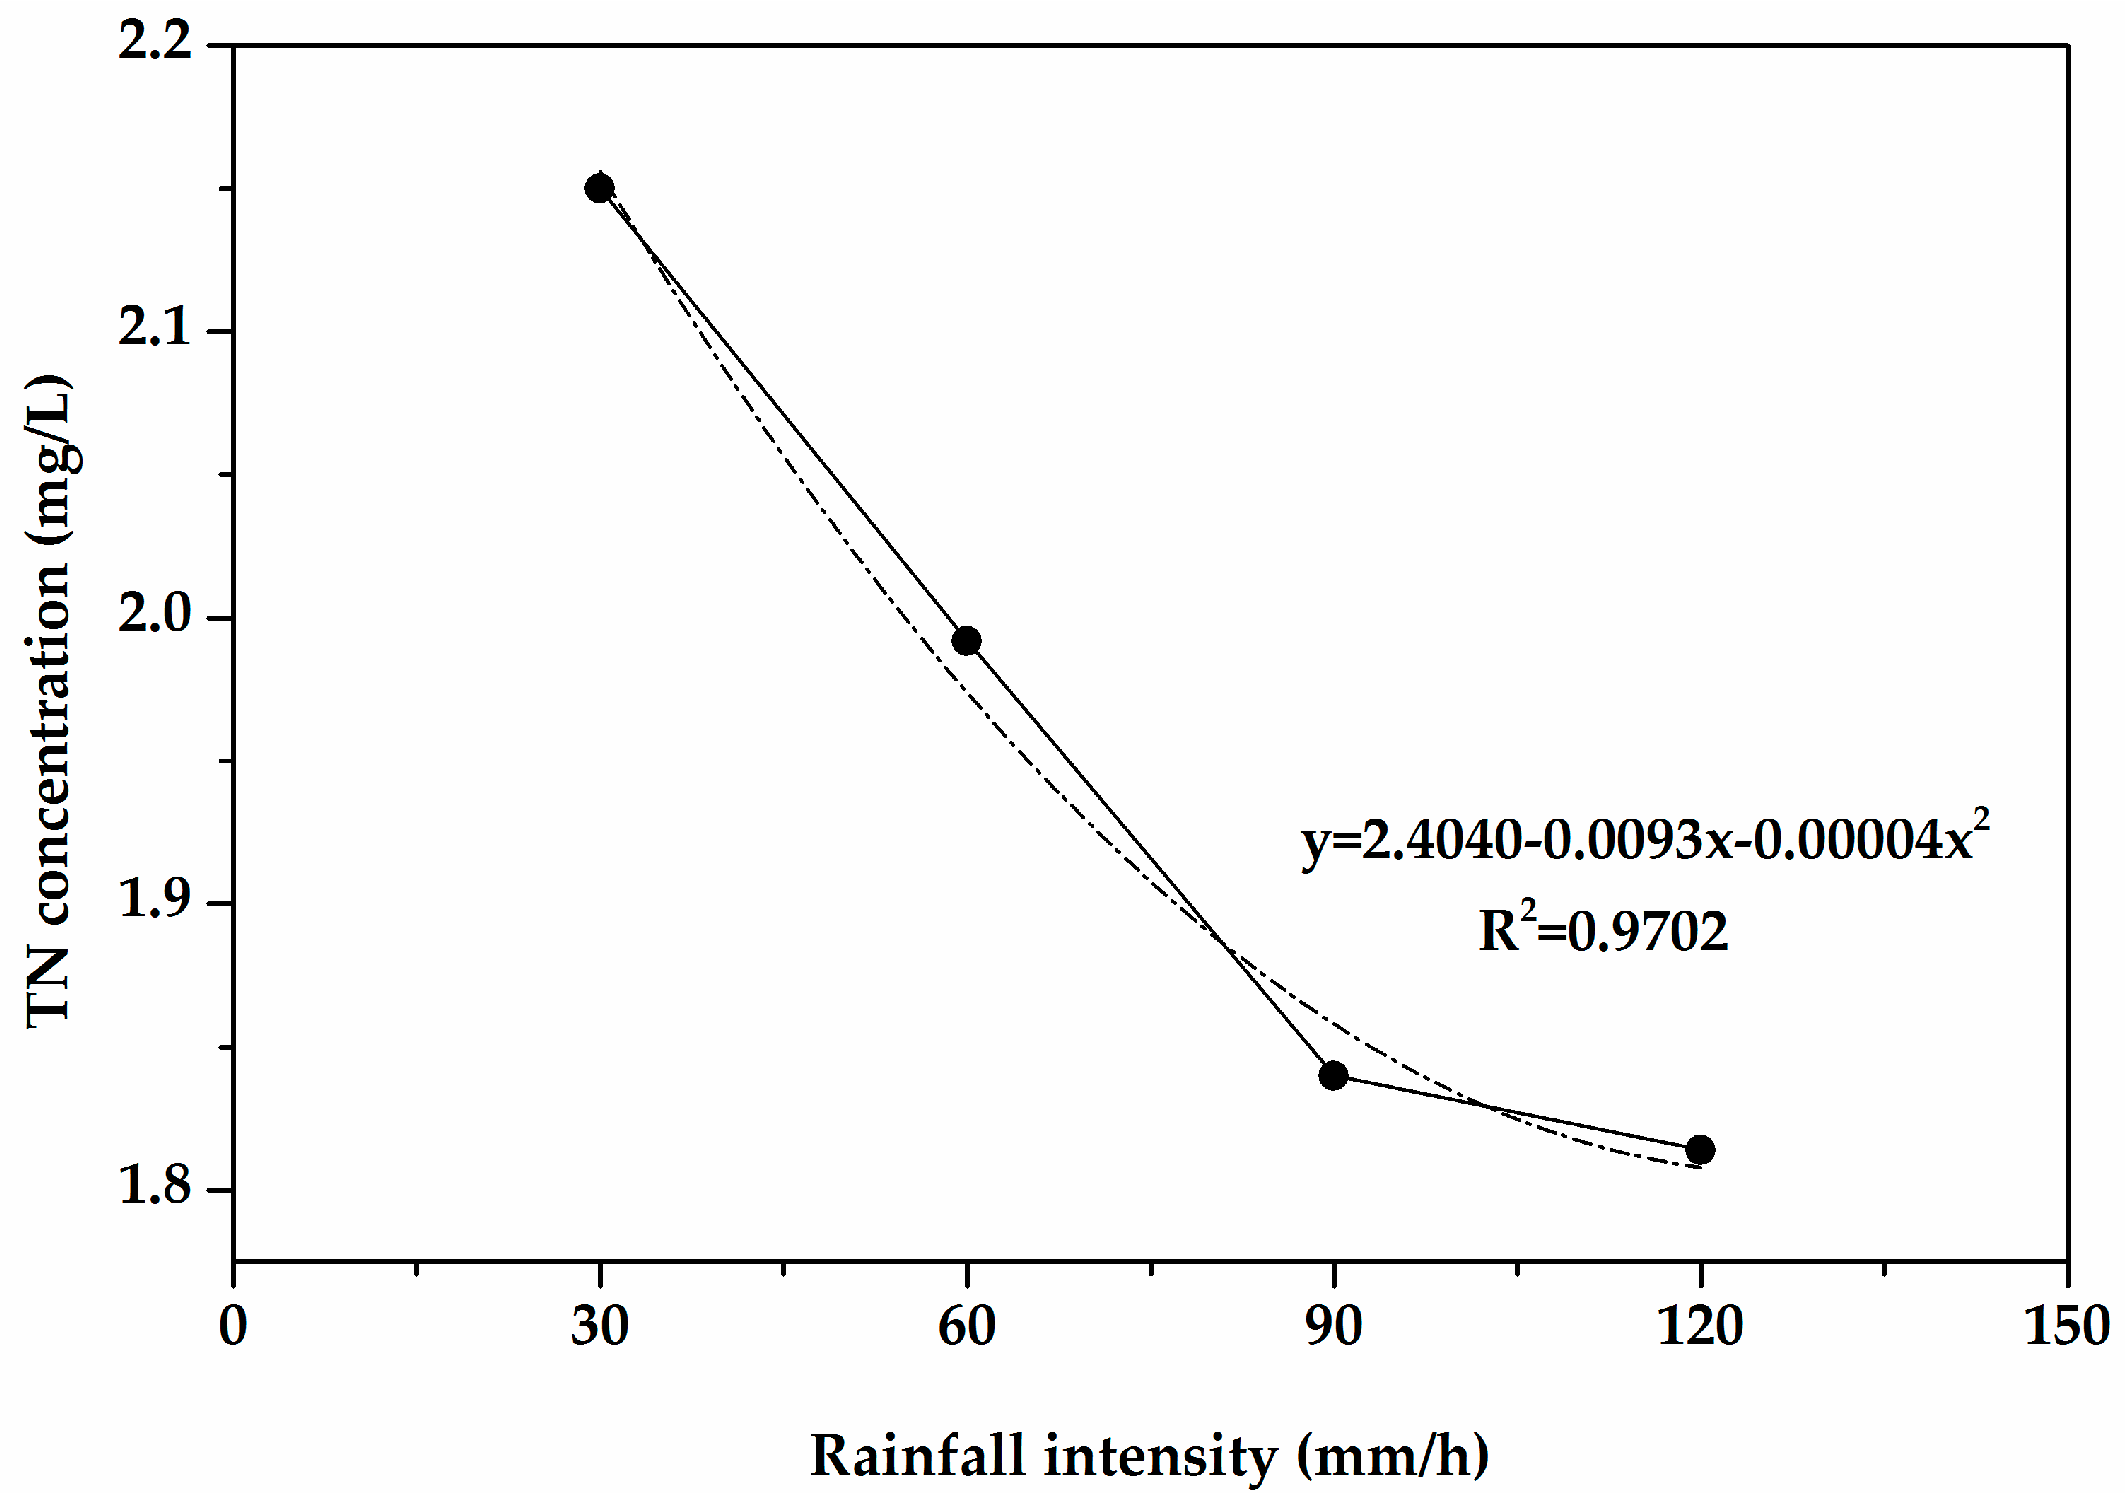
Due to the obvious relationship between precipitation and rainfall intensity, the effects of rainfall intensity on TN load were similar to those of precipitation on TN load, and therefore the effects are not discussed in detail. The correlation between rainfall intensity and TN concentration on various slopes is shown in Figure 6. It should be explained that TN concentrations on the five slopes under the same rainfall intensity were averaged as one value to eliminate the influence of slope on TN concentration.
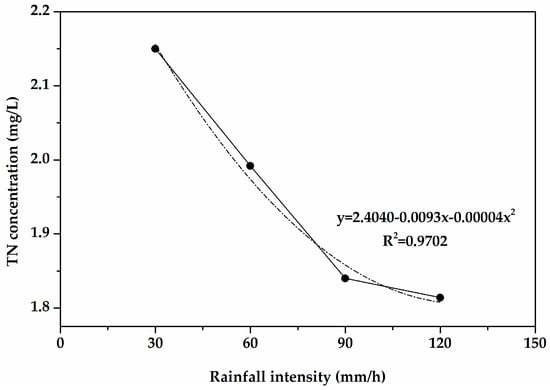
Figure 6.
Correlation between rainfall intensity and TN concentration.
The effects of slope on TN loss will be discussed in Section 3.3.1. Rainfall intensity and TN concentration are negatively correlated, which can be formulated by a quadratic polynomial, and the square of the correlation coefficient (R2) is 0.9702. It can be seen that more runoff is generated under the condition of higher rainfall intensity. Meanwhile, the background value of TN in soil was consistent throughout our experiments; hence TN concentration declined as rainfall intensity increased.
3.2.2. Effects of Rainfall Intensity on the Initial Runoff-Yielding Time
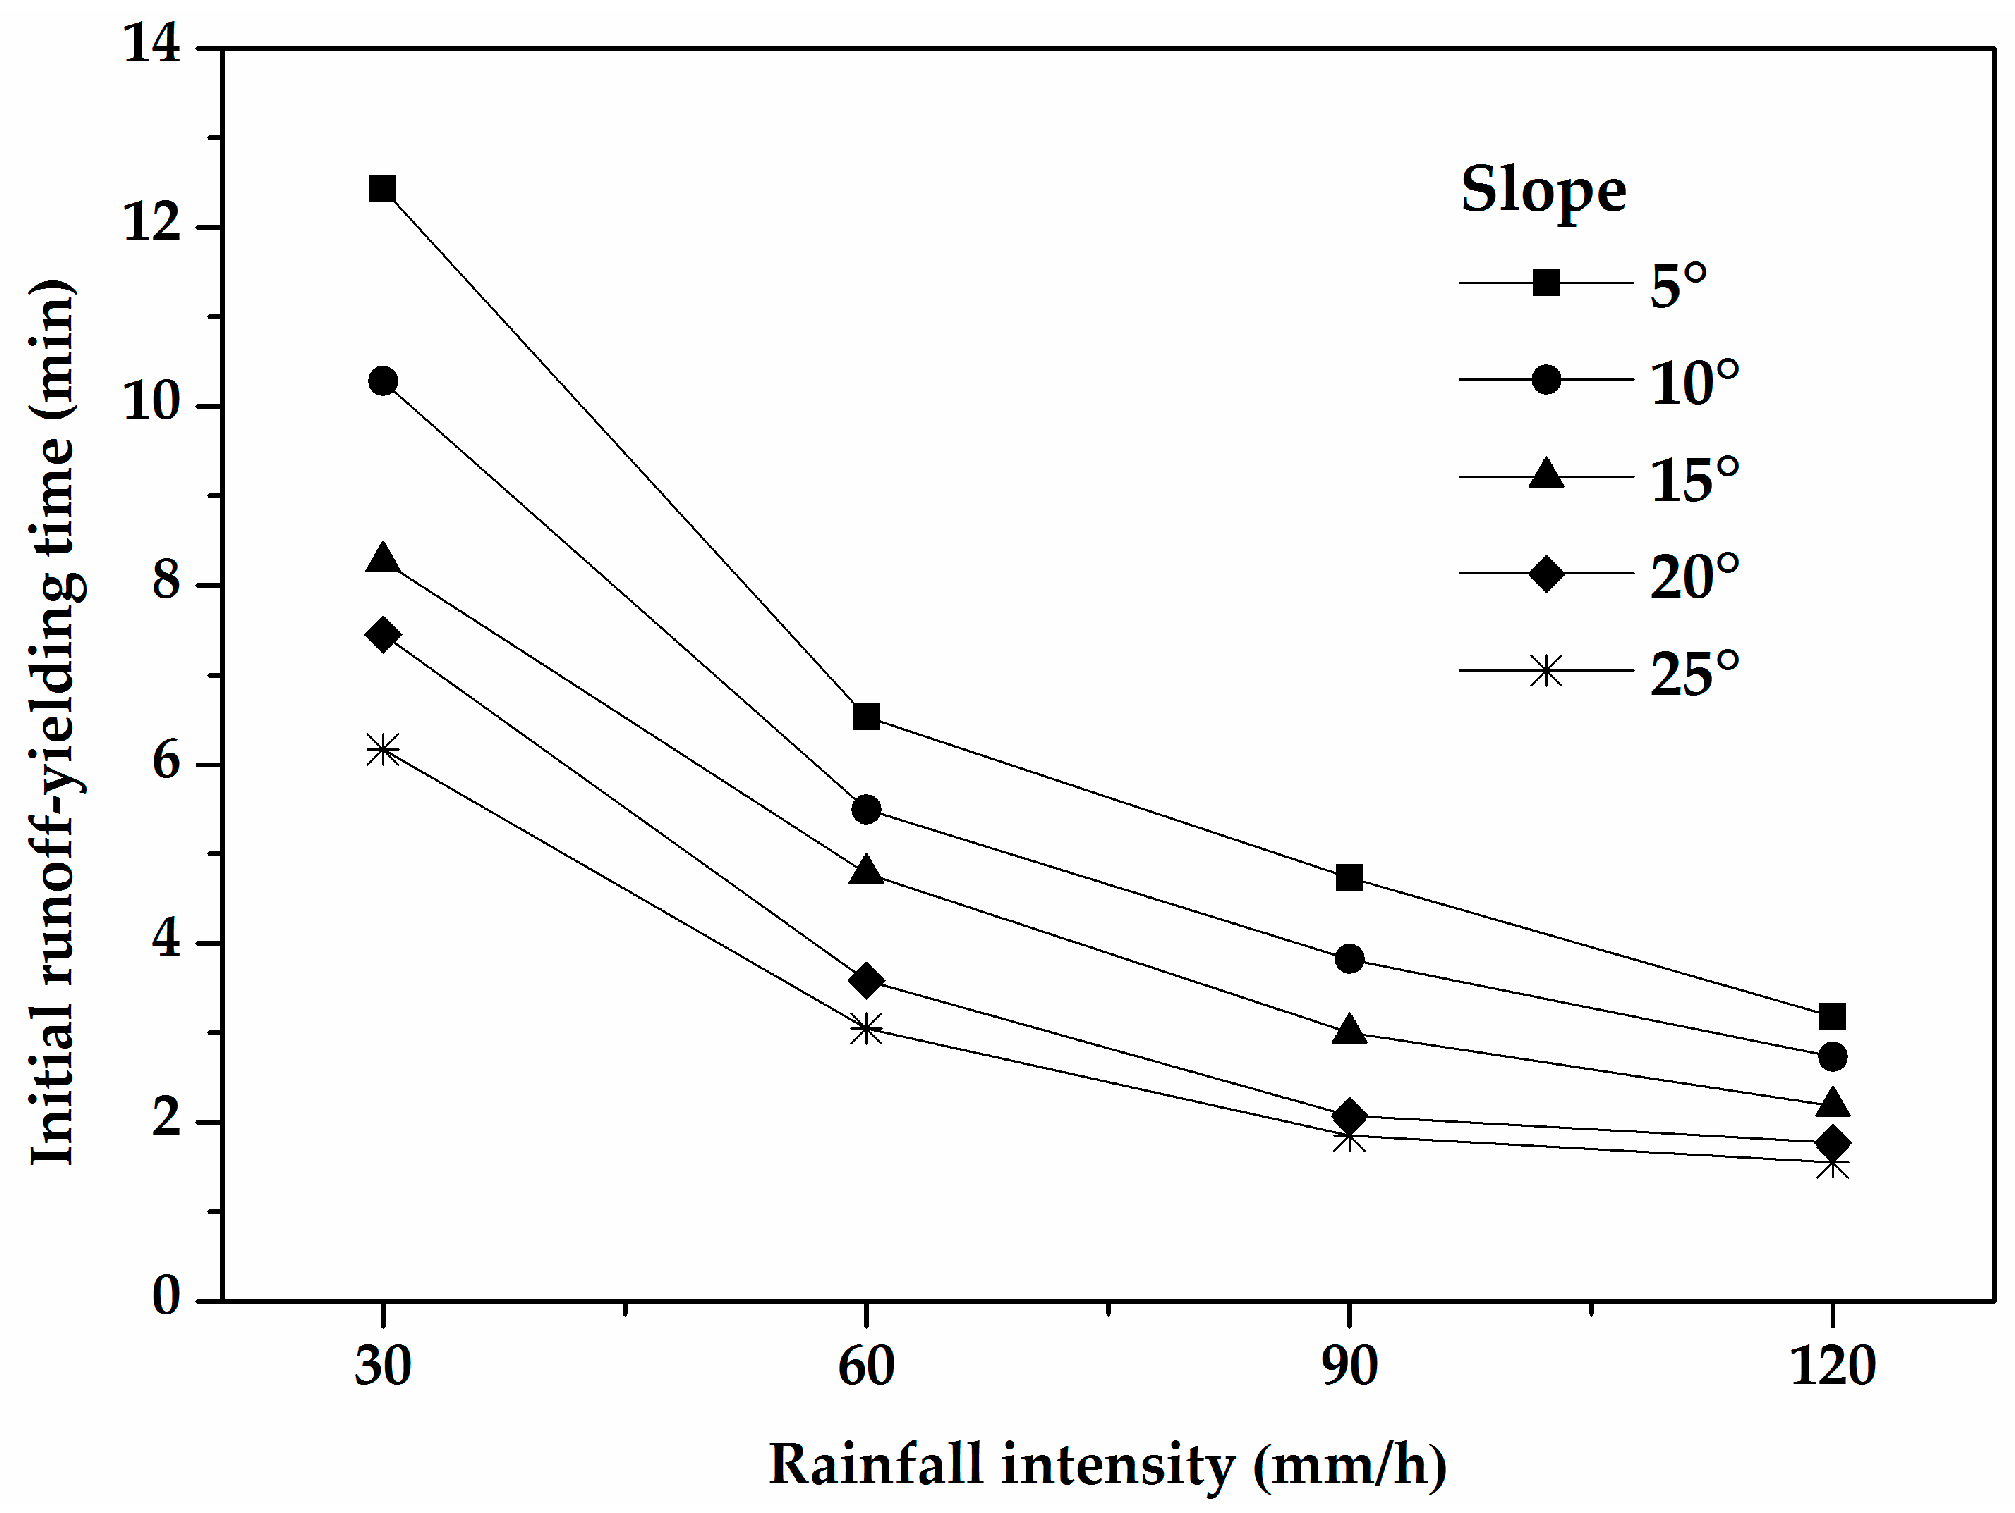
Correlation analysis on the relationship between precipitation and the initial runoff-yielding time showed that the former had no obvious effects on the latter. In contrast, there was a negative correlation between rainfall intensity and the initial runoff-yielding time (Figure 7). It can be explained that as rainfall intensity increases, more raindrops fall on a slope over a certain duration and soil water content increases rapidly. On the other hand, heavy rainfall causes broken soil particles to fill the gap and form water film, which causes the infiltration capacity of the runoff to decrease [37]. Those factors generated rapid runoff even before rainfall infiltrated thoroughly into deep soil, which caused the initial runoff-yielding time to be short.
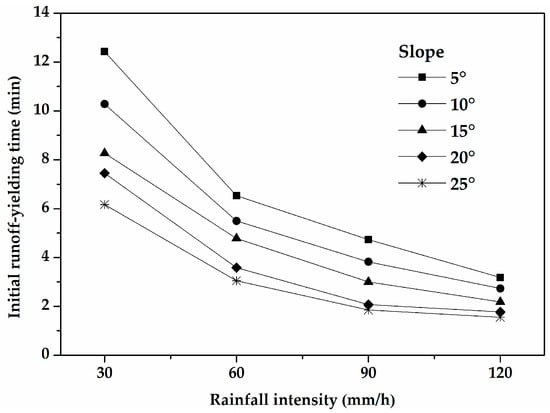
Figure 7.
Correlations between rainfall intensities and the initial rainfall-yielding times.
In Figure 7, the initial runoff time shortens when the slope rises, since increasing slope makes rainfall infiltration weaker and leads to easier runoff generation. It can be also seen that the effects of slope on the initial runoff time become indistinct as rainfall intensity increases to a certain degree. The difference among the initial runoff-yielding times on different slopes was obvious under a rainfall intensity of 30 mm/h: the longest time was 12.43 min on the 5° slope and the shortest was 6.17 min on the 25° slope. With increased rainfall intensity, the difference gradually diminishes. At a rainfall intensity of 120 mm/h, the difference between the maximum and the minimum is reduced from 6.26 min under rainfall intensity of 30 mm/h to 1.63 min. It can be seen that slope is a key factor affecting runoff generation when rainfall intensity is relatively small, and the initial runoff-yielding time decreases significantly as the slope increases. With rising rainfall intensity, the effect of rainfall intensity on runoff generation became more and more important, and the differences of the initial runoff-yielding times on different slopes lessen.
3.3. Effects of Slope on TN Losses
3.3.1. Effects of slope on TN Load in Runoff
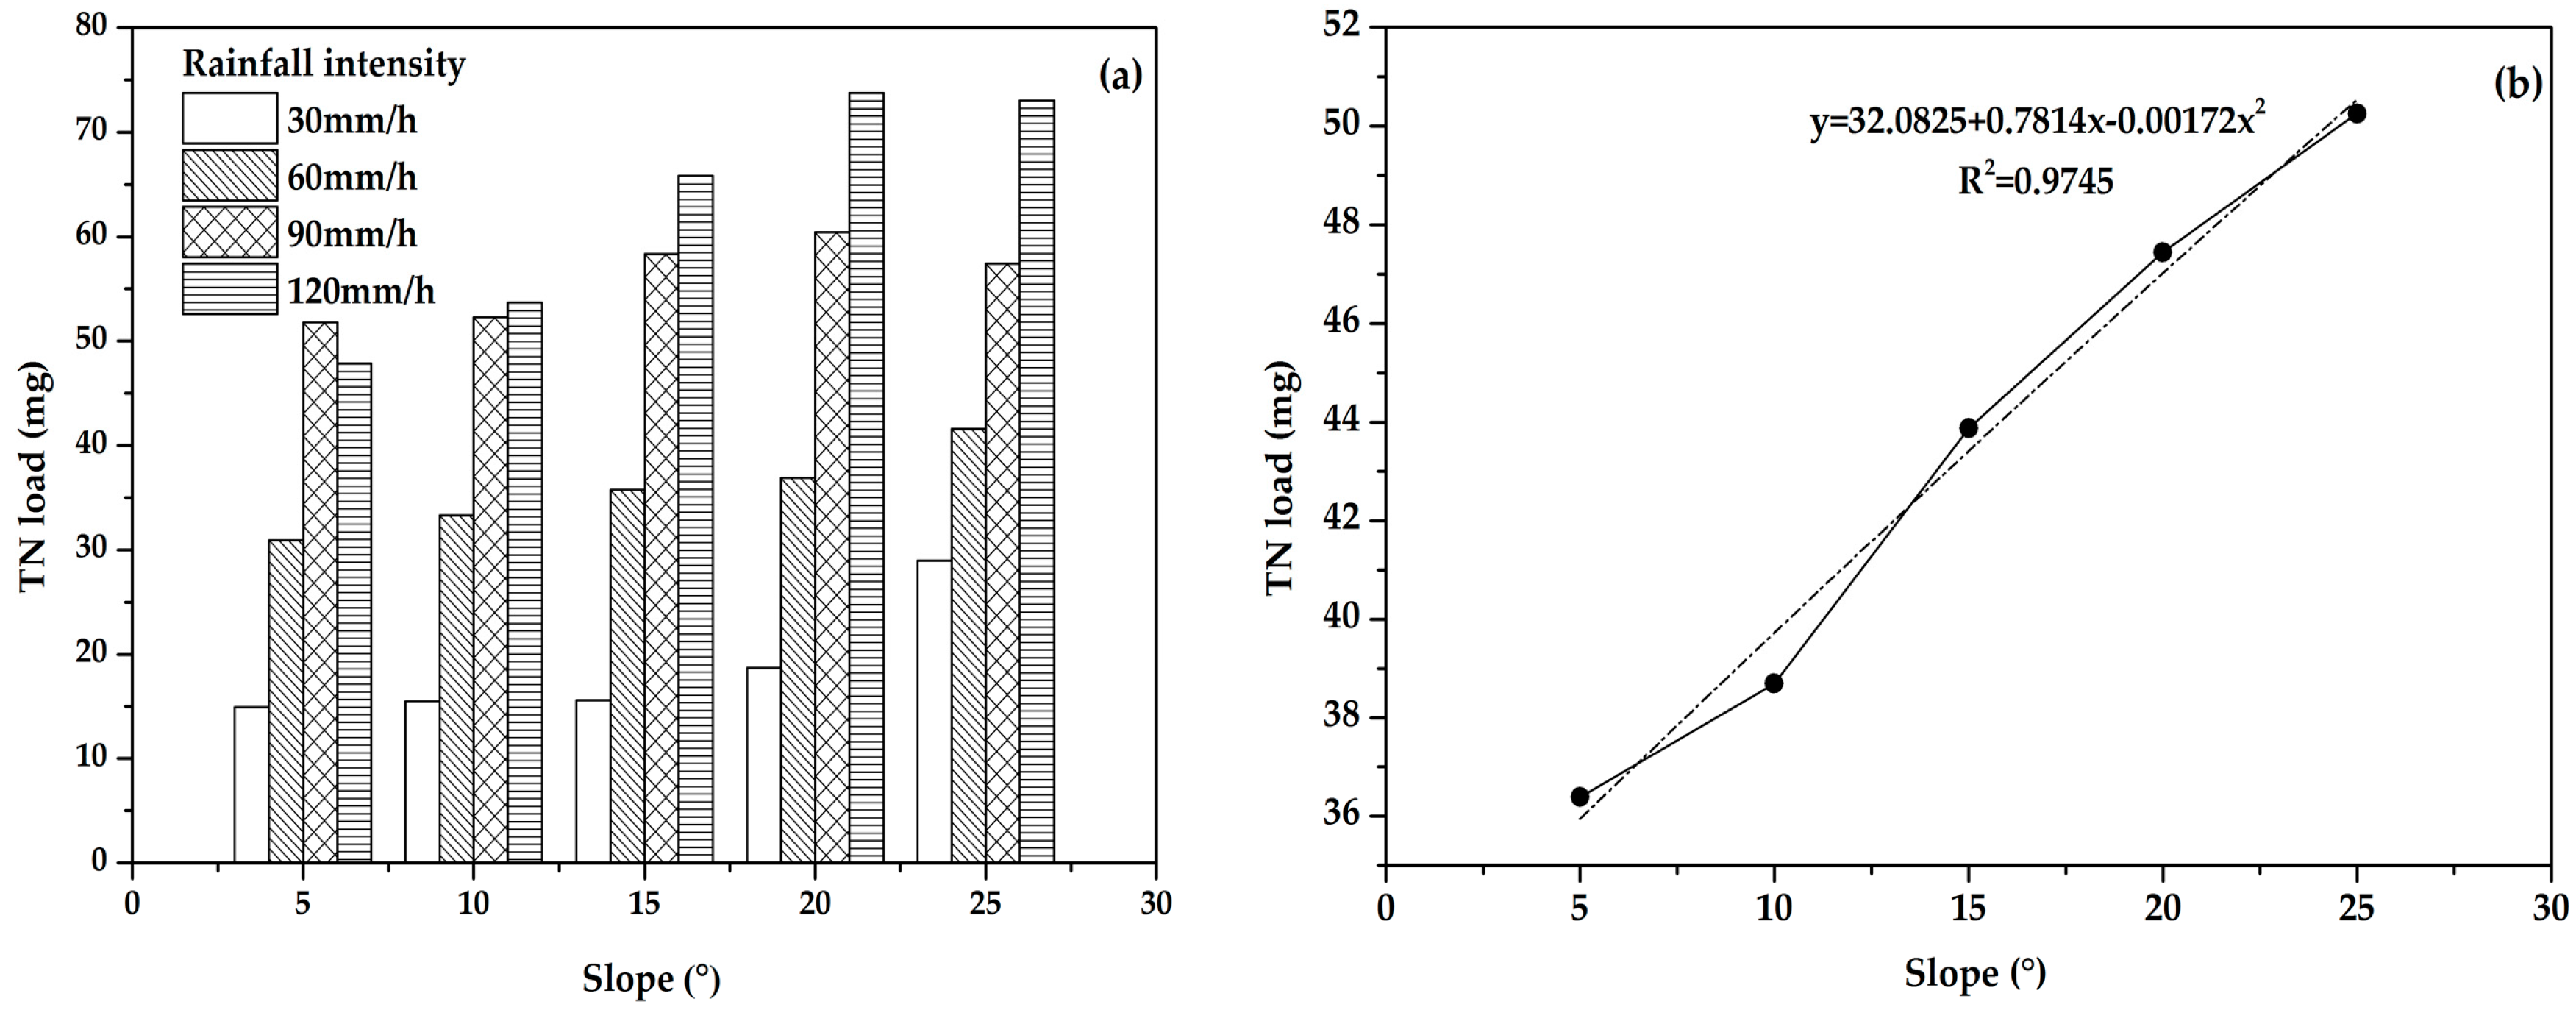
Figure 8a reflects TN loads in runoff on different slopes under different rainfall intensities. In Figure 8b, various rainfall intensities on certain slopes were averaged to eliminate the influence of rainfall intensity on TN load. The correlation between slope and TN load can be expressed as by a quadratic polynomial, and the square of correlation coefficient (R2) is 0.9745, as shown in Figure 8b.
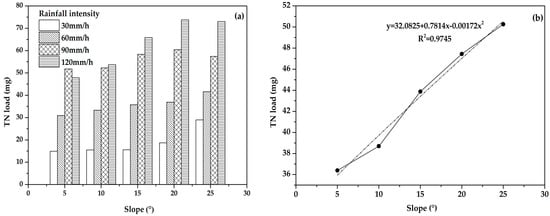
Figure 8.
(a) Effects of slopes on TN loads under different rainfall intensities; (b) Correlation between slope and TN load.
Generally, TN load rises as slope increases, under various rainfall intensity conditions. The influence of slope on TN load can be explained by the following aspects. For steeper slopes, the scouring effect is stronger, a larger amount of runoff is generated, more sediment is transported, and more serious TN loss occurs. Previous studies have shown that there is a critical value for TN loss on slopes, so that soil erosion and TN loss do not increase limitlessly with greater slope [42]. In our experiments, slight drops in Figure 8a also supported the idea that TN load might reach a peak with the rise of slope. TN load decreased slightly as slope increased from 20° to 25° under rainfall intensities of 90 mm/h and 120 mm/h.
3.3.2. Effects of Slope on TN Concentration in Runoff
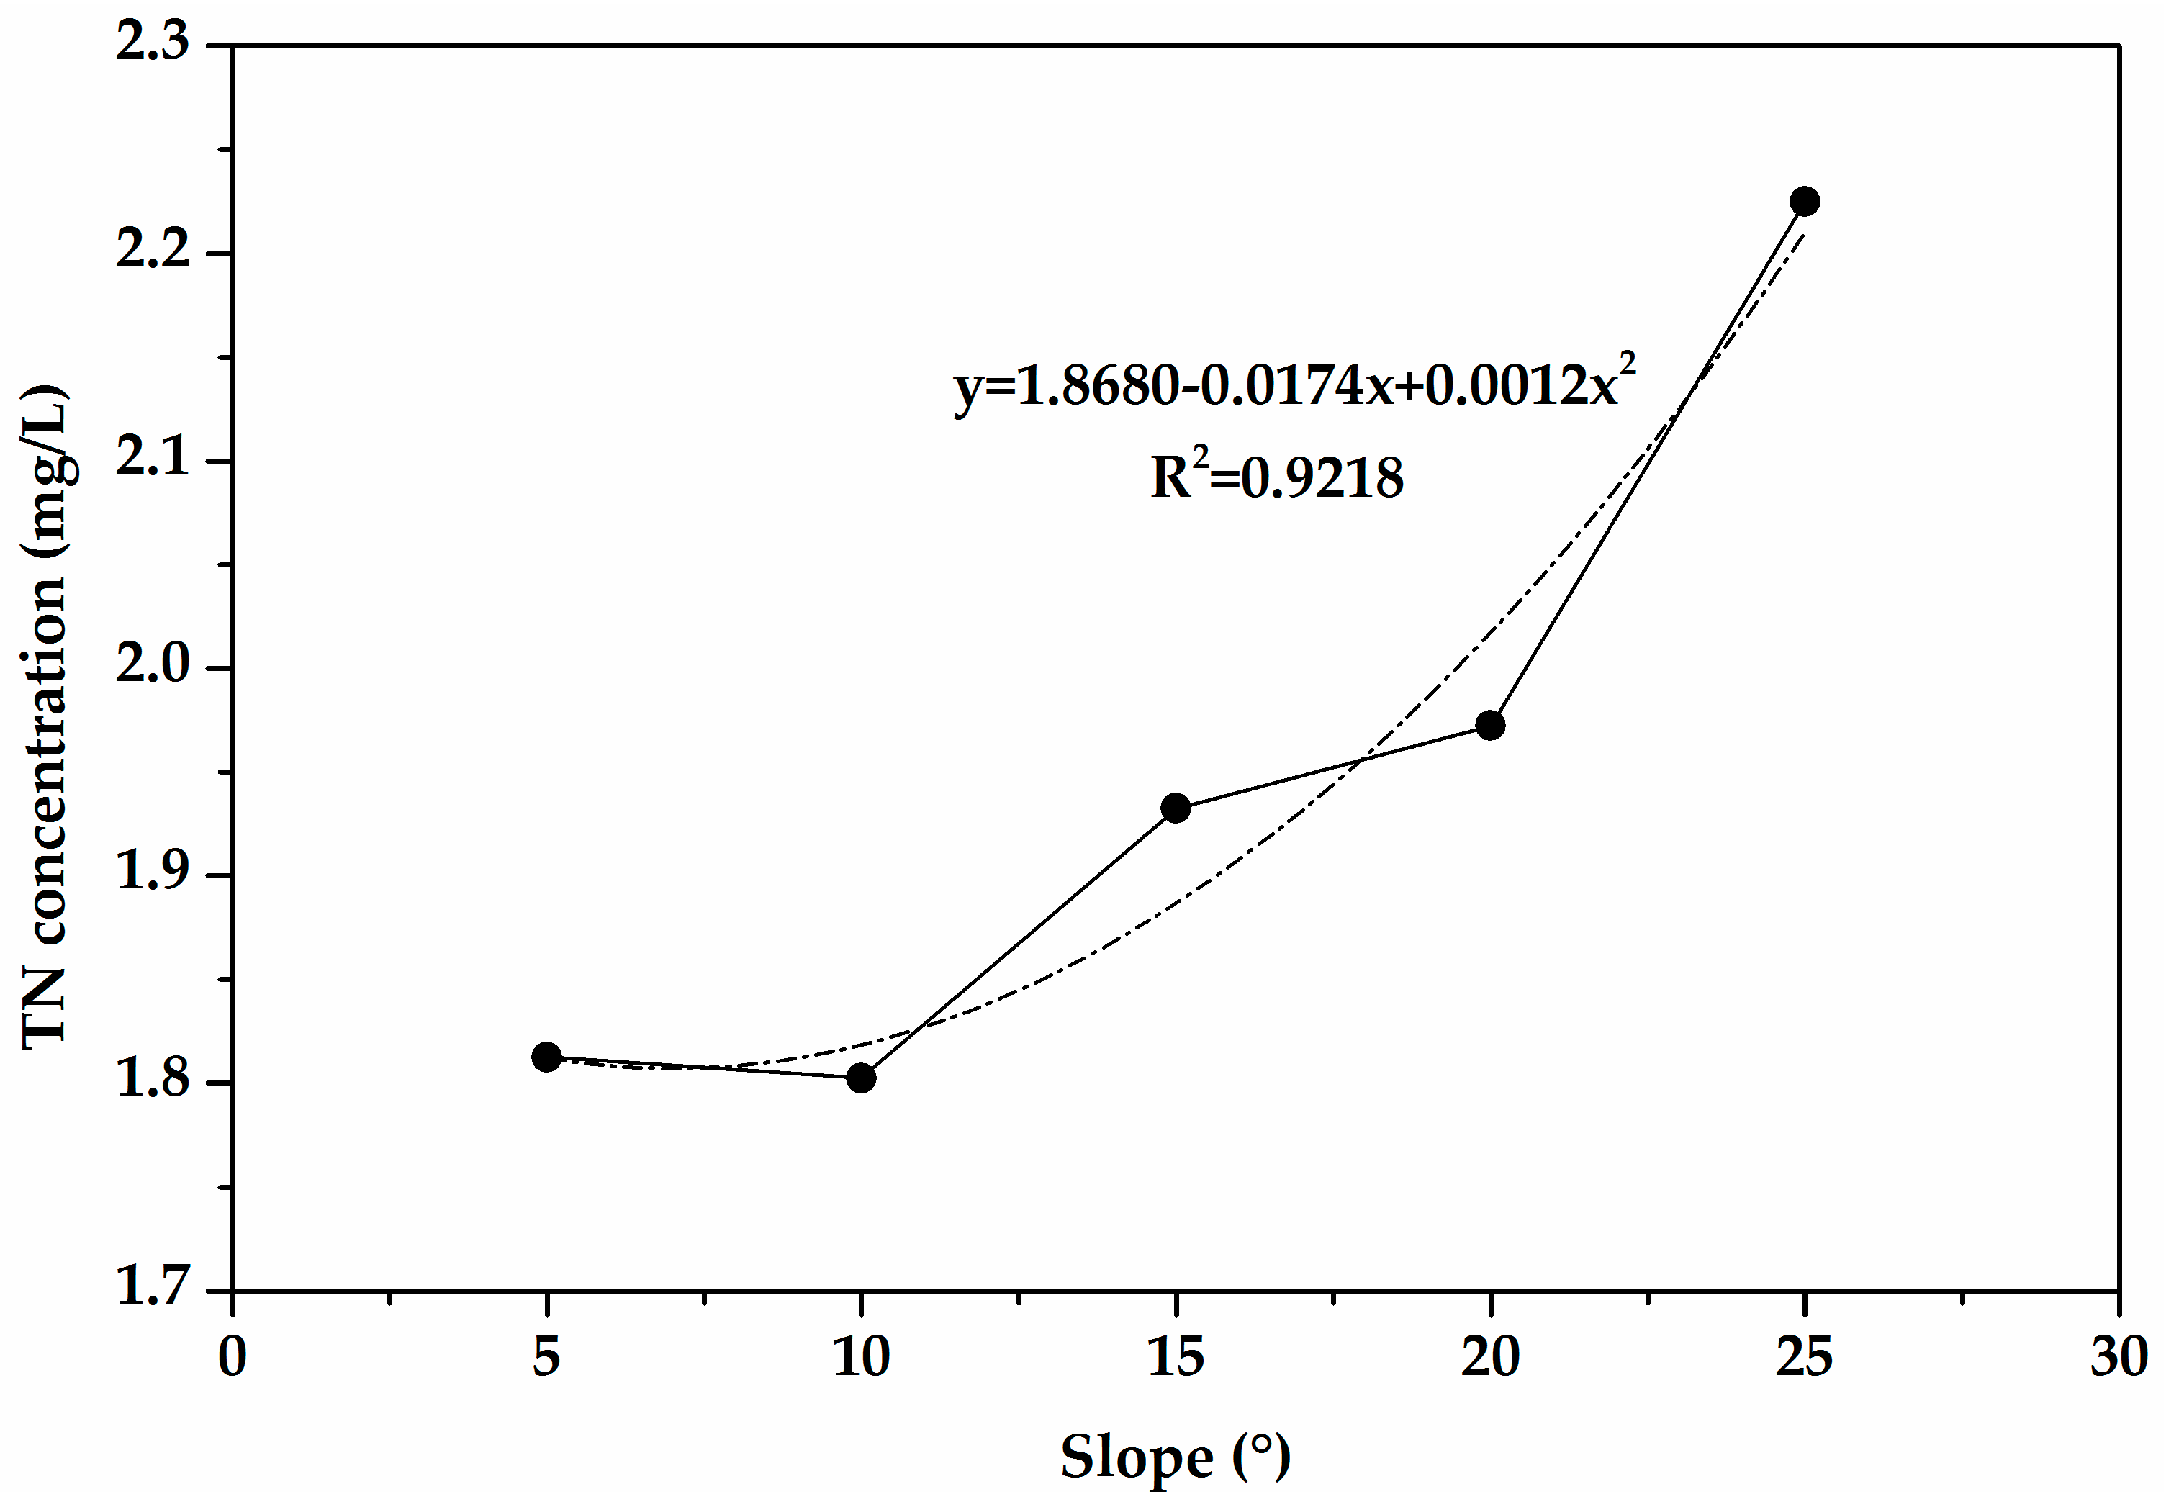
Figure 9 shows the correlation between slope and TN concentration, which can be expressed as a quadratic polynomial where the square of correlation coefficient (R2) is 0.9218. In Figure 9, four rainfall intensities on varying slope were averaged in order to eliminate the influence of rainfall intensity on TN concentration.
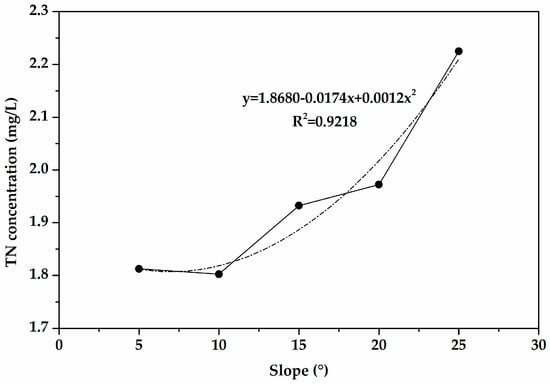
Figure 9.
Correlation between slope and TN concentration.
TN concentration showed a positive correlation with slope, and increases were more obvious for steeper slopes. It can be explained that the steeper the slope was, the faster the velocity of water flow became, the stronger the scouring effect, the worse the soil erosion, so that nitrogen dissolution and adsorbed nitrogen loss are greater. However, runoff generated from different slopes does not vary very much with rainfall intensity; therefore, TN concentration rises with the increase of slope. Moreover, the increases were more obvious for steeper slopes, which also indicated that the increases of TN loads were more significant than those of runoff for greater slopes.
3.3.3. Effects of Slope on the Initial Runoff-Yielding Time
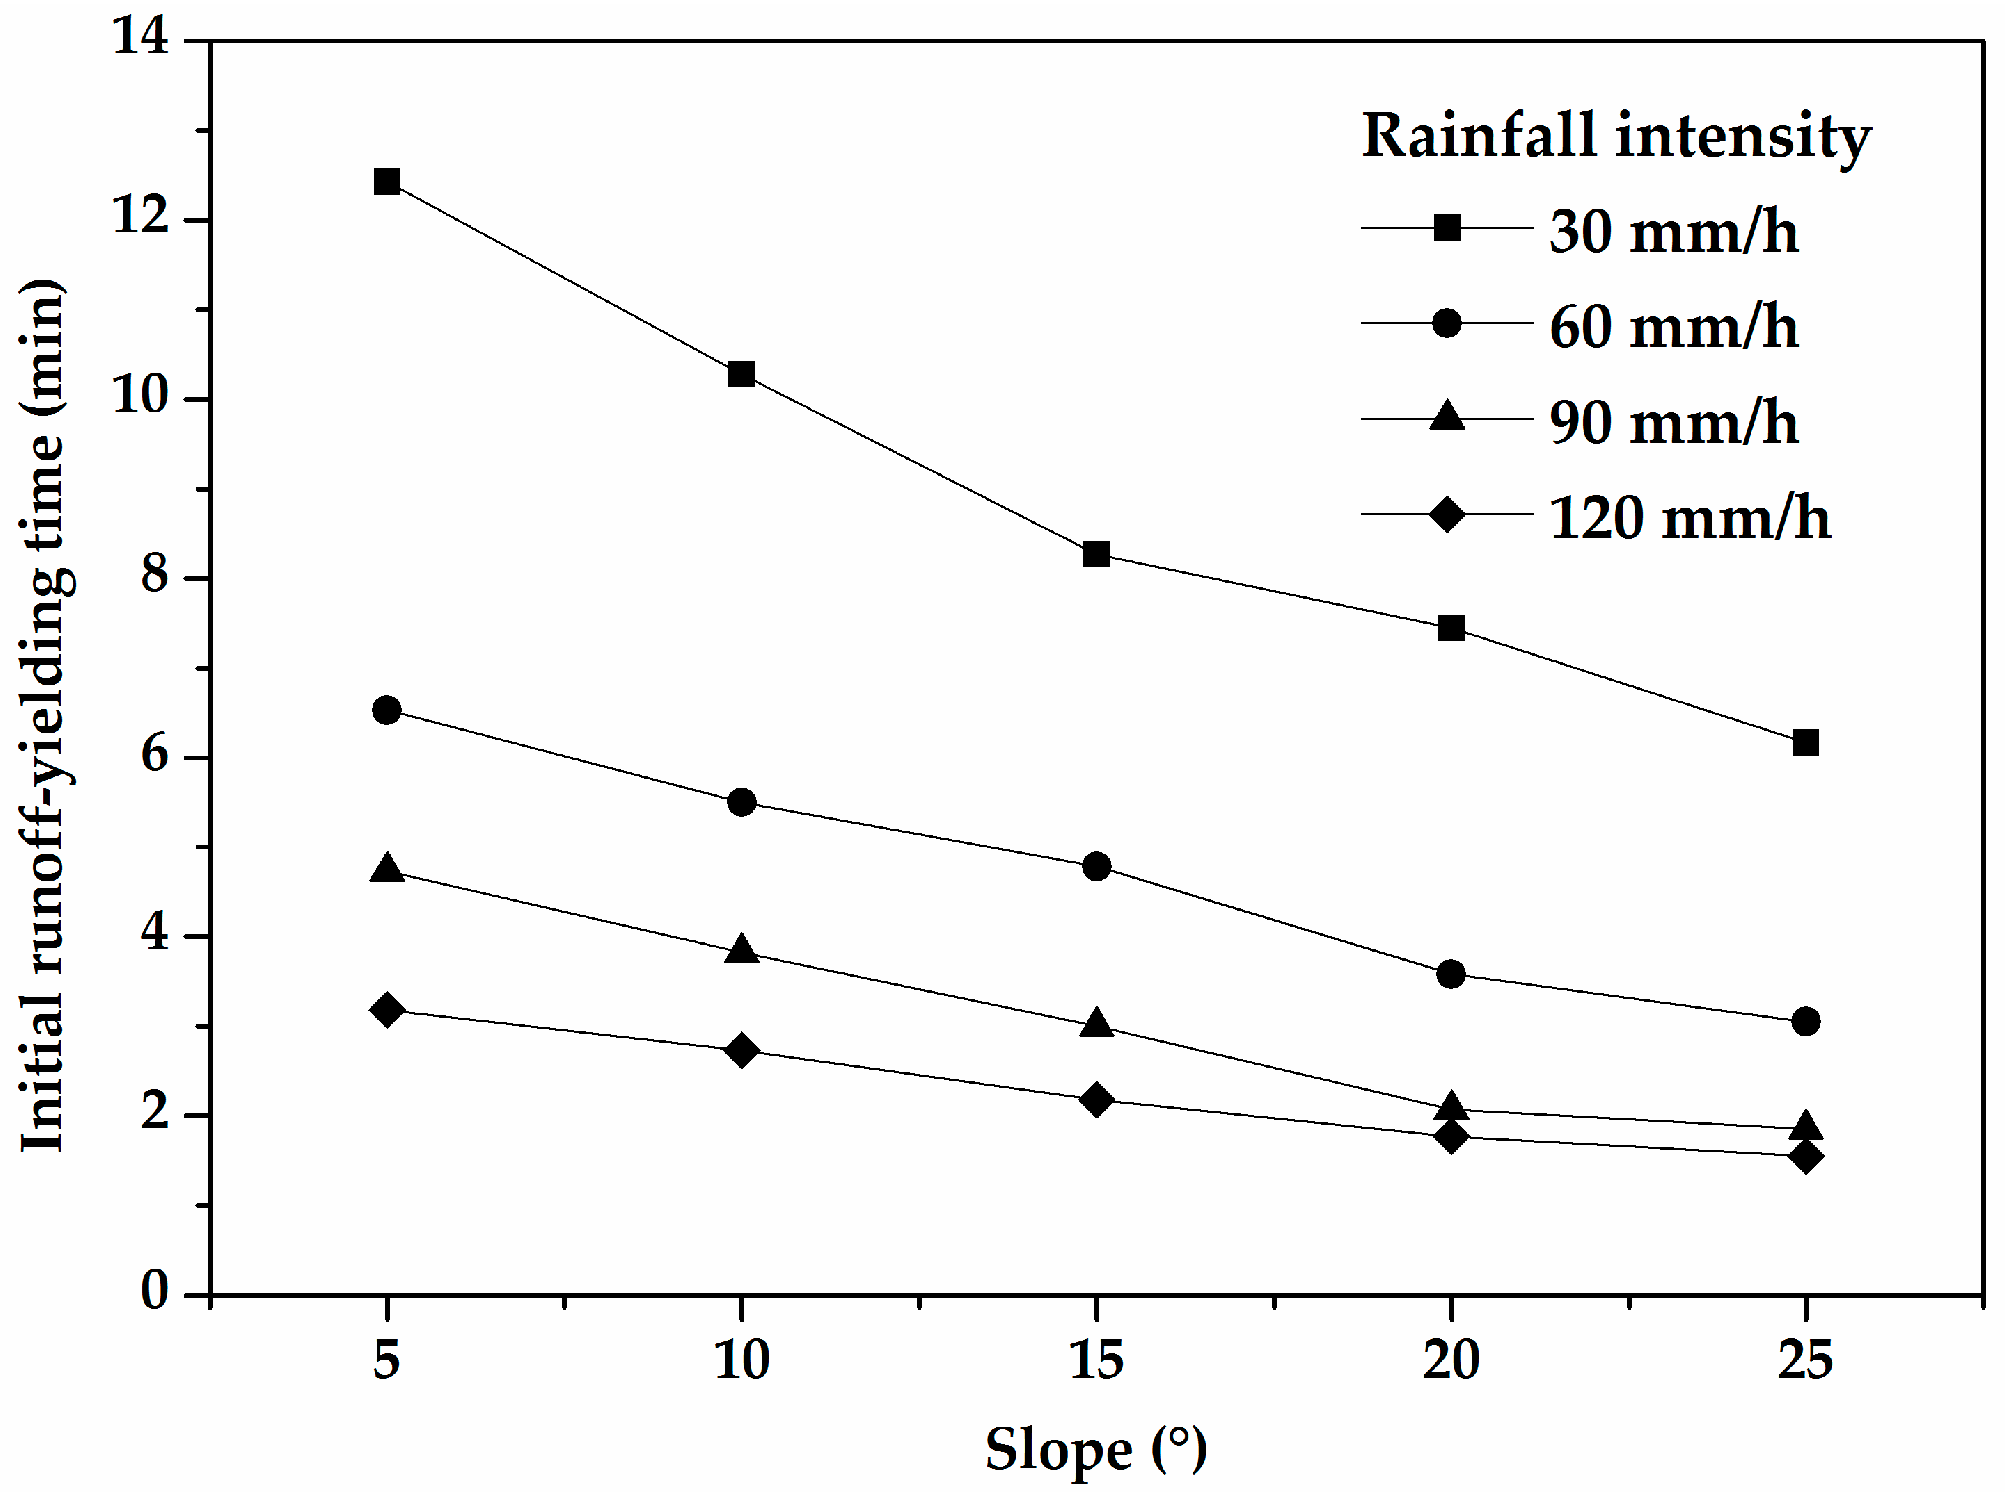
In our experiments, the relationships between slope and the initial runoff-yielding times showed negative correlations for all rainfall intensities (Figure 10). For a steeper slope, the contact time between rainfall and sloping field was shorter, the gravity of rainfall drops in slope surface direction became larger, rainfall infiltration was weakened, and runoff formed more easily; hence the initial runoff-yielding time was shorter. Figure 10 also shows that the differences among initial runoff-yielding times under various rainfall intensities diminish gradually with increasing of slope. Therefore, it can be deduced that slope plays a more important role in runoff generation as it increases, due to the increasing impacts of various factors.
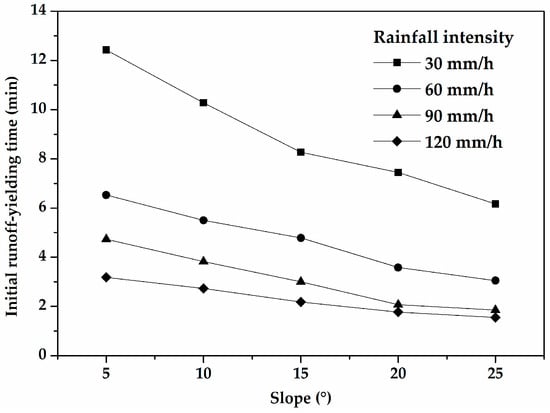
Figure 10.
Correlations between slopes and the initial rainfall-yielding times.
4. Conclusions
In this study, the influence mechanisms of rainfall and terrain characteristics on total nitrogen (TN) losses from regosol were revealed by a series of artificial rainfall experiments. Natural rainfall and terrain conditions were simulated in 20 designed scenarios, which consisted of four rainfall intensities (30 mm/h, 60 mm/h, 90 mm/h, and 120 mm/h) and five slopes (5°, 10°, 15°, 20°, and 25°), with runoff-yielding time lasting 40 min.
The results showed that there were positive linear relationships between precipitations and TN loads under different slopes. There were delays before runoff generation, which demonstrated that there was an interval between the beginning of rainfall and runoff generation. In contrast, negative linear relationships represented the correlations between precipitations and TN concentrations, and the decreases of TN concentrations with increased precipitation were obvious on sloping fields at 5° and 25° of slope. The effects of rainfall on TN loss indicated that total precipitation was an important influencing factor and driving force for TN loss. Due to the obvious relationship between precipitation and rainfall intensity, the effects of rainfall intensity on TN load were similar to those of precipitation on TN load. As far as the effects of rainfall intensity on TN concentration were considered, they presented as a negative correlation. Similarly, the initial runoff-yielding time also showed a negative correlation with increased rainfall intensity. The initial runoff-yielding time was short for a steep slope, and the differences among the initial runoff-yielding times under designed slopes decreased as the rainfall intensity increased. TN load generally increased with an increase of slope, but not limitlessly, which can be deduced by slight drops of TN load on slopes with 25° comparing to TN loads on slopes with 20° under rainfall intensities of 90 mm/h and 120 mm/h. As for the relationship between slope and TN concentration, results showed that it was a positive one, with upward trends of TN concentrations with increasing slope more obvious for steeper slopes. Initial runoff-yielding times exhibited downward trends with increasing of slope, and the differences under various rainfall intensities diminished gradually with increasing of slope. It could be concluded that the steeper the slope was, the more serious the TN loss was.
Other research has shown that TN losses increased with increased rainfall intensity and TN concentration in runoff did not limitlessly increase, and those results were confirmed by this study [42,43]. The runoff volume increased with the increasing rainfall intensity and the increasing soil moisture content, and decreased with the increasing vegetation cover. These factors also significantly affected the losses of N. In other words, a longer and more intense rainfall resulted in a higher loss of N [23]. The N concentration in runoff was high at an early stage, and then reduced with increasing time [44]. All of this research presented conclusions similar to those of this study. This study reveals the effects of precipitation, rainfall intensity, and slope on TN losses from regosol with quantitative correlation analysis, which has not been discussed thoroughly in previous studies. This study provides theoretical support for NPS pollution simulation and pollution control in reference to these influential factors and their influence mechanisms. The effects of rainfall and terrain on dissolved nitrogen in runoff and adsorbed nitrogen on sediments are also shown here. In the future, we hope to determine the critical slope value of TN losses from regosol and the influence mechanisms of natural rainwater and underlying surfaces on TN loss under multiple rainfalls.
Acknowledgments
This research work was funded by the National Natural Science Foundation of China (51309097), the National Key Scientific and Technological Projects of the PRC (2014ZX07104-005), and the Fundamental Research Funds for the Central Universities of PRC. The authors gratefully acknowledge the financial support of the programs and agencies.
Author Contributions
Xiaowen Ding conceived and designed the experiments; Ming Lin performed the experiments; Guihong Jiang contributed to data measurement; Ying Xue analyzed the data; Xiaowen Ding and Ying Xue wrote the paper.
Conflicts of Interest
The authors declare no conflicts of interest.
References
- Kalavrouziotis, I.K.; Arambatzis, C.; Kalfountzos, D.; Varnavas, S.P. Wastewater Reuse Planning in Agriculture: The Case of Aitoloakarnania, Western Greece. Water 2011, 3, 988–1004. [Google Scholar] [CrossRef]
- Sui, J.; Wang, J.; Gong, S.; Xu, D.; Zhang, Y. Effect of Nitrogen and Irrigation Application on Water Movement and Nitrogen Transport for a Wheat Crop under Drip Irrigation in the North China Plain. Water 2015, 7, 6651–6672. [Google Scholar] [CrossRef]
- Ahmed, W.; Hughes, B.; Harwood, V.J. Current Status of Marker Genes of Bacteroides and Related Taxa for Identifying Sewage Pollution in Environmental Waters. Water 2016, 8, 231. [Google Scholar] [CrossRef]
- Park, Y.S.; Engel, B.A.; Harbor, J. A Web-Based Model to Estimate the Impact of Best Management Practices. Water 2014, 6, 455–471. [Google Scholar] [CrossRef]
- Ahn, S.R.; Kim, S.J. The Effect of Rice Straw Mulching and No-Tillage Practice in Upland Crop Areas on Nonpoint-Source Pollution Loads Based on HSPF. Water 2016, 8, 106. [Google Scholar] [CrossRef]
- Alvarez, S.; Asci, S.; Vorotnikova, E. Valuing the Potential Benefits of Water Quality Improvements in Watersheds Affected by Non-Point Source Pollution. Water 2016, 8, 112. [Google Scholar] [CrossRef]
- Blumstein, M.; Thompson, J.R. Land-use impacts on the quantity and configuration of ecosystem service provisioning in Massachusetts, USA. J. Appl. Ecol. 2015, 52, 32–47. [Google Scholar] [CrossRef]
- Datri, C.W.; Pray, C.L.; Zhang, Y.X.; Nowlin, W.H. Nutrient enrichment scarcely affects ecosystem impacts of a non-native herbivore in a spring-fed river. Freshw. Biol. 2015, 60, 551–562. [Google Scholar] [CrossRef]
- Xing, W.M.; Yang, P.L.; Ren, S.M.; Ao, C.; Li, X.; Gao, W.H. Slope length effects on processes of total nitrogen loss under simulated rainfall. Catena 2016, 139, 73–81. [Google Scholar] [CrossRef]
- Shen, Z.Y.; Chen, L.; Hong, Q.; Qiu, J.L.; Xie, H.; Liu, R.M. Assessment of nitrogen and phosphorus loads and casual factors from different land use and soil types in the Three Gorges Reservoir Area. Sci. Total Environ. 2013, 454–455, 383–392. [Google Scholar] [CrossRef] [PubMed]
- Recanatesi, F.; Ripa, M.N.; Leone, A.; Luigi, P.; Luca, S. Erratum to: Land use, climate and transport of nutrients: Evidence emerging from the Lake Vico case study. Environ. Manag. 2013, 52, 503–513. [Google Scholar] [CrossRef] [PubMed]
- Gaddamwar, A.G.; Rajput, P.R. Analytical study of Bembala damp water for fishery capacity, portability and suitability for agricultural purposes. Int. J. Environ. Sci. 2012, 2, 1278–1283. [Google Scholar]
- Laine-Kaulio, H.; Koivusalo, H.; Komarov, A.S.; Lappalainen, M.; Launiainenc, S.; Laurénc, A. Extending the ROMUL model to simulate the dynamics of dissolved and sorbed C and N compounds in decomposing boreal mor. Ecol. Model. 2014, 272, 277–292. [Google Scholar] [CrossRef]
- Darmawi, S.; Burkhardt, S.; Leichtweiss, T.; Weber, D.A.; Wenzel, S.; Janek, J.; Elm, M.T.; Klar, P.J. Correlation of electrochromic properties and oxidation states in nanocrystalline tungsten trioxide. Phys. Chem. Chem. Phys. 2015, 17, 15903–15911. [Google Scholar] [CrossRef] [PubMed]
- Hu, B.Q.; Wang, H.J.; Yang, Z.S.; Sun, X.X. Temporal and spatial variations of sediment rating curves in the Changjiang (Yangtze River) basin and their implications. Quat. Int. 2011, 230, 34–43. [Google Scholar] [CrossRef]
- Hu, G.Y.; Dong, Z.B.; Lu, J.F.; Yan, C.Z. Driving forces responsible for aeolian desertification in the source region of the Yangtze River from 1975 to 2005. Environ. Earth Sci. 2012, 66, 257–263. [Google Scholar] [CrossRef]
- Pan, B.Z.; Wang, H.Z.; Ban, X.; Yin, X.A. An exploratory analysis of ecological water requirements of macroinvertebrates in the Wuhan branch of the Yangtze River. Quat. Int. 2015, 380, 256–261. [Google Scholar] [CrossRef]
- Liu, B.; Hu, Q.; Wang, W.P.; Zeng, X.F.; Zhai, J.Q. Variation of actual evapotranspiration and its impact on regional water resources in the Upper Reaches of the Yangtze River. Quat. Int. 2011, 244, 185–193. [Google Scholar]
- Ding, X.W.; Shen, Z.Y.; Hong, Q.; Yang, Z.F.; Wu, X.; Liu, R.M. Development and test of the Export Coefficient Model in the upper reach of the Yangtze River. J. Hydrol. 2010, 383, 233–244. [Google Scholar] [CrossRef]
- Zhang, N.; He, H.M.; Zhang, S.F.; Jiang, X.H.; Xia, Z.Q.; Huang, F. Influence of reservoir operation in the upper reaches of the Yangtze River (China) on the inflow and outflow regime of the TGR-based on the Improved SWAT Model. Water Resour. Manag. 2012, 26, 691–705. [Google Scholar] [CrossRef]
- Li, C.L.; Zhou, J.Z.; Ouyang, S.; Wang, C.; Liu, Y. Water Resources Optimal Allocation Based on Large-scale Reservoirs in the Upper Reaches of Yangtze River. Water Resour. Manag. 2015, 29, 2171–2187. [Google Scholar] [CrossRef]
- Zhao, X.L.; Jiang, T.; Du, B. Effect of organic matter and calcium carbonate on behaviors of cadmium adsorption-desorption on/from purple paddy soils. Chemosphere 2014, 99, 41–48. [Google Scholar] [CrossRef] [PubMed]
- Liu, R.M.; Wang, J.W.; Shi, J.H.; Chen, Y.X.; Sun, C.C.; Zhang, P.P.; Shen, Z.Y. Runoff characteristics and nutrient loss mechanism from plain farmland under simulated rainfall conditions. Sci. Total Environ. 2014, 468, 1069–1077. [Google Scholar] [CrossRef] [PubMed]
- Patil, R.H.; Laegdsmand, M.; Olesen, J.E.; Porter, J.R. Effect of soil warming and rainfall patterns on soil n cycling in northern europe. Agric. Ecosyst. Environ. 2010, 139, 195–205. [Google Scholar] [CrossRef]
- Ding, X.W.; Shen, Z.Y.; Liu, R.M.; Chen, L.; Lin, M. Effects of ecological factors and human activities on nonpoint source pollution in the upper reach of the Yangtze River and its management strategies. Hydrol. Earth Syst. Sci. Discuss. 2013, 11, 691–721. [Google Scholar] [CrossRef]
- Kakuturu, S.; Chopra, M.; Hardin, M.; Wanielista, M. Total nitrogen losses from fertilized turfs on simulated highway slopes in Florida. J. Environ. Eng. 2013, 139, 829–837. [Google Scholar] [CrossRef]
- Shin, J.; Gil, K. Effect of rainfall characteristics on removal efficiency evaluation in vegetative filter strips. Environ. Earth Sci. 2014, 72, 601–607. [Google Scholar] [CrossRef]
- Diaz, D.A.R.; Sawyer, J.E.; Barker, D.W.; Mallarino, A.P. Runoff Nitrogen Loss with Simulated Rainfall Immediately Following Poultry Manure Application for Corn Production. Soil Sci. Soc. Am. J. 2010, 74, 221–230. [Google Scholar] [CrossRef]
- Hao, C.L.; Yan, D.H.; Xiao, W.H.; Shi, M.; He, D.W.; Sun, Z.X. Impacts of typical rainfall processes on nitrogen in typical rainfield of black soil region in northeast china. Arab. J. Geosci. 2015, 8, 1–13. [Google Scholar] [CrossRef]
- Wang, H.J.; Shi, X.Z.; Yu, D.S.; Weindorf, D.C.; Huang, B.; Sun, W.X.; Ritsema, C.J.; Milne, E. Factors determining soil nutrient distribution in a small-scaled watershed in the purple soil region of Sichuan Province, China. Soil Tillage Res. 2009, 105, 35–44. [Google Scholar] [CrossRef]
- Wilson, C.; Weng, Q. Assessing surface water quality and its relation with urban land cover changes in the Lake Calumet area, Greater Chicago. Environ. Manag. 2010, 45, 1096–1111. [Google Scholar] [CrossRef] [PubMed]
- Chen, X.; Huang, Y.; Zhao, Y.; Mo, B.; Mi, H. Comparison of loess and purple rill erosions measured with volume replacement method. J. Hydrol. 2015, 530, 476–483. [Google Scholar] [CrossRef]
- Shen, Z.Y.; Chen, L.; Ding, X.W.; Hong, Q.; Liu, R.M. Long-term variation (1960–2003) and causal factors of non-point-source nitrogen and phosphorus in the upper reach of the Yangtze River. J. Hazard. Mater. 2013, 252, 45–56. [Google Scholar] [CrossRef] [PubMed]
- Philippot, L.; Spor, A.; Hénault, C.; Bru, D.; Bizouard, F.; Jones, C.M.; Sarr, A.; Maron, P.A. Loss in microbial diversity affects nitrogen cycling in soil. ISME J. 2013, 7, 1609–1619. [Google Scholar] [CrossRef] [PubMed]
- Hassink, J. The capacity of soils to preserve organic c and n by their association with clay and silt particles. Plant Soil 1997, 191, 77–87. [Google Scholar] [CrossRef]
- Marcarelli, A.M.; Wurtsbaugh, W.A. Temperature and nutrient supply interact to control nitrogen fixation in oligotrophic streams: An experimental examination. Limnol. Oceanogr. 2006, 51, 2278–2289. [Google Scholar] [CrossRef]
- Huang, J.; Wu, P.; Zhao, X.N. Effects of rainfall intensity, underlying surface and slope gradient on Soil infiltration under simulated rainfall experiments. Catena 2013, 104, 93–102. [Google Scholar] [CrossRef]
- Hong, J.; Li, T.; Xuan, H.; Yang, X.; He, Z. Effects of pH and low molecular weight organic acids on competitive adsorption and desorption of cadmium and lead in paddy soils. Environ. Monit. Assess. 2012, 184, 6325–6335. [Google Scholar]
- Gondar, D.; López, R.; Antelo, J.; Fiol, S.; Arce, F. Effect of organic matter and pH on the adsorption of metalaxyl and penconazole by soils. J. Hazard. Mater. 2013, 260, 627–633. [Google Scholar] [CrossRef] [PubMed]
- Gross, A.; Boyd, C.E.; Seo, J. Evaluation of the Ultraviolet Spectrophotometric Method for the Measurement of Total Nitrogen in Water. J. World Aquac. Soc. 1999, 30, 388–393. [Google Scholar] [CrossRef]
- Jiang, F.; Zhou, K.; Deng, H.; Li, X.; Zhong, Y. Study on Enterprise’s Employees’ Safety Training Based on SPSS. In Proceedings of the 2009 International Conference on Computational Intelligence and Software Engineering, Wuhan, China, 11–13 December 2009; IEEE: New York, NY, USA, 2009; pp. 1–4. [Google Scholar]
- Shao, X.J.; Wang, H.; Hu, H.W. Experimental and modeling approach to the study of the critical slope for the initiation of rill flow erosion. Water Resour. Res. 2005, 41, W12405. [Google Scholar] [CrossRef]
- Schwenke, G.D.; Haigh, B.M. The interaction of seasonal rainfall and nitrogen fertiliser rate on soil N2O emission, total N loss and crop yield of dryland sorghum and sunflower grown on sub-tropical Vertosols. Soil Res. 2016, 54, 604–618. [Google Scholar] [CrossRef]
- Qian, J.; Zhang, L.P.; Wang, W.Y.; Liu, Q. Effects of vegetation cover and slope length on nitrogen and phosphorus loss from a sloping land under simulated rainfall. Pol. J. Environ. Stud. 2014, 23, 835–843. [Google Scholar]
© 2017 by the authors. Licensee MDPI, Basel, Switzerland. This article is an open access article distributed under the terms and conditions of the Creative Commons Attribution (CC BY) license ( http://creativecommons.org/licenses/by/4.0/).

