Optimization Strategy for Improving the Energy Efficiency of Irrigation Systems by Micro Hydropower: Practical Application
Abstract
1. Introduction
2. Methods and Materials in the Optimization Strategy
2.1. Methods
2.2. Materials
Characterization of the Hydraulic Machine
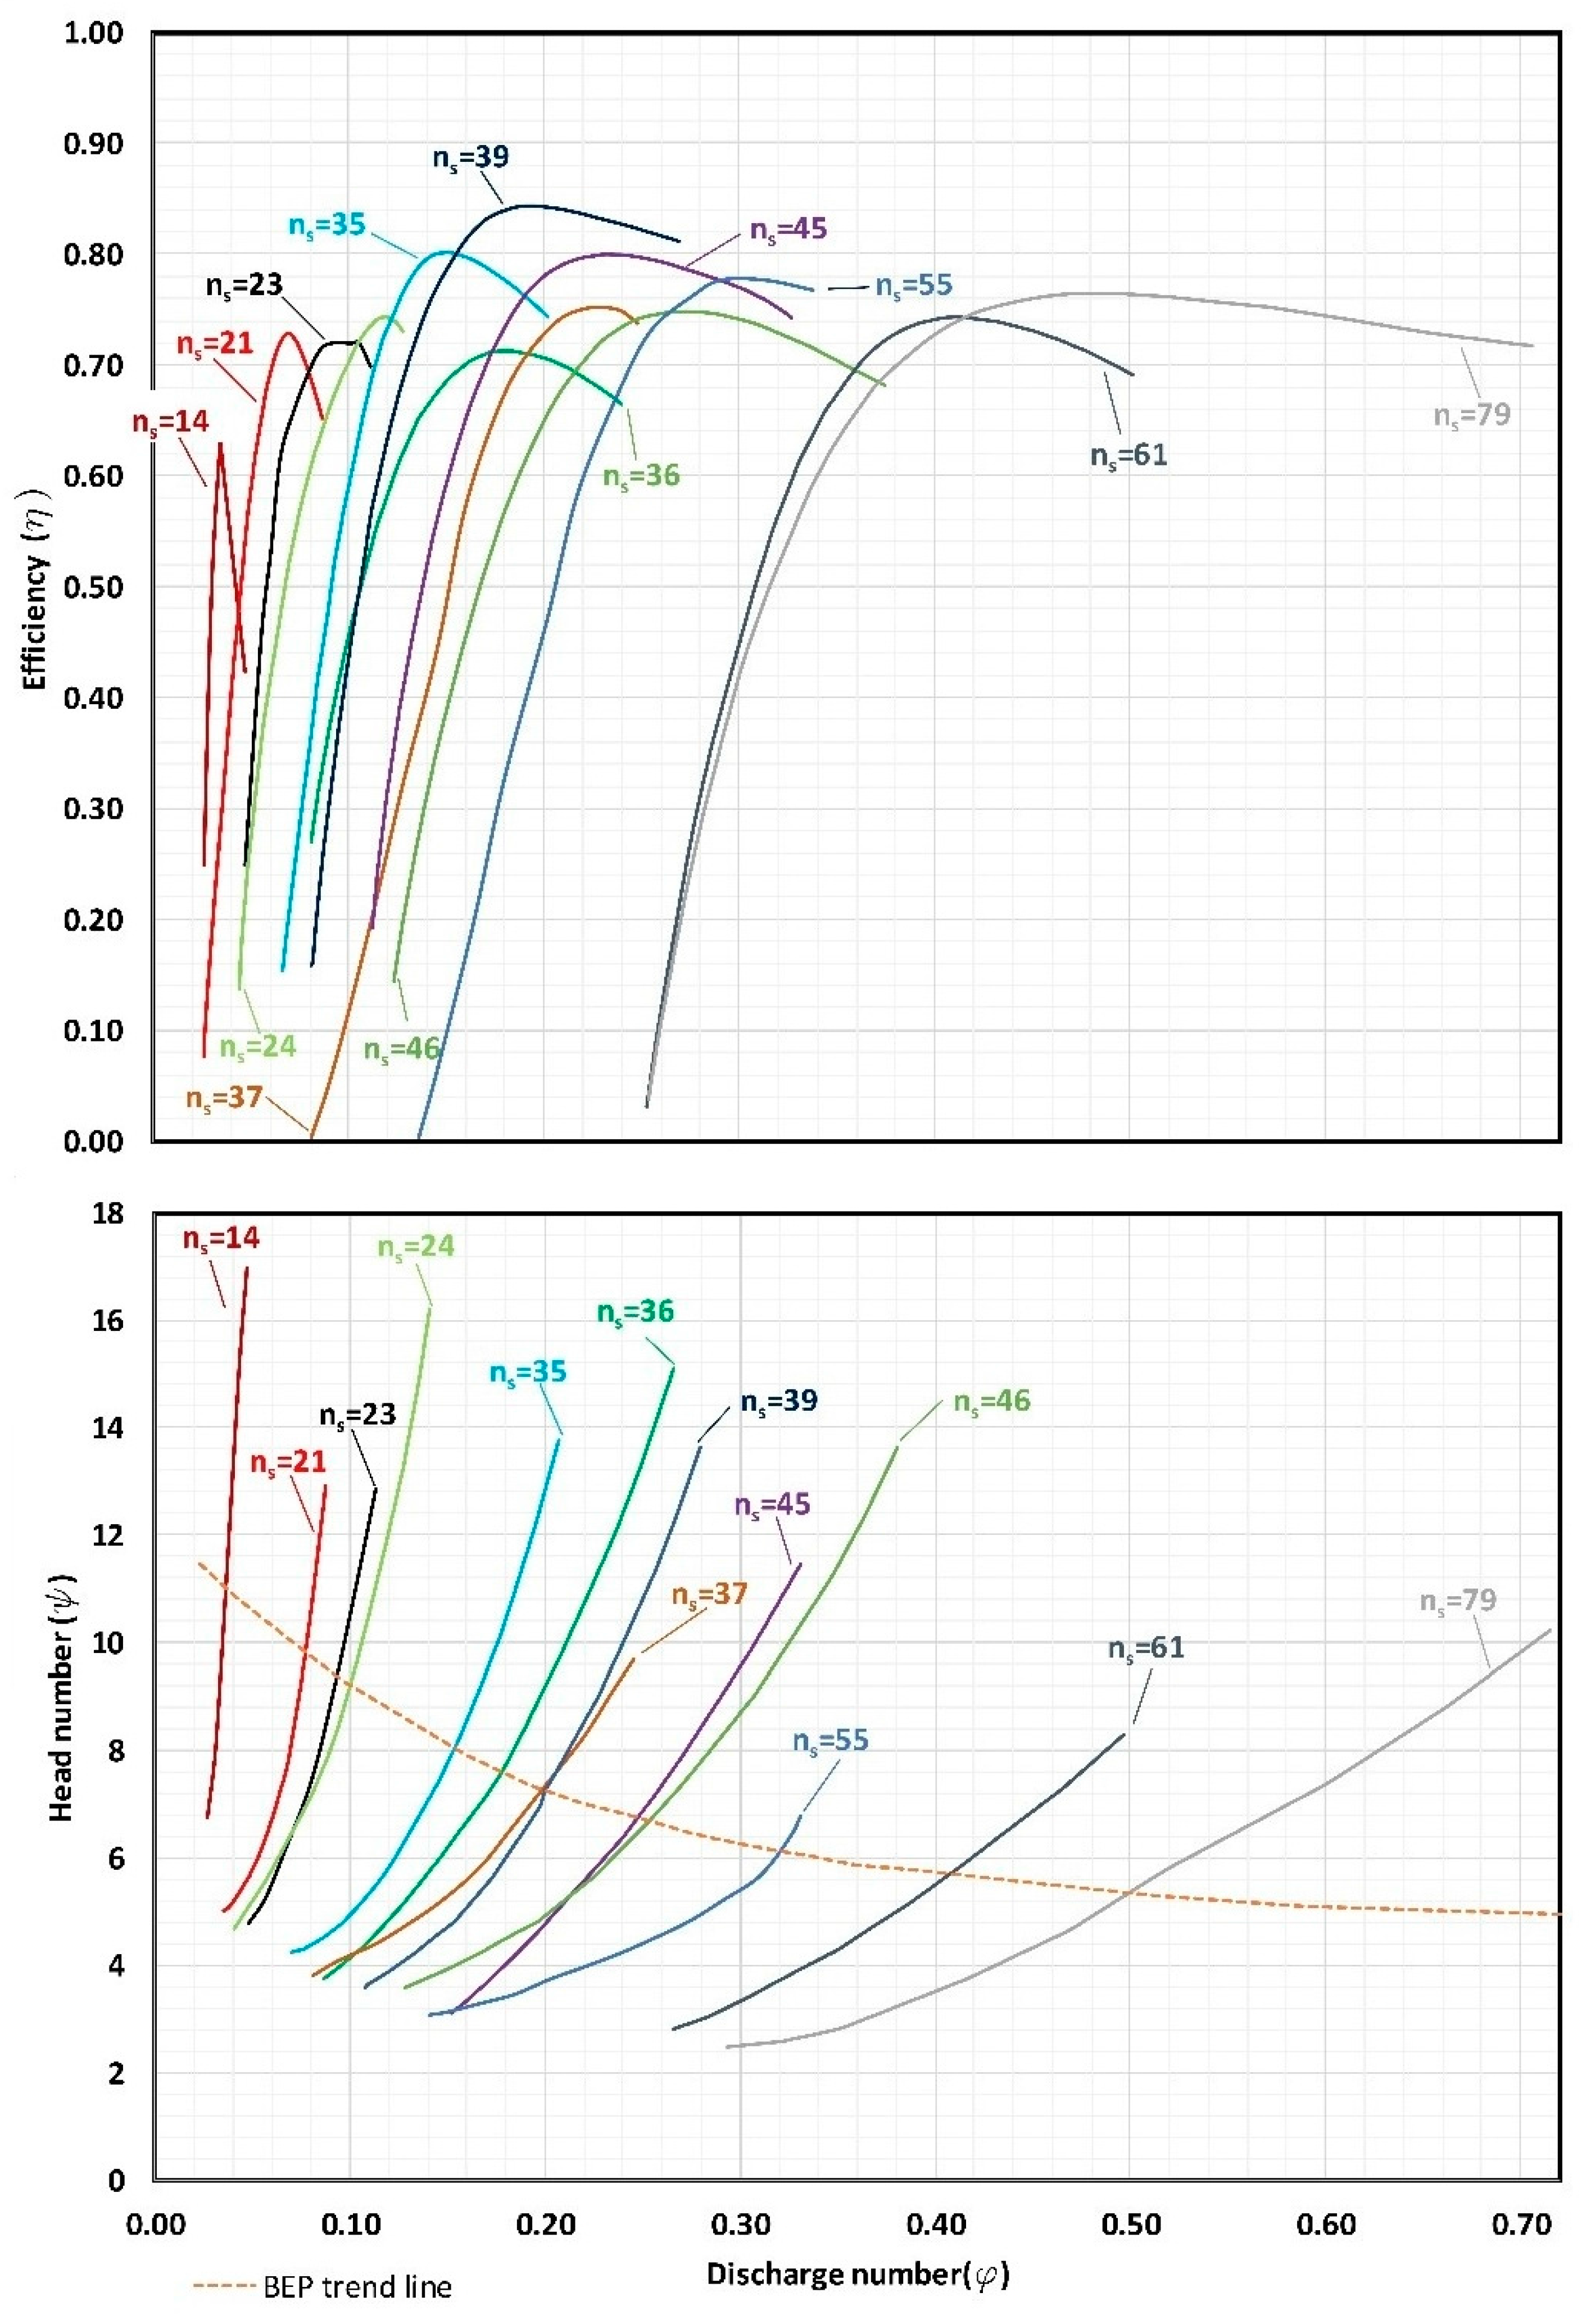
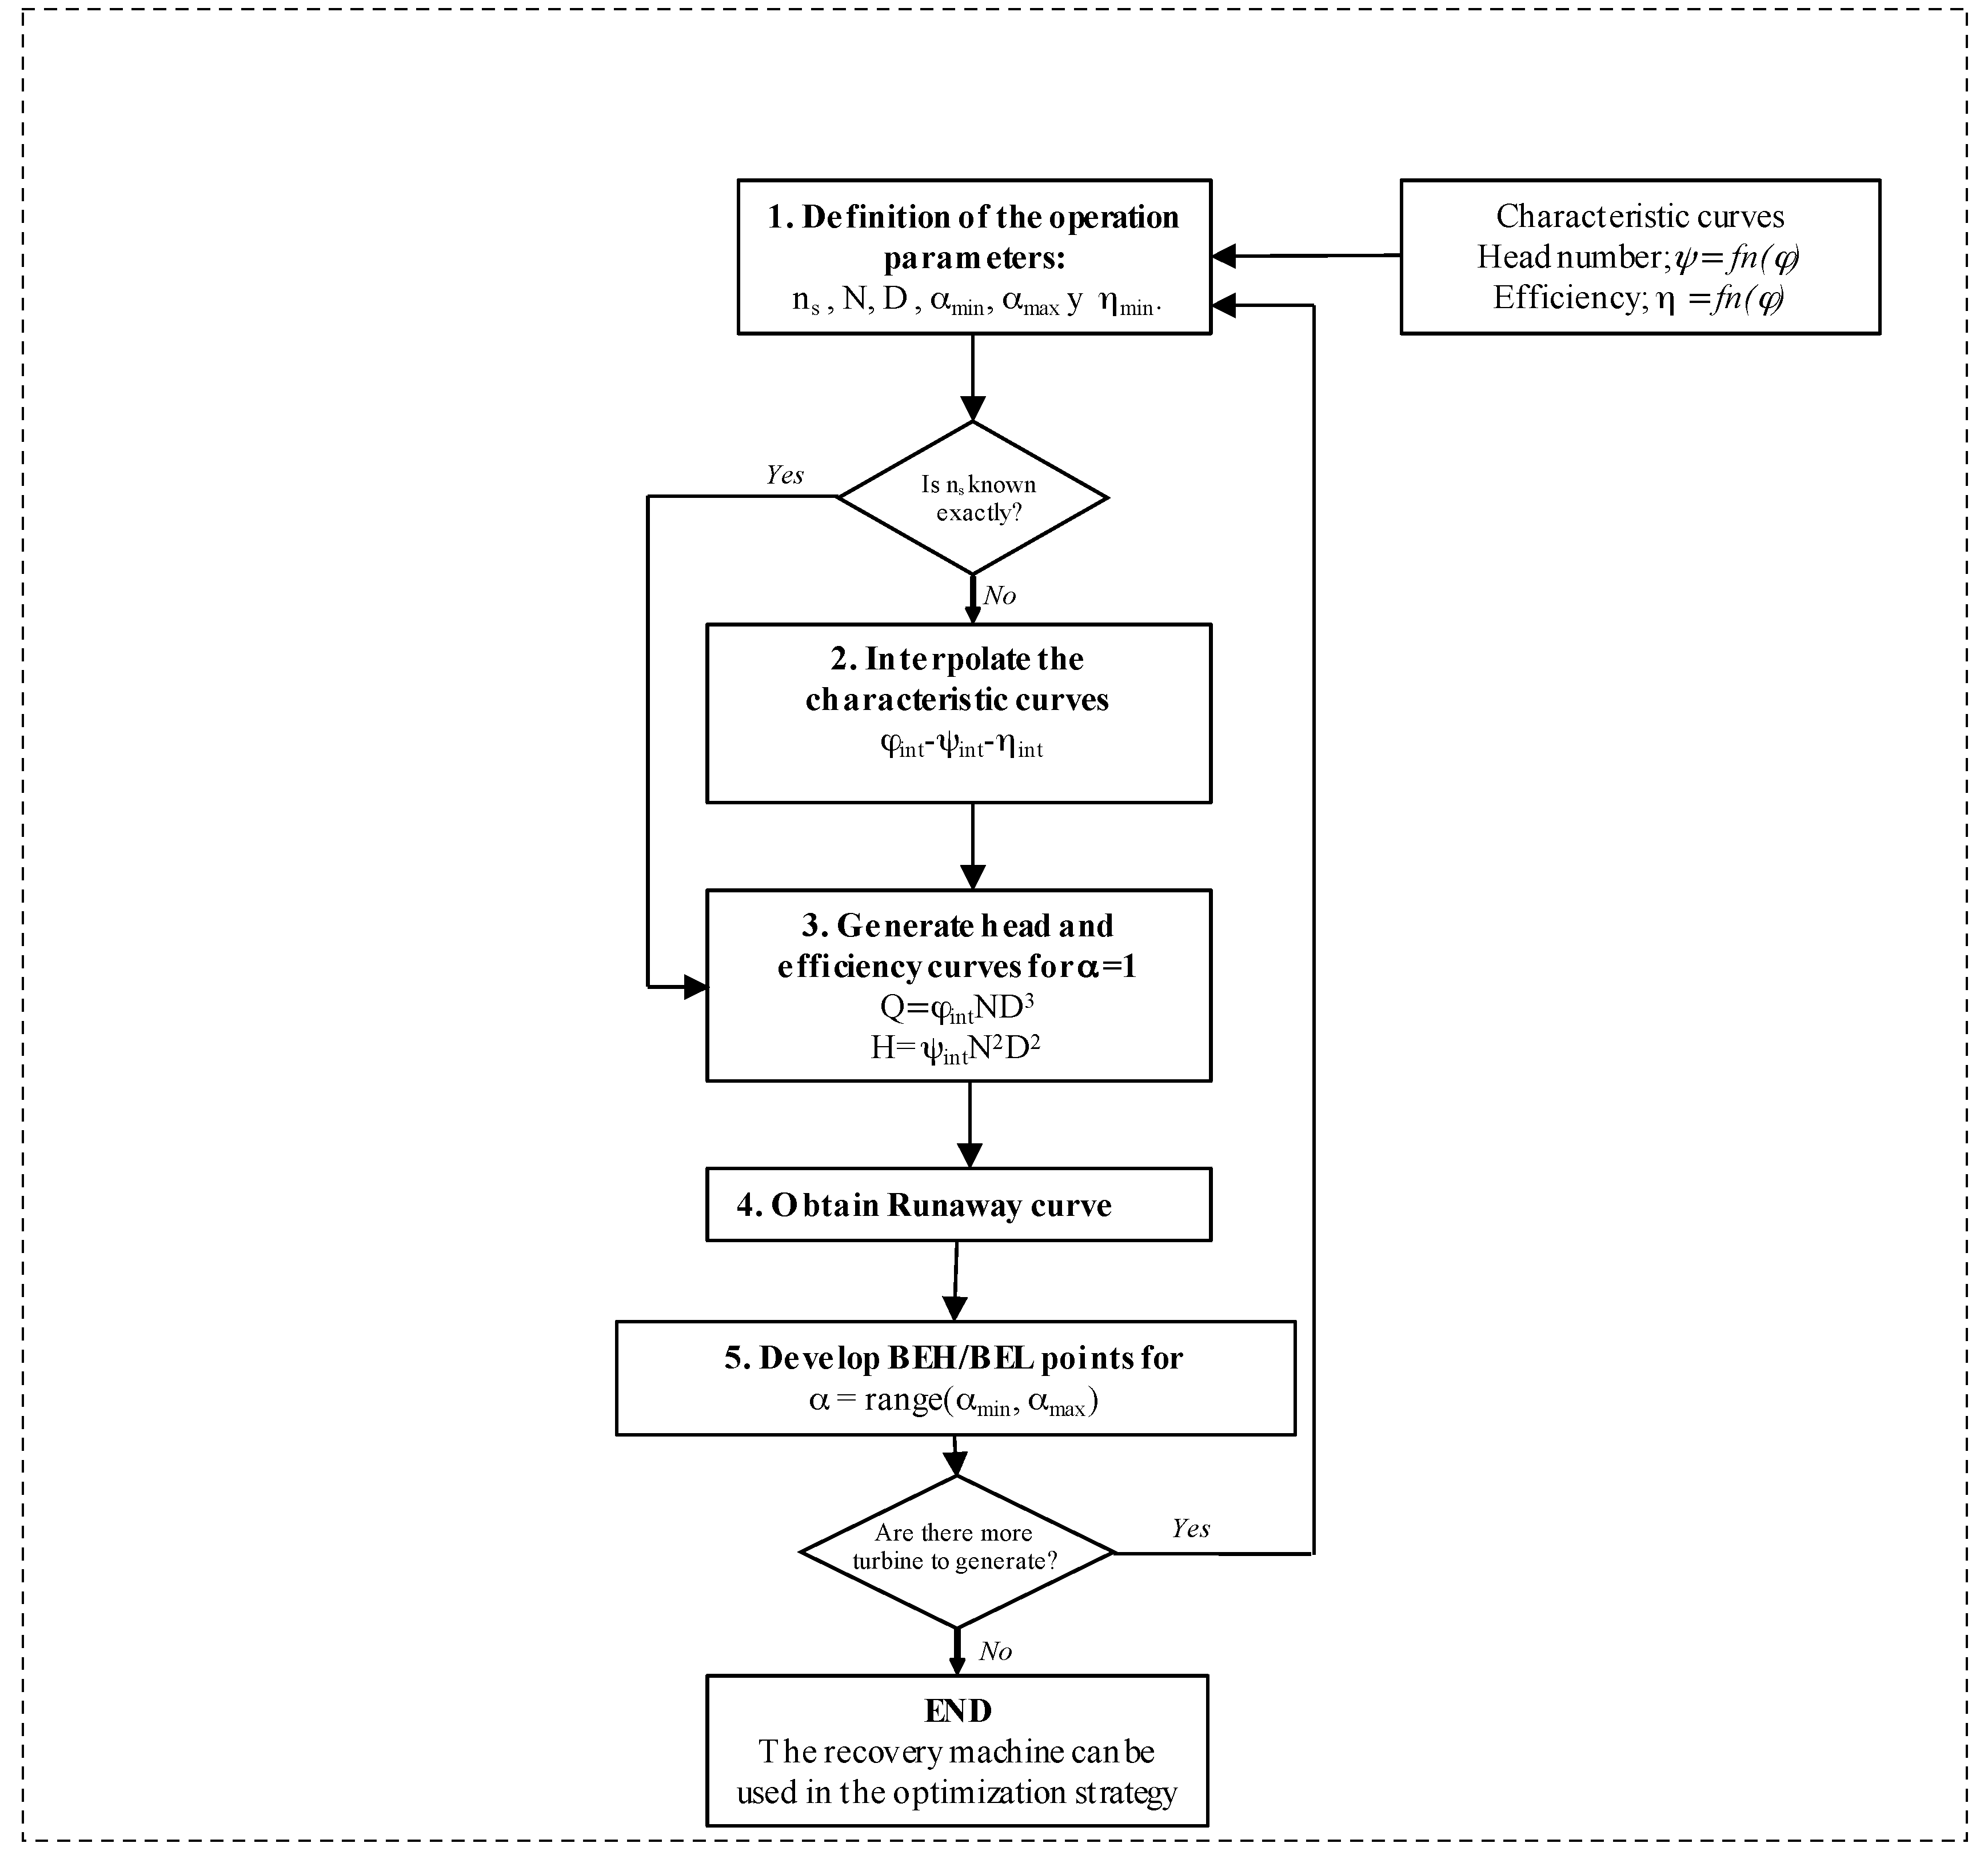
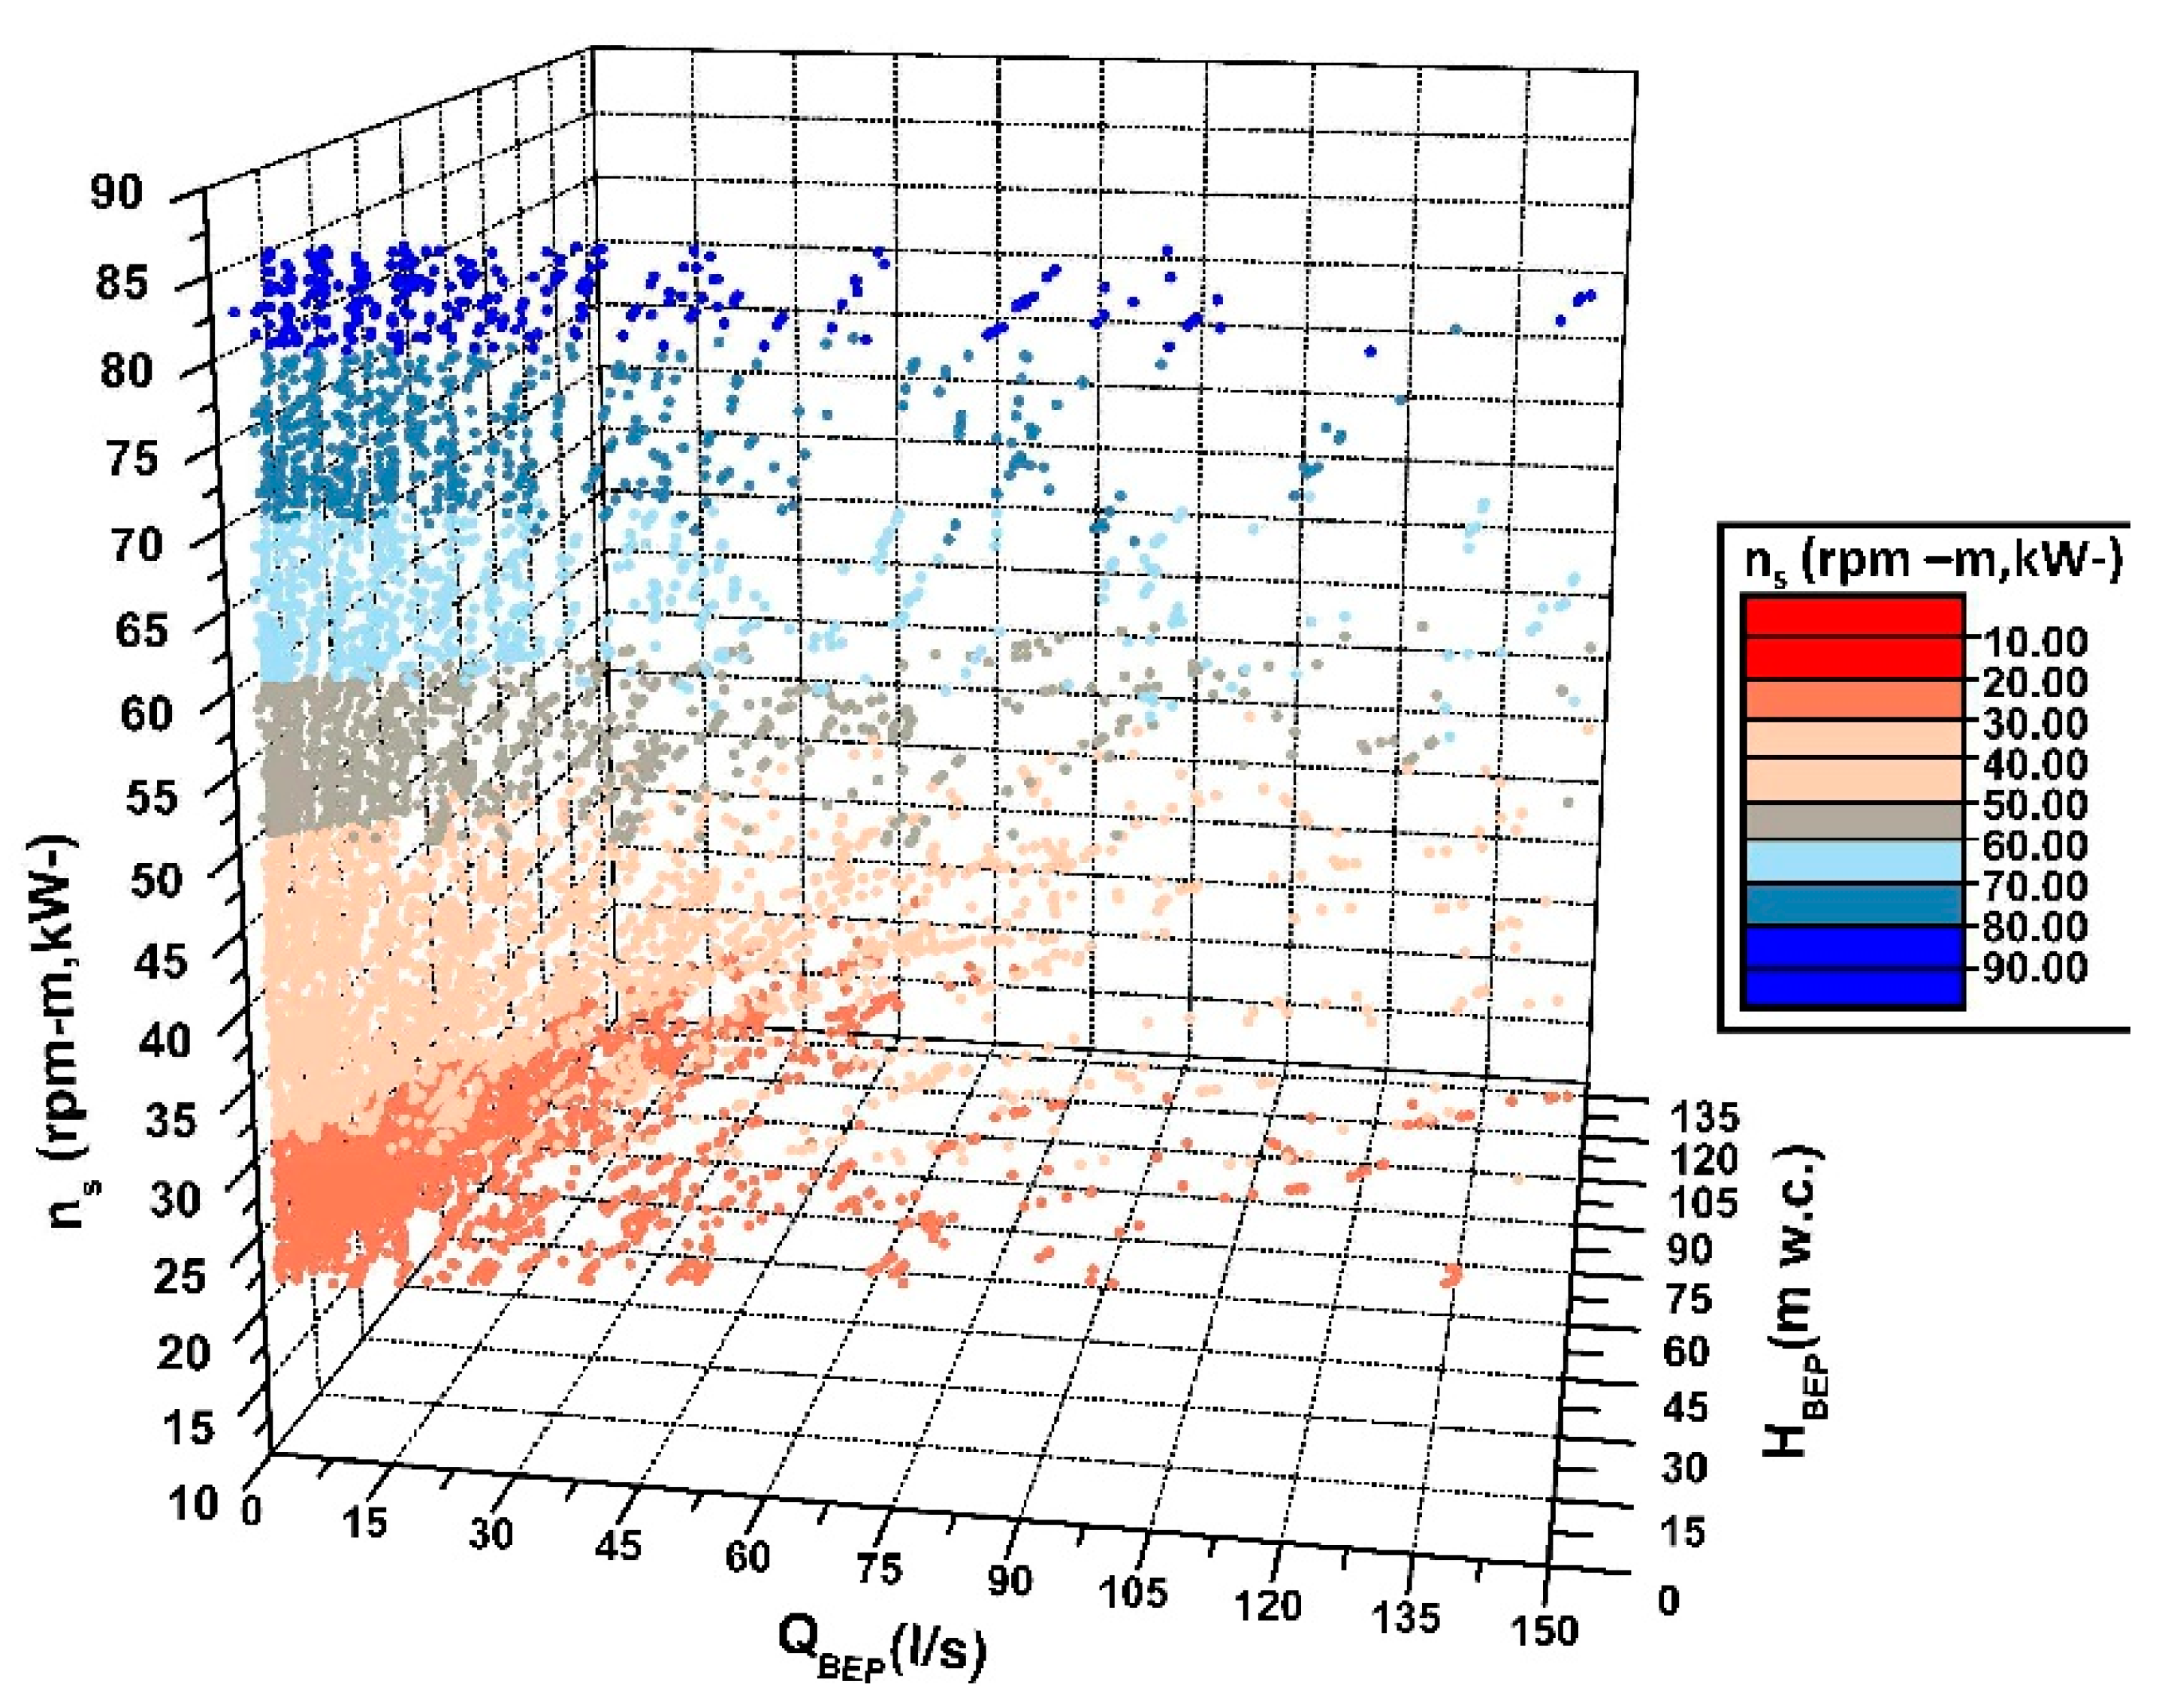
- Selection of the operation parameters: different parameters must be defined. To establish a database of synthetic PATs (in this particular case 8893 different PATs were defined). The database was developed through characteristic curves that are shown in Figure 2 (Input 1) as well as changing the following parameters:
- Specific speed (ns): defined according to Equation (3):where N is the rated rotational speed (rpm); PR is the rated power (kW); HR is the rated head (m w.c.); being ‘R’ the pump design point or the best efficiency condition.The range of specific speed oscillates between 14 and 79 rpm (m, kW).
- Rotational speed (N): the range of the rotational speed oscillated between 510, 1020, 2040, 2400, and 2900 rpm.
- Impeller Diameter (D): the range of the defined impeller was between 0.04 and 0.6 m.
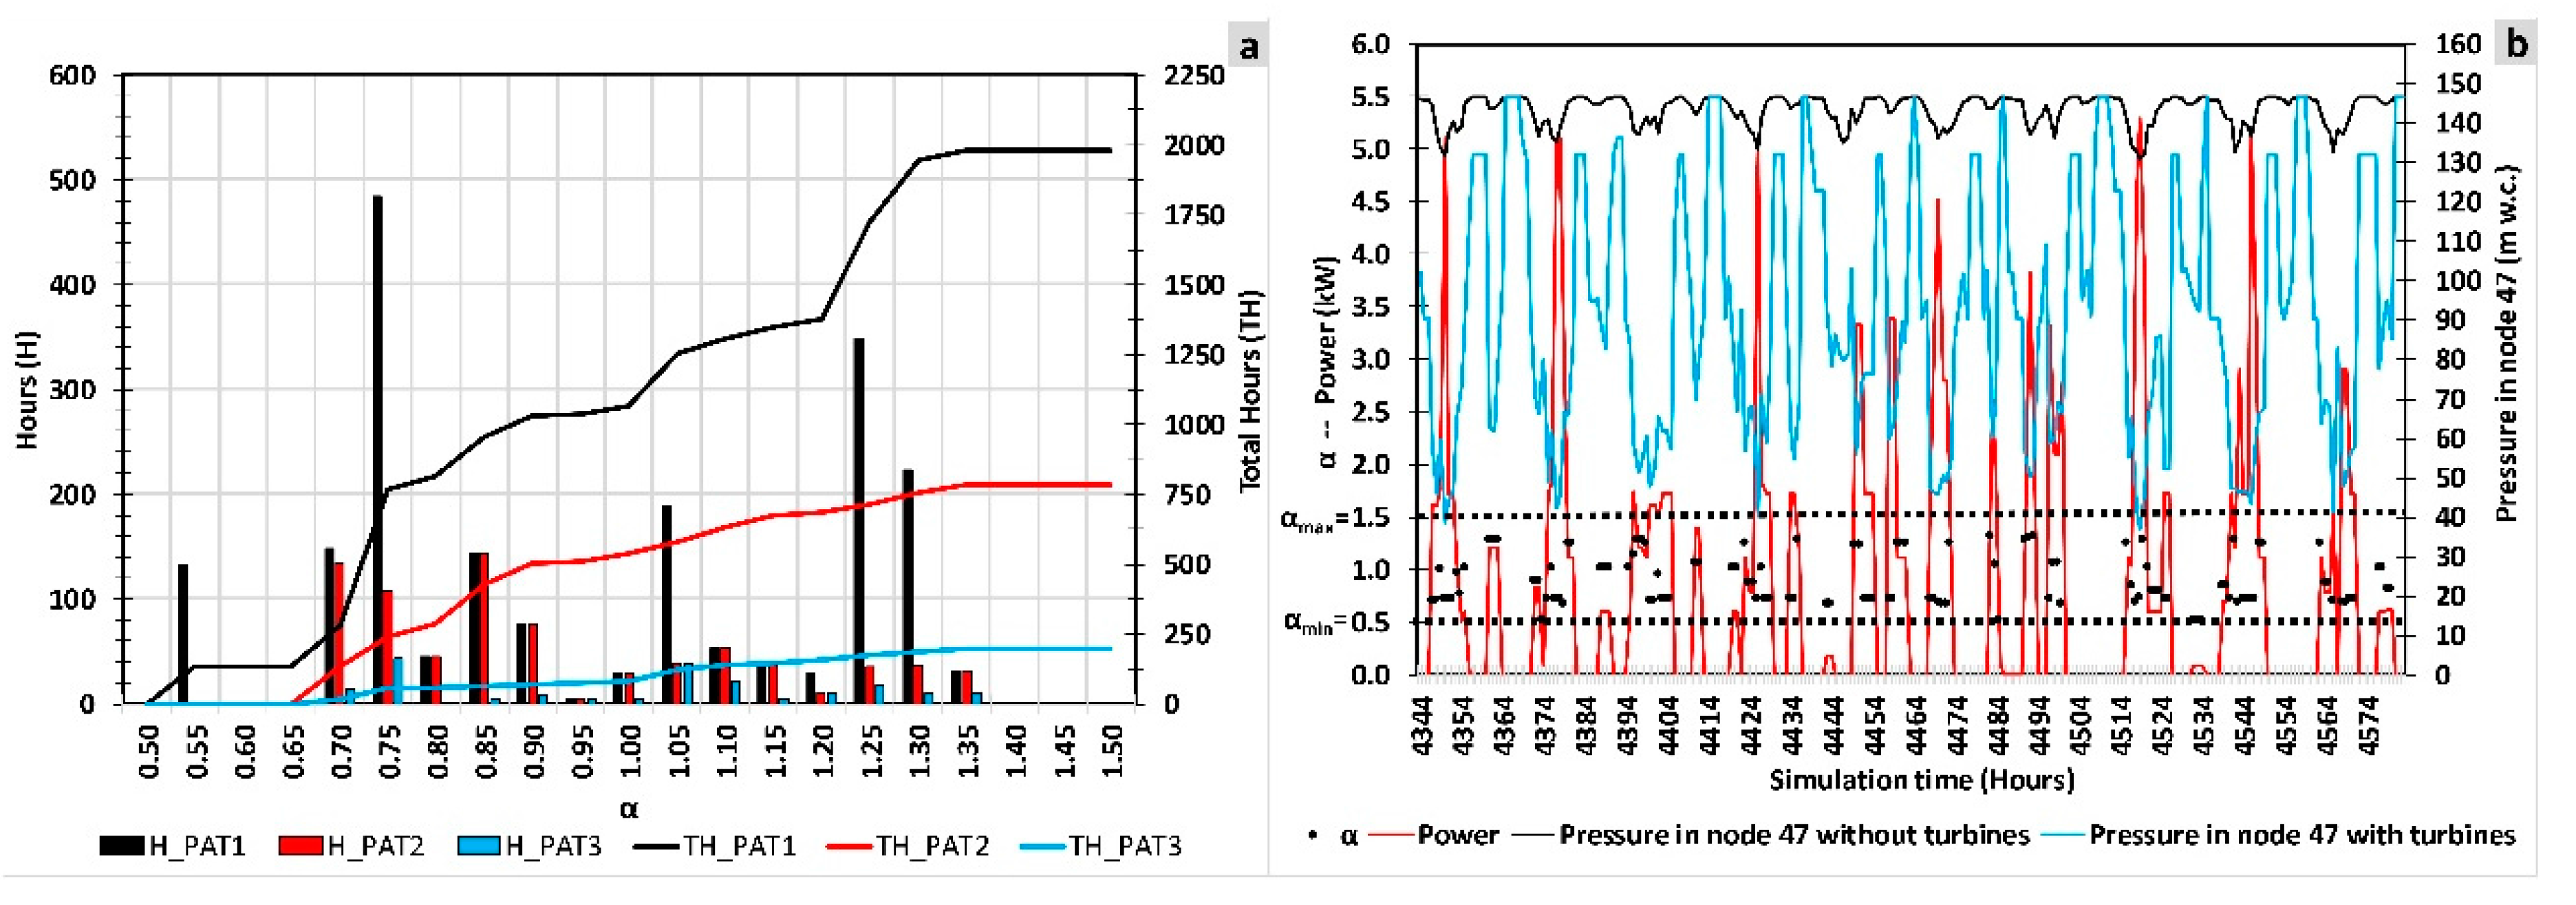
- Variation of the rotational speed: when the machine operates with a different rotation speed as a function of the flow, the coefficient () that is defined by Equation (4) can vary between 0.5 and 1.5.where is the rotational speed for each time in rpm; and is the nominal rotational speed in rpm.
- To interpolate characteristic curves: when the specific speed is defined and the ns curve is not known, the values of head number () and efficiency (ηint) for each discharge number value (φint) are estimated by linear interpolation
- To generate head and efficiency curves as a function of flow: when the characteristic numbers are defined for each diameter and rotational speed (N0) that are selected in step one, the head and efficiency curve are determined by Equations (5) to (7):The polynomic equations are fitted to the obtained values (the maximum considered degree is four) through linear regression by Equations (8) and (9):These curves can be used when the flow is between the interpolated range, where A, B, C, D and E are coefficients of the Q-H characteristic curve and F, G, H, I and J are coefficients of the efficiency curve. The flow limit of the turbine is defined by a minimum efficiency condition, which is proposed to be 0.3 for this case study.
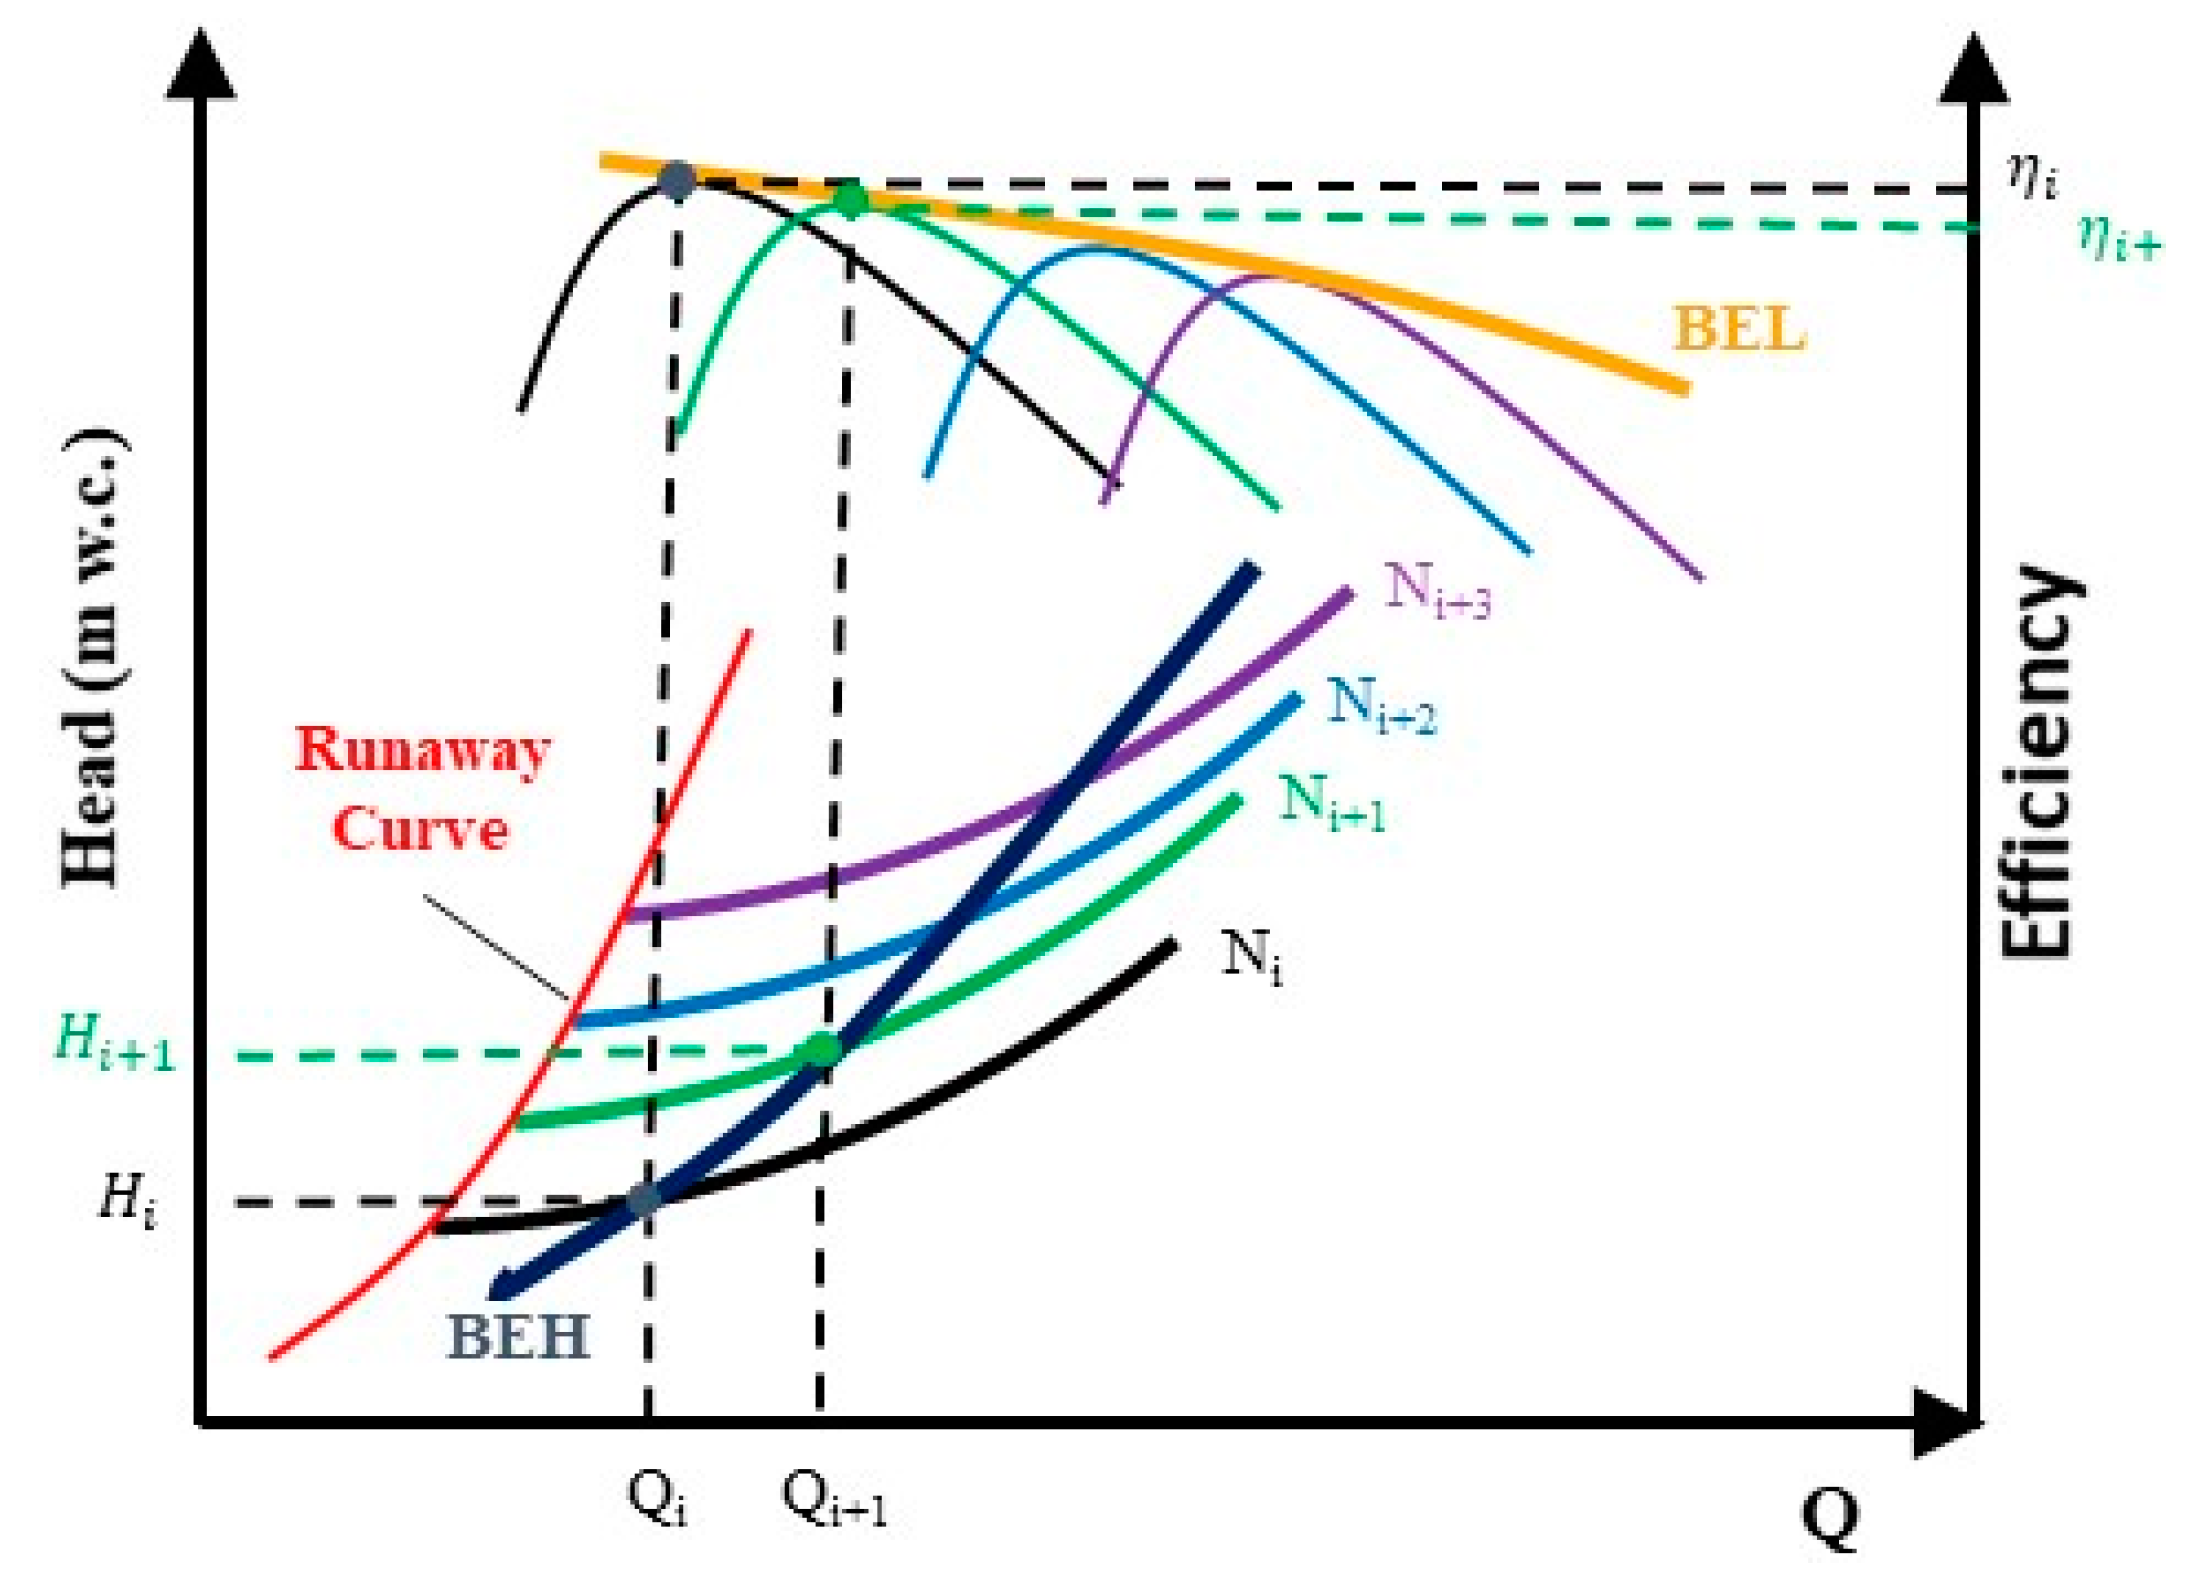
- To obtain runaway curve: the runaway curve is generated by second polynomic equation curve that contains the following points: coordinates origin and the minimum value obtained through Equation (8).
- To develop BEL/BEH: the best efficiency point is estimated for each rotational speed (α), adjusting by regression the curves defined by Equations (10) and (11):where H, I, J, K and L characterise the best efficiency head and M, N, O, P and R are coefficients that define the best efficiency line.
2.3. Optimization Strategy
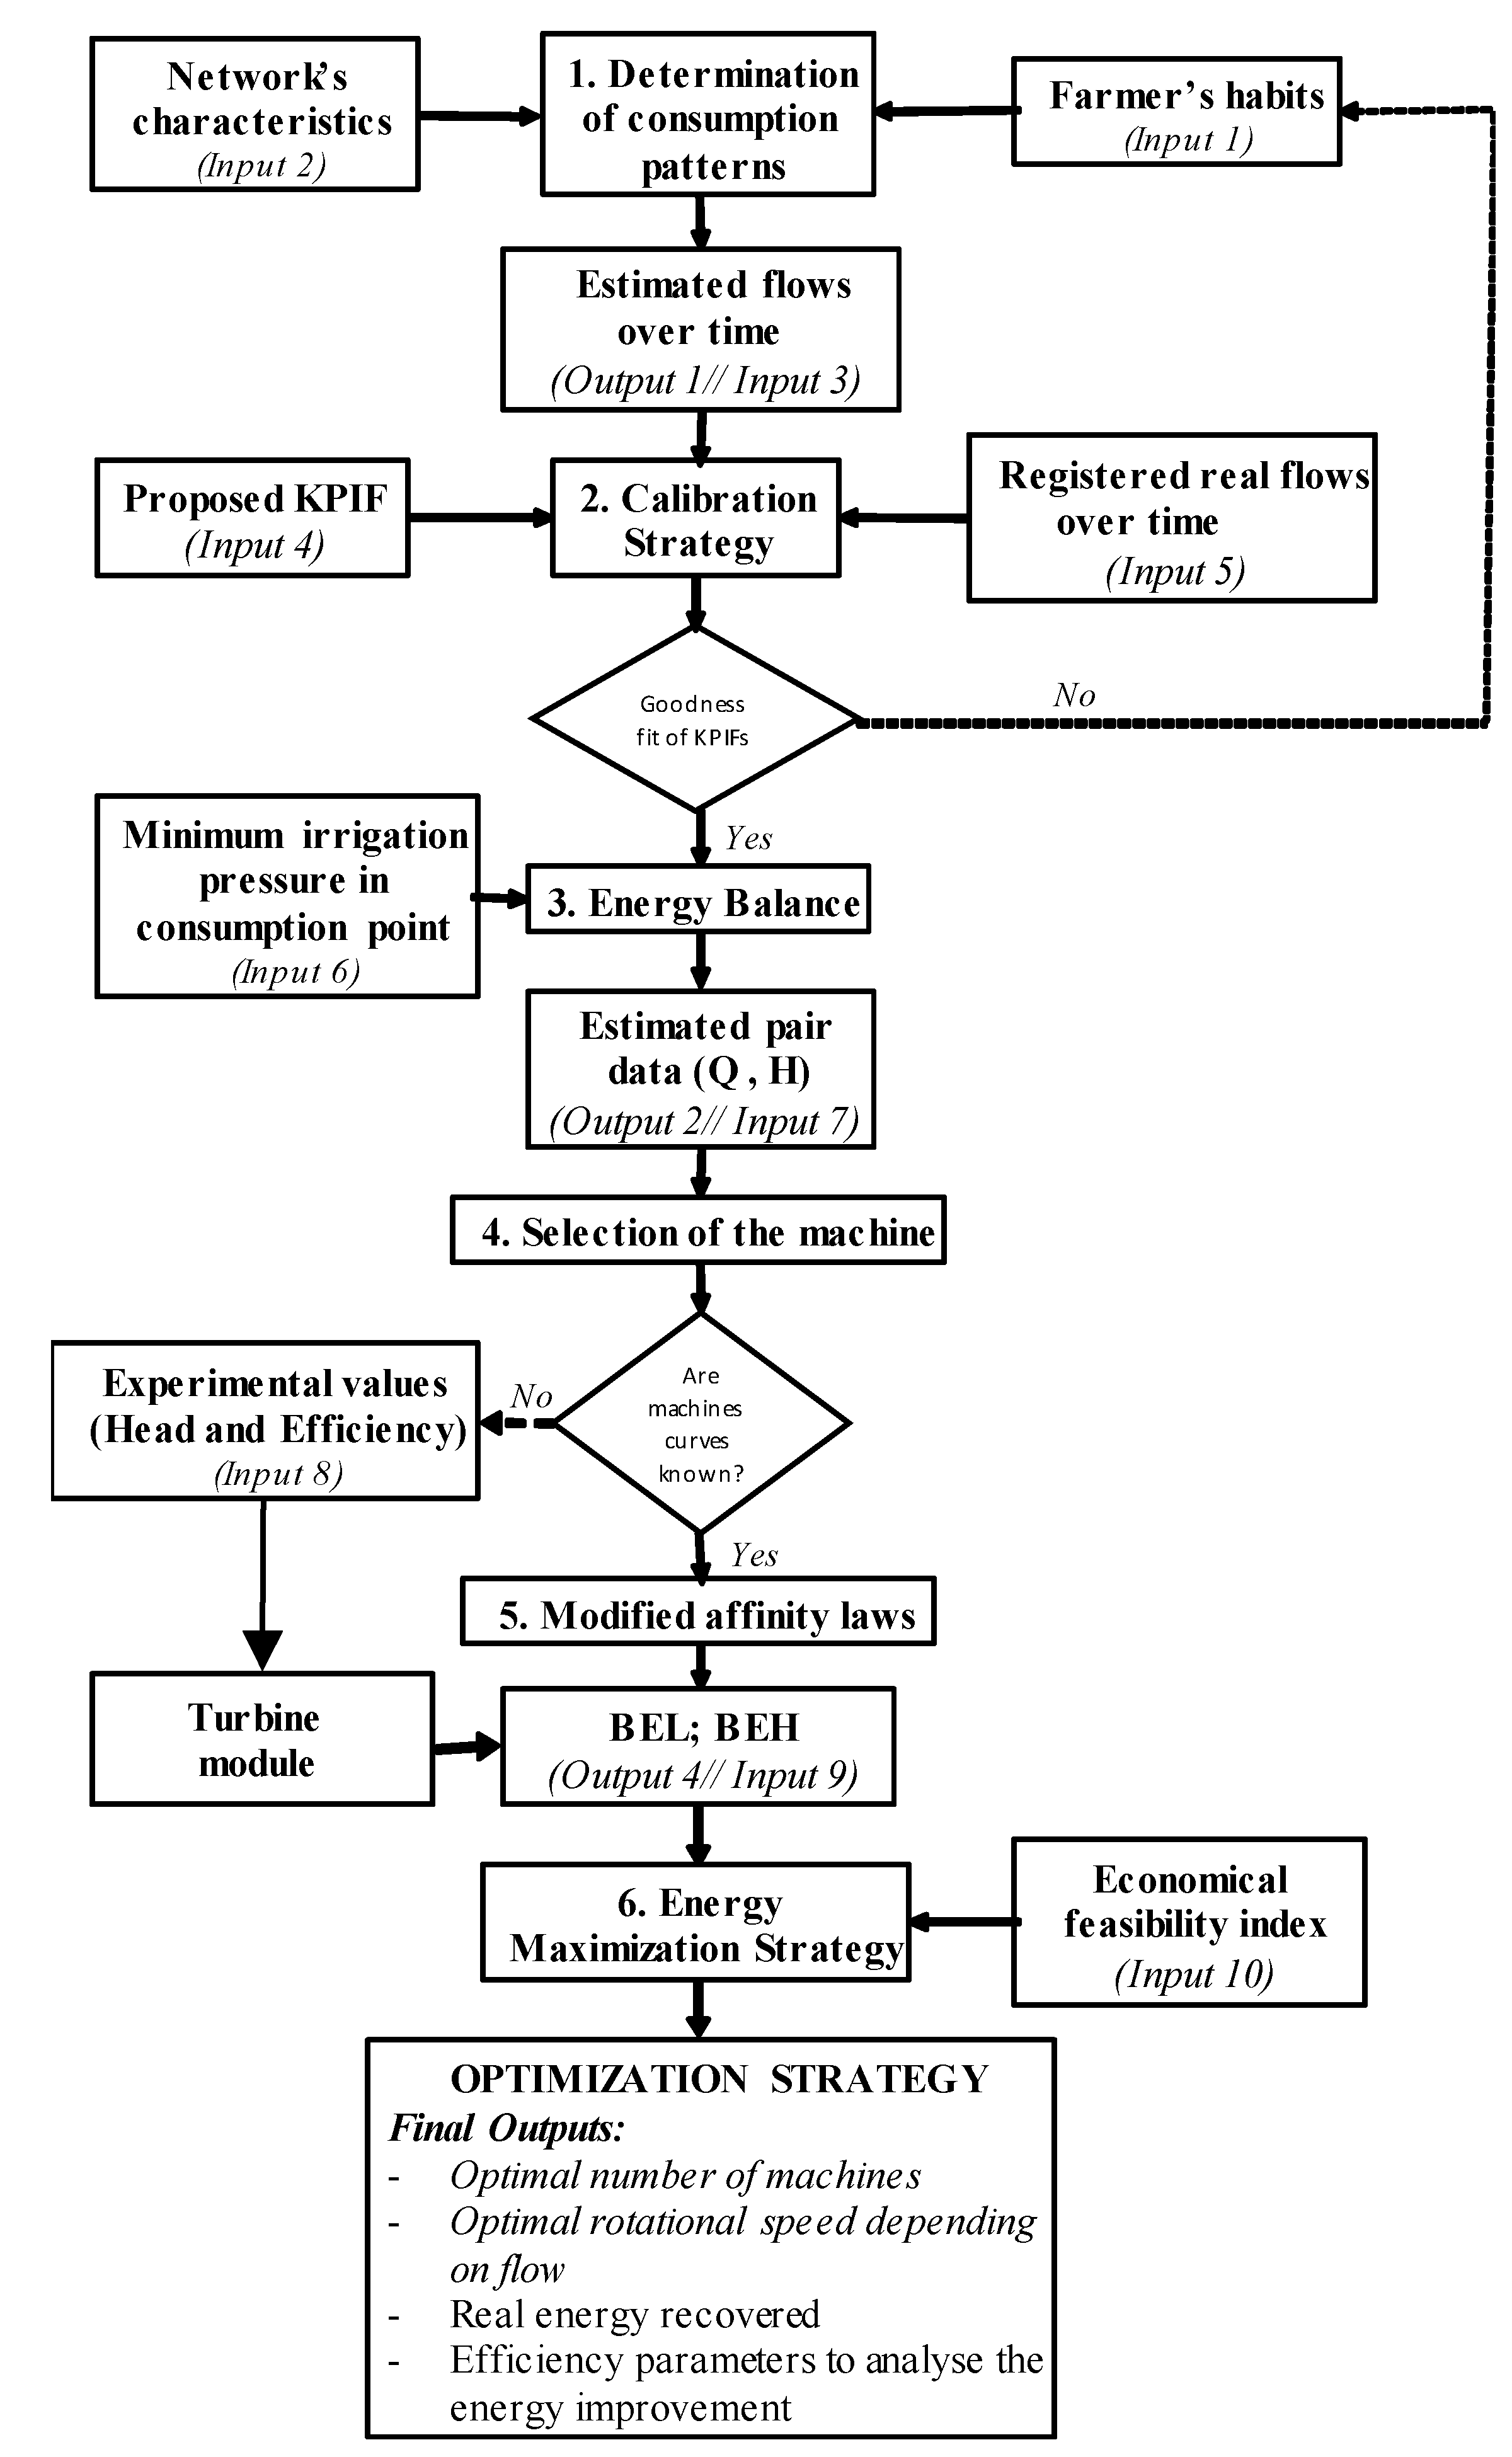
- The knowledge of the flow over time is the starting point in the optimization strategy. The flow can be known when the water manager has flowmeters in the pipes. However, the knowledge of the flow in all lines over time is almost impossible, and therefore, the flow has to be estimated in each line. In this sort of irrigation water distribution network, the flow depends on consumption flow patterns which must be determined as a function of the agronomist parameters. To estimate the consumption flow patterns, the used methodology considers the farmers’ habits and the characteristics of the network [39]. This methodology is able to estimate the flow over time in any line of the systems, depending on the network characteristics (Input 1) and the farmers’ habits (Input 2). The farmers’ habits are irrigation needs, irrigation duration, maximum days between irrigation and the irrigation volume. The knowledge of the farmers’ habits allows the determination of the opening or closing in consumption nodes over time. The state of the irrigation point determines the flow (Output 1) of the strategy. This output is an input for the next step: Input 3.
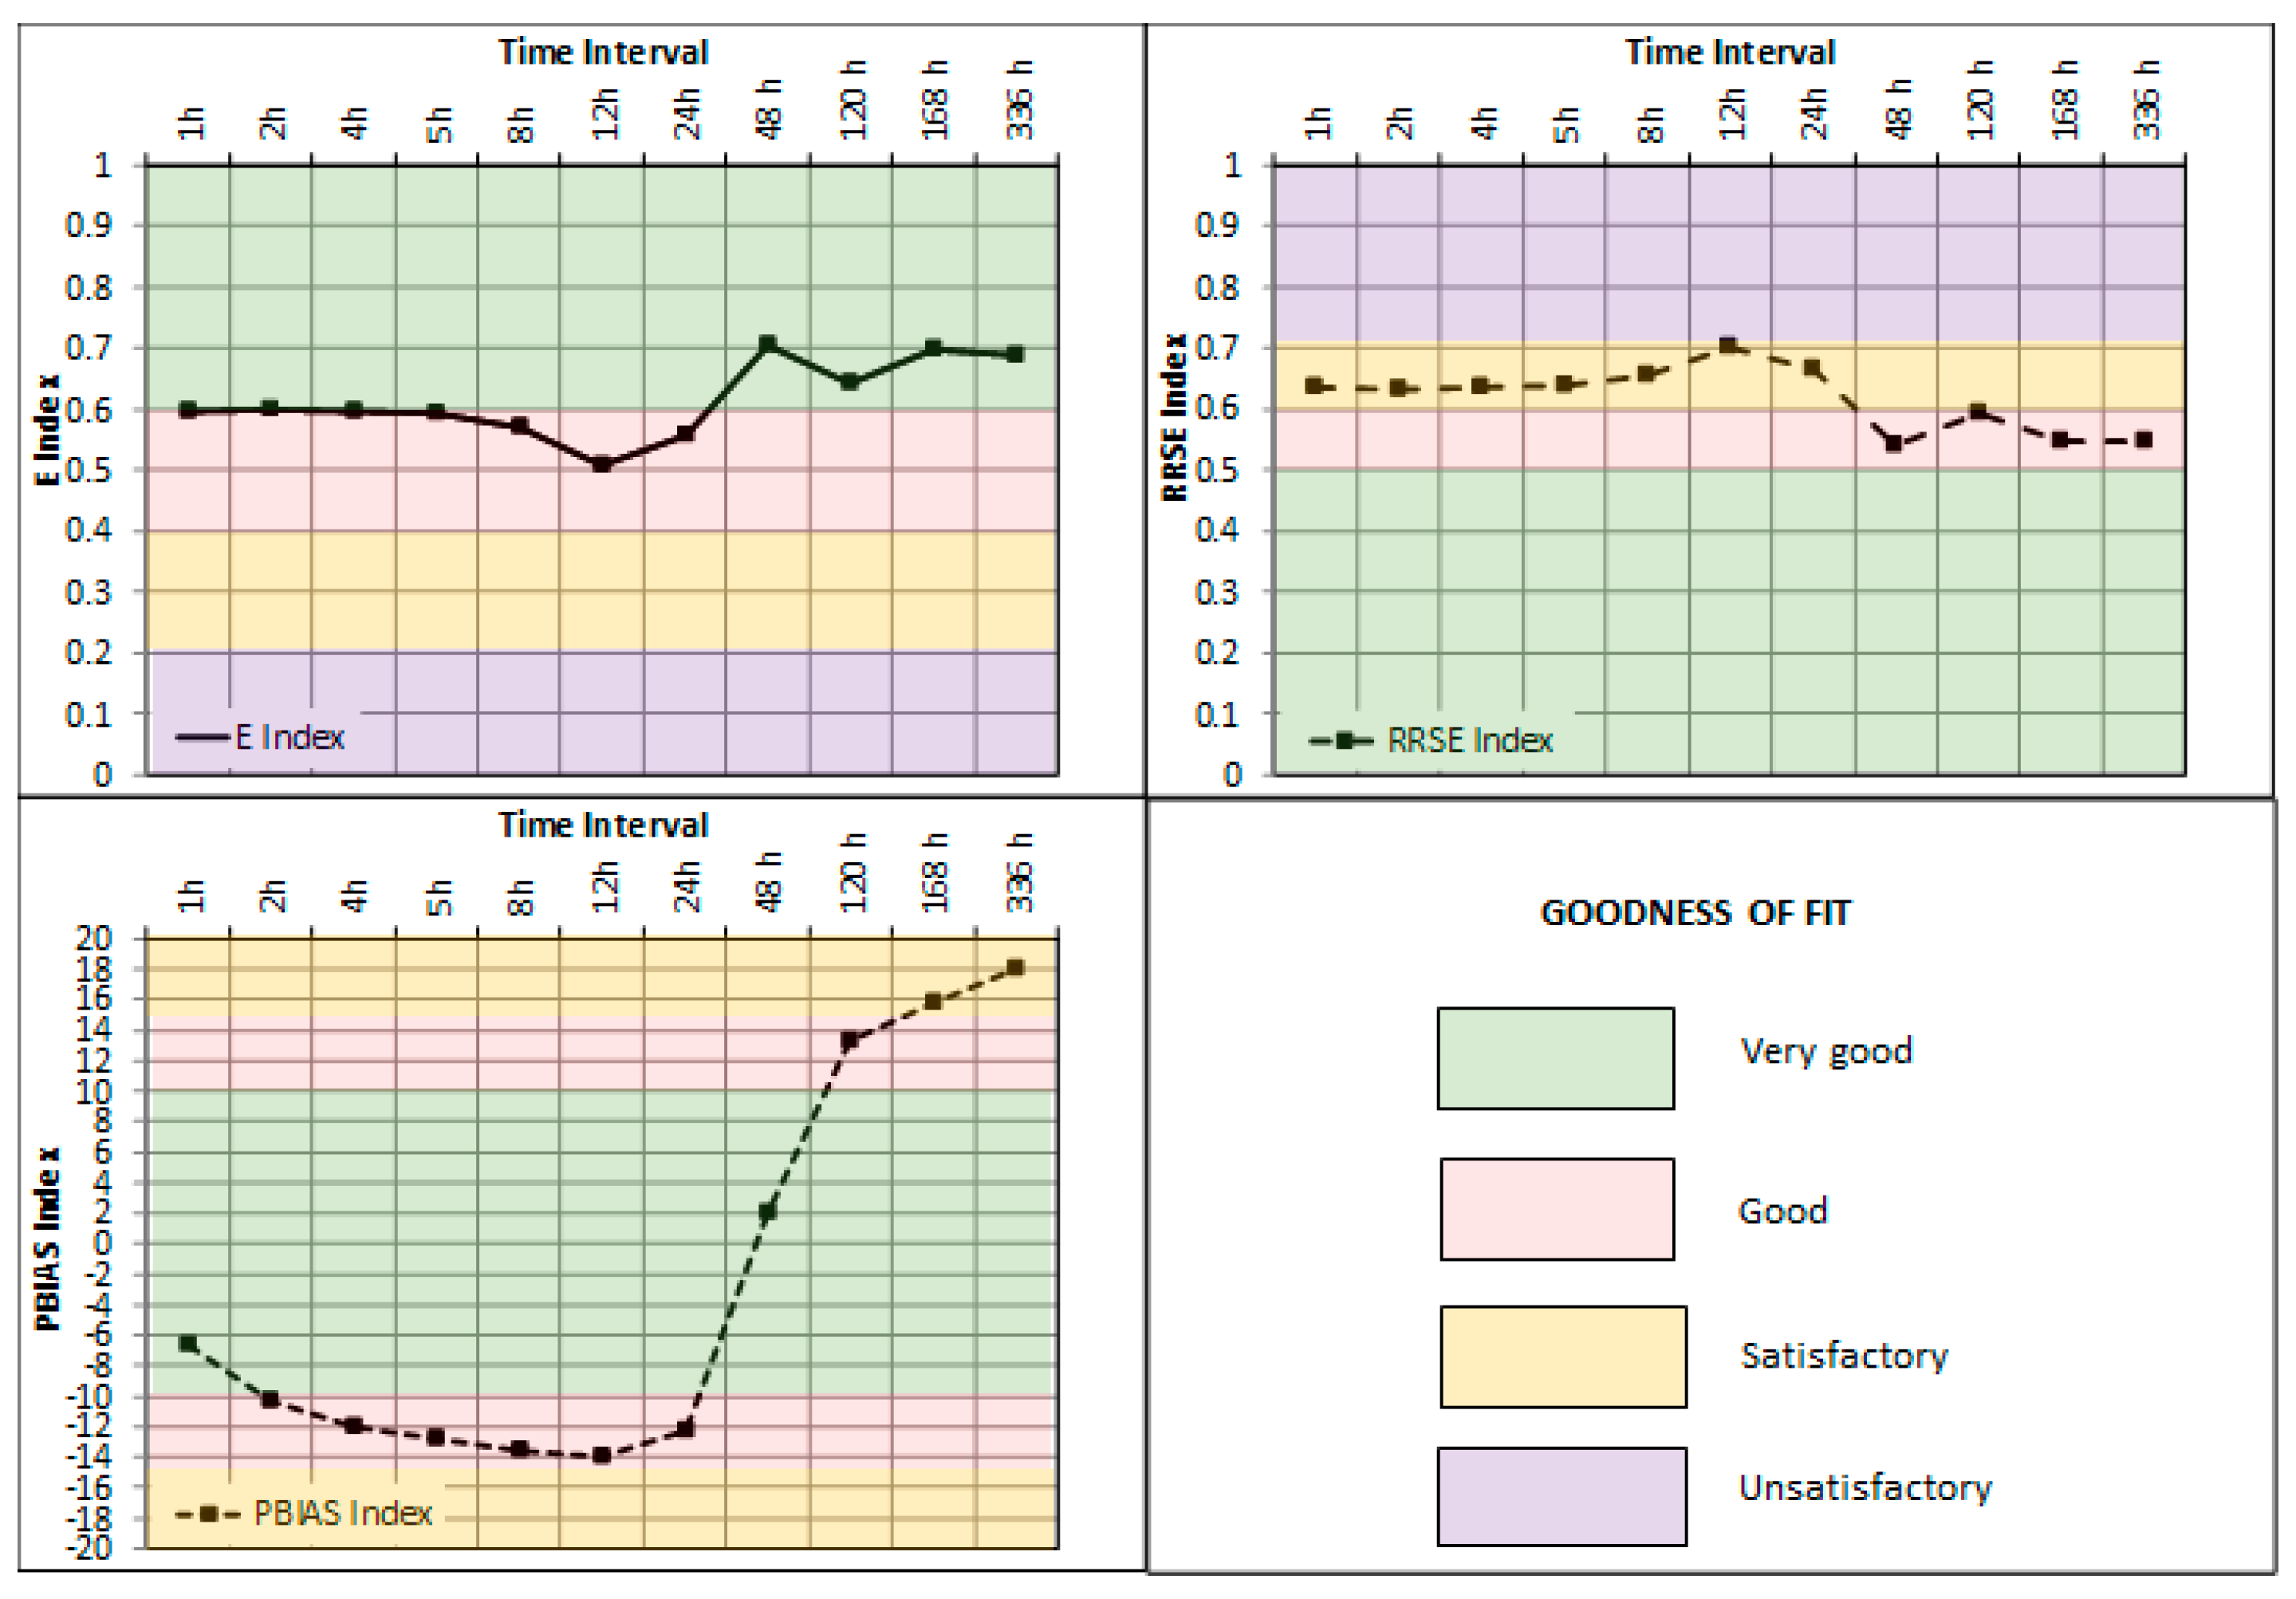
- The second stage stands on the calibration strategy. It uses key performance indicators (KPIFs) that are adapted from the traditional hydrological models (Input 4) [40]. The characterization of the goodness-of-fit is divided into very good, good, satisfactory, and unsatisfactory, depending on the KPIF values (Table 1). The comparison is developed with the registered flow data (Input 5) to determine the success of the fit. If the calibration is satisfactory, the energy balance (Step 3) can be done.
- The energy balance is able to discretize different energy terms (e.g., total, irrigation, friction) differentiating the terms for the available energy between the theoretically recoverable energy and theoretically non-recoverable energy, considering the minimum irrigation pressure at each consumption point (Input 6) [39]. The available energy enables us to determine the theoretical recovery coefficient at any line, hydrant or consumption point. In addition, the energy balance enables us to estimate the recovered head for each flow over time. Knowing these pairs of data (Q, H), the most suitable machine at each study point can be selected. The formula used to determine the annual balance of the network is defined by Equations (12) to (18):where is the total provided energy in the network (kWh/year); is the total friction energy in the network (kWh/year); is the total required energy to irrigate correctly all consumption points (kWh/year); is the total theoretical recovered energy in the network (kWh/year); is the total unrecoverable energy in the network (kWh/year); is the potential energy in each irrigation point when the consumption in the network is null (kWh); is the dissipated friction energy until the irrigation point (kWh); is the required energy at the consumption point to ensure the irrigation (kWh); is the available energy for recovery in a hydrant or line (kWh); is the maximum theoretical recoverable energy in an irrigation point, hydrant or line of the network, ensuring the minimum pressure of irrigation downstream (kWh); is the energy that cannot be recovered in a hydrant or line on the network (kWh); is the flow by a line (m3/s); is the geometry level above reference plane of the irrigation point, considering the reference datum level (m); is the geometry level above the reference plane of the free water surface of the reservoir (m); is the service pressure in any point of the network when consumption exists (m w.c.); is the minimum pressure of service of an irrigation point required to ensure the irrigation water evenly; and is the value of the head of an irrigation point, hydrant or line (m w.c.). This head is obtained as ; and is the time interval (s).
- Knowing the flow () and recoverable head () over time from the energy balance (Output 2, that is Input 7), enables the selection of the hydraulic machine type (e.g., radial, axial) according to the frequency histogram of the power generated among other conditions. To develop a guaranteed estimation of the recovered energy, the head and efficiency curve as a function of flow should be known for different rotational speeds (Input 8). If this information is not provided by the manufacturer, experimental tests are recommended to obtain the efficiency variation depending on the flow and for different rotational speeds. However, if experimental tests cannot be carried out, the experimental curves are determined using the characteristic numbers (discharge and head number, Figure 1) to select a machine considering its specific speed [41] using the turbine that was described in the previous section (Figure 2).
- When the tests are carried or the characteristic curves are used, the modified classical affinity laws based on the variation of the specific parameters (discharge coefficient, q; head coefficient, h; and velocity coefficient, n) can be used [33,42]. These parameters are defined by Equations (19) to (21):where H is the recovered head in m w.c.; Q is the flow through the turbine in m3/s when the rotational speed of the machine is N; and H0 and Q0 are head and flow, respectively, when the machine operates in its best efficiency point (BEP), for the rotational speed N0.Based on modified classical similarity laws (when there are not experimental data), two new concepts (the best efficiency line, BEL and best head line, BEH) are proposed (Output 4). The BEL adapts the rotational speed as a function of the flow, adjusting the maximum efficiency at each time point and maximising the energy recovered. The BEH relates the best efficiency point for each rotational speed with the recovered head as a function of the flow [35]. The knowledge of the BEL and/or BEH (Input 9) makes possible the use of these curves to develop the optimization of the energy recovery on a water system through the variation of the rotational speed as a function of the flow. The classical laws are defined by Equations (22) to (24) [36]:where Q1 is the flow in the new conditions of the rotational speed in m3/s; D1 is the diameter of the impeller in the new N status in m; D0 is the nominal diameter of the impeller in m; N1 is the new rotational speed in rpm; H1 is the head in the new N status in m w.c.; P1 is the shaft power for each N in kW; and P0 is the shaft power in the nominal condition in kW.
- This new strategy to maximize the energy recovered was developed by using PATs or any type of turbine. The theoretically recovered energy and the economic feasibility indexes (Input 10), particularly the simple payback period are considered (PSR) [39]. This strategy makes use of a simulated annealing algorithm to carry out the optimization, selecting the best lines to install turbines as a function of the number of installed turbines in the water system. The optimization can be developed with two different functions: the first function only considers the recovered energy, while the second one analyses the ratio between recovered energy and PSR [35]. The final output results of the optimization strategy are the optimal number of machines to install in the network according to the objective function; the optimal rotational speed as a function of the flow; the real recovered energy; as well as the efficiency parameters to analyse the energy improvement in the network.
3. Results and Discussion
3.1. Case Study Description
3.2. Results of the Optimization
3.3. Comparison of the Results of the Theoretical Energy Analysis, Fixed Rotational Speed, and BEL Strategy
4. Conclusions
Acknowledgments
Author Contributions
Conflicts of Interest
Abbreviations
| BEH | best efficiency head |
| BEL | best efficiency line |
| BEP | best efficiency point |
| E | Nash-Sutcliffe coefficient |
| EFR | friction energy |
| ER | real recovered energy |
| ERI | energy required for irrigation |
| ET | total energy |
| ETA | theoretically available energy |
| ETN | theoretically energy necessary |
| ETR | theoretically recoverable energy |
| ENTR | theoretically non-recoverable energy |
| KPIF | key performance indicators |
| n | number of groups of turbines or PATs |
| ns | specific rotational speed |
| PAT | pump as working turbine |
| PBIAS | percent bias |
| PSR | simple payback period |
| RRSE | root relative square error |
References
- Goonetilleke, A.; Vithanage, M. Water Resources Management: Innovation and Challenges in a Changing World. Water 2017, 9, 281. [Google Scholar] [CrossRef]
- Coelho, B.; Andrade-Campos, A. Efficiency achievement in water supply systems—A review. Renew. Sustain. Energy Rev. 2014, 30, 59–84. [Google Scholar] [CrossRef]
- Nogueira, M.; Perrella, J. Energy and hydraulic efficiency in conventional water supply systems. Renew. Sustain. Energy Rev. 2014, 30, 701–714. [Google Scholar] [CrossRef]
- McNabola, A.; Coughlan, P.; Corcoran, L.; Power, C.; Prysor Williams, A.; Harris, I.; Gallagher, J.; Styles, D. Energy recovery in the water industry using micro-hydropower: An opportunity to improve sustainability. Water Policy 2014, 16, 168. [Google Scholar] [CrossRef]
- Lydon, T.; Coughlan, P.; McNabola, A. Pump-As-Turbine: Characterization as an Energy Recovery Device for the Water Distribution Network. J. Hydraul. Eng. 2017, 143, 04017020. [Google Scholar] [CrossRef]
- Pasten, C.; Santamarina, J.C. Energy and quality of life. Energy Policy 2012, 49, 468–476. [Google Scholar] [CrossRef]
- Kanakoudis, V.; Papadopoulou, A. Allocating the cost of the carbon footprint produced along a supply chain, among the stakeholders involved. J. Water Clim. Chang. 2014, 5, 556–568. [Google Scholar] [CrossRef]
- Kanakoudis, V.; Tsitsifli, S.; Papadopoulou, A. Integrating the Carbon and Water Footprints’ Costs in the Water Framework Directive 2000/60/EC Full Water Cost Recovery Concept: Basic Principles towards Their Reliable Calculation and Socially Just Allocation. Water 2012, 4, 45–62. [Google Scholar] [CrossRef]
- Kanakoudis, V. Three alternative ways to allocate the cost of the CF produced in a water supply and distribution system. Desalin. Water Treat. 2015, 54, 2212–2222. [Google Scholar] [CrossRef]
- George, B.; Malano, H.; Davidson, B.; Hellegers, P.; Bharati, L.; Massuel, S. An integrated hydro-economic modelling framework to evaluate water allocation strategies I: Model development. Agric. Water Manag. 2011, 98, 733–746. [Google Scholar] [CrossRef]
- Huesemann, M.H. The limits of technological solutions to sustainable development. Clean Technol. Environ. Policy 2003, 5, 21–34. [Google Scholar] [CrossRef]
- Sitzenfrei, R.; von Leon, J. Long-time simulation of water distribution systems for the design of small hydropower systems. Renew. Energy 2014, 72, 182–187. [Google Scholar] [CrossRef]
- Patelis, M.; Kanakoudis, V.; Gonelas, K. Pressure Management and Energy Recovery Capabilities Using PATs. Procedia Eng. 2016, 162, 503–510. [Google Scholar] [CrossRef]
- Patelis, M.; Kanakoudis, V.; Gonelas, K. Combining pressure management and energy recovery benefits in a water distribution system installing PATs. J. Water Supply Res. Technol. AQUA 2017, 66, jws2017018. [Google Scholar] [CrossRef]
- Patelis, M.; Vasilopoulos, I.; Kanakoudis, V.; Gonelas, K. Exploiting energy recovery potential in a water distribution network along with reliable pressure management. In Proceedings of the 13th International Conference on Protection and Restoration of the Environment, Skiathos Island, Greece, 3–8 July 2016; Volume 117–124. [Google Scholar]
- Fecarotta, O.; Aricò, C.; Carravetta, A.; Martino, R.; Ramos, H.M. Hydropower Potential in Water Distribution Networks: Pressure Control by PATs. Water Resour. Manag. 2015, 29, 699–714. [Google Scholar] [CrossRef]
- Gilron, J. Water-energy nexus: Matching sources and uses. Clean Technol. Environ. Policy 2014, 16, 1471–1479. [Google Scholar] [CrossRef]
- Emec, S.; Bilge, P.; Seliger, G. Design of production systems with hybrid energy and water generation for sustainable value creation. Clean Technol. Environ. Policy 2015, 17, 1807–1829. [Google Scholar] [CrossRef]
- Okadera, T.; Chontanawat, J.; Gheewala, S.H. Water footprint for energy production and supply in Thailand. Energy 2014, 77, 49–56. [Google Scholar] [CrossRef]
- Herath, I.; Deurer, M.; Horne, D.; Singh, R.; Clothier, B. The water footprint of hydroelectricity: A methodological comparison from a case study in New Zealand. J. Clean. Prod. 2011, 19, 1582–1589. [Google Scholar] [CrossRef]
- Baki, S.; Makropoulos, C. Tools for Energy Footprint Assessment in Urban Water Systems. Procedia Eng. 2014, 89, 548–556. [Google Scholar] [CrossRef]
- Kanakoudis, V.; Tsitsifli, S.; Samaras, P.; Zouboulis, A.; Demetriou, G. Developing appropriate performance indicators for urban water distribution systems evaluation at Mediterranean countries. Water Util. J. 2011, 1, 31–40. [Google Scholar]
- Giugni, M.; Fontana, N.; Ranucci, A. Optimal location of PRVs and turbines in water distribution systems. J. Water Resour. Plan. Manag. 2013, 140, 6014004. [Google Scholar] [CrossRef]
- Pérez-Sánchez, M.; Sánchez-Romero, F.; López-Jiménez, P.; Ramos, H. PATs selection towards sustainability in irrigation networks: Simulated annealing as a water management tool. Renew. Energy 2017, 116, 234–249. [Google Scholar] [CrossRef]
- Corcoran, L.; McNabola, A.; Coughlan, P. Optimization of water distribution networks for combined hydropower energy recovery and leakage reduction. J. Water Resour. Plan. Manag. 2015, 142, 4015045. [Google Scholar] [CrossRef]
- Ramos, H.; Borga, A. Pumps as turbines: An unconventional solution to energy production. Urban Water 1999, 1, 261–263. [Google Scholar] [CrossRef]
- Ramos, H.M.; Kenov, K.N.; Vieira, F. Environmentally friendly hybrid solutions to improve the energy and hydraulic efficiency in water supply systems. Energy Sustain. Dev. 2011, 15, 436–442. [Google Scholar] [CrossRef]
- Cabrera, J. Calibración de Modelos Hidrológicos. 2009. Available online: http://www.imefen.uni.edu.pe/Temas_interes/modhidro_2.pdf (accessed on 17 October 2017).
- Moriasi, D.N.; Arnold, J.G.; Van Liew, M.W.; Binger, R.L.; Harmel, R.D.; Veith, T.L. Model evaluation guidelines for systematic quantification of accuracy in watershed simulations. ASABE 2007, 50, 885–900. [Google Scholar] [CrossRef]
- White, F.M. Fluid Mechanics, 6th ed.; McGrau-Hill: Madrid, Spain, 2008. [Google Scholar]
- Kirkpatrick, S.; Gelatt, C.; Vecchi, M. Optimization by simmulated annealing. Science 1983, 220, 671–680. [Google Scholar] [CrossRef] [PubMed]
- Samora, I.; Franca, M.; Schleiss, A.; Ramos, H. Simulated Annealing in Optimization of Energy Production in a Water Supply Network. Water Resour. Manag. 2016, 30, 1533–1547. [Google Scholar] [CrossRef]
- Carravetta, A.; Del Giudice, G.; Fecarotta, O.; Ramos, H. PAT Design Strategy for Energy Recovery in Water Distribution Networks by Electrical Regulation. Energies 2013, 6, 411–424. [Google Scholar] [CrossRef]
- Rossman, L.A. EPANET 2: User’s Manual; U.S. EPA: Ohio, OH, USA, 2000.
- Pérez-Sánchez, M. Methodology for Energy Efficiency Analysis in Pressurized Irrigation Networks, Practical Application. 2017. Available online: https://riunet.upv.es/bitstream/handle/10251/84012/RESUMEN.pdf?sequence=3 (accessed on 17 October 2017).
- Mataix, C. Turbomáquinas Hidráulicas; Universidad Pontificia Comillas: Madrid, Spain, 2009. [Google Scholar]
- Singh, P.; Nestmann, F. An optimization routine on a prediction and selection model for the turbine operation of centrifugal pumps. Exp. Therm. Fluid Sci. 2010, 34, 152–164. [Google Scholar] [CrossRef]
- Derakhshan, S.; Nourbakhsh, A. Experimental study of characteristic curves of centrifugal pumps working as turbines in different specific speeds. Exp. Therm. Fluid Sci. 2008, 32, 800–807. [Google Scholar] [CrossRef]
- Pérez-Sánchez, M.; Sánchez-Romero, F.; Ramos, H.; López-Jiménez, P. Modeling Irrigation Networks for the Quantification of Potential Energy Recovering: A Case Study. Water 2016, 8, 234. [Google Scholar] [CrossRef]
- Pérez-Sánchez, M.; Sánchez-Romero, F.; Ramos, H.; López-Jiménez, P. Calibrating a flow model in an irrigation network: Case study in Alicante, Spain. Span. J. Agric. Res. 2017, 15, e1202. [Google Scholar] [CrossRef]
- Pérez-Sánchez, M.; Sánchez-Romero, F.; Ramos, H.; López-Jiménez, P. Energy Recovery in Existing Water Networks: Towards Greater Sustainability. Water 2017, 9, 97. [Google Scholar] [CrossRef]
- Fecarotta, O.; Carravetta, A.; Ramos, H.M.; Martino, R. An improved affinity model to enhance variable operating strategy for pumps used as turbines. J. Hydraul. Res. 2016, 1686, 1–10. [Google Scholar] [CrossRef]

| Goodness-of-Fit | E | RRSE | PBIAS (%) |
|---|---|---|---|
| Very Good | E > 0.6 | 0.00 ≤ RRSE ≤ 0.50 | |
| Good | 0.40 < E ≤ 0.60 | 0.50 < RRSE ≤ 0.60 | |
| Satisfactory | 0.20 < E ≤ 0.40 | 0.60 < RRSE ≤ 0.70 | |
| Unsatisfactory | E < 0.20 | RRSE > 0.70 |
| n | Lines in Which Turbines Are Allocated | |||||||||||
|---|---|---|---|---|---|---|---|---|---|---|---|---|
| 1 | 38 | |||||||||||
| 2 | 22 | 38 | ||||||||||
| 3 | 22 | 38 | 59 | |||||||||
| 4 | 22 | 38 | 47 | 59 | ||||||||
| 5 | 5 | 22 | 38 | 47 | 59 | |||||||
| 6 | 5 | 22 | 38 | 47 | 58 | 59 | ||||||
| 7 | 5 | 22 | 38 | 47 | 58 | 59 | 70 | |||||
| 8 | 5 | 22 | 38 | 39 | 47 | 58 | 59 | 70 | ||||
| 9 | 2 | 10 | 22 | 39 | 43 | 47 | 58 | 59 | 70 | |||
| 10 | 2 | 10 | 22 | 39 | 43 | 47 | 58 | 59 | 70 | 85 | ||
| n | Total | |||||||||||
| 1 | ns D N | 35 114.3 2900 33.78 | 33.78 | |||||||||
| 2 | ns D N | 35 133.8 2900 30.97 | 35 134.9 2900 11.59 | 42.55 | ||||||||
| 3 | ns D N | 35 133.8 2900 30.97 | 35 134.9 2900 11.59 | 35 122.9 2900 3.56 | 46.11 | |||||||
| 4 | ns D N | 35 133.8 2900 30.97 | 35 134.9 2900 11.59 | 29 90.5 2900 2.96 | 35 122.9 2900 3.56 | 49.08 | ||||||
| 5 | ns D N | 44 175.7 2040 9.81 | 35 164.7 2900 24.16 | 35 134.9 2900 11.52 | 29 90.5 2900 2.96 | 35 122.9 2900 3.56 | 52.00 | |||||
| 6 | ns D N | 44 175.7 2040 9.81 | 35 164.7 2900 24.16 | 35 134.9 2900 11.52 | 29 90.5 2900 2.96 | 35 100.6 2900 2.64 | 40 121.2 2900 3.52 | 54.60 | ||||
| 7 | ns D N | 44 175.7 2040 9.81 | 35 164.7 2900 24.16 | 35 134.9 2900 11.52 | 29 90.5 2900 2.96 | 35 100.6 2900 2.64 | 35 122.9 2900 3.56 | 24 77 2900 0.83 | 55.47 | |||
| 8 | ns D N | 44 175.7 2040 9.81 | 35 164.7 2900 24.16 | 35 134.9 2900 11.52 | 24 60.4 2900 1.05 | 29 90.5 2900 2.96 | 35 100.6 2900 2.64 | 35 122.9 2900 3.56 | 24 77 2900 0.83 | 56.53 | ||
| 9 | ns D N | 83 118.3 2900 8.27 | 35 243.7 1020 6.22 | 35 164.7 2900 20.38 | 24 77 2900 1.46 | 35 134.9 2900 10.73 | 29 90.5 2900 2.96 | 35 100.6 2900 2.64 | 35 122.9 2900 3.56 | 24 77 2900 0.83 | 57.04 | |
| 10 | ns D N | 83 118.3 2900 8.27 | 35 243.7 1020 6.22 | 35 164.7 2900 20.38 | 24 77 2900 1.46 | 35 134.9 2900 10.73 | 29 90.5 2900 2.96 | 35 100.6 2900 2.64 | 35 122.9 2900 3.56 | 24 77 2900 0.83 | 26 71.5 2900 1.14 | 58.18 |
| n | Lines in Which Turbines Are Allocated | |||||||||||
|---|---|---|---|---|---|---|---|---|---|---|---|---|
| 1 | 38 | 38 | ||||||||||
| 2 | 22 | 38 | 22 | |||||||||
| 3 | 5 | 22 | 38 | 5 | ||||||||
| 4 | 5 | 22 | 38 | 60 | 5 | |||||||
| 5 | 5 | 22 | 38 | 56 | 60 | 5 | ||||||
| 6 | 5 | 10 | 22 | 38 | 58 | 60 | 5 | |||||
| 7 | 5 | 10 | 22 | 27 | 38 | 58 | 60 | 5 | ||||
| 8 | 1 | 5 | 12 | 13 | 22 | 38 | 58 | 60 | 1 | |||
| 9 | 1 | 5 | 10 | 22 | 38 | 48 | 58 | 54 | 60 | 1 | ||
| 10 | 1 | 5 | 6 | 8 | 10 | 22 | 26 | 38 | 58 | 60 | 1 | |
| n | Total | |||||||||||
| 1 | ns D N | 24 93.5 2900 27.32 | 27.32 | |||||||||
| 2 | ns D N | 32 89.1 2900 20.27 | 35 76 2400 7.39 | 27.66 | ||||||||
| 3 | ns D N | 77 60 2400 5.21 | 35 81.5 2900 17.27 | 41 77.1 2400 8.66 | 31.14 | |||||||
| 4 | ns D N | 77 60 2400 5.21 | 35 81.5 2900 17.27 | 41 77.1 2400 8.66 | 35 68.7 2040 2.03 | 33.16 | ||||||
| 5 | ns D N | 77 60 2400 5.21 | 35 81.5 2900 17.27 | 41 77.1 2400 8.66 | 24 43.8 2900 0.24 | 35 68.7 2040 2.03 | 33.40 | |||||
| 6 | ns D N | 65 62.4 2400 5.12 | 40 108.9 1020 3.60 | 41 76.2 2900 14.49 | 41 77.1 2400 8.74 | 40 53.6 2400 0.38 | 35 68.7 2040 2.03 | 34.35 | ||||
| 7 | ns D N | 62 72.4 2040 5.57 | 40 108.9 1020 3.60 | 41 76.2 2900 14.49 | 41 107.4 510 0.30 | 40 63.3 2900 6.71 | 38 47.4 2900 0.34 | 35 68.7 2040 2.03 | 33.03 | |||
| 8 | ns D N | 65 116.5 510 1.01 | 76 59.2 2400 4.94 | 40 108.9 1020 2.95 | 37 76.6 2040 0.20 | 41 76.2 2900 14.49 | 41 77.1 2400 8.60 | 34 49.2 2900 0.32 | 43 58.5 2400 1.88 | 34.38 | ||
| 9 | ns D N | 65 116.5 510 1.01 | 76 59.2 2400 4.94 | 40 108.9 1020 3.16 | 41 76.2 2900 14.49 | 40 72.2 2400 6.43 | 46 106.8 510 0.30 | 24 47.7 2400 0.16 | 46 106.8 510 0.06 | 43 58.5 2400 1.88 | 32.42 | |
| 10 | ns D N | 65 116.5 510 1.01 | 69 70.6 2040 5.37 | 41 107.4 510 0.07 | 48 98.8 2040 0.15 | 39 108.9 1020 3.04 | 42 74.7 2900 13.79 | 46 106.8 510 0.27 | 40 63.3 2900 6.71 | 39 47.7 2900 0.35 | 43 58.5 2400 1.88 | 32.63 |
| n | BEL Strategy | Theoretical | Fixed Rotational Speed () | ||||||||
|---|---|---|---|---|---|---|---|---|---|---|---|
| 1 | 33.78 | 1.7 | 19.87 | 90.29 | 5.56 | 9.10 | 37.41 | 23.98 | 2.40 | 9.99 | 140.88 |
| 2 | 42.55 | 6.24 | 6.81 | 109.75 | 5.65 | 10.68 | 38.77 | 31.44 | 8.28 | 3.80 | 135.35 |
| 3 | 46.11 | 7.59 | 6.07 | 120.36 | 5.99 | 11.05 | 38.30 | 31.44 | 12.42 | 2.53 | 146.67 |
| 4 | 49.08 | 7.42 | 6.61 | 125.45 | 6.31 | 10.94 | 39.12 | 33.27 | 12.15 | 2.74 | 147.54 |
| 5 | 52.00 | 15.97 | 3.25 | 129.55 | 6.22 | 11.45 | 40.14 | 29.01 | 25.89 | 1.12 | 179.28 |
| 6 | 54.60 | 15.94 | 3.42 | 133.18 | 6.28 | 11.67 | 40.99 | 29.71 | 26.34 | 1.13 | 183.79 |
| 7 | 55.47 | 15.67 | 3.53 | 135.35 | 6.41 | 11.61 | 40.98 | 30.26 | 14.16 | 2.14 | 183.32 |
| 8 | 56.53 | 15.41 | 3.66 | 136.98 | 6.53 | 11.54 | 41.26 | 30.77 | 14.00 | 2.20 | 183.72 |
| 9 | 57.04 | 16.4 | 3.47 | 138.04 | 6.79 | 11.19 | 41.32 | 36.42 | 8.70 | 4.19 | 156.64 |
| 10 | 58.18 | 16.16 | 3.60 | 139.64 | 6.85 | 11.21 | 41.66 | 36.98 | 8.63 | 4.29 | 157.33 |
| n | BEL Strategy | Theoretical | Fixed Rotational Speed () | ||||||||
|---|---|---|---|---|---|---|---|---|---|---|---|
| 1 | 27.32 | 0.71 | 38.46 | 49.66 | 5.46 | 9.10 | 55.01 | 11.78 | 1.65 | 7.14 | 147.20 |
| 2 | 27.66 | 0.59 | 46.82 | 60.36 | 5.65 | 10.68 | 45.83 | 13.66 | 1.20 | 11.38 | 113.83 |
| 3 | 31.14 | 0.6 | 51.71 | 62.61 | 5.58 | 11.23 | 49.73 | 16.74 | 1.12 | 14.94 | 107.79 |
| 4 | 33.16 | 0.61 | 54.01 | 68.24 | 5.87 | 11.62 | 48.59 | 17.83 | 1.14 | 15.64 | 114.54 |
| 5 | 33.40 | 0.61 | 54.03 | 69.68 | 5.96 | 11.69 | 47.93 | 17.95 | 1.15 | 15.60 | 115.69 |
| 6 | 34.35 | 0.65 | 52.34 | 70.95 | 5.98 | 11.87 | 48.41 | 20.02 | 1.13 | 17.78 | 101.12 |
| 7 | 33.03 | 0.64 | 51.03 | 70.95 | 5.98 | 11.87 | 46.55 | 19.48 | 1.10 | 17.70 | 95.24 |
| 8 | 34.38 | 0.72 | 47.24 | 70.93 | 5.95 | 11.94 | 48.47 | 21.64 | 1.19 | 18.18 | 89.35 |
| 9 | 32.42 | 0.66 | 49.10 | 71.05 | 5.95 | 11.95 | 45.62 | 19.75 | 1.08 | 18.28 | 87.08 |
| 10 | 32.63 | 0.67 | 48.68 | 71.05 | 5.95 | 11.95 | 45.93 | 19.53 | 1.12 | 17.44 | 91.09 |
© 2017 by the authors. Licensee MDPI, Basel, Switzerland. This article is an open access article distributed under the terms and conditions of the Creative Commons Attribution (CC BY) license (http://creativecommons.org/licenses/by/4.0/).
Share and Cite
Pérez-Sánchez, M.; Sánchez-Romero, F.J.; Ramos, H.M.; López-Jiménez, P.A. Optimization Strategy for Improving the Energy Efficiency of Irrigation Systems by Micro Hydropower: Practical Application. Water 2017, 9, 799. https://doi.org/10.3390/w9100799
Pérez-Sánchez M, Sánchez-Romero FJ, Ramos HM, López-Jiménez PA. Optimization Strategy for Improving the Energy Efficiency of Irrigation Systems by Micro Hydropower: Practical Application. Water. 2017; 9(10):799. https://doi.org/10.3390/w9100799
Chicago/Turabian StylePérez-Sánchez, Modesto, Francisco Javier Sánchez-Romero, Helena M. Ramos, and P. Amparo López-Jiménez. 2017. "Optimization Strategy for Improving the Energy Efficiency of Irrigation Systems by Micro Hydropower: Practical Application" Water 9, no. 10: 799. https://doi.org/10.3390/w9100799
APA StylePérez-Sánchez, M., Sánchez-Romero, F. J., Ramos, H. M., & López-Jiménez, P. A. (2017). Optimization Strategy for Improving the Energy Efficiency of Irrigation Systems by Micro Hydropower: Practical Application. Water, 9(10), 799. https://doi.org/10.3390/w9100799


