
Assessment of Risk Due to Chemicals Transferred in a Watershed: A Case of an Aquifer Storage Transfer and Recovery Site


Abstract
:
1. Introduction
2. Materials and Methods
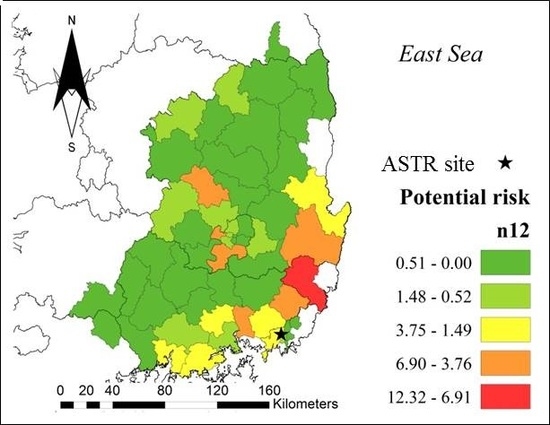
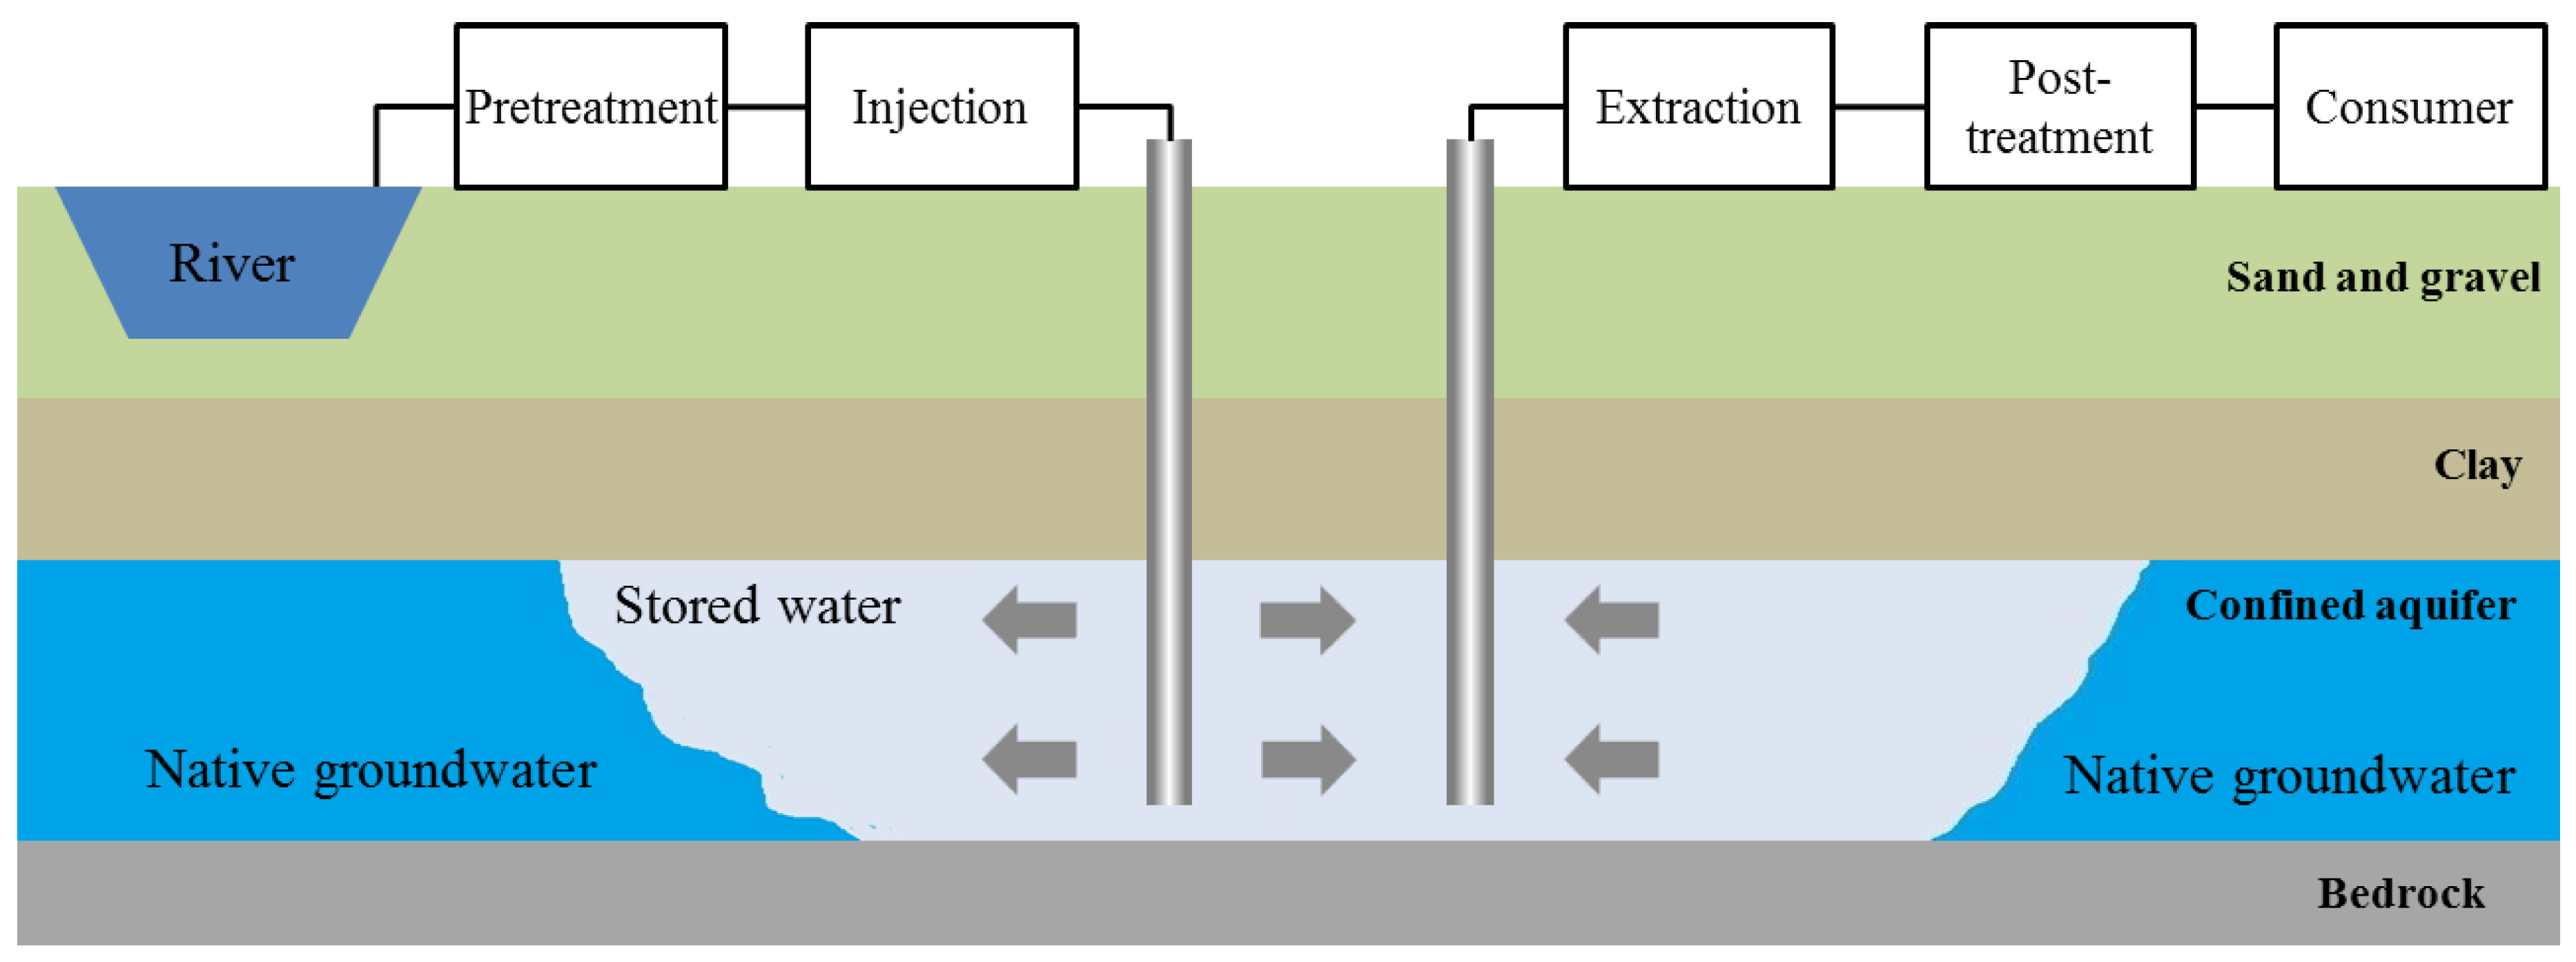
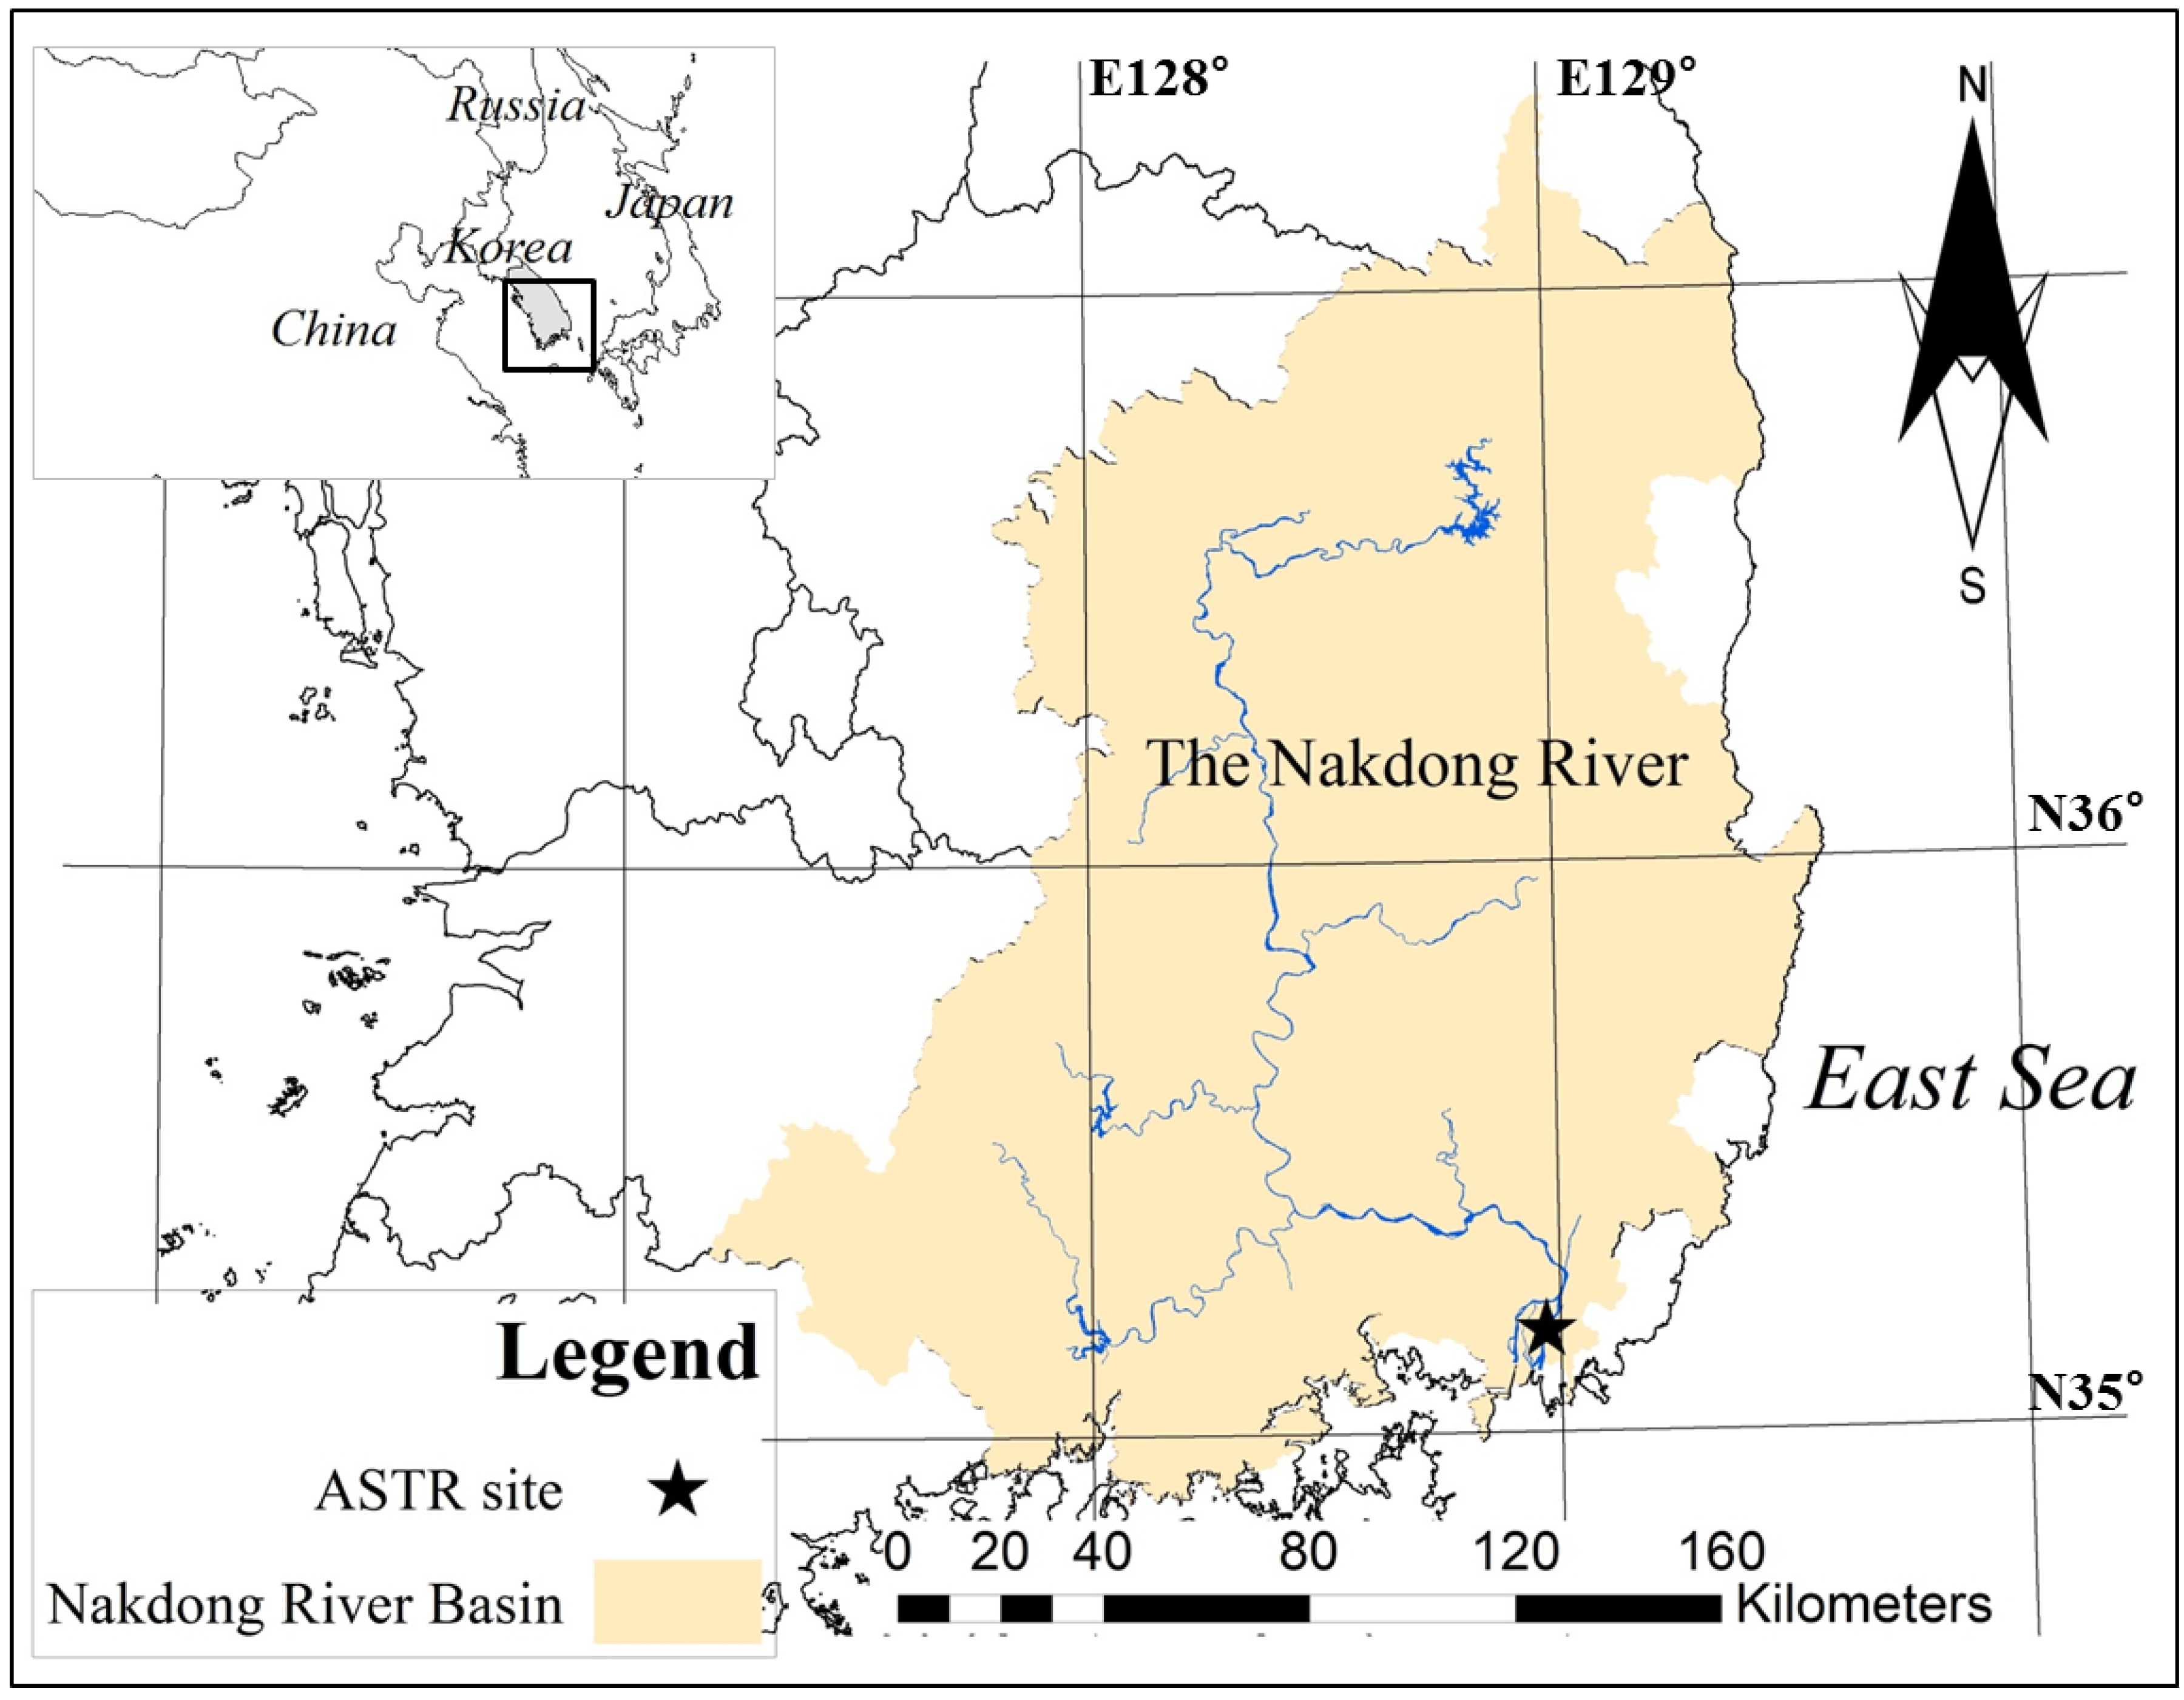
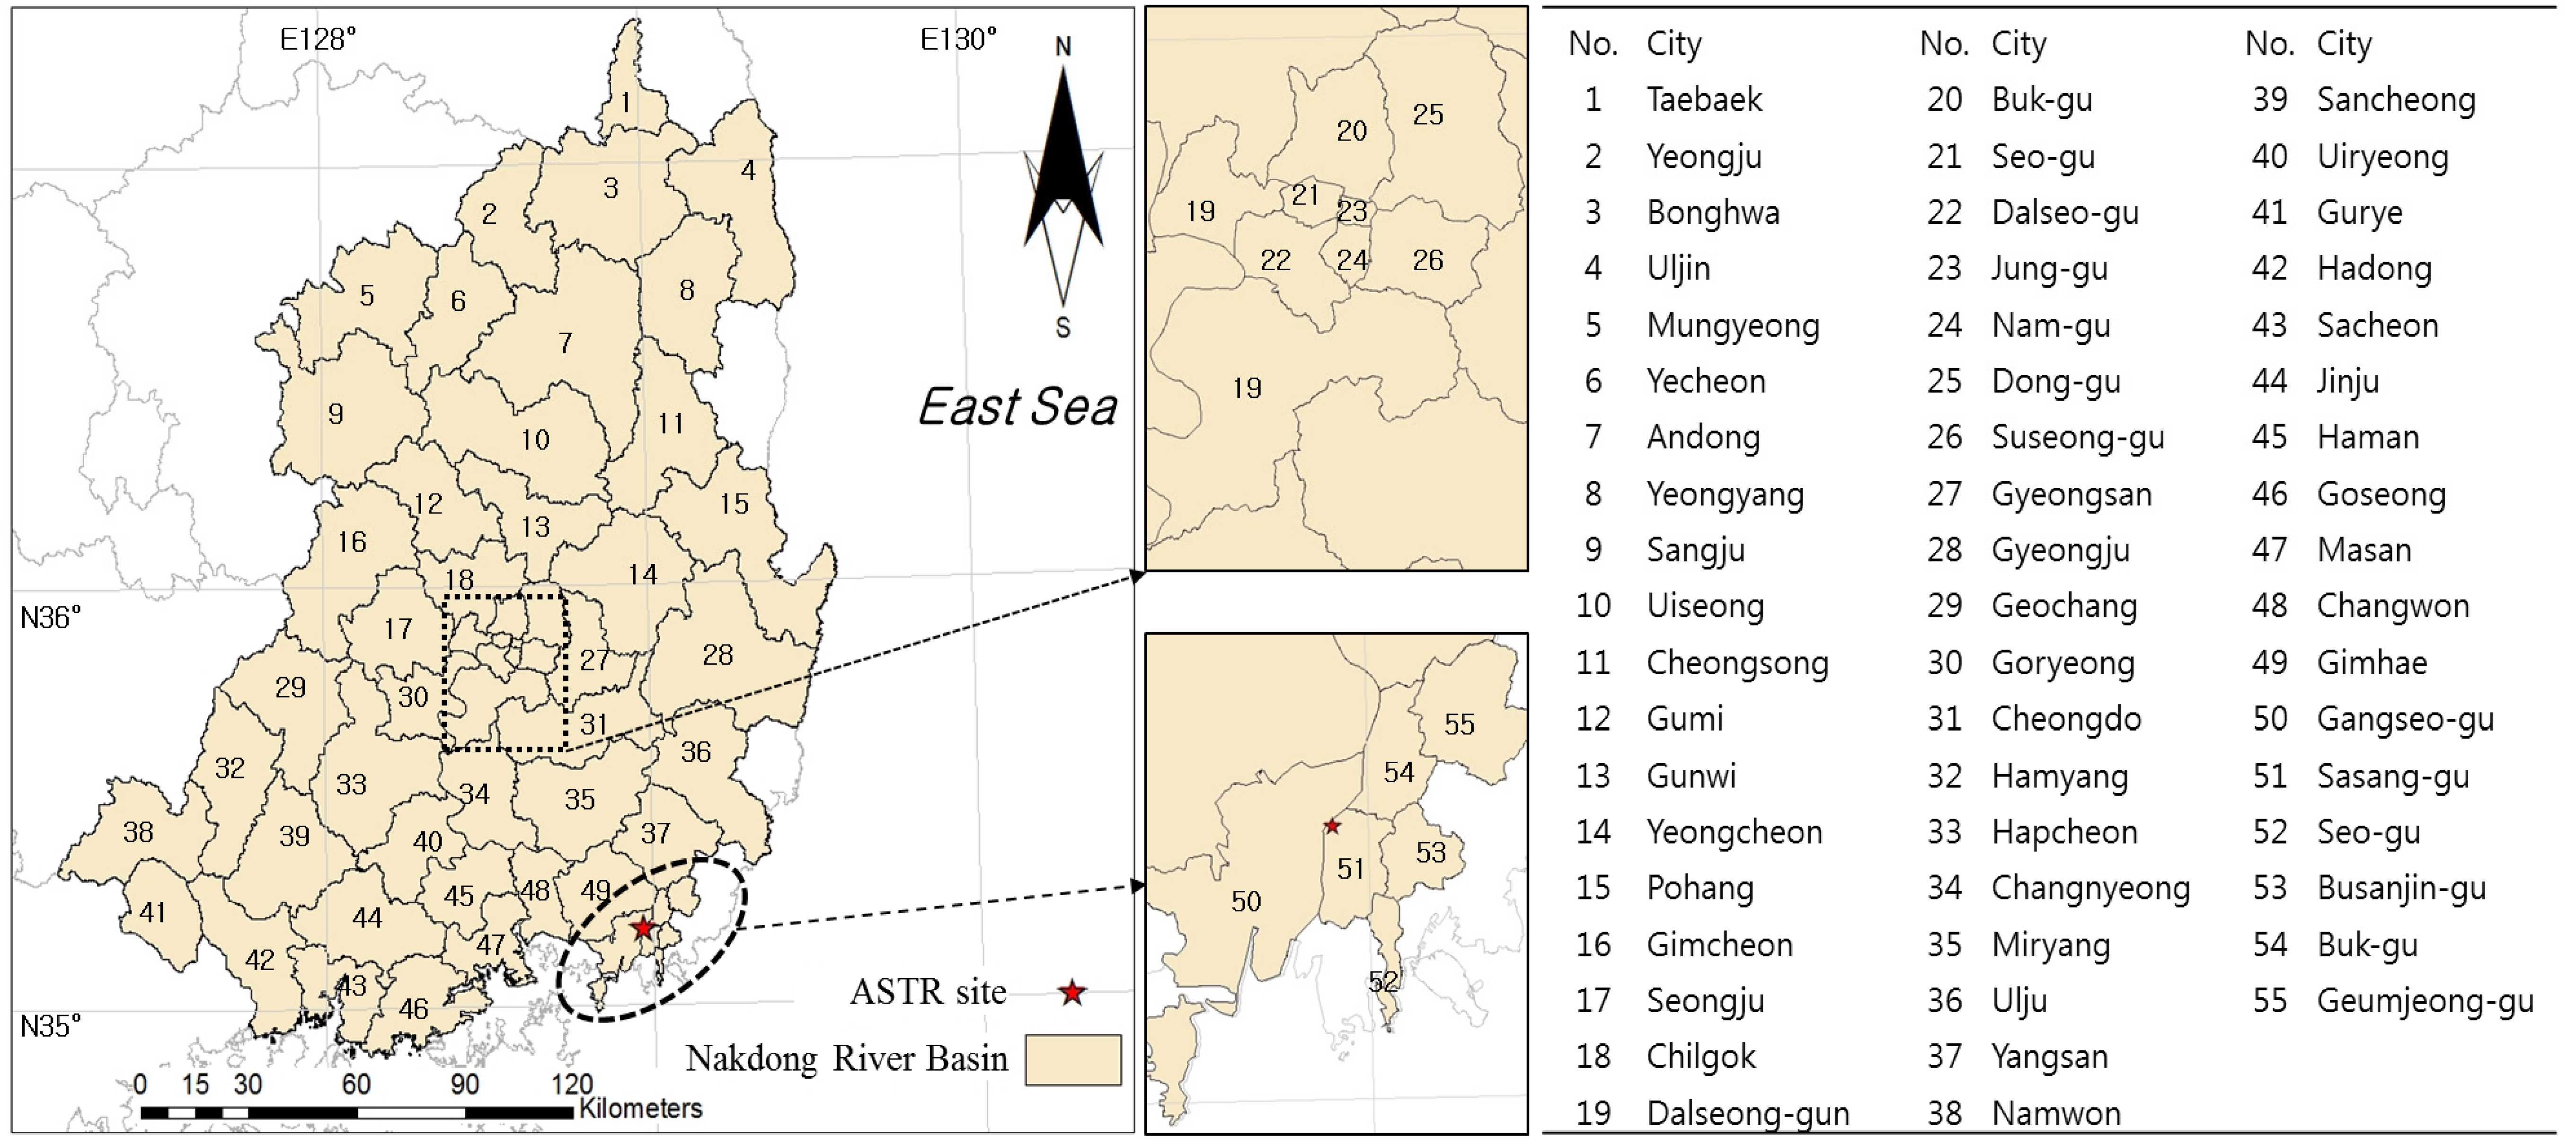
2.1. Study Area
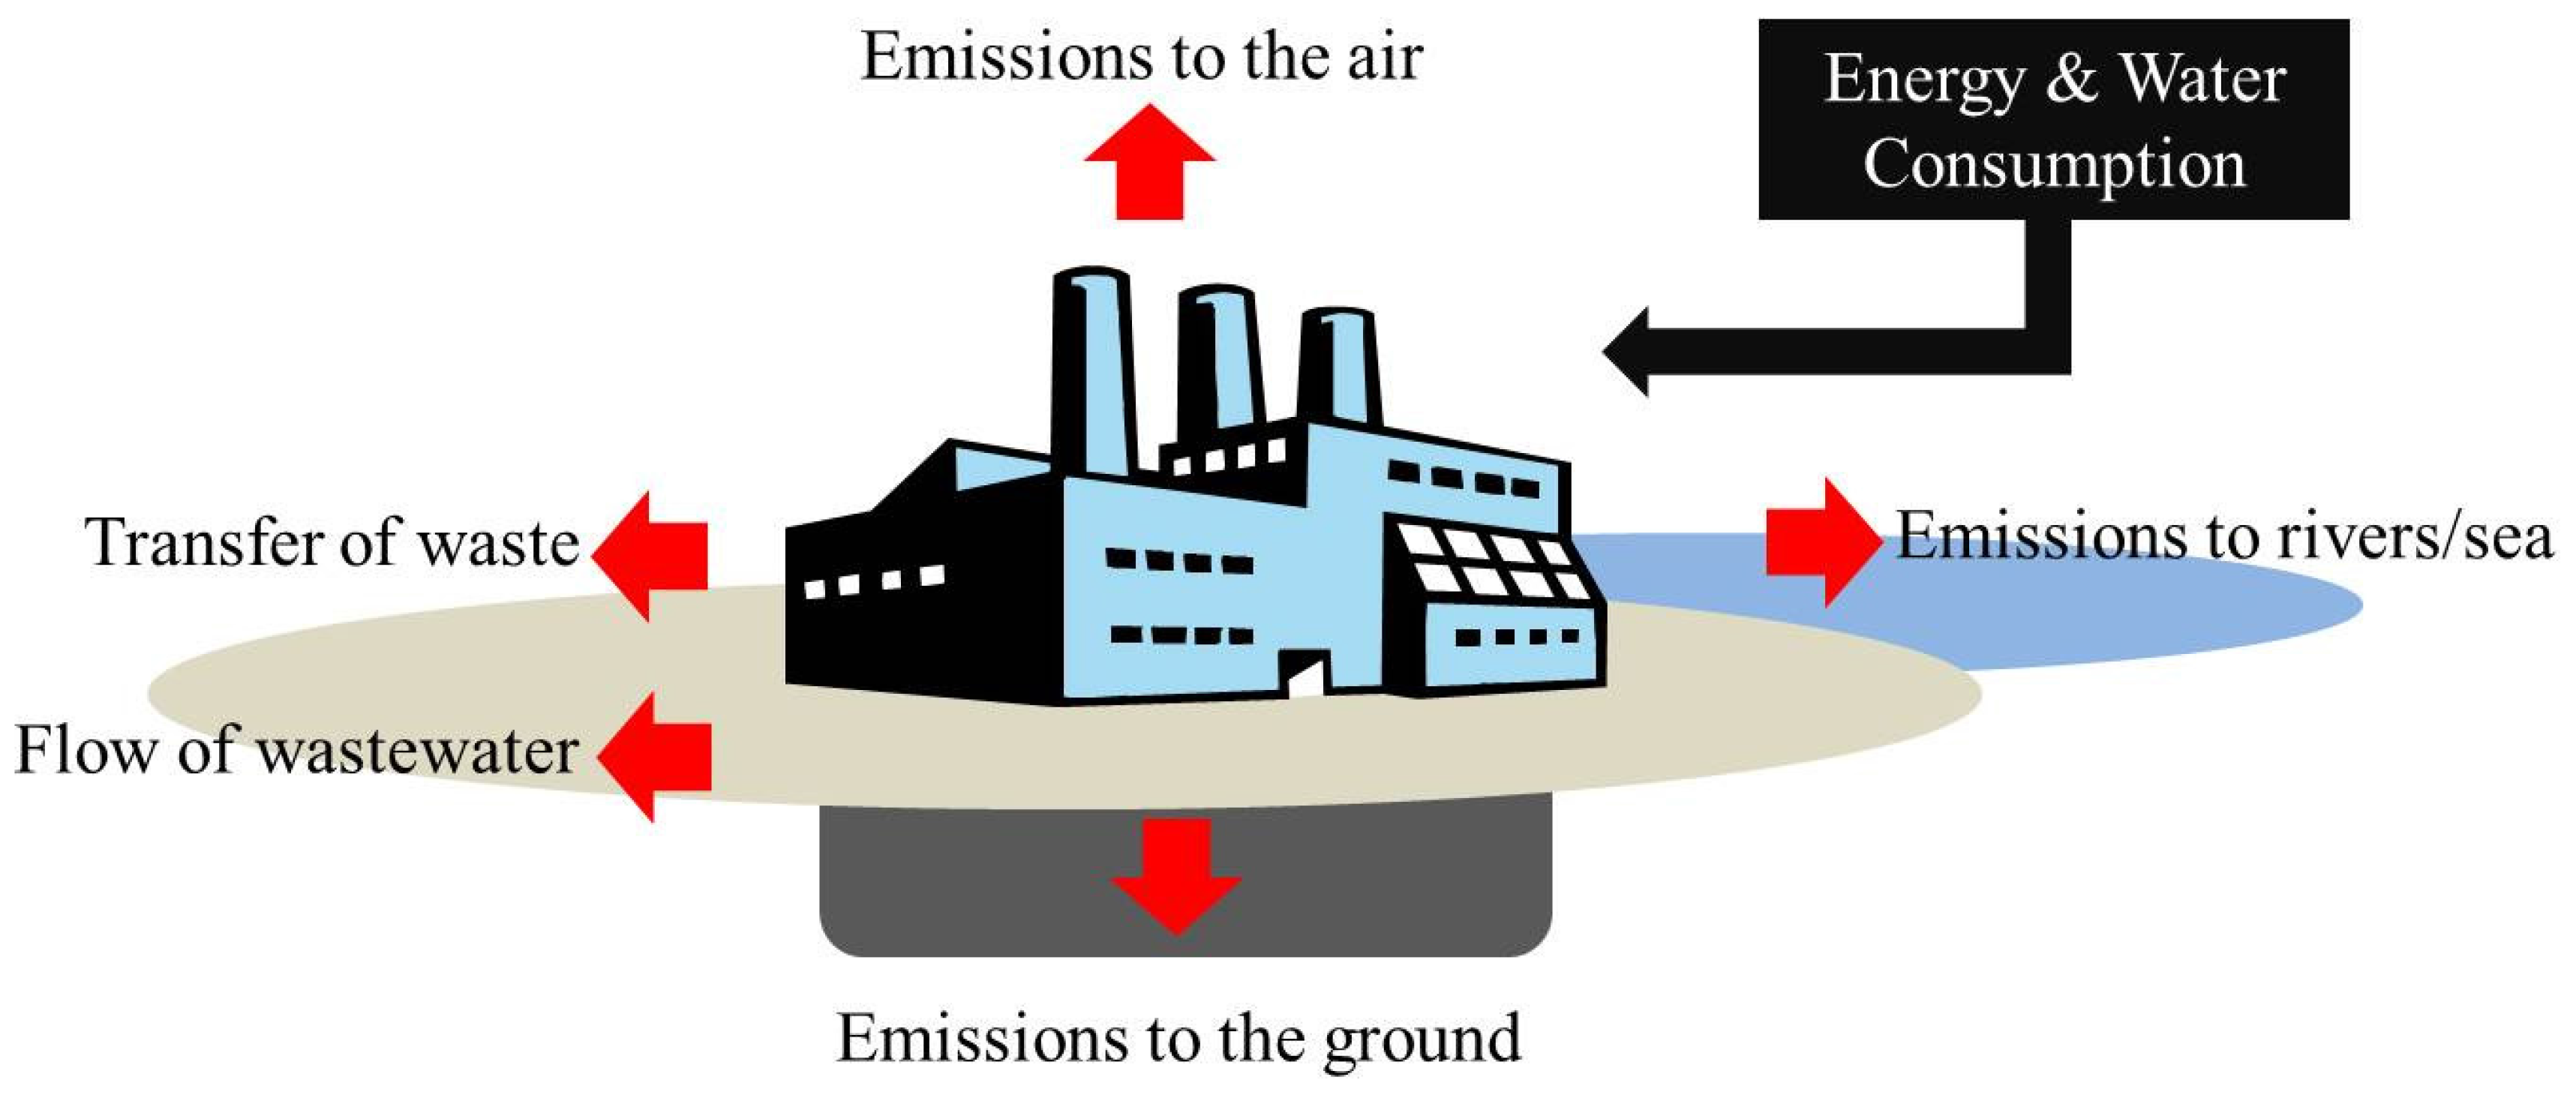
2.2. Pollutant Release and Transfer Register (PRTR)
2.3. Chemicals for Analysis
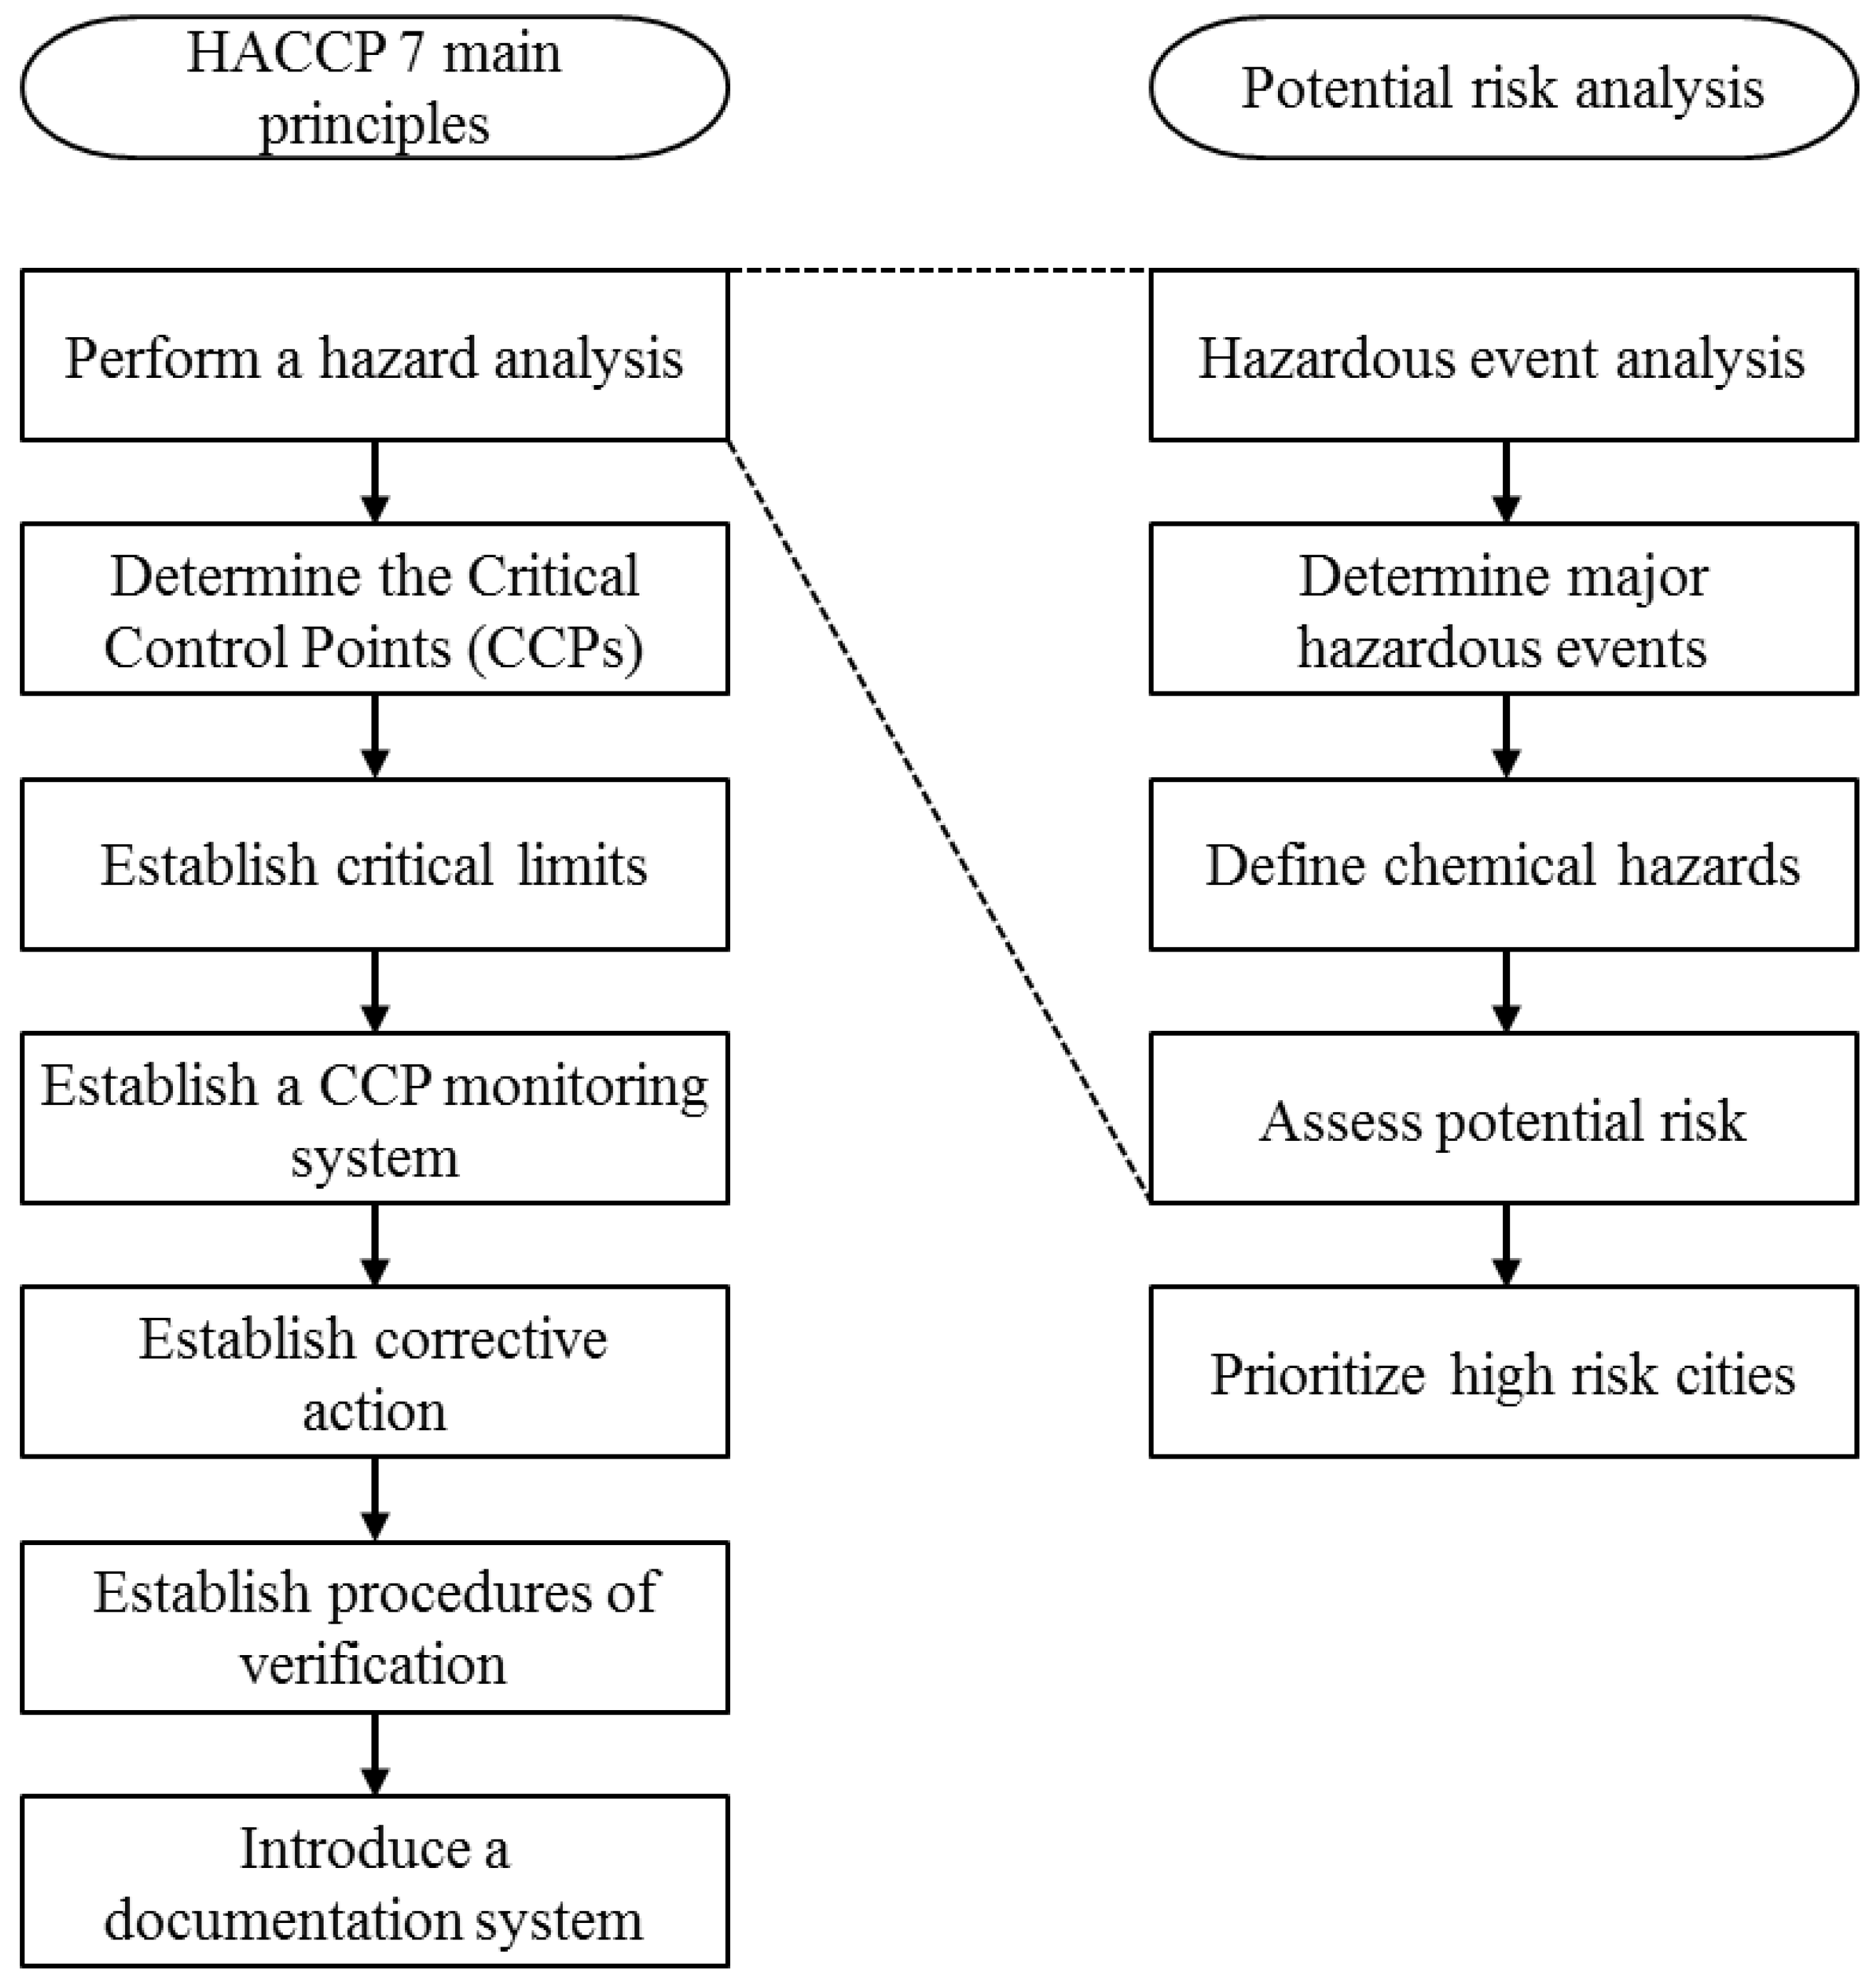
2.4. Mathematical Formulation
3. Results and Discussion
4. Conclusions
Acknowledgments
Author Contributions
Conflicts of Interest
References
- Cho, S.H.; Lee, Y.J.; Yoon, H.B. Korean’s perception and attitudes regarding their tap water (in Korean). Korean Public Health Res. 2006, 32, 130–140. [Google Scholar]
- Dillon, P. Future management of aquifer recharge. Hydrogeol. J. 2005, 13, 313–316. [Google Scholar] [CrossRef]
- Rahman, M.A.; Rusteberg, B.; Uddin, M.S.; Saada, M.A.; Rabi, A.; Sauter, M. Impact Assessment and Multicriteria Decision Analysis of Alternative Managed Aquifer Recharge Strategies Based on Treated Wastewater in Northern Gaza. Water 2014, 6, 3807–3827. [Google Scholar] [CrossRef]
- Sheng, Z. An aquifer storage and recovery system with reclaimed wastewater to preserve native groundwater resources in El Paso, Texas. J. Environ. Manag. 2005, 75, 367–377. [Google Scholar] [CrossRef] [PubMed]
- Page, D.; Vanderzalm, J.; Miotliński, K.; Barry, K.; Dillon, P.; Lawrie, K.; Brodie, R.S. Determining treatment requirements for turbid river water to avoid clogging of aquifer storage and recovery wells in siliceous alluvium. Water Res. 2014, 66, 99–110. [Google Scholar] [CrossRef] [PubMed]
- Havelaar, A.H. Application of HACCP to drinking water supply. Food Control 1994, 5, 145–152. [Google Scholar] [CrossRef]
- Jagals, C.; Jagals, P. Application of HACCP principles as a management tool for monitoring and controlling microbiological hazards in water treatment facilities. Water Sci. Technol. 2004, 50, 69–76. [Google Scholar] [PubMed]
- Damikouka, I.; Katsiri, A.; Tzia, C. Application of HACCP principles in drinking water treatment. Desalination 2007, 210, 138–145. [Google Scholar] [CrossRef]
- Tavasolifar, A.; Bina, B.; Amin, M.M.; Ebrahimi, A.; Jalali, M. Implementation of hazard analysis and critical control points in the drinking water supply system. Int. J. Environ. Health Eng. 2013, 1, 1–7. [Google Scholar]
- Lee, S.-I.; Ji, H.W. Identification of Hazardous Events for Drinking Water Production Process using Managed Aquifer Recharge in the Nakdong River Delta, Korea. Malays. J. Anal. Sci. 2016, 20, 365–372. [Google Scholar]
- Zio, E. Introduction to the Basics of Reliability and Risk Analysis; World Scientific: Singapore, 2007; pp. 3–10. [Google Scholar]
- Benson, S.; Oldenburg, C.; Hoversten, M.; Imbus, S. Carbon Dioxide Capture for Storage in Deep Geologic Formations-Results from the CO2 Capture Project; Elsevier: Amsterdam, The Netherlands, 2005; Volume 2, pp. 1131–1141. [Google Scholar]
- Hass, C.N.; Rose, J.B.; Gerba, C.P. Quantitative Microbial Risk Assessment, 2nd ed.; Wiley: Hoboken, NJ, USA, 2014; pp. 63–81. [Google Scholar]
- Smeets, P.W.M.H.; Rietveld, L.C.; van Dijk, J.C.; Medema, G.J. Practical applications of quantitative microbial risk assessment (QMRA) for water safety plans. Water Sci. Technol. 2010, 61, 1561–1568. [Google Scholar] [CrossRef] [PubMed]
- Toze, S.; Bekele, E.; Page, D.; Sidhu, J.; Shackleton, M. Use of static Quantitative Microbial Risk Assessment to determine pathogen risks in an unconfined carbonate aquifer used for Managed Aquifer Recharge. Water Res. 2014, 44, 1038–1049. [Google Scholar] [CrossRef] [PubMed]
- Bartram, J.; Corrales, L.; Davison, D.; Drury, D.; Gordon, B.; Howard, G.; Rinehold, A.; Stevens, M. Water Safety Plan Manual: Step-by-Step Risk Management for Drinking-Water Suppliers; World Health Organization: Geneva, Switzerland, 2009. [Google Scholar]
- Thomas, J.M.; Mckay, W.A.; Cole, E.; Landmeyer, J.E.; Bradley, P.M. The Fate of Haloacetic Acids and Trihalomethanes in an Aquifer Storage and Recovery Program, Las Vegas, Nevada. Groundwater 2000, 38, 605–614. [Google Scholar] [CrossRef]
- Ying, G.G.; Kookana, R.S.; Dillon, P. Sorption and degradation of selected five endocrine disrupting chemicals in aquifer material. Water Res. 2003, 37, 3785–3791. [Google Scholar] [CrossRef]
- Maeng, S.K.; Sharma, S.K.; Abel, C.D.T.; Magic-Knezev, A.; Amy, G.L. Role of biodegradation in the removal of pharmaceutically active compounds with different bulk organic matter characteristics through managed aquifer recharge: Batch and column studies. Water Res. 2011, 45, 4722–4736. [Google Scholar] [CrossRef] [PubMed]
- Lee, J.K.; Kim, T.O.; Jung, Y.J. Analysis of domestic water pollution accident and response management. J. Wetl. Res. 2013, 15, 529–534. (In Korean) [Google Scholar] [CrossRef]
- Ito, S.; Yokoyama, T.; Asakura, K. Emissions of mercury and other trace elements from coal-fired power plants in Japan. Sci. Total Environ. 2006, 368, 397–402. [Google Scholar] [CrossRef] [PubMed]
- Environmental Protection Agency. Annual Report; Environmental Protection Agency: Washington, DC, USA, 2001. [Google Scholar]
- Ministerio del Medio Ambiente. PRTR. Available online: http://www.mma.gob.cl/retc_ingles/1316/w3-channel.html (accessed on 01 March 2016).
- Government of the Netherlands. General Introduction to the Emission Register Project. Available online: http://www.emissieregistratie.nl/erpubliek/content/explanation.en.aspx (accessed on 23 September 2015).
- PRTR Information System. Annual Report (2013). Available online: http://ncis.nier.go.kr/triopen/ (accessed on 15 March 2015).
- Sheshinski, R.H. Indirect data collection for waste statistics and waste indicators. Stat. J. U. N. Econ. Commun. Eur. 2002, 19, 53–63. [Google Scholar]
- National Fire Protection Association. What is NFPA 704? Available online: http://www.nfpa.org/codes-and-standards/document-information-pages?mode=code&code=704 (accessed on 15 April 2015).
- Korea Information System for Chemical Safety Management. Available online: http://kischem.nier.go.kr/kischem2/wsp/main/main.jsp (accessed on 20 March 2015).
- Nardo, M.; Saisana, M.; Saltelli, A.; Taranta, S. Tools for Composite Indicators Building; European Communities: Ispra (VA), Italy, 2005; pp. 47–48. [Google Scholar]
- Lerche, D.; Matsuzaki, S.Y.; Sørensen, P.B.; Carlsen, L.; Nielsen, O.J. Ranking of chemical substances based on the Japanese Pollutant Release and Transfer Register using partial order theory and random linear extensions. Chemosphere 2004, 55, 1005–1025. [Google Scholar] [CrossRef] [PubMed]
- Yokouchi, Y.; Inagaki, T.; Yazawa, K.; Tamaru, T. Estimates of ratios of anthropogenic halocarbon emissions from Japan based on aircraft monitoring over Sagami Bay, Japan. J. Geophys. Res. 2005, 110. [Google Scholar] [CrossRef]
- Yamagata, H.; Saino, H.; Minamiyama, M.; Takahashi, M. Comprehensive management of chemical substances in a water environment using PRTR data. Water Sci. Technol. 2006, 53, 99–106. [Google Scholar] [CrossRef] [PubMed]

| Process | Hazardous Event | Type 1 | Hazards |
|---|---|---|---|
| Catchment Area | Illegal release of waste water from restaurants and private waste water treatment plants | M, C | Pathogens, nutrients, surfactants, metal, heavy metal, non-biodegradable organics, color, odor, taste |
| Discharge of waste water from factories in the upstream | C | Metal, heavy metal, non-biodegradable organics | |
| Release by accidents of major chemicals from industrial complex | C | Non-biodegradable organics | |
| Frequent oil leakage accidents | C | Non-Aqueous Phase Liquids (NAPLs) | |
| Land use | M, C, P | Pathogens, sulfur oxides, nutrients, turbidity, color, surfactants, organic matter, oil-contaminant | |
| Rapid change of river water quality by flood and drought | M, C | Pathogens, nutrients, turbidity, color, algae, toxic material, odor, taste | |
| Year-round occurrence of eutrophication | M, C | Algae, toxic material, color, odor, taste | |
| Storage | Rapid growth of cyanobacteria by abnormal high temperature in storage tank | M | Algae |
| Storage of treated water | Regrowth of pathogens or carcinogen (THMs) by inappropriate maintenance of residual chlorine | C | Pathogens, disinfection by-products |
| Rank | Chemical | CAS No. 1 | Molecular Formula | Toxicity 2 |
|---|---|---|---|---|
| 1 | Xylene | 1330-20-7 | C8H10 | 2 |
| 2 | Toluene | 108-88-3 | C7H8 | 2 |
| 3 | Dichloromethane | 75-09-2 | CH2Cl2 | 2 |
| 4 | Methyl alcohol | 67-56-1 | CH3OH | 1 |
| 5 | Ethyl acetate | 141-78-6 | C4H8O2 | 1 |
| 6 | Methyl ethyl ketone | 78-93-3 | CH3COC2H5 | 1 |
| 7 | Isopropanol | 67-63-0 | C3H8O | 1 |
| 8 | Ethylbenzene | 100-41-4 | C6H5C2H5 | 2 |
| 9 | N,N-Dimethylformamide | 68-12-2 | HCON(CH3)2 | 1 |
| 10 | Trichloroethylene | 79-01-6 | C2HCl3 | 2 |
| Chemical | The Ranking of Cities Based on Iqc and Rqc | ||||
|---|---|---|---|---|---|
| 1 | 2 | 3 | 4 | 5 | |
| Xylene | 36 1 (52.1 2) | 48 (26.7) | 28 (11.1) | 37 (10.6) | 15 (9.33) |
| 36 3 (13.7 4) | 48 (10.0) | 37 (6.35) | 28 (6.08) | 50 (6.04) | |
| Toluene | 50 (4.49) | 21 (2.80) | 12 (2.28) | 45 (1.70) | 36 (1.66) |
| 50 (4.21) | 21 (3.01) | 12 (2.56) | 45 (2.46) | 36 (2.45) | |
| Dichloromethane | 45 (22.3) | 48 (5.10) | 44 (3.25) | 36 (2.50) | 37 (1.63) |
| 45 (8.91) | 48 (4.37) | 44 (3.29) | 36 (3.01) | 37 (2.49) | |
| Methyl alcohol | 45 (11.0) | 12 (10.1) | 36 (9.62) | 19 (5.06) | 44 (4.83) |
| 45 (4.43) | 36 (4.27) | 12 (3.81) | 49 (3.07) | 19 (2.90) | |
| Ethyl acetate | 12 (104) | 36 (85.9) | 45 (33.2) | 37 (18.9) | 50 (11.7) |
| 36 (12.5) | 12 (12.2) | 45 (7.69) | 37 (6.00) | 50 (4.80) | |
| Methyl ethyl ketone | 12 (11.0) | 36 (6.95) | 37 (4.09) | 15 (3.39) | 18 (2.53) |
| 12 (3.97) | 36 (3.55) | 37 (2.79) | 15 (2.28) | 50 (2.07) | |
| Isopropanol | 12 (80.1) | 37 (10.1) | 48 (7.72) | 36 (4.40) | 45 (4.32) |
| 12 (10.7) | 37 (4.37) | 48 (3.80) | 36 (2.82) | 45 (2.77) | |
| Ethylbenzene | 36 (514) | 48 (151) | 19 (69.4) | 37 (56.6) | 28 (56.0) |
| 36 (43.2) | 48 (23.8) | 19 (15.2) | 37 (14.7) | 28 (13.7) | |
| N,N-Dimethylformamide | 20 (7.03) | 50 (5.68) | 27 (4.02) | 19 (1.80) | 16 (1.69) |
| 20 (3.36) | 50 (3.35) | 27 (2.60) | 19 (1.73) | 16 (1.56) | |
| Trichloroethylene | 19 (4.94) | 36 (4.60) | 12 (1.72) | 27 (1.35) | 48 (1.28) |
| 36 (4.08) | 19 (4.05) | 12 (2.22) | 48 (2.20) | 27 (2.13) | |
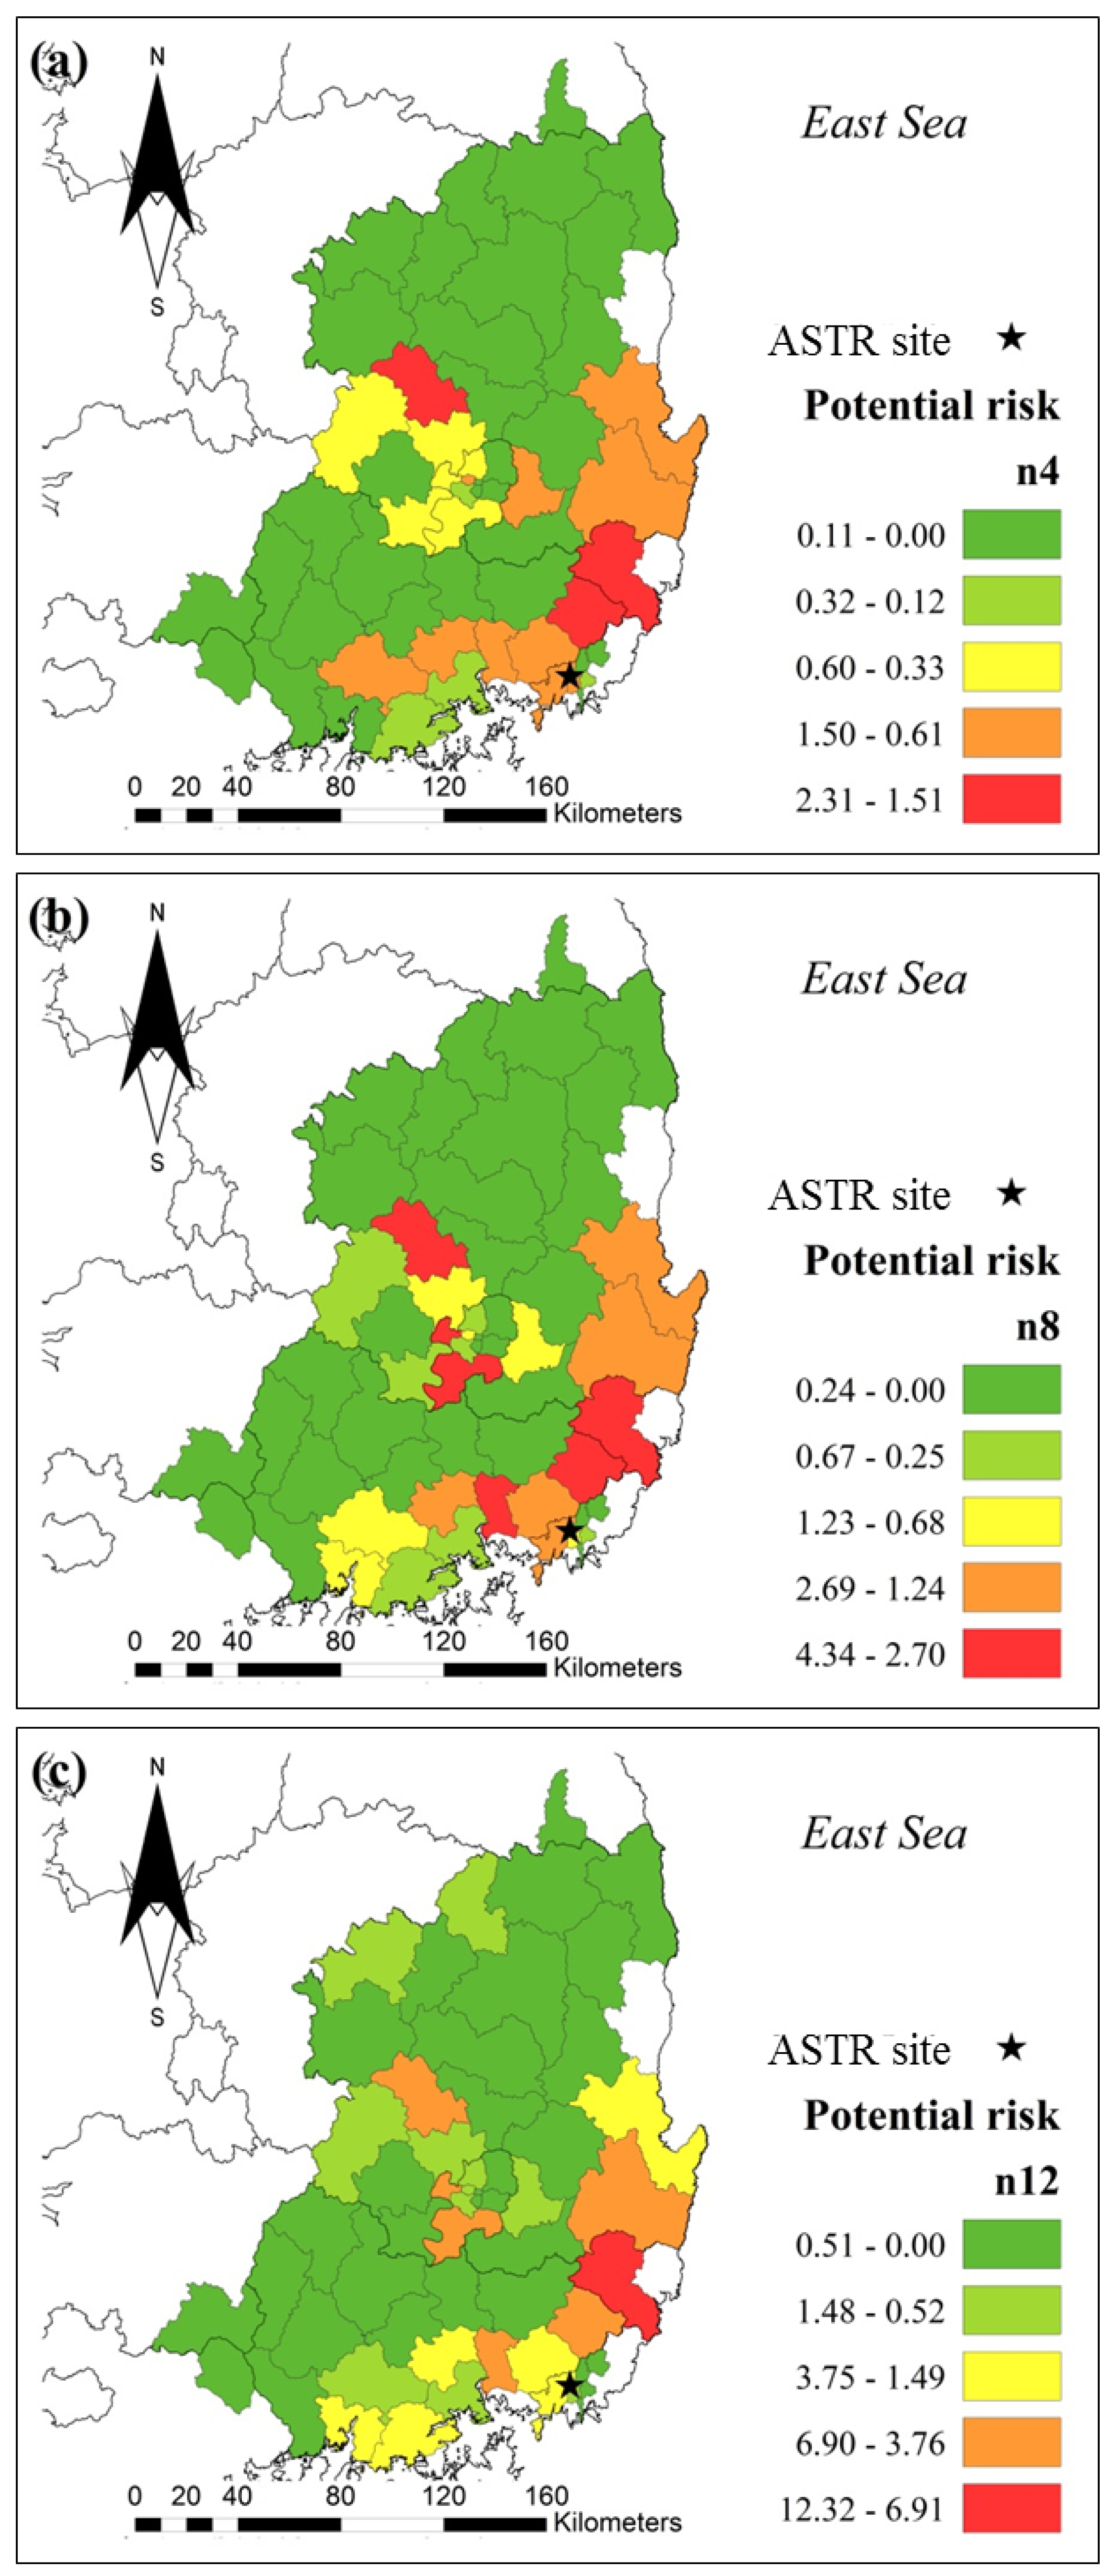
| Rank | (a) 1 | (b) 2 | (c) 3 | |||
|---|---|---|---|---|---|---|
| City No. | Rc | City No. | Rc | City No. | Rc | |
| 1 | 37 | 2.31 | 48 | 4.34 | 36 | 12.3 |
| 2 | 36 | 2.15 | 36 | 4.31 | 48 | 6.90 |
| 3 | 12 | 2.02 | 37 | 3.66 | 37 | 4.73 |
| 4 | 48 | 1.50 | 19 | 3.57 | 12 | 4.64 |
| 5 | 50 | 1.27 | 12 | 3.48 | 19 | 4.38 |
| 6 | 49 | 1.19 | 45 | 2.69 | 28 | 4.03 |
| 7 | 15 | 1.12 | 15 | 1.89 | 45 | 3.75 |
| 8 | 45 | 1.12 | 50 | 1.69 | 50 | 3.45 |
| 9 | 51 | 0.95 | 49 | 1.69 | 43 | 2.72 |
| 10 | 28 | 0.94 | 28 | 1.61 | 15 | 2.60 |
© 2016 by the authors; licensee MDPI, Basel, Switzerland. This article is an open access article distributed under the terms and conditions of the Creative Commons Attribution (CC-BY) license (http://creativecommons.org/licenses/by/4.0/).
Share and Cite
Ji, H.W.; Lee, S.-I. Assessment of Risk Due to Chemicals Transferred in a Watershed: A Case of an Aquifer Storage Transfer and Recovery Site. Water 2016, 8, 242. https://doi.org/10.3390/w8060242
Ji HW, Lee S-I. Assessment of Risk Due to Chemicals Transferred in a Watershed: A Case of an Aquifer Storage Transfer and Recovery Site. Water. 2016; 8(6):242. https://doi.org/10.3390/w8060242
Chicago/Turabian StyleJi, Hyon Wook, and Sang-Il Lee. 2016. "Assessment of Risk Due to Chemicals Transferred in a Watershed: A Case of an Aquifer Storage Transfer and Recovery Site" Water 8, no. 6: 242. https://doi.org/10.3390/w8060242
APA StyleJi, H. W., & Lee, S.-I. (2016). Assessment of Risk Due to Chemicals Transferred in a Watershed: A Case of an Aquifer Storage Transfer and Recovery Site. Water, 8(6), 242. https://doi.org/10.3390/w8060242