Article

Modeling Water-Quality Loads to the Reservoirs of the Upper Trinity River Basin, Texas, USA

1
Department of Geography, Chonnam National University, Gwangju 61186, Korea
2
Blackland Research and Extension Center, Texas AgriLife Research, Texas A & M University System, Temple, TX 76502, USA
3
Soil and Water Research Laboratory, USDA-ARS, Temple, TX 76502, USA
4
Department of Environmental Engineering, Sri Jayachamarajendra College of Engineering, Mysore, Karnataka 570006, India
5
Spatial Sciences Laboratory, Department of Ecosystem Science and Management, Texas A & M University, College Station, TX 77843, USA
6
Department of Civil Engineering, Indian Institute of Technology-Madras, Chennai, Tamil Nadu 600002, India
7
Environmental Division, Tarrant Regional Water District, Fort Worth, TX 76102, USA
*
Author to whom correspondence should be addressed.
Water 2015, 7(10), 5689-5704; https://doi.org/10.3390/w7105689
Submission received: 8 July 2015 / Revised: 25 September 2015 / Accepted: 14 October 2015 / Published: 20 October 2015
(This article belongs to the Special Issue Watershed Protection and Management)

Abstract

:
The Upper Trinity River Basin (TRB) is the most populated river basin and one of the largest water suppliers in Texas. However, sediment and nutrient loads are reducing the capacity of reservoirs and degrading water quality. The objectives of this study are to calibrate and validate the Soil and Water Assessment Tool (SWAT) model for ten study watersheds within the Upper TRB in order to assess nutrient loads into major reservoirs in the basin and to predict the effects of point source elimination and urbanization on nutrient loads through scenario analyses. SWAT performed reasonably well for the current condition except for two out of five tributaries in the Eagle Mountain watershed and total phosphorous in Richland-Chambers. The impacts of simulated scenarios varied within watersheds. Point-source elimination achieved reductions ranging from 0.3% to 24% in total phosphorus and 1% to 56% in total nitrogen received by the reservoirs. Population and development projections were used to examine the impacts of urbanization on each watershed. Projected urbanization in 2030 had large effects on simulated total phosphorus loads in some watersheds, ranging from a reduction of 1% to an increase of 111%. Projected urbanization also affected simulated total nitrogen loads, from a reduction of 3% to an increase of 24%. One limitation of this study is the lack of long-term, up-to-date water quality data due to discontinued water-quality monitoring stations. Although careful considerations were given to the adjustment of parameter values reflecting various aspects of the nutrient processes, further data collection will enhance modeling study for assessment of these watersheds’ water resources and environmental problem.

1. Introduction

Excessive nutrients have created numerous negative ecological effects. For instance, excess nutrient loading into the reservoirs in the Trinity River Basin (TRB) has led to eutrophication, depletion of dissolved oxygen, excess algal growth, and fish tissue contamination [1]. More than 10 river segments in the TRB watershed, including some in reservoirs, are classified under 2000 Clean Water Act list for water quality impairment by point and nonpoint sources by the Texas Commission on Environmental Quality (TCEQ). Therefore, the TRB’s top priority has been focused on protecting water quality.
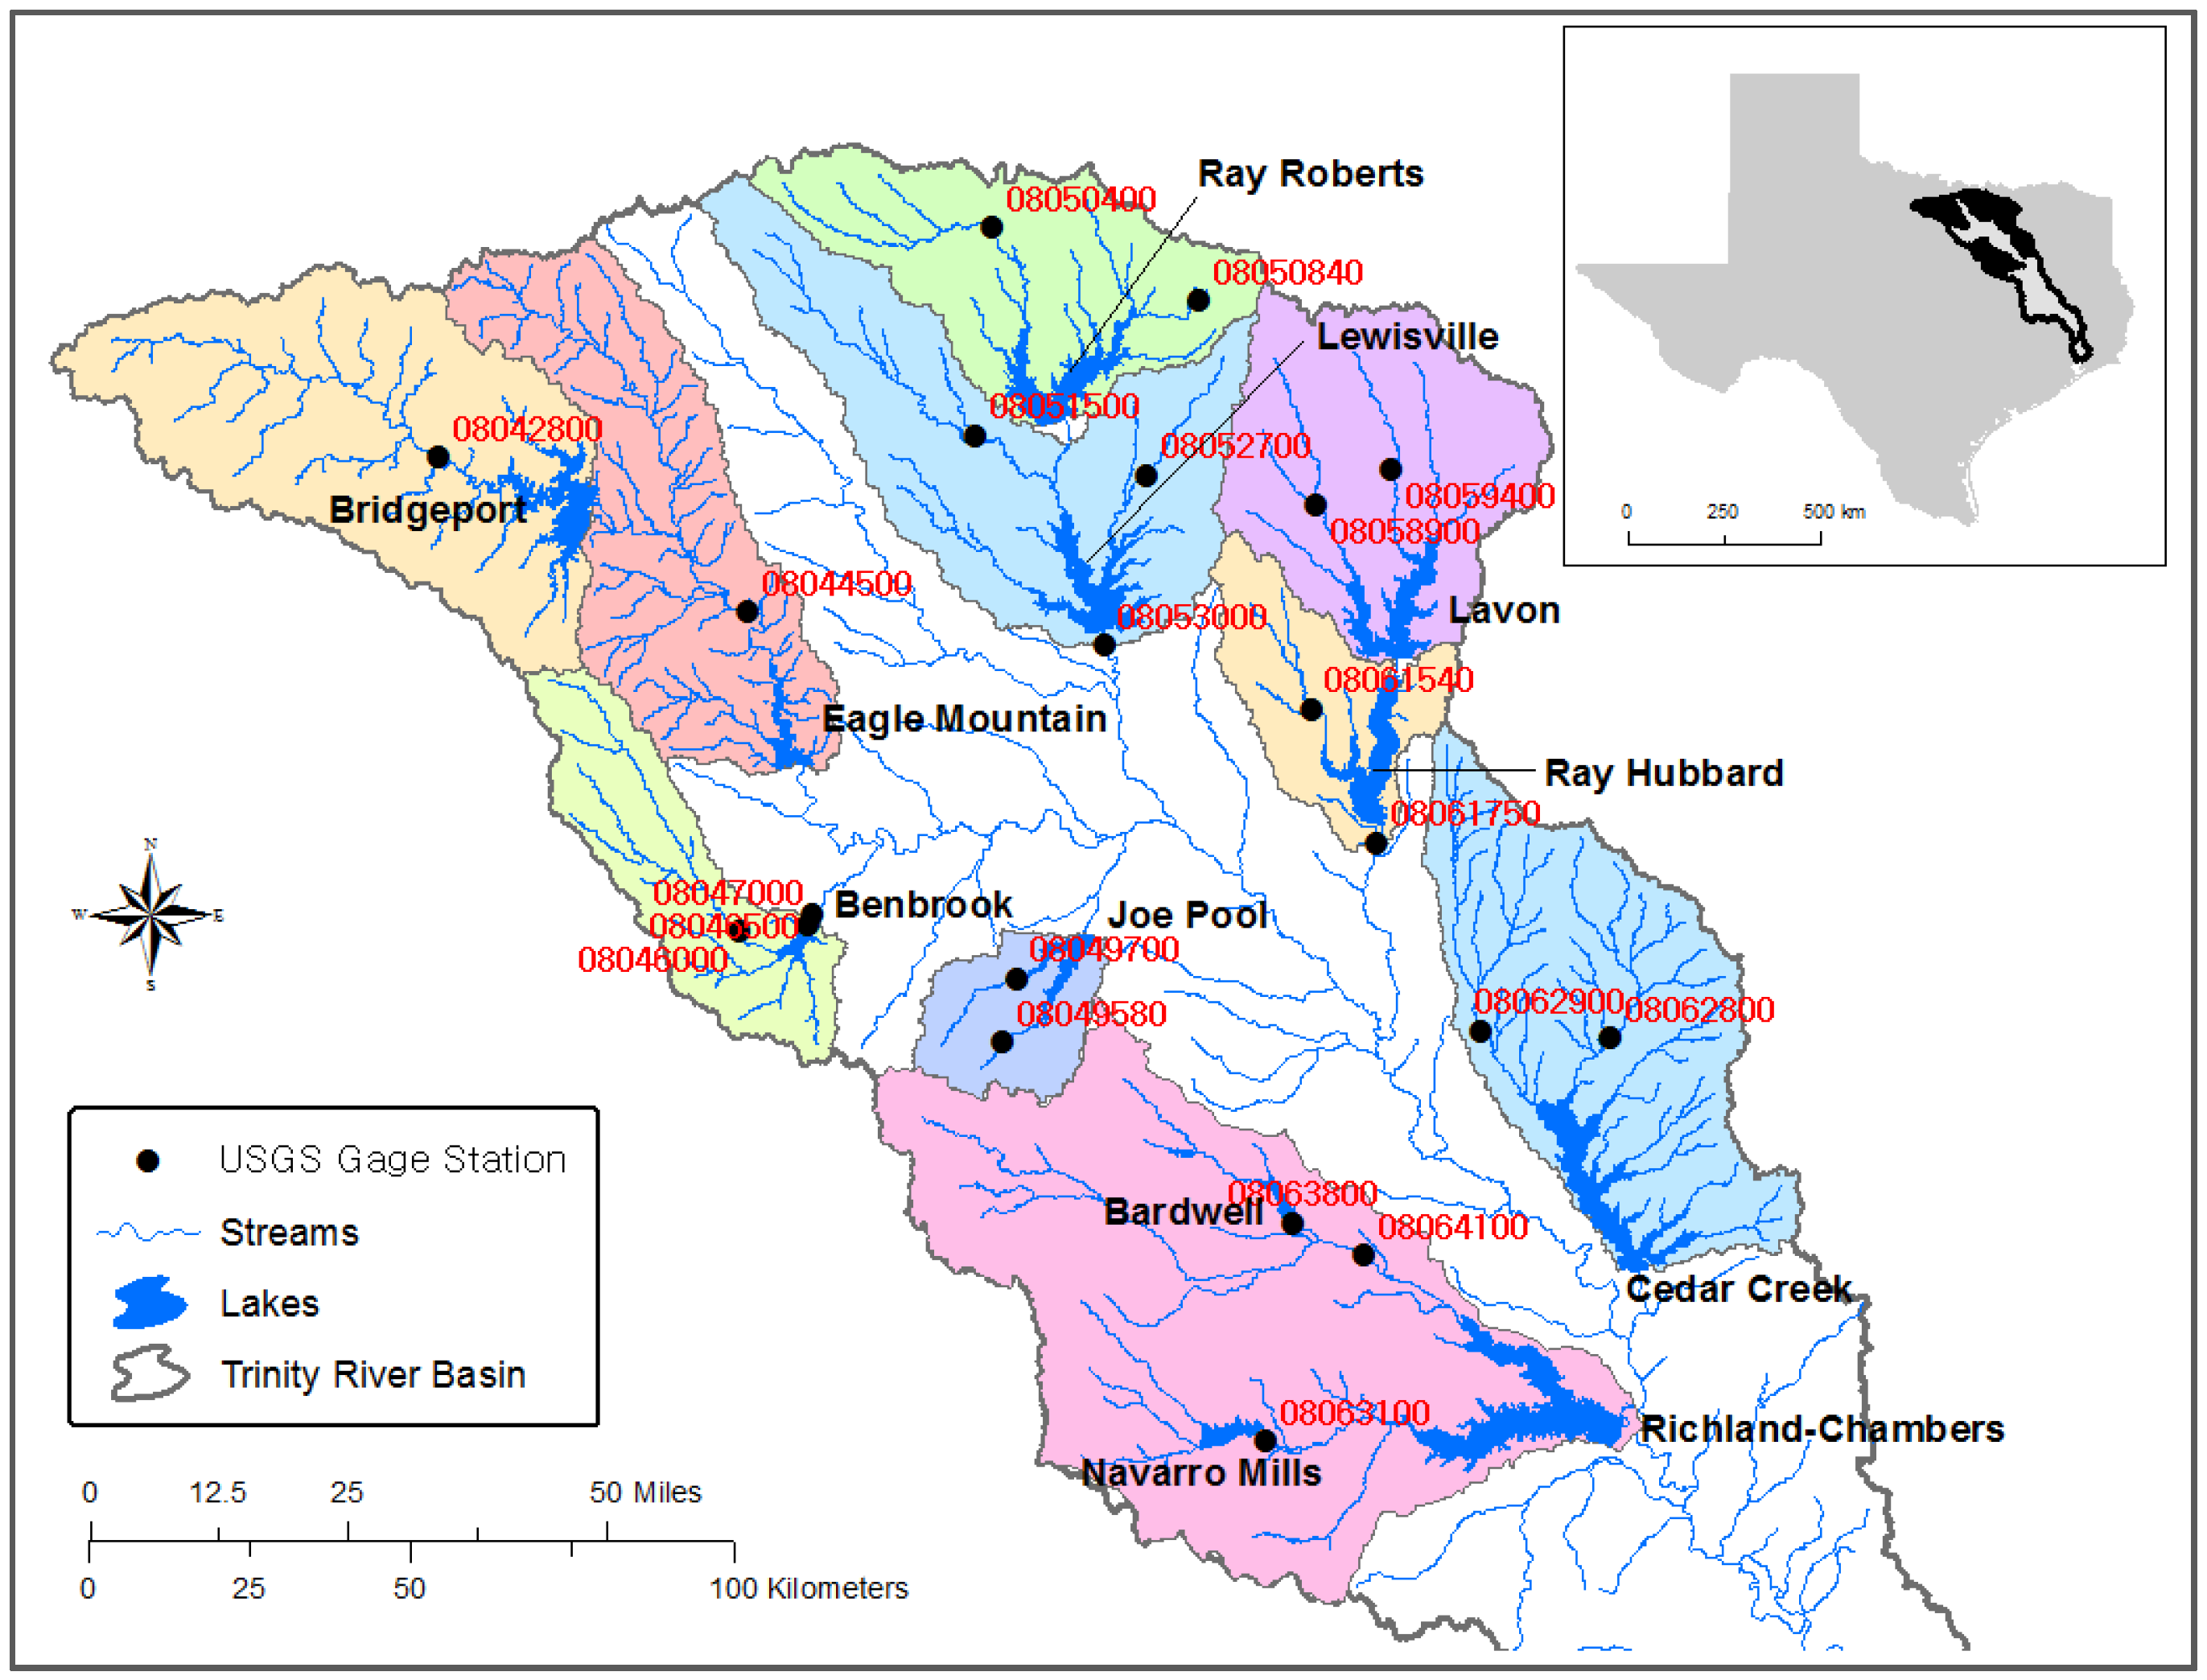
The TRB extends from northwest of Fort Worth to the Gulf of Mexico near Houston, Texas. The Upper TRB (Figure 1) including the Dallas-Fort Worth Metro is the most populated and heavily urbanized area in Texas. More than 90% of the regional municipal water supply is from reservoirs. The North Central Texas Council of Governments (NCTCOG) forecasted the future population increase and urban expansion in the Dallas-Fort Worth Metropolitan area and surrounding 10 Counties through the year 2060 [2]. NCTCOG [2] estimated that total population will increase from 6.3 million as in 2010 to over 9.1 million in 2030, and eventually to 13.0 million in 2060, more than doubling during the 50 years of period. To meet water supply needs for this increasing population, it has been estimated that 2960 million cubic meters in 2030 and 4070 million cubic meters in 2060 will be needed, which requires 2343 million cubic meters more water (2.4 times larger) than historical usage in 2006 (1727 million cubic meter).
Incoming sediment loads are trapped in the reservoirs reducing their capacity, and nutrients loads have the effect of degrading water quality. Sediment surveys of Texas reservoirs and monitoring of reservoir water quality have raised concerns of water degradation and reducing capacity of reservoirs [1]. With increasing regional water demands and public concern, a number of studies have been conducted in the TRB. The Soil and Water Assessment Tool (SWAT) [3] was used to predict current and future water quality and to evaluate the impacts on urban increase and Best Management Practices (BMPs). There have been modeling works for some watersheds previously [4,5,6]. TNRCC [7] point out that nonpoint source pollution in agricultural streams was one of the major water quality issues. Simulation of the impacts of BMPs on nutrient loading was conducted in Berthold [1] for the watersheds of five major reservoirs: Bridgeport, Eagle Mountain, Benbrook, Cedar Creek, and Richland-Chambers (Figure 1) using SWAT. Berthold [1] reported that primary causes were suspected to be urbanization and suggested implementation of BMPs for storm water, nutrient controls, and agricultural land. The Bridgeport and part of Eagle Mountain watersheds was studied in reference [4]. They focus on evaluating the impacts of water quality management plans at the farm level (reduced sediment and nutrient loadings up to 99%) and at two watershed outlet locations (reduced sediment and nutrient loadings by only 1% to 2%) using SWAT. They reasoned that the small impacts at the watershed level compared to the farm level were due to the water quality management plan implementation area was very small compared to total watershed area. Debele et al. [8] conducted SWAT simulation for the upper streams of Cedar Creek Reservoir and Eagle Mountain Reservoir in the TRB (Figure 1) with the focus of enhancing SWAT evapotranspiration and overland flow routing modules. Lee et al. [9] has reported the Eagle Mountain watershed study in which SWAT simulated the annual Total Nitrogen (TN) yield of 1055 metric ton and annual Total Phosphorous (TP) yield of 173 metric ton to the lake. However, entire watershed-wide overview and modeling works for all watersheds (some were not included in previous studies) were needed for comprehensive understanding of the current status and future assessment for this area including projected population. Wang et al. [10] have conducted flow and sediment modeling for all the watersheds with the major reservoirs in the Upper TRB (Figure 1) using SWAT. The calibrated SWAT performed reasonably well for streamflow and sediment loads. The effects of upland ponds were further evaluated in reference [10] through a pond removal scenario. Nutrient loads and the future urbanization impact are not yet explored by reference [10]. This study was built upon previously conducted work by Wang et al. [10] and continued the modeling effort for nutrient loads in the watersheds. The objectives of this study are to assess nutrient loads to major reservoirs in the entire Upper TRB and to predict the effects of point source elimination and urbanization on nutrient loads through scenario analyses.
Figure 1. The locations of major reservoirs and USGS (US Geological Survey) gage stations in the Upper Trinity River Basin (adopted from reference [10]).
Water 07 05689 g001

2. Materials and Methods

2.1. Study Area

The study area in the Upper TRB in North Central Texas consists of 12 major reservoirs, with Bardwell and Navarro Mills draining into the Richland-Chambers (Figure 1). The Trinity River eventually discharges into the Gulf of Mexico. These reservoirs are the source of the local water supply for the urban population. The quantity and quality of this water has been of concern along with the population growth. This study focused on the ten watersheds listed in Table 1. The major landuse distribution is shown in Figure 2 based on the National Land Cover Dataset (NLCD) 2001 dataset.
Figure 2. Major landuse for the Upper Trinity River Basin study area. Number indicates the percentage of the largest landuse in each watershed.
Water 07 05689 g002
Table 1. Watersheds within the Trinity River Basin study area.
WatershedWatershed Area (km2)Number of Sub-Watershed
Joe Pool5807
Lavon199320
Lewisville252032
Ray Roberts179028
Ray Hubbard90720
Benbrook110037
Bridgeport284957
Richland Chambers5157156
Cedar Creek2600106
Eagle Mountain2230150
NCTCOG [2] Demographic Forecast provides long-range, small area household/population projections for use in intra-regional infrastructure planning and resource allocations in the metropolitan area of North Central Texas. The 2030 forecast has a 30-year time horizon and is conducted for the ten counties in the study area, as shown in Figure 3b. Urban area change is derived from population change (2000 to 2030) and 2001 NLCD based on the relationship between the fraction of counties that is urban and population density as shown in Figure 3a. Dallas and Tarrant counties’ total share of the regional households will decrease. Collin and Denton counties will continue to capture an increasing share of the region’s growth. The remaining six ex-urban counties are projected to show very strong growth. Parker, Johnson, Ellis, Kaufman, and Rockwall counties are each expected to more than triple their 2000 household totals by the year 2030, while Wise County more than doubling over this same period [2]. Therefore, the population center of the greater Dallas-Fort Worth metropolitan area will begin to square off, with strong growth along the SH 114 and I-35 corridors in Denton County (154% population change) and move west over the next 30 years. The region infrastructure improvements will draw residents to the west and southwest portions of the region including eastern Parker County (284% population change) and northern Johnson County (257% change).
Figure 3. (a) Relationship between the fraction of counties that is urban and population density, as derived from North Texas Council of Governments (NCTCOG) population data for 2000 as well as 2001 NLCD [10]; (b) Fraction of urban change based on population projections for 2030. New urban area equals to the production of old urban area and fraction in urban change, e.g., a fraction in urban change of 36 on the map means the urban area will change to 36-fold of old urban area.
Water 07 05689 g003

2.2. Short Description of the SWAT Model and Model Inputs

SWAT is a continuous-time simulation model, which is developed to simulate/predict hydrologic and water quality processes at large watershed scales [10]. It is a spatially distributed model that subdivides a watershed into smaller subwatersheds. Subwatersheds are divided into Hydrologic Response Units (HRUs), which are assumed to be unique combinations of soil, land use, and slope. Water and pollutant loadings are predicted for each HRU and lumped for each subwatershed, and then routed through a channel network to the watershed outlet. The model is widely used to manage water quantity and quality, and to establish watershed conservation plans. Detailed descriptions of the SWAT model can be found in references [11,12].
A previous study by Wang et al. [10] presented the SWAT model set up, flow and sediment calibration and validation for the Upper TRB. This study is a continuation of that study and focuses on the estimation of nutrient loads in the Basin. Both studies were from the series of individual modeling efforts conducted by several modelers (listed as co-authors of this article). The same data sources were employed in each effort to maintain consistency. The major datasets used in these studies include a 30-m National Elevation Dataset (NED) used as DEM (Digital Elevation Model) to delineate watershed; and a 30-meter NLCD for landuse; and SSURGO (Soil Survey Geographic) for soils. Weather data were obtained from NOAA (National Oceanic and Atmospheric Association) and NCDC (National Climate Data Center) for each weather station located within and around each watershed. The information for dams in the Upper TRB was obtained from US Army Corps of Engineers and National Inventory of Dams.
A total of 114 point sources discharge data were used in this study. They were from the USGS Water Resource database, or EPA (Environmental Protection Agency)’s Permit Compliance System identified actively operating point sources with discharge data. Data of the wastewater treatment plant discharge rates are mostly permitted discharge rates, not the amount actually discharged due to the data unavailability. However, while data were available, the actual wastewater effluent concentrations and flows were used. Permit limits, while available, were used for calculating nutrient loads for these point sources. In some cases where no permitted rates were available, nutrient loads were estimated using concentrations derived from a comprehensive survey of municipal wastewater dischargers in the Virginia portion of the Chesapeake Bay Basin [13], which are comparable to local available data. Personal interviews with local NRCS (Natural Resource Conservation Service) personnel were used to describe agricultural operation schedules in SWAT. The characteristics and drainage area of small flood control ponds by USDA-NRCS watershed protection program known as PL-566 were also represented in the model.

2.3. Model Calibration and Validation for Nutrients

As stated above, this study is built upon a previously conducted study by Wang et al. [10]. Previous modeling has resulted in calibrated/validated flow and sediment for the study watersheds (Table 2) in the Upper TRB. Because nutrient calibration and validation are continuous efforts of previous modeling work, it is necessary to briefly summarize model results for flow and sediment loadings in each watershed. Nash–Sutcliffe efficiency (NSE) [14] values ranged from 0.50 to 0.95 based on monthly flow comparisons between simulated and observed values for calibration (Figure 4) and from 0.44 to 0.92 for validation, except the validation at station ID 08045850 in Benbrook watershed (0.18). The calibrated SWAT models in large part captured the hydrologic dynamics in the diverse watersheds within the TRB as evidenced by acceptable NSE values except for the Benbrook watershed. The relatively low model performance for Benbrook watershed is due to limited data available to calibrate the SWAT model. Flow data were available at three USGS stream gauge sites at Benbrook (Figure 1). However, all gauges were downstream of significant impoundments on the Clear Fork of the Trinity River. Unfortunately, data from these sites are not representative of the flow from overland areas because streamflow below reservoirs is more a function of reservoir management and releases than inflow from the drainage area and reservoir losses from evaporation, seepage and withdraw made the total water balance more difficult to define [15].
Figure 4. Summary of previous modeling results by Wang et al. [10] for flow. NSE indicates Nash–Sutcliffe Model Efficiency [14].
Water 07 05689 g004
Table 2. Monitored nutrient data for each study watershed in the Upper Trinity River Basin.
ReservoirLocationPeriod# of Data
Joe Pool08049700October 1985–July 2007 (NO3, NO2, Organic N, TN and TP)16–42 days
Lavon08058900April 1993–August 1995 (NO3, NO2 and TN), November 1981–August 1995 (Organic N and TP)30 days 48 days
Lewisville08052700May 1971–July 1997 (mineral P, TP, NO3-NO2, Organic N)15–62 days
08053000January 1981–July 1997 (mineral P, TP, NO3-NO2, Organic N)28–66 days
Ray Roberts08050840December 1992–January 1995 (mineral P, TP, NO3-NO2, Organic N)17 Days
Ray Hubbard08061750November 1981–November 1992 (TP, NO3-NO2, Organic N, TN)64–67 days
Benbrook 1
Bridgeport080428001970–200764 days
Richland Chambers080641001983–2003 (Org N); 1993–2006 (Min N, Min P), 1983–2006 (TP)140–157 days
TRWD 21991–200546 days
Cedar CreekTRWD 21989–2000, 200213–40 days 3
Eagle MountainTRWD 21991–200415–38 days 3
Notes: 1 Insufficient data available for calibration, calibration was conducted at nearby Bridgeport; 2 TRWD (Tarrant Region Water District) monitoring stations; 3 Various sample days in various monitoring sites.
Due to data availability, sediment calibrations were conducted for six watersheds and model performance was represented by percentage errors, which ranged from −10.8% to 5.0%. The Benbrook, Joe Pool, Ray Roberts, and Ray Hubbard watersheds have insufficient or no sediment data available with which to estimate sediment loads for calibration. Therefore, Wang et al. [10] adopted SWAT-derived hydrologic and water quality parameters from the neighboring watersheds SWAT model set-up.
In this study, the previously established model setups in reference [10] were further calibrated/validated for nitrogen and phosphorus using measured nitrogen (Organic N, NO2, NO3, and NH4) and phosphorus (Organic P and Mineral P) for each watershed (Table 2). Overall, there were limited observations for nutrient data and the data availability varied in both monitoring periods and the number of locations. Table 2 contains monitoring sites and the number of days with sampling for nutrients in each watershed. It is noticeable that continuous records of measured data for nutrient loads were not available. Only grab sample data (nutrient concentration) were available from time to time (usually 1 to 10 samples per year, with missing years in between) at several monitoring sites within the study area. For example, the Lavon watershed has only 3 years with sampled data at an average frequency of 10 per year. The Ray Roberts has only 4 years with data and only 17 samples in total. The Bridgeport has 38 years with sampled data, yet the average annual frequency is only about 2. Some additional water-quality data were obtained from Texas Water Development Board (TWDB) (Table 2). The decline/discontinued water-quality monitoring stations caused by funding availability makes it a challenging task to adequately calibrate each watershed for the nutrient components. With this limitation, some watershed models utilized SWAT-adjusted parameter setup from neighboring basins that have similar watershed characteristics. Therefore, efforts to collect more data for adequate validation of the models must continue. Nevertheless, careful considerations were given to the adjustment of parameter values reflecting various aspects of the nutrient processes.
SWAT parameters related to nutrient processes were applied based on expertise and experience obtained from previous studies [4,16,17]. Model parameters involved in both upland and channel nutrient processes were adjusted. For nutrient calibration, percentage error was the preferred metric because available measured loads were generally scarce. Typically, measured loading data are estimated based on grab sample concentrations, along with observed streamflow, by using a load estimator program [18]. Parameters were adjusted one at a time with continual assessment of the percentage error. Due to the data availability, only calibration was conducted in some watersheds and model validation was not conducted. Table 3 lists the parameters and the range of parameter values used for model calibration for eight watersheds except Cedar Creek and Eagle Mountain watershed, which will be described in more detail in the next paragraph.
More detailed model analysis was conducted for Cedar Creek and Eagle Mountain watershed using TRWD monitoring data and a QUAL2E (Enhanced Stream Water Quality Model) [19] reach set up conducted by Espey, Inc., Austin, TX, USA, Using their parameter set up by QUAL2E, SWAT calibration for nutrients was conducted for both watersheds. TRWD monitored nutrients in tributaries for nitrogen and phosphorus at various locations in both watersheds for more than ten years (Table 4). For Cedar Creek watershed, data collection was conducted in major tributaries including Kings, Cedar, Lacy, North Twin, South Twin, Lynn, Clear, Caney and Prairie Creek from 1989 to 2000. For Eagle Mountain, nutrient monitoring data were collected at Ash, Derrett, Dosier, Walnut and West Fork at 4688 from 1991 to 2004. These monitored data were used for model calibration by comparison with the predicted three day rolling average in order to account for daily uncertainty and then compared with calculated Median, 25th percentile and 75th percentile values. Table 4 shows parameter values in the watershed-wide water quality file (.wwq) for both QUAL2E by Espey, Inc. and SWAT calibration.
Table 3. Adjusted nutrient parameter values of SWAT for calibration.
NutrientsParameter (File)DescriptionCalibrated Value
NitrogenRHOQ (.wwq)Algal respiration rate at 20 °C (day−1)0.1–0.33
SDNCO (.bsn)Denitrification threshold water content (fraction of field capacity water content above which denitrification takes place)0.85–1.5
NPERCO (.bsn)Nitrate percolation coefficient0.01–1.0
AI1 (.wwq)Fraction of algal biomass that is nitrogen0.07–0.09
RS4 (.swq)Rate coefficient for organic N settling in the reach at 20 °C (day−1)0.001–2.5
BC2 1 (.swq)Rate constant for biological oxidation of NO2 to NO3 in the reach at 20 °C (day−1)2.0
BC3 (.swq)Rate constant for hydrolysis of organic N to NH4 in the reach at 20 °C (day−1)0.001–1.0
CDNDenitrification exponential rate coefficient0.3
PhosphorousPPERCO (.bsn)Phosphorus percolation coefficient10.0–17.5
PHOSKD (.bsn)Phosphorus soil partitioning coefficient50–350
PSPPhosphorus sorption coefficient8
AI2 (.wwq)Fraction of algal biomass that is phosphorus0.015–0.02
BC4 (.swq)Rate constant for mineralization of organicPto dissolved P in the reach at 20 °C (day−1)0.01–0.7
RS5 (.swq)Organic phosphorus settling rate in the reach at 20 °C (day−1)0.001–2.5
IPETPET method: 0 = Priest-T, 1 = Pen-M, 2 = Harg, 3 = user input1
ISUBWQInstream water quality:1 = model instream water quality0
Nitrogen & phosphorusCMN 2Rate factor for humus mineralization of active organic nutrients (N and P)0.0003
MUMAX 2Maximum specific algal growth rate (day−1)1.0
1 Ray Robert and Richland-Chamber only; 2 Richland-Chamber and Benbrook and Bridgeport only.
Table 4. QUAL2E and SWAT parameter setting for Cedar Creek and Eagle Mountain watershed.
Parameters (.wwq)DescriptionQUAL2E 1Calibrated Value
LAOLight averaging option22
IGROPTAlgal specific growth rate option22
AI0Ratio of chlorophyll-a to algal biomass (µg-chla/mg algae)1010
AI1Fraction of algal biomass that is nitrogen (mg N/mg alg)0.090.09
AI2Fraction of algal biomass that is phosphorus (mg P/mg alg)0.020.02
AI3The rate of oxygen production per unit of algal photosynthesis (mg O2/mg alg)1.61.4–1.5
AI4The rate of oxygen uptake per unit of algal respiration (mg O2/mg alg)2.32.0–2.3
AI5The rate of oxygen uptake per unit of NH3-N oxidation (mg O2/mg NH3-N)3.53.0–3.5
AI6The rate of oxygen uptake per unit of NO2-N oxidation (mg O2/mg NO2-N)1.01.0
MUMAXMaximum specific algal growth rate at 20 °C (day−1)1.81.0–2.0
RHOQAlgal respiration rate at 20 °C (day−1)0.10.3
TFACTFraction of solar radiation computed in the temperature heat balance that is photosynthetically active0.30.3–0.44
K_LHalf-saturation coefficient for light (kJ/(m2·min))0.4180.418
K_NMichaelis–Menton half-saturation constant for nitrogen (mg N/L)0.40.4
K_PMichaelis–Menton half-saturation constant for phosphorus (mg P/L)0.040.04
LAMBDA0Non-algal portion of the light extinction coefficient (m−1)1.51.5
LAMBDA1Linear algal self-shading coefficient (m−1·(µg chla/L)−1))0.0020.002
LAMBDA2Nonlinear algal self-shading coefficient (m−1·(µg chla/L)−2)0.0540.054
P_NAlgal preference factor for ammonia0.10.1
1 QUAL2E parameter setting was conducted by Espey, Inc and used for starting point of calibration for Cedar Creek and Eagle Mountain watershed.

2.4. Scenarios

After model calibration and validation, the baseline SWAT model is used to simulate point source elimination and urbanization scenarios to evaluate their probable effects on nutrient loads received by the region’s water supply reservoirs. Wastewater treatment is expected to improve in the future. To simulate the maximum impacts of improved wastewater management on the major reservoir nutrient loading, all point-source discharges were eliminated from each baseline model. This scenario did not consider that the bioavailability of nutrients in point-source effluent may be much greater than that of other sources, particularly eroded materials. Therefore, it may underestimate the impact of point source reductions on reservoir water quality.
A great portion of the Upper TRB is expected to be urbanized by 2030 per NCTCOG’s estimations (Figure 3). Seto et al. [20] reported that the rate of urban land expansion is similar or more than that of population increase, indicating that urbanization due to population increase sacrifices other landuses such as forest, farmland, rangeland, and so on. Therefore, for the urban increase scenario, an assumption was made to simplify the model, that is, the increased population was represented in the model by increasing the urban area within each corresponding sub-watershed for each watershed. For example, a 10% population increase was represented as a total 10% increase of urban landuse in a sub-watershed, while the rest of the landuse was decreased proportionally to offset the 10% area in the sub-watershed. Sub-watersheds that have no information for population increase due to limited information were assumed to have no increase in population. Increases in urban land area in 2030 were taken uniformly from all non-urban categories in each subbasin to preserve the total subbasin area, and the percentages of land in all urban categories (low, medium and high density) remained the same. In other words, no attempt was made to reallocate the current distribution among these urban categories. The baseline model was then executed with the new land use data to simulate the effects of increased urbanization on nutrient loads to water supply reservoirs.

3. Results and Discussion

The results for nutrient calibration and validation are summarized in Table 5. Based on days with available measured nutrient data, the average daily TN ranged from 94.0 kg/day (Joe Pool) to 29,864 kg/day (Bridgeport) while simulated corresponding values ranged from 85.0 (Joe Pool) to 32,352 kg/day (Bridgeport) with prediction error ranging from −16.3% (Ray Hubbard) to 8.9% (Lewisville, 08053000). Observed average daily TP from days with available data ranged from 7.0 kg/day (Joe Pool) to 38,159 kg/day (Bridgeport), while the corresponding modeled TP ranged from 7.3 kg/day (Joe Pool) to 36,001 kg/day (Bridgeport) with prediction error ranging from −23.6% (Ray Roberts) to 80.6% (Richland-Chambers). The model prediction errors are mostly within a difference of 10%, with some large under or over estimations including Lewisville, Ray Roberts, and Richland-Chambers.
Table 5. Model results for nutrients in watersheds in the Upper Trinity River Basin.
Gauge Station IDCalibration/ValidationPeriodTN (kg/day)Error (%)TP (kg/Day)Error (%)
ObservedModeledObservedModeled
Joe Pool
0849700Calibration1985–1992/394.085.0−9.57.07.35.4
Validation1992/5–2007106.7110.03.013.815.210.2
Lavon
08058900Calibration1981–1995621.5640.33.0139.7131.9−5.6
Lewisville
08052700Calibration1971–19972039.11940.94.8225.5227.81.1
08053000Calibration1981–19894190.23819.28.9216.1237.49.9
Validation1990–19972091.12084.40.3261.2217.8−16.6
Ray Roberts
08050840Calibration1992–19953199.33220.50.71453.61,110.4−23.6
Ray Hubbard
08061750Validation1981–19924010.83355.8−16.3817.2763.2−6.6
Bridgeport
08042800 1Calibration1970–200729,864.032,352.08.338,159.036,001.0−5.7
Richland-Chambers
08064100Calibration1984–19955129.34991.0−2.7443.0800.080.6
Benbrook 2
Cedar Creek 3
Eagle Mountain 3
1 Nitrate-Nitrogen only for TN; 2 Insufficient data available for calibration/validation. We adopted SWAT-derived hydrologic and water quality parameters from the neighboring Bridgeport Basin SWAT model set-up; 3 Nutrient data at multiple major tributaries from the Tarrant Region Water District (TRWD) monitoring stations were compared with simulated results, which were presented in below.
Model results for Cedar Creek and Eagle Mountain watershed were presented in a different way as nutrient data at multiple major tributaries at the two watersheds from the Tarrant Region Water District (TRWD) monitoring stations were compared. Narasimhan et al. [6] illustrated the result of model performance for TN and TP at 10 monitoring sites in the Cedar Creek watershed. Their study showed data comparison between observed and modeled from 1989 to 2002 and found out statistically significant correlation (r2) of 0.7 and 0.8 for TN and TP, respectively. We compared water quality data collected by TRWD (1989–2002) in each major tributary (Kings, Cedar, Lacy, North Twin, South Twin, Lynn, Clear, Caney and Prairie) for TN and TP in the Cedar Creek watershed. The percent errors ranged from −26% to 28%, except for TN at the Lynn site (43% error) where only five samples were available (see reference [6] for more detail).
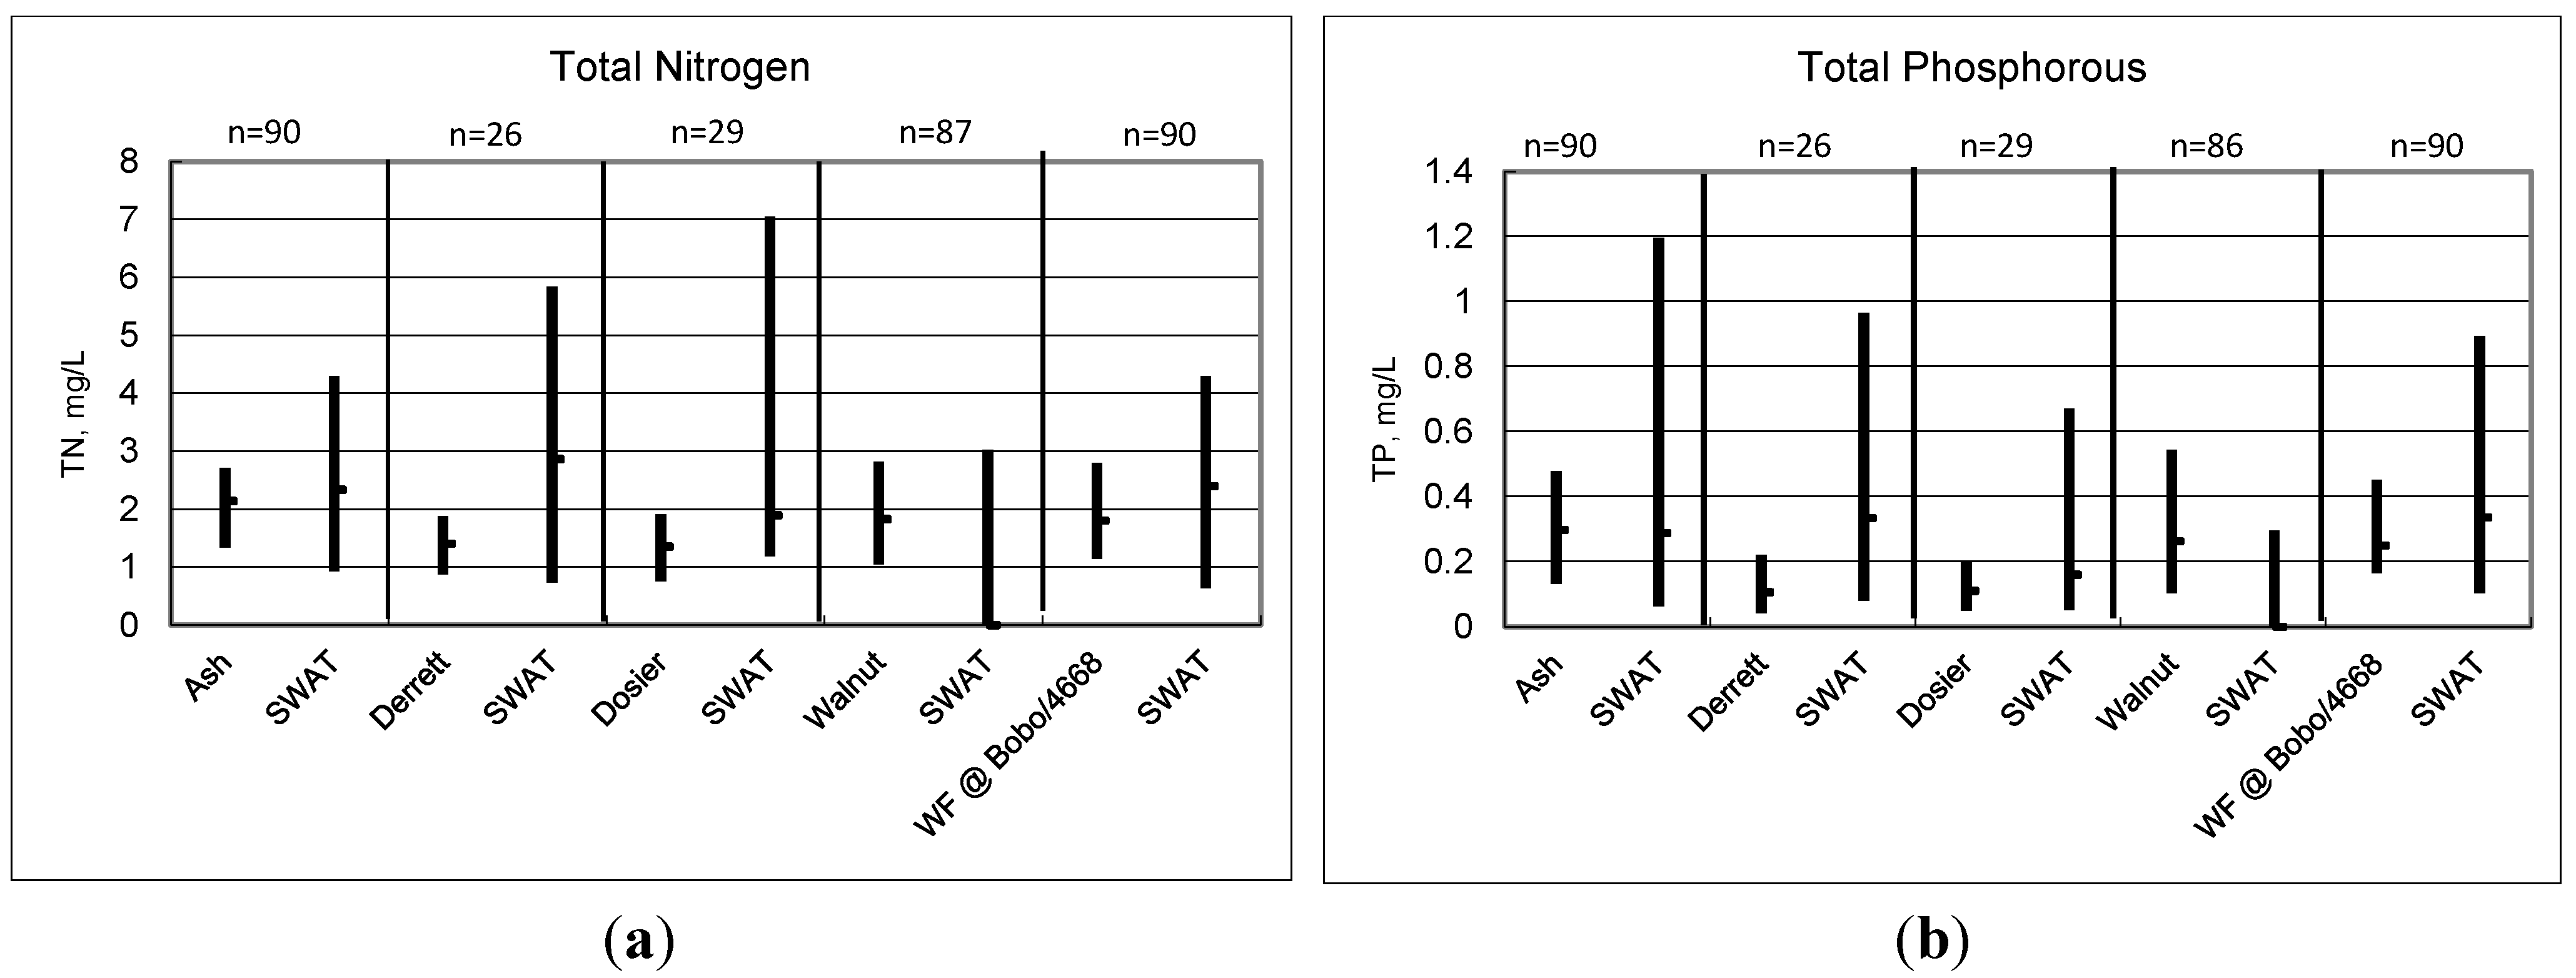
Figure 5 shows model performance for TN and TP in Eagle Mountain watershed by median, 25th and 75th percentile for observation and estimation in each major tributary (Ash, Derrett, Dosier, Walnut and West Fork 4688). Some sites showed disagreement between observed and measured data such as Derrett with percent error of 104% for TN and 217% for TP and Walnut (−90% error for TN and TP). The remaining three sites, including the West Fork 4688 site located at the end of the main channel before the lake entrance, agreed relatively well with percent errors ranging from −3% to 41%.
Figure 5. Median, 25th and 75th percentile of measured and predicted TN (a) and TP (b) at monitoring sites throughout the Eagle Mountain. Measured data were provided by Tarrant Region Water District (TRWD) from the 1991 to 2004 tributary study. The first bar in each column indicates measured data and the second bar indicates the SWAT estimation. The “n” indicates the number of samples.
Water 07 05689 g005
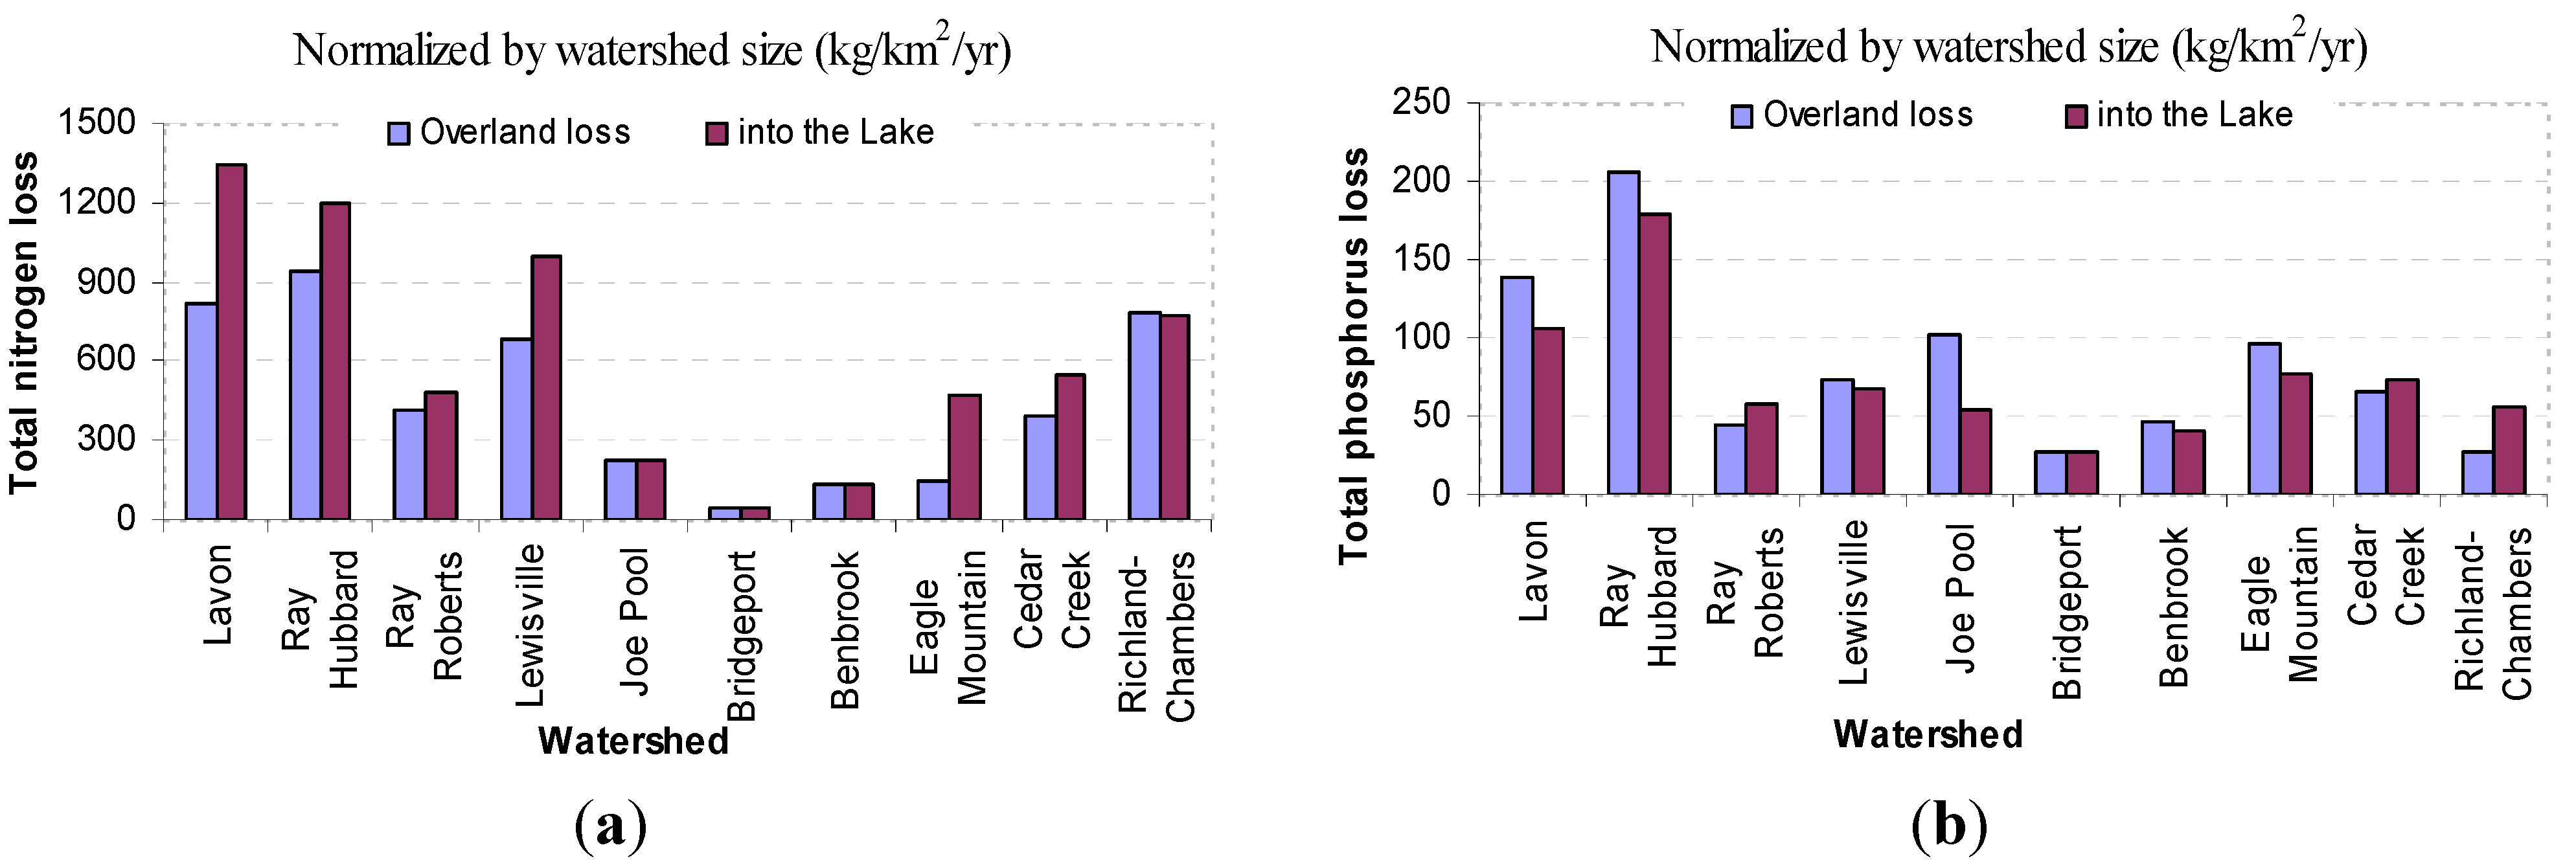
The calibrated SWAT model was used to predict nutrient losses from upland and nutrient loads into reservoirs. The ten study watersheds ranged in size from 580 km2 (Joe Pool) to 5157 km2 (Richland-Chambers). Nutrient losses and loads into reservoirs by watershed size are illustrated in Figure 6. The study watersheds vary widely in their simulated nutrient loss and transport, reflecting the variability among watersheds. For example, annual overland TN rates ranged from 42 kg/km2 for Bridgeport to 936 kg/km2 for Ray Hubbard. Annual TP rates ranged from 26 kg/km2 for Bridgeport to 206 kg/km2 for Ray Hubbard (Figure 6). Normalized nutrient loads into the receiving reservoirs by watershed size indicated that the Lavon and Ray Hubbard watersheds discharge the highest TN rates (1340 and 1200 kg/km2) to the lakes and those watersheds again discharges extremely large TP (106 and 179 kg/km2) compared to the other watersheds. The remaining watersheds had discharge rates ranging from 40 to 1000 kg/km2 for TN and from 26 to 67 kg/km2 for TP (Figure 6).
Figure 6. SWAT simulated nutrient loads by area for each watershed in the Upper Trinity River Basin. (a): Total nitrogen; (b): Total phosphorus.
Water 07 05689 g006
Half of the Ray Hubbard watershed is developed, and WWTPs serving urban areas within the watershed appear to contribute a large portion of the nutrient loads reaching the lake. According to scenario analysis, the elimination of these WWTPs reduced reservoir loading of TN by 20% and TP by 8% (Table 6). Point sources appear to contribute substantially to Lake Lavon’s nutrient loads as evidenced by the point source elimination scenario, which reduces TN loads by 56% and TP loads by 24% (Table 6). Lewisville and Benbrook also see great nutrient loads reduction with the point source elimination scenario, which reduce TN by 27% and 23%, TP by 14% and 9%, respectively, for the two watersheds (Table 6).
The impacts of projected population growth in the Upper TRB on nutrient loads also varied among watersheds. Increased urbanization caused changes in overland TN losses ranging from a decrease of 3% (Ray Hubbard) to an increase of 24% (Benbrook). Projected urbanization increased TP losses from upland areas by 3% (Ray Hubbard) to 111% (Benbrook), except for Richland-Chambers where total phosphorus losses decreased by 1% (Table 7). This decrease was due to the fact that pastureland and cropland dominate the Richland-Chambers watershed and are large contributors to nutrient loading. Therefore, nutrient loads in this watershed decreased with urbanization due to proportional decreases in pastureland and cropland. Most of the Benbrook watershed is in Parker and Johnson counties. The two counties are expected to have 284% and 257% population increase from 2000 to 2030, respectively [
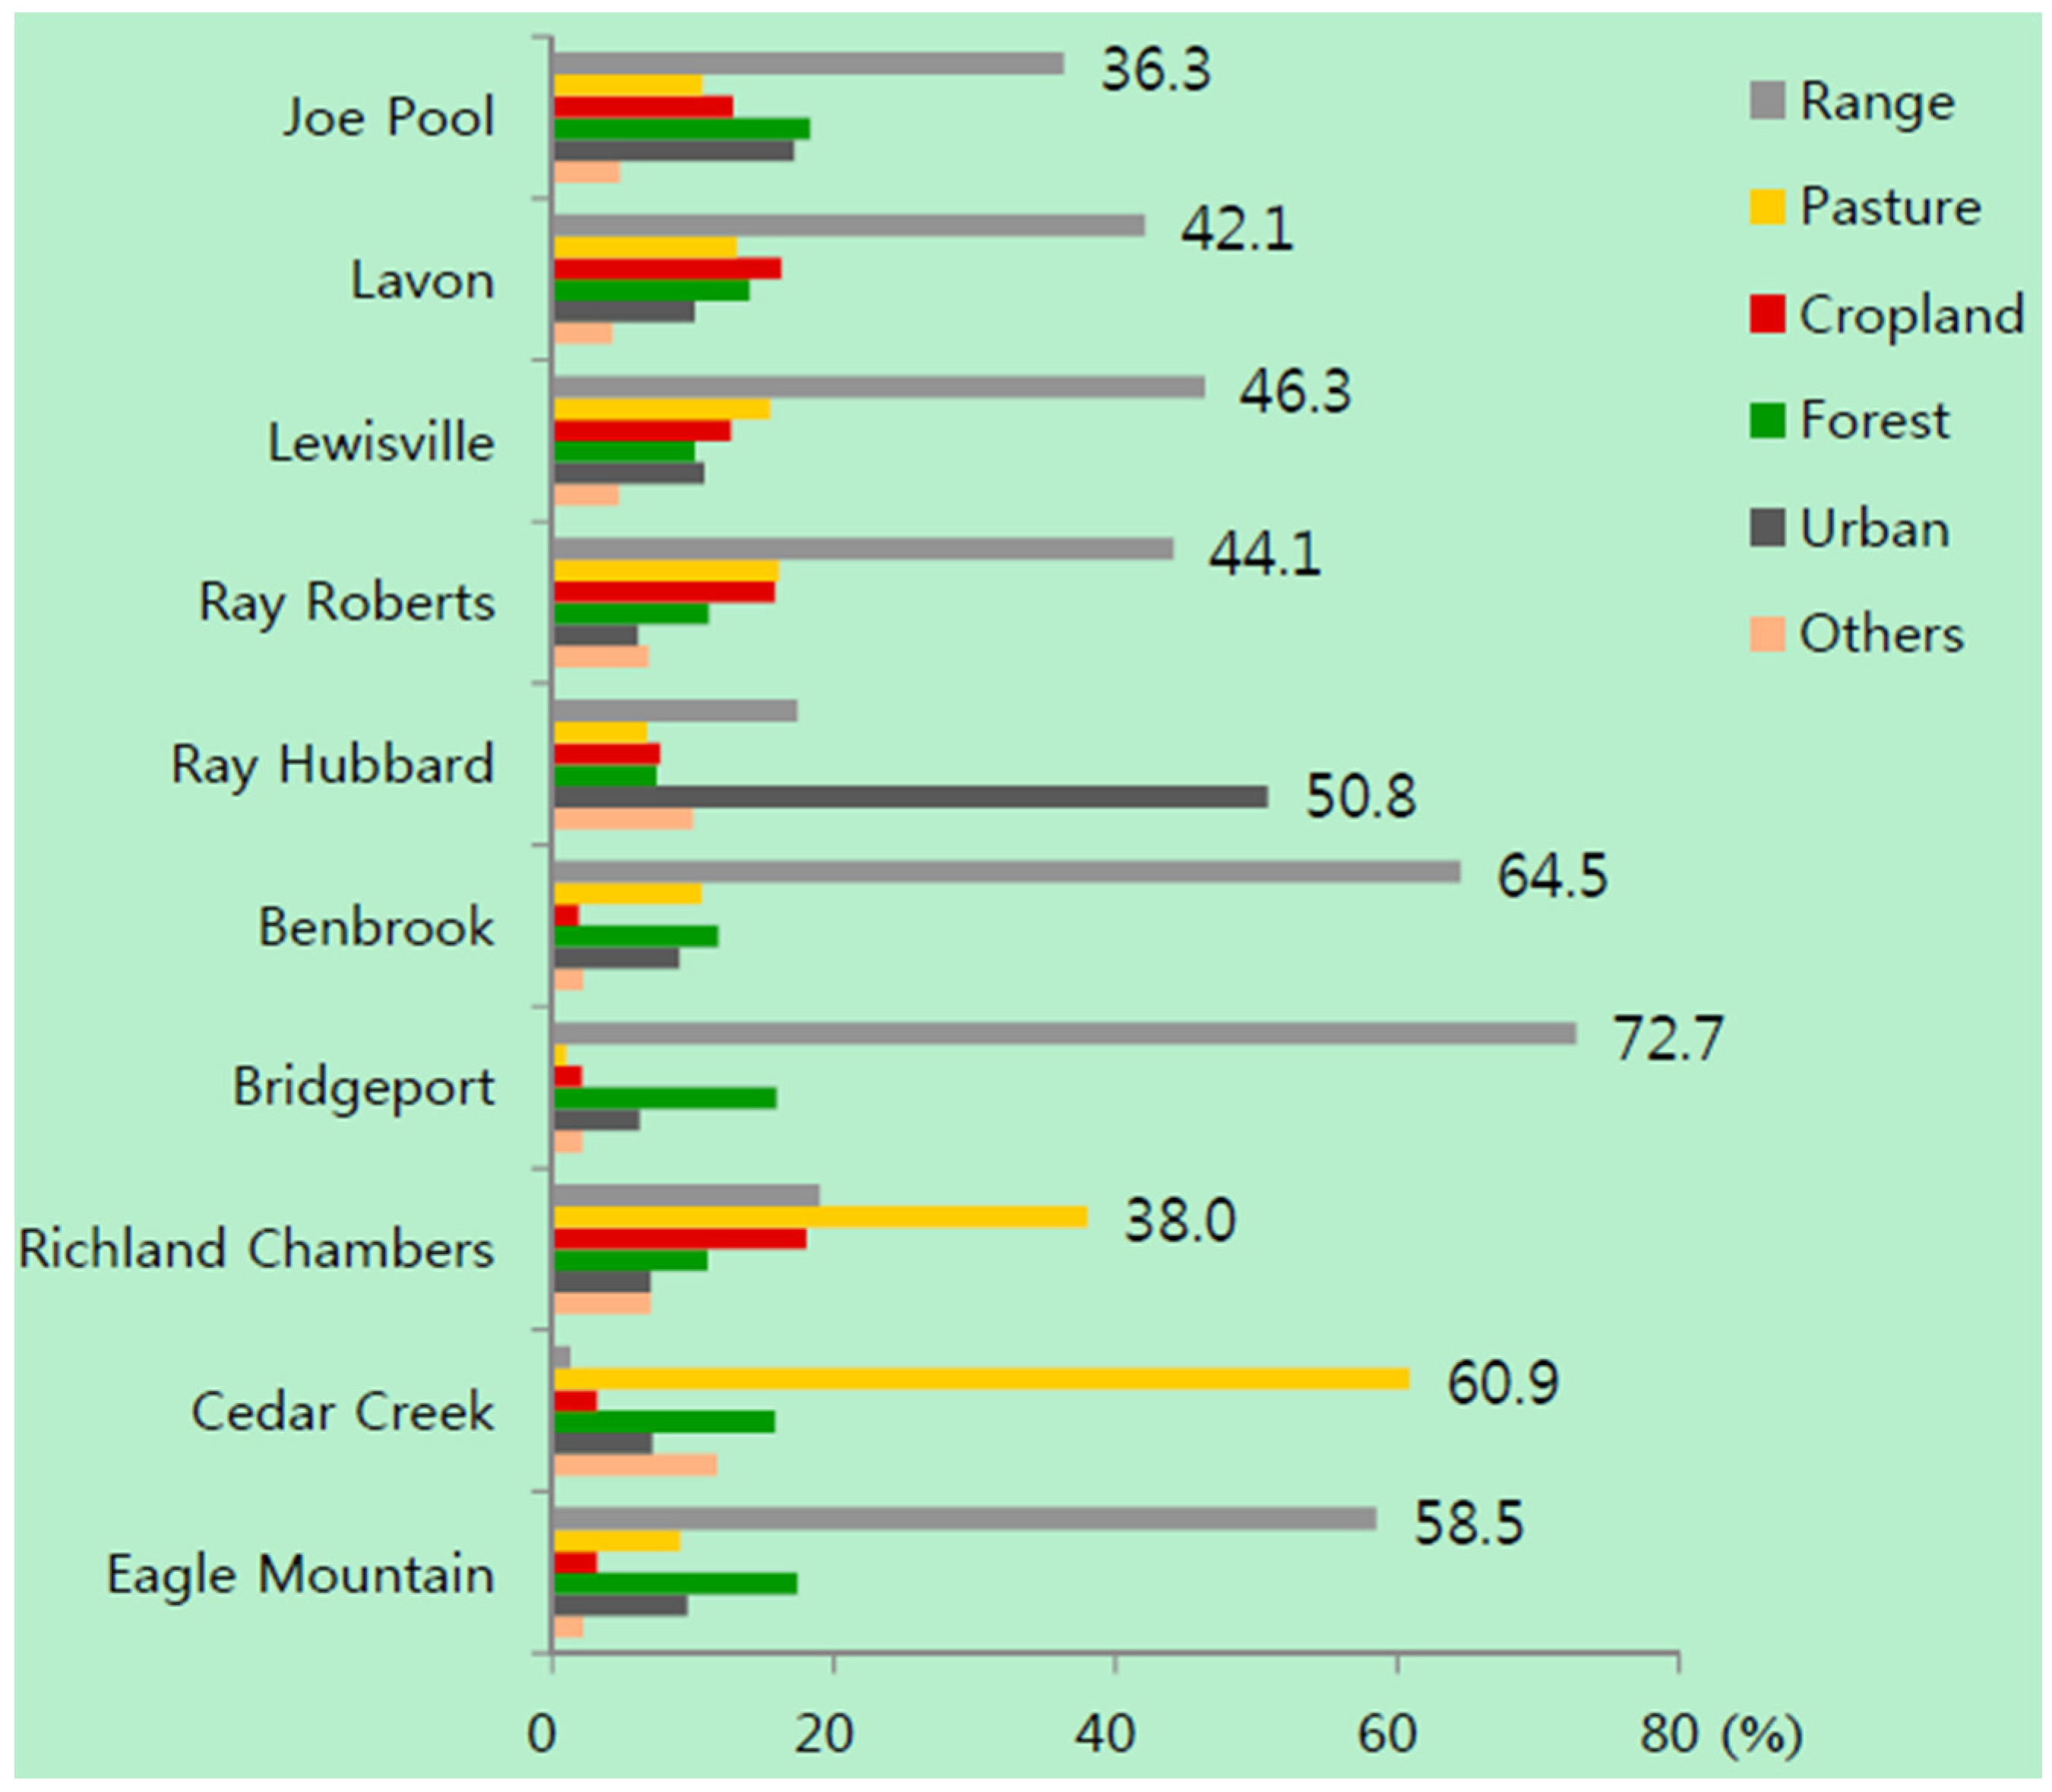
2]. Urban area in Benbrook was projected to expand from 9% based on 2001 NLCD (Figure 2) to 26% of the total watershed area based on the relationship between the fraction of counties that is urban and population density established in reference [15]. This resulted in 288 km2 total urban area in 2030 from the 2001’s 99 km2, a total increase of 191% in urban area (Table 7). The model predicted the greatest change in nutrient loads, with TN increasing 23% and TP increasing 111%.
Table 6. Simulated baseline annual nutrient loads into each lake and percent reduction with point source elimination scenario.
Watershed Area (km2)Modeling PeriodTN (kg/Year)Point Source Elimination (%)TP (kg/Year)Point Source Elimination (%)
Joe Pool5801986–2007129,885−7.331,339−1.0
Lavon19931968–20072,671,500−55.7210,750−24.2
Lewisville25201968–20072,518,920−27.2168,080−14.4
Ray Roberts17901987–2007646,060−5.9103,590−6.0
Ray Hubbard9071968–20071,088,650−20.4162,480−7.8
Benbrook11001970–2005145,000−23.444,500−9.3
Bridgeport28491970–2007113,000−13.074,000−2.9
Richland Chambers51571977–20064,011,580−4.0285,104−0.3
Cedar Creek26001966–20021,419,380−3.8188,670−6.0
Eagle Mountain22301971–20041,057,437−1.1173,383−1.2
Table 7. Increase of TN and TP by estimated population growth by 2030.
WatershedUrban Area Increase (%)Increase of TN (%)Increase of TP (%)
Joe Pool17.016.437.4
Lavon9.09.214.4
Lewisville8.02.923.5
Ray Roberts5.04.716.6
Ray Hubbard2.0−2.63.2
Benbrook190.923.6111.0
Bridgeport59.010.330.7
Richland Chambers1.2−2.6−1.1
Cedar Creek3.47.16.3
Eagle Mountain8.516.93.3
Note: Load changes from overland flow only.
The limitation of the urbanization scenario is that the percentage of the urban increase is represented in the model only by sub-watershed, which means the same rate of urban increase was applied to the entire sub-watershed with no particular spatial location within the sub-watershed. Continuous records of measured data for nutrient loads are not available; data are also not up-to-date. The discontinued water-quality monitoring stations pose a challenging task for watershed evaluation.

4. Conclusions

The water quality in numerous reservoirs has been a concern in the Upper TRB including Dallas-Fort Worth Metro area. These 12 reservoirs in ten watersheds are sources of water supply for the area and increased population growth and heavy urbanization are expected in the future. Water quality trends, based on two decades of monitoring, in reservoirs is degrading and a continuation of water quality monitoring and comprehensive modeling was necessary.
Available datasets including GIS data, agricultural operations, WWTPs, USGS gage stations, sediment loadings, and monitored nutrient data were used to calibrate the SWAT model for local conditions and to estimate water quality. The model overviews the current condition in each watershed with an acceptable to good range of statistical model performance evaluation although some of watersheds showed large model errors (TP for Richland-Chambers at 80.6% error). The model prediction errors are mostly acceptable at this large scale, except for two out of five tributaries at the Eagle Mountain watershed and TP in Richland-Chambers.
Normalization for nutrient loadings by watershed area showed that some watersheds such as Lavon and Ray Hubbard generated an extremely high level of nutrients. It should be emphasized that future watershed management needs to focus on those watersheds. Barring potential management changes, such as wastewater treatment, improved crop use efficiency, etc., the urbanization scenario increased TN loads in each watershed ranged from −3% to 24% and increased TP loads ranged from −1% to 111%.
This study provides an overall estimate of the magnitude and spatial distribution of pollutants generated by overland flow as well as the amount actually delivered to the major reservoirs within the TRB. Although the SWAT model has been successfully applied in ungauged basins, thorough model calibration and validation increases the confidence in its applicability. Insufficient data, especially related to point sources and observed data on nutrients makes model calibration and validation a challenging task. Nevertheless, modeling studies using a comprehensive semi-distributed model such as SWAT do help simulate and assess the pollutant generation and transport potential of the landscape.

Acknowledgments

USDA is an equal opportunity employer and provider.

Author Contributions

All authors worked on modeling the watersheds and provided model results. Taesoo Lee and Xiuying Wang wrote manuscript, and Darrel Andrews provided some datasets.

Conflicts of Interest

The authors declare no conflict of interest.

References

  1. Berthold, T.A. North Central Texas Water Quality Final Report. TR-409; Texas Water Resources Institute: College Station, TX, USA, 2011. [Google Scholar]
  2. NCTCOG. North Central Texas 2030 Demographic Forcast; North Central Texas Council of Governments Research and Information Service: Dallas, TX, USA, 2003. [Google Scholar]
  3. Arnold, J.G.; Srinivasan, R.; Muttiah, R.S.; Williams, J.R. Large Area Hydrologic Modeling and Assessment, Part 1: Model Development. J. Am. Water Resour. Assoc. 1998, 34, 73–89. [Google Scholar] [CrossRef]
  4. Santhi, C.; Srinivasan, R.; Arnold, J.G.; Williams, J.R. A modeling approach to evaluate the impacts of water quality management plans implemented in a watershed in Texas. Environ. Model. Softw. 2006, 21, 1141–1157. [Google Scholar] [CrossRef]
  5. Srinivasan, R.; Ramanarayanan, T.S.; Arnold, J.G.; Bednarz, S.T. Large area hydrologic model and assessment Part II: Model application. J. Am. Water Resour. Assoc. 2007, 34, 91–101. [Google Scholar] [CrossRef]
  6. Narasimhan, B.; Srinivasan, R.; Bednarz, S.T.; Ernst, M.R.; Allen, P.M. A comprehensive modeling approach for reservoir water quality assessment and management due to point and nonpoint source pollution. Trans. Am. Soc. Agric. Biol. Eng. 2010, 53, 1605–1617. [Google Scholar] [CrossRef]
  7. TNRCC. Texas Nonpoint Source Pollution Assessment Report and Management Program; Report No. SFR-68/99; Texas Natural Resources Conservation Commission: Austin, TX, USA, 1999. [Google Scholar]
  8. Debele, B.; Srinivasan, R.; Parlange, J.Y. Hourly analyses of hydrological and water quality simulations using the ESWAT model. Water Resour. Manag. 2009, 23, 303–324. [Google Scholar] [CrossRef]
  9. Lee, T.; Narasimhan, B.; Srinivasan, R. Eagle Mountain Watershed: Calibration, Validation, and Best Management; Texas Water Resources Institute Technical Report No. 408 Texas A & M University System: College Station, TX, USA, 2011. [Google Scholar]
  10. Wang, X.; White, M.J.; Tuppad, P.; Lee, T.; Srinivasan, R.; Zhai, T.; Andrews, D.; Narasimhan, B. Simulating Sediment Loading into the Major Reservoirs in Trinity River Basin. J. Soil Water Conserv. 2013, 68, 372–383. [Google Scholar] [CrossRef]
  11. Gassman, P.W.; Reyes, M.; Green, C.H.; Arnold, J.G. The Soil and Water Assessment Tool: Historical development, applications, and future directions. Trans. Am. Soc. Agric. Eng. 2007, 50, 1211–1250. [Google Scholar] [CrossRef]
  12. Arnold, J.G.; Moriasi, D.N.; Gassman, P.W.; Abbaspour, K.C.; White, M.J.; Srinivasan, R.; Santhi, C.; Harmel, R.D.; Griensven, A.; van Liew, M.W.; et al. SWAT: Model use, calibration and validation. Trans. Am. Soc. Agric. Biol. Eng. 2012, 55, 1491–1508. [Google Scholar]
  13. Wiedeman, A.; Cosgrove, A. Chesapeake Bay Watershed Model Application and Calculation of Nutrient and Sediment Loads; Chesapeake Bay Program Nutrient Subcommittee: Annapolis, MD, USA, 1998. [Google Scholar]
  14. Nash, J.E.; Sutcliffe, J.V. River flow forecasting through conceptual models. Part 1: A discussion of principles. J. Hydrol. 1970, 10, 282–290. [Google Scholar] [CrossRef]
  15. Wang, X.; White, M.J.; Lee, T.; Tuppad, P.; Srinivasan, R.; Jones, A.; Narasimhan, B. Trinity River Basin Environmental Restoration Initiative 2010; Tarrant Regional Water District: Fort Worth, TX, USA, 2011. [Google Scholar]
  16. Neitsch, S.L.; Arnold, J.G.; Kiniry, J.R.; Srinivasan, R.; Williams, J.R. Soil and Water Assessment Tool, User Manual, Version 2000; Grassland, Soil and Water Research Laboratory: Temple, TX, USA, 2002. [Google Scholar]
  17. White, K.L.; Chaubey, I. Sensitivity analysis, calibration, and validations for a multisite and multivariable SWAT model. J. Am. Water Resour. Assoc. 2005, 41, 1077–1089. [Google Scholar] [CrossRef]
  18. Runkel, R.L.; Crawford, C.G.; Cohn, T.A. Load Estimator (Loadest): A Fortran Program for Estimating Constituent Loads in Streams and Rivers; US Geological Survey: Denver, CO, USA, 2004.
  19. Brown, L.C.; Barnwell, T.O. The Enhanced Water Quality Models QUAL2E and QUAL2E-UNCAS: Documentation and User Manual; EPA/600/3-87/007; USEPA: Athens, Greece, 1987.
  20. Seto, K.C.; Fragkias, M.; Gueneralp, B.; Reilly, M.K. A meta-analysis of global urban land expansion. PLoS ONE 2011, 6, e23777. [Google Scholar] [CrossRef] [PubMed]

