1. Introduction
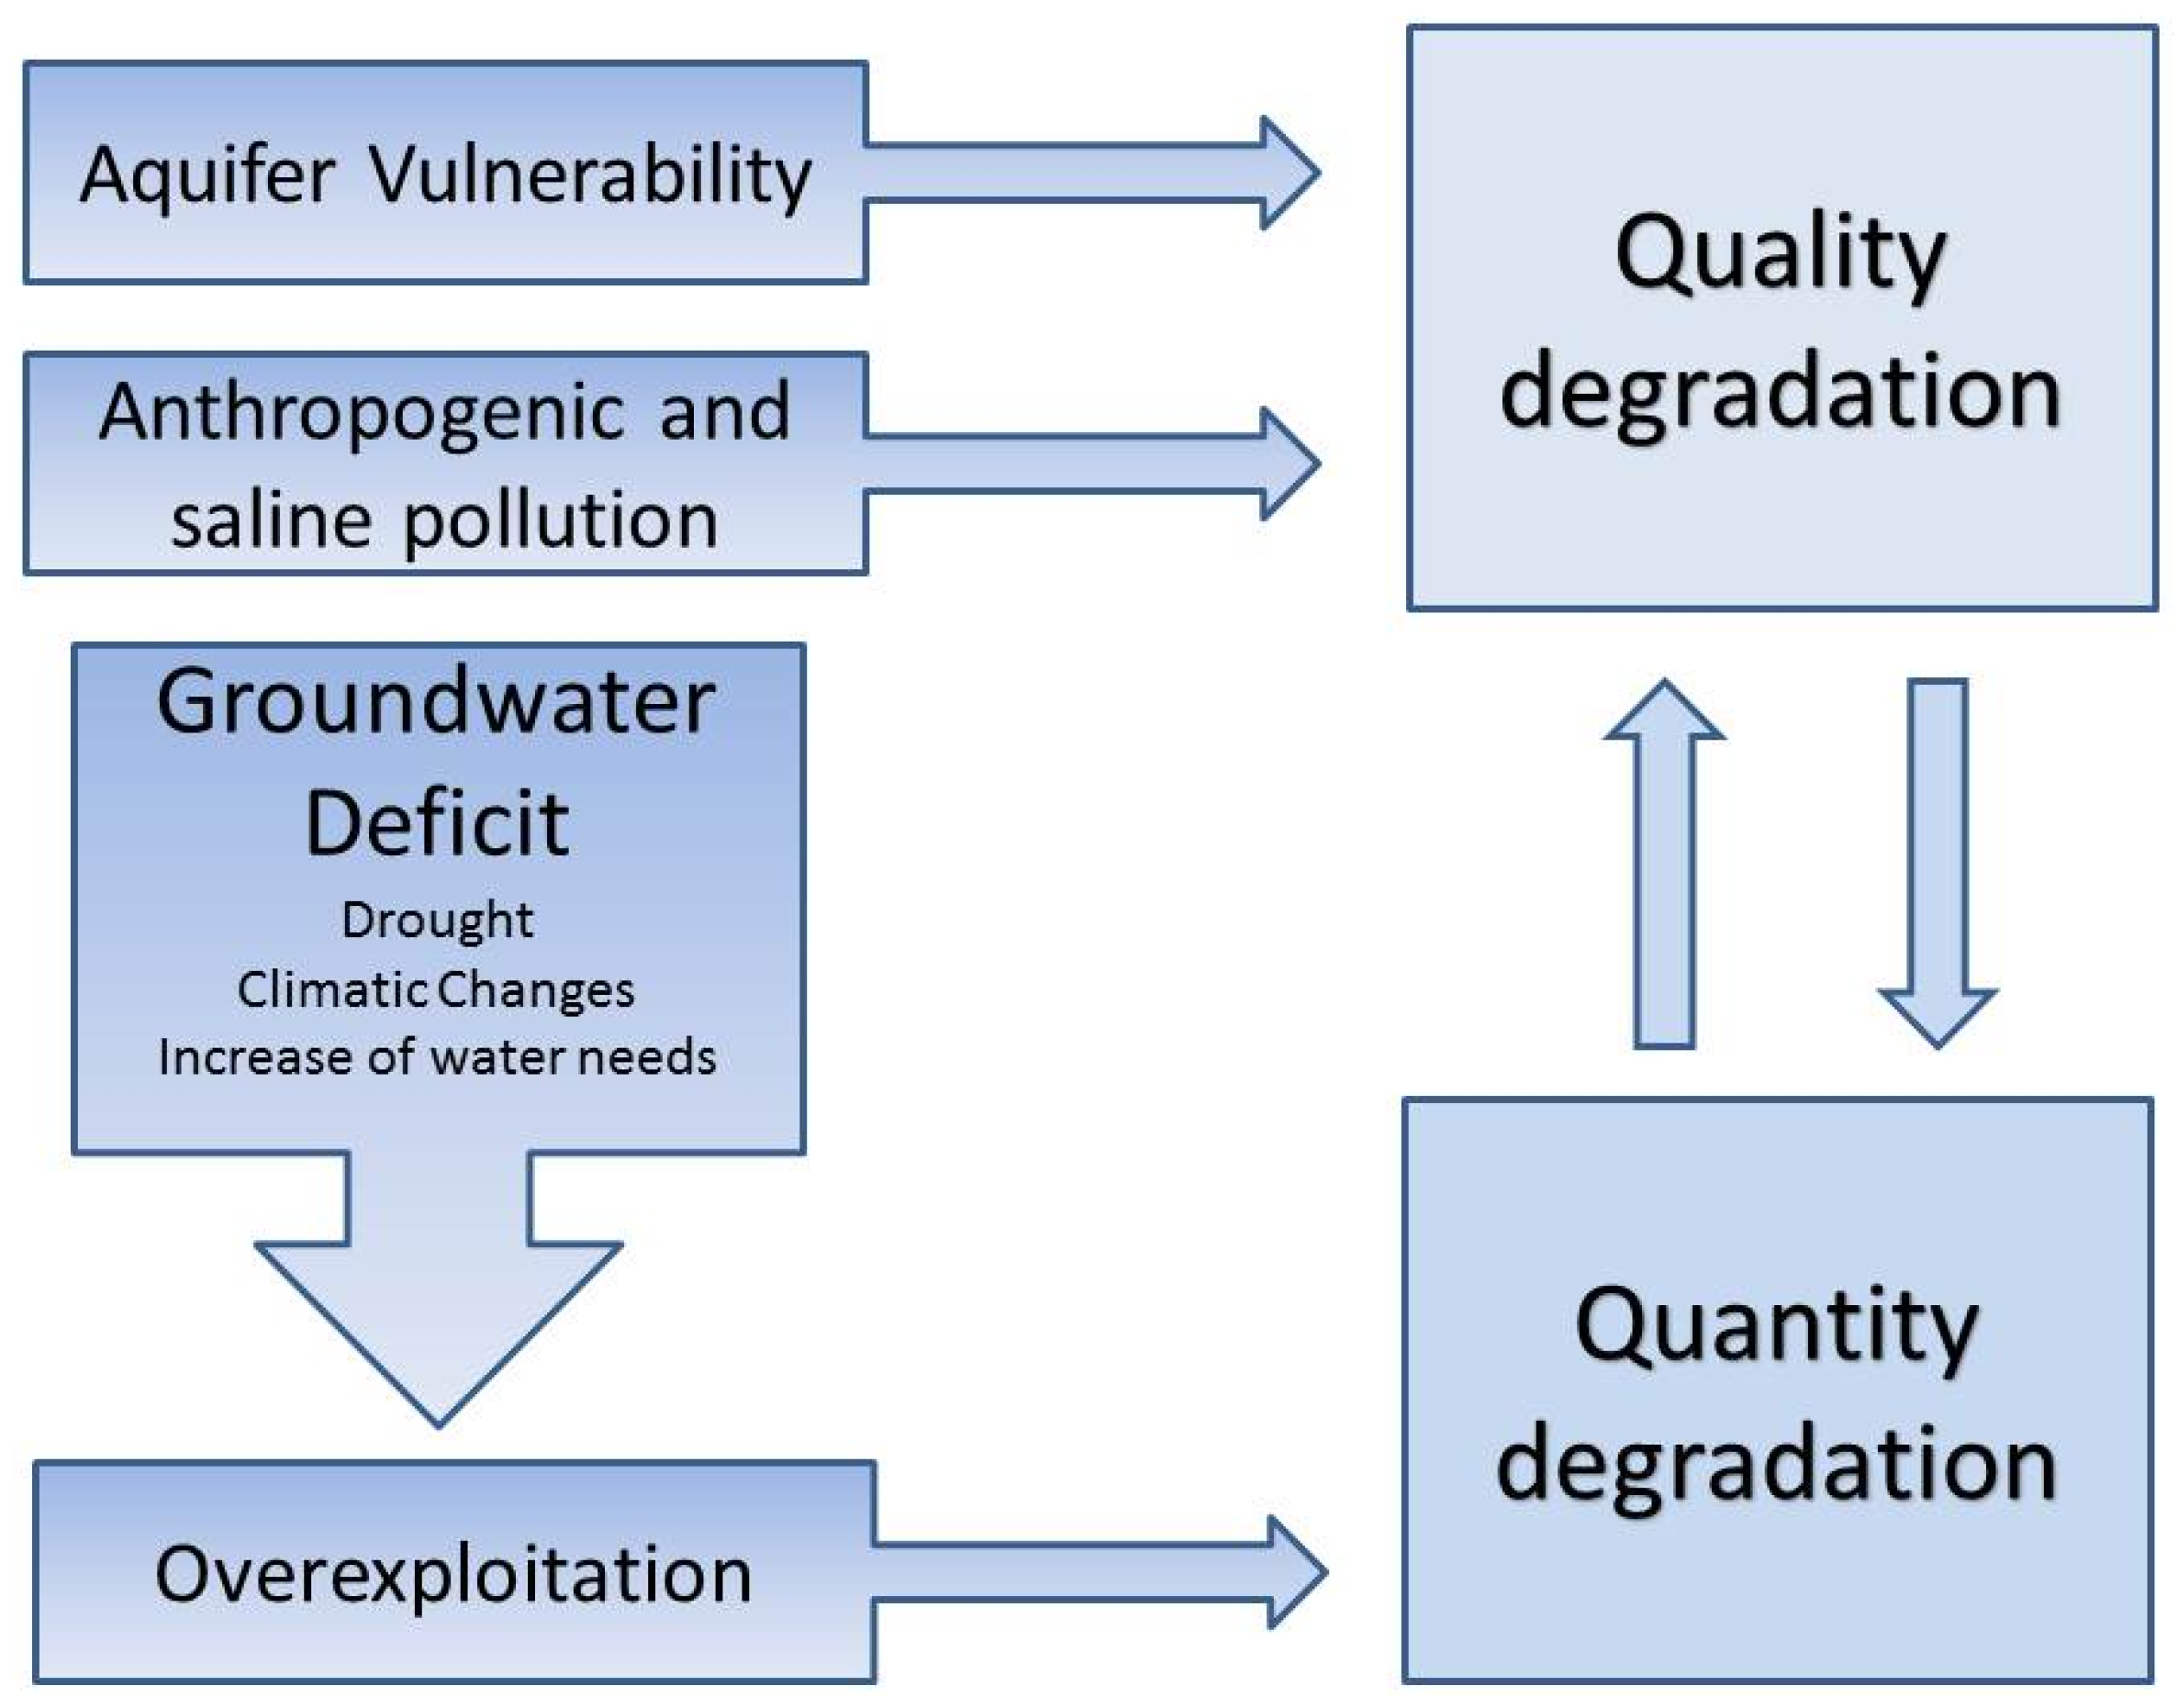
In focusing on high-quality groundwater resources, which are larger than superficial water resources but less renewable, the main risks of degradation can be categorized into two types (
Figure 1).
The first type, quality degradation, is partly caused by intrinsic aquifer characteristics, which determine the aquifer vulnerability, and also by the existence of pollution sources due to anthropization as well as sources of salinization, which, though natural, can lead to the phenomenon of seawater intrusion [
1]. Quality degradation causes the reduction of high-quality groundwater. The primary effect of aquifer overexploitation,
i.e., the piezometric lowering, which is mainly due to increasing water demand, droughts, and/or climate change, is amplified in coastal aquifers in terms of quality degradation due to seawater intrusion and consequent salinization, bringing together quality and quantity degradation. As a result of seawater intrusion, wells could be abandoned and/or large volumes of fresh groundwater could be salinized to the point that it becomes dangerous for a number of uses, causing reduction of both groundwater quality and availability [
2].
Karstic rock outcrops cover approximately 12% of the world’s surface. Karstic aquifers are highly vulnerable to contamination and anthropogenic modifications [
3].
Karstic aquifers are a key global source of water resources; approximately 20%–25% of the global population depends on karstic aquifer groundwater [
4]. In addition, 29% of European groundwater is obtained from karst aquifers; the majority of these aquifers are coastal aquifers [
5,
6].
Groundwater discharge increased over the second half of the 20th century; as a consequence, a great number of aquifers are currently overexploited. This overuse is concentrated in coastal areas, where increasing population, growth of urban areas, and increases of irrigation and industrial demands and tourism are occurring [
1,
6,
7,
8].
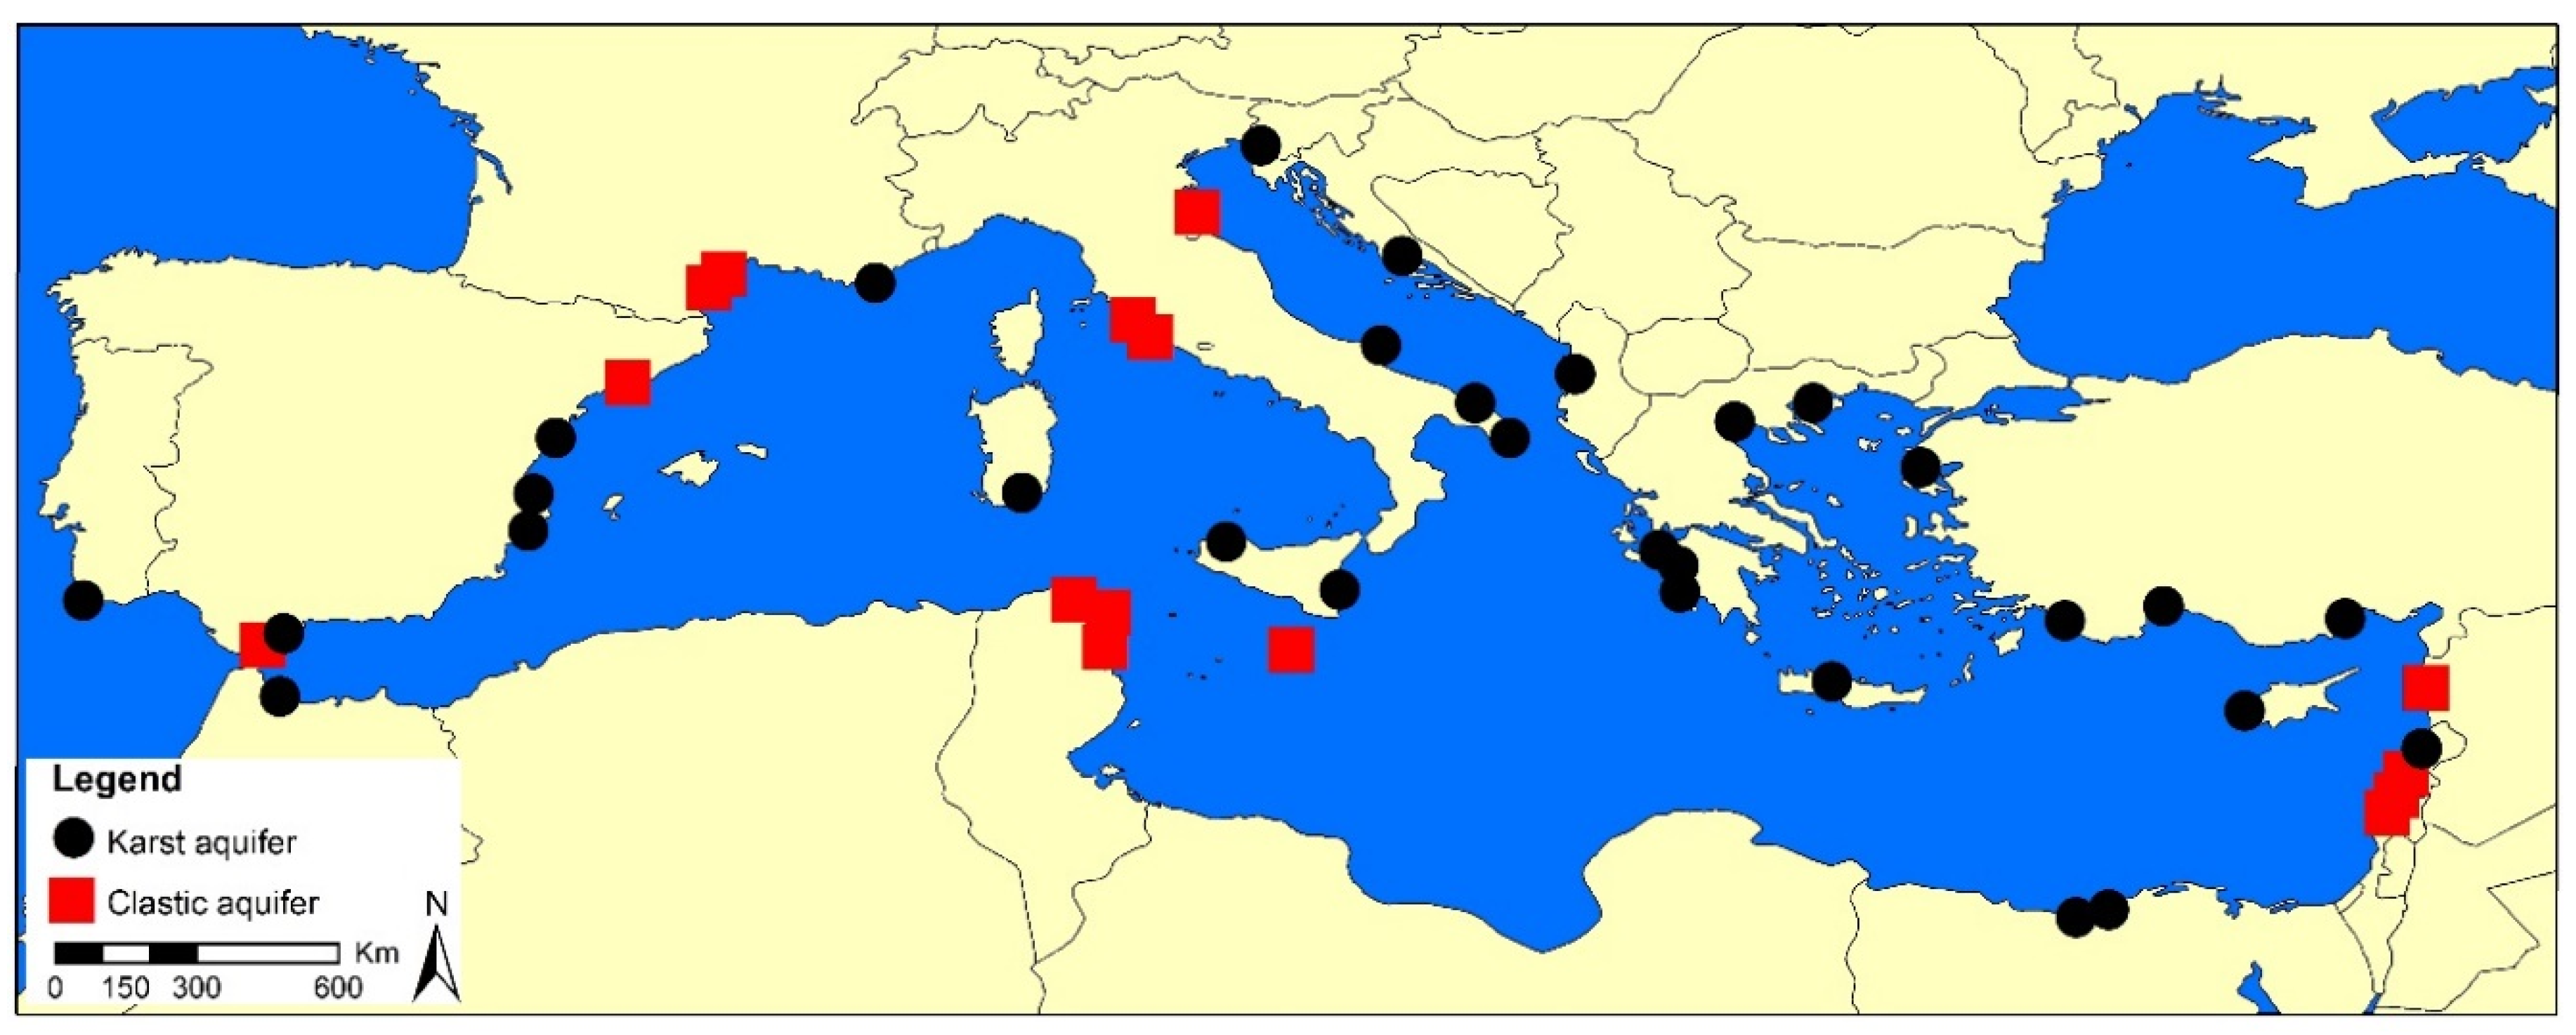
Most of the coastal aquifers of Mediterranean countries, such as Spain, France, Portugal, Slovenia, Croatia, Greece, Albania, Turkey, Cyprus, Egypt, Morocco, Tunisia, Syria, Israel, and Italy, are at risk of overexploitation and seawater intrusion (
Figure 2).
In addition to water demand problems, any modification of the quality and quantity of coastal karstic groundwater outflow can severely affect the hydrological and ecological equilibrium of a coastal water body, including highly vulnerable wetlands [
9,
10].
In previous decades, climate variations and droughts in the Mediterranean contributed to the increasing overexploitation trend, with negative consequences in terms of seawater intrusion [
6,
7,
11,
12,
13,
14]. These trends were also observed in Italy, where seawater intrusion is the main cause of groundwater quality degradation in coastal karst aquifers, the largest of which are located in the Apulian region [
15] (
Figure 3). Climate change, particularly with regard to changes in temperature, precipitation, sea level, and sea water salinity, is a key factor for future decades, potentially worsening the risks of groundwater degradation, as in the case of coastal Mediterranean aquifers [
16,
17].
In Apulia, the widespread karst makes this region extremely poor in surface water but rich in groundwater resources, which have proven to be of strategic importance for economic and social development, as they can meet the high water demand of activities such as agriculture and tourism. If the variations of natural conditions that determine the recharge, boundary conditions, and growing water demand are not properly considered for management purposes, this will greatly contribute to the degradation of the quality and quantity of Apulian water resources; this trend still continues [
12,
20,
21,
22,
23]. The implementation of new management strategies of groundwater resources has become extremely important [
15,
23,
24]. These strategies have to be validated with the use of numerical models of key processes [
2,
16].
The scientific activity performed in recent years by the Hydrogeology Group of CNR IRPI (
http://hydrogeology.ba.irpi.cnr.it/) aims to develop methodologies and knowledge for the management and safeguard of groundwater resources. The rapid national socioeconomic growth, which has occurred over the past few decades, has deeply affected the main hydrogeological systems, thereby leading to different risk conditions, especially for the largest karst coastal aquifers, located in the Apulian region.
The approach and methodologies described in this paper, which are based on Apulian aquifers as a case study, include a recharge and discharge trend analysis, a regional monitoring network, multi-parameter well logging for rapid groundwater quality classification, a discussion of regulation of groundwater utilization, a salinity threshold and multi-temporal spatial analysis, and large-scale numerical modeling.
2. Hydrogeological Features of the Main Aquifers
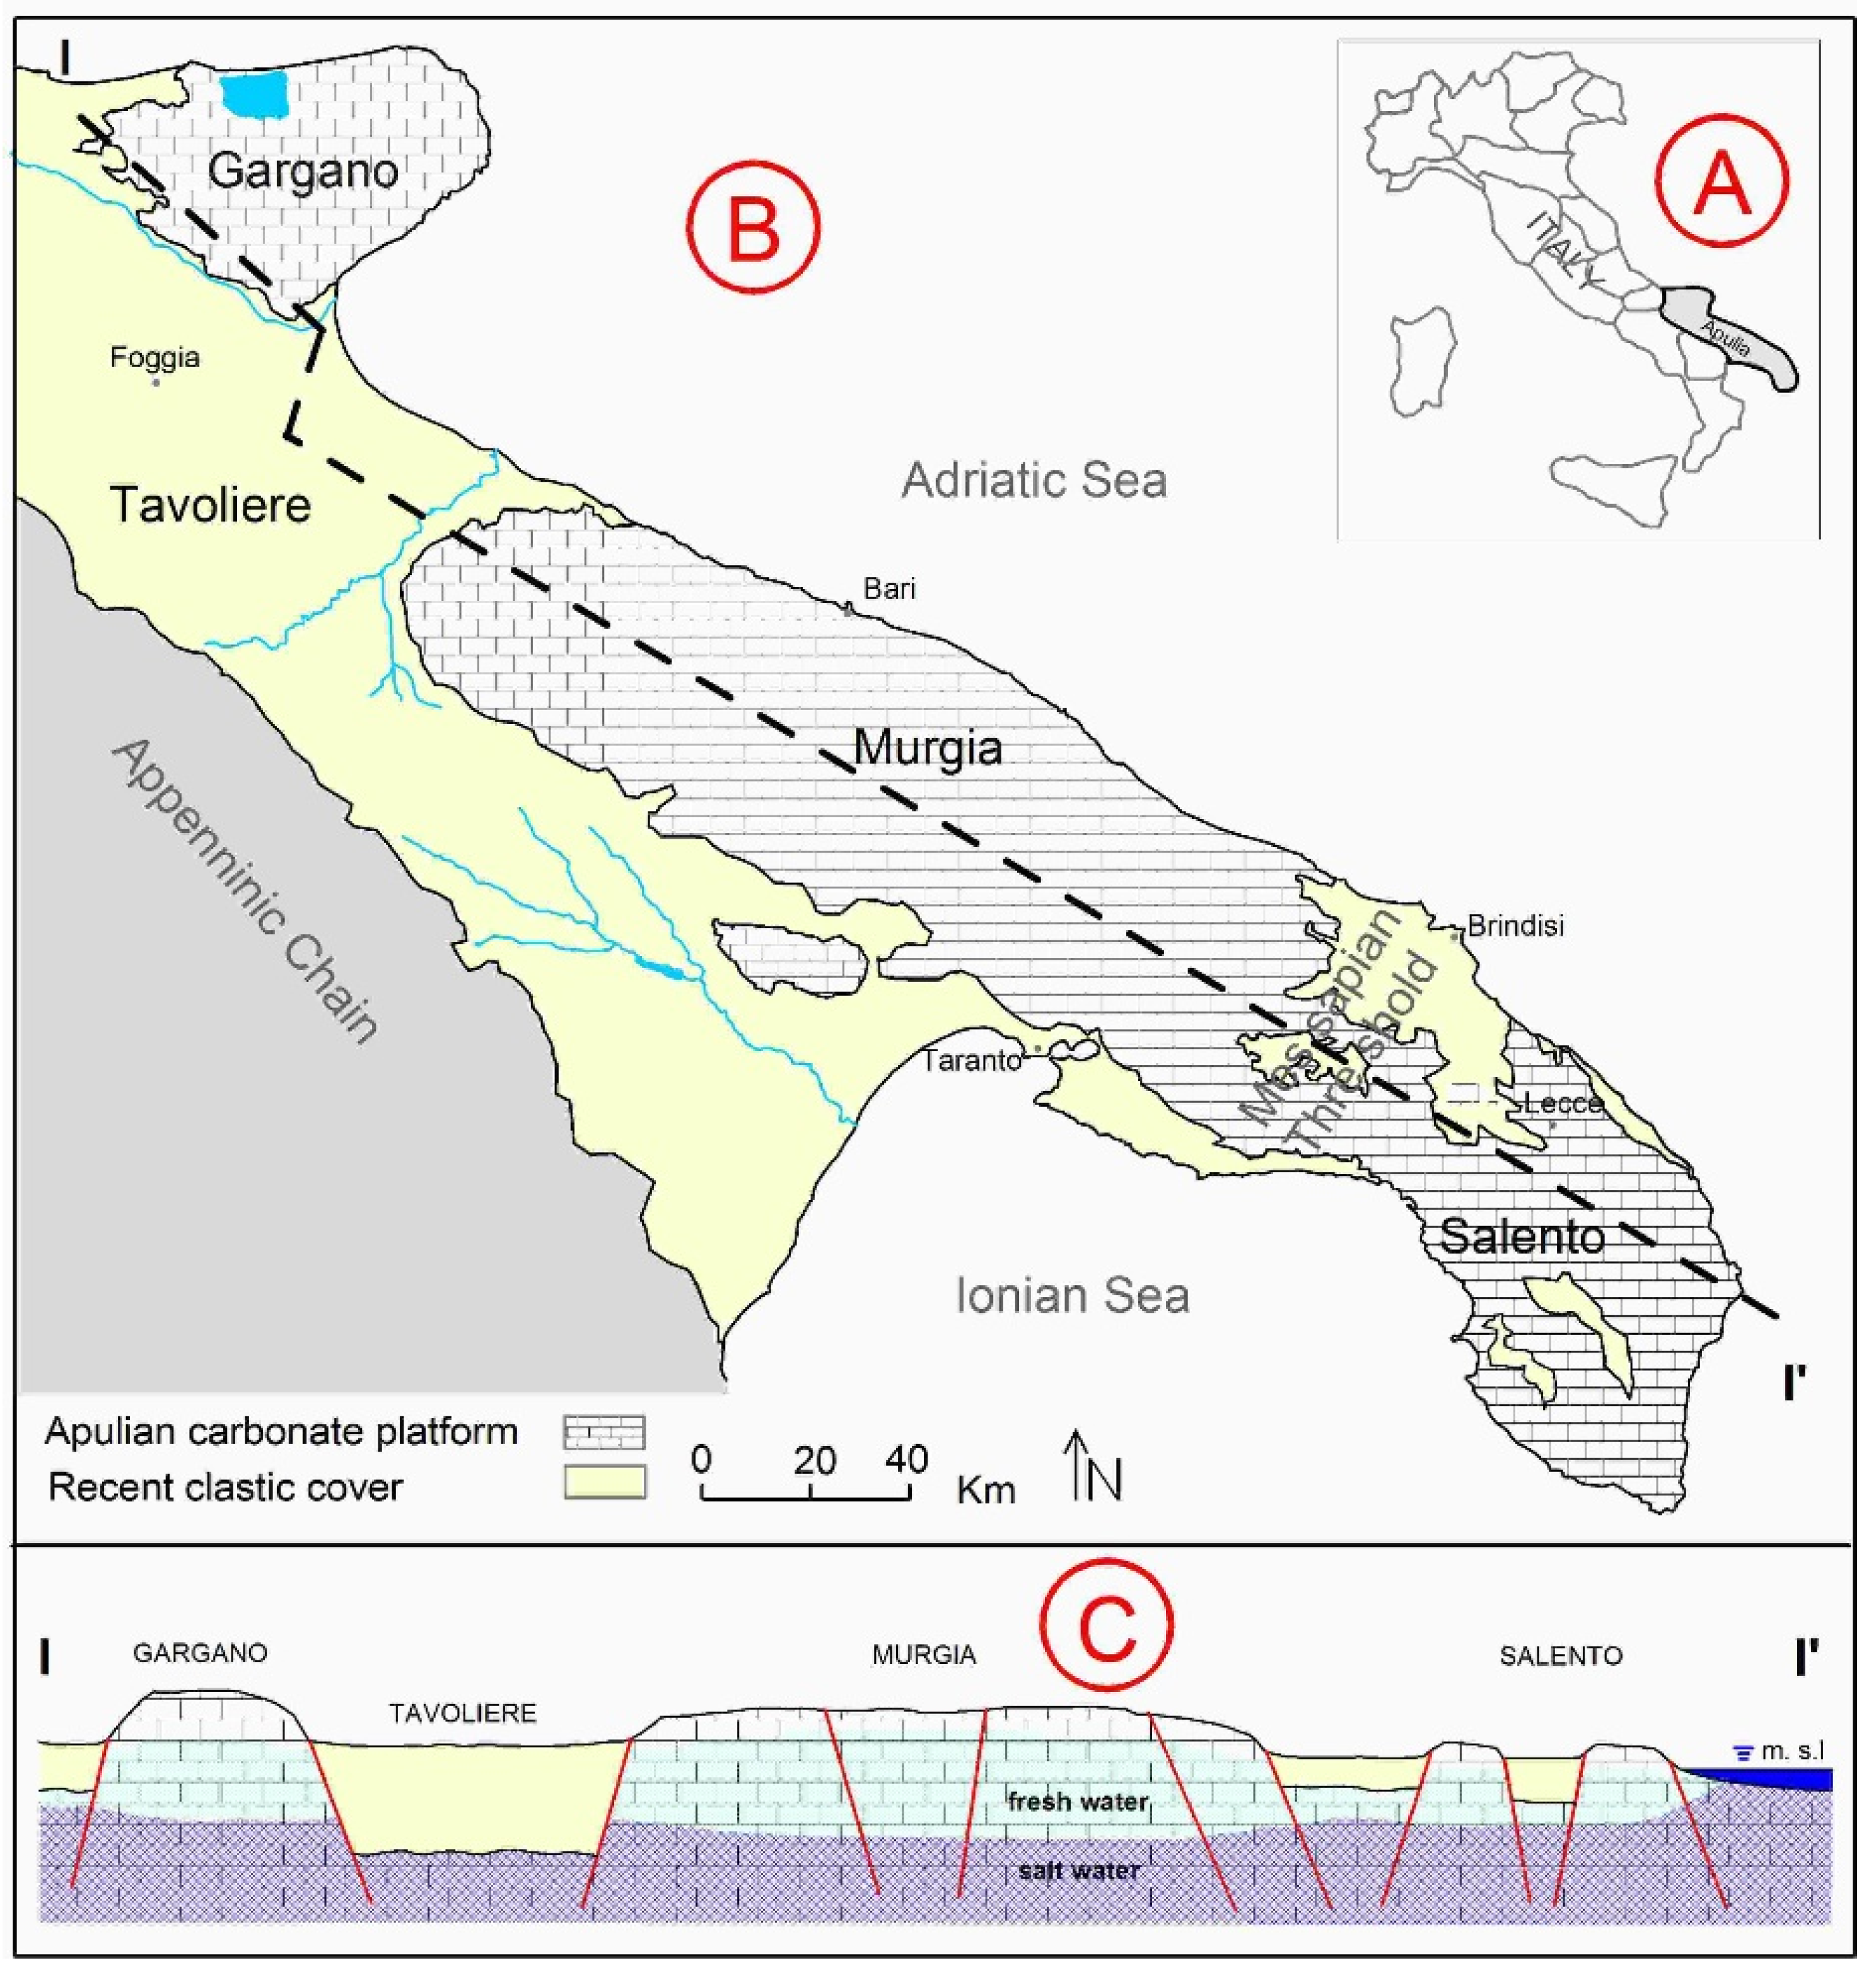
Bounded by the Appenninic chain on the western side, Apulia is bounded for more than 800 km by coastline on the Adriatic and Ionian Seas (
Figure 3). The Apulian carbonate platform includes large limestone and dolomite Mesozoic outcrops, which constitute the physiographic units of Gargano, Murgia, and Salento. Outcrops of detrital organogenic soils and rocks (Tertiary and Quaternary) can be found in the topographic troughs that partially overlap the abovementioned platform, as in the case of the Tavoliere physiographic unit [
18,
19]. Four hydrogeological structures (HSs) can be distinguished in the Apulian region: Tavoliere, Gargano, Murgia, and Salento, the last three of which are karstic. The Apulia region hosts the largest coastal karstic Italian aquifers.
The Tavoliere HS is mainly characterized by a porous shallow aquifer, whose groundwater flow is limited by a clay bottom a few hundred meters thick, both lying on top of the carbonate platform. Groundwater flows in phreatic conditions upstream, far from the sea, and is confined downstream, close to the coast. Inland, the piezometric head is approximately 300 masl; only along a very narrow coastal strip is the aquifer sufficiently deep to allow seawater intrusion. Salinization is a negligible phenomenon, both from a scientific and practical point of view (also due to the local availability of surface water resources), for this aquifer.
The Tavoliere HS hosts aquifers of secondary relevance, whereas the karstic HSs of Gargano, Murgia, and Salento create large carbonate aquifers that are hundreds of meters deep and are deeply influenced by karstic processes [
19]. These aquifers exhibit varying degrees of fracturing and permeability [
18].
Gargano is a high horst that strikes NE–SW in the shape of a promontory extending into the Adriatic Sea (peak altitude 1065 masl). The carbonate rock types of Gargano allow it to be divided into two distinct parts: the eastern sector consists of frontal reef depositions and transition depositions, and the central-western sector is dominated by reef facies and, to a lesser degree, by back reef depositions. Due to the mountainous features of Gargano, the level of anthropogenic activity is very low in terms of the degree of groundwater utilization [
16,
24].
The Murgia HS, which corresponds to a plateau (peak altitude 680 masl) and has a large asymmetric horst caged by two direct fault systems (striking NW–SE and NE–SW), and Salento HS, an almost flat area (peak altitude 150–180 masl) bounded by two seas, together constitute a continuum for groundwater flow. These HSs are also divided by a morphological-structural feature called the Messapian Threshold, which is multiples of kilometers wide and covers an area that extends from sea to sea (
Figure 3) [
18]. Moving from Murgia to Salento HS, the hydrogeological parameters improve (in the latter, higher hydraulic conductivity and storage coefficients are observed), the depth to water decreases considerably (from hundreds to tens of meters), the mean piezometric head decreases, the mean distance from the sea decreases, the level of groundwater utilization increases, and, on the whole, the risk of quality degradation as a result of seawater intrusion increases [
12,
15,
22].
Recharge of both of these HSs occurs mainly from rainfall infiltration, but a large amount of the Murgia recharge discharges to the sea by flowing across the Salento HS [
18,
19,
25]. Focusing on groundwater flow and the piezometric surface, a hydrogeological boundary divides the Salento HS into two portions: the northern portion, in which the main inflow is due to recharge from the Murgia HS and discharge to the Ionian and Adriatic Seas, together with direct rainfall infiltration, and the southern portion (SS-HS), in which the recharge is only due to direct rainfall infiltration. This southern portion of the Salento area experiences greater effects of seawater intrusion [
22].
3. Recharge and Discharge Trends
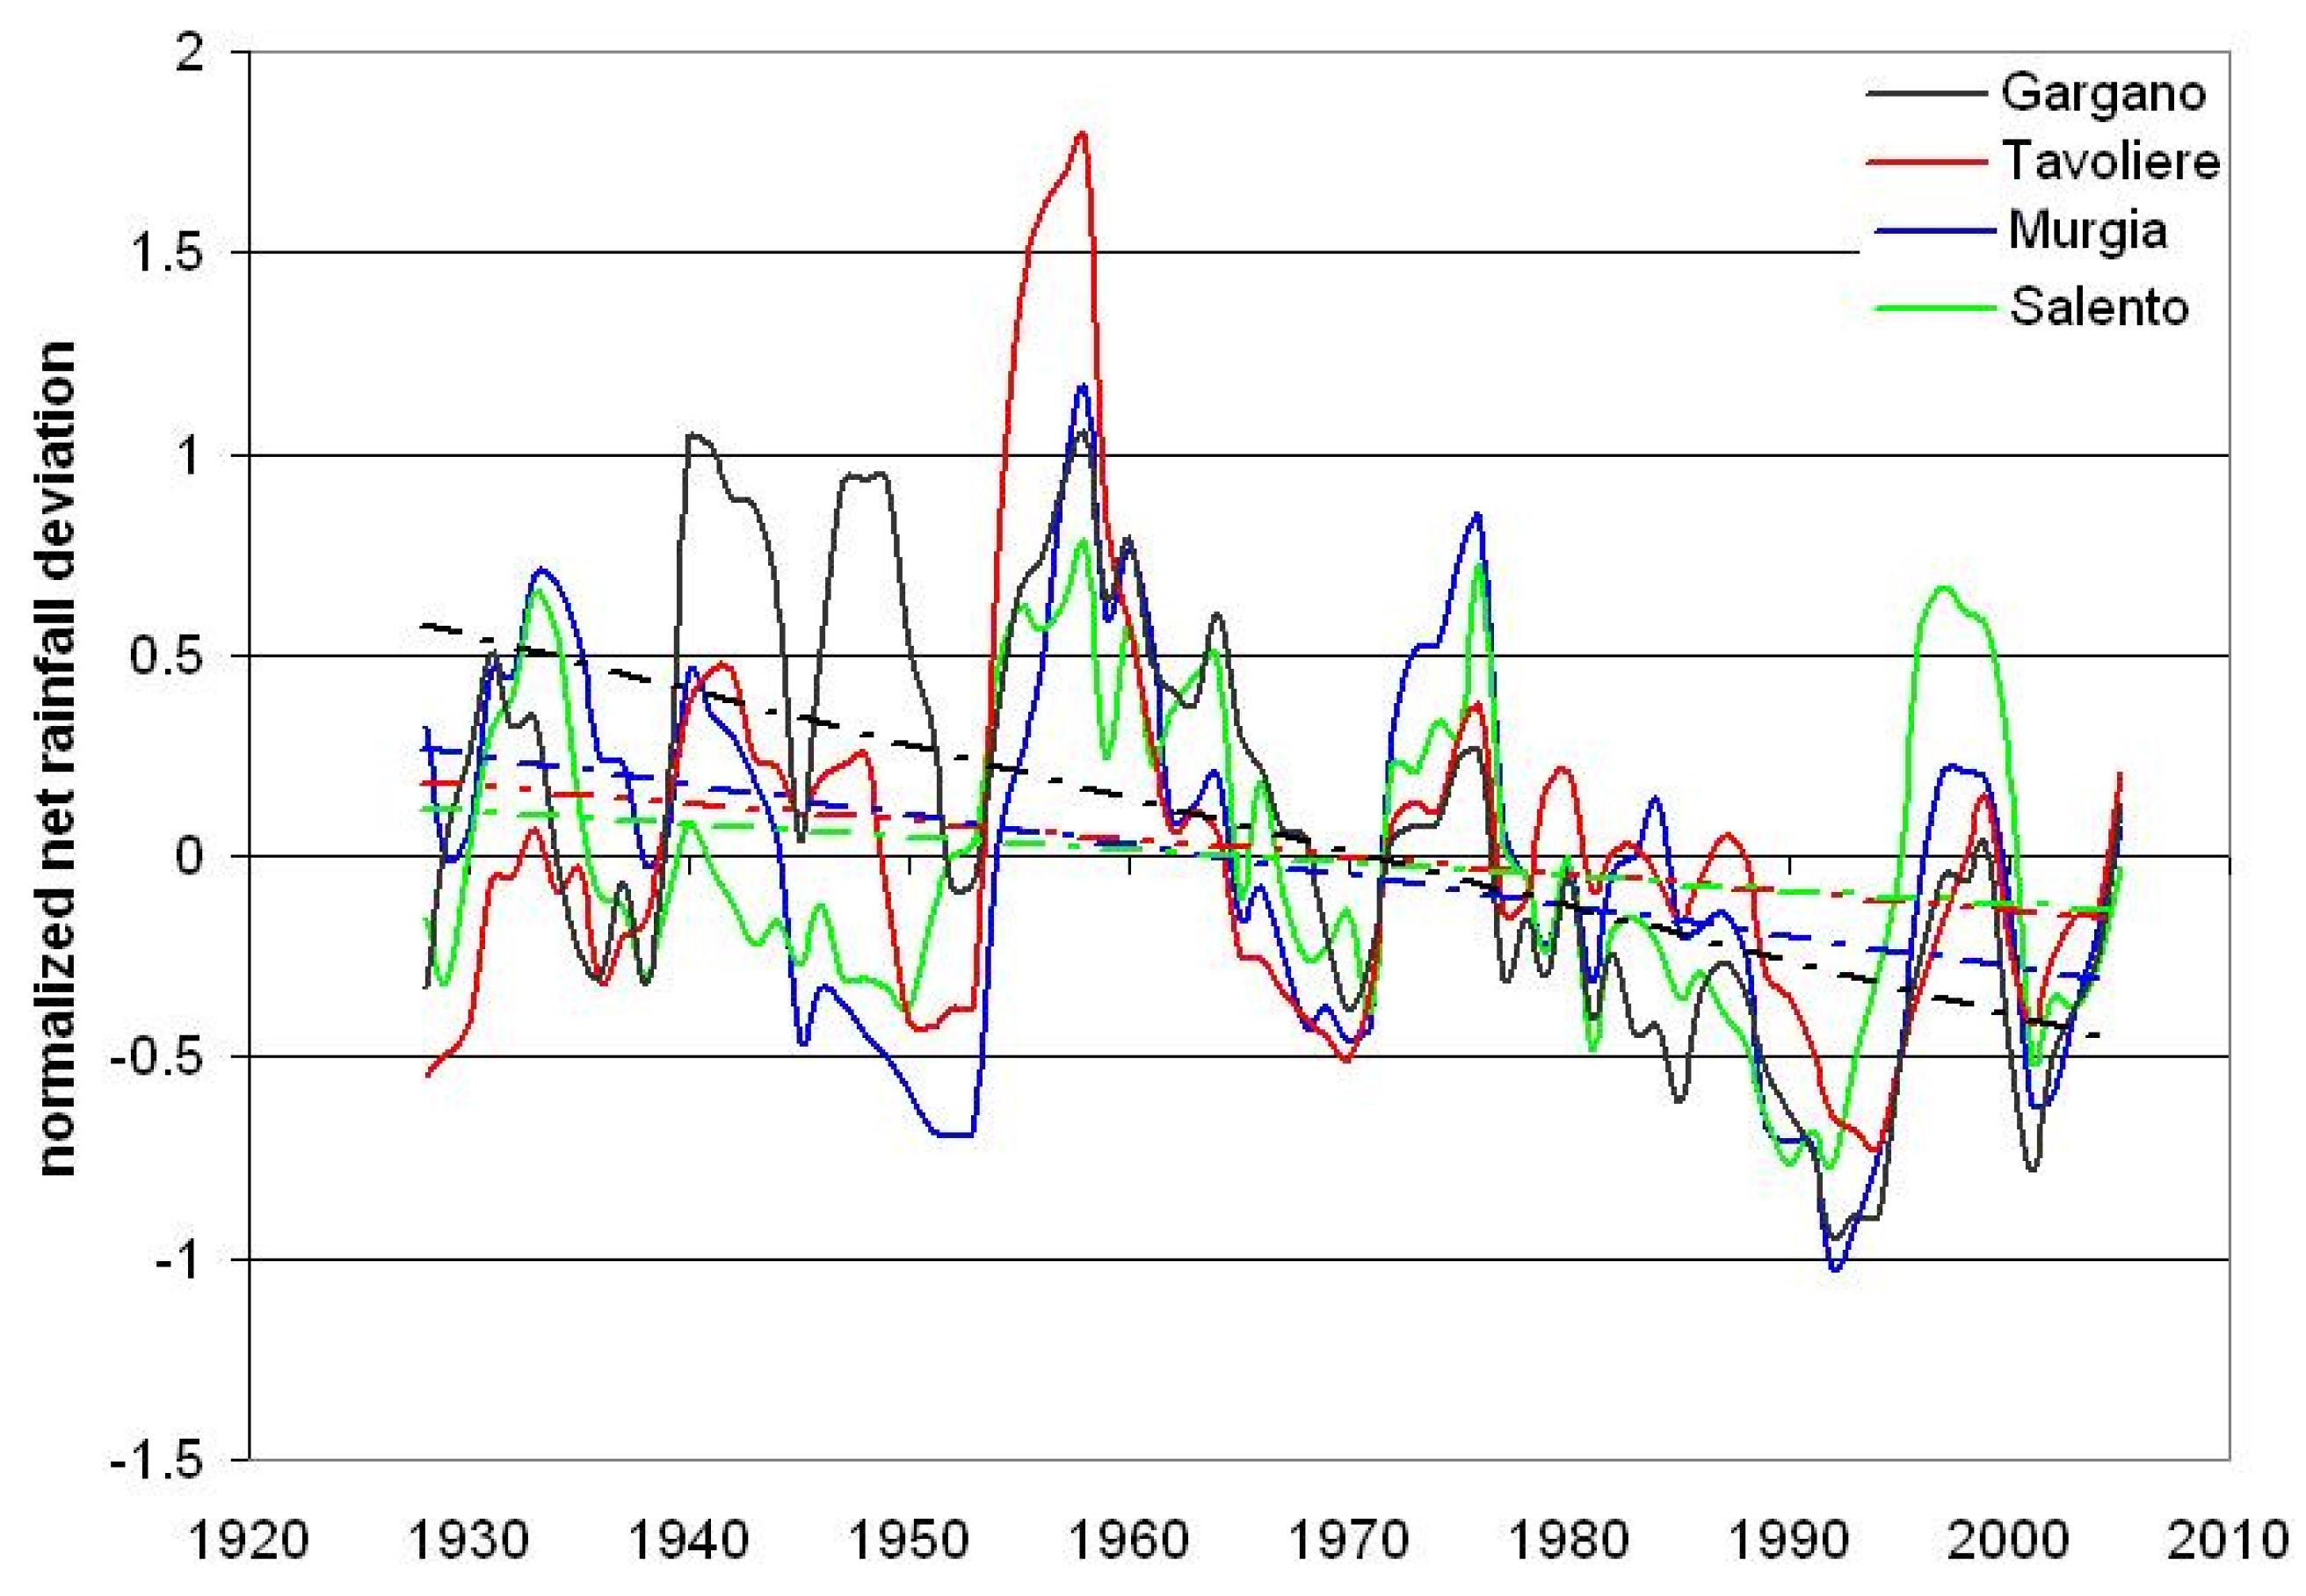
Monthly time series of rainfall and temperature from 1916 (temperature from 1925) to 2005, based on data published by the National and Regional Hydrological Service, were analyzed. Mean annual rainfall varies from 430 to 1170 mm in the Apulia region, with an average value of 644 mm [
11]. Over the entire study period, the Apulian annual rainfall trend is equal to −0.80 mm/year [
26].
Mean annual net rainfall varies from 52 to 675 mm in the region, with a regional average of 146 mm. For each time series, the net rainfall trend was strongly negative; the absolute value of net rainfall trend got worse more than rainfall trend. The net rainfall trend ranged from −0.23 to −3.52 mm/year. In the whole period, the decrease of net rainfall amounts to 42.2% of the mean net rainfall. The five-year moving average of annual net rainfall was assessed (
Figure 4). Negative trends are evident for all spatial domains; an anomalous sequence of negative values is evident since 1980.
A few deep wells existed in Apulia, located in Tavoliere, in 1936 [
27]. The level of Apulian groundwater utilization was very low (zero in large areas) until the end of the Second World War. A continuously increasing trend of groundwater abstraction, starting in the second half of the 1950s, was observed. The current well number is not known due to the high percentage of unauthorized wells; however, this number is approximated to be many tens of thousands. The continued effect of recharge variability and increasing exploitation can be assessed in terms of groundwater quantity degradation by measurement of the piezometric head and coastal spring discharge [
28].
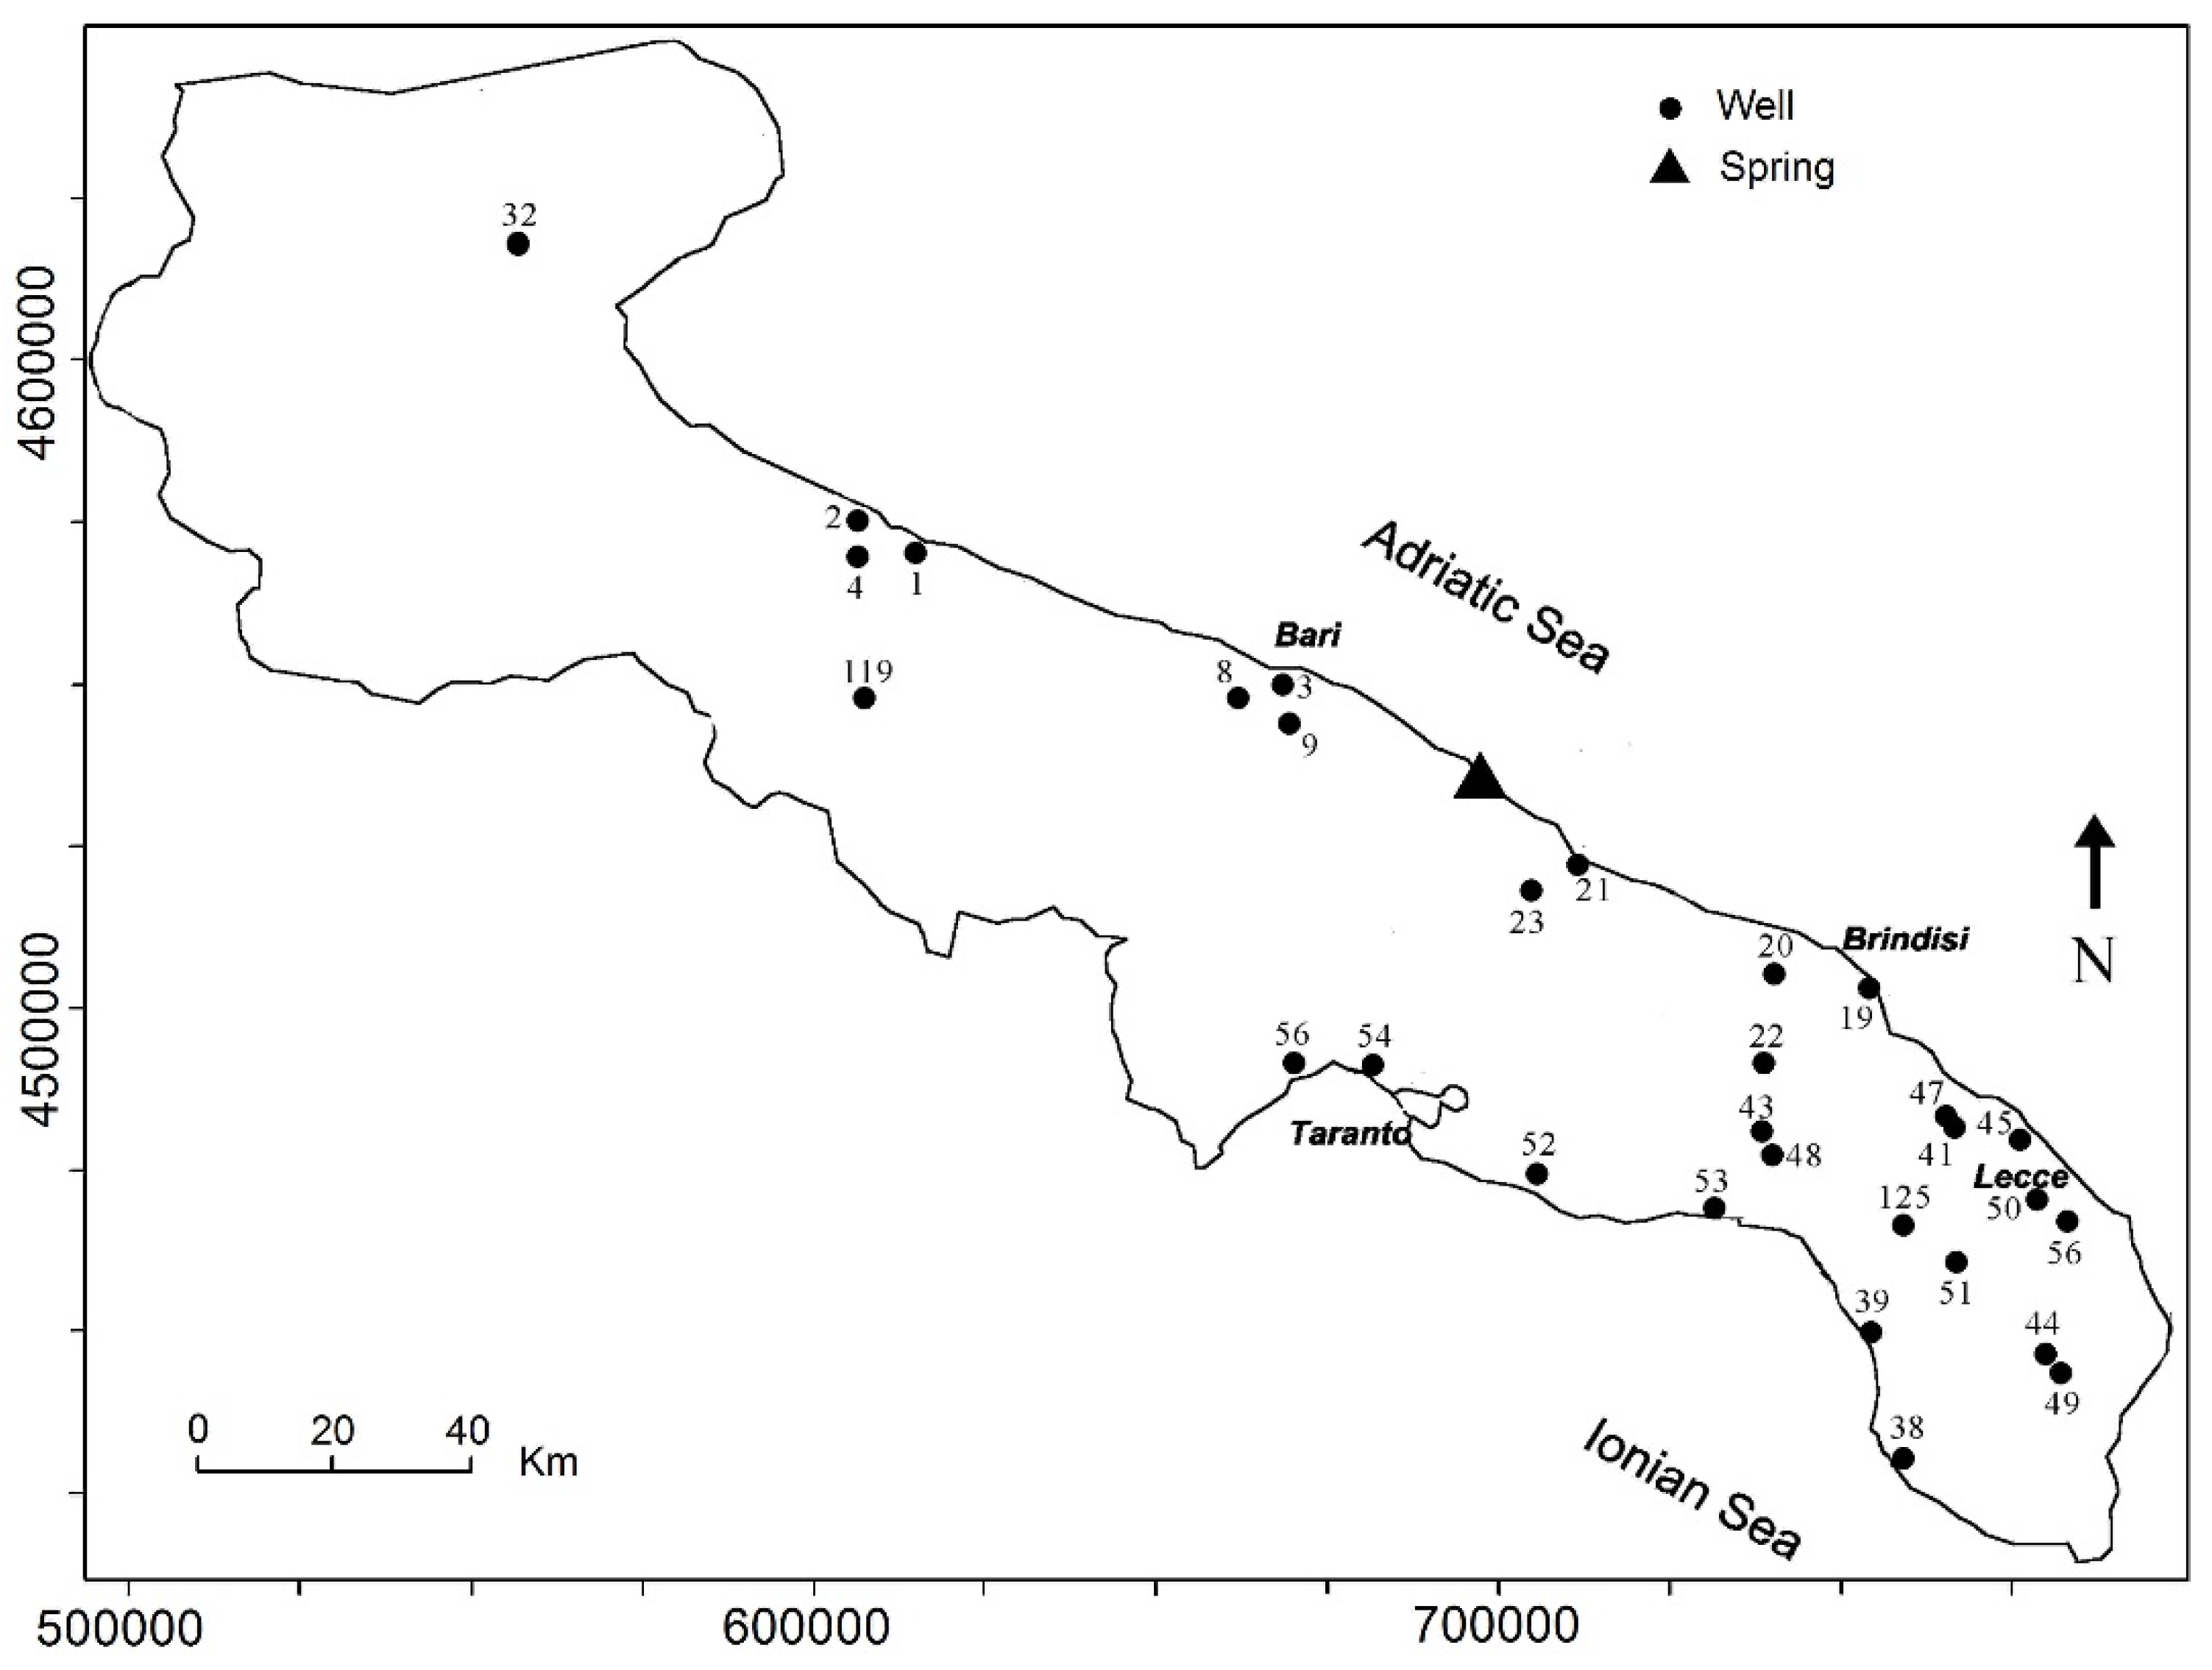
A regional piezometric study was realized for the period 1965–2010, using monthly data, with gaps of 30 selected well time series (
Figure 5) [
29].
The statistical reliability of the detected trends was tested with the Mann–Kendall test at a confidence level of 0.05; the piezometric trend was quantified with the Angular Coefficient (AC) of the straight-line regression. The piezometric trend was generally downward (negative AC) because there was a widespread tendency, albeit in some cases a very slow one, towards a piezometric decline (
Table 1). These results were confirmed by measurements of coastal spring outflow. In the case of the Fiume Grande Spring (
Figure 5), data with gaps are available from 1926 to 2010: on the basis of a mean value of 0.574 m
3/s, the trend was equal to –0.00443 m
3/year [
29].
The most probable spatial piezometric trend of each HS ranges from a low decrease, as in the case of Gargano (well 32), to a moderate decrease, as in the case of Salento, and to a high decrease rate, as in the case of Murgia and Tavoliere. The widespread trend towards piezometric lowering increases the risk of salt pollution by seawater intrusion, especially in Salento, which is higher than in the rest of the region, due to peculiarities of the boundaries and the piezometric range (the Salento historical maximum piezometric head of approximately 4 m asl is orders of magnitude lower than maxima of Murgia and Gargano).
4. Groundwater Regional Monitoring Network
To characterize the modification in terms of groundwater availability and quality due to salinization and/or human-related pollution, a regionally based continuously operating hydrogeological monitoring network should be considered an affordable option [
12,
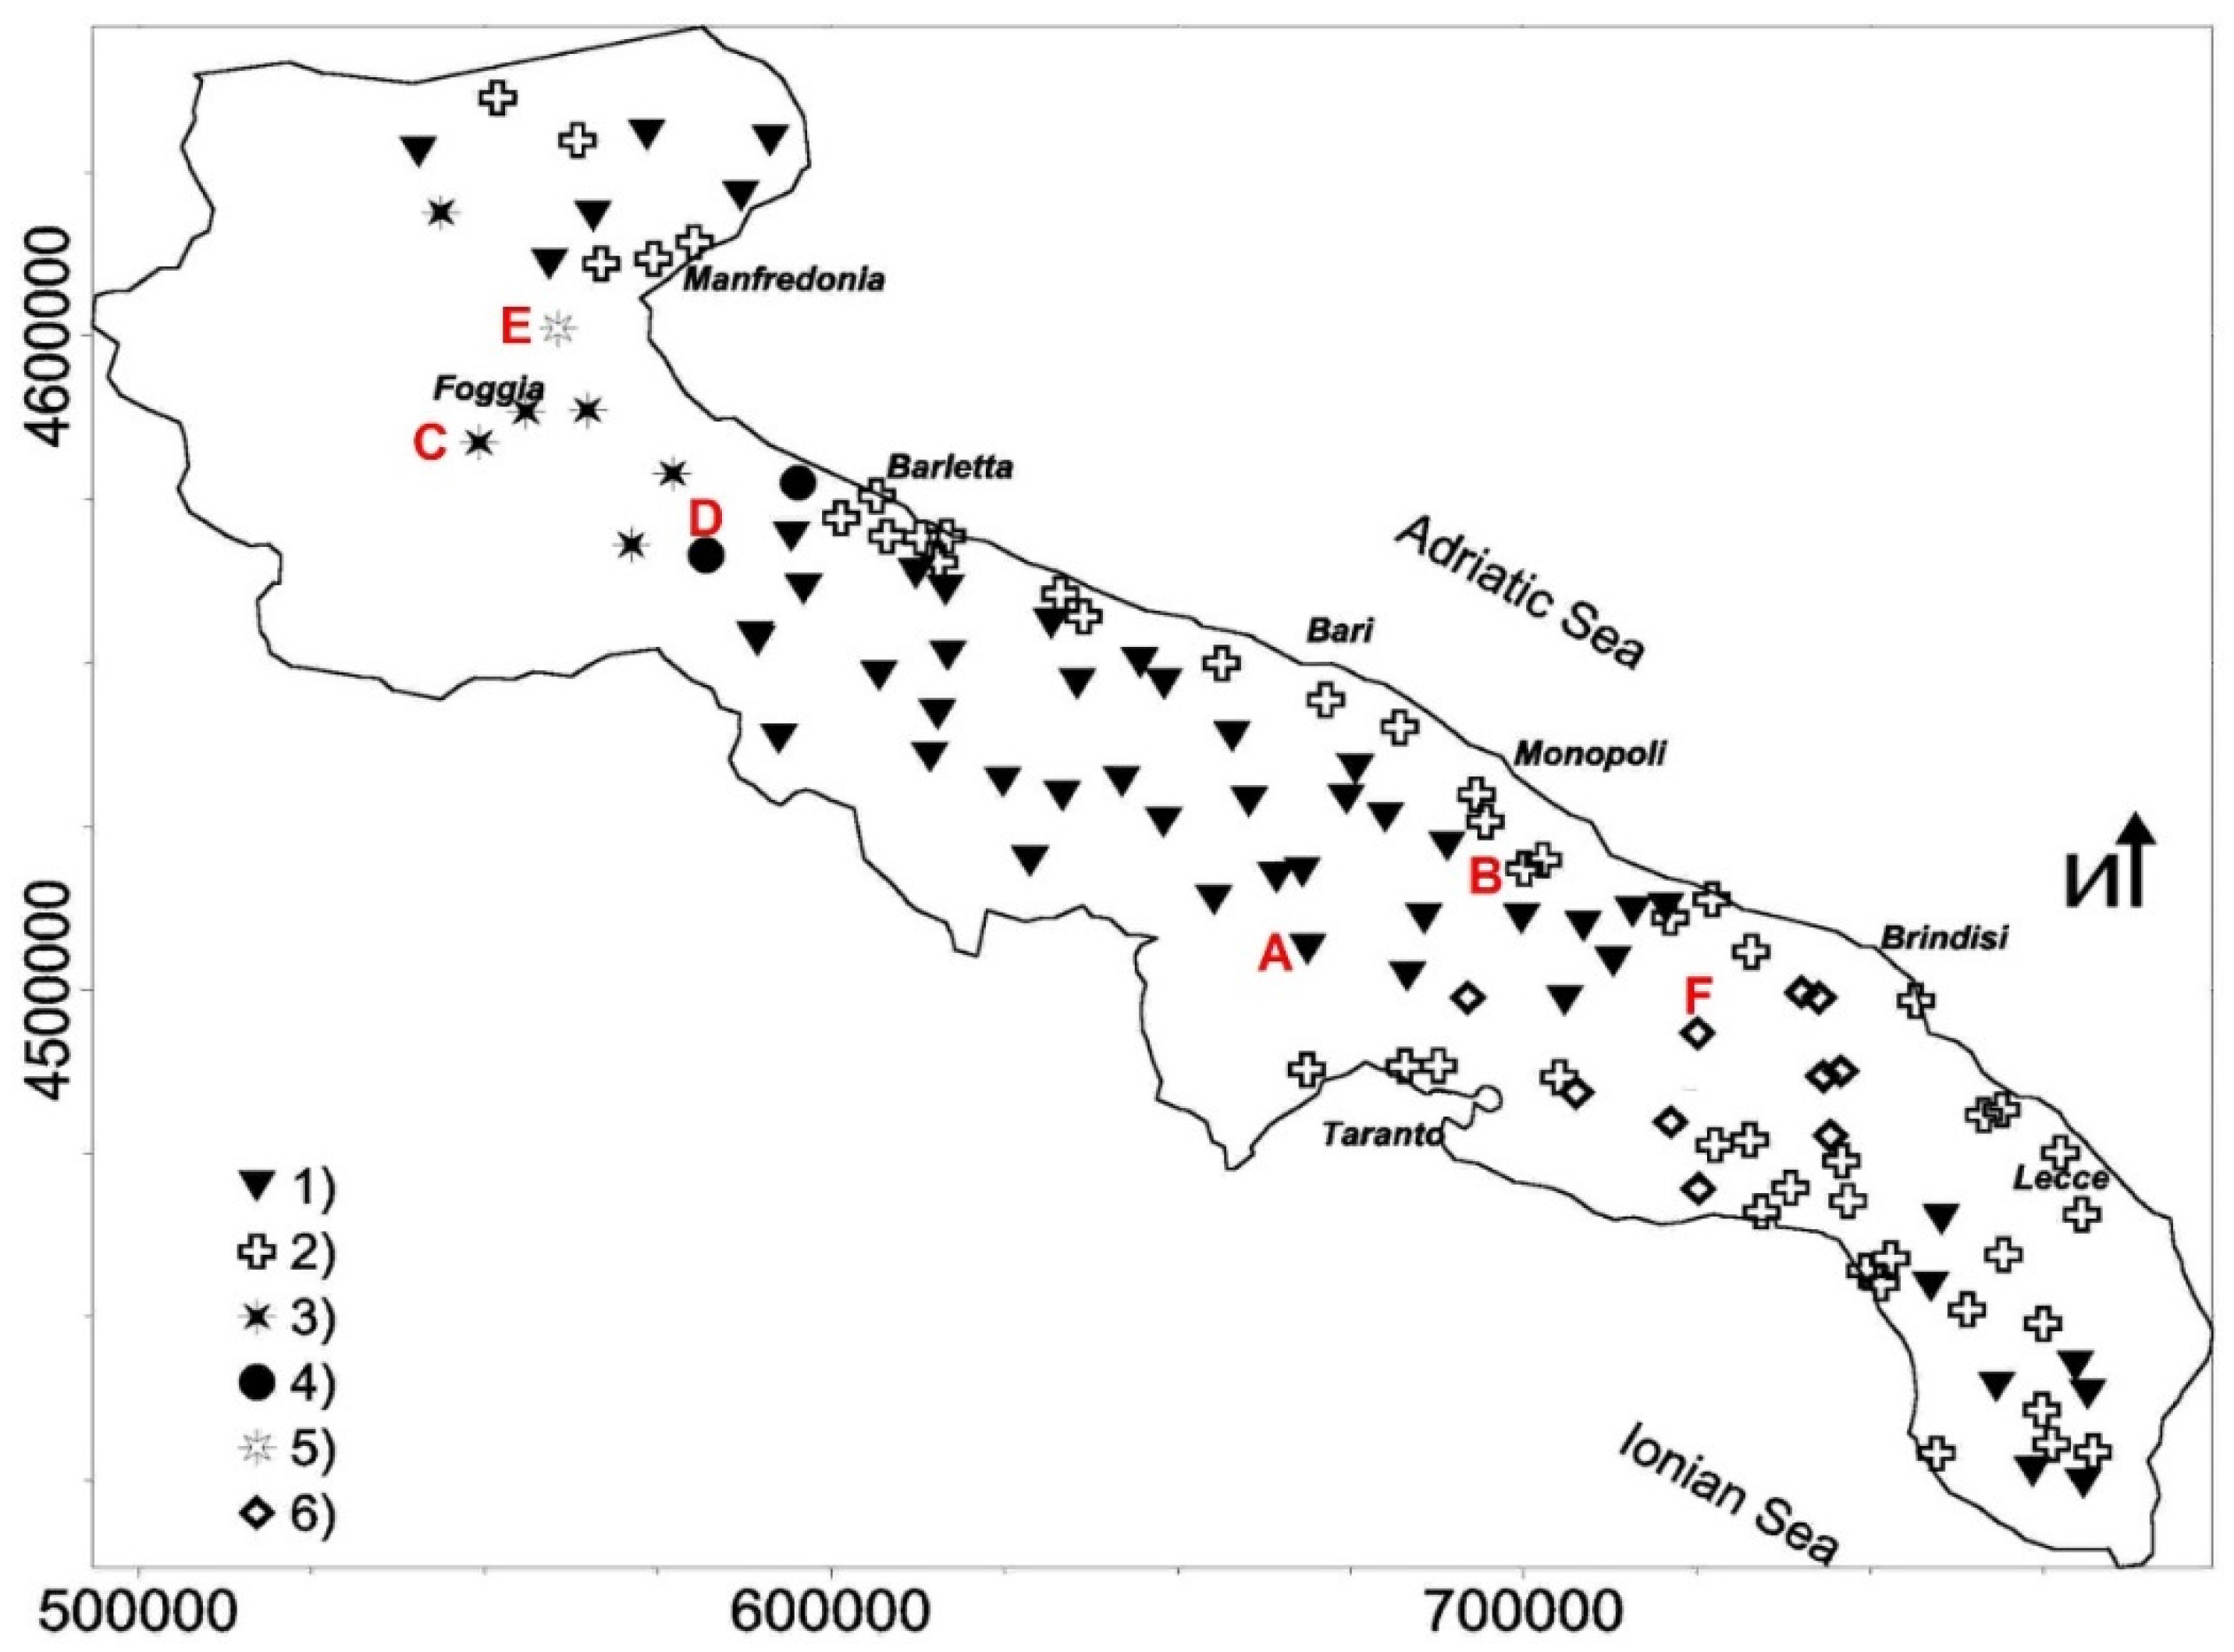
23]. In 1998, the Apulian monitoring system used 118 wells, selected from 120 available wells, for monitoring purposes (the well map is shown in
Figure 6), some of which were hundreds of meters deep [
30]. Different types of wells were equipped with electrical sensors along the vertical axis and connected to a GIS system permitting piezometric (P, measured in each well), temperature (T), electric conductivity (EC), total dissolved solid (TDS, estimated on the basis of T and EC measurements), Eh, and dissolved oxygen (DO) measurements.
Three types of wells were used. Piezometric wells, in which only a P sensor was installed, accounted for 78 wells (66% of the total); three couples (at different depths) of T and EC sensors (permitting TDS assessment) were installed in 12 wells (10%), i.e., the coastal wells, located along the coast and generally very deep (the well bottom is below the transition zone between fresh and saline groundwater); T, EC, pH, Eh, and DO sensors were installed in quality control wells, accounting for 24% of the total, which were located where the withdrawal rate and groundwater contamination hazards were higher.
On the basis of the monitoring network data, high differences were assessed in terms of the seawater intrusion in the karstic structures. The lateral seawater intrusion in Murgia is bounded in a narrow coastal strip, usually less than 3 km in width and 14 km at maximum; apart from this strip, the groundwater salinity is low further inland (less than 0.5 g/L), with a depth of 500–900 m below sea level. In Salento, only narrow areas, located inland, exhibit pure fresh groundwater.
5. Multi-Parameter Logging for Rapid Groundwater Quality Classification
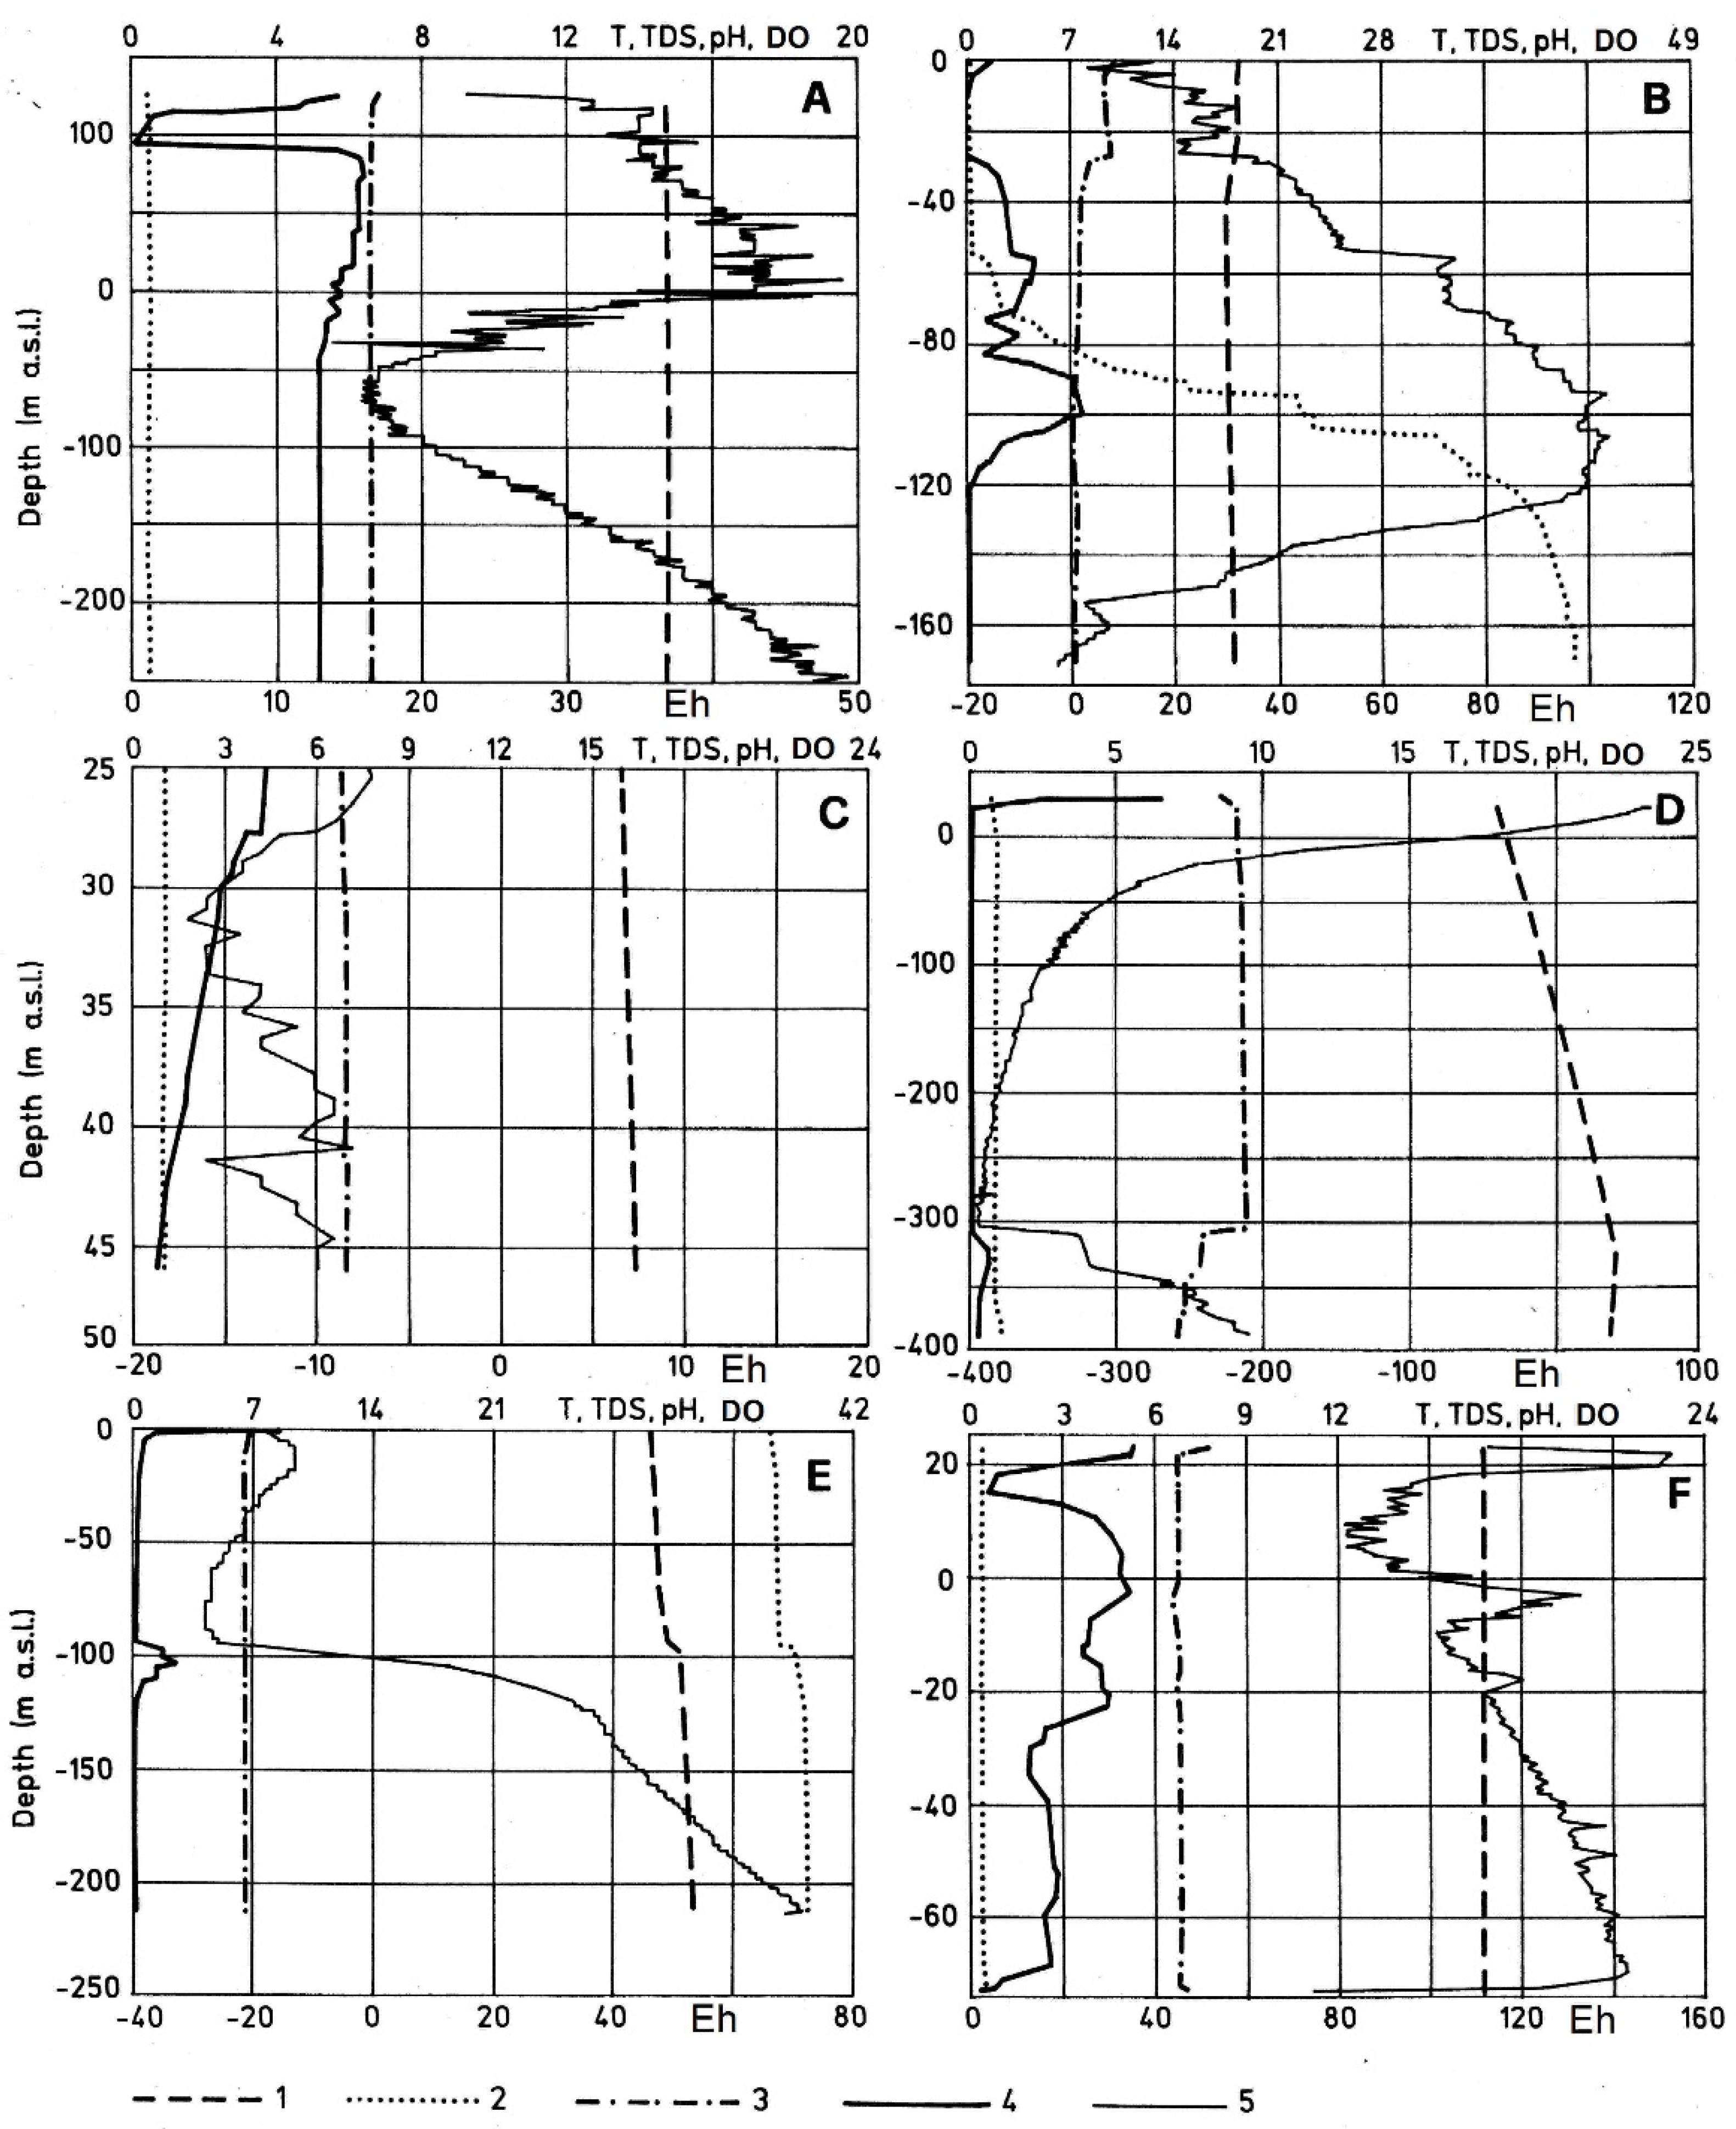
The multi-parameter logs are measurements of some groundwater parameters, generally T, EC, TDS, pH, Eh, and DO, along the water columns of the wells. The rapid groundwater quality classification method is based on detection with multi-parameter logs of typical parameter trends that are due to natural hydrogeological conditions of the studied aquifer.
The method was tested in 120 Apulian wells over one year, with surveys conducted every three months (
Figure 6) [
31]. It was observed that these types of trends are rather recurrent in space and time (
Figure 7). Six typical trends of the multi-parameter logs were distinguished: the inner or recharge area (type A), in which pure fresh groundwater, typical of a carbonate aquifer, flows; the coastal strip trend (type B), characterized by a salinity “knee” trend due to seawater intrusion; the Tavoliere shallow aquifer (type C), in which the low groundwater quality is exhibited by the pH, Eh, and DO logs; the transition zone between the Murgia and the Tavoliere (type D); the transition zone between the Tavoliere and the Gargano (type E), in which the trends change from one aquifer to the other; and the transition zone between the Murgia and the Salento (type F), in which the effect of the leakage from inland Murgia to Salento corresponds to a steady and widespread decrease of the piezometric head and a significant increase in permeability.
It is reasonable that an extensive use of the suggested method can be easily applied to the preliminary detection of the hydrogeological conditions. Some examples include preliminary and rapid assessment (which can be further developed with more expensive hydrogeological studies) of the natural groundwater quality; if aquifer boundaries are uncertain, the preliminary recognition of a tapped aquifer; and the detection of anthropogenic effects on quality,
i.e., the occurrence of human-related pollution or seawater intrusion. Human-related pollution is highlighted by an anomalous trend of one or generally more than one of the following parameters: T, pH, Eh, and DO. The effect of seawater intrusion (upconing or lateral intrusion) requires repeated logs over time, focusing on EC or TDS variations; in this way, overexploitation effects can be detected by observing the vertical modification of the transition zone between fresh and saline groundwater [
18].
This method may prove particularly useful for practical purposes because the execution of logs is quite simple, quick, and comes at a low cost.
6. Regulation of Groundwater Utilization
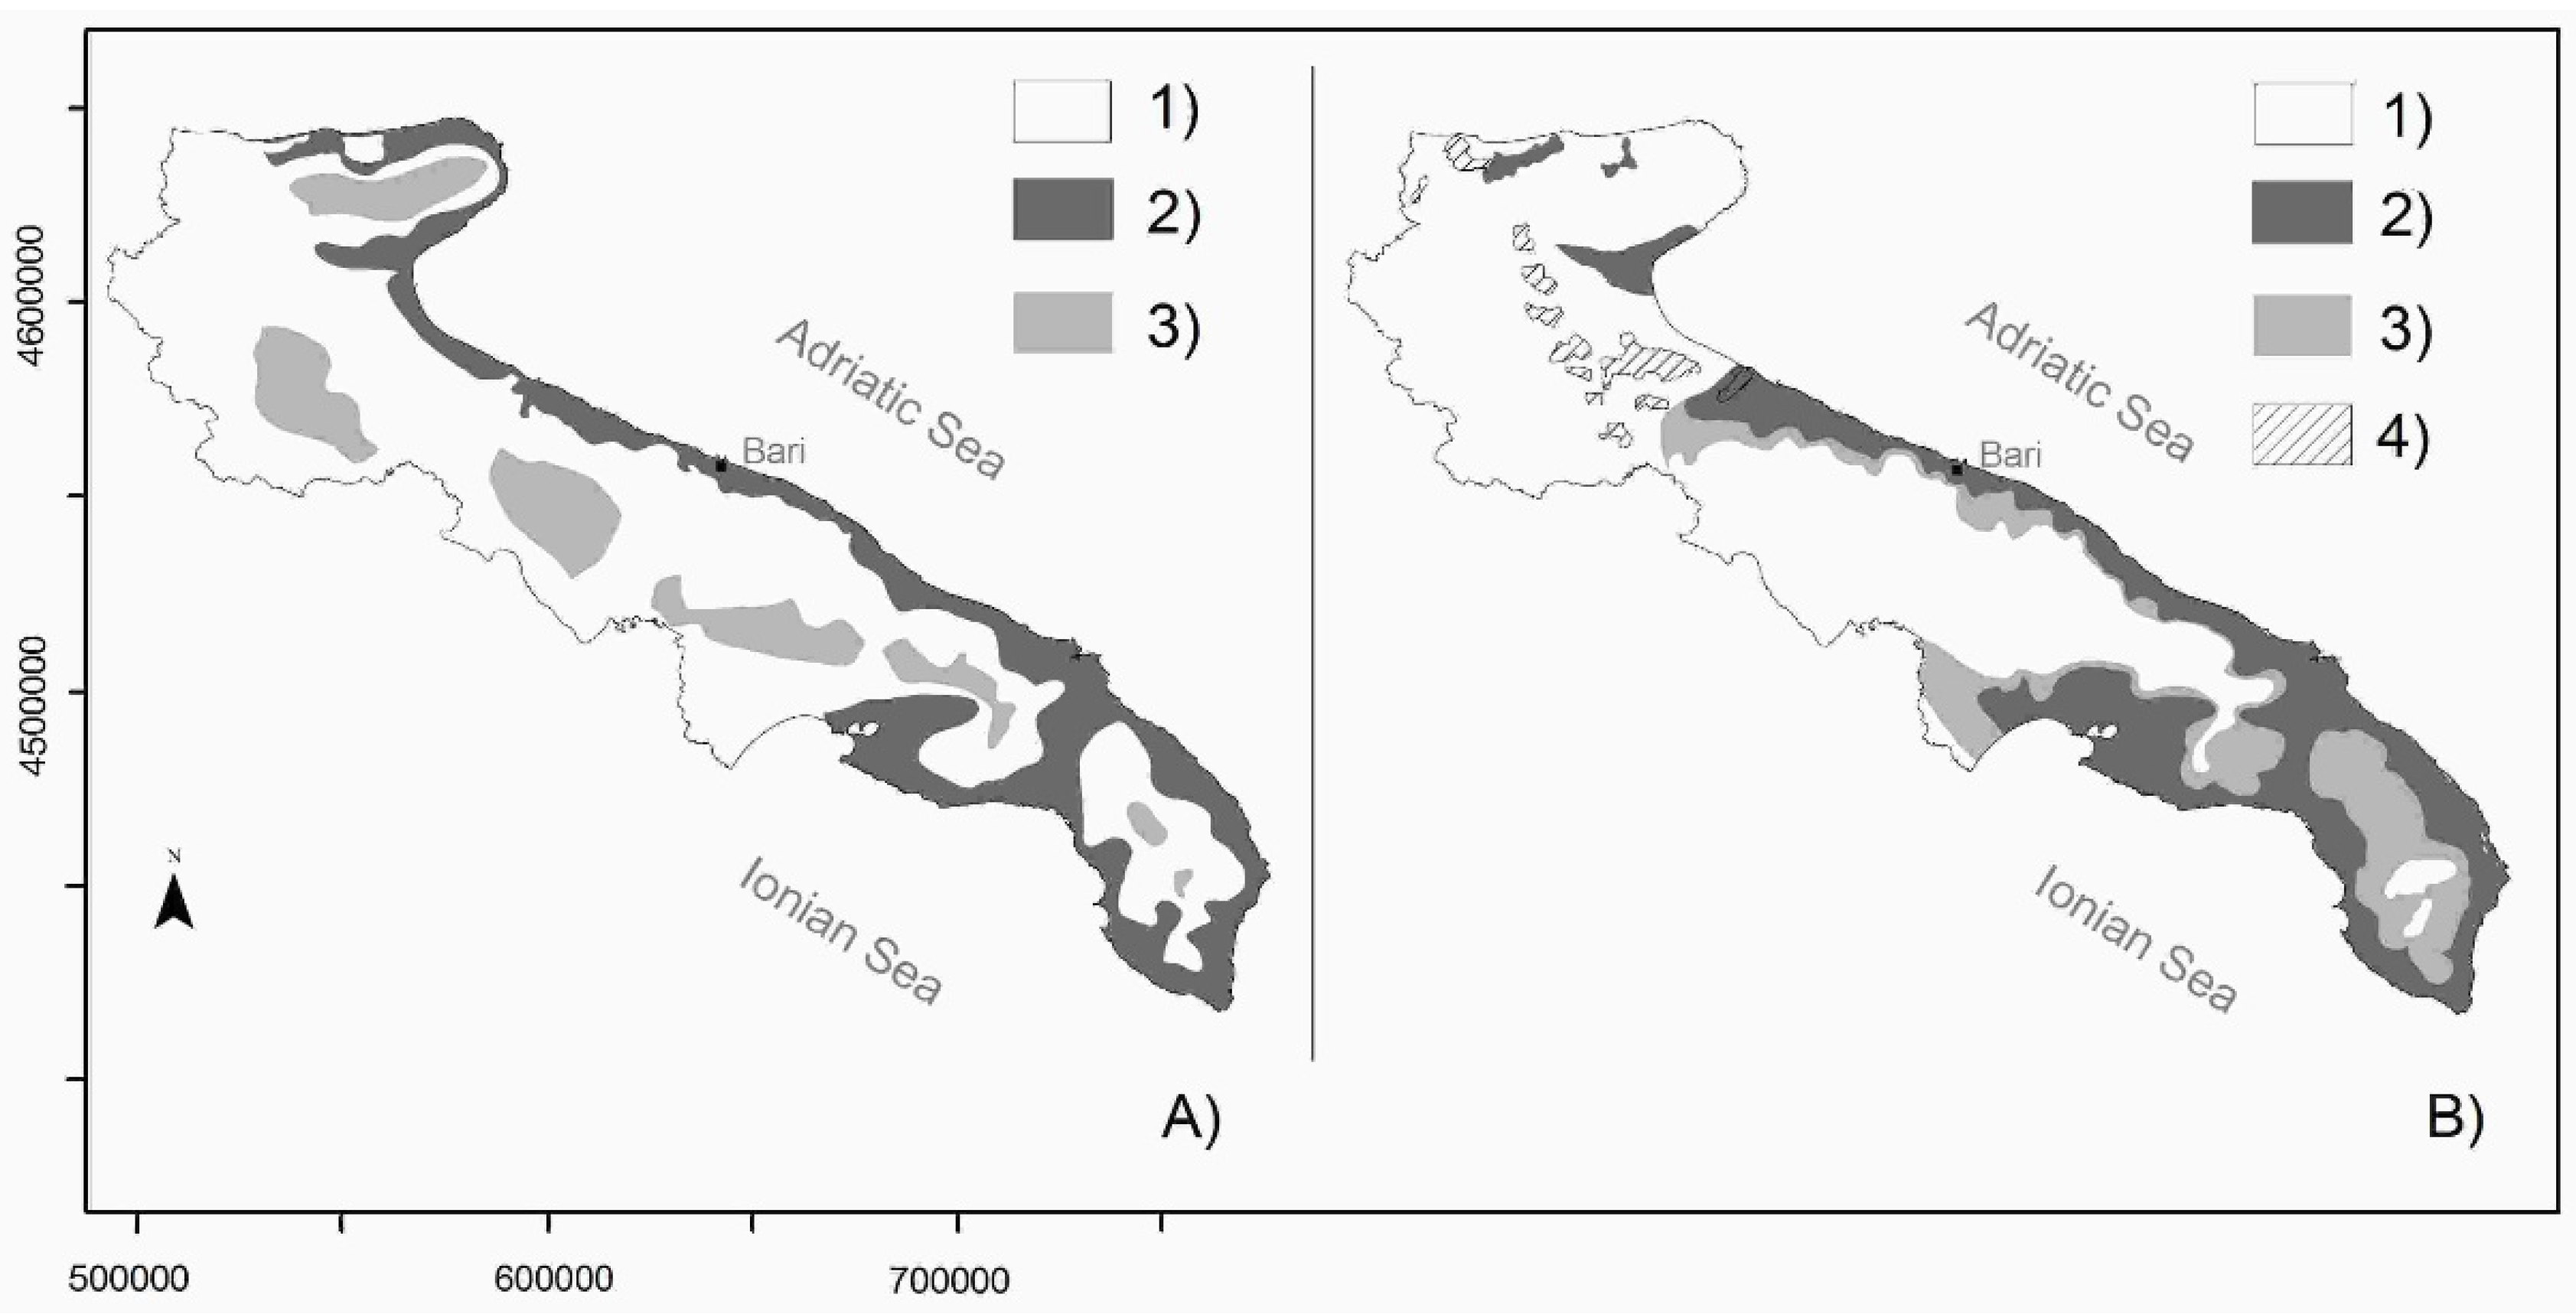
Until 1984, laws regulated groundwater extraction in Apulia (and roughly in Italy) mainly from an administrative point of view, without considering the effects of seawater intrusion and the application of hydrogeological management criteria. In 1984, the regional authorities implemented a safeguarding and decontamination plan called PRA or PLAN1, which determined the quality zonation of Apulian groundwater and the regulation of groundwater utilization as a function of the risk of groundwater degradation, mainly considering seawater intrusion effects [
32]. As an example, the drilling of new pumping wells was forbidden where the salinity was too high due to the mixing with saline groundwater (no discharge zone, called NOD1 zone hereafter,
Figure 8A).
The areas where the water quality was the lowest were located along the coast, as an effect of seawater intrusion. The boring of new abstraction wells was regulated where groundwater quality was suitable for drinking utilization (
Figure 8A). This was roughly the case for the main recharge areas of the Apulian aquifers.
In 2009, the Water Protection Plan (PTA or PLAN2), still applicable, replaced PLAN1, and considers other phenomena in addition to seawater intrusion [
33]. It distinguishes zones of quantitative protection (QP zone), as in the example of the shallow Tavoliere aquifer, the most overexploited Apulian aquifer, in which new abstraction permissions were suspended (
Figure 8B) [
34].
Focusing on seawater intrusion, zones affected by seawater intrusion (hereinafter referred to as the NOD2 zone, to be distinguished from the NOD1 zone of the previous PLAN1), located along the coast, and zones defined as qualitative and quantitative protection zones (QQP zone), located between recharge or inland areas, are distinguished from each other. In the NOD2 zone, the issue of permits for constructing new wells and for abstraction of fresh groundwater is “suspended”, even if the probability of finding fresh groundwater in this zone is low. It is only possible to drill for new pumping wells in the case of using deep and saline groundwater for specific purposes, but a specific hydrogeological study and assessment are required. The authorization renewal of pre-existing wells is only possible on the condition of two criteria: the well bottom (m below sea level) should be less than 30, 25, or 20 times the piezometric head (m above sea level) in the cases of Gargano, Murgia, and Salento, respectively; additionally, the maximum abstraction rate should cause a drawdown (m) of less than 50% (Murgia) or 30% (Gargano and Salento) of the piezometric head (m asl). In the QQP zone, new authorizations are again regulated considering the well bottom (a condition quite similar to the NOD2 zone but declined if groundwater is locally confined) and the maximum abstraction allowed. It requires a drawdown (m) of less than 60% (Murgia) or 30% (Salento) of the piezometric head (masl); TDS should be less than 1 g/L, and chloride concentrations should be less than 500 mg/L.
Both plans do not explain the criteria defined to plot NOD1, NOD2, and QQP zones, but it seems the high level of salinity and pumping well density were considered as key criteria. Neither plan considered the spatial and temporal modification of seawater intrusion effects. The PLAN1 approach failed to protect groundwater quality and availability. It is too soon to assess the effects of PLAN2, but the described criteria seem to be overly linked to a single-well criterion; for example, the Ghyben–Herzberg principle of a sharp interface does not consider the overlapping effects of nearby wells and the whole amount of abstraction compared to the variable recharge.
7. Salinity Threshold and the Multi-Temporal Spatial Analysis Method
A very simple criterion to detect the absence or presence of seawater intrusion quality degradation was defined for the Apulian karstic aquifers [
23]: the threshold criterion. The key concept was to define a boundary or threshold between pure fresh groundwater and any type of mixing between fresh and saline groundwater.
On the basis of a hydrogeochemical classification of approximately 500 groundwater laboratory analyses (samples taken from the karstic HSs), groundwater samples of the hydrochemical parameters (water types), i.e., Ca2+-HCO3−, Ca2+-Mg2+-HCO3−, and Mg2+-Ca2+-HCO3−, were considered to be representative of pure fresh karstic groundwater, as an effect of chemical modification on infiltrated rain water due to the characteristics of the topsoil and the karstic aquifer. The simplest grouping of samples is as follows: pure fresh groundwater (group F) and the remaining samples (group S), consisting of pure fresh groundwater mixed with variable percentages of seawater (all the pure fresh groundwater samples came from wells located in the inner portion of Murgia and Salento). On the basis of salinity statistical analysis of group F, the upper salinity limit (TDS) or threshold value of pure fresh groundwater was determined as equal to 0.5 g/L.
With this threshold, the analysis of the salinity spatial evolution over time was based on low frequency and high-density salinity data used for plotting the threshold contour line (TCL) of 1981, 1989, 1997, and 2003, using all available data, including those for private discharge wells [
23,
27].
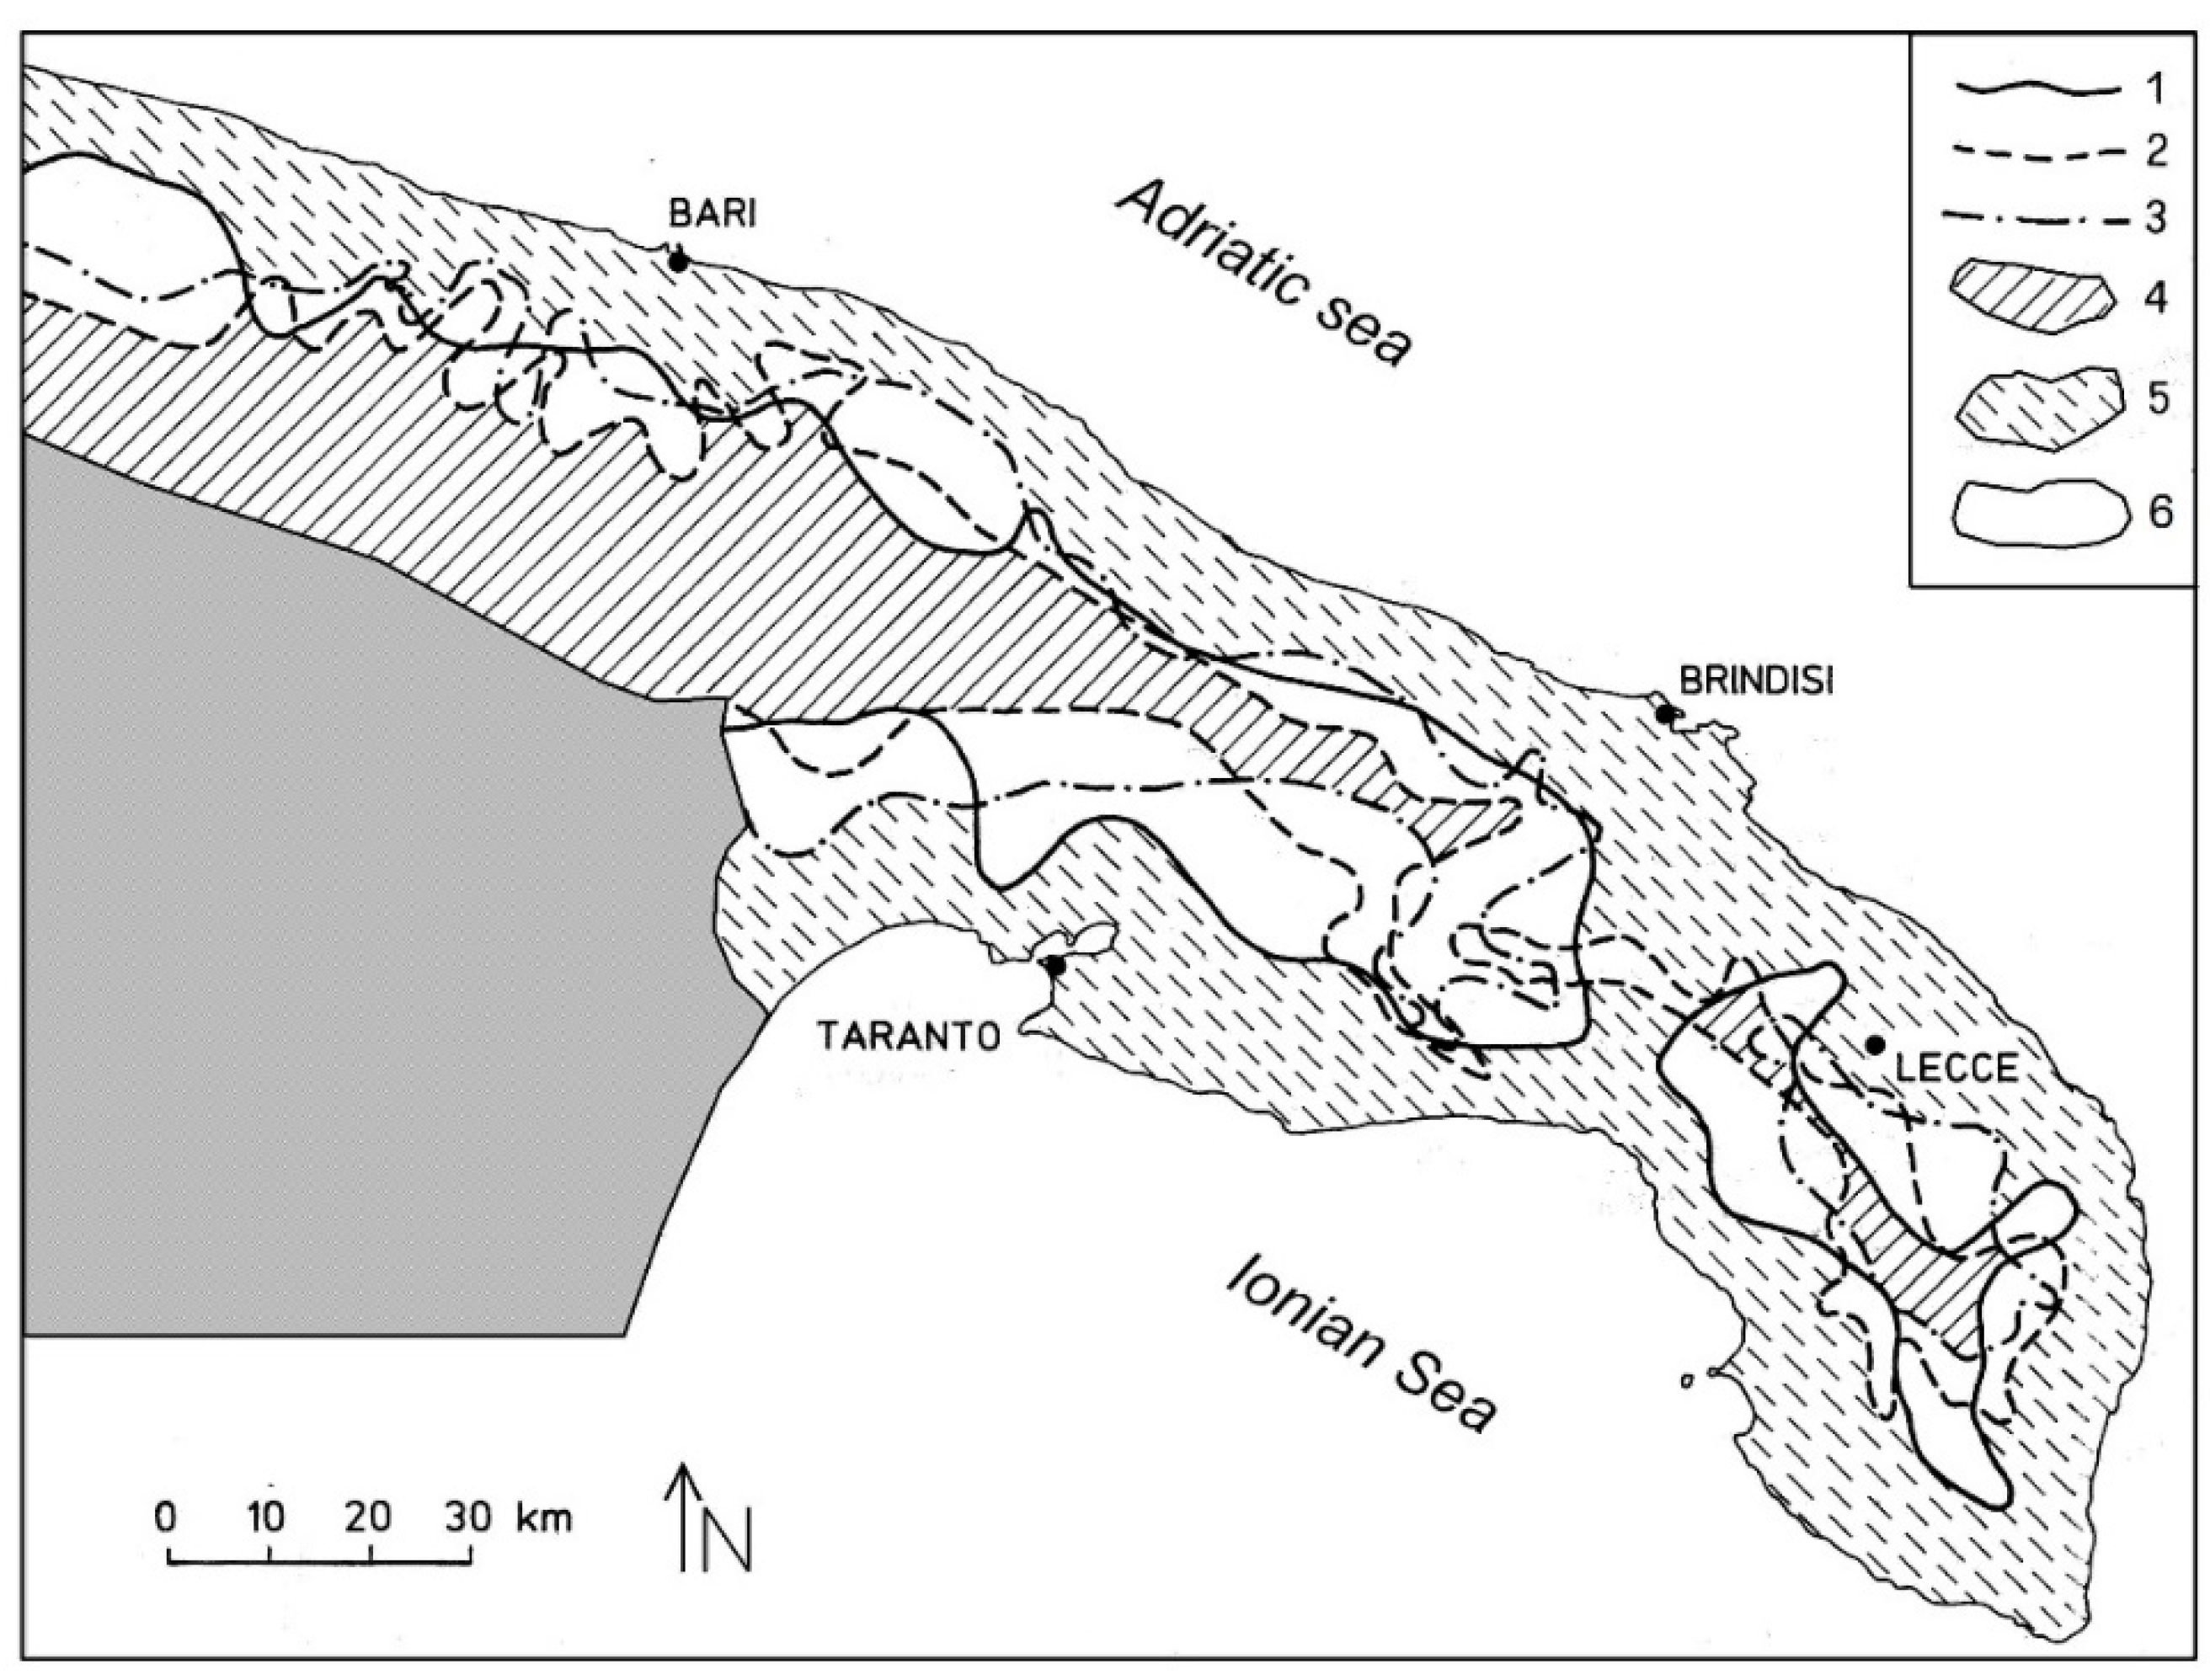
Multi-temporal spatial analysis was then performed on the basis of TCLs overlapping, considering the time variations from 1981 to 2003 (
Figure 9; the 2003 TCL was not plotted to simplify the figure reading). Three zones of the contour line were distinguished.
In the first zone or inland zone, salinity remained permanently below the threshold, indicating a low vulnerability to seawater intrusion [
18]. TCLs were always downward or on the boundary of this zone (between the zone and the coast). In the second or coastal zone, salinity was always above the threshold due to seawater intrusion, showing a high vulnerability to seawater intrusion; TCLs were always upward of this zone or on the boundary of this zone. In the third zone or intermediate zone, each point was spanned by TCLs over time.
The largest inland movement of TCL (worst salinization effects) was observed as an effect of huge drought periods, as in the case of the 1989 TCL, whereas a salinity or quality improvement was an effect of rainy periods, as in the case of the generalized seaward movement of the 1997 TCL [
11,
26,
27].
The first zone corresponds to a wide portion of inland Murgia and a narrow strip in the middle of the Salento peninsula; it had not been involved in seawater intrusion. The groundwater salinization can be considered a long-standing phenomenon in the second zone. In the third zone, salinity is highly sensitive to climate, the water cycle, exploitation variability and, predominantly, human management of groundwater resources.
This zonation was preliminarily validated using all available previous data, similar to how the analyzed groundwater samples were used to calculate the threshold value. Data of sufficient density to plot contour lines are not available after 2004, but available scattered data confirm the validity of the zonation approach.
Based on these results, some basic management criteria could be proposed.
As an example, discharge for drinking purposes could be increased in the inland zone considering a limitation rule based on the annual recharge (in any case, almost less than total recharge), operating on the basis of both the yearly recharge values and the statistical analysis of low recharge values. The discharge in the intermediate zone could be managed using two criteria: the discharge of the intermediate zone should be reduced or forced to be considerably lower in the residual part (not used in the inland zone) of the annual recharge and validated by monitoring salinity effects with the purpose of ensuring a buffer zone around the inland zone, in which the salinity should be maintained close to the threshold.
The discharge in the coastal zone should be authorized only for specific uses for which brackish or saline water is acceptable, as long as it does not cause negative economic or environmental effects. Saline water discharge should be encouraged if it entails positive effects on the pure fresh groundwater resources. In both cases, the effects of discharge in terms of degradation risks should be assessed in detail.
The discharge plan should be defined taking into account different discharge and recharge scenarios. In the intermediate and coastal zones, the discharge wells (number, location, geometry, and construction techniques) should be optimized on the basis of local hydrogeological characteristics. Each one of these rather simple proposals are still neglected by regulations.
8. Large-Scale Numerical Model Approach
In the previous section, basic management criteria were proposed on the basis of the TCL approach. The selected management criteria, which could be at the core of a future groundwater protection plan, should be defined by the management authority to determine measureable groundwater quality and quantity objectives (milestones) and conduct pre-validation and ongoing post-validation surveys. The pre-validation should be realized before the plan is applicable using numerical modeling to test the feasibility of the planned objectives based on future scenarios; the post-validation should be based on monitoring to check the ongoing feasibility of the planned objectives without plan adjustment.
Pre-validation and post-validation were not realized in the case of PLAN1 and PLAN2 by management authorities. Pre-validation in the case of large, deep, coastal, and karstic aquifers, which represent a very complex hydrogeological problem, is uncommon.
This research activity started with the purpose of demonstrating the feasibility of conducting pre-validation of the Apulian HSs by testing the future effects of current management criteria. For this purpose, SS-HS, the area undergoing the most significant degradation due to seawater intrusion,
i.e., southern Salento, was selected. An equivalent porous continuous medium (EPCM) was selected to be applied to SS-HS, as described by [
16]. The numerical codes used were MODFLOW [
35] and SEAWAT [
36] (the former was basically used in the initial phases for steady-state calculations and initial calibrations; the latter, which is a computer program designed to simulate three-dimensional variable-density groundwater flow, was used in the rest of the activities). The active domain of the study area (active cells) covered approximately 2300 km
2 with 45,925 cells. Vertically, the area was divided into 12 layers, from 214 to −350 m asl, to allow an accurate lithological and hydrogeological discretization. The thickness and geometry of the layers were defined based on 3D knowledge of the hydrogeological complexes.
The natural flow and salinity conditions were calculated using a steady state model, calibrated with mean historical data of the 1930s, a period in which the level of discharge was so low that it was considered negligible; these steady-state results could be considered as natural groundwater conditions and are used as a reference to assess the following modifications. Piezometric and salinity variations from 1930 to 2060 were simulated under three past scenarios (up to 1999) and three future scenarios of climate change to test different hypotheses regarding discharge for different types of utilization, and changes in sea level and salinity. The model was validated using surveyed piezometric and salinity data of different decades.
The past scenario results confirmed the piezometric lowering and the salinization worsening not only due to the lateral seawater intrusion but mainly due to upconing caused by groups of drinking wells [
2,
37].
Based on the reliable “A1B scenario” model [
13], rainfall was predicted to decrease: equal to −3.9%, −5.9%, and−9% of the 1960–1980 mean value for the periods of 2000–2020 (future scenario F1), 2021–2040 (F2), and 2041–2060 (F3), respectively. Mean temperature increases, ranging from 0.9 °C for F1 to 2.4 °C for F3, were predicted. Based on these results, the amount of annual recharge was calculated. As groundwater discharge cannot be predicted, a steady discharge level for all uses at the level of 2000 was hypothesized for each future scenario, which is almost equal to the discharge values observed from the implementation of PLAN2 (2009). This hypothesis is approximate and will likely underestimate the future well discharge if adaptation measures are not implemented, as is currently the case.
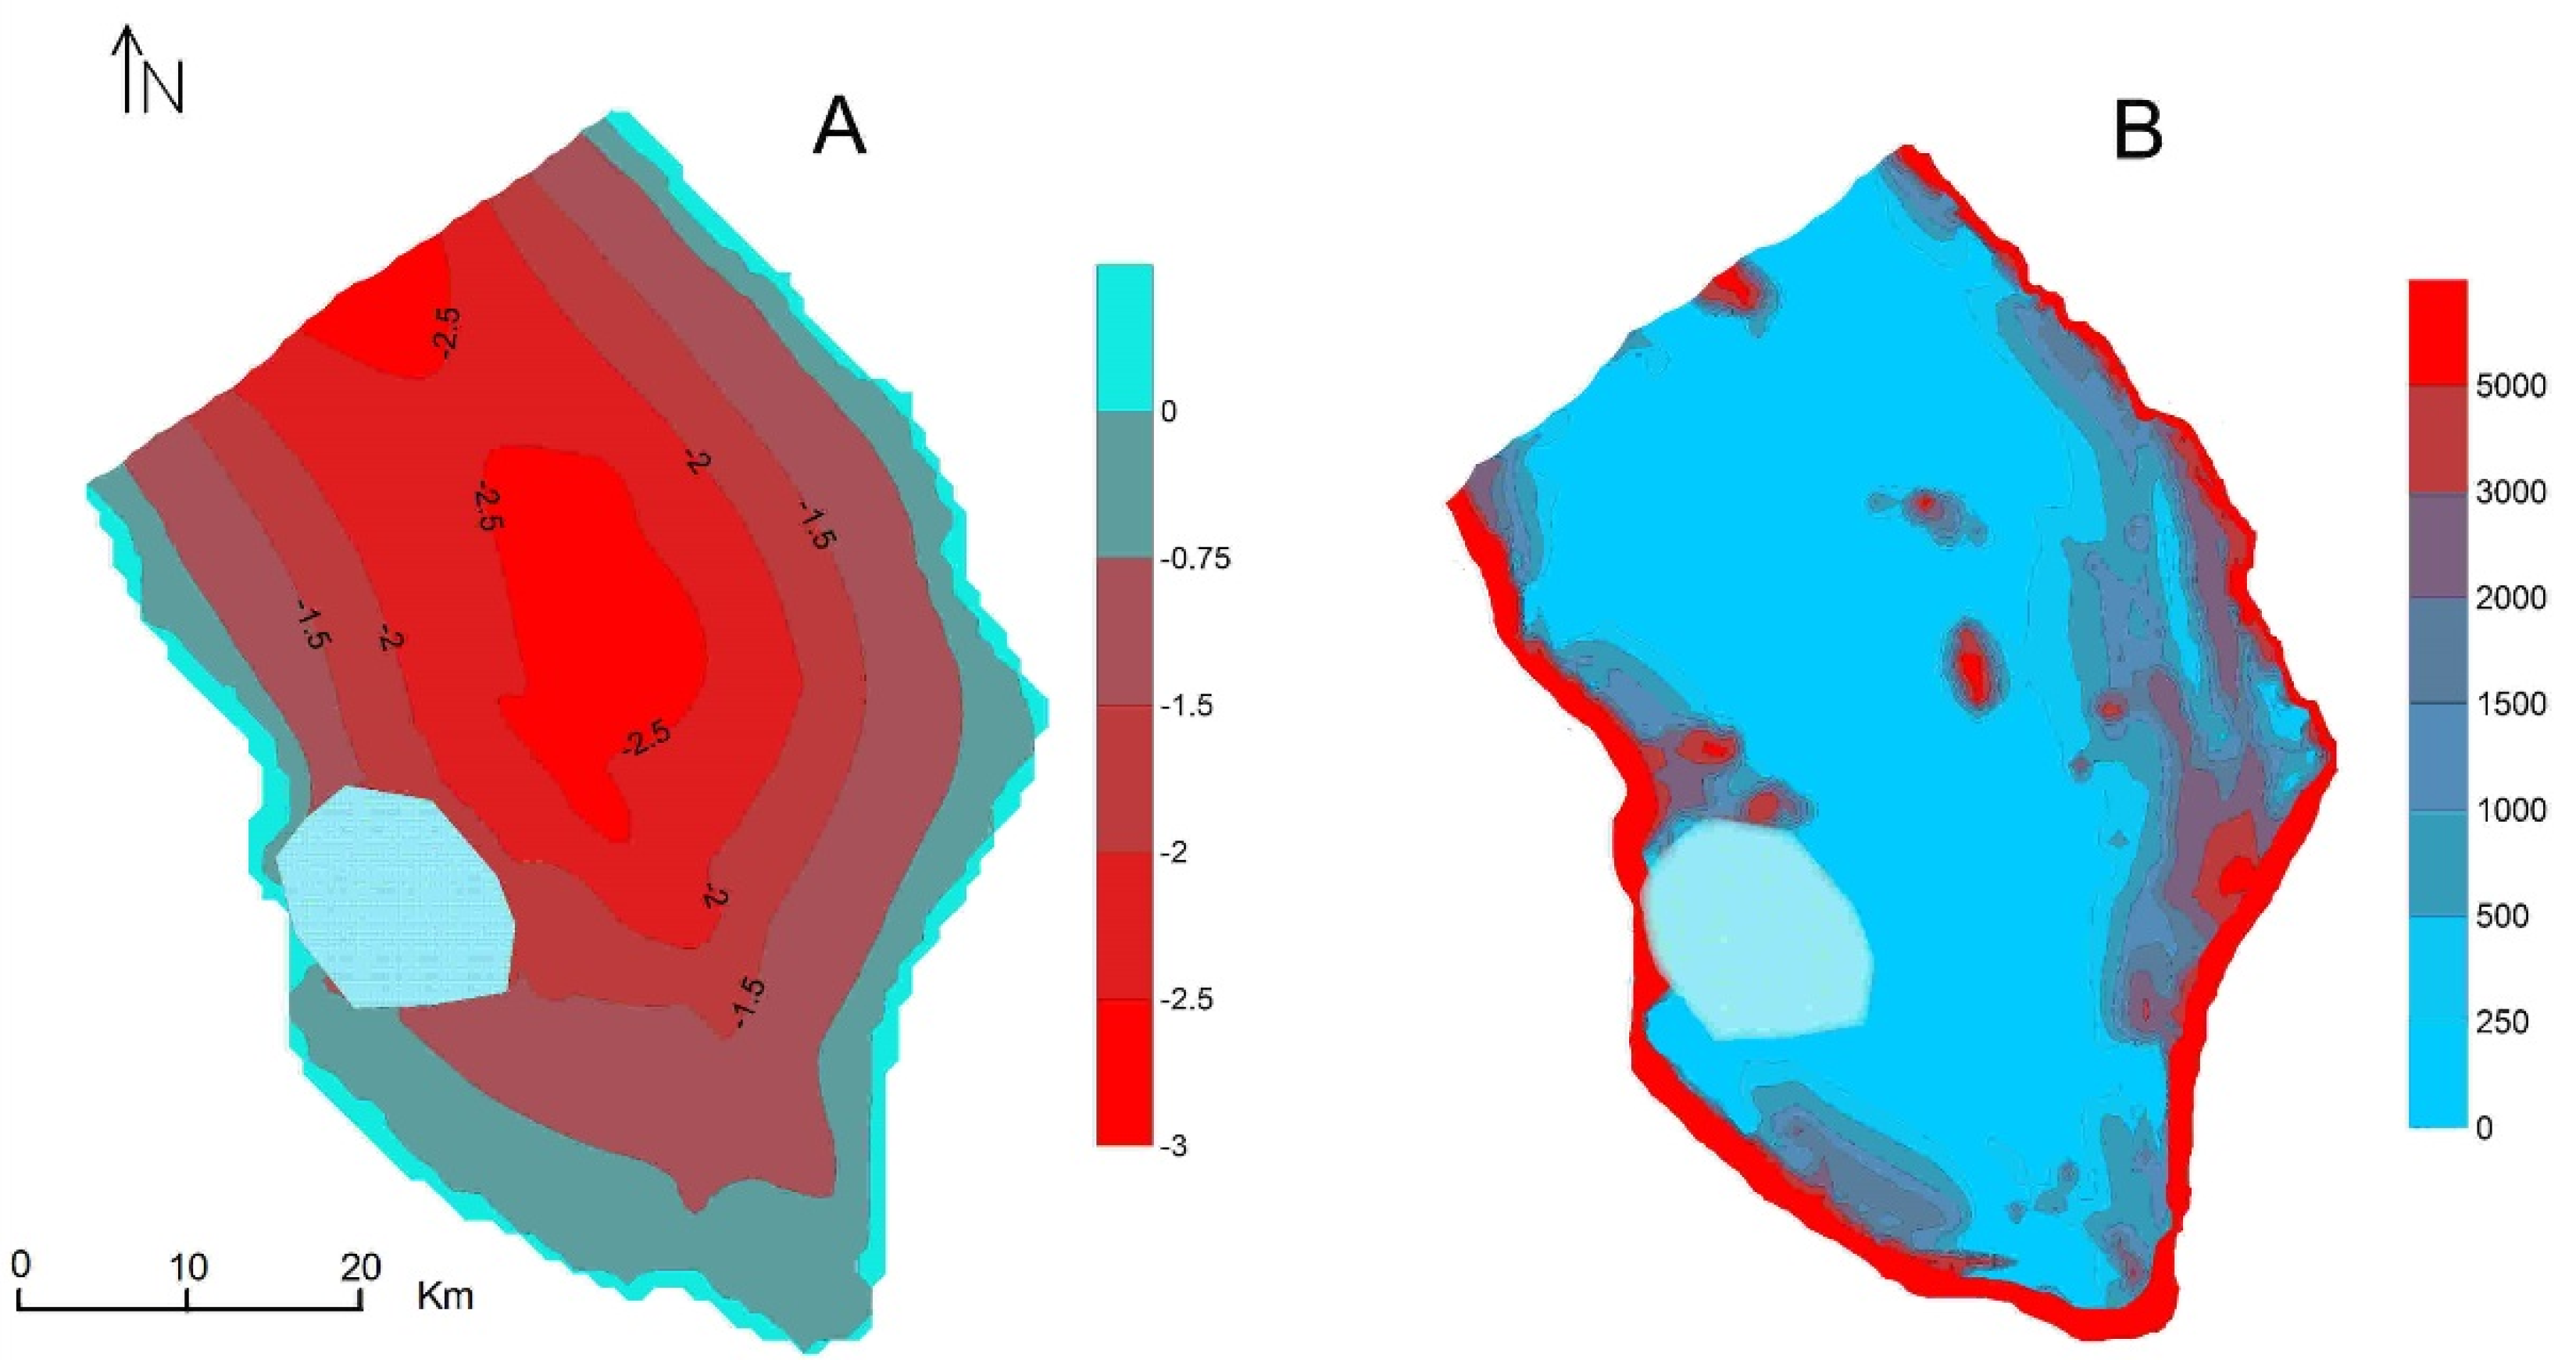
Continuing the application of current management criteria, which do not consider the physical characteristics of seawater intrusion and the need of adaption measures to regulate the discharge (to be almost lower than the recharge), could cause effects similar to those observed in
Figure 10 (the displayed layer was selected because it includes the transition zone between pure fresh groundwater and saline water over a large portion of the aquifer, far from the coast), in which the results of the final year of the future simulation are summarized.
A dramatic piezometric decrease of more than 2.5 m was predicted in 2060 compared to steady-state or natural conditions (
Figure 10A). The predicted 2060 salinity shows a huge increase from steady-state conditions, greater than 5000 mg/L in wide areas (
Figure 10B). This increase was predicted along the coastal zone, particularly in the western Ionian area, but also far from the coast. In the latter case, the increase and the consequent dramatic effects on drinking water resources are due to the enlargement and worsening of the upconing phenomenon, which can be observed around groups of drinking wells.
An evident piezometric drop was confirmed for the past; a similar dramatic drop appears to be likely in the future. The lateral intrusion and upconing effects of seawater intrusion were non-negligible in the past and will be considerable in the future. All phenomena considered here, including sea level and sea salinity, exhibited not negligible effects on coastal groundwater.
9. Conclusions
Decades of surveys and studies on large karstic coastal aquifers were summarized to offer an overview of efforts to pursue the sustainable utilization of the main natural resources of a karstic coastal Italian region.
The main results show the progressive degradation of Apulian groundwater resources, both in terms of quality and quantity. The methods and approaches described were designed and tested to be proposed to support decision makers to adopt decisions useful for the purpose of maximizing the groundwater utilization to ensure the steady availability and quality of groundwater resources. Future research developments will be finalized on the proposal of management criteria, including those described in this paper, which are optimized using the pre-validation approach, together with other potential criteria based on adaptation strategies focused on agricultural uses, the greatest type of water demand in this Mediterranean region.


