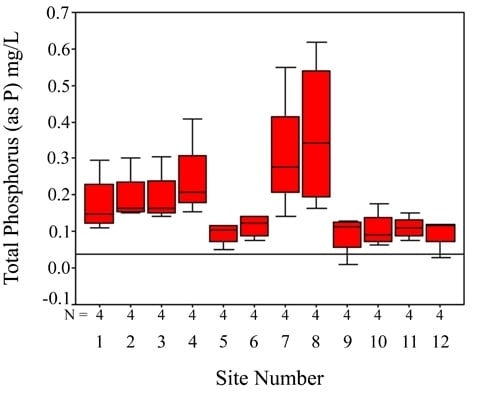
Past, Present, and Future Nutrient Quality of a Small Southeastern River: A Pre-Dam Assessment
Abstract
:1. Introduction
2. Materials and Methods
2.1. Study Area
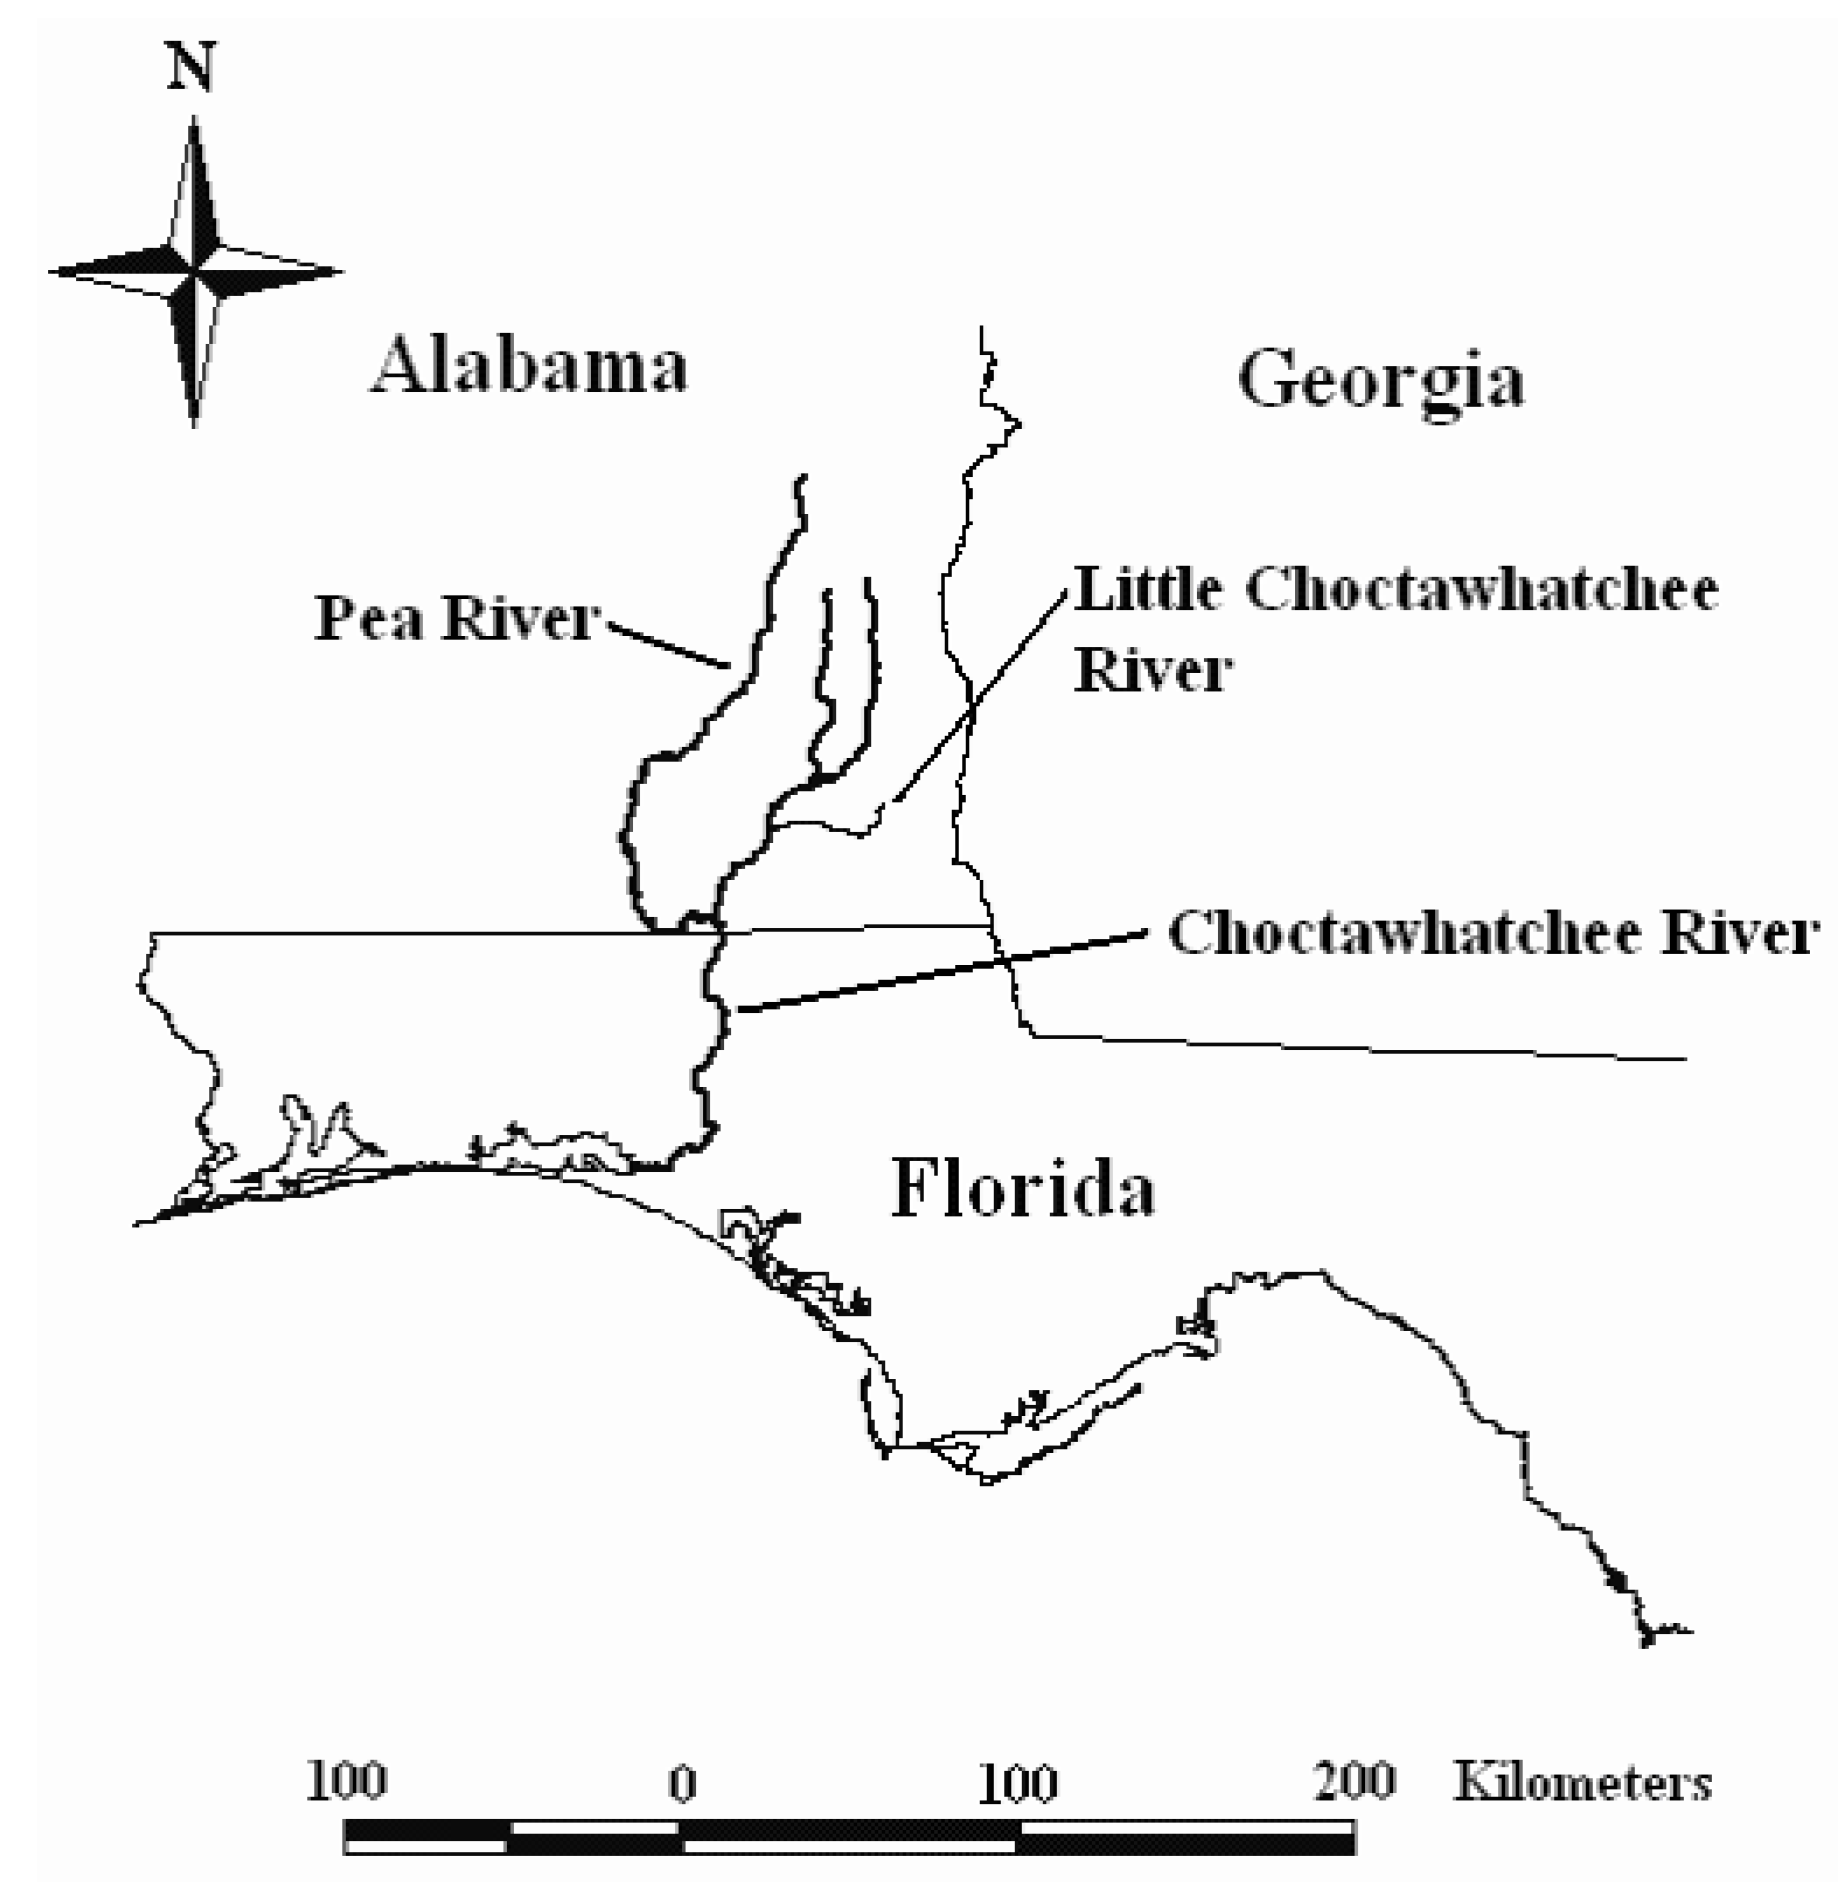
2.2. Nutrient Sample Collection and Analysis
2.3. Data Analysis
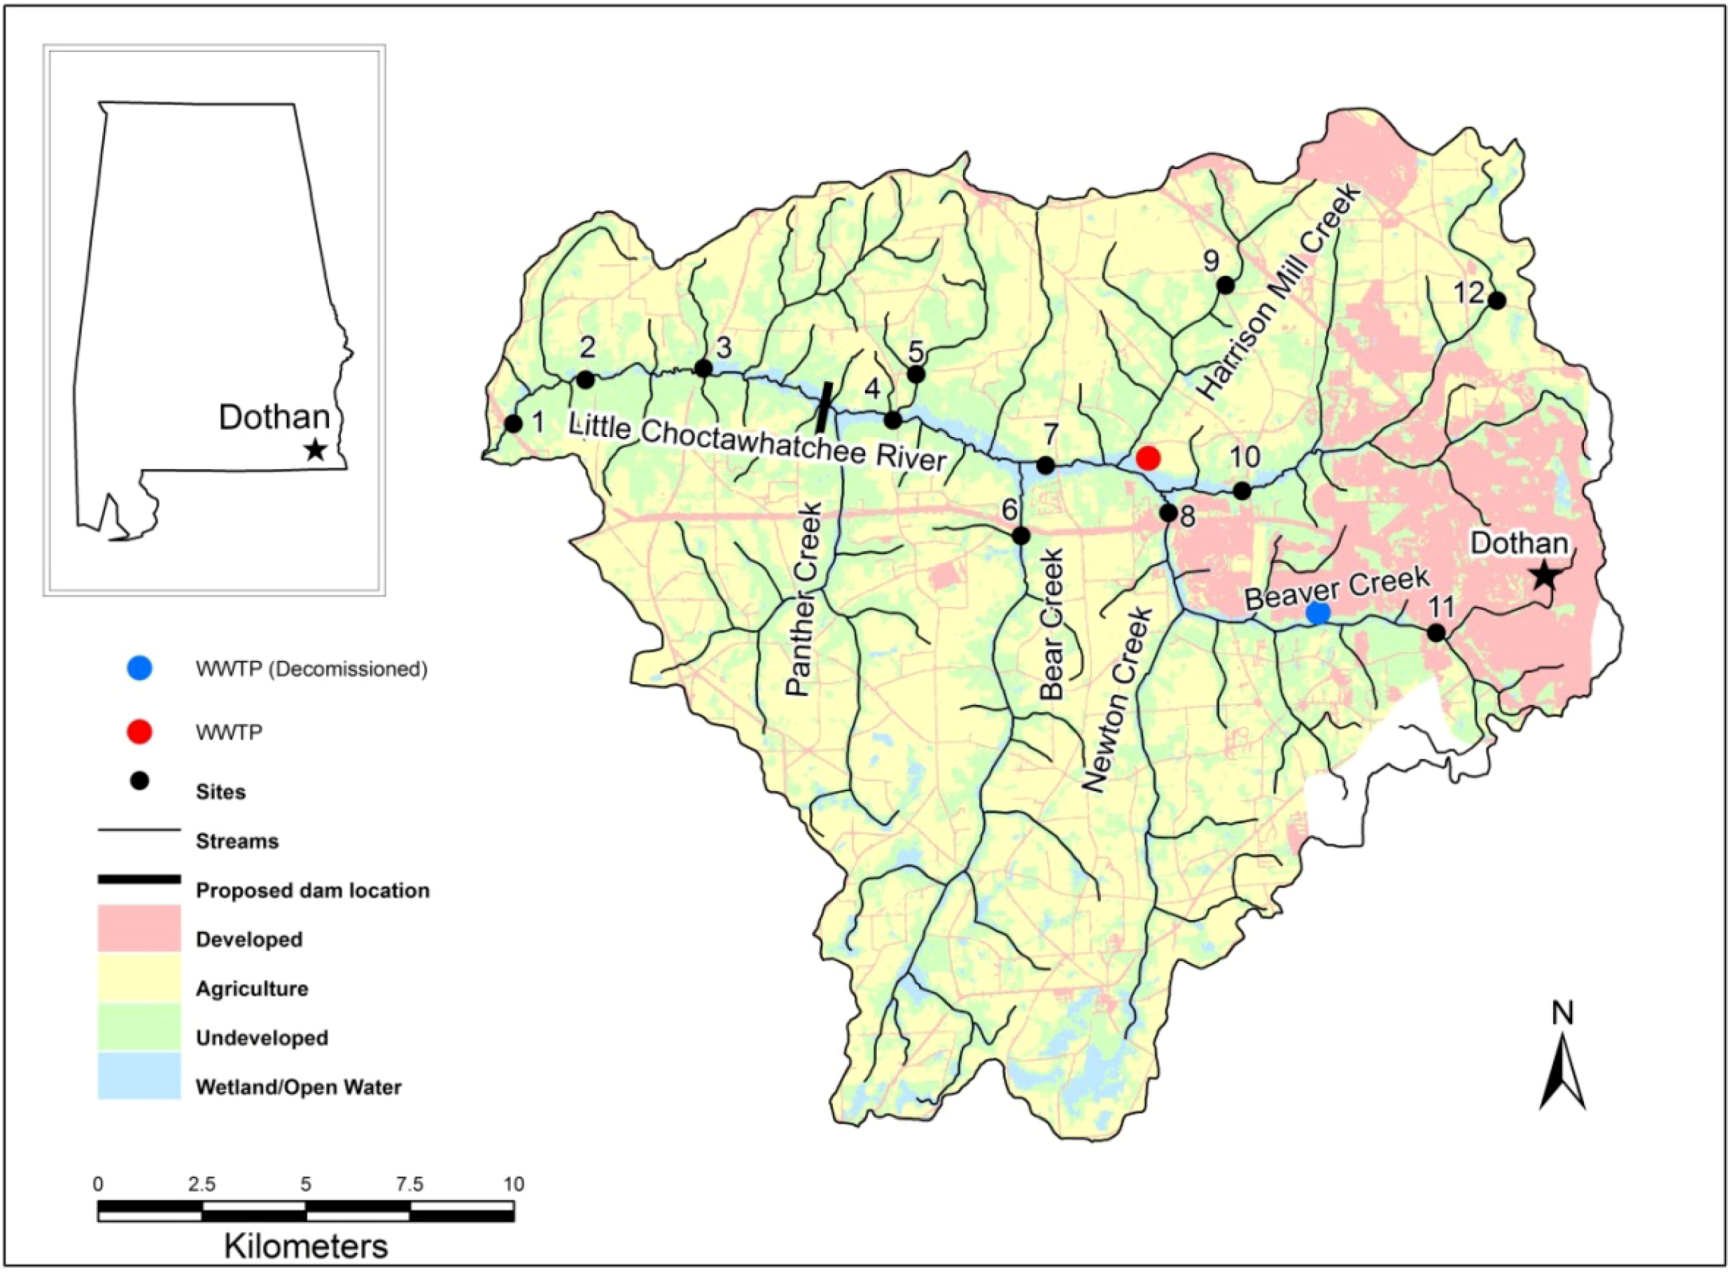
3. Results
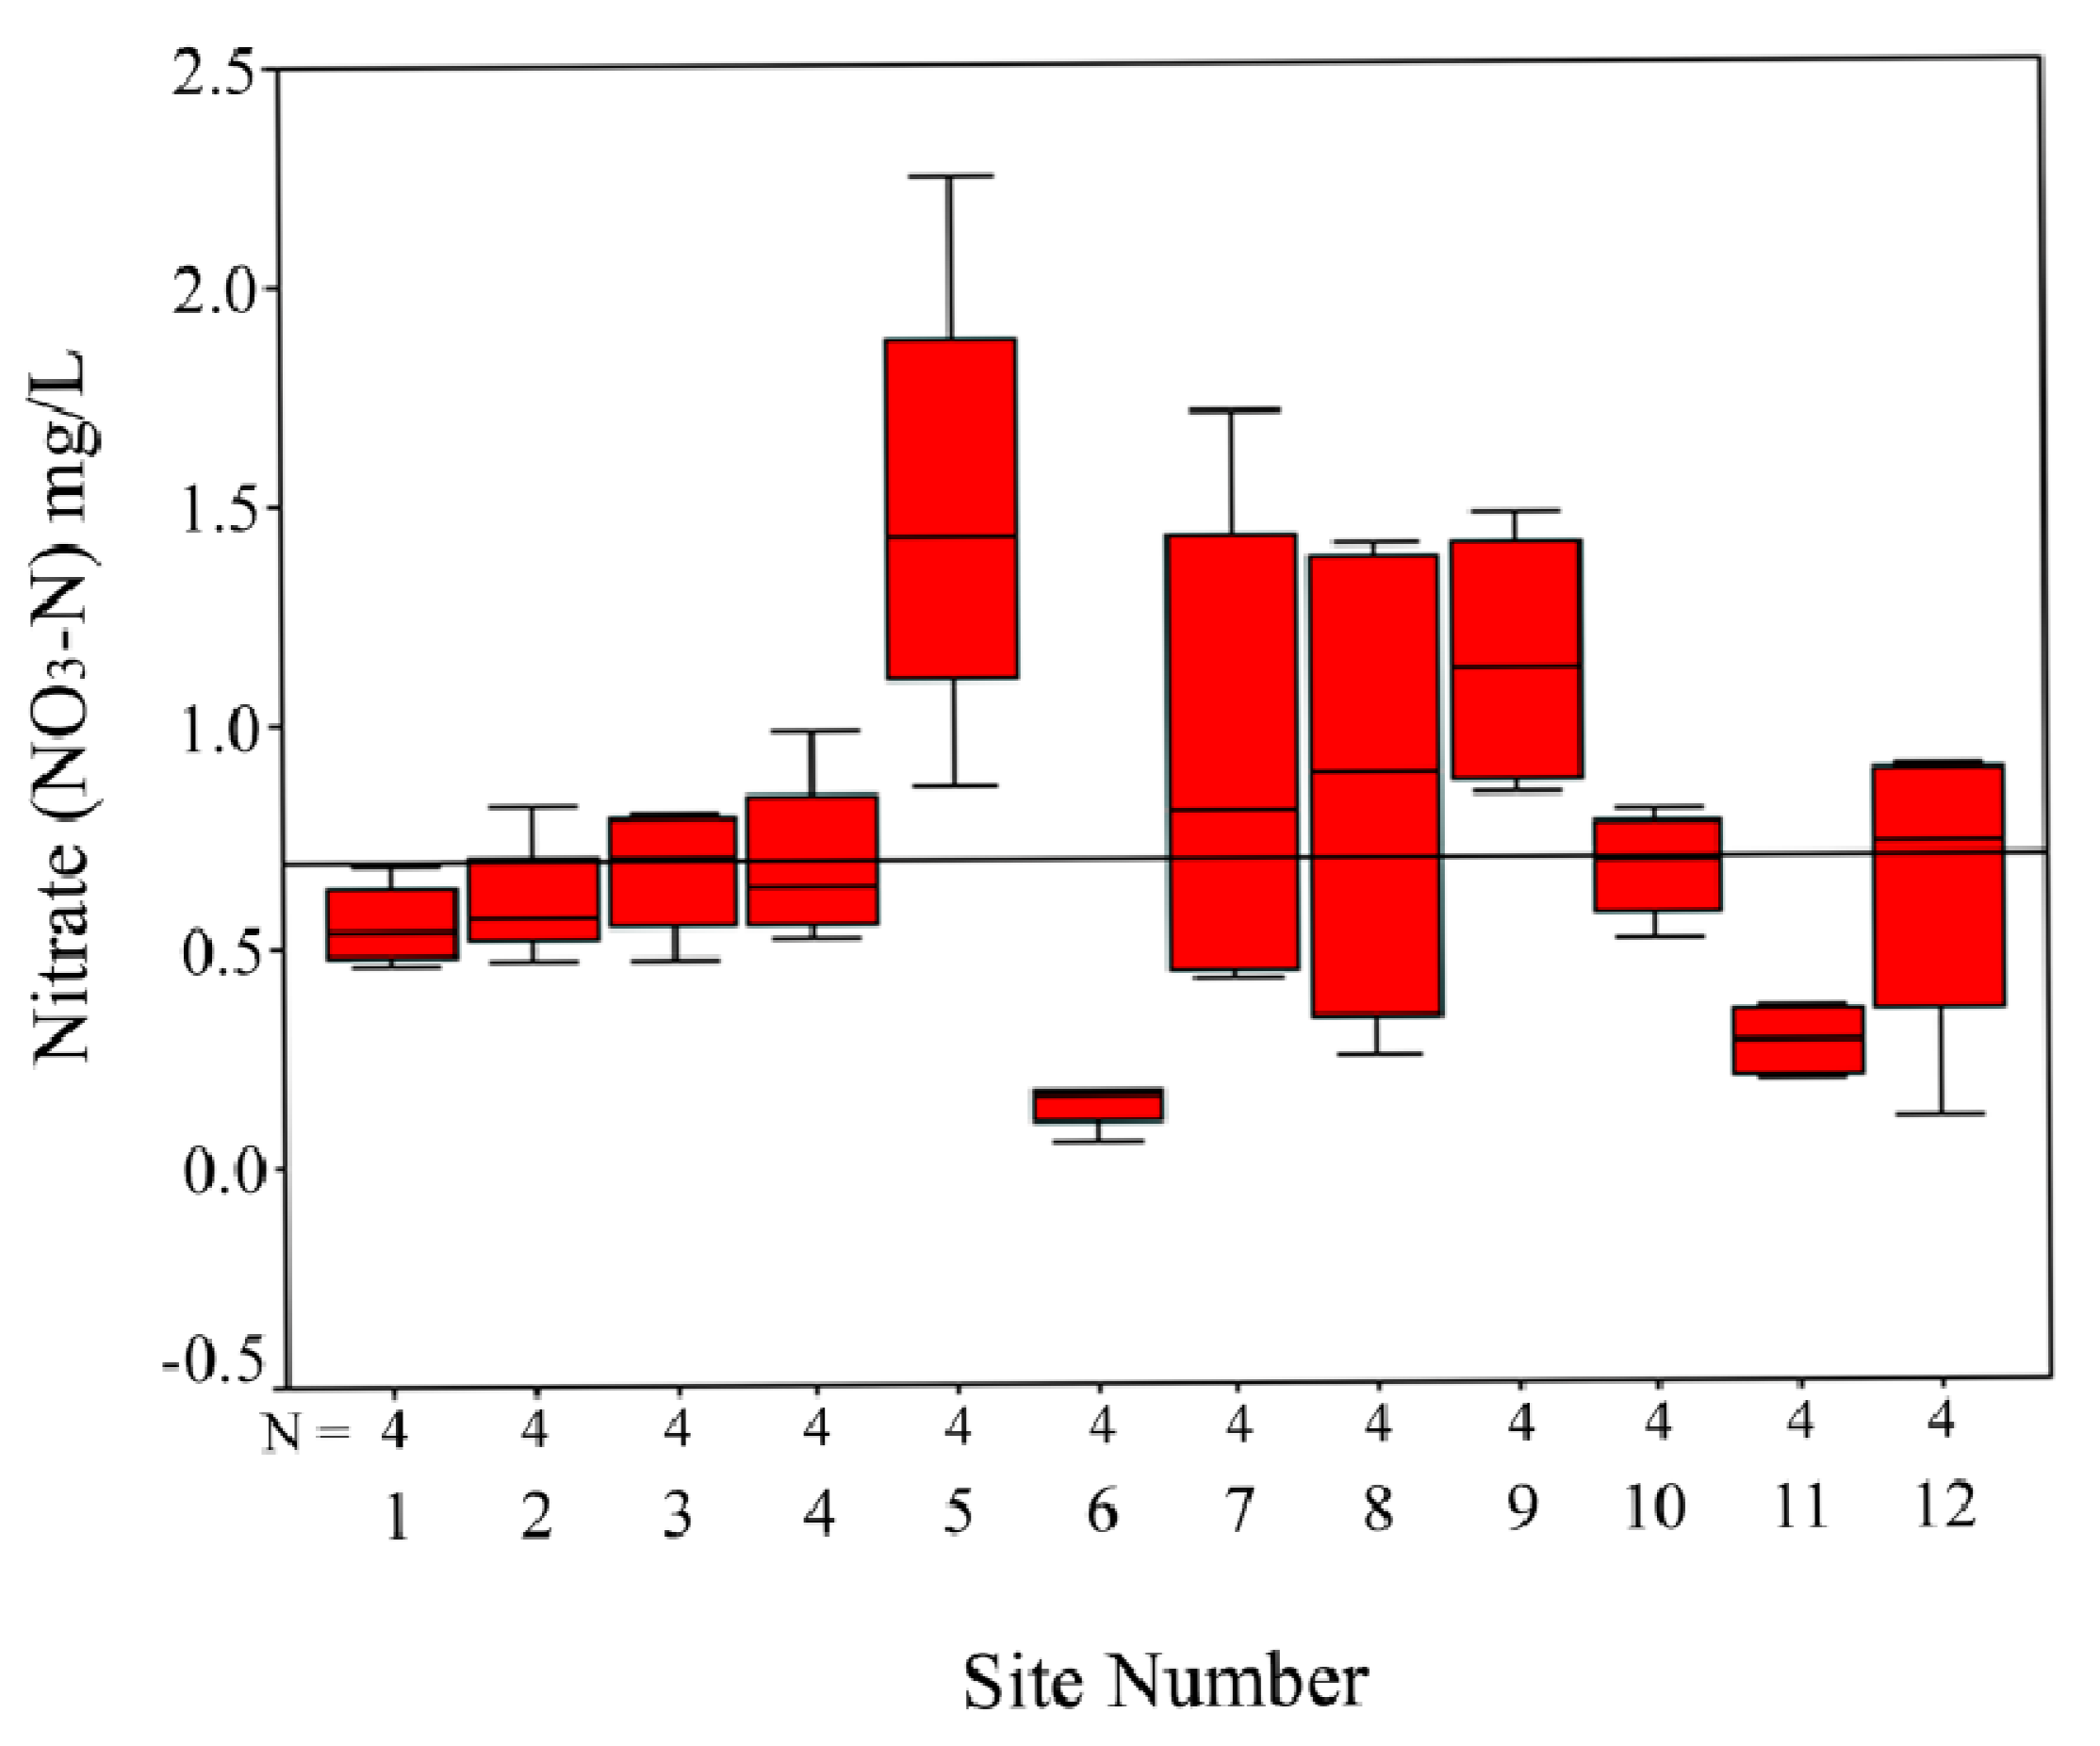
3.1. Recent and Seasonal Condition of the LCR Watershed
| Nutrients by Season | Mean (mg/L) | Median (mg/L) | Variance (mg/L) | Minimum (mg/L) | Maximum (mg/L) |
|---|---|---|---|---|---|
| Fall (7 October 2007) | |||||
| TP | 0.274 | 0.236 | 0.031 | 0.09 | 0.62 |
| OP | 0.146 | 0.103 | 0.019 | 0.01 | 0.39 |
| NO3 | 0.838 | 0.825 | 0.230 | 0.05 | 1.71 |
| Winter (8 January 2008) | |||||
| TP | 0.135 | 0.139 | <0.001 | 0.10 | 0.16 |
| OP | 0.049 | 0.033 | 0.002 | <0.01 | 0.12 |
| NO3 | 0.618 | 0.630 | 0.138 | 0.10 | 1.47 |
| Spring (4 April 2008) | |||||
| TP | 0.150 | 0.134 | 0.004 | 0.08 | 0.28 |
| OP | 0.100 | 0.096 | 0.004 | <0.01 | 0.23 |
| NO3 | 0.552 | 0.510 | 0.126 | 0.20 | 1.50 |
| Summer (29 June 2008) | |||||
| TP | 0.141 | 0.093 | 0.016 | <0.02 | 0.46 |
| OP | 0.093 | 0.059 | 0.009 | 0.01 | 0.33 |
| NO3 | 0.864 | 0.710 | 0.347 | 0.16 | 2.25 |
| Mean/Year 2007–2008 | |||||
| TP | 0.1750 | 0.142 | 0.015 | <0.02 | 0.62 |
| OP | 0.0969 | 0.059 | 0.009 | <0.01 | 0.39 |
| NO3 | 0.7177 | 0.600 | 0.216 | 0.05 | 2.25 |

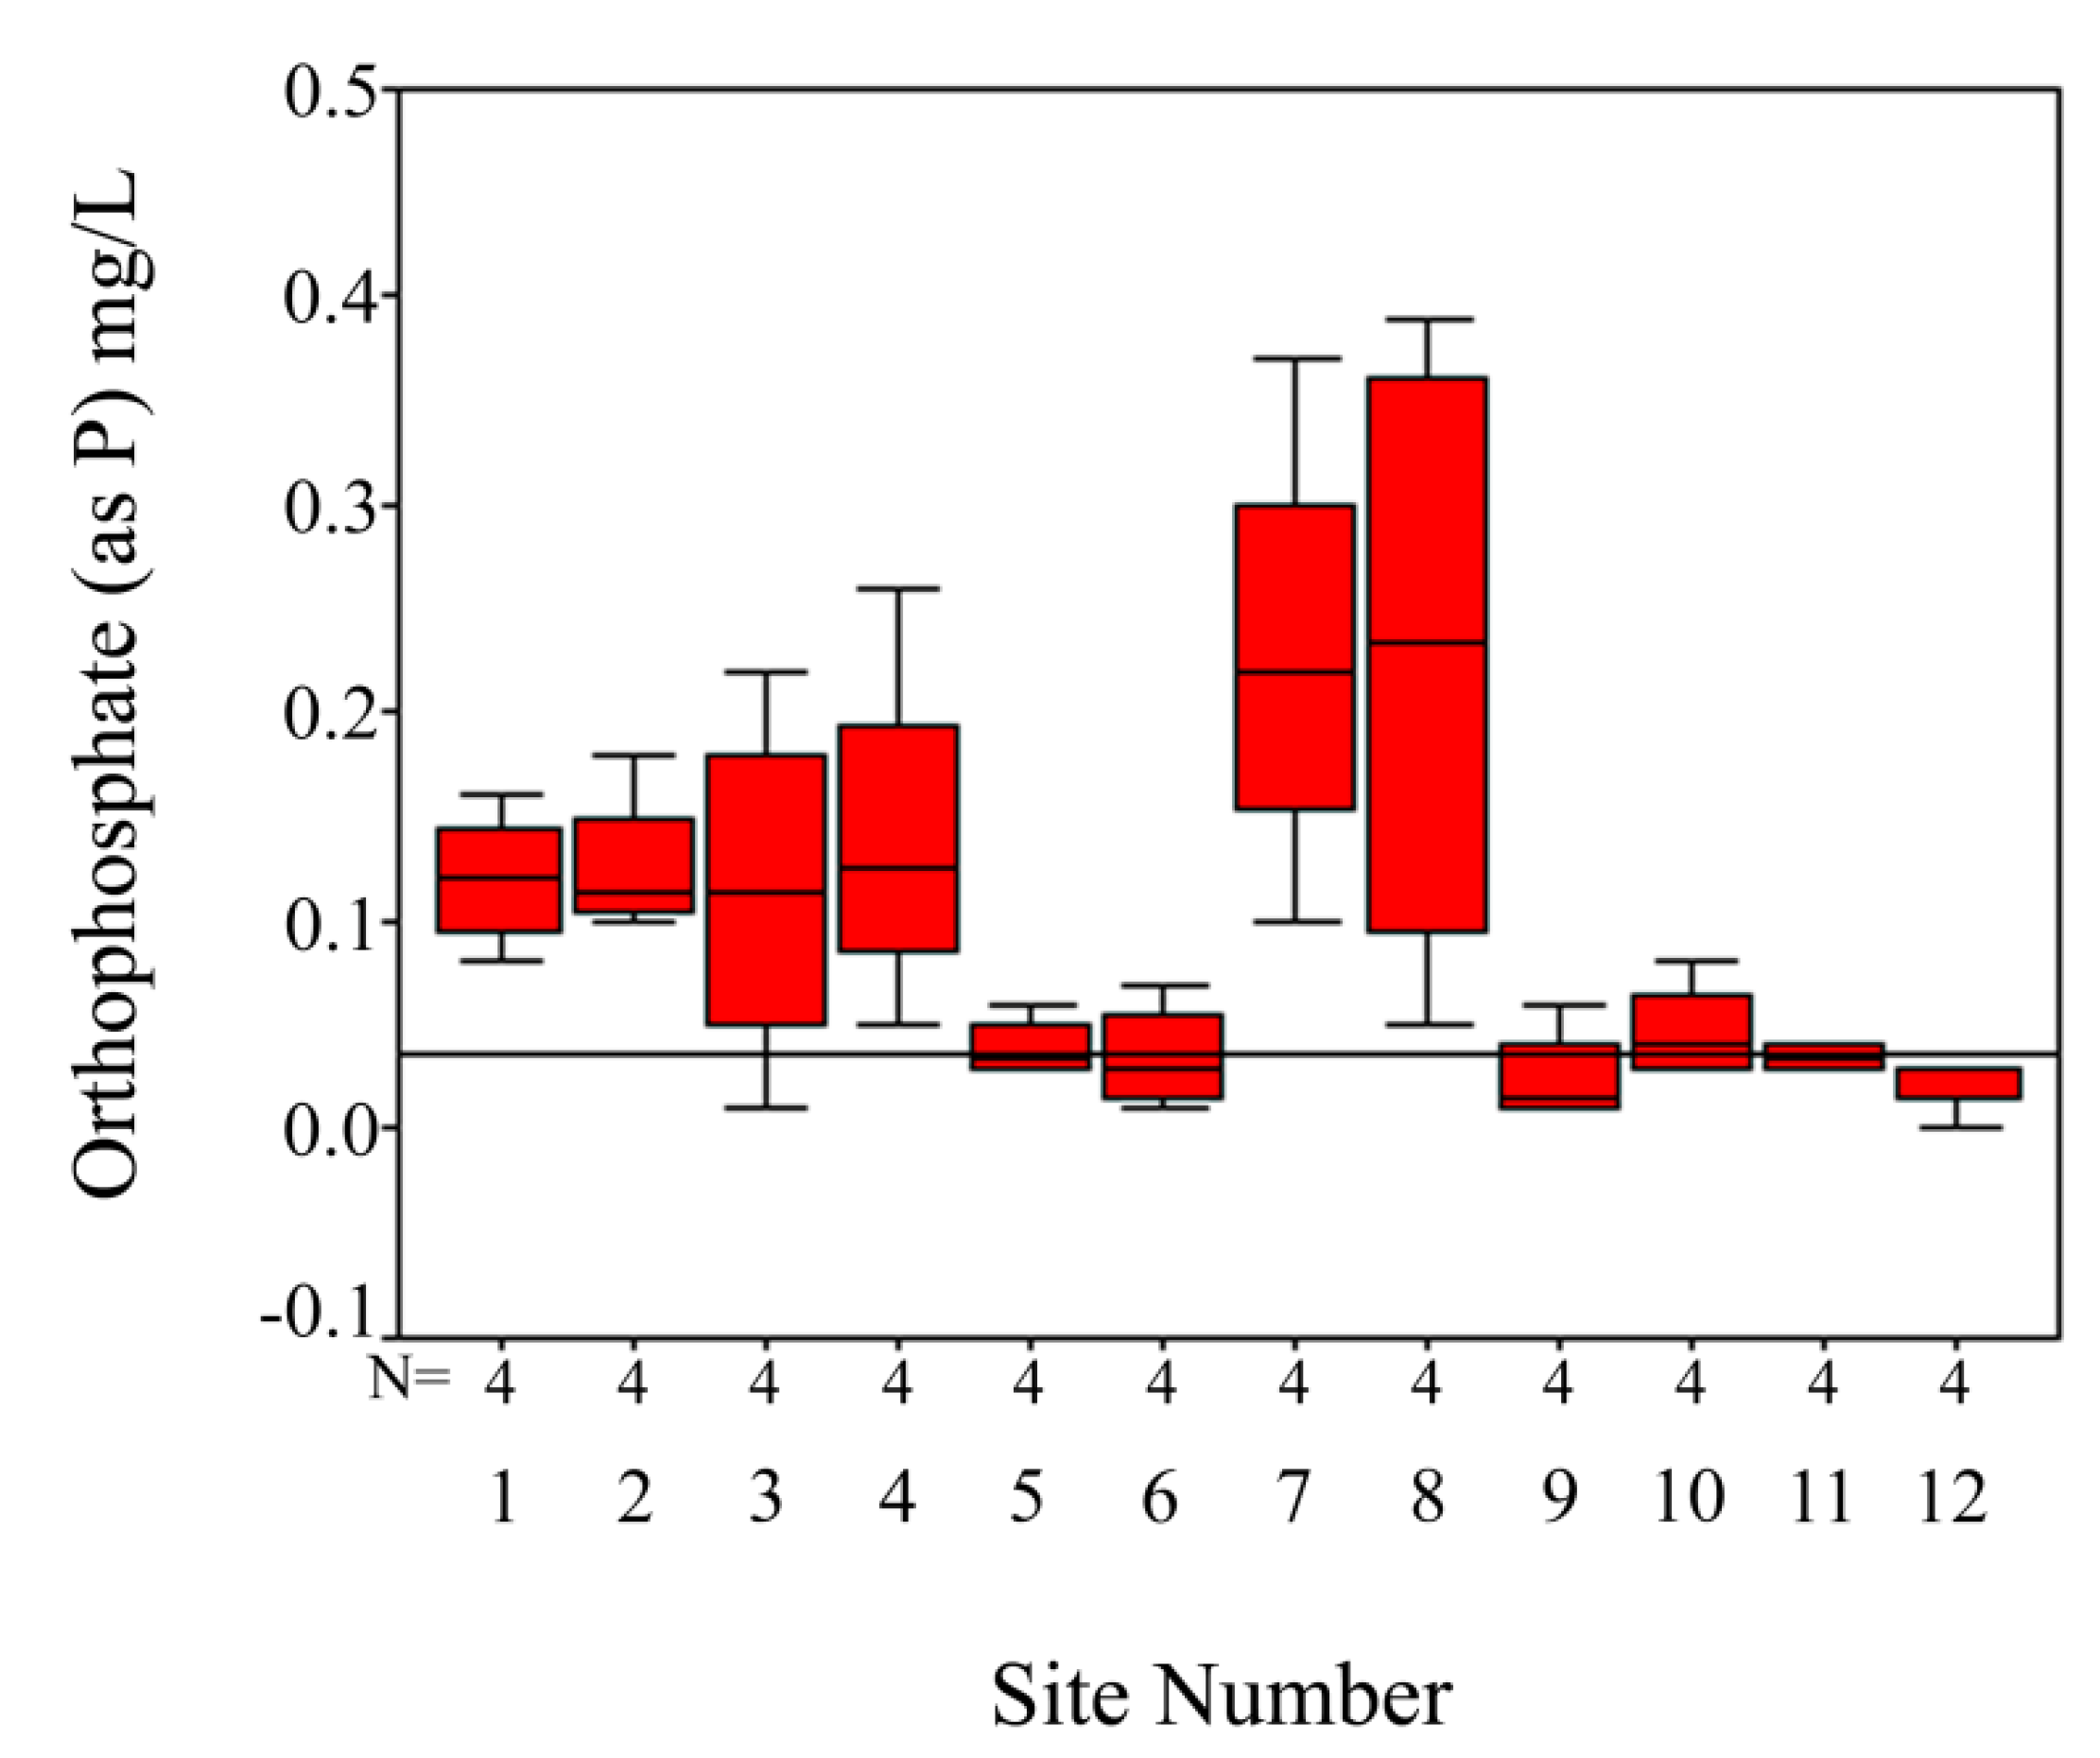
3.2. Comparison to Past LCR Nutrient Data
| Source | Sample Year | TP | Site 1 | Site 4 | Site 5 | Site 6 | Site 8 | Site 10 | Site 11 | Site 12 |
|---|---|---|---|---|---|---|---|---|---|---|
| ADEM [24] | 1999 | Min | 0.19 | |||||||
| Max | 0.91 | |||||||||
| Mean | 0.48 | |||||||||
| Mullen (PE) [21] | 1999–2003 | Min | BDL | 0.02 | 0.03 | 0.15 | BDL | |||
| Max | 0.22 | 0.18 | 0.12 | 0.24 | 0.13 | |||||
| Mean | 0.13 | 0.14 | 0.08 | 0.19 | 0.06 | |||||
| Mullen (CERS) [21] | 1999–2003 | Min | 0.15 | 0.20 | 0.11 | 0.23 | 0.07 | |||
| Max | 0.54 | 0.58 | 0.21 | 0.31 | 0.18 | |||||
| Mean | 0.29 | 0.32 | 0.17 | 0.26 | 0.13 | |||||
| Sawyer et al. [10] | 2001 | Value | 0.73 | |||||||
| Heath [20] | 2004 | Value | 0.61 | 0.76 | ||||||
| ADEM [24] | 2004 | Min | 0.04 | |||||||
| Max | 0.29 | |||||||||
| Mean | 0.18 | |||||||||
| ADEM [24] | 2005 | Min | 0.03 | |||||||
| Max | 0.26 | |||||||||
| Mean | 0.16 | |||||||||
| Chakravarty [23] | 2006–2007 | Min | 0.12 | 0.20 | 0.09 | |||||
| Max | 0.36 | 0.34 | 0.38 | |||||||
| Mean | 0.23 | 0.27 | 0.18 | |||||||
| Our Study | 2007–2008 | Min | 0.11 | 0.15 | 0.05 | 0.08 | 0.16 | 0.06 | 0.08 | 0.03 |
| Max | 0.30 | 0.41 | 0.12 | 0.14 | 0.62 | 0.18 | 0.15 | 0.12 | ||
| Mean | 0.18 | 0.24 | 0.10 | 0.12 | 0.37 | 0.11 | 0.11 | 0.10 | ||
| Cook et al. [19] | 2009–2010 | Min | BDL | BDL | BDL | BDL* | BDL* | |||
| Max | 0.13 | 0.06 | 0.05 | 0.74 | 0.04 | |||||
| Mean | 0.06 | 0.02 | 0.02 | 0.36 | 0.02 |
| Source | Sample Year | OP | Site 1 | Site 4 | Site 5 | Site 6 | Site 8 | Site 10 | Site 11 | Site 12 |
|---|---|---|---|---|---|---|---|---|---|---|
| Mullen [21] | 1999–2003 | Min | BDL | BDL | BDL | 0.08 | BDL | |||
| Max | 0.22 | 0.14 | 0.11 | 0.23 | 0.10 | |||||
| Mean | 0.08 | 0.07 | 0.06 | 0.14 | 0.04 | |||||
| Sawyer et al. [10] | 2001 | Value | 0.11 | |||||||
| Heath [20] | 2004 | Value | 0.11 | 0.09 | ||||||
| Our Study | 2007–2008 | Min | 0.08 | 0.05 | 0.03 | 0.01 | 0.05 | 0.03 | 0.03 | BDL |
| Max | 0.16 | 0.26 | 0.06 | 0.07 | 0.39 | 0.08 | 0.04 | 0.03 | ||
| Mean | 0.12 | 0.14 | 0.04 | 0.04 | 0.23 | 0.05 | 0.03 | 0.03 |
| Source | Sample Year | NO3 | Site 1 | Site 4 | Site 5 | Site 6 | Site 8 | Site 10 | Site 11 | Site 12 |
|---|---|---|---|---|---|---|---|---|---|---|
| ADEM [24] | 1999 | Min | 0.17 | |||||||
| Max | 2.56 | |||||||||
| Mean | 1.33 | |||||||||
| Mullen (PE) [21] | 1999–2003 | Min | 0.82 | 0.72 | 0.90 | 1.12 | 0.98 | |||
| Max | 3.58 | 4.09 | 1.06 | 1.69 | 3.42 | |||||
| Mean | 1.80 | 1.81 | 0.97 | 1.42 | 1.96 | |||||
| Mullen (CERS) [21] | 1999–2003 | Min | 0.40 | 0.80 | 0.30 | 1.00 | 0.80 | |||
| Max | 1.70 | 1.70 | 0.50 | 1.30 | 1.30 | |||||
| Mean | 1.20 | 1.30 | 0.40 | 1.20 | 0.90 | |||||
| Sawyer et al. [10] | 2001 | Value | 2.00 | |||||||
| Heath [20] | 2004 | Value | 0.30 | 1.10 | ||||||
| ADEM [24] | 2004 | Min | 0.50 | |||||||
| Max | 3.40 | |||||||||
| Mean | 1.60 | |||||||||
| ADEM [24] | 2005 | Min | 0.29 | |||||||
| Max | 2.12 | |||||||||
| Mean | 0.95 | |||||||||
| Our Study | 2007–2008 | Min | 0.46 | 0.52 | 0.86 | 0.05 | 0.24 | 0.51 | 0.18 | 0.10 |
| Max | 0.68 | 0.99 | 2.25 | 0.16 | 1.41 | 0.80 | 0.35 | 0.90 | ||
| Mean | 0.56 | 0.69 | 1.49 | 0.13 | 0.86 | 0.67 | 0.27 | 0.61 | ||
| Cook et al. [19] | 2009–2010 | Min | BDL | 0.7 | 0.3 | 0.1* | 0.4* | |||
| Max | 5.7 | 2.3 | 1.9 | 3.6 | 1.5 | |||||
| Mean | 1.7 | 1.9 | 0.6 | 1.3 | 1.0 |
| Source | Sample Year | TP | OP | NO3 | No. Sites |
|---|---|---|---|---|---|
| Mullen [22] | 1999–2003 | 0.29 | 0.07 | 0.74 | 10 |
| Sawyer et al. [10] | 2001 | 0.77 | 0.13 | 0.66 | 49 |
| Heath [20] | 2004 | 0.60 | 0.29 | 0.54 | 44 |
| Chakravarty [23] | 2006–2007 | 0.24 | N/A | N/A | 48 |
| Our Study | 2007–2008 | 0.18 | 0.10 | 0.72 | 12 (4 seasons) |
3.3. Comparison to Regional Data
| Rivers of Alabama | Location | Mean TP Concentrations (mg/L) |
|---|---|---|
| Little Choctawhatchee River drainage (our study) | (12 sites) throughout drainage | 0.18 |
| Alabama River McPherson et al. [25] | Claiborne, Alabama | 0.09 |
| Black Warrior River McPherson et al. [25] | Below Bankhead Lock and Dam near Bessemer, Alabama | 0.80 |
| Bogue Chitto Creek McPherson et al. [25] | Memphis, Alabama | 1.07 |
| Cahaba River McPherson et al. [25] | Centreville, Alabama | 0.21 |
| Chattooga River McPherson et al. [25] | Above Gaylesville, Alabama | 0.14 |
| Cahaba Valley Creek McPherson et al. [25] | Cross Creek Road at Pelham, Alabama | 0.14 |
| Pintlalla Creek McPherson et al. [25] | Liberty Church Road near Pintlalla, Alabama | 0.15 |
| Threemile Branch McPherson et al. [25] | North Boulevard at Montgomery, Alabama | 0.22 |
| Tombigee River McPherson et al. [25] | Below Coffeeville Lock and Dam near Coffeeville, Alabama | 0.14 |
| Choctawhatchee Watershed Chakravarty [23] | (48 sites) throughout drainage | 0.24 |
| Other U.S. Rivers | ||
| Smith et al. [27] | 381 U.S. riverine sites (1974 to 1981) | 0.13 |
| Spruill et al. [28] | Albemarle-Pamlico Basin of North Carolina and Virginia (1992 to 1995) | 0.05 |
| Kleiss et al. [29] | Mississippi River (1984 to 1993) | 0.16 |
| Kleiss et al. [29] | Yazoo River, Mississippi (1984 to 1993) | 0.26 |
| Atkins et al. [30] | Mobile River Basin, Alabama (1998 to 1999) | 0.10 |
3.4. Comparison to Nutrient Criteria
4. Discussion
4.1. Recent and Seasonal Condition of the LCR Watershed
4.2. Comparison to Historical Data
4.3. Comparison to Regional Data
4.4. Comparison to Nutrient Criteria
4.5. Future Consideration of Potential Reservoir Impacts
5. Conclusions
Acknowledgements
Conflict of Interest
References
- Ligon, F.K.; Dietrich, W.E.; Trush, W.J. Downstream ecological effects of dams: A geomorphic perspective. BioScience 1995, 45, 183–193. [Google Scholar] [CrossRef]
- De Mérona, B.; Albert, P. Ecological monitoring of fish assemblages downstream of a hydroelectric dam in French Guiana (South America). Regul. Rivers 1999, 15, 339–351. [Google Scholar] [CrossRef]
- Ward, J.V.; Stanford, J.A. Ecological Factors Controlling Stream Zoobenthos with Emphasis on Thermal Modification of Regulated Streams. In The Ecology of Regulated Streams; Stanford, J.A., Ed.; Plenum Publishers: New York, NY, USA, 1979; pp. 35–53. [Google Scholar]
- Lessard, J.L.; Hayes, D.B. Effects of elevated water temperature on fish and macroinvertebrate communities below small dams. River Res. Appl. 2003, 19, 721–732. [Google Scholar] [CrossRef]
- United States Army Corps of Engineers (USACOE) Web Page. Corps Map: National Inventory of Dams. Available online: http://geo.usace.army.mil/pgis/f?p=397:12: (accessed on 13 August 2007).
- Hannan, H.H. Chemical Modifications in Reservoir-Regulated Streams. In The Ecology of Regulated Sreams; Ward, J.V., Stanford, J.A., Eds.; Plenum Press: New York, NY, USA, 1979; pp. 75–94. [Google Scholar]
- Ahearn, D.S.; Sheibley, R.W.; Dahlgren, R.A. Effects of river regulation on water quality in the lower Mokelumne River, California. River Res. Appl. 2005, 21, 651–670. [Google Scholar] [CrossRef]
- Redfield, A.C. The biological control of chemical factors in the environment. Am. Sci. 1958, 46, 205–221. [Google Scholar]
- Kelly, V.J. Influence of reservoirs on solute transport: A regional-scale approach. Hydrol. Process. 2001, 15, 1227–1249. [Google Scholar] [CrossRef]
- Sawyer, J.; Stewart, P.M.; Simon, T.P.; Mullen, M.; Bennett, H. Comparison of water quality, habitat, and land use variables driving macroinvertebrate and fish assemblages of the Choctawhatchee-Pea Watershed, southern Alabama. Aquat. Ecosyst. Health 2004, 7, 85–99. [Google Scholar] [CrossRef]
- United States Army Corps of Engineers (USACOE), Water Supply Alternatives Evaluation Study for Southeast Alabama Supplemental Report; Choctawhatchee, Pea, and Yellow Watershed Management Authority, Troy University: Troy, AL, USA, 2005.
- American Public Health Association (APHA), Standard Methods for the Examination of Water and Wastewater, 21st ed.American Public Health Association, American Waterworks Association, and Water Environment Federation (WEF): Washington, DC, USA, 2005.
- Hach Company, Phosphorus, Total (0.00 to 3.50 mg/L PO43−) Method 8190. In DR/4000 Spectrophotometer Handbook; Hach Company: Loveland, CO, USA, 1995; pp. 523–529.
- Hach Company, Phosphorus, Reactive (0 to 2.500 mg/L PO43−) Method 8048. In DR/4000 Spectrophotometer Handbook; Hach Company: Loveland, CO, USA, 1995; pp. 509–515.
- Hach Company. DR/4000 Procedure Nitrate Method 8192. Available online: http://www.hach.com/fmmimghach?/CODE%3ANITRATE_PP_LOW_CDR_E2060%7C1 (accessed on 8 January 2007).
- United States Environmental Protection Agency (USEPA), Nutrient Criteria Technical Guidance Manual: Rivers and Streams; EPA 822-B-00-002; United States Environmental Protection Agency Office of Water: Washington, DC, USA, 2000.
- Dodds, W.K.; Jones, J.R.; Welch, E.B. Suggested classification for stream trophic state: Distributions of temperate stream types by chlorophyll, total N and P. Water Resour. 1998, 32, 1455–1462. [Google Scholar]
- Maidment, D.R. Handbook of Hydrology; McGraw-Hill Inc.: New York, NY, USA, 1993; pp. 11:37–11:54. [Google Scholar]
- Cook, M.R.; Murgulet, D.; Moss, N.E.; Gillett, B.; Jennings, S.P. Water-Quality Evaluation of the Little Choctawhatchee River in Southeast Alabama; Open File Report 1113; Geological Survey of Alabama: Tusculoosa, AL, USA, 2011. [Google Scholar]
- Heath, W.H. Distributional Survey and Habitat Partitioning of Crayfish (Crustacea: Decapoda) Assemblages in Wadeable Streams in the Coastal Plains of Southeastern Alabama. Master’s Thesis, Troy University, Troy, AL, USA, 2008. [Google Scholar]
- Mullen, M.W. Little Choctawhatchee River Sampling; Center for Environmental Research and Service, Department of Biological and Environmental Sciences, Troy State University: Troy, AL, USA, 2003. [Google Scholar]
- Mullen, M.W. Water Quality in the Choctawhatchee-Pea Rivers; Center for Environmental Research and Service, Department of Biological and Environmental Sciences, Troy State University: Troy, AL, USA, 1997. [Google Scholar]
- Chakravarty, T.A. Water Quality and Trophic Classification of a Southeastern Watershed. Master’s Thesis, Troy University, Troy, AL, USA, 2007. [Google Scholar]
- Alabama Department of Environmental Management (ADEM). Little Choctawhatchee River (0.14-0201-120) data from 1999, 2004, and 2005. Available online: http://www.adem.state.al.us/FieldOps/WQReports/2004SEALReport.pdf (accessed on 21 July 2008).
- McPherson, A.K.; Moreland, R.S.; Atkins, J.B. Occurrence and Distribution of Nutrients, Suspended Sediments, and Pesticides in the Mobile River Basin, Alabama, Georgia, Mississippi, and Tennessee, 1999–2001; United States Geological Survey Circular WRI 03-4203; National Water-Quality Assessment Program, United States Geological Survey: Denver, CO, USA, 2003. [Google Scholar]
- Berndt, M.P.; Hatzell, H.H.; Crandall, C.A.; Turtora, M.; Pittman, J.R.; Oaksford, E.T. Water Quality in the Georgia-Florida Coastal Plain; United States Geological Survey: Tallahassee, FL, USA, 1998. [Google Scholar]
- Smith, R.A.; Alexander, R.B.; Wolman, M.G. Water quality trends in the nation’s rivers. Science 1987, 235, 1607–1615. [Google Scholar]
- Spruill, T.B.; Harned, D.A.; Ruhl, P.M.; Eimers, J.L.; McMahon, G.; Smith, K.E.; Galeone, D.R.; Woodside, M.D. Water Quality in the Albemarle-Pamlico Drainage Basin, North Carolina and Virginia, 1992–1995; United States Geological Survey Circular 1157; National Water-Quality Assessment Program, United States Geological Survey: Denver, CO, USA, 1998. [Google Scholar]
- Kleiss, B.A.; Coupe, R.H.; Gonthier, G.J.; Justus, B.J. Water Quality in the Mississippi Embayment, Mississippi, Louisiana, Arkansas, Missouri, Tennessee, and Kentucky, 1995–1998; United States Geological Survey Circular 1208; National Water-Quality Assessment Program, United States Geological Survey: Denver, CO, USA, 2000. [Google Scholar]
- Atkins, J.B.; Zappia, H.; Robinson, J.L.; McPherson, A.K.; Moreland, R.S.; Harned, D.A.; Johnston, B.F.; Harvill, J.H. Water Quality in the Mobile River Basin, Alabama, Georgia, Mississippi, and Tennessee, 1999–2001; United States Geological Survey Circular 1231; National Water-Quality Assessment Program, United States Geological Survey: Reston, VA, USA, 2004. [Google Scholar]
- Miller, J.M.; Stewart, P.M. Historical vs. current biological assemblages in the little Choctawhatchee watershed, Southeastern AL, USA. Southeast. Nat. 2013, 12, 267–282. [Google Scholar]
- Miller, J.M. Water Quality, Mussel, Fish, and Crayfish Assemblages of the Little Choctawhatchee River: A Pre-Dam Assessment. Master’s Thesis, Troy University, Troy, AL, USA, 2009. [Google Scholar]
- United States Geological Survey. The Quality of Our Nation’s Waters-Nutrients and Pesticides; United States Geological Survey Circular 1225. 1999. Available online: http://pubs.usgs.gov/circ/circ1225/pdf/front.pdf (accessed on 21 July 2008).
- Winger, J.G.; Duthie, H.C. Export coefficient modeling to assess phosphorus loading in an urban watershed. J. Am. Water Resour. As. 2000, 36, 1053–1061. [Google Scholar] [CrossRef]
- Osborne, L.L.; Wiley, M.J. Empirical relationships between land use/cover and stream water quality in an agricultural watershed. J. Environ. Manag. 1988, 26, 9–27. [Google Scholar]
- Smolen, M.D. Phosphorus and Water Quality; Division of Agricultural Sciences and Natural Resources, Oklahoma State University: Stillwater, OK, USA, 2009. Available online: http://www.poultrywaste.okstate.edu/files/BAE-1521web.pdf (accessed on 16 November 2009).
- Tomer, M.D.; Burkart, M.R. Long-term effects of nitrogen fertilizer use on groundwater nitrate in two small watersheds. J. Environ. Qual. 2003, 32, 2158–2171. [Google Scholar] [CrossRef]
- National Oceanic and Atmospheric Association (NOAA) Web Page. Historical Palmer Drought Indices. Available online: http://www.ncdc.noaa.gov/temp-and-precip/drought/historical-palmers.php (accessed on 7 October 2009).
- Mullen, M.W. Characteristics of Pollutants in Storm Water Runoff from Dothan, Alabama Catchments: Implications for Phase II Storm Water Management; Center for Environmental Research and Service, Department of Biological and Environmental Sciences, Troy State University: Troy, AL, USA, 2000. [Google Scholar]
- Keast, A.; Fox, M.G. Fish community structure, spatial distribution and feeding ecology in a beaver pond. Environ. Biol. Fish. 1990, 27, 201–214. [Google Scholar] [CrossRef]
- Omernik, J.M. The Influence of Land Use on Stream Nutrient Levels; EPA-600/2-76-014; United States Environmental Protection Agency: Washington, DC, USA, 1976. [Google Scholar]
- Nagumo, T.; Hatano, R. Impact of nitrogen cycling associated with production and consumption of food on nitrogen pollution of stream water. Soil Sci. Plant Nutr. 2000, 46, 325–342. [Google Scholar]
- Paul, M.J.; Meyer, J.L. Streams in the urban landscape. Annu. Rev. Ecol. Syst. 2001, 32, 333–365. [Google Scholar] [CrossRef]
- Omernik, J.M. Nonpoint Source-Stream Nutrient Level Relationships: A Nationwide Study; EPA-600-3-77-105; Special Studies Branch, Corvallis Environmental Research Laboratory, Office of Research and Development, United States Environmental Protection Agency: Corvallis, OR, USA, 1997. [Google Scholar]
- Smart, M.M.; Jones, J.R.; Sebaugh, J.S. Stream-watershed relations in the Missouri Ozark Plateau province. J. Environ. Qual. 1985, 14, 77–82. [Google Scholar] [CrossRef]
- Peierls, B.L.; Caraco, N.F.; Pace, M.L.; Cole, J.J. Human influence on river nitrogen. Nature 1991, 350, 386–387. [Google Scholar]
- Chessman, B.C.; Hutton, P.E.; Burch, J.M. Limiting nutrients for periphyton growth in sub-alpine, forest, agricultural, and urban streams. Freshwater Biol. 1992, 28, 349–355. [Google Scholar] [CrossRef]
- Richards, C.; Host, G. Examining land use influences on stream habitats and macroinvertebrates: A GIS approach. Water Resour. Bull. 1994, 30, 729–738. [Google Scholar] [CrossRef]
- Hunsaker, C.T.; Levine, D.A. Hierarchical approaches to the study of water quality in rivers. Bioscience 1995, 45, 193–203. [Google Scholar] [CrossRef]
- White, J.D.; Prochnow, S.J.; Filstrup, C.T.; Byars, B.W. A combined watershed-water quality modeling analysis of the Lake Waco reservoir: II. Watershed and reservoir management options and outcomes. Lake Reserv. Manag. 2010, 26, 159–167. [Google Scholar]
- O’Connor, J.; Major, J.; Grant, G. Down with the dams: Unchanging U.S. rivers. Available online: http://www.geotimes.org/mar08/article.html?id=feature_dams.html (accessed on 7 October 2009).
© 2013 by the authors; licensee MDPI, Basel, Switzerland. This article is an open access article distributed under the terms and conditions of the Creative Commons Attribution license (http://creativecommons.org/licenses/by/3.0/).
Share and Cite
Miller, J.M.; Stewart, P.M. Past, Present, and Future Nutrient Quality of a Small Southeastern River: A Pre-Dam Assessment. Water 2013, 5, 988-1005. https://doi.org/10.3390/w5030988
Miller JM, Stewart PM. Past, Present, and Future Nutrient Quality of a Small Southeastern River: A Pre-Dam Assessment. Water. 2013; 5(3):988-1005. https://doi.org/10.3390/w5030988
Chicago/Turabian StyleMiller, Jonathan M., and Paul M. Stewart. 2013. "Past, Present, and Future Nutrient Quality of a Small Southeastern River: A Pre-Dam Assessment" Water 5, no. 3: 988-1005. https://doi.org/10.3390/w5030988
APA StyleMiller, J. M., & Stewart, P. M. (2013). Past, Present, and Future Nutrient Quality of a Small Southeastern River: A Pre-Dam Assessment. Water, 5(3), 988-1005. https://doi.org/10.3390/w5030988


