Article

Prospects of Source-Separation-Based Sanitation Concepts: A Model-Based Study

1
Wetsus, Centre of Excellence for Sustainable Water Technology, P.O. Box 1113, 8900CC Leeuwarden, The Netherlands
2
Sub-Department Environmental Technology, Wageningen University, P.O. Box 17, 6700AA Wageningen, The Netherlands
*
Author to whom correspondence should be addressed.
Water 2013, 5(3), 1006-1035; https://doi.org/10.3390/w5031006
Submission received: 27 April 2013 / Revised: 13 June 2013 / Accepted: 14 June 2013 / Published: 8 July 2013
(This article belongs to the Special Issue Sustainable Wastewater Treatment and Pollution Control)

Abstract

:
Separation of different domestic wastewater streams and targeted on-site treatment for resource recovery has been recognized as one of the most promising sanitation concepts to re-establish the balance in carbon, nutrient and water cycles. In this study a model was developed based on literature data to compare energy and water balance, nutrient recovery, chemical use, effluent quality and land area requirement in four different sanitation concepts: (1) centralized; (2) centralized with source-separation of urine; (3) source-separation of black water, kitchen refuse and grey water; and (4) source-separation of urine, feces, kitchen refuse and grey water. The highest primary energy consumption of 914 MJ/capita(cap)/year was attained within the centralized sanitation concept, and the lowest primary energy consumption of 437 MJ/cap/year was attained within source-separation of urine, feces, kitchen refuse and grey water. Grey water bio-flocculation and subsequent grey water sludge co-digestion decreased the primary energy consumption, but was not energetically favorable to couple with grey water effluent reuse. Source-separation of urine improved the energy balance, nutrient recovery and effluent quality, but required larger land area and higher chemical use in the centralized concept.

Graphical Abstract

1. Introduction

Separation of different domestic wastewater streams and targeted on-site treatment of these streams for resource recovery has been recognized as one of the most promising concepts to re-establish the balance in carbon, nutrient and water cycles [1,2,3,4]. Domestic wastewater can be divided into two major streams: concentrated stream of black water (feces and urine) and kitchen refuse, and less concentrated stream of grey water from washing activities, such as laundry, shower and bath. Black water can be further divided into urine and feces using urine diverting toilets or urinals. Energy and nutrients can be recovered primarily from the concentrated streams, while the less concentrated stream serves as an alternative water source.
Key technology for energy recovery from source-separated streams is anaerobic treatment of black water or feces and kitchen refuse in an up-flow anaerobic sludge blanket (UASB) reactor [4,5]. Nutrient recovery and pollutant removal from the UASB reactor effluent can be established by struvite precipitation, autotrophic nitrogen removal using oxygen limited anaerobic nitrification denitrification (OLAND) reactor and a post-treatment, such as a trickling filter (TF), to remove remaining organic material [4]. Due to operational conditions, such as a lower buffer capacity of the OLAND reactor effluent compared to the UASB reactor effluent, the struvite precipitation is preferred after the nitrogen removal [6].
Urine separation can be employed in two different approaches: in the source-separation-based sanitation and coupled with the existing centralized sanitation. Separation and direct reuse of urine on agricultural land can be used to increase nutrient recovery, improve wastewater effluent quality and to decrease operational energy consumption, due to lower nutrient concentrations in wastewater [7]. However, collection and reuse of source-separated waste streams, urine in particular, also involves social and cultural issues requiring attention when implementing new technology [8].
Commonly used treatment systems to remove organic material and nutrients from grey water include sequencing batch reactor (SBR) [9] and constructed wetlands (CW) [10]. Due to the considerably high land area requirement, the use of CW is not suitable for densely populated areas, such as the Netherlands [11]. One option could be, however, to implement CW as a green roof [10]. To utilize the organic material present in grey water, excess sludge from the grey water treatment system can be potentially co-digested in the UASB reactor instead of using energy-intensive sludge transport and disposal [12]. However, the possible inhibitory effect of surfactants present in grey water sludge on anaerobic digestion should be investigated [13]. To avoid extensive mineralization of grey water sludge, a bio-flocculation unit, such as a high loaded membrane bioreactor (MBR) or A-trap from the AB-process [14], can be used to concentrate grey water at short hydraulic and sludge retention times (HRT and SRT). A post-treatment system (such as TF) can be applied to remove the remaining organic material from grey water effluent prior to reuse.
Quantitative tools, such as Material Intensity per Service unit (MIPS), exergy analysis and Life Cycle Assessment (LCA) have been used to draw energy and material balances of different centralized and source-separation-based sanitation concepts [15,16,17]. These studies present data on energy consumption and production, material intensity, and emissions of source-separated feces, urine and grey water treatment and centralized wastewater treatment with and without urine separation. For more in depth insight into the urban water cycle, Makropoulos et al. [18] developed an Excel/Matlab-based decision support tool for sustainable integrated urban water management, including domestic wastewater streams and rain water. Extensive information was provided on different household components for water use and options for water treatment and reuse, producing a complete water balance. A study on economic viability and critical influencing factors of different implementation scales of black water and grey water source-separation compared to the centralized sanitation was conducted by Thibodeau et al. [19]. Van Beuzekom et al. [20] conducted a social cost-benefit analysis on different sanitation concepts in Geerpark Heusden, a neighborhood in the Netherlands. This study compared centralized sanitation with different levels of source-separation of wastewater and different scales for the treatment of source-separated wastewater in terms of livability, safety, health, biodiversity and affordability. No studies, however, have investigated the influence of urine separation combined with different grey water treatment configurations and grey water sludge co-digestion on the energy and material balances of the sanitation concepts. The objective of this study was to present energy and water balances, nutrient recovery, chemical use, effluent quality and land area requirement of the centralized and source-separation-based sanitation concepts with and without urine separation, and with different configurations of grey water treatment.

2. Materials and Methods

2.1. Construction of the Model

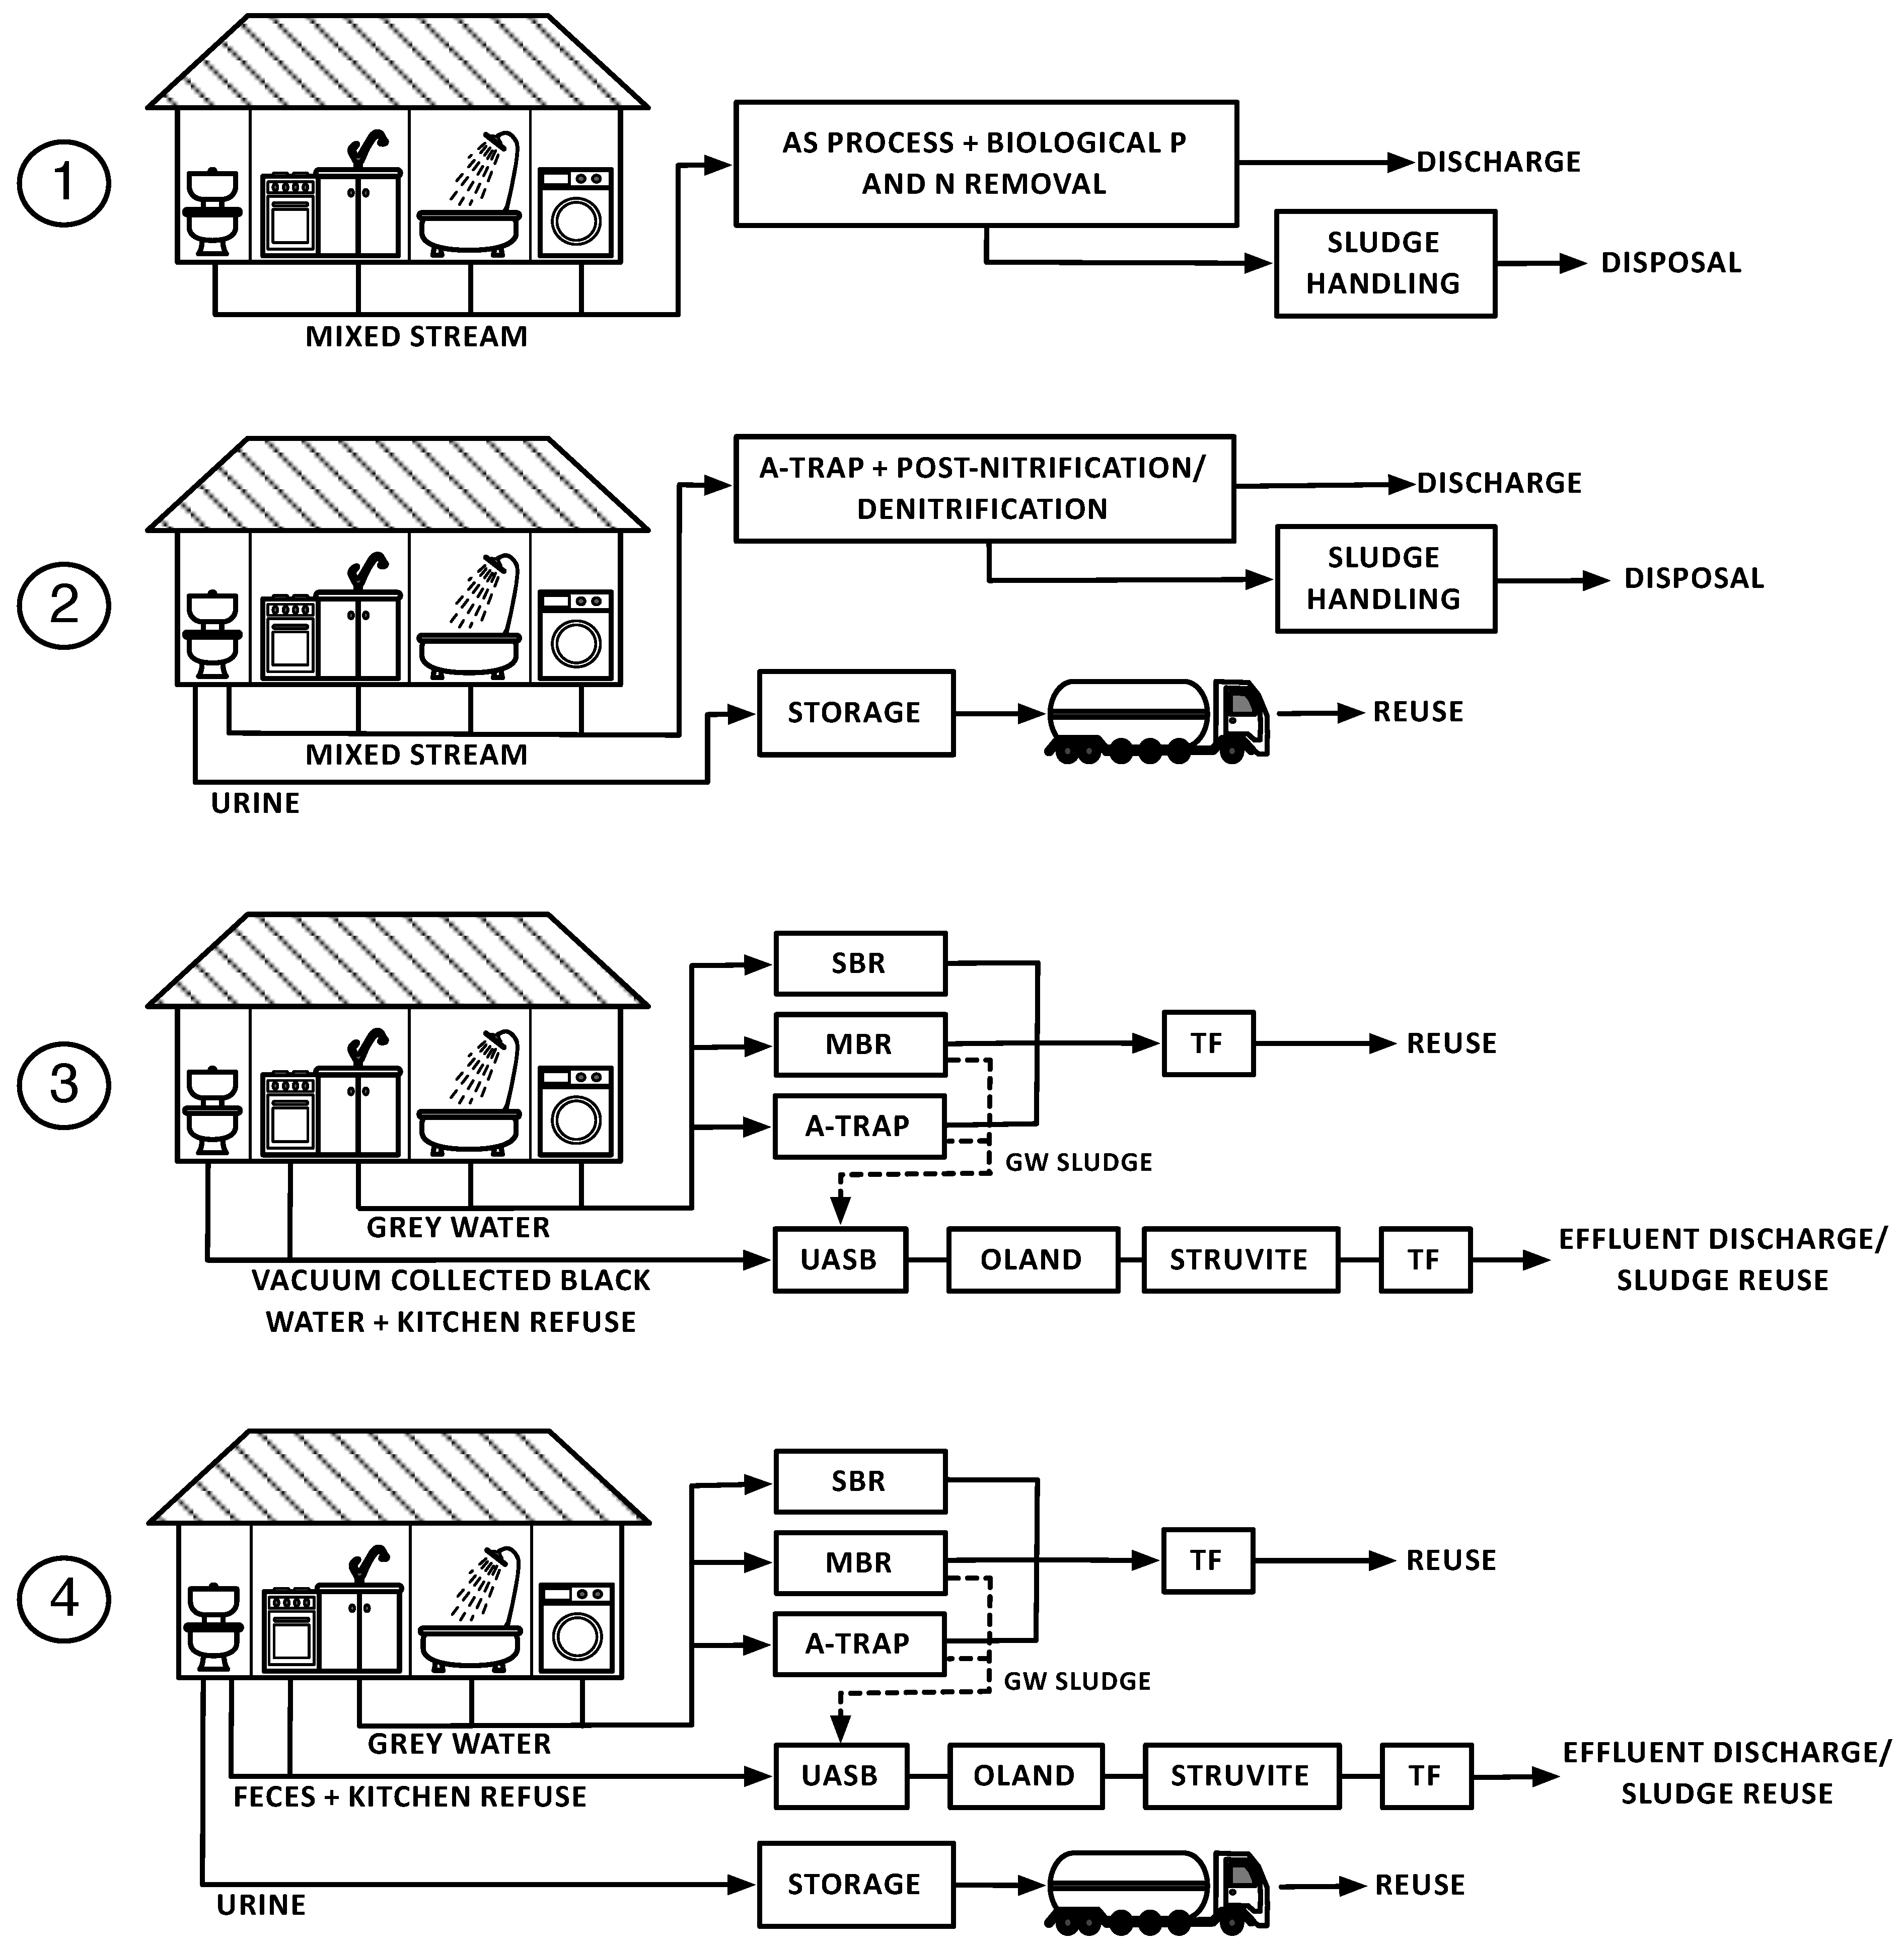
An Excel-based model was developed based on literature data for the comparison of four sanitation concepts: (1) centralized sanitation; (2) centralized sanitation with source-separation of urine; (3) source-separation of black water, kitchen refuse and grey water; and (4) source-separation of urine, feces, kitchen refuse and grey water (Figure 1), from which Concept 1 has been applied on a full scale, and Concepts 2, 3 and 4 have been demonstrated on a pilot or lab scale. These concepts were compared in terms of energy consumption and production, water saving and reuse, nutrient recovery, chemical use, effluent quality and land area requirement. The energy and material balances were based on collection, transport and treatment of wastewater, leaving out the energy and materials used in the construction and maintenance of the required infrastructure. The model was tailored for European circumstances with a specific focus on the Netherlands. However, with small modifications on data input, the model is applicable also in other circumstances.
The model was constructed from location-specific data on environmental temperature, tap water temperature and distances to a sewage sludge incineration plant and agricultural land, general data on water consumption of different appliances and wastewater characteristics, and treatment system-specific data on operational conditions, reactor performance, sludge production, energy consumption and energy production. The energy and water balance, recovered nutrients, chemicals used, effluent quality and land area requirement for each treatment system was then calculated using energy and mass balances based on the selected data.
Figure 1. Sanitation Concepts (14) included in the model with wastewater streams and corresponding treatment systems (AS = activated sludge process; SBR = sequencing batch reactor, MBR = membrane bioreactor; A-trap = A-stage of AB-process; TF = trickling filter; UASB = up-flow anaerobic sludge blanket reactor; OLAND = oxygen limited anaerobic nitrification denitrification).
Water 05 01006 g001

2.2. Data Inventory: Location Specific Data

Wastewater in Concepts 1 and 2 were considered to be treated centralized (10,000 or more people), and the urine collection (Concepts 2 and 4) and the treatment of black water or feces, kitchen refuse and grey water were considered to be community-on-site (100–10,000 people). Average environmental temperature of 10 °C [21] and tap water temperature of 12 °C [22] of the Netherlands were used. The distance from the centralized wastewater treatment plant to the sewage sludge incineration plant was set to 10 km [22], and the distance from the on-site collection to agricultural land was assumed to be 50 km, as a typical distance in the Netherlands. The influence of the transport distance on feasibility of the sanitation concepts was further discussed in the sensitivity analysis.

2.3. Data Inventory: General Data

The toilet type selected for Concept 1 was a normal flush toilet, for Concept 2, a urine diverting toilet (gravity), for Concept 3, a vacuum toilet, and for Concept 4, a urine diverting toilet (gravity/vacuum). The water consumption of different toilets and kitchen grinders is presented in Table 1.
Table 1. Water consumption of different toilets and kitchen grinders.
ParameterUnitWater use
Normal flush toilet (Concept 1)L/cap/d34 1
Vacuum toilet (Concept 3)L/cap/d6 2,*
Urine diverting toilet (gravity) (Concepts 2 and 4)L/cap/d5 3,*
Urine diverting toilet (vacuum) (Concept 4)L/cap/d2 **
Kitchen grinder (Concepts 1, 2, 3 and 4)L/cap/d0.6 2
Notes: 1 [23]; 2 [24]; 3 [25] (0.2 L for urine and 4 L (assumed) for feces per flush); * based on production of one time feces and five times urine per day; ** based on 0.2 L for urine [25] and 1 L for feces per flush [24].
As a common practice in the centralized approach, the wastewater influent in Concepts 1 and 2 was considered to consist of domestic wastewater, rain water runoffs and some industrial effluents, ending up with a daily flow of 300 L/cap [22]. For better comparison between centralized and source-separation-based sanitation concepts, the pollutant loading in the wastewater influent was considered to originate only from the domestic wastewater streams of urine, feces, kitchen refuse and grey water and sludge rejection water from sludge dewatering, forming a daily loading of 176 gCOD(Chemical Oxygen Demand)/cap, 21 gTN(Total Nitrogen)/cap and 3.6 gTP(Total Phosphorus)/cap (Concept 1), similar to the study of Wilsenach and van Loosdrecht [22]. Although kitchen refuse was not included in the study of Wilsenach and van Loosdrecht [22], the pollutant loading from kitchen refuse was considered to replace the pollutant loading from industrial effluents in this study.
Table 2 presents the characteristics of different domestic wastewater streams. In every sanitation concept, the pollutant loading in the wastewater influent was calculated as a sum of the according sub-streams, and in Concepts 3 and 4, the daily flow was calculated as a sum of the pollutant loading and the water consumption of the toilet and the kitchen grinder.
Table 2. Domestic wastewater characteristics. (COD = Chemical Oxygen Demand; BOD5 = Biochemical Oxygen Demand; TSS = Total Suspended Solids; TN = Total Nitrogen; NH4+-N = Ammonium Nitrogen; TP = Total Phosphorus; PO43−-P = Phosphate Phosphorus; K = Potassium).
ParameterUnitFecesUrineKitchen refuseGrey water
Temperature°C37 *37 **20 *32 2
VolumeL/cap/d0.1 11.4 10.2 179 4
CODg/cap/d50 111 159 152 1
BOD 5g/cap/d24 15.5 137 **27 1
TSSg/cap/d30 140 179 155 1
TNg/cap/d1.8 19 11.7 11.2 1
NH4+-Ng/cap/d1.2 39 5-0.1 ***
TPg/cap/d0.5 10.8 10.2 10.4 1
PO43−-Pg/cap/d0.2 30.3 3-0.1 ***
Kg/cap/d0.9 12.8 10.2 10.8 1
Notes: 1 [24]; 2 [26]; 3 [27] (NH4+-N/TN ratio of 0.7); 4 [23]; 5 [22] (TN = NH4+-N in urine); * based on body temperature (feces and urine) and average room temperature; ** based on COD/BOD ratio of 1.6 [28]; *** based on NH4+-N/TN ratio of 0.1 and PO43−-P/TP ratio of 0.35 [26].

2.4. Data Inventory: Treatment System Specific Data

The wastewater treatment system in Concept 1 was based on an activated sludge process (AS process) with biological phosphate and nitrogen removal and, in Concept 2 on an A-trap (A-stage of AB-process [14]) with a post-nitrification/denitrification step according to the study of Wilsenach and van Loosdrecht [22]. As the wastewater in Concept 2 was without the input of urine, a high loaded process with a short SRT and a post-treatment step was assumed to be sufficient for pollutant removal. Urine in Concepts 2 and 4 was considered to be collected on-site with a collection degree of 75% [8], first stored for six months on-site and, then, transported to agricultural land to be used as a fertilizer by spreading. As a result of the breakdown of urea during storage, the high ammonium content and the increased pH ensures the hygienization of urine [29] and is recommended by the World Health Organization (WHO) for safe use of urine in agriculture [30]. The risk of ammonia emissions is prevented by using non-ventilated storage and handling. The treatment systems applied for black water or feces, kitchen refuse and grey water in Concepts 3 and 4 are presented in Figure 1. Table 3 presents the pollutant removal efficiencies of the different treatment systems. The removal efficiencies in the AS process in Concept 1 were according to existing wastewater treatment plants in the Netherlands.
Incineration was selected for excess sludge treatment in Concepts 1 and 2, as it is the most common practice in the Netherlands [31]. Complete sludge treatment consisted of anaerobic digestion to produce methane, sludge dewatering, transport of dewatered sludge to an incineration plant and sludge incineration. Sludge rejection water from sludge dewatering was recycled back to the influent. Excess sludge from the UASB reactor and the SBR (Concepts 3 and 4) was considered to be transported to agricultural land for spreading without dewatering.
Table 3. Pollutant removal efficiencies of biological reactors in Concept 1 and 2, and of up-flow anaerobic sludge blanket reactor (UASB), oxygen limited anaerobic nitrification denitrification (OLAND), struvite precipitator, trickling filter (TF), sequencing batch reactor (SBR), A-stage of AB-process (A-trap) and membrane bioreactor (MBR) in Concepts 3 and 4.
ParameterUnitConcept 1Concept 2Concepts 3 and 4 Black water/feces and kitchen refuse Grey water
UASBOLANDStruviteTFTotalSBRA-trapMBR
COD%92 192 783 253 2-85 399 **90 442 575 6
BOD5%98 192 *83 253 *-85 399 **90 *42 *75 6
TSS%95 192 *83 2--85 397 **76 442 *≥95 6
TN%80 172 71 273 29 8-76 **35 436 581 6
TP%82 179 733 2-96 8-98 **28 440 565 6
Notes: 1 [32]; 2 [33]; 3 [28] (based on standard rate filter with hydraulic loading of 1–4 m3/m2*d); 4 [9]; 5 [34]; 6 [12]; 7 [22]; 8 [35]; * assumed based on COD removal; ** calculated as total removal efficiency of UASB, OLAND, Struvite and TF.

2.5. Calculations for Energy Balance

The total primary energy consumption in the sanitation concepts was calculated according to Equation (1):
E t o t a l = E c o l l e c t i o n + E t r e a t m e n t + E u r i n e s l u d g e t r a n s p o r t E m e t h a n e
where E c o l l e c t i o n was the energy requirement for the collection and transport of wastewater, E t r e a t m e n t was the energy requirement for all the biological, chemical and physical treatment units for mixed wastewater stream, excess sludge and source-separated urine, black water/feces, kitchen refuse and grey water, E u r i n e / s l u d g e t r a n s p o r t was the energy requirement for urine and excess sludge transport and E m e t h a n e was the energy production as methane. The detailed description of the energy parameters is presented in the Appendix. All the energy parameters were calculated as primary energy by converting the electrical energy (collection, aeration, mixing and pumping) using efficiency of 0.31 based on the European electricity mix [36].

2.6. Calculations for Chemical Use

In Concepts 1 and 2, polymers were used for sludge dewatering, and calcium oxide (CaO) was used for flu gas treatment after sludge incineration. The dose of CaO was 30 kg/t Dry Matter (DM) and the dose of polymers was 7.1 kg/t DM [37]. Methanol (CH3OH) was consumed 1.48 kg/cap/year in the post-denitrification step in Concept 2 [22]. In Concepts 3 and 4, sodium hydroxide (NaOH) and magnesium chloride (MgCl2) were used in struvite precipitation to increase the pH and the supersaturation state. Consumption of NaOH was calculated from stoichiometry to increase the pH of influent to the operational pH (see Appendix). Consumption of MgCl2 was calculated from the influent phosphate concentration using a Mg/PO4-P ratio of 1.5 [35].

2.7. Calculations for Reactor Dimensions and Land Area Requirement

Total land area requirement for Concepts 1 and 2 consisted of the volume of the biological reactors, secondary settling tank, digester, biogas storage tank and the urine storage tank (Concept 2). The land use of the incineration process was not taken into account, due to lack of data. Total land area requirement for Concepts 3 and 4 consisted of the volume of the buffer tank (for UASB, SBR, A-trap and MBR), reactors (UASB, OLAND, Struvite, black water TF, SBR/A-trap/MBR and grey water TF), biogas storage tank and the urine storage tank (Concept 4). The detailed calculations for reactor dimensions and land area requirement are described in the Appendix.

3. Results and Discussion

3.1. Energy Balance

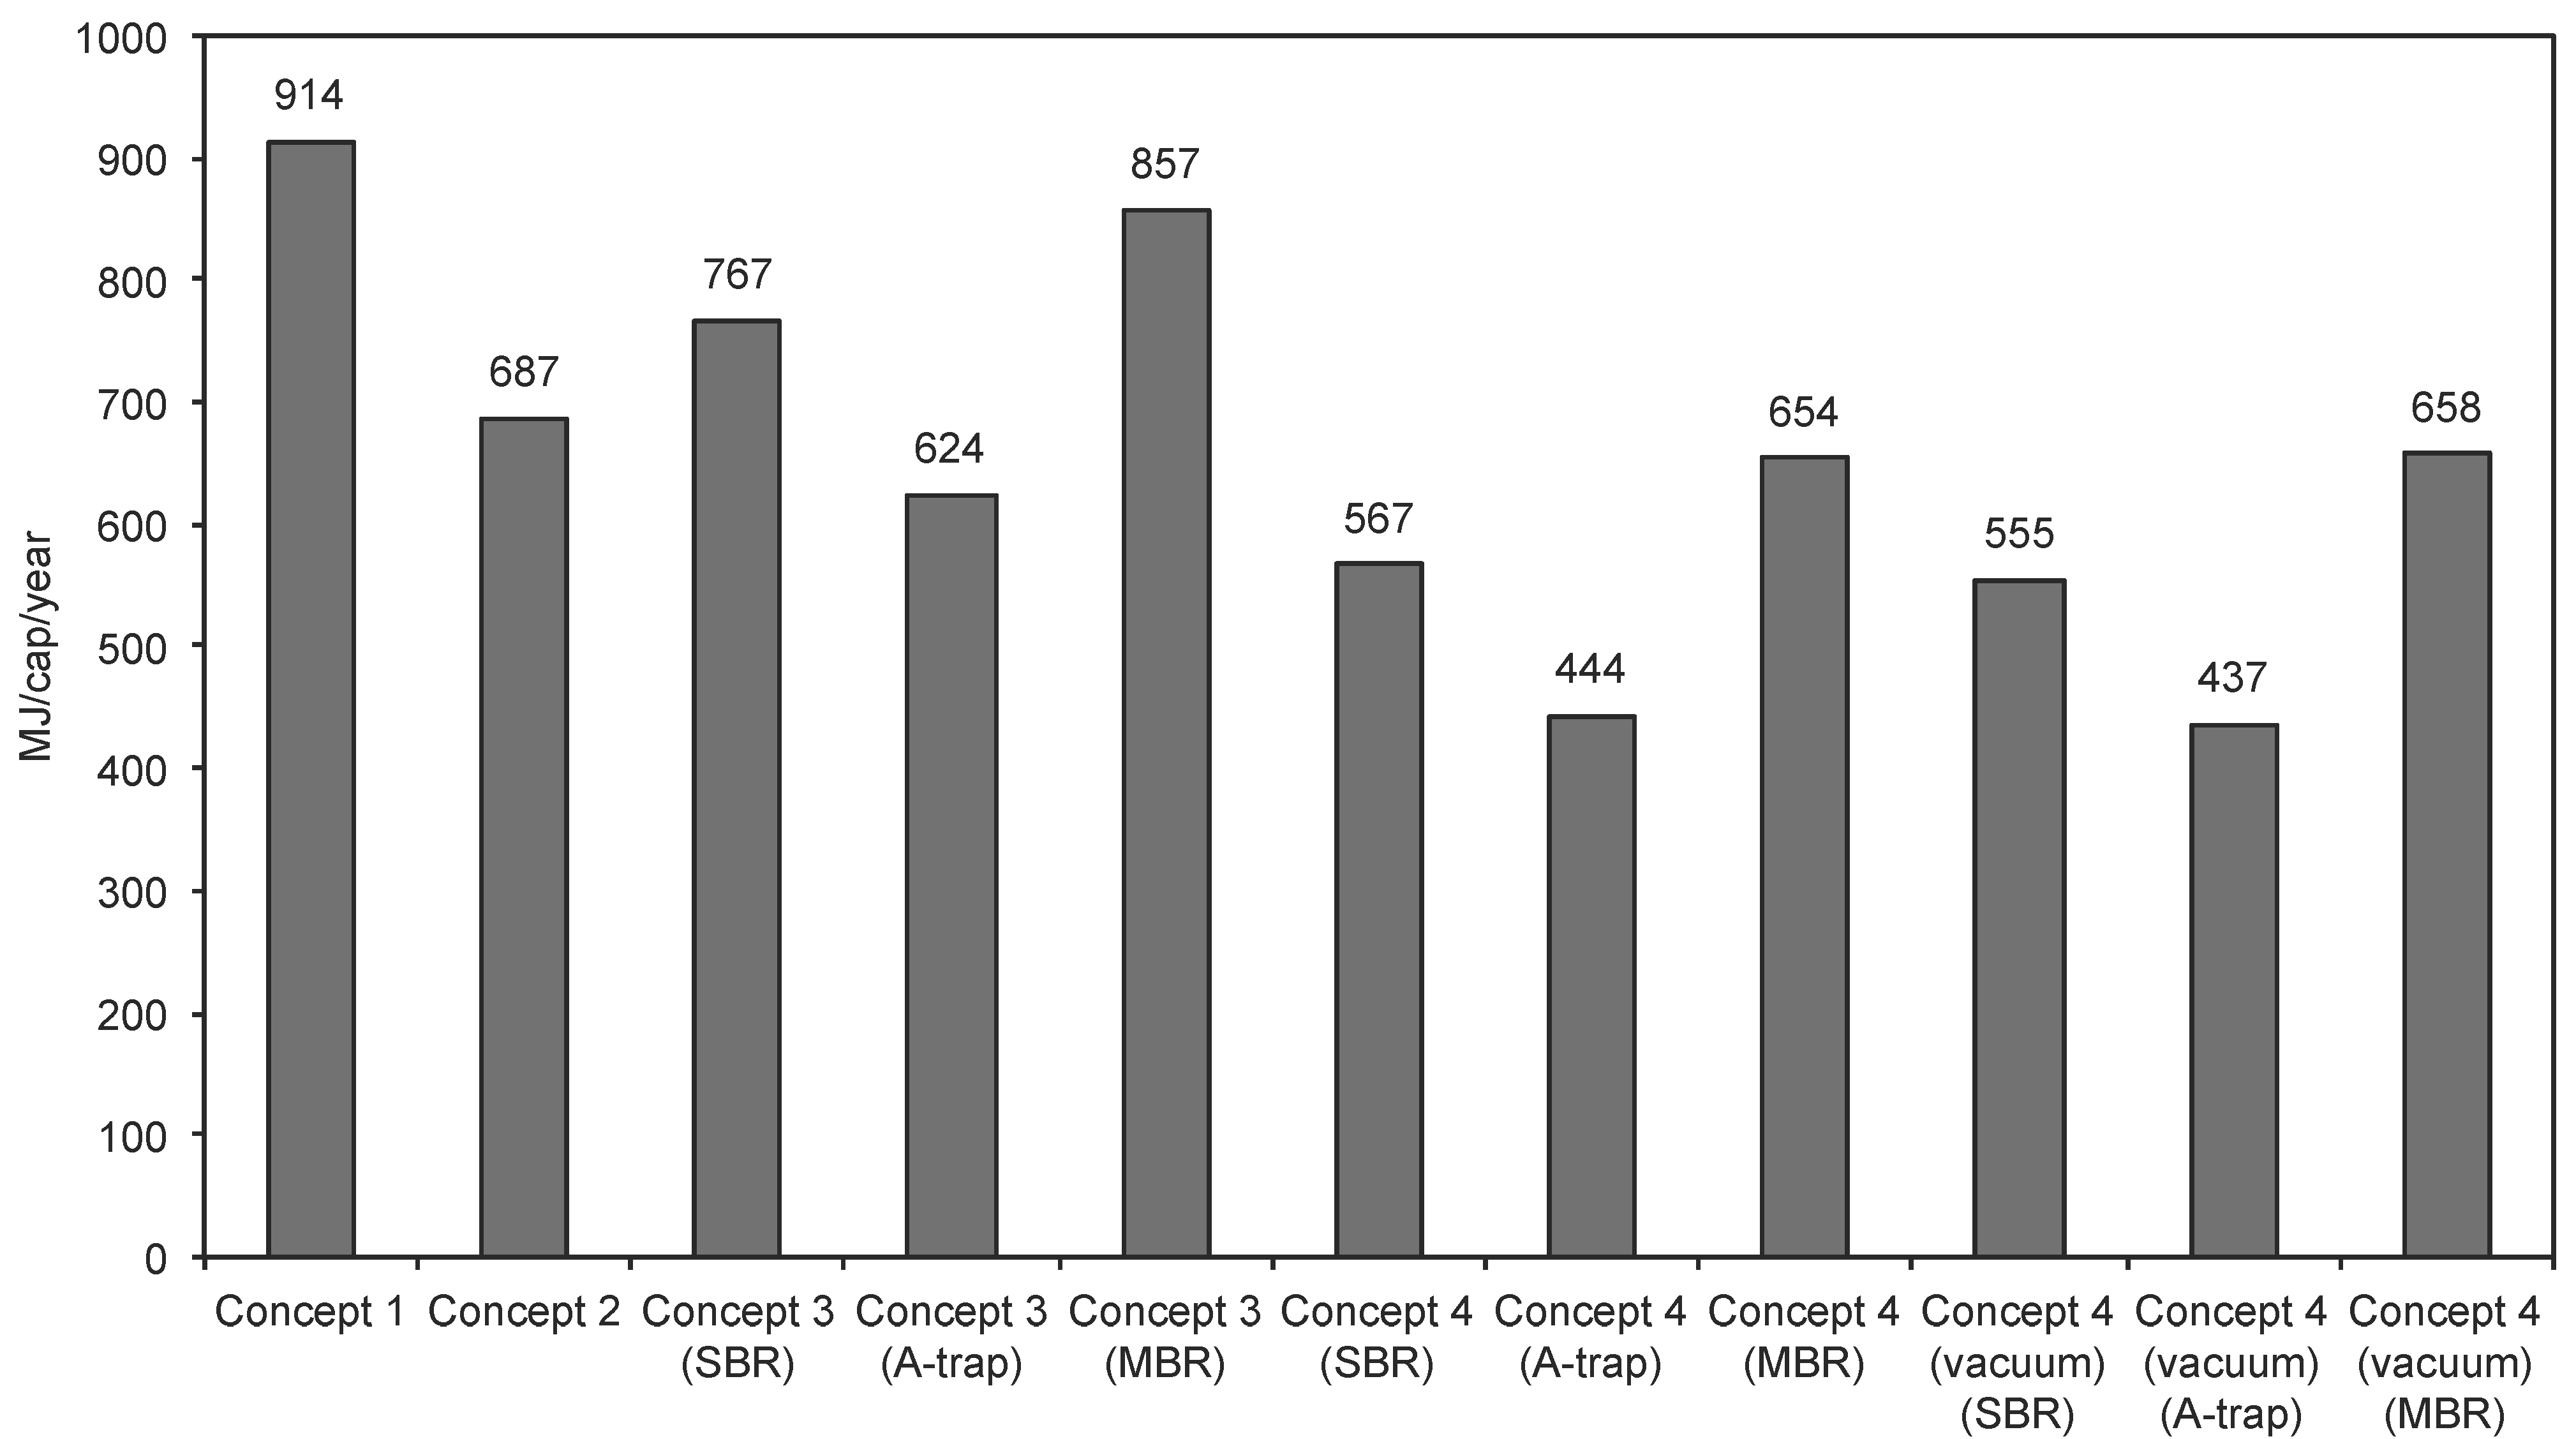
Figure 2 presents the total primary energy consumption in the sanitation concepts. The highest primary energy consumption of 914 MJ/cap/year is attained in the centralized sanitation concept (Concept 1), and by applying urine separation within the centralized concept, the primary energy consumption is decreased to 687 MJ/cap/year, creating a yearly energy saving of 227 MJ/cap. The lowest primary energy consumption of 437 MJ/cap/year is attained in the source-separation of urine, feces, kitchen refuse and grey water (Concept 4 vacuum) using the A-trap for grey water treatment. Urine separation in the source-separation-based sanitation concept creates a yearly energy saving of 200 MJ/cap using the SBR, 180 MJ/cap using the A-trap and 203 MJ/cap using the MBR in Concept 4 with gravity separation, 212 MJ/cap using the SBR, 187 MJ/cap using the A-trap and 200 MJ/cap using the MBR in Concept 4 with vacuum separation. Bio-flocculation of grey water in the A-trap and sub-sequent grey water sludge co-digestion in the UASB reactor creates a yearly energy saving of 143 MJ/cap in Concept 3, 123 MJ/cap in Concept 4 (gravity) and 118 MJ/cap in Concept 4 (vacuum) compared to the use of the SBR for grey water treatment. The high primary energy consumption of Concept 1 originates mainly from the high energy input to mineralize organic matter in the AS process and the resulting low energy recovery as methane. The low primary energy consumption of Concept 4 originates from the low water consumption of the urine diverting toilets, resulting in low energy demand of collection and treatment of feces and kitchen refuse. In addition, by grey water sludge co-digestion in the UASB reactor, high energy consumption for sludge transport can be avoided, while simultaneously increasing energy recovery as methane.
The energy parameters, together with the sludge production and urine collection, are presented in the Appendix in Table A1 (Concepts 1 and 2) and in Table A2 and Table A3 with UASB influent characteristics (Concepts 3 and 4). The most prominent parameters in the energy balance in Concepts 1 and 2 are energy consumption for the collection of wastewater and aeration of the biological reactors. The collection contributes 27% in Concept 1 and 30% in Concept 2 to the total primary energy consumption, and the aeration contributes 40% in Concept 1 and 23% in Concept 2. Furthermore, transporting of urine in Concept 2 contributes 18% to the total primary energy consumption. Due to the shorter SRT in the A-trap (0.8 d) compared to the AS process (12 d), the energy consumption for aeration is significantly lower in Concept 2 compared to Concept 1. However, short SRT increases the excess sludge production, leading to an increase in the energy requirement for heating of the digester. Nevertheless, the higher excess sludge production together with the low mineralization of organic matter creates almost twice as high methane production in Concept 2 compared to Concept 1. Compared to the study of Wilsenach and van Loosdrecht [22], both concepts have higher total primary energy consumption, mainly due to the energy consumption for the collection that is included in this study and the higher energy consumption for the transporting of collected urine compared to the treatment of urine and sludge rejection water in struvite precipitation and the Single reactor system for High activity Ammonium Removal Over Nitrite (SHARON) processes, used in the study of Wilsenach and van Loosdrecht [22]. However, direct reuse of urine provides a clean route for nutrient recovery, while the mixing of sludge rejection water with urine might deteriorate the quality of the produced struvite with heavy metals from sewage.
Figure 2. Total primary energy consumption in sanitation concepts with different grey water treatment configurations.
Water 05 01006 g002
The most prominent parameters in the energy balance in Concepts 3 and 4 are energy consumption for the vacuum collection and transport of black water and kitchen refuse and heating of the UASB reactor. The vacuum collection and transport contributes 27%–35% in Concept 3 and 15%–20% in Concept 4 (vacuum) to the total primary energy consumption, and heating of the UASB reactor contributes 33%–46% in Concept 3, 36%–53% in Concept 4 (gravity) and 24%–43% in Concept 4 (vacuum). Furthermore, transporting of collected urine in Concept 4 contributes 17%–23% to the total primary energy consumption.
Urine separation in the source-separation-based sanitation concept (Concept 4) has the potential to decrease the total energy consumption, due to a lower energy demand of the feces collection and the post-treatment of UASB reactor effluent in the OLAND reactor, struvite precipitator and TF compared to Concept 3. In addition, separation of urine from feces and kitchen refuse and the low water consumption of the urine diverting toilets decreases the UASB reactor influent volume and, thus, the energy used for heating of the reactor. However, urine separation has an extra energy consumption for transporting of collected urine. Although vacuum collection of feces and kitchen refuse increases the energy demand of collection compared to gravity collection, vacuum separation of urine presents the energetically most favorable option, due to the smallest UASB reactor influent volume.
A significant fraction of the energy consumption for the SBR originates from the high aeration demand at the long SRT (15 d [9]). By decreasing the SRT to 0.6 d using the A-trap [34] or to 1 d using the MBR [12]), the energy consumption for the grey water treatment system can be decreased. The energy consumption for the MBR, however, is four times higher than for the A-trap, due to the higher energy requirement of membrane technology. When grey water sludge is co-digested in the UASB reactor, the total energy consumption can be decreased, as no transporting of grey water sludge is required. Furthermore, methane production in the UASB reactor can be increased, due to the higher loading of the reactor and the higher methanization level of grey water sludge compared to black water, feces and kitchen refuse. However, co-digestion of grey water sludge increases the heating energy required for the reactor as a result of a higher influent volume and a lower influent temperature, originating from the lower grey water sludge temperature that was assumed to be the environmental temperature. Consequently, bio-flocculation of grey water in the MBR and sub-sequent grey water sludge co-digestion in the UASB reactor is not energetically favorable compared to grey water treatment in the SBR, due to the high sludge production in the MBR and the resulting high heating energy requirement for the UASB reactor. However, to decrease the volume of the MBR sludge, a settler can be implemented to increase the concentration of the sludge.

3.2. Water Reuse

Table 4 presents the calculated effluent quality of the different grey water treatment systems and the standards for non-potable grey water reuse suggested by Li et al. [38]. The reuse standards were divided into recreational impoundments, such as ornamental fountains and lakes, and urban reuse, such as toilet flushing, laundry and irrigation. Unrestricted reuse is considered in close contact with people and restricted reuse in areas without public access. Due to high nutrient concentrations in the effluent, none of the treatment systems fulfilled the reuse standards for recreational impoundments. The SBR and the MBR with TF as a post-treatment step fulfilled the standards for urban reuse, but only the effluent from the SBR-TF was according to the unrestricted reuse. The better effluent quality from the SBR-TF in terms of BOD5 can be explained by the longer SRT and, thus, more extensive degradation of organic material. However, membrane technology has the potential to produce grey water effluent free of solids and, therefore, benefit from the use of advanced post-treatment systems, such as UV and ozonation, for removing micro-pollutants and pathogens. Nevertheless, the costs of advanced post-treatment systems have to be related to the actual need for high quality water, rather than striving to fulfill the most stringent standards.
Table 4. Calculated effluent quality of grey water treatment systems and suggested standards for water reuse.
ParameterUnitGrey water effluent qualitySuggested reuse standards [38]
(This study)Recreational impoundmentsUrban reuse
SBR-TFA-Trap-TFMBR-TFRestrictedUnrestrictedRestrictedUnrestricted
BOD5mg/L5301430103010
TSSmg/L2560630-30-
TNmg/L1010311--
TPmg/L4320.050.05--

3.3. Nutrient Recovery

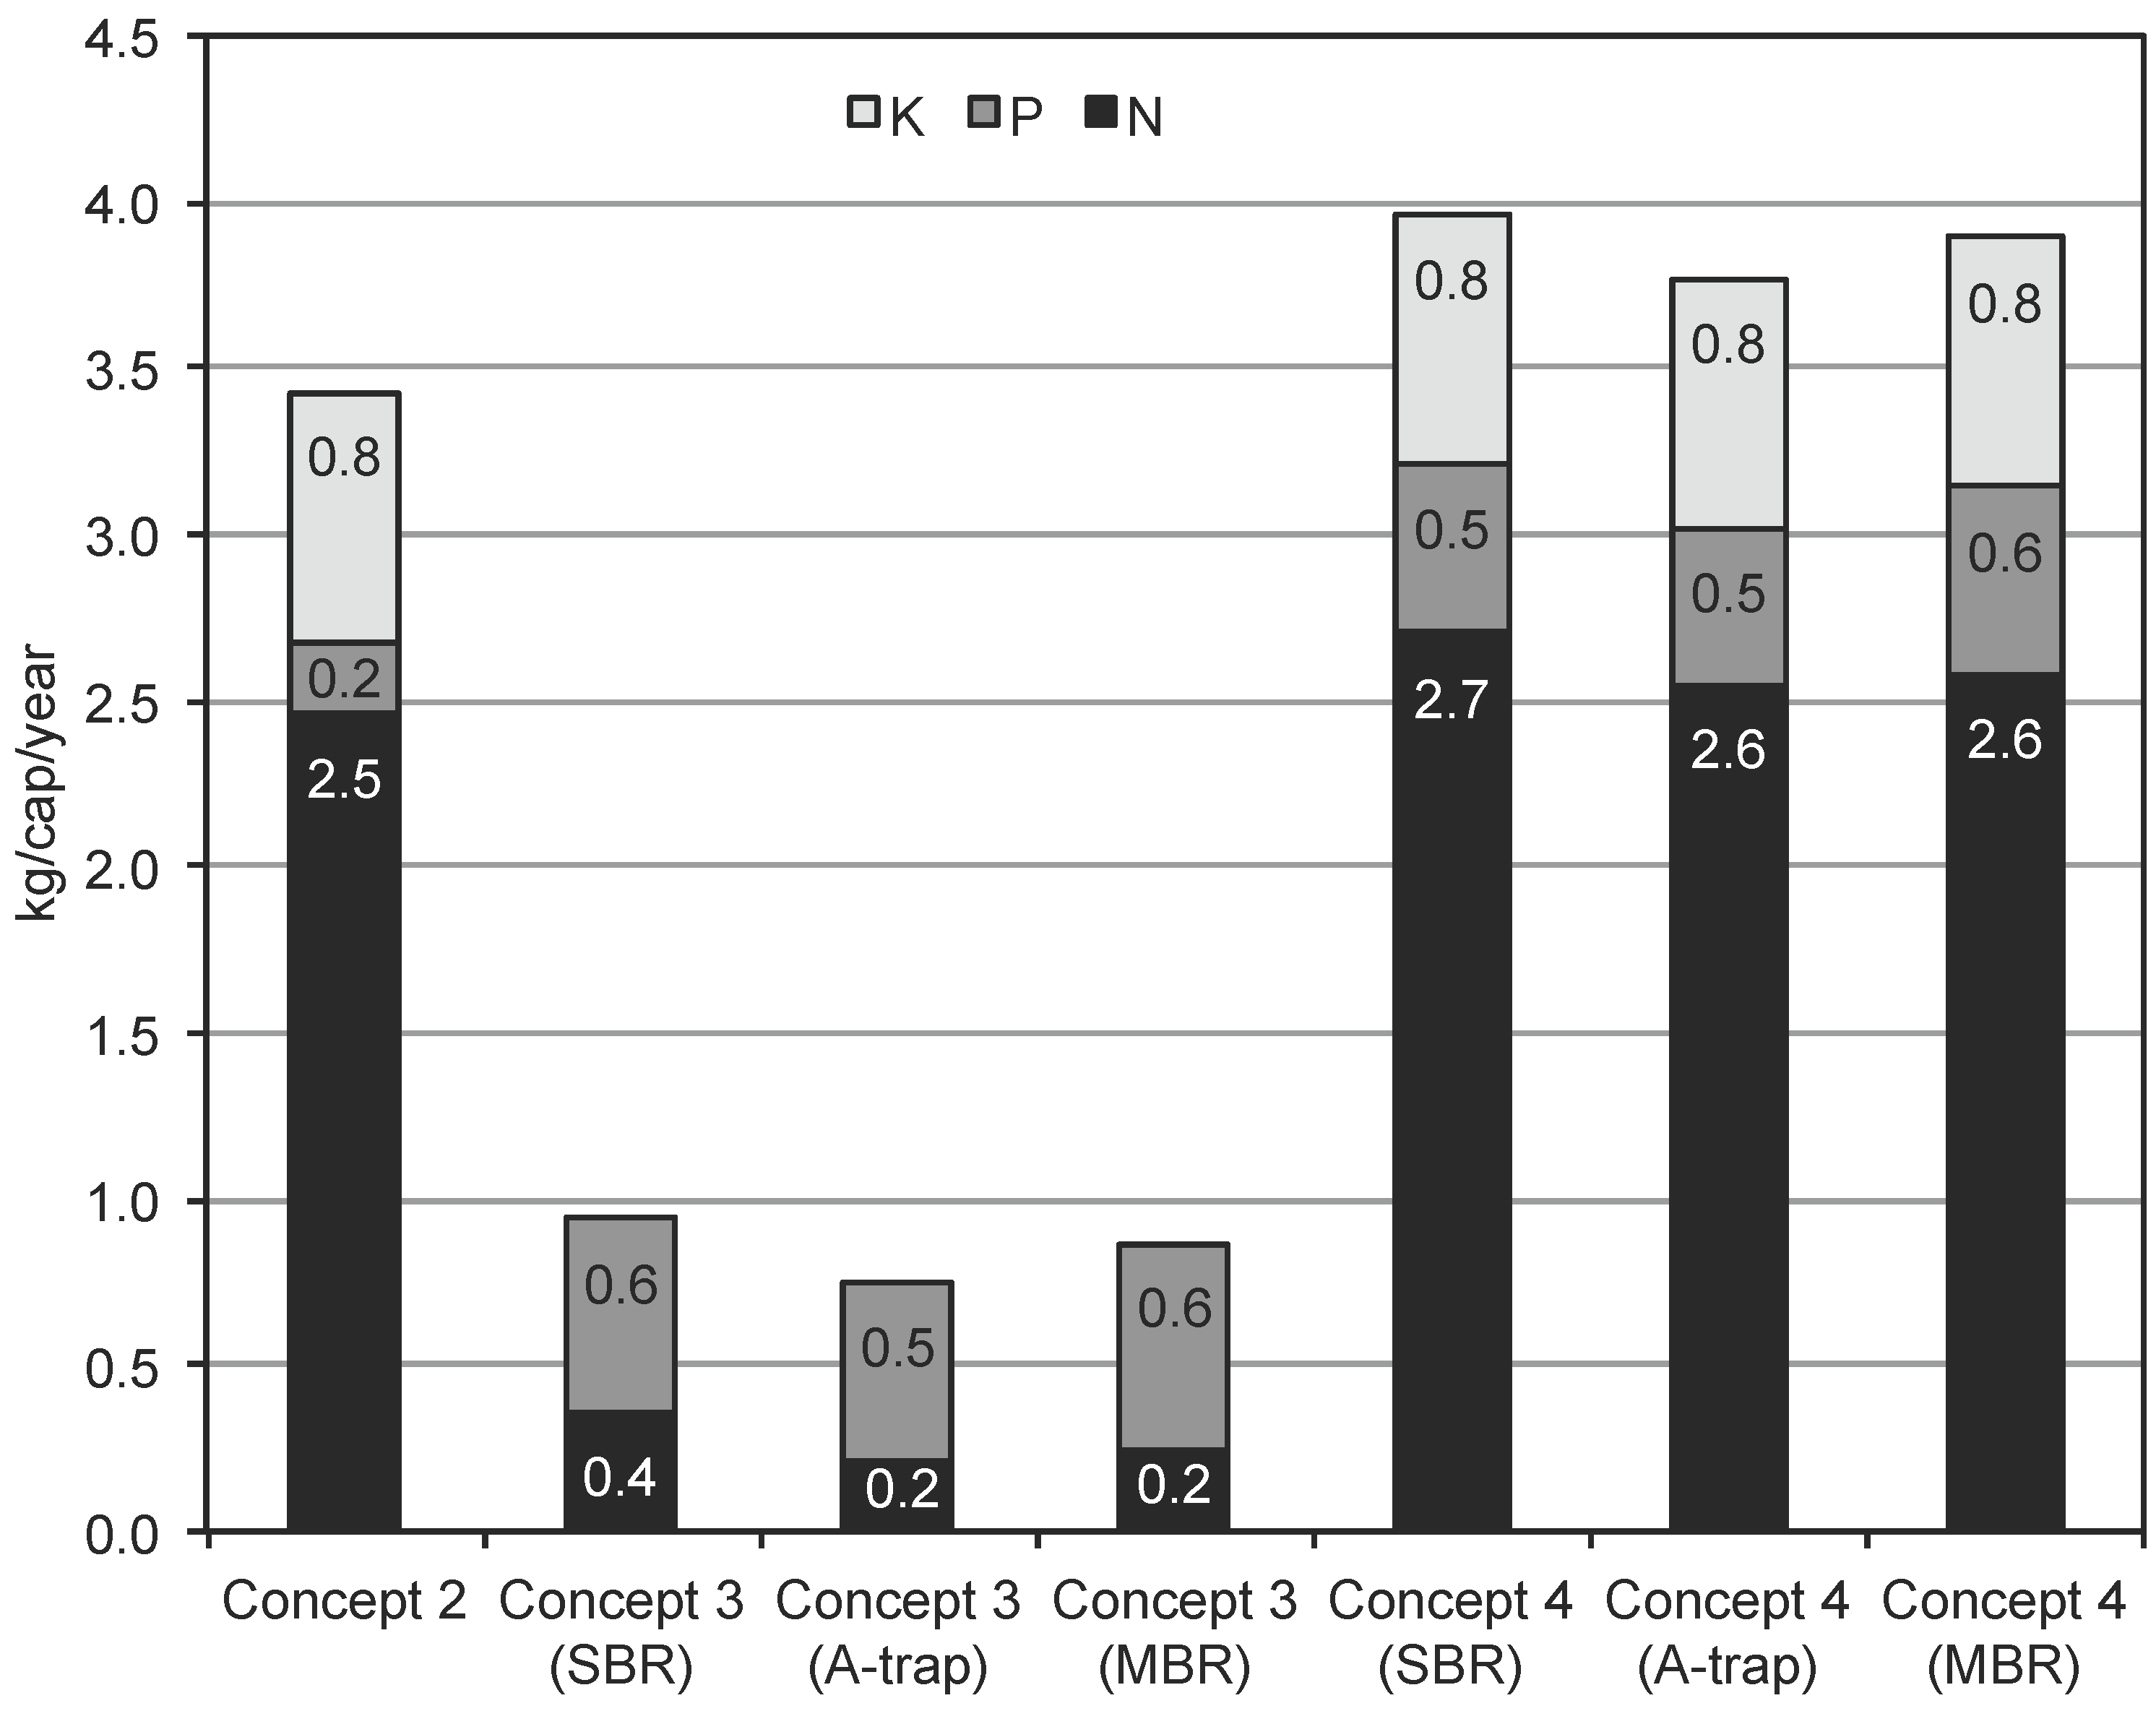
Nutrients, such as nitrogen, phosphorus and potassium, can be recovered using urine separation in the centralized concept and in the source-separation-based sanitation concepts. Nutrients were considered to be recovered through urine spreading on agricultural land in Concepts 2 and 4, and thus, all the nutrients present in the collected urine (collection degree of 75%) were considered to be recovered. Struvite (MgNH4PO4 6H2O) precipitation is used to recover nutrients from the effluent of the OLAND reactor in Concepts 3 and 4. Struvite is produced 2.13 kg/cap/year from which 0.27 kg is phosphorus and 0.12 kg is nitrogen in Concept 3 and 1.0 kg/cap/year from which 0.13 kg is phosphorus and 0.06 kg is nitrogen in Concept 4. In Concepts 3 and 4, nutrients were also considered to be recovered from the excess sludge of the UASB reactor and the SBR through sludge reuse on agricultural land. Nitrogen and phosphorus removed in the UASB reactor and the SBR were considered to be trapped in the sludge and, in this way, recovered. Figure 3 presents the nutrients recovered in Concepts 2–4 with different grey water treatment configurations. As most of the nutrients are present in urine, source-separation and direct reuse of urine brings forth a major contribution to the total nutrient recovery. The choice between the different grey water treatment configurations (SBR/A-trap/MBR) has only a slight effect on the total amount of nutrients recovered. The maximum nutrient recovery can be achieved with Concept 4, where nutrient recovery from sludge increases the recovery of nitrogen and phosphorus compared to Concept 2.
Compared to artificial fertilizers, direct reuse of urine in agriculture, as suggested here, has an advantage of acting as a multicomponent fertilizer. However, direct reuse of urine also has disadvantages, such as transporting of urine to agricultural land and the possible adverse effect of high salt content of urine on soil, especially in low rainfall areas. Several technologies have been presented to overcome these issues by indirectly recovering the resources from urine. Nutrients can be recovered from urine by struvite precipitation [7,8] or using algae for nutrient up-take from urine and subsequent reuse of algae biomass [39]. In the study of Kuntke et al. [40], a microbial fuel cell was used to simultaneously produce energy (3.46 kJ/gN) and recover ammonium (3.29 gN/d/m2) from urine. By replacing the urine transport with a microbial fuel cell, the total primary energy consumption can be decreased by 19% in Concept 2 and 17%–23% in Concept 4, indicating a promising new direction for urine treatment.
According to the current Dutch guidelines for sewage sludge reuse in agriculture (BOOM), reuse of black water sludge is prohibited, due to elevated concentrations of copper and zinc [41]. However, as black water is predominantly human originated (urine, feces and tap water), the applicability of sewage sludge reuse guidelines on the reuse of black water sludge can be argued. Furthermore, the amount of heavy metals related to the phosphorus content of sludge is significantly higher in cow manure [42] and in artificial phosphorus fertilizers in the case of cadmium, chromium and nickel [43]. The heavy metal content of grey water sludge and the effect of grey water sludge co-digestion on the excess sludge quality of the UASB reactor needs to be further investigated to decide whether or not to mix these streams.
Figure 3. Nutrient recovery in Concepts 2–4 with different grey water treatment configurations.
Water 05 01006 g003

3.4. Energy Balance Including Water Saving and Reuse and Nutrient Recovery

Compared to the normal flush toilet in Concept 1, the use of a urine diverting toilet or a vacuum toilet saves water of a drinking quality. The vacuum toilet saves 28 L/cap/day, the urine diverting toilet (gravity) saves 29 L/cap/day and the urine diverting toilet (vacuum) saves 32 L/cap/day. Considering a primary energy consumption of 5.4 MJ/m3 for drinking water production and distribution [31] (using efficiency of 0.31 [36]), 57 MJ/cap/year can be indirectly gained in Concepts 2 and 4 (gravity), 55 MJ/cap/year in Concept 3 and 63 MJ/cap/year in Concept 4 (vacuum). Furthermore, by reusing grey water effluent for toilet flushing, laundry and irrigation, drinking water can be saved and energy can be indirectly gained in Concepts 3 and 4. By assuming full reuse of grey water effluent (29 m3/cap/year), energy can be indirectly gained as 157 MJ/cap/year by using either the SBR-TF for unrestricted or the MBR-TF for restricted urban reuse. As the water use for toilet flushing and laundry is only 8 m3/cap/year [23], 73% of the SBR-TF effluent is left for irrigation. Grey water effluent from the MBR-TF can only be used for urban reuse applications without public access, such as irrigation of restricted areas.
Through the recovery of nutrients, energy can be indirectly gained in the production of artificial fertilizers. Considering a primary energy requirement of 45 MJ/kgN, 29 MJ/kgP and 11 MJ/kgK for fertilizer production [7], energy can be indirectly gained 129 MJ/cap/year in Concept 2, in Concept 3, 33 MJ/cap/year with SBR, 25 MJ/cap/year with A-trap and 29 MJ/cap/year with MBR and in concept 4, 145 MJ/cap/year with SBR, 137 MJ/cap/year with A-trap and 141 MJ/cap/year with MBR.
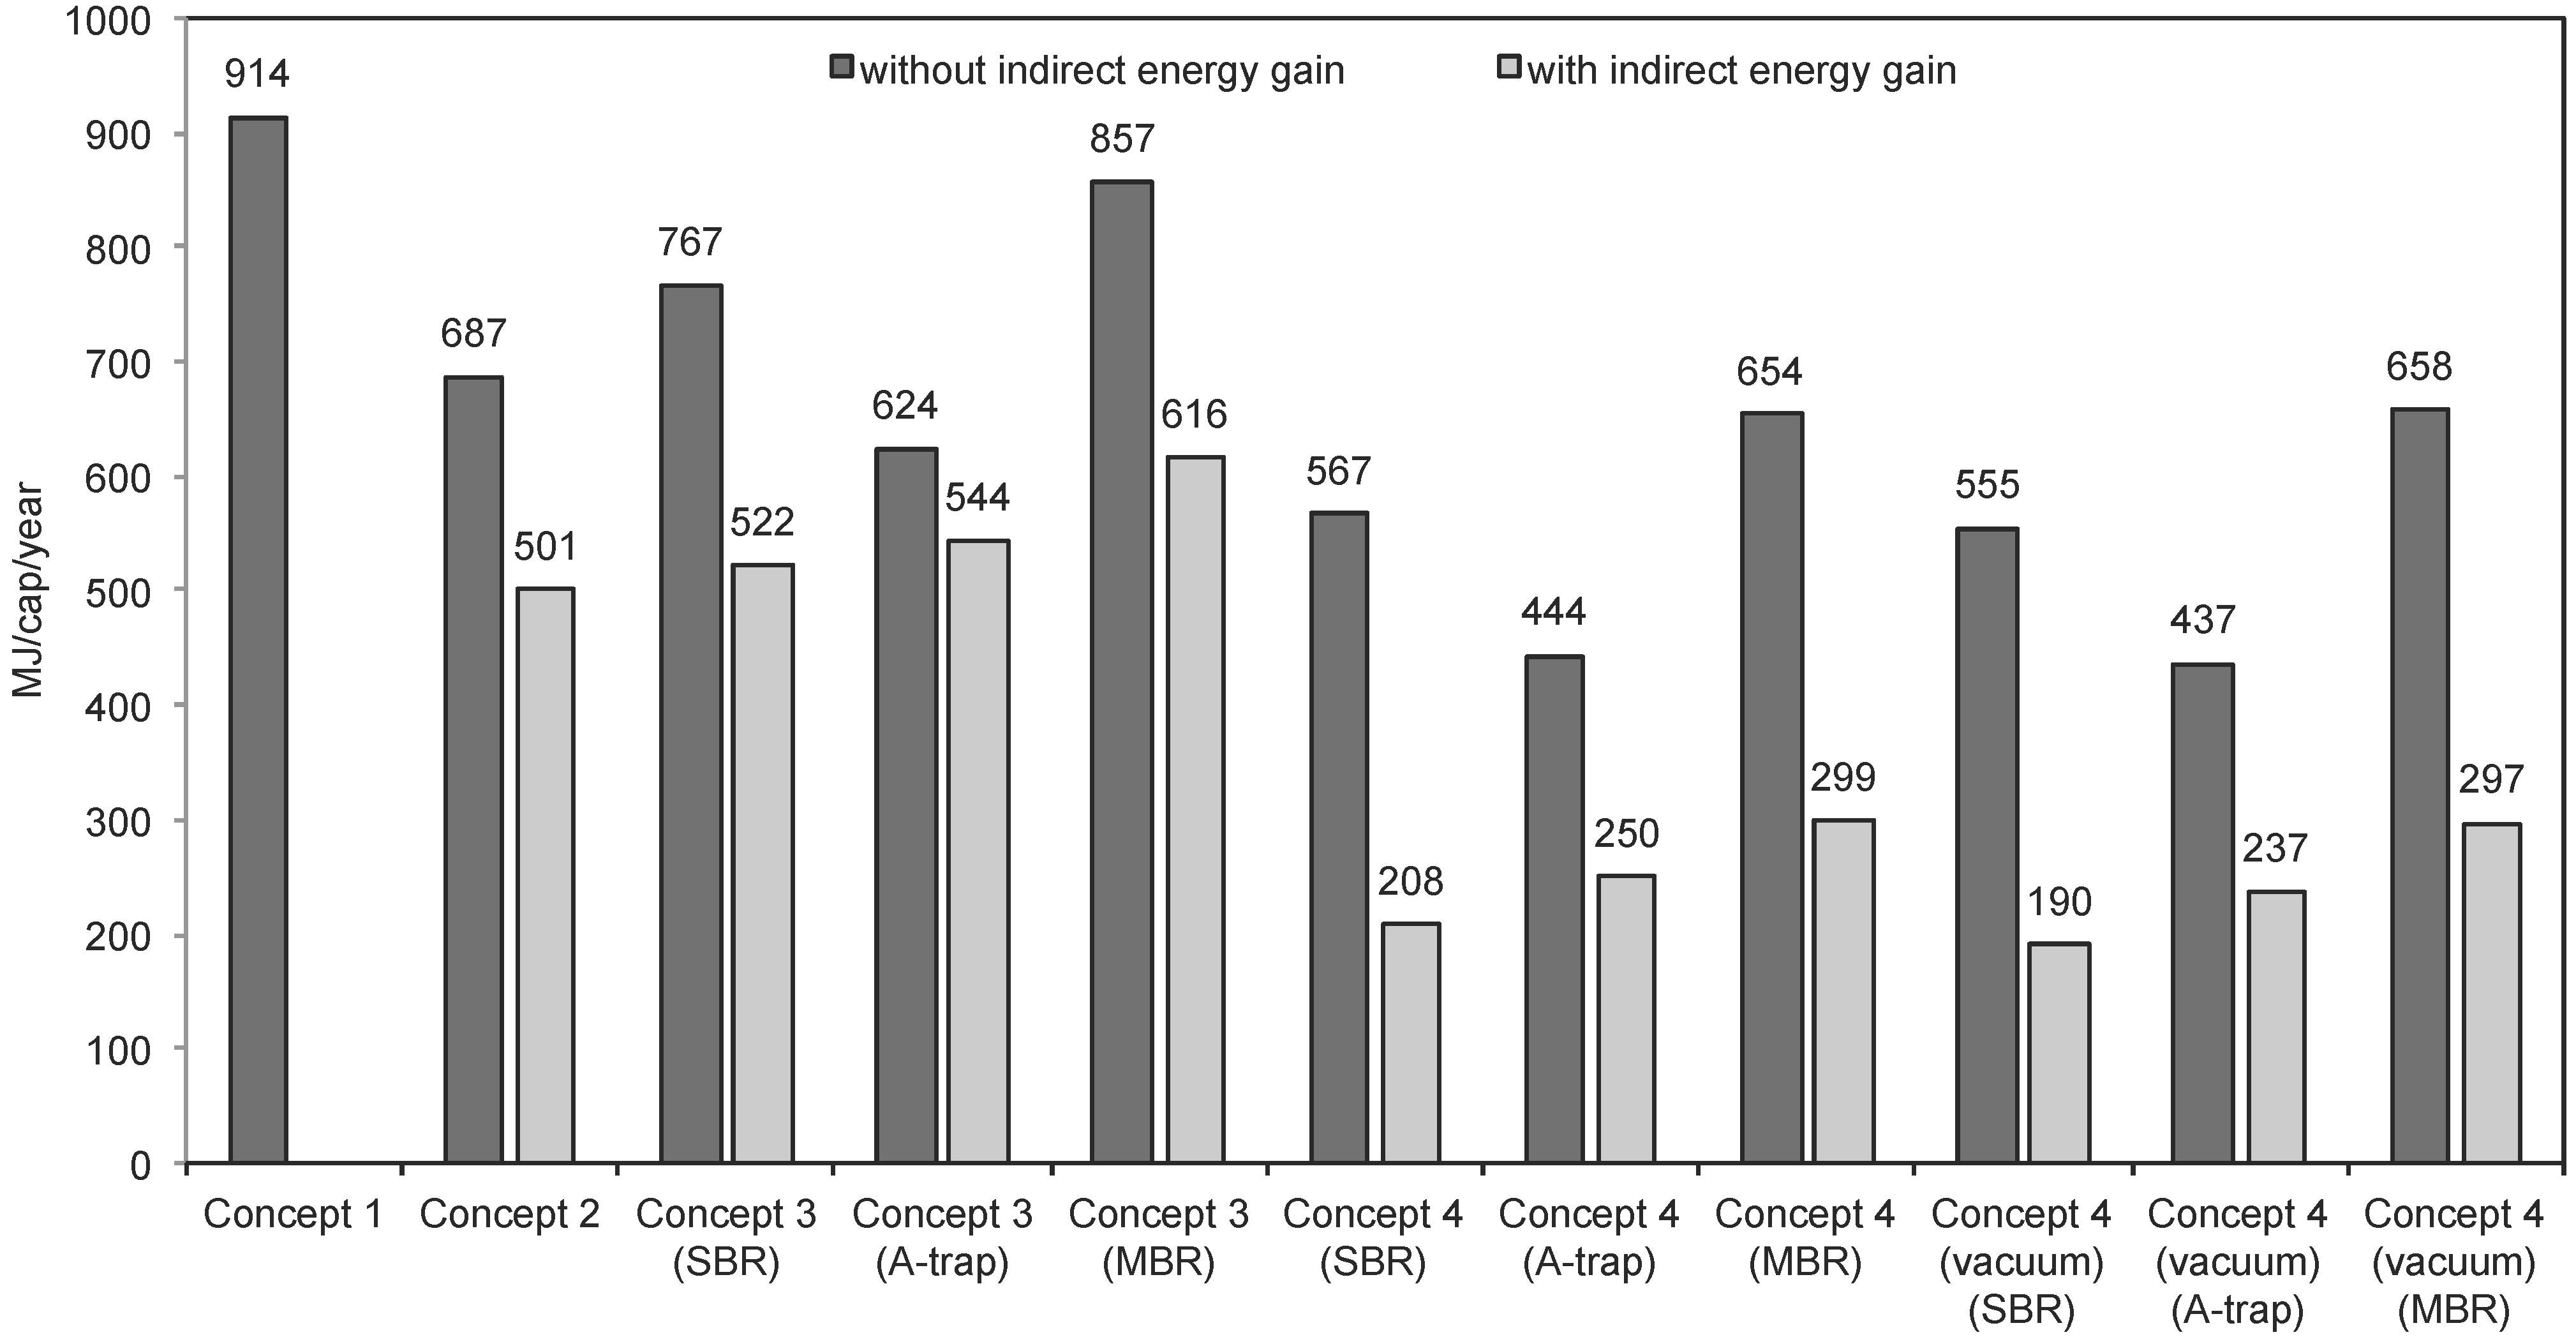
Figure 4 presents the total primary energy consumption with and without the indirect energy gain from water saving and reuse, and nutrient recovery. The most prominent energy gain can be achieved with the recovery of nutrients through urine separation (Concepts 2 and 4) and the reuse of grey water effluent using either the SBR or the MBR (Concepts 3 and 4). Due to the significant energy gain from the grey water effluent reuse, grey water treatment in the SBR becomes energetically more favorable than bio-flocculation of grey water in the A-trap and subsequent grey water sludge co-digestion in the UASB reactor. Besides water and nutrient recovery, there is an increasing interest to recover the heat content of wastewater [44]. Heat recovery on-site from source-separated grey water using a heat exchanger would be an energy-efficient option to preheat the incoming tap water, as no electricity is needed.
When the indirect energy gain is taken into account, urine separation applied in the centralized sanitation creates even higher yearly energy saving of 413 MJ/cap compared to Concept 1. The lowest energy consumption in Concept 3 (522 MJ/cap/year) and Concept 4 (208 MJ/cap/year (gravity) and 190 MJ/cap/year (vacuum)) is attained when the SBR is used. By applying urine separation in the source-separation-based sanitation, 294–331 MJ/cap/year can be saved with indirect energy gain.
Figure 4. Total primary energy consumption in sanitation concepts with and without indirect energy gain from water saving and reuse, and nutrient recovery.
Water 05 01006 g004

3.5. Chemical Use

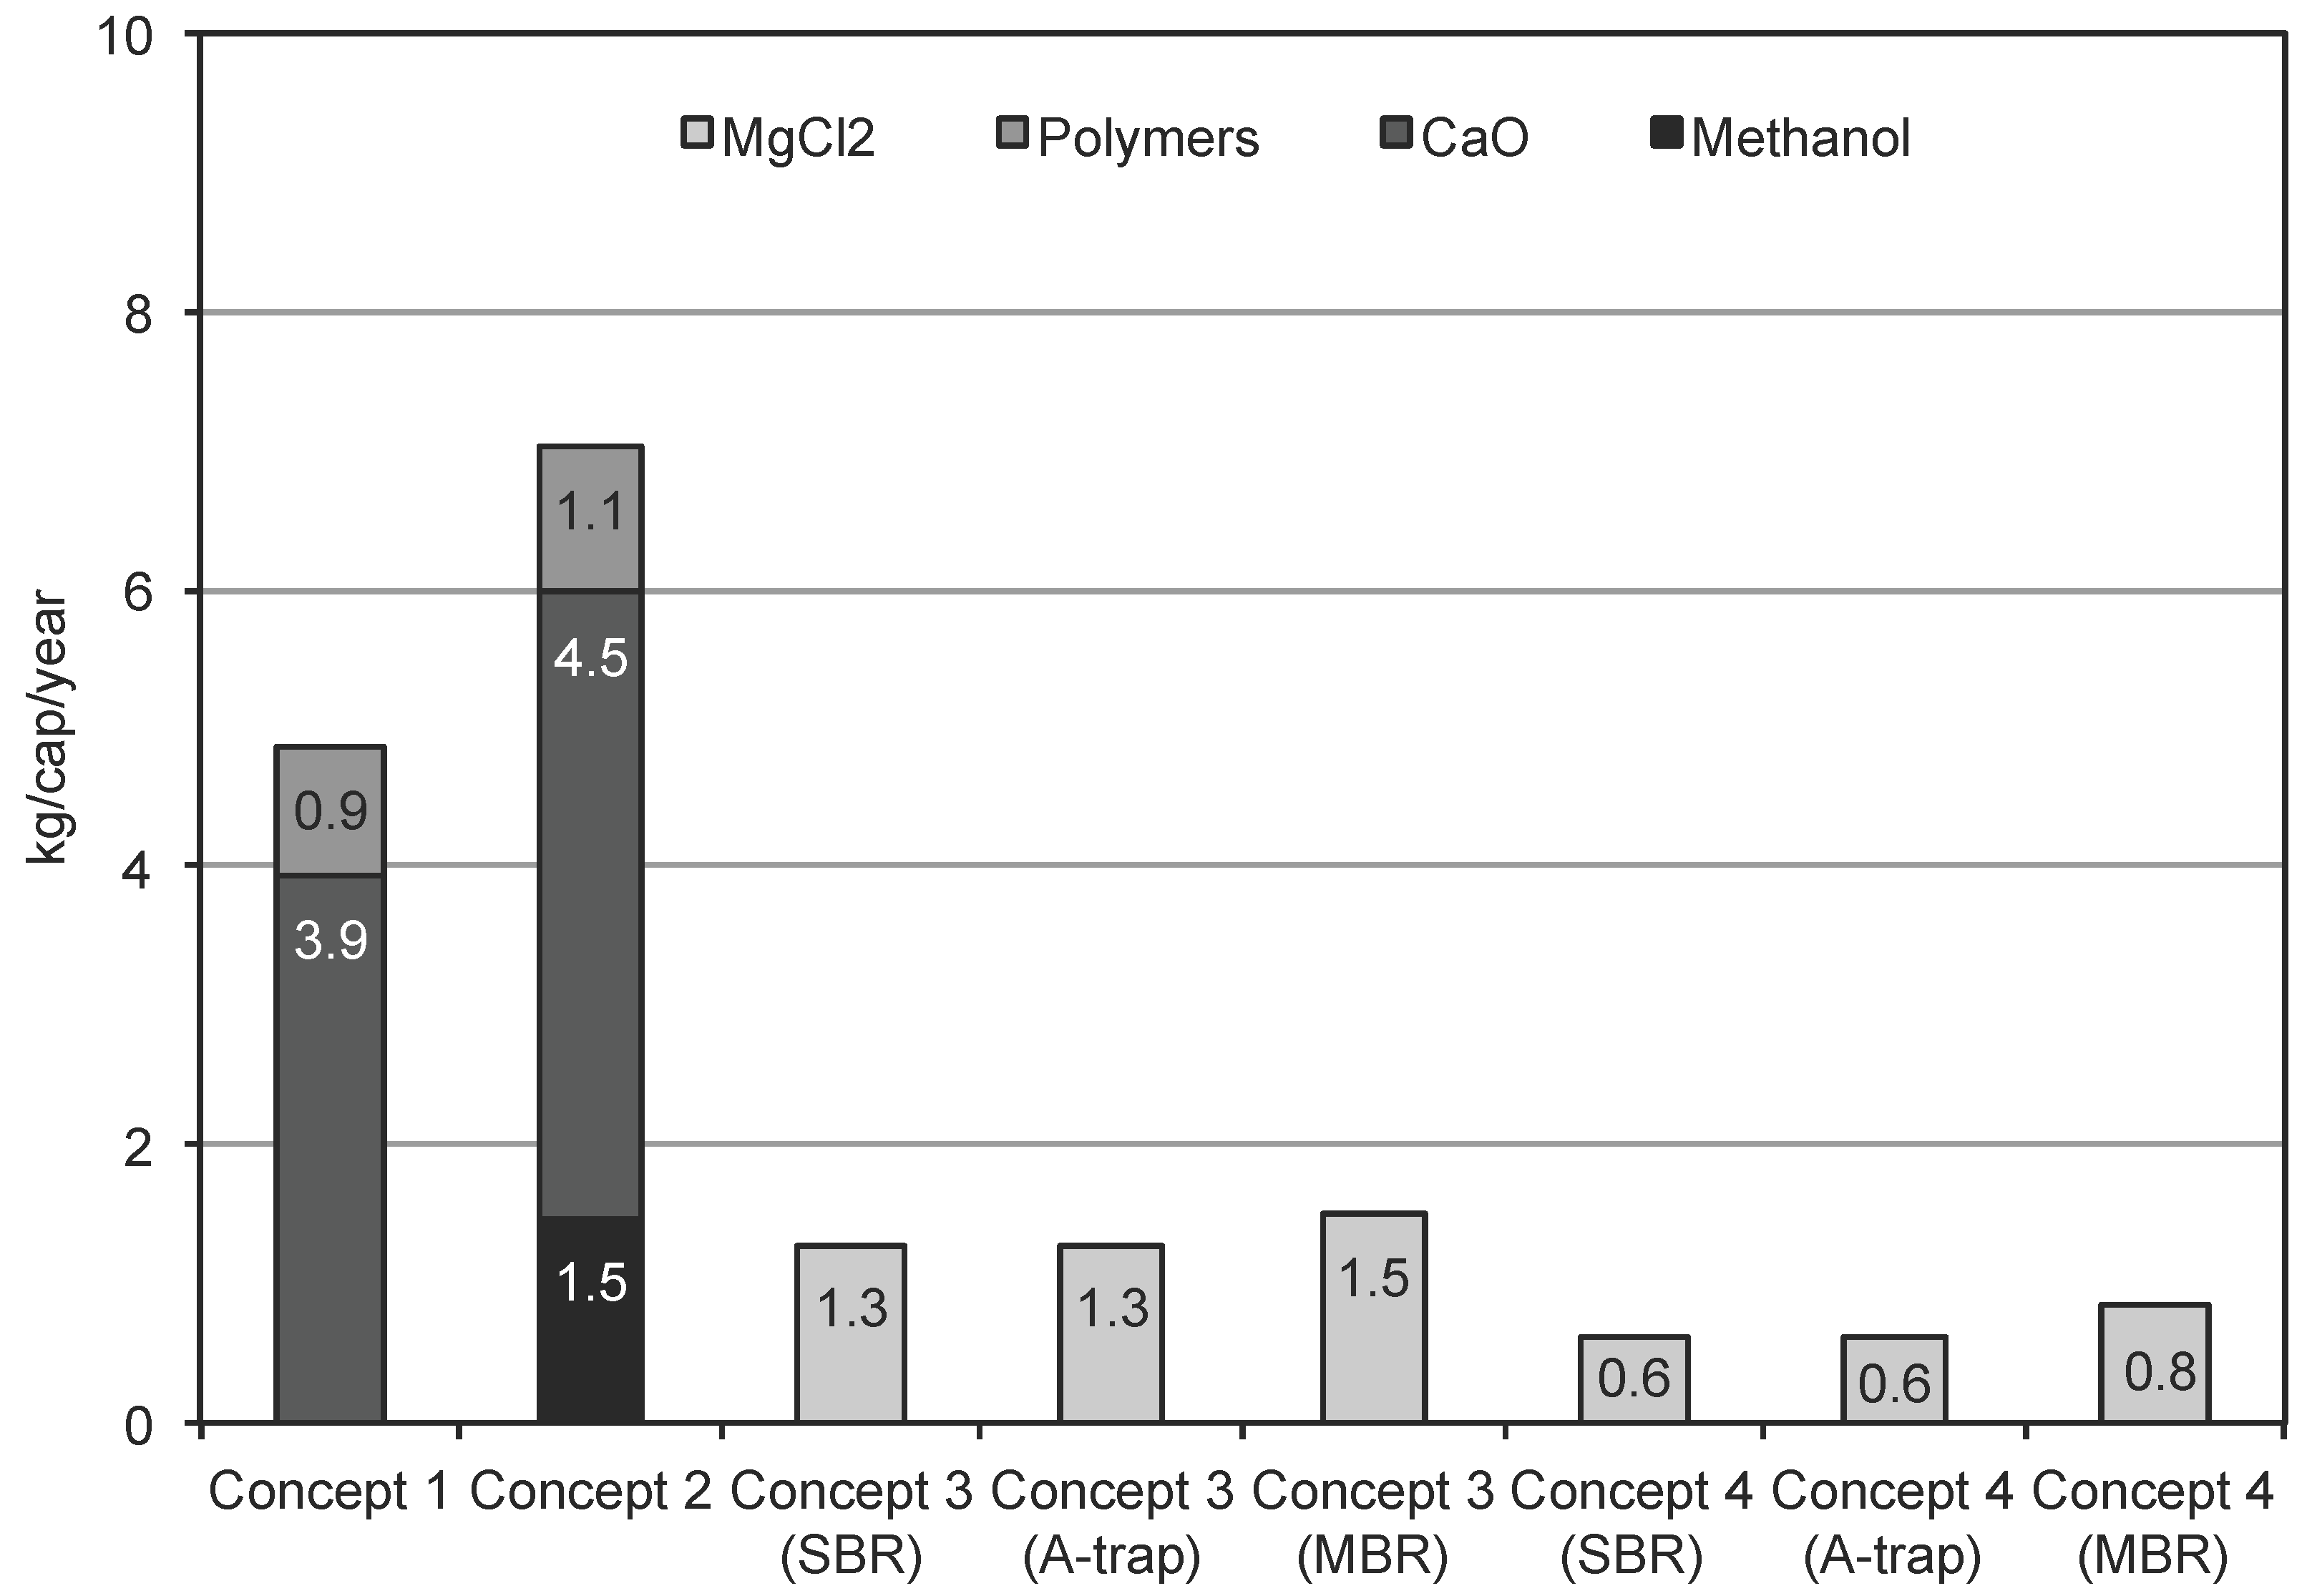
Figure 5 presents the chemical use in Concepts 1–4 with different grey water treatment configurations. The chemical use in Concepts 1 and 2 is considerably higher than in Concepts 3 and 4, due to the high sludge production in aerobic processes and the resulting consumption of polymers for sludge dewatering and CaO for flu gas treatment after sludge incineration. As the sludge production in Concept 2 is higher than in Concept 1 (due to the shorter SRT in the aerobic process), the chemical use is accordingly higher. Furthermore, additional chemical use in Concept 2 originates from the consumption of methanol in the post-denitrification step. As the amount of NaOH is calculated to be negligible, the only chemical taken into account in the struvite precipitation in Concepts 3 and 4 is MgCl2. The use of MgCl2 is the highest in Concept 3, due to the highest phosphate concentration in the OLAND reactor effluent. Grey water treatment in the MBR and the sub-sequent grey water sludge co-digestion in the UASB reactor slightly increases the MgCl2 consumption, due to the increased phosphate loading. The use of either a gravity or vacuum urine diverting toilet does not influence the chemical use in Concept 4. Contrary to the centralized concept, urine separation in the source-separation-based concept decreases the chemical use.
Figure 5. Chemical use in Concepts 1–4 with different grey water treatment configurations.
Water 05 01006 g005

3.6. Effluent Quality

Within the European Union, the discharge of wastewater effluent is controlled by the pollutant removal efficiencies of the treatment systems and the final effluent concentrations per connected person, according to the EU Water Framework Directive 91/271/EEC [45]. Table 5 presents the calculated effluent quality of the different sanitation concepts and the discharge standards. In Concepts 3 and 4, only the effluent discharge of the source-separated concentrated stream is taken into account, leaving out the grey water effluent that is considered to be reused. For simplicity, the effluent quality presented in Concepts 3 and 4 is the average of the different grey water treatment configurations (without co-digestion using the SBR or with co-digestion using the A-trap/MBR). The pollutant concentrations in the effluent of the concentrated stream are higher and the pollutant loadings are lower without grey water sludge co-digestion, due to the lower UASB reactor influent volume compared to co-digestion.
As the total pollutant removal efficiencies in Concepts 3 and 4 are mostly higher than in Concepts 1 and 2 (Table 3), the higher pollutant concentrations in the effluent in Concepts 3 and 4 originate from the higher concentrations in the source-separated streams. Consequently, according to the current discharge standards that are based on pollutant concentrations rather than pollutant loadings, the discharge of effluent in Concepts 3 and 4 is prohibited. However, as the pollutant loadings in the effluent in Concepts 3 and 4 decrease by up to 90% compared to Concepts 1 and 2, the future discharge standards ought to consider also the total pollutant load discharged from wastewater treatment. With urine separation (Concepts 2 and 4), both nutrient (N and P) concentrations and loadings are decreased.
Table 5. Calculated effluent quality in sanitation concepts and discharge standards.
ParameterUnitConcept 1Concept 2Concept 3Concept 4Discharge standards [45]
CODmg/L4644155187125
BOD5mg/L6248310025
TSSmg/L344739338535
TNmg/L963507015
TPmg/L4127172
CODg/cap/y50374802599551-
BOD5g/cap/y6572619321297-
TSSg/cap/y3723512915201148-
TNg/cap/y9866551392221-
TPg/cap/y43810910451-
The COD/BOD5 ratio of the effluent loading in Concept 1 is higher than in other concepts, originating from the high BOD5 removal efficiencies in the existing wastewater treatment plants in the Netherlands, applied in Concept 1. More data on the actual BOD5 removal efficiencies in the A-trap in Concept 2 and in the OLAND reactor in Concepts 3 and 4 is required to confirm the actual COD/BOD5 ratio of the effluent loading. To deal with the current discharge standards, further treatment of effluent in Concepts 3 and 4 need to be considered. However, according to the COD:N:P ratio of 100:20:1 necessary for biological treatment [28], the effluent is short in organic matter with a ratio of 100:226:18 (Concept 3) and 100:38:9 (Concept 4) and requires an alternative treatment method or a source of organic matter.

3.7. Land Area Requirement

The total volume of the treatment systems in Concept 1 is 0.32 m3/cap and in Concept 2 is 0.53 m3/cap, of which 0.38 m3/cap originates from the urine storage tank. The total volume of the treatment systems for black water and kitchen refuse (Concept 3) is 0.15–0.22 m3/cap and for feces and kitchen refuse (Concept 4) is 0.13–0.17 m3/cap, the lowest value being without grey water sludge co-digestion and the highest with grey water sludge co-digestion using the MBR for bio-flocculation of grey water. Grey water treatment in the SBR-TF requires a total volume of 0.16 m3/cap, the A-trap-TF requires 0.29 m3/cap and the MBR-TF requires 0.14 m3/cap. The total volume of the treatment systems in Concept 3 is 0.31–0.47 m3/cap and in Concept 4 is 0.67–0.81 m3/cap, reaching the highest volumes with the A-trap and the lowest with the SBR. Urine separation in both centralized and source-separation-based sanitation concepts increases the land area requirement, due to the large volume of the urine storage tank. In addition, the land use of the incineration process (Concept 1 and 2) will further increase the land area requirement. The lowest land area requirement is achieved with source-separation of black water and kitchen refuse, and by using the SBR for grey water treatment.

3.8. Sensitivity Analysis

The SRT applied in the high loaded biological reactors, such as the A-trap, can have significant influence on the pollutant removal efficiencies and resulting effluent quality. For example, the removal efficiencies of the A-trap used for sewage treatment in Concept 2 are significantly higher than of the A-trap used for grey water treatment in Concepts 3 and 4 (Table 3). The A-trap used for sewage treatment is according to the study of Wilsenach and van Loosdrecht [22] in which an SRT of 0.8 d was assumed to attain the highest effluent quality, while the SRT of the A-trap used for grey water treatment is according to the actual SRT of 0.6 d applied at the demonstration site of [34], resulting in lower removal efficiencies similar to the ones reported by Böhnke [14]. Consequently, if the SRT of the A-trap for grey water treatment is increased to 0.8 d, the pollutant removal efficiencies could be increased, resulting in higher effluent quality. Furthermore, effluent from the A-trap with higher quality could be reused according to the urban reuse standards, resulting in a significant indirect energy gain from water reuse, and turning the use of the A-trap and subsequent grey water sludge co-digestion into an energetically more favorable option than the use of the SBR. However, due to limited experimental data and the different composition of grey water and sewage, more research is required to confirm the relation between the SRT of the A-trap and the pollutant removal efficiencies.
A significant part of the total energy consumption in the sanitation concepts originates from the energy used for heating the digester and the UASB reactor. Location-specific data on the environmental temperature and the tap water temperature have a major effect on the energy demand of heating, as the tap water temperature defines the amount of energy used for heating up the influent, and the environmental temperature defines the amount of energy used to compensate heat loss through reactor walls. For example, if the tap water and environmental temperature is increased to 15 °C (as an average annual temperature in the south of Europe), the primary energy consumption for heating decreases by 13%–20% in all sanitation concepts. In contrast, if the tap water and environmental temperature is decreased to 6 °C (as an average annual temperature in the north of Europe), the primary energy consumption for heating increases by 15%–21% in all sanitation concepts. The location and the according temperatures may therefore affect the feasibility of grey water sludge co-digestion in the UASB reactor, especially when grey water is concentrated in the MBR with high sludge production.
The transport distance of urine and excess sludge is another location-specific parameter significantly influencing the energy balance of the sanitation concepts. Accessibility and the demand for fertilizers on agricultural land in the vicinity determines the transport distance of urine and excess sludge. In the case of centralized sanitation, the critical distance to agricultural land at which urine transport (Concept 2) becomes unfavorable compared to Concept 1 is 410 km, including the indirect energy gain from water saving and nutrient recovery. This distance covers transport of urine from the Netherlands to France and is higher than any actual distance to accessible agricultural land. However, to avoid high energy consumption of transporting, collected urine should be concentrated at long distances. When considering the use of a vapor compression distillation process with an average primary energy consumption of 337 MJ/m3 [46], the critical distance at which evaporation of urine becomes more favorable than transporting of urine is 90 km. In the case of source-separation-based sanitation, the critical distance to agricultural land at which urine and excess sludge transport (from the UASB reactor and the SBR) becomes unfavorable compared to Concept 1 is 140 km in Concept 3 and 150 km in Concept 4, including the indirect energy gain from water saving and reuse, and nutrient recovery. Furthermore, by using the A-trap for bio-flocculation of grey water and subsequent grey water sludge co-digestion in the UASB reactor, the critical distance is increased to 300 km in Concept 3 and to 180 km in Concept 4, covering the transport within the Netherlands. Although the transport of urine and excess sludge over long distances is never the optimal solution for nutrient recovery, the long critical distances presented above realizes the possibilities of implementing nutrient recovery technologies in locations surrounded by agricultural lands with a surplus of nutrients.
According to the study of Thibodeau et al. [19], one of the most critical factors influencing the economic viability of source-separation of black and grey water is the water consumption for vacuum toilet. Reduction in the vacuum toilet flow has a major effect, not only on the heating energy used for the UASB reactor, but also on the energy consumption for the vacuum collection and transport of wastewater. For example, if the water consumption for the vacuum toilet used for black water is decreased to 1.5 L/cap/d (0.25 L per flush) and the energy consumption for the vacuum collection is assumed to decrease by 75% ( 1.5 6 L), the energy consumption in Concept 3 can be decreased by 35%–55%, attaining the lowest primary energy consumption (156 MJ/cap/year using the SBR) of all the sanitation concepts, including the indirect energy gain from water saving and reuse, and nutrient recovery.

3.9. Outlook

This study provides insight into the influence of urine separation and different grey water treatment configurations [with (A-trap/MBR) and without (SBR) grey water sludge co-digestion] on the energy and material balances of centralized and source-separation-based sanitation concepts. The energy and material balances are based on collection, transport and treatment of wastewater, leaving out the energy and materials used in the construction and maintenance of the required infrastructure. However, according to Tidåker et al. [47], the energy use for the source-separation infrastructure is significant, and further research is therefore needed to complete the total lifecycle of the sanitation concepts.
This study emphasizes the direct reuse of source-separated urine as a multicomponent fertilizer in agriculture. Besides the downside of urine transport, direct reuse also involves concerns about the contamination of soil and plants by pharmaceutical residues present in urine [48]. Further research on technologies for indirect resource recovery from urine would help to address both of these issues. Nevertheless, micro-pollutants are widely measured also from wastewater effluents and receiving water bodies, posing an actual contamination risk on the surrounding agriculture and drinking water production [49]. Clearly, micro-pollutants are of concern, not only in the reuse of source-separated waste streams, but in the whole urban water cycle.
To guarantee the optimal energy recovery from domestic wastewater streams, the influence of grey water sludge co-digestion on the UASB reactor performance, in particular, the effect of surfactants on the digestion process, needs to be further investigated. In addition, the effect of grey water sludge co-digestion on the excess sludge quality in terms of heavy metals and micro-pollutants should be determined.
Beside struvite recovery, further research should focus on alternative phosphorus recovery technologies to minimize the chemical use and to produce other phosphorus products, such as calcium phosphate, more suited for the needs of current fertilizer industries. Furthermore, to promote the full closing of carbon and nutrient cycles, a better understanding on the origin of heavy metals in the excess sludge of the UASB reactor is required. By targeted and functional standards for the sludge reuse in agriculture, resources from the source-separated waste streams can be recovered in such a way that the soil quality is improved.

4. Conclusions

The highest primary energy consumption of 914 MJ/cap/year is attained within the centralized sanitation concept. By coupling the centralized concept with source-separation of urine, the energy consumption is decreased to 687 MJ/cap/year and, further, to 501 MJ/cap/year with an indirect energy gain from water saving and nutrient recovery.
Source-separation of black water, kitchen refuse and grey water results in a primary energy consumption of 767 MJ/cap/year, and in a consumption of 522 MJ/cap/year with indirect energy gain from water saving and reuse, and nutrient recovery. Urine separation within the source-separation-based sanitation concept decreases the energy consumption to 567 MJ/cap/year with a gravity urine diverting toilet and to 555 MJ/cap/year with a vacuum urine diverting toilet. With the indirect energy gain from water saving and reuse, and nutrient recovery, the energy consumptions are further decreased, reaching the lowest energy consumptions of 208 MJ/cap/year (gravity) and 190 MJ/cap/year (vacuum) of all the sanitation concepts.
Source-separation of urine not only improves the energy balance and nutrient recovery, but also increases the effluent quality in terms of nutrient concentrations and the overall pollutant loading in both centralized and source-separation-based sanitation concepts. However, larger land area and higher chemical use in the centralized concept is required.
Grey water bio-flocculation in the A-trap and subsequent grey water sludge co-digestion in the UASB reactor decreases the primary energy consumption by 19% in the source-separation of black water and 22% (gravity) and 21% (vacuum) in the source-separation of urine and feces, compared to grey water treatment in the SBR without grey water sludge co-digestion. However, as grey water effluent from the A-trap does not comply with the water reuse standards, in contrast to effluent from the SBR, the use of the SBR for grey water treatment becomes energetically more favorable than the A-trap when indirect energy gain from water reuse is taken into account. Although grey water effluent from the MBR is applicable for water reuse, the high sludge production and the resulting high energy consumption makes the use of the MBR energetically unfavorable.

Acknowledgments

This work was performed in the TTIW cooperation framework of Wetsus, center of excellence for Sustainable Water Technology. Wetsus is funded by the Dutch Ministry of Economic Affairs, the European Union Regional Development Fund, the Province of Fryslân, the City of Leeuwarden and the EZ/Kompas program of the Samenwerkingsverband Noord-Nederland. The authors would like to thank the participants of the research theme “Separation at Source” for the fruitful discussions and their financial support.

A. Appendix

A.1. Calculations for Energy Balance

E c o l l e c t i o n was the energy requirement for the gravity sewers with lifting stations (20 kWh/cap/y) [50] in Concepts 1 and 2, for the vacuum collection and transport of black water and kitchen refuse (25 kWh/cap/y) [4] in Concept 3 and for the vacuum collection and transport of feces and kitchen refuse (8 kWh/cap/y) in Concept 4 (assumed to be 1 3 of the energy requirement for the black water vacuum collection according to the water consumption ratio of 2 6 L). Urine separation in Concept 2 was assumed not to have a significant effect on the total wastewater flow and, thus, on the energy requirement for the collection. Due to short wastewater transport distances in semi-centralized sanitation, the energy requirement for the gravity urine diverting toilet was assumed to be insignificant. The collection also included the energy consumption for the kitchen grinder (5 kWh/cap/y) [4] in all of the sanitation concepts.
In Concepts 1 and 2, E t r e a t m e n t consisted of the following energy parameters. E a e r a t i o n was the aeration energy required to oxidize organic matter and nitrogen in the AS process, A-trap and post-nitrification step and was calculated based on an energy requirement of 2.2 MJ/kgCODconverted and 14 MJ/kgNconverted [7]. The aeration energy was calculated based on the fraction of oxidized COD of the total COD removed (43% in Concept 1 and 22% in Concept 2) and the fraction of nitrified N of the total N removed (94% in Concept 1 and 76% in Concept 2) [22]. E m i x i n g was the energy requirement for mixing of the biological reactors and the anaerobic digester, and E p u m p i n g was the energy requirement for pumping of the internal flows, return activated sludge and excess sludge to the anaerobic digester [22]. In Concept 1, additional mixing energy of 5 MJ/kg Premoved originated from the biological phosphorus removal [7]. E h e a t i n g ( d i g e s t e r ) was the energy required to heat up the influent (excess sludge) to the operational temperature of the digester and to compensate heat loss through the digester walls. The primary energy required to heat up the influent was calculated according to Equation (A1):
Δ Q = m C Δ T
where ΔQ is the required energy (J), m is the mass of liquid (g), C is the specific heat capacity of water (4.2 J/g °C) and ΔT is the temperature difference between the influent temperature and the operational temperature of the reactor. The influent temperature of the digester (Concept 1 and 2) was considered to be the tap water temperature (12 °C). The primary energy required to compensate heat loss was calculated according to Fourier’s law presented in Equation (A2):
E h e a t = Φ = λ A d T d x
where Φ is the heat transfer (W), λ is the thermal conductivity of the isolation material (W/m*k), A is the heat transfer area, dT is the temperature difference across the isolation material (K) and dx is the thickness of the isolation material (m). Mineral wool with thermal conductivity of 0.04 W/m*k and thickness of 0.05 m was considered to be used as isolation material [5]. The area of heat transfer was considered to be the surface area of the reactor (calculated from the volume and dimensions of the reactor presented under the sub-chapter Calculations for reactor dimensions and land area requirement), and the temperature difference was considered to be the difference between the environmental temperature (10 °C) and the operational temperature of the reactor (35 °C). E d e w a t e r i n g and E i n c i n e r a t i o n were the primary energy requirements for dewatering of the digested sludge and for incinerating the dewatered sludge according to the study of Wilsenach and van Loosdrecht [22], from which they were recalculated to primary energy using an efficiency of 0.31. The heat production in the incineration of sludge was taken into account in the energy requirement.
Esludge transport was the energy requirement for transporting of dewatered sludge to the incineration plant and was calculated based on a primary energy requirement of 4.8 MJ/t/km (including empty return trip) [22]. Eurine transport was the energy requirement for transporting of urine from the on-site collection to agricultural land and was calculated based on the energy requirement of transporting described above.
E m e t h a n e was the energy produced as methane in the digestion of excess sludge and was calculated by taking into account the different excess sludge compositions in Concepts 1 and 2, originating from the different SRTs (12 d and 0.8 d, respectively). As presented in the study of Wilsenach and van Loosdrecht [22], excess sludge from the A-trap was considered to consist of 25% adsorbed substrate and 75% biomass. The methanization level of the adsorbed substrate was assumed to be 73% [51]. No adsorbed substrate was considered in Concept 1, due to the high SRT. The fraction of biodegradable biomass in Concept 1 was assumed to be 45% and in Concept 2 65%, and the methanization level of this fraction was considered to be 90% [22]. The volume of the produced methane was calculated using a theoretical methane production of 0.35 L/gCOD, and the primary energy production from methane was calculated using the volume of methane and the calorific value of methane (35.8 MJ/m3) [28].
The sludge production in the AS process (Concept 1) and the A-trap (Concept 2) was calculated according to Tchobanoglous et al. [28] [Equation (A3)]:
P = Y Q ( S 0 S )
where P is the sludge production (kgVSS/d), Y is the sludge yield (kgVSS/kg BODremoved), Q is the influent flow (m3/d), S0 is the influent BOD concentration (mg/L) and S is the effluent BOD concentration (mg/L). A sludge yield of 0.58 kgVSS/kg BODremoved was used for the AS process (SRT 12 d) and 0.85 kgVSS/kg BODremoved for the A-trap (SRT 0.8 d) at 12 °C. The sludge production as total solids was calculated using a VSS/TSS ratio of 0.85 [28]. The total wet sludge production was calculated using a dry solid content of 2.5%, and the total dry sludge production (after dewatering) was calculated using a dry solid content of 20% [22]. In Concept 1, additional sludge production of 3.3 kgTSS/kg Premoved was assumed to originate from the biological phosphorus removal [7].
The composition of the sludge rejection water (COD, TN and TP) was defined as the difference between the digester influent (excess sludge from the AS process and A-trap) and the COD converted into methane and nitrogen and phosphorus incorporated into the anaerobic biomass. The amount of biomass produced in the digester was calculated using a biomass yield of 0.08 gVSS/g CODconverted, and the amount of nitrogen and phosphorus incorporated into the biomass was calculated using fractions of 0.12 gN/g VSS and 0.03 gP/g VSS, respectively [28]. All of the nitrogen and phosphorus in the sludge rejection water was considered to be in the inorganic form of NH4+ and PO43−.
In Concepts 3 and 4, E t r e a t m e n t consisted of the following energy parameters. E h e a t i n g ( U A S B ) was the energy required to heat up the influent to the operational temperature of the reactor and to compensate heat loss through the reactor walls, calculated as described above with the digester in Concepts 1 and 2. The influent temperature of the UASB reactor was calculated from the mass proportions of the according wastewater sub-streams (Table 2). In the case of grey water sludge co-digestion in the UASB reactor, the influent temperature was adjusted with the temperature of grey water sludge that was assumed to be the environmental temperature (10 °C). No heating energy for other treatment steps were taken into account. E O L A N D was the energy requirement for the OLAND reactor and was derived from the rotating power requirement of the rotating biological contactor according to Fujie et al. [52] [Equation (A4)]).
P ( w ) = λ 1 N 2 D 2 A
where A is the surface area of the discs (m2), λ1 is the frictional constant (8.6*10−6 kWmin2/min4), N is the rotational speed of a disc (min−1) and D is the disc diameter (m). The surface area of the discs was calculated from the total nitrogen load and the biofilm load (6300 mgN/m2/d [53]). The disc rotational speed of 3 min−1 [6] and the disc diameter of 1 m [52] were selected. E S t r u v i t e was the energy requirement for the struvite precipitation and was calculated based on an electricity consumption of 3.8 kWh/kgNinfluent [53]. E T F was the energy requirement for the trickling filter as a post-treatment step in both black water and grey water treatment lines and was calculated based on an average electricity consumption of 3 kW/1000 m3influent [28]. E M B R was the energy requirement for the MBR and was calculated based on an average electricity consumption of 0.3 kWh/m3greywater [54]. The electricity consumption for the OLAND reactor, struvite precipitator, TF and the MBR was converted to primary energy using an efficiency of 0.31 [36]. E S B R and E A t r a p were the energy requirements for grey water treatment in the SBR and the A-trap, respectively, consisting of energy consumption for pumping and aeration. Energy consumption for pumping was calculated with Equation (A5) according to Karassik et al. [55]:
E p u m p ( k W ) = Q ( m 3 d ) H ( m ) s p e c i f i c g r a v i t y o f f l u i d 367.7 η
where Q is the flow rate, H is the pump head and η is the pump efficiency. For the SBR, the pump head was considered to be the height of wastewater in the reactor. For the A-trap, the pump head was considered to be the height of the buffer tank for influent pump and the height of the aerated grit chamber and settling tank for the two intermediate pumps (calculations for pump head are presented in the sub-chapter Calculations for reactor dimensions and land area requirement). The specific gravity of fluid was considered to be one and η was set to 0.68, according to the study of Wilsenach and van Loosdrecht [22]. The total energy consumption for pumping in the SBR was calculated from the energy consumption for two pumps: influent and effluent pump, feeding and discharge time of 15 min each and a total cycle time of 360 min [9]. The total energy consumption for pumping in the A-trap was calculated by assuming the pumping to be continuous. The energy requirement for pumping of the UASB influent was calculated to be insignificant and was not included in the energy balance. The energy consumption for aeration in the SBR and the A-trap was calculated according to the energy requirement of 2.2 MJ/kgCODconverted [7]. The amount of oxidized COD in the SBR was calculated by defining the total amount of biodegradable COD removed in the reactor using a CODbiodegradable/BOD5 ratio of 1.6 g/g [28] and excluding the amount of COD removed in the sludge using a sludge yield of 0.12 kgVSS/kgCOD [9] and a COD/VSS ratio of 1.4. The amount of oxidized COD in the A-trap was assumed to be 11% of the incoming COD [34]. Nitrogen removal in the SBR and A-trap was assumed to take place only through the excess sludge removal.
E s l u d g e t r a n s p o r t and E u r i n e t r a n s p o r t were the energy requirements for transporting of excess sludge from the UASB reactor and the SBR and urine, respectively, from the on-site collection to agricultural land, and was calculated based on the primary energy requirement of 4.8 MJ/t/km (including empty return trip) [22].
E m e t h a n e was the energy produced as methane in the UASB reactor. The volume of produced methane was calculated from the COD load of the reactor, the methanization level of the influent and the theoretical methane production of 0.35 L/gCOD. The methanization level of the influent was calculated as a mass proportion of the methanization levels of the sub-streams (70% for black water with kitchen refuse, 78% for feces with kitchen refuse [5] and 88% for grey water sludge [12]). The primary energy production from methane was calculated using the volume of methane and the calorific value of methane (35.8 MJ/m3) [28].
The sludge production in the UASB reactor was calculated according to Zeeman and Lettinga [56] [Equation (A6)]:
X p = O S S R ( 1 H )
where Xp is the sludge production (kgCOD/m3/d), O is the organic loading rate (2.98 kgCOD/m3/d [33]), SS is the fraction of suspended solids in the influent (CODss/CODtotal) (0.76 with a mixture of black water and kitchen refuse, and 0.88 with a mixture of feces and kitchen refuse [5]), R is the fraction of CODss removed (0.96 [33]) and H is the level of hydrolysis of the removed solids (0.7 [5]). The total wet sludge production was calculated using the volume of the UASB reactor (calculations for the reactor volume are presented in the sub-chapter Calculations for reactor dimensions and land area requirement) and the sludge concentration (34 gCOD/L [27]). The sludge production in the SBR was calculated using a sludge yield of 0.12 kgVSS/kgCODremoved and a sludge concentration of 5.5 gVSS/L [9]. The sludge production in the A-trap was calculated using a sludge yield of 0.73 kgVSS/kgCODremoved and a sludge concentration of 6.3 gVSS/L [34]. The sludge production in the MBR was calculated from the flow mass balance of the system using a SRT of 1 d and HRT of 1.9 h [12].

A.2. Calculations for Chemical Use

Consumption of NaOH in struvite precipitation was calculated using Equation (A7):
m N a O H = M N a O H 10 14 ( 10 p H b 10 p H a )
where mNaOH is the mass of NaOH (g/L), M is the molecular mass (g/mol), pHa is the influent pH of 7.7 [33] and pHb is the operational pH of 9 [35]. Consumption of 33% NaOH was further determined from the mass of NaOH.

A.3. Calculations for Reactor Dimensions and Land Area Requirement

The volume of the biological reactors and secondary settling tanks were according to Wilsenach and van Loosdrecht [22], and the volume of the buffer tanks, urine storage tank and reactors (digester/UASB, struvite, MBR and A-trap) were determined using the influent flow rate and the storage time or the HRT. The volume of the A-trap consisted of three parts: aerated grit chamber, A-trap reactor and settling tank. The storage time was 1 d for the UASB buffer tank (assumed), 0.3 d for the SBR, A-trap and MBR buffer tanks (assumed) and six months for the urine collection tank [7]. The HRT was 15 d for the digester [22], 0.08 d for the struvite reactor [35], 1.9 h for the MBR [12], 4 min and 54 min for the aerated grit chamber and settling tank, respectively [57], and 1.9 h for the A-trap reactor [34]. The HRT of the UASB reactor was calculated according to Zeeman and Lettinga [56] [Equation (A8)]:
H R T = C S S X R ( 1 H ) S R T
where C is the influent, CODtotal concentration (gCOD/L), X is the sludge concentration in the reactor (34 gCOD/L [27]), SS is the fraction of suspended solids in the influent (CODss/CODtotal) (0.76 with a mixture of black water and kitchen refuse and 0.88 with a mixture of feces and kitchen refuse [5]), R is the fraction of CODss removed (0.96 [33]), H is the level of hydrolysis of the removed solids (0.7 [5]), and SRT is the sludge retention time (d) calculated from the sludge production (kgCOD/m3/d) and the sludge concentration in the reactor.
The volume of the biogas storage tank was calculated using the volume of produced methane, the fraction of methane in biogas (65% [28]) and storage time of 1 d [5]. The volume of the SBR was calculated using the volume of wastewater per cycle (360 min) and a volumewastewater/volumetotal ratio of 0.3 m3/m3 [28]. The volume of a single-stage TF was determined according to Tchobanoglous et al. [28] [Equation (A9)]:
V = W ( 100 e ( 1 + 0 . 4432 ) ) 2
where W is the BOD5 loading and e is the BOD5 removal efficiency. The depth of the filter was set to 2.1 m as the average depth in standard rate filters.
The volume of the OLAND reactor was determined from the length, width and height of the reactor. The length of the reactor was determined by the length of the shaft and the width and height by the disc diameter. To calculate the length of the shaft, the total number of discs was defined from the total surface area of discs and the disc diameter (determined previously with the energy requirement of OLAND). The length of the shaft was calculated using a disc thickness of 0.5 cm and a disc interspace of 1 cm [6]. The length, width and height of the reactor was then determined using the length of the shaft and the disc diameter, respectively, with 15% of the disc diameter as extra space.
Height of the buffer tanks, digester, UASB reactor and SBR was calculated using Equation (A10), which was derived from the equation for cylinder volume using f as a height/diameter ratio.
H = 4 V c y l i n d e r f 2 π 3 , f = H d
where Vcylinder is the volume of the reactor and f is the height/diameter ratio that was assumed to be three with the exception of the SBR with a ratio of 1. The diameter was calculated using an assumed maximum height of 5 m as a boundary condition.
The height of the aerated grit chamber and settling tank of the A-trap was calculated using Equation (A11), which was derived from the sum of cube volume and pyramid volume using f as the heightpyramid/heightvessel ratio:
H = V v e s s e l A ( 1 2 3 f ) , f = H p y r a m i d H v e s s e l
Vvessel is the volume of the aerated grit chamber and settling tank, A is the surface area and f is the heightpyramid/heightvessel ratio of 0.1 for the aerated grit chamber and 0.5 for the settling tank. The surface area of the aerated grit chamber was calculated using a maximum surface loading of 30 m3/(m2h), and the surface area of the settling tank was calculated using a maximum surface loading of 1.5 m3/(m2h) [57]. The height of the A-trap reactor was considered to be the difference between the height of the vessel and the height of the pyramid.
A.4. Energy Balance

Table A1 presents the sludge production, urine collection, and the energy consumption and production (methane) in Concepts 1 and 2.
Table A2 presents the UASB reactor influent characteristics, sludge production in the UASB reactor, SBR, A-trap and MBR, and the urine collection in Concepts 3 and 4.
Table A1. Sludge production, urine collection, and energy consumption and production (methane) in Concepts 1 and 2 (primary energy presented as bolded figures).
ParameterUnitConcept 1Concept 2
Urine collectionkg/cap/y-743
Sludge productionkgWS/cap/y10481201
EcollectionkgDS/cap/y131150
kWh/cap/y2525
MJ/cap/y288288
EaerationMJ/cap/y13568
MJ/cap/y432218
EmixingMJ/cap/y3717
MJ/cap/y11854
EpumpingMJ/cap/y2015
MJ/cap/y6448
Eheating(digester)MJ/cap/y104114
EdewateringMJ/cap/y55
Esludge transportMJ/cap/y67
Eincineration transportMJ/cap/y5452
Eurine transportMJ/cap/y-178
EmethaneMJ/cap/y157277
EtotalMJ/cap/y914687
Notes: WS = Wet Sludge; DS = Dry Sludge.
Table A2. UASB influent characteristics, sludge production and urine collection in Concepts 3 and 4 with different grey water treatment configurations (without co-digestion using the SBR or with co-digestion using the A-trap/MBR) (UASB = up-flow anaerobic sludge blanket reactor, OLAND = oxygen limited anaerobic nitrification denitrification, struvite precipitator, TF = trickling filter, SBR = sequencing batch reactor, A-trap = A-stage of AB-process and MBR = membrane bioreactor).
ParameterUnitConcept 3Concept 4
SBRA-trapMBRGravity toiletVacuum toilet
SBRA-trapMBRSBRA-trapMBR
UASB influent
Volumem3/cap/y345234123
Temperature°C161513121111111110
Methanization level%707980787980787980
Sludge production
UASB reactorkg/cap/y277321365299343394299343394
SBR/A-trap/MBRkg/cap/y373682212837368221283736822128
Urine collectionkg/cap/y---743743743743743743
Table A3 presents the energy consumption and production (methane) in Concepts 3 and 4 with different grey water treatment configurations (without co-digestion using the SBR or with co-digestion using the A-trap/MBR).
Table A3. Energy consumption and production (methane) in Concepts 3 and 4 (primary energy presented as bolded figures) (UASB = up-flow anaerobic sludge blanket reactor, OLAND = oxygen limited anaerobic nitrification denitrification, struvite precipitator, TF = trickling filter, SBR = sequencing batch reactor (SBR), A-trap = A-stage of AB-process and MBR = membrane bioreactor).
ParameterUnitConcept 3Concept 4
SBRA-trapMBRGravity toiletVacuum toilet
SBRA-trapMBRSBRA-trapMBR
EcollectionkWh/cap/y303030555131313
MJ/cap/y346346346585858150150150
Eheating(UASB)MJ/cap/y341422584305385547199280441
EOLANDkWh/cap/y1.31.62.20.20.30.40.30.40.8
MJ/cap/y151825235359
EStruvitekWh/cap/y4.45.47.50.81.01.50.91.52.7
MJ/cap/y51628691217101731
ETF (BW)kWh/cap/y0.20.30.40.20.20.30.10.10.2
MJ/cap/y235223112
Esludge transportMJ/cap/y156778816183951618395
ESBRMJ/cap/y33--33--33--
MJ/cap/y106--106--106--
EA-trapMJ/cap/y-7.2--7.2--7.2-
MJ/cap/y-23--23--23-
EMBRkWh/cap/y--8.7--8.7--8.7
MJ/cap/y--100--100--100
ETF (GW)kWh/cap/y2.12.12.12.12.12.12.12.12.1
MJ/cap/y242424242424242424
Eurine transportMJ/cap/y---178178178178178178
EmethaneMJ/cap/y274352401278324373278324373
EtotalMJ/cap/y767624857567444654555437658

References

  1. Larsen, T.A.; Alder, A.C.; Eggen, R.I.; Maurer, M.; Lienert, J. Source separation: Will we see a paradigm shift in wastewater handling? Environ. Sci. Technol. 2009, 43, 6121–6125. [Google Scholar] [CrossRef] [PubMed]
  2. Otterpohl, R.; Braun, U.; Oldenburg, M. Innovative technologies for decentralized water-, wastewater and biowaste management in urban and peri-urban areas. Water Sci. Technol. 2003, 48, 23–32. [Google Scholar] [PubMed]
  3. Wilsenach, J.A.; Maurer, M.; Larsen, T.A.; van Loosdrecht, M.C.M. From waste treatment to integrated resource management. Water Sci. Technol. 2003, 48, 1–9. [Google Scholar] [PubMed]
  4. Zeeman, G.; Kujawa, K.; de Mes, T.; Hernandez, L.; de Graaff, M.; Abu-Ghunmi, L.; Mels, A.; Meulman, B.; Temmink, H.; Buisman, C.; et al. Anaerobic treatment as a core technology for energy, nutrients and water recovery from source-separated domestic waste(water). Water Sci. Technol. 2008, 57, 1207–1212. [Google Scholar] [CrossRef] [PubMed]
  5. Kujawa, K. Anaerobic Treatment of Concentrated Wastewater in DESAR Concepts; STOWA: Utrecht, the Netherlands, 2005. [Google Scholar]
  6. Vlaeminck, S.E.; Terada, A.; Smets, B.F.; Linden, D.V.D.; Boon, N.; Verstraete, W.; Carballa, M. Nitrogen removal from digested black water by one-stage partial nitritation and anammox. Environ. Sci. Technol. 2009, 43, 5035–5041. [Google Scholar] [CrossRef] [PubMed]
  7. Maurer, M.; Schwegler, P.; Larsen, T. Nutrients in urine: Energetic aspects of removal and recovery. Nutr. Remov. Recover. 2003, 48, 37–46. [Google Scholar]
  8. Larsen, T.A.; Lienert, J. NoMix–A New Approach to Urban Water Management; Novaquatis Final Report; Eawag: Dübendorf, Switzerland, 2007. [Google Scholar]
  9. Hernández Leal, L.; Temmink, H.; Zeeman, G.; Buisman, C.J. Comparison of three systems for biological greywater treatment. Water 2010, 2, 155–169. [Google Scholar] [CrossRef]
  10. Avery, L.M.; Frazer-Williams, R.A.D.; Winward, G.; Shirley-Smith, C.; Liu, S.; Memon, F.A.; Jefferson, B. Constructed wetlands for grey water treatment. Ecohydrol. Hydrobiol. 2007, 7, 191–200. [Google Scholar] [CrossRef]
  11. Brix, H.; Arias, C.A. The use of vertical flow constructed wetlands for on-site treatment of domestic wastewater: New Danish guidelines. Ecol. Eng. 2005, 25, 491–500. [Google Scholar] [CrossRef]
  12. Hernández Leal, L.; Temmink, H.; Zeeman, G.; Buisman, C.J.N. Bioflocculation of grey water for improved energy recovery within decentralized sanitation concepts. Bioresour. Technol. 2010, 101, 9065–9070. [Google Scholar] [CrossRef] [PubMed]
  13. García-Morales, J.L.; Nebot, E.; Romero, L.I.; Sales, D. Comparison between acidogenic and methanogenic inhibition caused by linear alkylbenzene-sulfonate (LAS). Chem. Biochem. Eng. Q. 2001, 15, 13–20. [Google Scholar]
  14. Böhnke, B. Energieminimierung durch das Adsorptions-Belebungsverfahren; Gewässerschutz Wasser Abwasser No. 49; Instituts für Siedlungswasserwirtschaft der RWTH: Aachen, Germany, 1981. [Google Scholar]
  15. Otterpohl, R.; Grottker, M.; Lange, J. Sustainable water and waste management in urban areas. Water Sci. Technol. 1997, 35, 121–133. [Google Scholar] [CrossRef]
  16. Hellström, D. Exergy analysis: A comparison of source separation systems and conventional treatment systems. Water Environ. Res. 1999, 71, 1354–1363. [Google Scholar] [CrossRef]
  17. Benetto, E.; Nguyen, D.; Lohmann, T.; Schmitt, B.; Schosseler, P. Life cycle assessment of ecological sanitation system for small-scale wastewater treatment. Sci. Total Environ. 2009, 407, 1506–1516. [Google Scholar] [CrossRef] [PubMed]
  18. Makropoulos, C.; Natsis, K.; Liu, S.; Mittas, K.; Butler, D. Decision support for sustainable option selection in integrated urban water management. Environ. Model. Softw. 2008, 23, 1448–1460. [Google Scholar] [CrossRef]
  19. Thibodeau, C.; Monette, F.; Glaus, M.; Laflamme, C.B. Economic viability and critical influencing factors assessment of black water and grey water source-separation sanitation system. Water Sci. Technol. 2011, 64, 2417–2424. [Google Scholar] [CrossRef] [PubMed]
  20. Van Beuzekom, I.; Dekker, S.; Teunissen, M. Duurzame afvalwaterbehandeling Geerpark Heusden; Grontmij: De Bilt, the Netherlands, 2010. [Google Scholar]
  21. KNMI (Koninklijk Nederlands Meteorologisch Instituut). Annual Report 2010: KNMI round the Clock; KNMI: De Bilt, the Netherlands, 2010. [Google Scholar]
  22. Wilsenach, J.A.; van Loosdrecht, M.C.M. Integration of processes to treat wastewater and source-separated urine. J. Environ. Eng. 2006, 132, 331–341. [Google Scholar] [CrossRef]
  23. Statistics Netherlands. Urban Wastewater Treatment per Province and River Basin District; Statistics Netherlands: Den Haag, the Netherlands, 2011.
  24. Kujawa-Roeleveld, K.; Zeeman, G. Anaerobic treatment in decentralised and source-separation-based sanitation concepts. Rev. Environ. Sci. Biotechnol. 2006, 5, 115–139. [Google Scholar] [CrossRef]
  25. Larsen, T.A.; Peters, I.; Alder, A.; Eggen, R.; Maurer, M.; Muncke, J. Re-engineering the toilet for sustainable waste water management. Environ. Sci. Technol. 2001, 35, 192–197. [Google Scholar] [CrossRef]
  26. Hernández Leal, L.; Temmink, H.; Zeeman, G.; Buisman, C. Characterization and anaerobic biodegradability of grey water. Desalination 2011, 270, 111–115. [Google Scholar] [CrossRef]
  27. De Graaff, M.S.; Temmink, H.; Zeeman, G.; Buisman, C.J.N. Anaerobic treatment of concentrated black water in a UASB reactor at a short HRT. Water 2010, 2, 101–119. [Google Scholar] [CrossRef]
  28. Tchobanoglous, G.; Burton, F.L.; Stensel, H.D. Wastewater Engineering: Treatment and Reuse, 4th ed.; McGraw-Hill Series in Civil and Environmental Engineering; McGraw-Hill: New York, NY, USA, 2004. [Google Scholar]
  29. Vinnerås, B.; Nordin, A.; Niwagaba, C.; Nyberg, K. Inactivation of bacteria and viruses in human urine depending on temperature and dilution rate. Water Res. 2008, 42, 4067–4074. [Google Scholar] [CrossRef] [PubMed]
  30. World Health Organization (WHO). Guidelines for the Safe Use of Wastewater, Excreta and Greywater, Volume 3: Wastewater and Excreta Use in Aquaculture; World Health Organization: Geneva, Switzerland, 2006. [Google Scholar]
  31. Frijns, J.; Mulder, M.; Roorda, J. Op weg Naar een Klimaatneutrale Waterketen; STOWA: Utrecht, the Netherlands, 2008. [Google Scholar]
  32. RIONED Foundation. Urban Drainage Statistics 2009–2010; RIONED Foundation: Ede, the Netherlands, 2009. [Google Scholar]
  33. Kujawa-Roeleveld, K.; Weijma, J.; Nanninga, T. Nieuwe Sanitatie op Wijkniveau: Resultaten en Ervaringen Demo-site Sneek en Perspectieven voor Opschaling; LeAF (Lettinga Associates Foundation): Wageningen, the Netherlands, 2012. [Google Scholar]
  34. Reactor Performance of AB-Process at the DeSaH Demonstration Site; DeSaH: Sneek, the Netherlands, 2010.
  35. De Graaff, M.S.; Temmink, H.; Zeeman, G.; Buisman, C.J.N. Energy and phosphorus recovery from black water. Water Sci. Technol. 2011, 63, 2759–2765. [Google Scholar] [CrossRef] [PubMed]
  36. UCPTE (Union pour la coordination de la production et du transport de l’lectricit). Yearly Report 1993; UCPTE: Vienna, Austria, 1994. [Google Scholar]
  37. Houillon, G.; Jolliet, O. Life cycle assessment of processes for the treatment of wastewater urban sludge: Energy and global warming analysis. J. Clean. Prod. 2005, 13, 287–299. [Google Scholar] [CrossRef]
  38. Li, F.; Wichmann, K.; Otterpohl, R. Review of the technological approaches for grey water treatment and reuses. Sci. Total Environ. 2009, 407, 3439–3449. [Google Scholar] [CrossRef] [PubMed]
  39. Adamsson, M. Potential use of human urine by greenhouse culturing of microalgae (Scenedesmus acuminatus), zooplankton (Daphnia magna) and tomatoes (Lycopersicon). Ecol. Eng. 2000, 16, 243–254. [Google Scholar] [CrossRef]
  40. Kuntke, P.; Śmiech, K.; Bruning, H.; Zeeman, G.; Saakes, M.; Sleutels, T.; Hamelers, H.; Buisman, C. Ammonium recovery and energy production from urine by a microbial fuel cell. Water Res. 2012, 46, 2627–2636. [Google Scholar] [CrossRef] [PubMed]
  41. De Graaff, M. Resource Recovery from Black Water. Ph.D. Thesis, Wageningen University, Wageningen, the Netherlands, 2010. [Google Scholar]
  42. Van Dooren, H.J.C.; Hanegraaf, M.C.; Blanken, K. Emission and Compost Quality of on Farm Composted Dairy Slurry. PraktijkRapport Rundvee 68; Animal Sciences Group, Wageningen University: Wageningen, the Netherlands, 2005. [Google Scholar]
  43. Remy, D.I.C.; Ruhland, I.A. Ecological Assessment of Alternative Sanitation Concepts with Life Cycle Assessment. Technical University Berlin: Berlin, Germany, 2006; Volume 55. [Google Scholar]
  44. Verstraete, W.; Vlaeminck, S.E. ZeroWasteWater: Short-cycling of wastewater resources for sustainable cities of the future. Int. J. Sustain. Dev. World Ecol. 2011, 18, 253–264. [Google Scholar] [CrossRef]
  45. European Commission. EU Water Framework Directive 91/271/EEC; European Commission: Brussels, Belgium, 2013. [Google Scholar]
  46. Maurer, M.; Pronk, W.; Larsen, T. Treatment processes for source-separated urine. Water Res. 2006, 40, 3151–3166. [Google Scholar] [CrossRef] [PubMed]
  47. Tidåker, P.; Mattsson, B.; Jönsson, H. Environmental impact of wheat production using human urine and mineral fertilisers—A scenario study. J. Clean. Prod. 2007, 15, 52–62. [Google Scholar] [CrossRef]
  48. Winker, M.; Clemens, J.; Reich, M.; Gulyas, H.; Otterpohl, R. Ryegrass uptake of carbamazepine and ibuprofen applied by urine fertilization. Sci. Total Environ. 2010, 408, 1902–1908. [Google Scholar] [CrossRef] [PubMed]
  49. Ternes, T.; Joss, A. Human Pharmaceuticals, Hormones and Fragrances: The Challenge of Micropollutants in Urban Water Management; International Water Association: London, UK, 2006. [Google Scholar]
  50. Van Buuren, J.C.L. Sanitation Choice Involving Stakeholders. Ph.D. Thesis, University of Wageningen, Wageningen, The Netherlands, 2010. [Google Scholar]
  51. Elmitwalli, T.A.; Soellner, J.; de Keizer, A.; Bruning, H.; Zeeman, G.; Lettinga, G. Biodegradability and change of physical characteristics of particles during anaerobic digestion of domestic sewage. Water Res. 2001, 35, 1311–1317. [Google Scholar] [CrossRef]
  52. Fujie, K.; Bravo, H.E.; Kubota, H. Operational design and power economy of a rotating biological contactor. Water Res. 1983, 17, 1153–1162. [Google Scholar] [CrossRef]
  53. Meulman, B.; Zeeman, G.; Buisman, C.J.N. Treatment of Concentrated Black Water on Pilot Scale: Options and Challenges. In Proceedings of Sanitation Challenge, Wageningen, the Netherlands, 19–21 May 2008.
  54. Melin, T.; Jefferson, B.; Bixio, D.; Thoeye, C.; de Wilde, W.; de Koning, J.; van der Graaf, J.; Wintgens, T. Membrane bioreactor technology for wastewater treatment and reuse. Desalination 2006, 187, 271–282. [Google Scholar] [CrossRef]
  55. Karassik, I.J.; Messina, J.P.; Cooper, P.; Heald, C.C. Pump Handbook, 3rd ed.; McGraw-Hill: New York, NY, USA, 2001. [Google Scholar]
  56. Zeeman, G.; Lettinga, G. The role of anaerobic digestion of domestic sewage in closing the water and nutrient cycle at community level. Water Sci. Technol. 1999, 39, 187–194. [Google Scholar] [CrossRef]
  57. Dorussen, H.L. Ontwerp awzi Dokhaven; DBW/RIZA: Lelystad; Stora: Den Haag, the Netherlands, 1980. [Google Scholar]