1. Introduction
Organophosphate esters (OPEs), a class of chemicals extensively utilized in industrial products such as plastics, coatings, flame retardants, and plasticizers, have recently garnered significant attention due to their ubiquitous environmental presence, persistence, biotoxicity, and potential endocrine-disrupting effects [
1,
2]. Following the restriction and gradual phase-out of polybrominated diphenyl ethers (PBDEs), the global production and consumption of OPEs—serving as the primary alternatives—have surged significantly. It is estimated that global usage of OPEs reached approximately 3.1 million tons in 2023 [
3]. As a major global producer and consumer, China’s annual production was estimated to reach 598,422 tons in 2022 [
4]. As emerging contaminants, OPEs enter water bodies through various pathways, including industrial wastewater, urban sewage, and atmospheric deposition. Their high mobility and bioaccumulation potential in aquatic environments pose a potential threat to aquatic ecosystems [
5].
In recent years, investigations into OPEs across different environmental media have revealed their widespread distribution and significant concentration variations. Freshwater environments, which directly receive pollution inputs from industrial and urban activities, typically exhibit higher OPE pollution levels compared to marine environments. For instance, a study on typical coastal aquaculture waters in China (e.g., Hangzhou Bay, Zhelin Bay) reported a ΣOPEs concentration range of only 37.4–102 ng/L in 2021 [
6]. In contrast, Taihu Lake, a representative large lake in the Yangtze River Basin, serves as a key area for OPE research. Historical data indicates that the average concentration of ΣOPEs in its surface water was as high as 976.05 ng/L (range: 277.42–2147.01 ng/L) in 2012. However, owing to the implementation of control policies, concentrations significantly decreased to an average of 271.14 ng/L (range: 123.11–604.82 ng/L) by 2021–2022, with TCPP, TPPO, and TCEP being the major detected components [
7]. Nevertheless, pollution levels in specific functional zones, such as the freshwater aquaculture area in Meiliang Bay, remain concerning, with ΣOPEs concentrations reaching 591 ng/L in 2021—far exceeding those in coastal aquaculture areas—thereby reaffirming the severe pollution pressure faced by freshwater lakes.
Regarding source apportionment, Zhang et al. identified four principal components (PC1–PC4) in Taihu Lake using Principal Component Analysis (PCA), accounting for 35.0%, 18.4%, 14.1%, and 12.8% of the variance, respectively. These components were associated with industrial sources (TnBP, TCPP, TDCPP), sewage treatment plants and PVC-related atmospheric deposition (TEHP, TCEP), electronic product emissions (TPhP), and metal/pharmaceutical processing (TPPO). Furthermore, Spearman correlation analysis indicated that the target pollutants (including TnBP, TCPP, TDCPP, TEHP, TCEP, TPHP, and TPPO) exhibited significant correlations with environmental factors such as NH
3-N, total nitrogen (TN), total phosphorus (TP), water temperature, relative humidity, and corrected precipitation [
7]. Additionally, Qi et al. quantitatively apportioned OPE sources in 35 major rivers entering the Bohai Sea using three receptor models: PCA-MLR, Positive Matrix Factorization (PMF), and Unmix. The contribution ratios of three identified sources—rigid/flexible polyurethane foams/coatings, cellulose/acrylic/vinyl polymers/unsaturated polyesters, and PVC—were 49.9%, 29.7%, and 20.5% (PCA-MLR); 57.9%, 28.6%, and 13.5% (PMF); and 47.9%, 30.8%, and 22.4% (Unmix). Comprehensive performance evaluation identified PMF as the optimal model, recommending it as the preferred receptor model for resolving OPE sources in water bodies [
8].
Ecological risk assessment is widely employed to evaluate the impacts of organic and inorganic pollutants on aquatic ecosystems [
6,
9]. Studies have shown that different OPE congeners exhibit varying adverse effects on organisms, potentially threatening human health. Toxicological research indicates that OPE exposure is linked to health risks including cancer, intestinal damage, neurotoxicity, developmental disorders, and metabolic inhibition. Specifically, compounds such as tris(2-chloroethyl) phosphate (TCEP), tri-n-butyl phosphate (TnBP), and triphenyl phosphate (TPhP) are defined as neurotoxic [
10]. Research in the middle and lower reaches of the Yangtze River revealed that while all risk quotients (RQs) were below 1, 26.9% of samples fell within the 0.1–1 range, indicating a medium ecological risk. Further analysis identified ethylhexyl diphenyl phosphate (EHDPP) as the primary contributor, accounting for over 89.2% of the total ecological risk. Moreover, risk levels in major tributaries of the lower Yangtze were found to be nearly an order of magnitude higher than those in the main stream [
11].
Despite the accumulation of data on OPEs in aquatic environments, a significant gap remains regarding systematic research in key ecological functional zones. Poyang Lake, the largest freshwater lake in China, is a core region for flood control, water supply, and biodiversity maintenance in the middle and lower Yangtze River basin, serving vital functions in irrigation and aquaculture [
7,
12]. In recent years, accelerated urbanization and industrialization in the Poyang Lake basin have led to substantial OPE inputs via inflowing rivers such as the Ganjiang, Fuhe, and Xinjiang rivers. The inlet regions, in particular, serve as critical interfaces for OPE enrichment and transformation due to dynamic hydrological conditions and the convergence of pollutants [
13]. However, systematic investigations into the occurrence levels, spatiotemporal distribution patterns, pollution source profiles, and ecological risk grades of OPEs in the inlet regions of Poyang Lake are currently lacking. Unlike previous studies in the Yangtze River basin that primarily provided static spatial snapshots, this work uniquely characterizes the dynamic seasonal succession of OPE sources. Specifically, it distinguishes itself by revealing how extreme hydrological fluctuations dictate the mechanistic shift between diffuse non-point source flushing and localized accumulation. This lack of dynamic mechanism analysis currently results in an insufficient scientific understanding of the pollution status that hinders precise water environment management and the formulation of risk control strategies. Consequently, this study focuses on the major inlet regions of Poyang Lake with the following specific objectives:
- (1)
Determine the occurrence concentrations and composition profiles of OPEs and reveal their spatiotemporal distribution patterns through field sampling and laboratory analysis.
- (2)
Apportion pollution sources and quantify their contributions by combining multiple receptor models.
- (3)
Identify high-risk components and sensitive areas via ecological risk assessment. Ultimately, this work aims to provide a critical scientific basis for OPE pollution control and aquatic ecosystem protection in the Poyang Lake basin, thereby enriching specialized research content on freshwater lake inlets and refining the existing knowledge framework regarding OPE pollution at such critical interfaces.
2. Materials and Methods
2.1. Chemicals and Materials
Standard reagents of the 15 OPEs (purity ≥ 98%) were purchased from Dr. Ehrenstorfer (Augsburg, Germany). The deuterated internal standards, TCPP-d18 and TnBP-d27, were obtained from Toronto Research Chemicals (Toronto, ON, Canada), while TPrP-d21 and TPhP-d15 were acquired from Chiron AS (Trondheim, Norway) and Cambridge Isotope Laboratories (Tewksbury, MA, USA), respectively. HPLC-grade methanol and acetonitrile were supplied by Thermo Fisher Scientific (Waltham, MA, USA), and formic acid was purchased from Sigma-Aldrich (St. Louis, MO, USA). Ammonia solution (25–28%) and hydrochloric acid (analytical grade) were obtained from Sinopharm Chemical Reagent Co., Ltd. (Beijing, China).
2.2. Study Area and Sample Collection
Poyang Lake (N 28°24′–29°46′, E 115°49′–116°46′), located in the northern part of Jiangxi Province, China, is the largest freshwater lake in the country. This wetland not only provides an ideal habitat for a diverse array of fish and aquatic vegetation but also serves as the largest wintering ground for migratory birds in East Asia. It attracts hundreds of thousands of overwintering birds annually, including the critically endangered Siberian Crane, and also supports vital populations of the Yangtze finless porpoise [
14]. The Poyang Lake basin belongs to a typical subtropical wet monsoon climate zone, characterized by distinct seasonal variations. The average annual temperature is approximately 17.5 °C, and the average annual precipitation is roughly 1600 mm. Precipitation is highly uneven throughout the year, primarily concentrated from April to September (forming the wet season), while the period from October to March of the following year receives significantly less rainfall (forming the normal and dry seasons) [
15]. As highlighted by previous correlations between OPEs and environmental factors (e.g., temperature and precipitation), these intense seasonal climatic fluctuations dictate the hydrological dynamics of the inflowing rivers, thereby directly driving the seasonal dilution and accumulation effects of pollutants [
12].
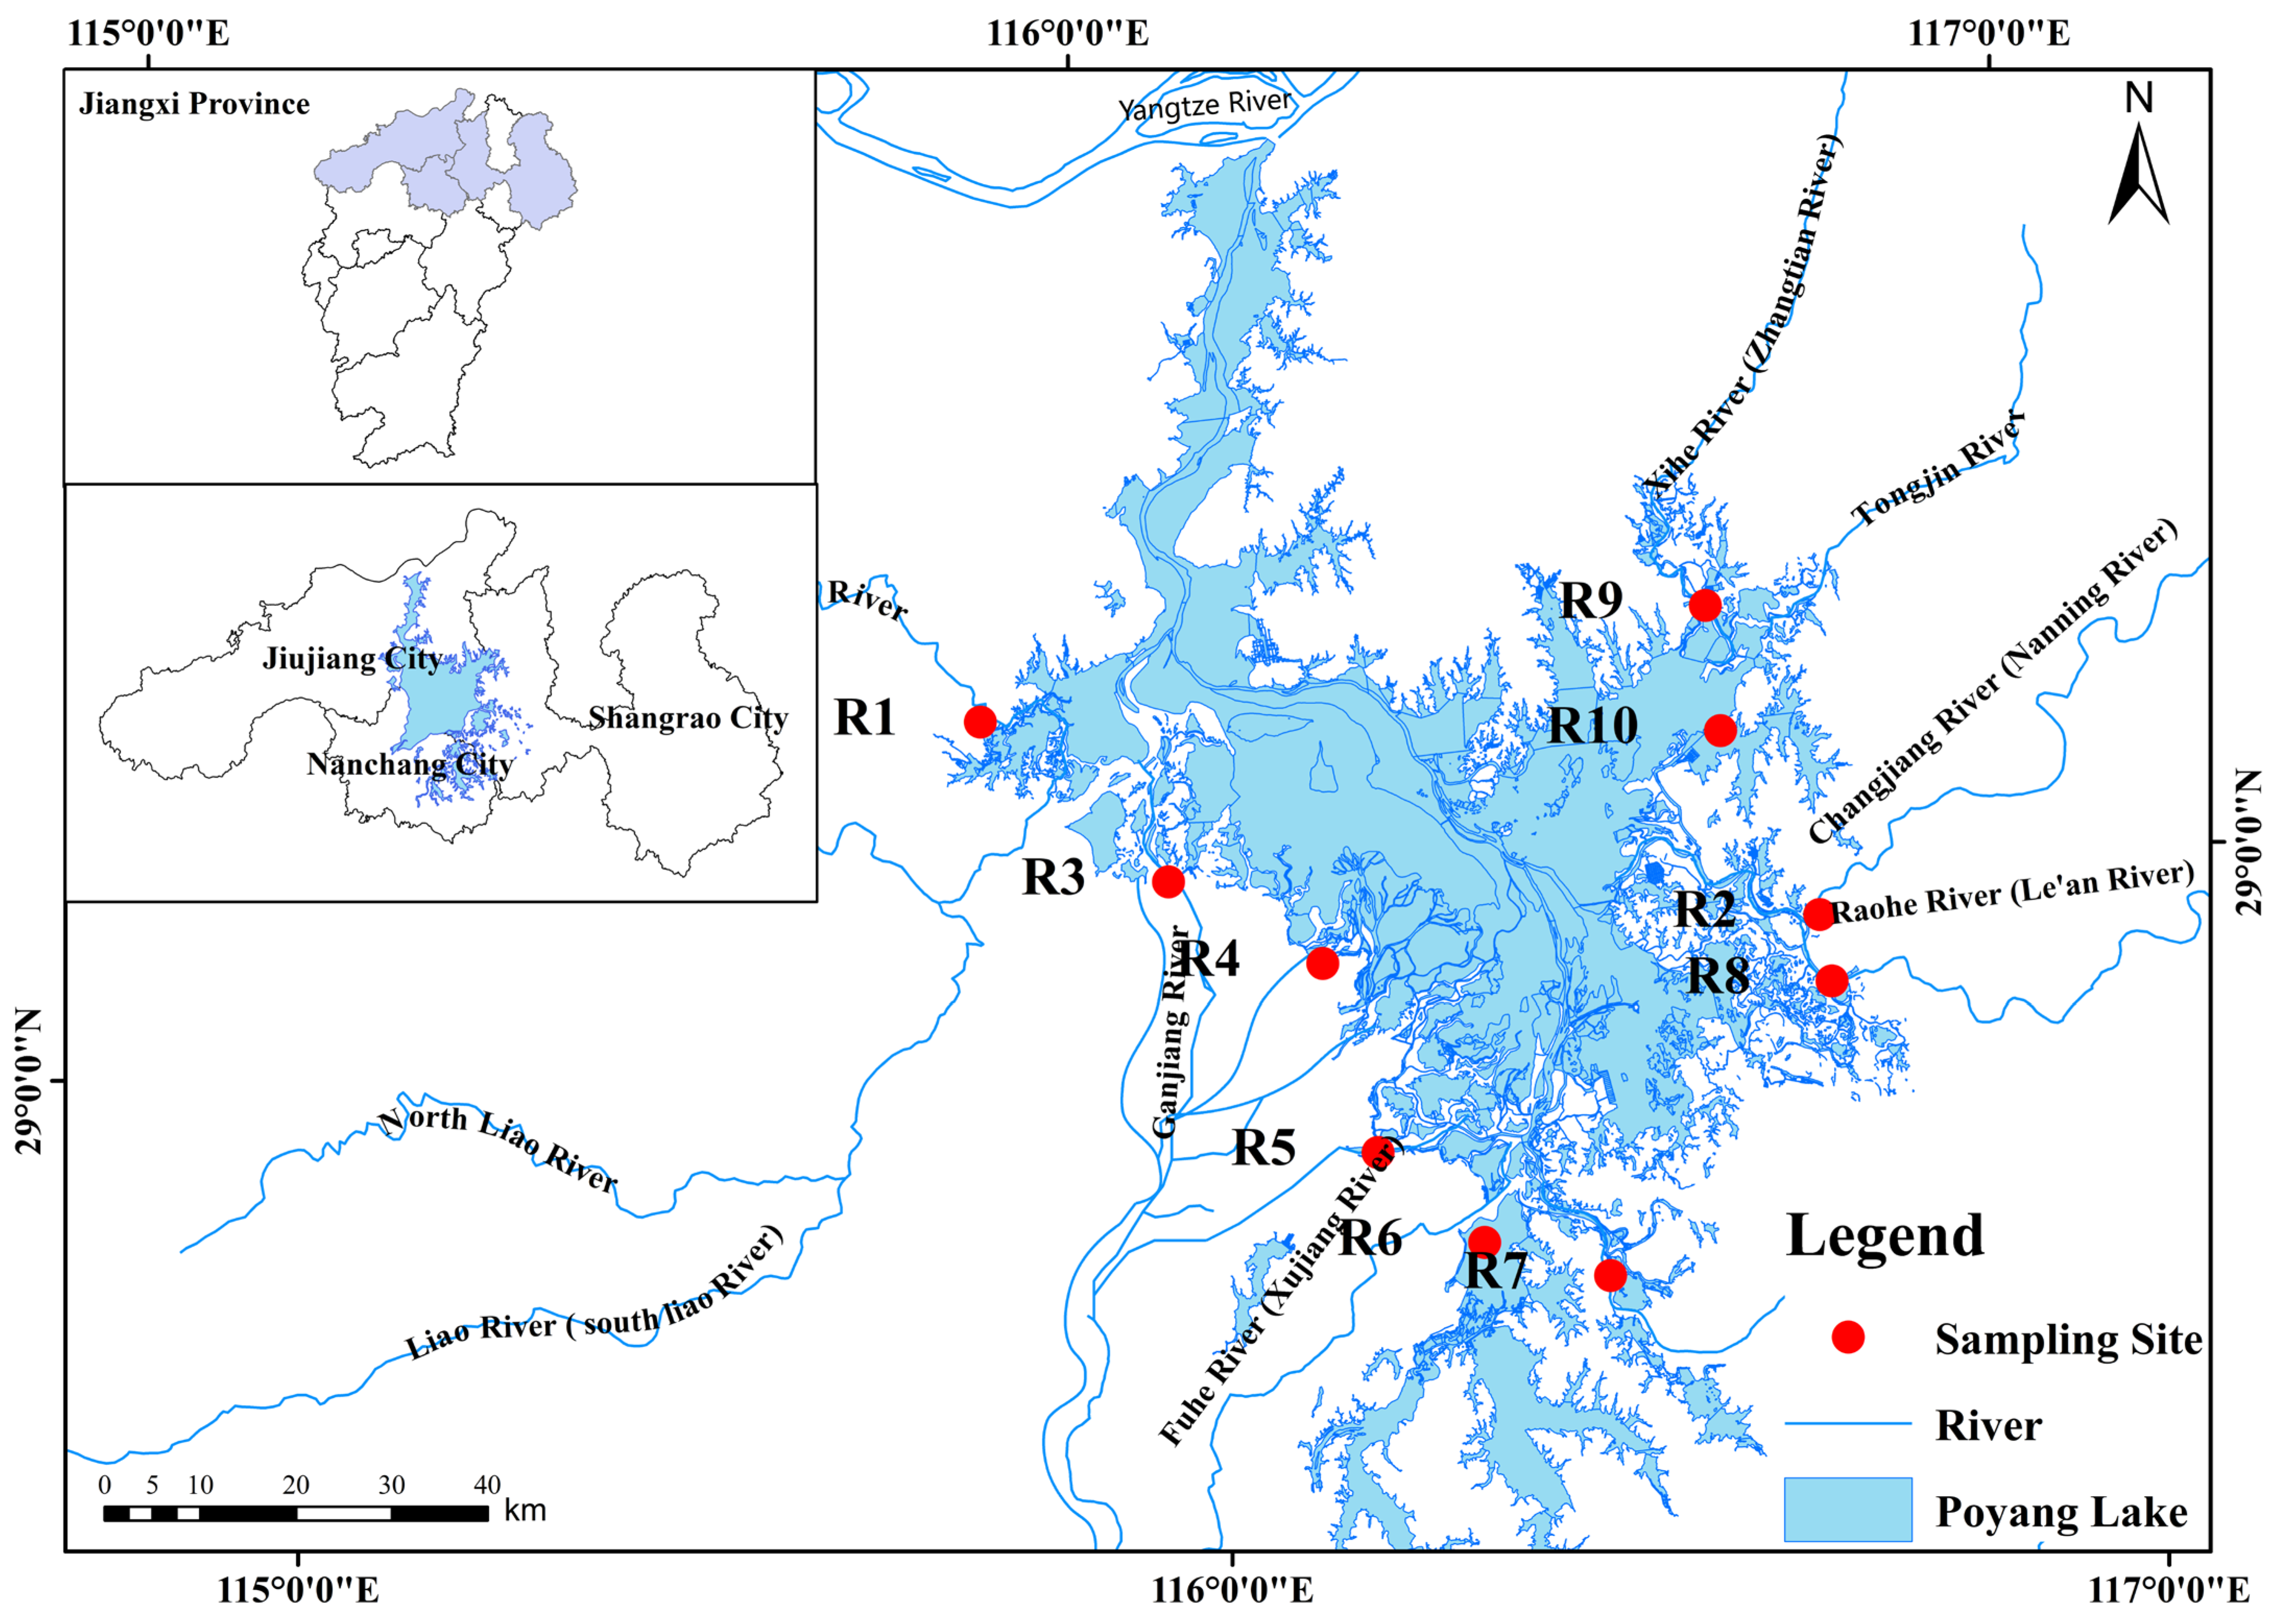
Based on the hydrological patterns and pollution input characteristics of Poyang Lake, 10 sampling sites were systematically established for surface water collection, as shown in
Figure 1. The sampling sites covered the estuarine sections and mainstream confluence areas of the five major inflowing rivers (Xiushui, Ganjiang, Fuhe, Xinjiang, and Raohe rivers). These sites were selected to balance coastal areas with concentrated industrial pollution sources and ecologically sensitive wetland reserves, thereby comprehensively capturing spatial differences in pollutant distribution.
Field sampling was performed in August (wet season), October (normal season), and December (dry season) to cover three distinct hydrological periods [
16], yielding a total of 30 water samples. To provide a comprehensive physical context for these distinct periods, we analyzed long-term historical water level data from five major hydrological stations spanning the southern inlets to the northern outlet of Poyang Lake (Kangshan, Tangyin, Duchang, Xingzi, and Hukou;
Figure S1). The data demonstrate profound basin-wide seasonal fluctuations. During the wet season (August), the entire lake experiences peak water levels, generally ranging from 15 to 19 m across all stations, maximizing the lake’s volume and dilution capacity. In the normal season (October), water levels begin a significant basin-wide recession. By the dry season (December), the lake enters an extreme low-water phase, exhibiting a clear spatial gradient in water level reduction: while southern inlet-adjacent stations (Kangshan and Tangyin) drop to approximately 11–13 m, the northern and outlet-adjacent stations (Duchang, Xingzi, and Hukou) experience more drastic declines, frequently dropping below 7–10 m. These distinct spatiotemporal hydrological transitions fundamentally drive the dynamic source shifts and concentration variations in OPEs observed in this study. Comparative monitoring across these different periods effectively reflects the impact of seasonal hydrological changes on pollutant migration and transformation. During sampling, 1.5 L of surface water was collected at each site using brown reagent bottles that had been sterilized at high temperatures and rinsed with organic solvents to prevent interference from light exposure and container adsorption. All water samples were immediately stored in the dark at 4 °C after collection, and pretreatment procedures were strictly completed within 24 h [
17]. To account for potential contamination during sample collection and transport, field blanks were prepared during each sampling campaign. Specifically, ultrapure water was transported to the field, transferred into the pre-cleaned sampling bottles, and subsequently processed and analyzed following the exact same procedures as the actual environmental samples. Target OPEs in the field blanks were either not detected or strictly below the method quantification limits, indicating that no significant contamination occurred during the field sampling and transportation processes.
2.3. Sample Pretreatment and Analysis
The collected water samples were first filtered through 0.45 μm glass fiber membranes to remove suspended particulate matter. A 1 L aliquot of the filtered water was spiked with 50 μL of a mixed internal standard solution containing TnBP-d27, TCPP-d18, and TPhP-d15 (100 μg·L
−1). Solid-phase extraction (SPE) was performed using ENVI-18 cartridges to extract and enrich OPEs from the samples. The cartridges were activated sequentially with 5 mL of dichloromethane, 5 mL of acetonitrile, and 10 mL of ultrapure water (prepared via a Milli-Q system). The water samples were then loaded onto the cartridges at a flow rate of approximately 3 mL·min
−1. Following sample loading, the cartridges were vacuum-dried for 10 min to ensure complete passage, rinsed with 10 mL of ultrapure water, and vacuum-dried for an additional 1 h to remove residual moisture. Elution was carried out using 8 mL of a solvent mixture (acetonitrile:dichloromethane = 3:1,
v/
v). The eluate was concentrated to near dryness under a gentle stream of nitrogen in a 40 °C water bath and subsequently reconstituted to a final volume of 1 mL with the mixed solvent. Finally, the extract was filtered through a 0.22 μm nylon membrane and transferred to a 1 mL amber HPLC vial for storage at −20 °C prior to instrumental analysis [
7,
8,
18]. The detailed analytical methods and instruments used for the determination of conventional water quality parameters (including pH, dissolved oxygen, total organic carbon, total nitrogen, total phosphorus, etc.) are all listed in
Table S4.
2.4. Quality Control and Quality Assurance
The determination of target analytes was performed using an Ultra-Performance Liquid Chromatography–Tandem Mass Spectrometry (UPLC-MS/MS) system. The instrumentation consisted of a Xevo TQ-S micro IVD triple quadrupole mass spectrometer (Waters, Milford, MA, USA) equipped with an electrospray ionization source (ESI) operating in positive mode, coupled with Waters MassLynx software (v4.2) for data acquisition and processing.
Chromatographic separation was achieved on an ACQUITY UPLC® BEH C18 column (1.7 µm, 50 mm × 2.1 mm, Waters, Milford, MA, USA) maintained at 40 °C. The mobile phase consisted of 0.1% formic acid in water (A) and acetonitrile (B). The flow rate was set at 0.4 mL·min−1, and the injection volume was 5 μL. Mass spectrometric analysis was conducted in multiple reaction monitoring (MRM) mode. The operational parameters were as follows: capillary voltage, 0.5 kV; ion source temperature, 150 °C; and desolvation temperature, 400 °C. Nitrogen was employed as both the desolvation and cone gas, while helium served as the collision gas.
Analyte identification relied on the specific precursor ion, the two most abundant product ions, and retention time matching. Quantification was performed using the internal standard method. The calibration curves for the 15 OPEs, ranging from 0.01 to 200 μg·L
−1, exhibited excellent linearity with correlation coefficients (R
2) greater than 0.995. Spike recovery rates ranged from 86.23% to 110.62%. Regarding data treatment for limits of detection (LOD): concentrations below the LOD were treated as zero, while values falling between the LOD and the limit of quantification (LOQ) were assigned a value of LOQ/2 [
19]. The method detection limits (MDLs) and limits of quantification (LOQs) were determined based on a signal-to-noise ratio (S/N) of 3 and 10, respectively. For the 15 target OPEs, the MDLs ranged from 0.004 to 0.833 ng/L, and the LOQs ranged from 0.013 to 2.749 ng/L. Detailed calculation parameters and the specific MDL and LOQ values for each individual OPE compound are systematically summarized in
Table S1.
2.5. Positive Matrix Factorization (PMF) Model
In this study, the Positive Matrix Factorization (PMF) model was employed to quantitatively resolve the sources of OPEs in the water bodies of the Poyang Lake inlet regions. Unlike traditional Principal Component Analysis (PCA), PMF is highly preferred for source apportionment because it incorporates non-negativity constraints and individual data uncertainties [
8]. This mathematically ensures that the derived source profiles and contributions remain physically meaningful without generating impossible negative values. Given the significant variations in detection rates and concentration levels of OPEs across the three hydrological periods, source apportionment was conducted separately for each season. This methodological decision was crucial to accurately capture the dynamic shifts in pollution sources driven by the intense seasonal hydrological fluctuations of the lake, which would otherwise be obscured if the annual dataset were pooled.
The analysis incorporated data for 15 OPE congeners across 10 sampling sites. The uncertainty () for each data point was calculated based on the relationship between the measured concentration and the method detection limit (LOD) using the following equations:
For concentrations below the LOD:
For concentrations exceeding the LOD:
In Equation (2), the Error Fraction is typically determined empirically, ranging from 0.05 to 0.2 [
20]. In this study, the Error Fraction was set to 0.1.
2.6. Ecological Risk Assessment Method
The ecological risks of OPEs in the surface water of Poyang Lake were evaluated using the Risk Quotient (RQ) method. The calculation equations are as follows:
where MEC represents the measured environmental concentration of the pollutant, and PNEC denotes the predicted no-effect concentration. LC
50 refers to the median lethal concentration for the most sensitive representative aquatic organisms (typically algae, crustaceans, or fish); all concentration units are expressed in mg/L. AF stands for the assessment factor. In this study, a conservative AF of 1000 was applied because the PNEC was derived from acute toxicity data (LC
50). This factor is widely adopted in established ecological risk assessments to account for the uncertainties associated with acute-to-chronic extrapolation, interspecies sensitivity variations, and laboratory-to-field extrapolations [
6,
21]. The ecological risk levels are classified based on the RQ values: RQ < 0.1 indicates low or negligible risk; 0.1 ≤ RQ < 1.0 indicates medium ecological risk; and RQ ≥ 1.0 indicates high ecological risk [
21]. The specific toxicity data (LC
50) for individual OPEs were obtained from published literature and the United States Environmental Protection Agency (U.S. EPA) Integrated Risk Information System (IRIS) database [
22,
23], and the detailed values are comprehensively provided in the
Table S3.
2.7. Data Analysis and Statistical Methods
All experimental data were processed using Microsoft Excel 2019. The descriptive statistics and Spearman correlation analysis were conducted using IBM SPSS Statistics (Version 26.0, IBM Corp., Armonk, NY, USA). Principal Component Analysis (PCA) was also performed in SPSS to identify potential sources. The Positive Matrix Factorization (PMF) model was executed using the EPA PMF 5.0 software (U.S. Environmental Protection Agency, Washington, DC, USA) for quantitative source apportionment. The Circos plot for visualizing the Spearman correlation matrix was generated using the R programming language with the “circlize” package. Other visualizations, including bar charts and scatter plots, were plotted using OriginPro 2022 (OriginLab Corporation, Northampton, MA, USA).
3. Results and Discussion
3.1. Concentration Levels and Composition of OPEs in the Water Bodies of Poyang Lake’s Inflowing Rivers
A total of 15 OPEs were detected in the water bodies of the inflowing rivers of Poyang Lake (
Table S1). The detected compounds included eight alkyl-OPEs (TMP, TEP, TPrP, TEHP, TBEP, TnBP, TiBP, and TIPP), three chlorinated OPEs (Cl-OPEs: TCEP, TCPP, and TDCP), and four aryl-OPEs (TPhP, CDPP, EHDPP, and TCrP).
In terms of detection frequency (DF), CDPP was detected in 13.33% of samples, while TPrP, EHDPP, and TEHP had DFs below 50%; the remaining OPEs exhibited DFs exceeding 70%. TEP, TiBP, TnBP, and TCPP were detected in 100% of the samples, followed by TBEP (98.33%), TPhP (95.00%), TCEP (93.33%), TIPP (93.22%), and TMP (90.00%), making them the most ubiquitous OPEs in the study area. The average detection rates for the three categories followed the order: Aryl-OPEs (52.92%) < Alkyl-OPEs (80.00%) < Cl-OPEs (90.00%). Regarding concentration, TCPP (0.921~104.350 ng/L) and TEP (8.230~61.777 ng/L) were the dominant congeners, accounting for 33.87% and 21.93% of the total concentration (ΣOPEs), respectively. These were followed by TiBP (2.778~139.658 ng/L) and TnBP (2.550~138.276 ng/L), which contributed 19.07% and 18.47% to the total mass, respectively. Overall, Alkyl-OPEs and Cl-OPEs were the predominant components, constituting 60.32% and 38.17% of the total OPE burden, respectively, while Aryl-OPEs accounted for a minor fraction (1.52%).
To better contextualize the pollution status of OPEs in the Poyang Lake inlet regions, the measured ΣOPEs concentrations were compared with those reported for other major aquatic systems (
Table 1). Overall, the OPE contamination level in our study area (mean: 82.00 ng/L) was significantly lower than the levels found in Taihu Lake (mean: 271.14 ng/L) and the Bohai Sea inflow rivers (mean: 286.0 ng/L). However, it was comparable to the levels reported in typical coastal aquaculture waters (37.4–102.0 ng/L). These results indicate that the Poyang Lake inlet regions currently face a relatively low to moderate level of OPE contamination compared to other highly industrialized freshwater basins in China. The dominance of Cl-OPEs (e.g., TCPP) and Alkyl-OPEs (e.g., TEP, TiBP) in this study is consistent with the usage patterns observed in the Yangtze River Basin.
Usage volume and physicochemical properties, such as water solubility and photodegradability, are critical factors governing the environmental concentrations of OPEs in surface water (
Table S2) [
24,
25]. TEP, TBEP, TCEP, and TCPP exhibit relatively high water solubilities (5.00 × 10
5, 1.20 × 10
3, 7.00 × 10
3, 1.60 × 10
3 mg·L
−1 at 25 °C, respectively), which facilitates their dissolution and results in higher detection rates and concentrations in the inlet waters. Compared to other groups, Cl-OPEs are characterized by greater environmental persistence and resistance to degradation; combined with the widespread application of TCPP and TCEP in consumer products, these factors contribute significantly to their elevated levels in surface water [
26,
27]. Conversely, the average concentrations of Aryl-OPEs (TPhP, CDPP, and EHDPP) were notably lower (0.4561, 0.0304 and 0.0602 ng/L, respectively) partly due to their poor water solubility (hydrophobicity). Furthermore, OPEs are known to undergo photodegradation in water, with rates reportedly following the order: Aryl-OPEs > Alkyl-OPEs > Cl-OPEs [
24]. Consequently, The lower environmental concentrations and detection frequencies of Aryl-OPEs likely result from a combination of limited emission sources and their specific physicochemical properties. In addition to lower regional inputs, the high hydrophobicity of Aryl-OPEs drives their rapid partitioning from the aqueous phase into suspended particulate matter and sediments. Furthermore, their continuous depletion via photodegradation and potential microbial transformation exacerbates their low occurrence in water.
3.2. Spatiotemporal Variations in OPEs in the Inflowing Rivers of Poyang Lake
3.2.1. Temporal Variation
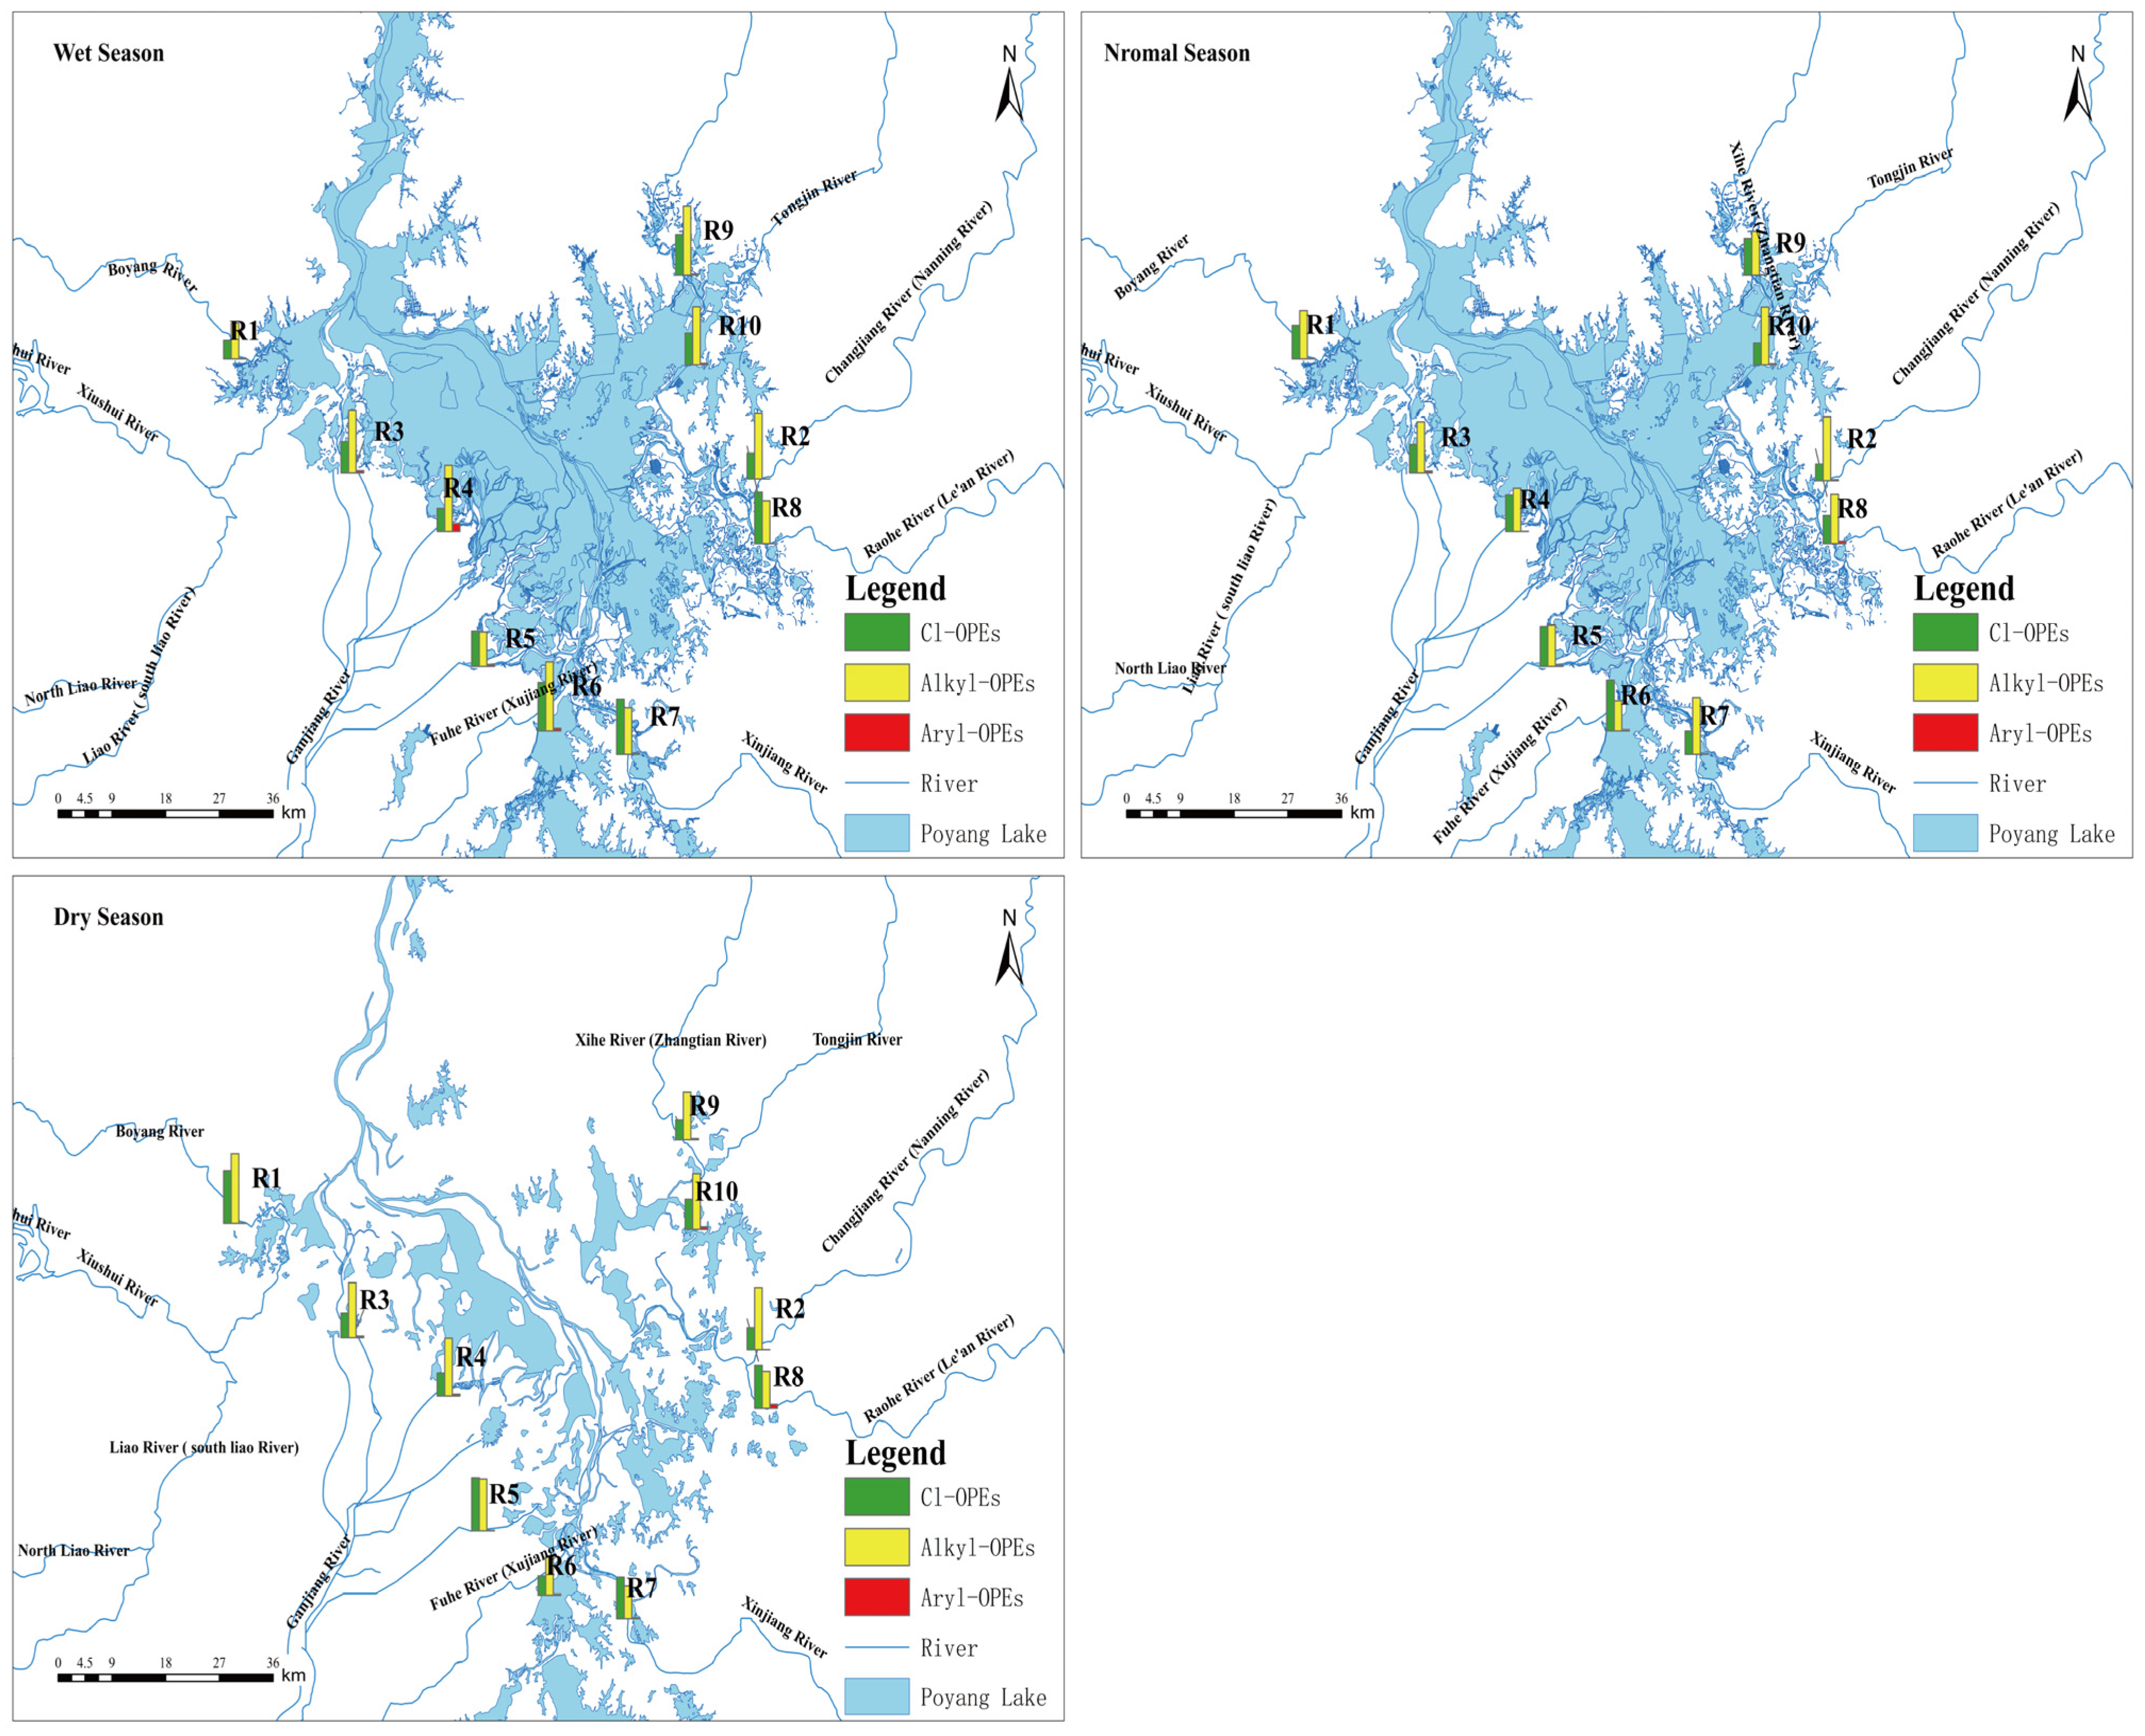
Following the characterization of overall concentrations and compositions, clarifying the distribution of OPEs across different hydrological periods and geographic locations is essential for understanding their environmental behavior and migration pathways. As a major class of flame retardants and plasticizers, Alkyl-OPEs exhibited distinct seasonal patterns in the Poyang Lake water environment (
Figure 2). A comprehensive analysis of the 10 sampling sites across the wet, normal, and dry seasons revealed that while overall concentration levels fluctuated, there was a general trend of concentrations being slightly higher in the dry season than in the wet season. This trend was particularly evident at specific sites, such as the Boyang River (R1) and the South Branch of the Ganjiang River (R5), where Alkyl-OPE concentrations showed a continuous increasing trend from the wet to the dry season. For instance, at R1, the concentration rose significantly from 0.383 ng/L in the wet season to 0.499 ng/L in the dry season; similarly, at R5, it increased from 0.383 ng/L to 0.586 ng/L. This “high in dry, low in wet” phenomenon has been reported in other studies on pollutants in Poyang Lake and is primarily attributed to seasonal hydrological variations [
15]. During the wet season (summer), abundant rainfall and high inflow from the five rivers maintain high lake water levels, exerting a dilution effect on pollutants. Conversely, during the dry season (winter), reduced rainfall and lower water levels lead to a shrinking water surface area, facilitating the accumulation of pollutants in the relatively closed and stagnant water body. Additionally, lower water temperatures in the dry season reduce microbial activity, potentially slowing the biodegradation rates of organic pollutants, which further contributes to maintaining higher concentration levels [
14]. It is worth noting that while this general trend exists, the magnitude and pattern of variation differ among sampling sites, reflecting the complexity of local pollution inputs and hydrodynamic conditions.
In contrast, Aryl-OPEs were generally detected at low concentrations, with no obvious seasonal variation patterns. Their total concentrations were an order of magnitude lower than those of Alkyl-OPEs and Cl-OPEs, and they were below the detection limit at multiple sites. For example, at the Changjiang River (R2), Aryl-OPE concentrations were zero in both the wet and dry seasons, with only trace levels detected in the normal season. Although a relatively high concentration was observed in the Middle Branch of the Ganjiang River (R4) during the wet season, lake-wide seasonal fluctuations were insignificant, and levels remained extremely low overall. Among the 30 data points (10 sites × 3 seasons), 11 (36.7%) showed zero concentration. Even where detected, values typically ranged from 0.01 to 0.04 ng/L. This pervasive low-concentration phenomenon likely results from multiple factors: firstly, the production and usage volumes of Aryl-OPEs are likely lower than those of Alkyl- and Cl-OPEs, resulting in lower environmental input; secondly, physicochemical properties such as high octanol-water partition coefficients (
) may drive Aryl-OPEs to partition into sediments or organisms rather than the aqueous phase [
28]. Previous studies indicate that sediments act as a significant sink for OPEs; thus, low aqueous concentrations may not reflect the true burden in the ecosystem. Furthermore, Aryl-OPEs are more susceptible to photolysis or biodegradation in water, shortening their environmental persistence [
29].
As widely used flame retardants, Cl-OPEs displayed more complex seasonal characteristics. Similar to Alkyl-OPEs, Cl-OPE concentrations at certain sites (e.g., R1 and R5) followed the trend of a significant seasonal gradient with higher levels in the dry season and lower levels in the wet season, likely due to hydrological dilution and concentration effects. Specifically, concentrations at R1 rose from 0.483 ng/L (wet) to 0.581 ng/L (dry), and at R5 from 0.392 ng/L to 0.600 ng/L. However, Cl-OPEs did not strictly adhere to this rule across all sites, exhibiting more volatile fluctuations. For instance, at the Fuhe River (R6), concentrations peaked during the normal season (0.619 ng/L) and dropped sharply in the dry season (0.219 ng/L). Conversely, at the Xinjiang River (R7), the concentration peaked during the wet season (0.617 ng/L), far exceeding the other two seasons. These exceptions suggest that the distribution of Cl-OPEs is heavily governed by specific local industrial activities and their interaction with hydrology. To be specific, the Xinjiang River (R7) flows through major industrial hubs (e.g., Yingtan and Shangrao), which are characterized by intensive electronic manufacturing, metal smelting, and e-waste processing industries. These sectors extensively utilize Cl-OPEs (such as TCPP and TCEP) as flame retardants in cables, circuit boards, and plastic casings. The anomalous peak during the wet season at R7 strongly indicates that intense summer rainfall effectively flushes substantial amounts of Cl-OPE dust and residues from open-air industrial yards and urban surfaces into the river via non-point source runoff, overwhelmingly masking the hydrological dilution effect [
24]. Conversely, the peak during the normal season at the Fuhe River (R6) may be attributed to the specific production cycles of local textile and building material industries in the Fuzhou region, or the pulse discharges from municipal wastewater treatment plants, which introduce continuous point-source inputs that do not align with natural hydrological rhythms [
7]. Due to the presence of chlorine atoms, Cl-OPEs possess strong persistence and bioaccumulation potential, making their complex environmental behavior a critical subject for further study.
3.2.2. Spatial Variation
In addition to seasonal temporal fluctuations, OPE concentrations exhibited significant spatial variations across the sampling sites, reflecting the regional characteristics of pollution source inputs. The spatial distribution of alkyl-OPEs across the ten sampling sites in Poyang Lake revealed marked heterogeneity, with distinct differences between high- and low-concentration zones (
Figure 2). Overall, the Middle Branch of the Ganjiang River (R4), Xihe River (R9), and Fuhe River (R6) were identified as areas with relatively high Alkyl-OPE concentrations, whereas the Boyang River (R1) and the South Branch of the Ganjiang River (R5) exhibited lower levels. This spatial pattern is likely closely linked to watershed-specific variations in industrial structure, population density, land use, and sewage treatment capabilities. As the largest inflow river, the Ganjiang River basin hosts frequent industrial and agricultural activities, which are likely significant sources of Alkyl-OPEs. Similarly, the Xihe and Fuhe watersheds may contain specific industrial pollution sources contributing to elevated levels. In contrast, the relatively lower levels of industrialization and urbanization in the Boyang River and South Branch of the Ganjiang River basins likely result in reduced pollution inputs.
Furthermore, the spatial distribution of OPEs is governed by the interplay between pollutant loading and the river’s dilution capacity. In large-volume rivers like the Ganjiang (R4), the intensive anthropogenic inputs from extensive industrial and agricultural activities appear to outpace the natural dilution effect of its high discharge. Specifically, the Middle Branch of the Ganjiang River (R4) directly receives discharge from Nanchang, the capital and most densely populated city of Jiangxi Province. According to the Jiangxi Statistical Yearbook (2023), Nanchang supports a resident population of over 6.5 million and contributes to approximately one-quarter of the province’s total industrial output. The watershed is heavily characterized by national-level economic and technological development zones—with pillar industries including electronic information, automobile manufacturing, and textiles—coupled with extensive peri-urban agricultural lands [
30]. These massive, quantifiable anthropogenic footprints generate continuous point-source effluents and non-point source runoff, directly corroborating the elevated OPE levels observed at this specific site. Conversely, in smaller tributaries such as the Xihe (R9) and Fuhe (R6) rivers, the high concentrations may be further exacerbated by their limited hydrodynamic flushing and dilution capacities [
31]. Therefore, while the total pollutant mass is largely determined by watershed-specific industrialization, the final observed concentration is a function of both the magnitude of emissions and the hydrological volume of the receiving water body.
The spatial distribution of Aryl-OPEs was extremely uneven, characterized primarily by concentrations that were either very low or below the detection limit at most sites, with anomalous peaks occurring only at specific locations during specific seasons. Notably, the concentration detected at the Middle Branch of the Ganjiang River (R4) during the wet season (0.090 ng/L) was significantly higher than at all other sites and seasons, marking it as a distinct hotspot. Apart from this, concentrations were generally negligible (mostly 0.01–0.03 ng/L), with non-detects at multiple sites. This distribution pattern suggests that Aryl-OPE pollution is likely driven by localized, episodic, or seasonal point-source emissions rather than widespread basin-wide inputs. The anomaly at R4 during the wet season may be associated with specific industrial discharges or accidental leaks near the sampling point during that period. Given their generally low aqueous concentrations, the ecological risk assessment of Aryl-OPEs may require a shift in focus toward their accumulation in sediments and organisms [
28,
29].
Cl-OPEs also demonstrated significant spatial heterogeneity, with a clear distinction between high- and low-concentration areas. High-concentration zones were identified in the Xinjiang River (R7), Raohe River (R8), and Fuhe River (R6), while the Middle Branch of the Ganjiang River (R4) and Tongjin River (R10) exhibited relatively lower levels. This distribution pattern differs from that of Alkyl-OPEs, suggesting distinct primary pollution sources and migration pathways for different OPE classes. The Xinjiang, Raohe, and Fuhe basins likely contain industries or specific sources utilizing Cl-OPE-containing products. Since Cl-OPEs are commonly used as flame retardants in polyurethane foams and electronics, production and processing activities involving these materials may be key entry pathways into the environment [
32]. Conversely, the Ganjiang Middle Branch and Tongjin River basins may have fewer such sources, or their water environmental conditions (e.g., pH, organic matter) may be less favorable for Cl-OPE dissolution and migration. Similar to Alkyl-OPEs, the spatial distribution of Cl-OPEs is modulated by hydrological conditions, though the response appears more complex.
3.3. Influencing Factors and Source Apportionment of OPEs in the Inflowing Rivers of Poyang Lake
3.3.1. Spearman Correlation Analysis
To further elucidate the mechanisms driving the observed spatiotemporal distribution patterns, this study investigated the environmental factors influencing OPE concentrations and employed multiple receptor models for qualitative and quantitative source apportionment.
Previous studies indicate that the occurrence levels of organophosphate esters (OPEs) are susceptible to the physicochemical properties of the water body. Furthermore, OPEs can enter lakes via atmospheric particulate deposition and subsequently undergo photodegradation within the lacustrine environment [
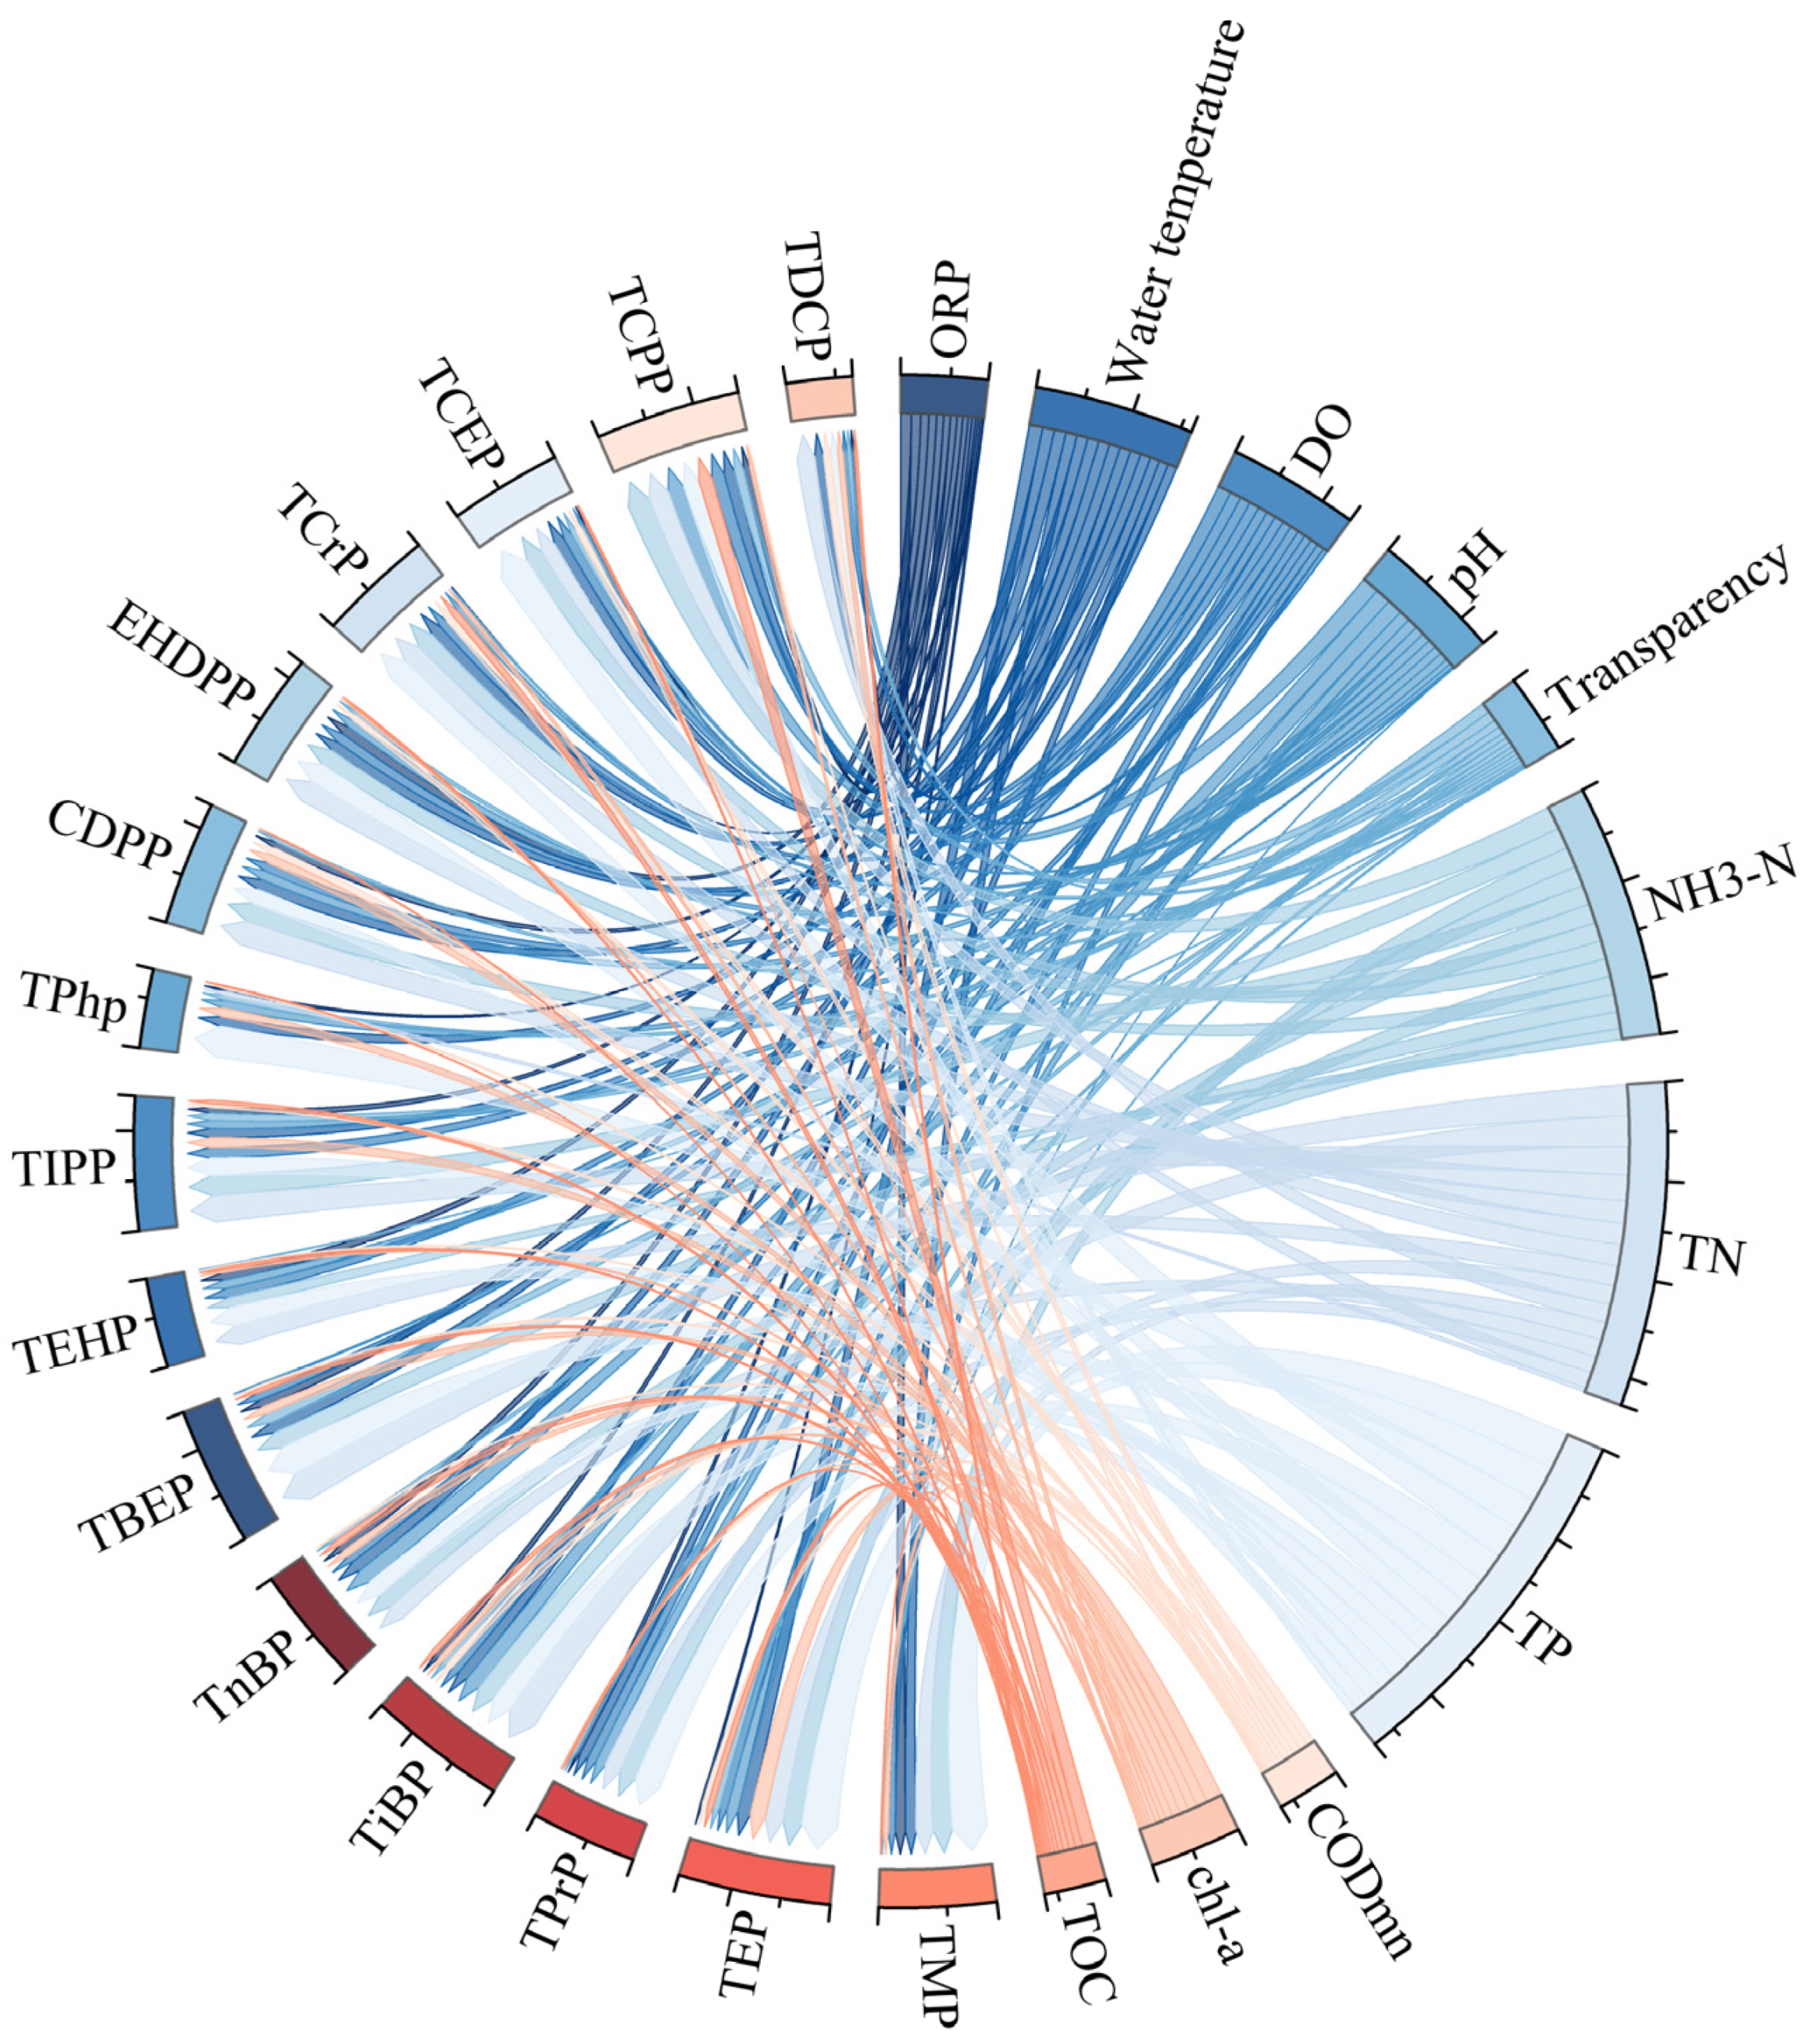
26]. In this study, Spearman correlation coefficients were calculated to characterize the relationships between various environmental indices and the pollutants. Subsequently, Circos visualization technology was employed to illustrate the correlations between OPEs and water quality parameters, where the thickness of the connecting lines corresponds to the strength of the association. As illustrated in
Figure 3, ammonia nitrogen (NH
3-N), total nitrogen (TN), total phosphorus (TP), and water temperature exhibited significant correlations with the majority of the target pollutants. The detailed correlation matrix is provided in
Table S5.
The divergent correlation patterns between specific OPE congeners and environmental factors elucidate the complex interplay among pollution source homology, physicochemical properties, and degradation kinetics. Specifically, highly water-soluble congeners (e.g., TCPP, TEP, and TnBP) exhibited highly significant positive correlations with TP and NH
3-N (
p < 0.01). Given their high aqueous solubility [
33], these predominantly alkyl and chlorinated OPEs readily partition into the dissolved phase. Their synchronized fluctuations with TP and NH
3-N indicate a strong hydrodynamic co-transport from point-source effluents (e.g., wastewater treatment plants and industrial discharges), which undergo pronounced accumulation during the dry season [
34].
Conversely, TN and water temperature exhibited strong negative correlations with most OPEs, governed by seasonal dilution and enhanced degradation. Elevated summer precipitation triggers agricultural non-point source runoff, driving TN peaks while simultaneously diluting the dissolved OPE pool [
35]. Notably, TDCP presented an anomalous positive correlation with TN (
). This deviation can be scientifically attributed to its higher hydrophobicity and distinct phase-partitioning behavior. During intense precipitation events, TDCP strongly sorbed onto soil and suspended particulate matter is flushed into the lake alongside agricultural TN runoff, manifesting as particulate-facilitated transport [
36]. Furthermore, the significant negative correlations between water temperature and most OPEs underscore the role of degradation kinetics; elevated summer temperatures substantially accelerate microbial biodegradation and photochemical transformation processes, thereby attenuating their aqueous concentrations [
32]. Lastly, bulk organic indices (e.g., TOC, COD
Mn at the mg/L level) showed extremely weak or non-significant correlations across the board, as their macroscopic background levels are inherently uncoupled from the discrete emission and trace-level transport (ng/L) of synthetic OPEs. Meanwhile, highly dynamic physicochemical parameters like DO and pH only exhibited sporadic correlations with specific congeners.
3.3.2. Source Apportionment of OPEs
Principal Component Analysis
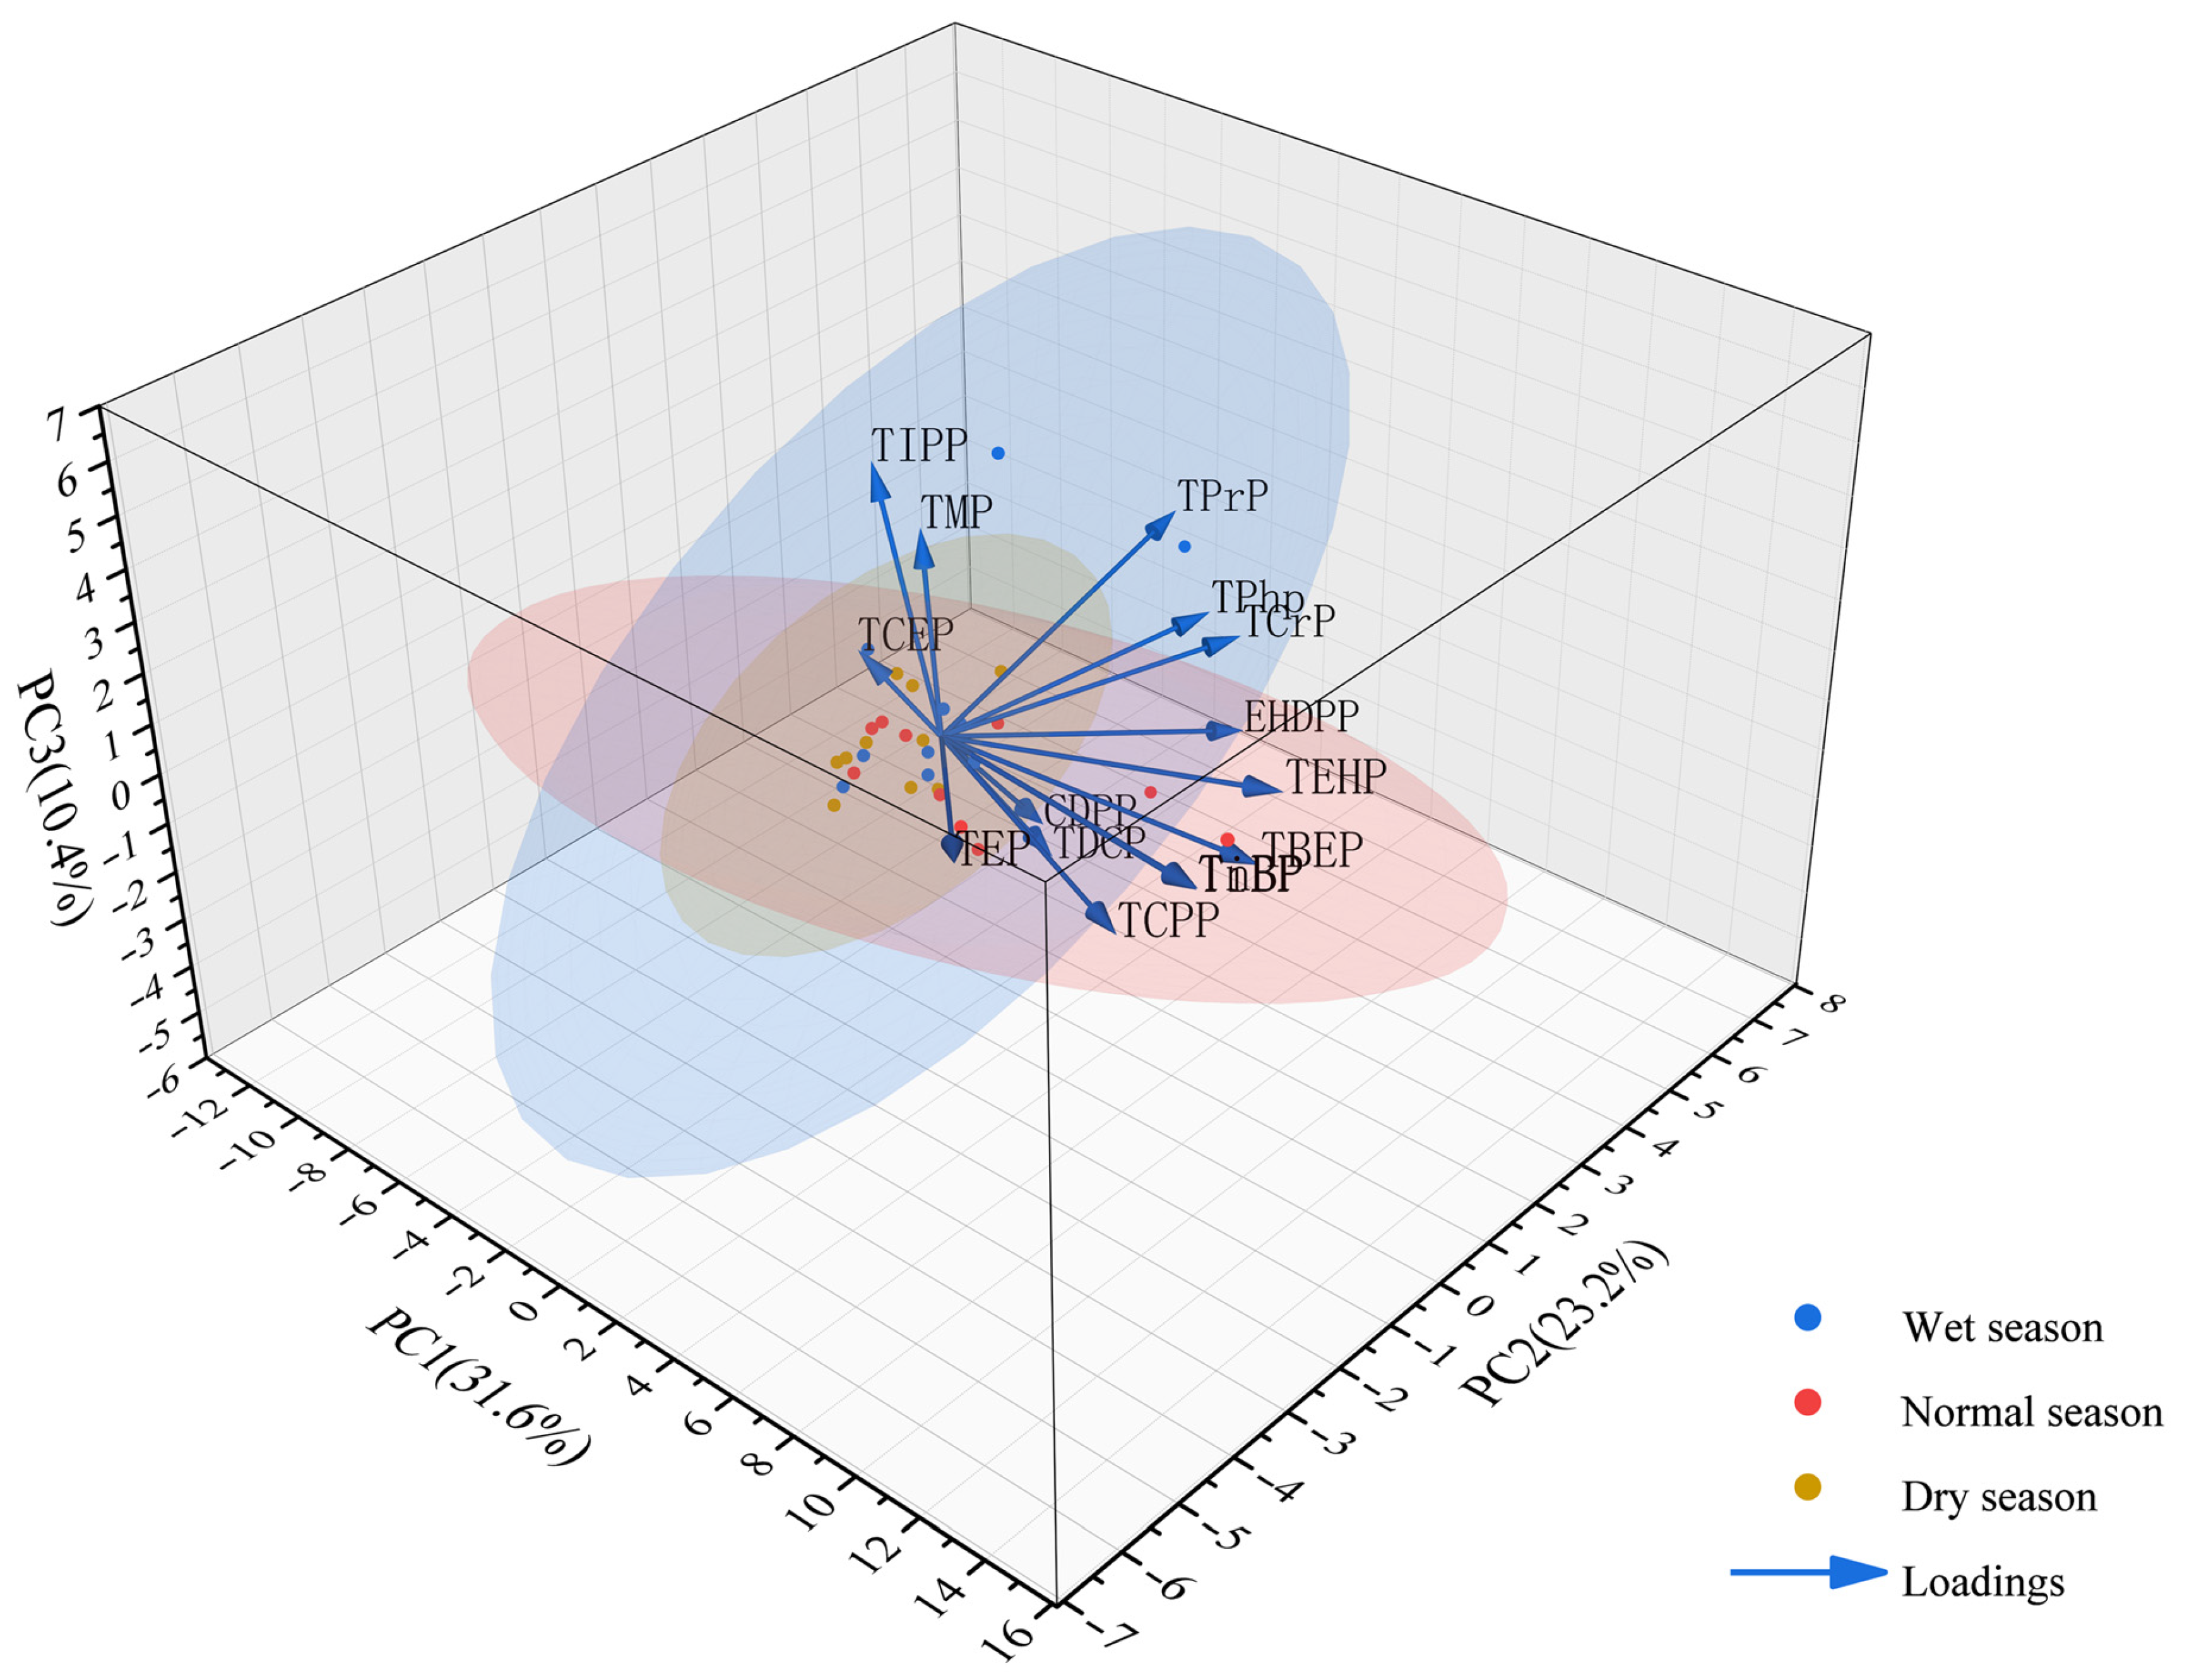
Principal Component Analysis (PCA) was employed to further elucidate the sources and contribution characteristics of OPEs in the water bodies of Poyang Lake’s inflowing rivers. The analysis extracted three principal components (PC1, PC2, and PC3), which cumulatively accounted for 65.2% of the total variance. The biplot visualizing the factor loadings and sample scores for PC1 and PC2 is presented in
Figure 4.
PC1, explaining 31.6% of the variance, exhibited high loadings for TnBP, TiBP, TBEP, TEHP, and TCPP. TnBP and TiBP are frequently utilized as additives in hydraulic fluids, engine oils, and plastics [
37,
38]. TCPP is widely applied in industrial production—often in large quantities—as a flame retardant in furniture, electronic products, and textiles [
38,
39]. TBEP is typically added to polyurethane foams, paints, and floor polishes, while TEHP is incorporated into materials such as polyethylene and polyacrylate to enhance water and acid resistance [
40,
41]. The spatial distribution of these contaminants supports this attribution. The upstream region of the Changjiang River (Sampling Site R2) likely hosts chemical plants discharging wastewater containing TnBP and TiBP; these facilities may share drainage systems with printed circuit board (PCB) enterprises, leading to the concurrent detection of the flame retardant TCPP. The Xinjiang River (R7) flows through urban centers and receives effluents from wastewater treatment plants (which often exhibit low removal efficiencies for TBEP and TCPP), as well as leachate from electronic waste dismantling zones, creating a mix of domestic and industrial pollution. The Raohe River estuary (R8) is situated adjacent to freight terminals, where ship engine lubricants (containing TnBP and TiBP) and PVC liners in shipping containers (containing TBEP) constitute significant sources, with tidal action exacerbating pollutant accumulation. Consequently, PC1 is identified as a mixed source of industrial production emissions and ship traffic pollution.
PC2, accounting for 23.2% of the variance, showed high loadings for TPrP, EHDPP, and TPhP. TPrP serves as a critical industrial raw material in the production of plasticizers and flame retardants [
42]. TPhP acts as a flame retardant and plasticizer in hydraulic fluids, polyvinyl chloride (PVC), electronic products, casting resins, glues, engineering thermoplastics, phenoxy resins, and phenolic resins. It has been widely detected as an emitted component from laptops, LCD televisions, curtains, power sockets, insulation boards, wallpapers, and construction materials [
31,
41], Based on these associations, PC2 is interpreted as a pollution source deriving from waste and electronic products.
To comprehensively resolve the potential sources, the third principal component (PC3) was analyzed. PC3 alone accounted for 10.4% of the variance and was characterized by positive loadings of TIPP, TDCP, CDPP, and TMP. As TIPP and TDCP are critical additives in industrial lubricants and metal processing, CDPP serves as a specialized flame retardant, and TMP is widely utilized as a solvent for pharmaceuticals and pesticides [
38,
42], PC3 is identified as a specific localized source driven by mixed industrial processing and agricultural emissions.
Source Apportionment Using Positive Matrix Factorization (PMF)
Prior to analyzing the specific source profiles, the mathematical stability and reliability of the PMF solutions were rigorously evaluated. The optimal number of factors (three) for each season was determined based on standard diagnostic criteria. Specifically, the ratio for the base runs was 0.96, closely approaching 1.0, which indicates an excellent model fit without excessive influence from extreme data points. Furthermore, Bootstrap (BS) resampling analysis (100 runs) was performed to assess the stability of the PMF solutions. The mapping rates for all three factors reached 94%, well above the widely accepted threshold of 80%, thereby confirming that the identified source profiles are statistically robust.
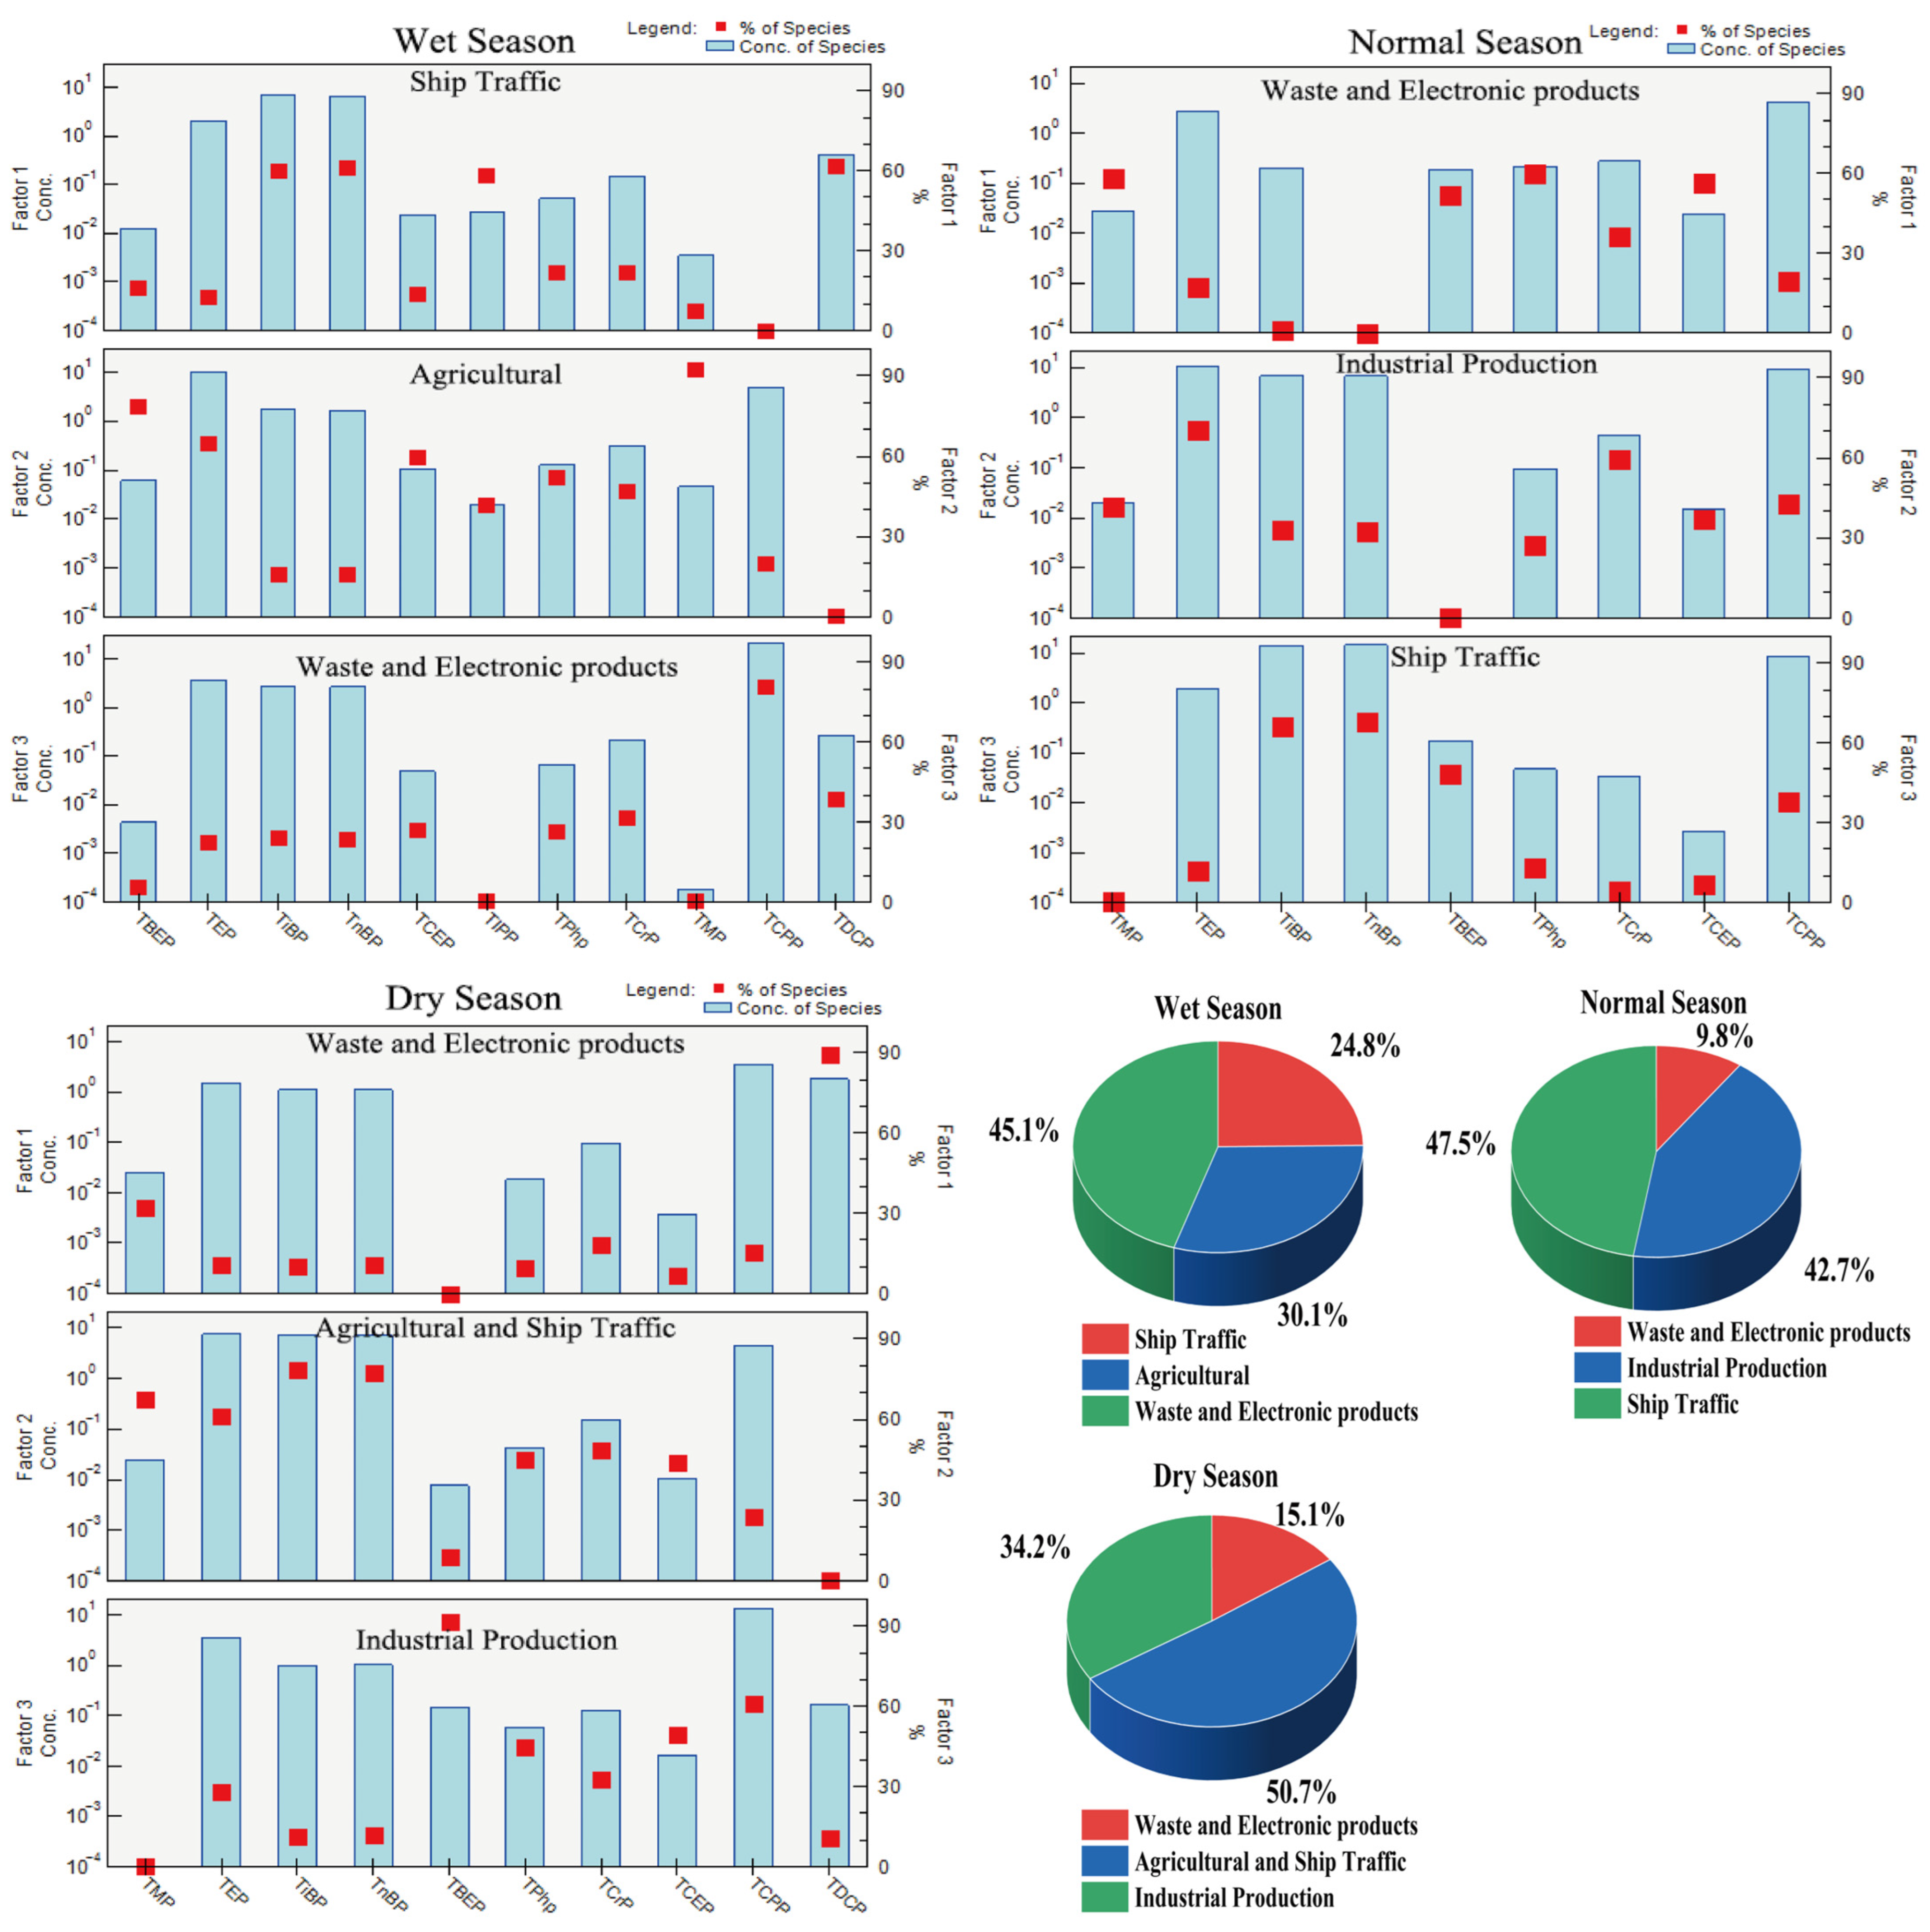
During the wet season, the PMF model was applied to identify and quantify potential OPE sources (
Figure 5). Factor 1 was identified as ship traffic pollution. The chemical profile of this factor is characterized by the specific co-occurrence of TnBP, TiBP, TDCP, and TIPP. Beyond the general industrial applications of TnBP and TiBP as flame retardants and plasticizers, their synchronized variation with a typical gasoline additive (TDCP) and a metal-processing lubricant (TIPP) forms a distinct source signature of motorized engine operations. This attribution is robustly supported by spatial evidence: the highest contributions from this factor were observed at sites (e.g., R4, R7) located directly adjacent to the primary inland navigational channels and active sand-mining zones of Poyang Lake. Therefore, the accumulation of these specific OPEs is primarily ascribed to the chronic leakage of engine lubricants, hydraulic fluids, and fuel emissions from inland vessel traffic [
31,
38,
40]. Factor 2 was dominated by TMP, with TBEP and TEP moderately weighted, corresponding to agricultural pollution. TMP and TEP are primarily utilized as solvents and extractants for pharmaceuticals and pesticides, and TBEP serves as an intermediate in these industries [
38]. Factor 3, defined by TCPP, with TDCP and TCrP moderately weighted, represents waste and electronic product pollution. TCPP is extensively used as a flame retardant in rubber, polystyrene, and polyurethane foams, while TDCP and TCrP are common in mining belts, cables, and electronic device components [
31,
38,
40].
Source contribution analysis revealed that Waste and electronic products were the dominant source (45.1%) in the wet season. Intense precipitation drives surface runoff, flushing large quantities of OPEs from open-air domestic waste and improperly managed e-waste (e.g., flame retardants in casings) into the inlet regions—a process exacerbated by dense populations and insufficient waste classification [
41]. Agricultural Pollution accounted for 30.1%, coinciding with the peak crop growth season when pesticides and OPE-containing plastic mulches are transported into the lake via drainage and runoff [
18]. Although shipping is frequent, Ship Traffic contributed only 24.8%, as the high water volume and flow velocity during the wet season facilitate dilution, thereby limiting the local impact of this point source [
18].
In the normal season, Factor 1 was dominated by TPhP, along with TMP and TCEP. TPhP is a common emission from electronics (e.g., laptops, TVs) and construction materials (e.g., PVC, insulation), while TCEP is used in circuit board encapsulation [
31,
38,
40]. Accordingly, Factor 1 was identified as Electronic Product Production or Waste Disposal. Factor 2 showed high loadings of TEP and TCrP. TEP is widely added to PVC and polyurethane foams, and TCrP is frequently found in industrial lubricants and plastic processing machinery [
38], identifying Factor 2 as Industrial Production. Factor 3 was characterized by TnBP and TiBP, typical markers for lubricants and hydraulic fluids [
40,
41], and was thus identified as Ship Traffic Pollution.
The contribution profile shifted significantly in the normal season, with Ship Traffic becoming the primary source (47.5%). Stable water levels increase shipping volume, while slower flow velocities reduce pollutant diffusion, leading to the accumulation of fuel leaks and antifouling paints. Industrial Production accounted for 42.7%; unlike rainfall-dependent agricultural sources, industrial emissions are continuous. The reduction in surface runoff decreases natural dilution, thereby increasing the relative proportion of chemically stable industrial OPEs (e.g., TCrP) [
15]. Conversely, the contribution of Waste and Electronic Products dropped to 9.8% due to the weakening of rainfall-driven runoff scouring [
38].
During the dry season, Factor 1 was dominated by TDCP and TMP, associated with mining belts, cables, and electronic manufacturing materials [
31,
38,
40], and was identified as Electronic Product Production or Waste Disposal. Factor 2 was characterized by TnBP and TiBP (shipping markers) as well as TMP and TEP (pesticide solvents) [
38] designating it as Mixed Agricultural and Ship Traffic Pollution. Factor 3 was defined by TBEP and TCPP, indicating inputs from plasticizers, paints, and polyurethane foam production [
31,
38,
40], and was identified as Industrial Production.
Mixed agricultural and ship traffic sources dominated the dry season (50.7%). This attribution is driven by the application of fertilizers and pesticides for overwintering crops entering via irrigation drainage, combined with the concentration of ships in narrow navigation channels due to low water levels. Reduced water volume and flow velocity further exacerbate the accumulation of these pollutants [
18]. Industrial Production accounted for 34.2%, maintained by continuous point-source emissions. Waste and electronic products (15.1%) remained the minor source but rose slightly compared to the normal season; falling water levels expose previously submerged waste, allowing wind or minor precipitation to re-introduce OPEs into the water body, although overall emissions remain dispersed [
41].
3.4. Ecological Risk Assessment
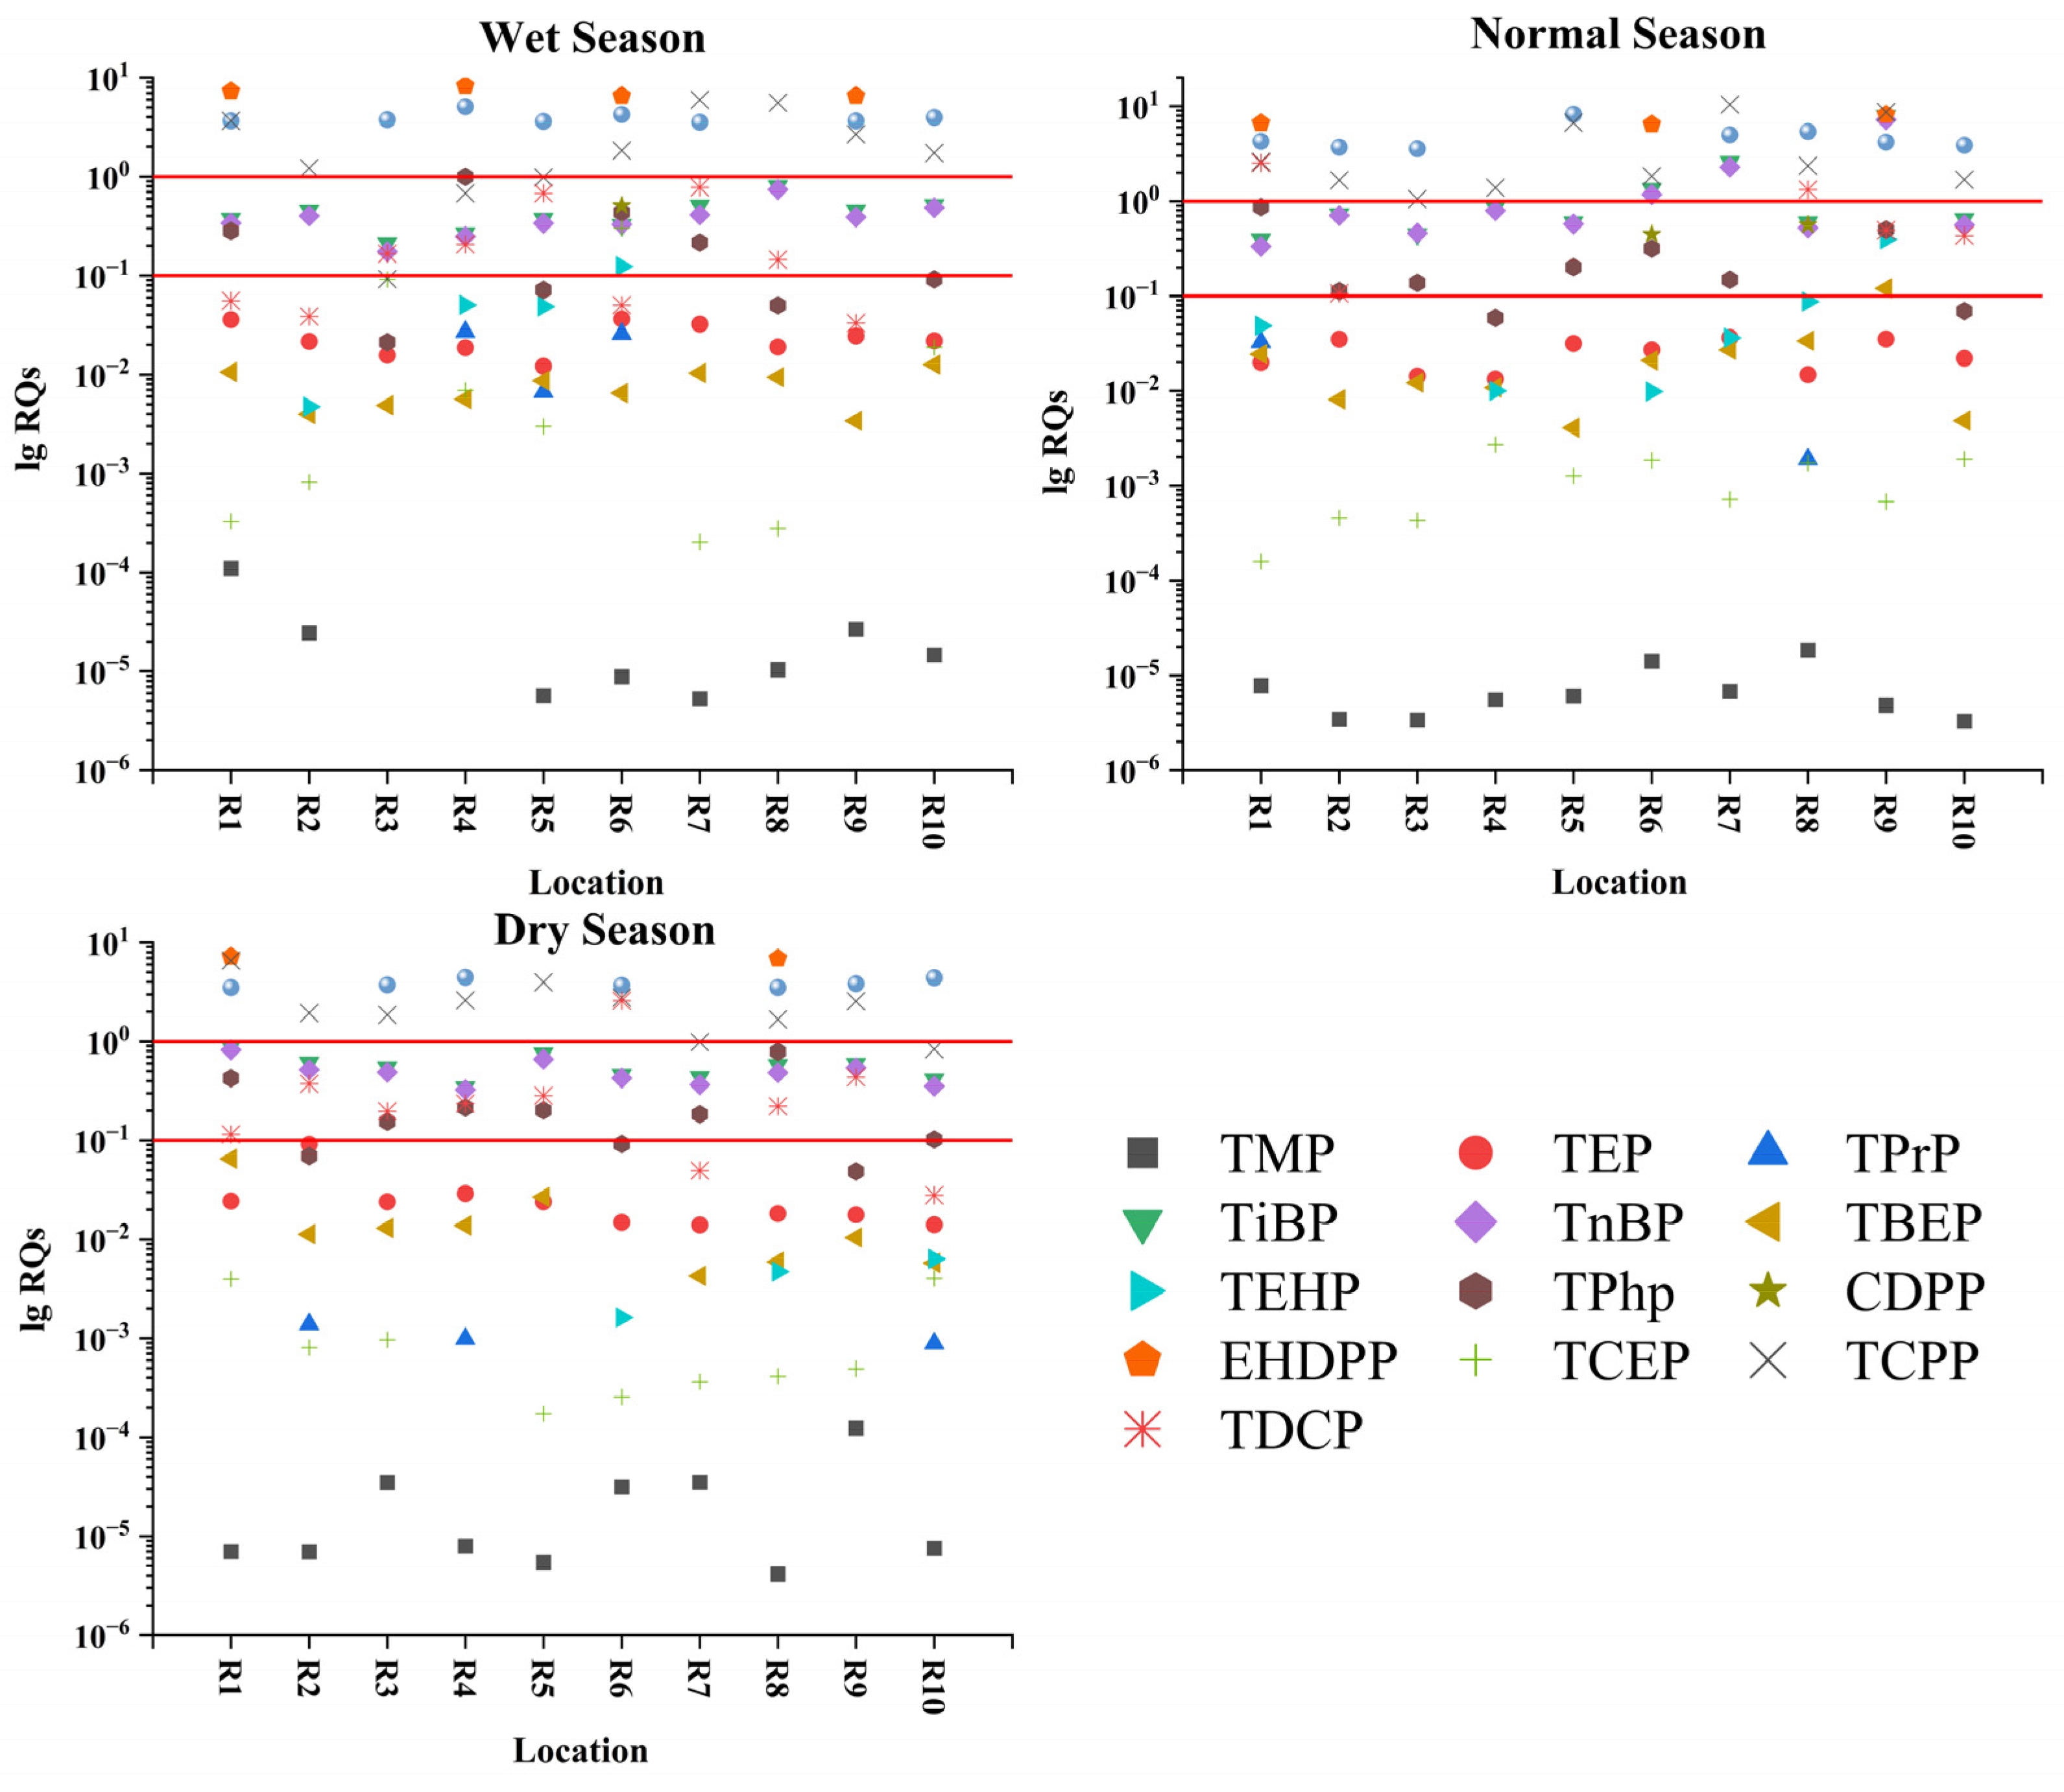
The ecological risks of OPEs in the surface water of the Poyang Lake inlet regions were evaluated using the Risk Quotient (RQ) method. The assessment results indicated that the RQ values for the majority of OPEs concerning algae, crustaceans, and fish were below 0.1, suggesting a generally low ecological risk across the study area (
Table S3,
Figure 6).
However, specific OPE congeners exhibited elevated risk levels. EHDPP, TCrP, and TCPP, along with TiBP, TnBP, TDCP, and TPhP at certain sampling sites, exceeded the high-risk threshold (RQ ≥ 1.0), classifying them as high-ecological-risk contaminants. This implies that the environmental concentrations of these compounds may have reached or surpassed levels capable of inducing direct toxic effects on aquatic organisms, particularly sensitive species. Long-term exposure to these concentrations could inhibit organismal growth, reduce reproductive capacity, and ultimately impact population structures and ecosystem functions [
2]. Furthermore, other OPEs including CDPP, TCEP, TBEP, and TEHP, alongside the aforementioned contaminants at their non-peak sites, were frequently identified in the medium risk category (0.1 ≤ RQ < 1.0). Although these compounds have not yet reached critical high-risk levels globally, they present a potential ecological hazard. With cumulative concentration increases or prolonged exposure durations, they may induce sublethal effects—such as alterations in physiological metabolism and behavioral characteristics—which could subsequently threaten higher trophic levels (including birds and mammals) via biomagnification along the food chain [
43].
Furthermore, traditional risk assessments relying solely on individual Risk Quotients (RQs) may underestimate the actual ecological threat due to the potential for mixture toxicity. OPEs frequently co-occur in the aquatic environment and often share similar modes of toxicological action, such as neurotoxicity and endocrine disruption [
27,
44]. Consequently, concurrent exposure to multiple OPEs can lead to additive or even synergistic toxicological effects. Given the simultaneous detection of multiple OPE congeners across the sampling sites in Poyang Lake, the combined ecological risk to aquatic organisms is likely greater than the simple sum of individual RQs. This underscores the critical need to consider mixture toxicity and cumulative risk models in future environmental risk frameworks.
It is important to note that current research on OPE toxicity to aquatic organisms predominantly focuses on acute toxicity endpoints. In this study, the Predicted No-Effect Concentration (PNEC) was derived from LC50 data using an assessment factor (AF), whereas aquatic organisms in natural environments are typically subjected to long-term chronic exposure. Consequently, this assessment method may introduce uncertainties, potentially leading to either over-protection or under-protection. Therefore, the ecological risks associated with long-term, low-dose combined exposure to OPE mixtures warrant further investigation.
4. Conclusions
This study demonstrates that seasonal hydrological regimes fundamentally regulate the occurrence, environmental behavior, and ecological risks of organophosphate esters (OPEs) at the river–lake interface of Poyang Lake. Alkyl-OPEs and Cl-OPEs consistently dominated the contaminant profiles across all seasons. Crucially, while the regional background risk remains generally low, the risk quotient (RQ) assessment identified localized high-risk hotspots (RQ ≥ 1.0) driven by specific congeners, including EHDPP, TCrP, TCPP, TiBP, TnBP, TDCP, and TPhP. The pervasive presence of medium-risk OPEs further highlights the potential for chronic sublethal effects and biomagnification in sensitive aquatic species under prolonged exposure.
The spatiotemporal dynamics of these contaminants are inextricably linked to variations in macroscopic water quality parameters. Significant positive correlations between highly soluble OPEs (e.g., TCPP, TEP, TnBP) and nutrients (TP, NH3-N) indicate hydrodynamically driven co-transport from continuous point sources. Conversely, significant negative correlations with water temperature and total nitrogen (TN) underscore the competing environmental influences of temperature-enhanced degradation kinetics and precipitation-driven dilution.
This hydrological modulation directly dictates the distinct seasonal succession of primary pollution sources. Rather than remaining static, source contributions shifted dramatically: intense wet-season precipitation primarily flushes non-point sources from waste and electronic products (45.1%), whereas reduced flows and stable water levels in the normal and dry seasons exacerbate the localized accumulation of ship traffic emissions (47.5%) and mixed agricultural inputs (50.7%). This dynamic shift mechanistically explains the observed seasonal concentration gradient, characterized by higher levels during the dry season and lower levels during the wet season, across the basin.
Ultimately, these findings emphasize that static water quality management is insufficient for emerging contaminants. Mitigating OPE pollution in dynamic river–lake systems requires temporally adaptive, source-specific control strategies tailored to seasonal hydrological cycles, alongside targeted interventions at high-risk estuarine hotspots. For instance, wet-season management must prioritize upgrading solid waste infrastructure to intercept rainfall-driven runoff from e-waste dumpsites. Conversely, strategies during the dry and normal seasons should strictly regulate bilge water discharges and promote eco-friendly marine lubricants to curb localized ship traffic emissions. Furthermore, implementing advanced treatment technologies (e.g., advanced oxidation processes) in local wastewater treatment plants is critical to efficiently intercept highly mobile hydrophilic OPEs before they reach the lake.





 ,
,