Article

Identification and Spatiotemporal Evolution of Drought–Flood Abrupt Alternation Events in the Yellow River Basin Based on Standardized Precipitation Evapotranspiration Index (SPEI)


1
School of Ecology and Environment, North China University of Water Resources and Electric Power, Zhengzhou 450046, China
2
College of Water Resources, North China University of Water Resources and Electric Power, Zhengzhou 450046, China
*
Author to whom correspondence should be addressed.
Water 2026, 18(9), 1053; https://doi.org/10.3390/w18091053
Submission received: 6 April 2026 / Revised: 22 April 2026 / Accepted: 27 April 2026 / Published: 29 April 2026

Abstract

This study proposes a quantitative identification method for drought–flood abrupt alternation (DFAA) events in the Yellow River Basin (YRB) based on the daily standardized precipitation evapotranspiration index (SPEI) data from 1982 to 2021 and analyzes their spatiotemporal evolution characteristics. The results show that the proposed identification method has good applicability and agrees well with historical records. Grid-scale DFAA events showed an overall slowly increasing trend in occurrence frequency. The mean occurrence frequency, mean duration, and mean intensity were 0.67 events, 30.57 d, and 1.45, respectively. The mean occurrence frequency had a pattern of being higher in the middle and lower reaches and lower in the upper reaches, whereas the mean intensity had a pattern of being higher in the west than in the east and higher in the south than in the north. A total of 16 DFAA events were identified in the YRB, with a mean annual occurrence frequency of 0.4 events per year and an increasing trend across decades. The mean total duration of these events was 31.81 d, and the intensity ranged from 0.96 to 1.79. DFAA events were generally less frequent in the upper reaches and more frequent in the middle and lower reaches and the inland-drainage area. For the level-II water resource subregions, Hekouzhen–Longmen (Subregion IV), Sanmenxia–Huayuankou (Subregion VI), the area below Huayuankou (Subregion VII), and the inland-drainage area (Subregion VIII) had higher occurrence frequencies and larger fluctuations in duration. These findings could provide a scientific reference for flood control, drought relief, and disaster risk management in the YRB.

1. Introduction

The Sixth Assessment Report of the Intergovernmental Panel on Climate Change (IPCC) stated that global surface temperature during 2011–2020 was 1.09 °C higher than that in the pre-industrial period (1850–1900) and is projected to exceed 1.5 °C by the middle of the twenty-first century [1]. Under global warming, both the occurrence frequency and intensity of extreme hydrological events, including droughts and floods, have increased [2,3,4,5]. Drought–flood abrupt alternation (DFAA), as a compound extreme hydrological event, has increased in many regions [6,7]. It has caused serious impacts on human production, daily life, and natural ecosystems. Compared with a single drought or flood event, DFAA aggravates disaster losses [8,9,10].
In general, DFAA refers to an abrupt shift from intensifying drought to flood control and emergency response in a region or river basin, triggered by an extreme rainstorm or flood event. It is an extreme hazard characterized by a rapid transition between drought and flood conditions [11]. However, no unified criterion for identifying DFAA has yet been established in hydrology and meteorology [12]. Due to the difficulty of directly observing the intensity and extent of impact of DFAA events, DFAA is commonly described using specific indices [13]. Existing identification approaches can generally be grouped into three categories: (1) Identification based on monitored meteorological variables such as precipitation [14,15]. This identification method relies on actual precipitation data and can directly extract DFAA events, giving it a certain degree of intuitiveness and reliability. However, the classification of drought and flood conditions often depends on empirical thresholds, which may result in differences in the applicability of the criteria across regions or under different climatic conditions. (2) Identification based on drought and flood indices, such as standardized precipitation index (SPI), standardized weighted average precipitation (SWAP), and standardized precipitation evapotranspiration index (SPEI). These indices classify DFAA events into different categories by setting threshold values [16,17,18]. By comparing the index values with the corresponding thresholds, DFAA events of different categories can be readily identified. (3) Identification based on drought–flood abrupt alternation indices constructed from precipitation-related variables, mainly including the long-cycle drought–flood abrupt alternation index (LDFAI), short-cycle drought–flood abrupt alternation index (SDFAI), and daily-scale drought–flood abrupt alternation index (DWAAI). The calculation procedures of LDFAI and SDFAI are relatively simple and do not require manual screening. However, they still have some limitations [19,20]. For example, these indices usually consider only the drought–flood difference between the preceding and subsequent periods but do not consider the degree of abruptness in the transition from drought to flood, which may reduce the accuracy of identification. To address this problem, Shan et al. [21] developed the DWAAI, which incorporates the degree of abrupt transition and thus provides a more comprehensive basis for identifying DFAA events.
Among these indices, SPEI jointly considers precipitation and potential evapotranspiration demand, has the advantage of multi-timescale applicability and is more sensitive to enhanced evaporative demand under a warming climate [3,22]. Therefore, it is more effective in characterizing the continuous process of antecedent drought accumulation followed by abrupt wetting during DFAA and can better reflect the dynamic evolution of regional drought and flood conditions. Consequently, it has been widely applied in studies on the identification of DFAA events. For example, Sun et al. [23] and Meng et al. [24] used the SPEI to analyze the spatiotemporal evolution characteristics of DFAA events in China as a whole and in the Yangtze River Basin, respectively.
From occurrence to development and termination, DFAA events are essentially a dynamic evolution process with both temporal and spatial continuity. Therefore, their evolutionary characteristics should be revealed from both temporal and spatial perspectives. However, existing studies mainly focus on the analysis of spatiotemporal variation at the grid or station scale [25,26,27]. Few studies have systematically characterized the spatiotemporal continuity and coupled evolution of DFAA events at the basin scale [28,29]. At the same time, discussion of threshold selection in DFAA identification, such as drought duration, flood duration, and the transition time from drought to flood, remains insufficiently systematic and in-depth [30]. Many studies directly adopt threshold settings from previous literature, which makes threshold determination strongly dependent on experience. Study regions differ markedly in climatic background, seasonal precipitation structure, and underlying surface conditions. Therefore, greater attention should be paid to sensitivity analysis, uncertainty analysis, and applicability analysis when selecting thresholds [31,32].
The Yellow River Basin (YRB) is an important economic region in China, a major center of population activity, and a key grain-producing area. It accounts for 8.6% of the national population and 12.5% of the country’s cultivated land area. Spanning arid, semi-arid, and semi-humid regions, the YRB is a climate-sensitive area where DFAA and the coexistence of drought and flood are particularly evident [26,33]. This has significant impacts on the socio-economic development of the basin. In particular, it poses severe threats to agricultural production and food security [34,35]. According to historical records, one such event that occurred in the YRB in 2012 affected 4.0086 million people, damaged crops over 4305.99 thousand hectares, and caused direct economic losses of CNY 15.710 billion [10]. In this study, the objectives are to (1) identify grid-scale DFAA events in the YRB based on the daily SPEI from 1982 to 2021; (2) propose a quantitative identification method for DFAA events in the YRB; and (3) analyze the spatiotemporal variations in the occurrence frequency, duration, and intensity of DFAA events. The findings provide a scientific basis for DFAA risk management, response strategy formulation, and flood control and drought relief practices in the YRB.

2. Materials and Methods

2.1. Study Area

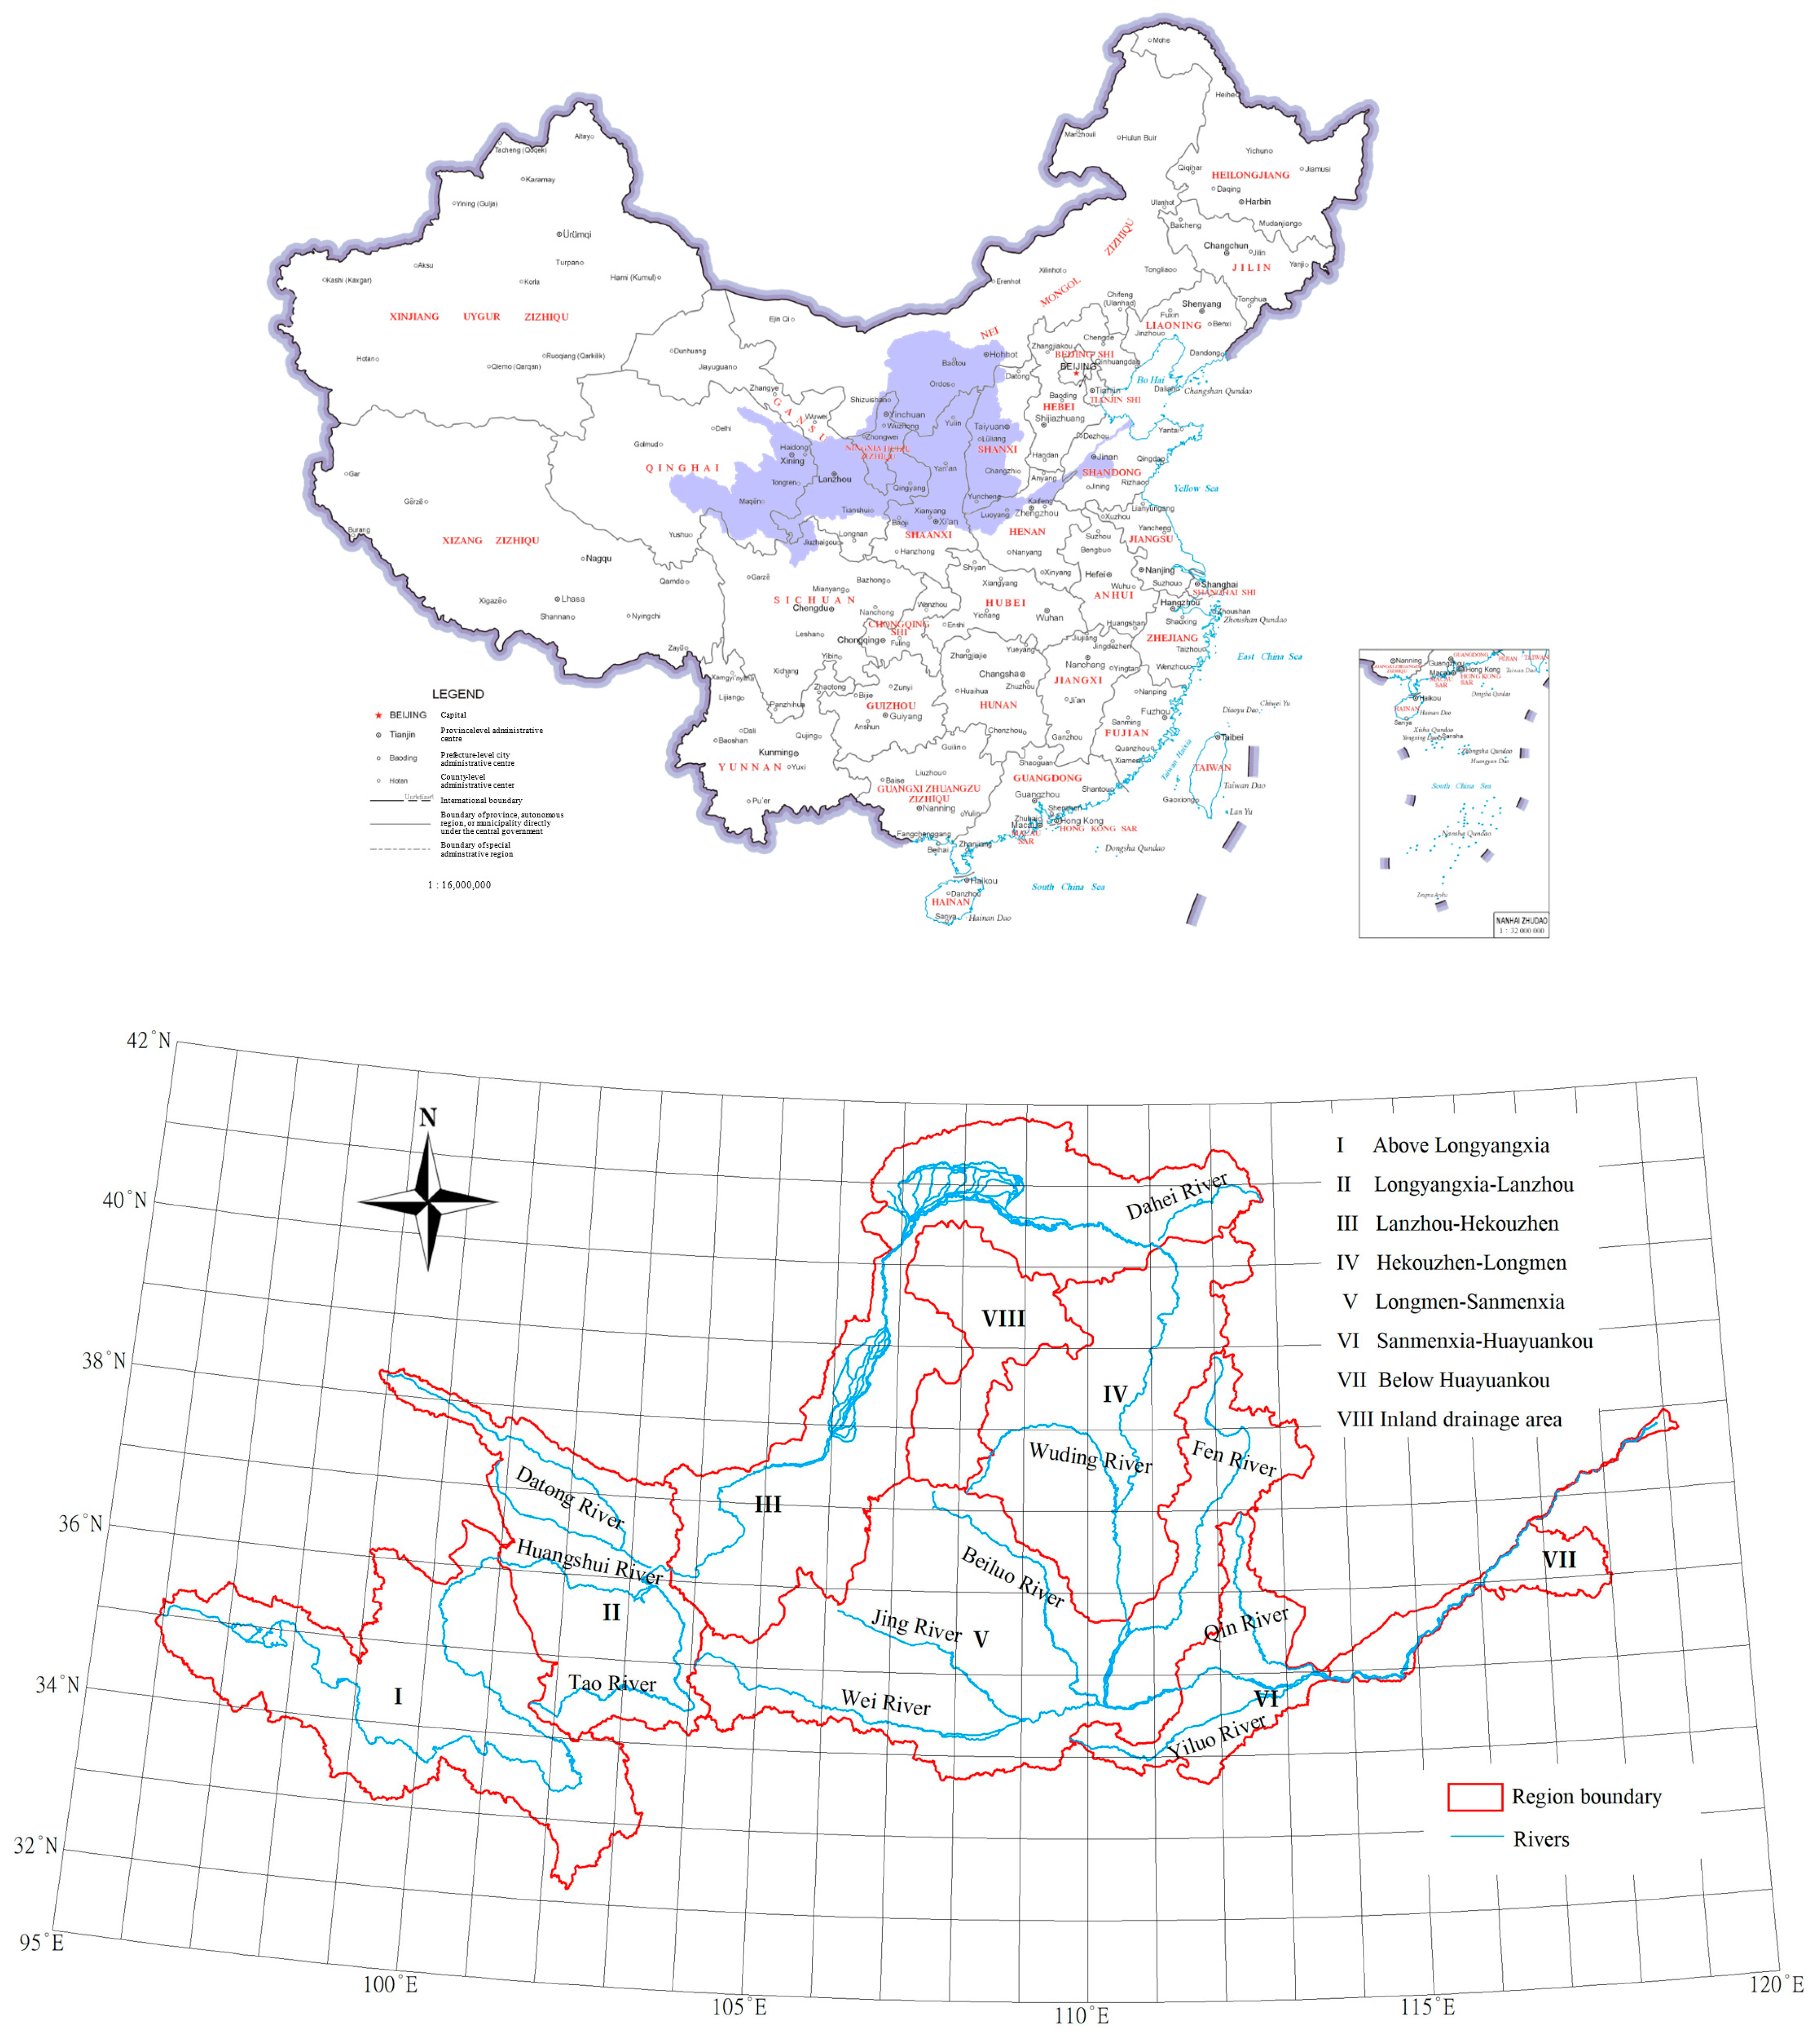
The YRB extends from 95°53′ to 119°05′ E and from 32°10′ to 41°50′ N. The main stem is 5464 km long, with a total elevation drop of 4480 m and a basin area of 795,000 km2, including 42,000 km2 of inland-drainage area. The terrain generally descends from west to east, and the basin exhibits highly diverse landforms. For water resources management, the basin is conventionally divided into eight level-II water resource subregions: above Longyangxia, Longyangxia–Lanzhou, Lanzhou–Hekouzhen, Hekouzhen–Longmen, Longmen–Sanmenxia, Sanmenxia–Huayuankou, below Huayuankou, and the inland drainage area (Figure 1). The YRB spans arid, semi-arid, and semi-humid climate zones, resulting in pronounced climatic heterogeneity. Mean annual air temperature ranges from −4 to 14 °C and generally decreases from south to north and from east to west. Precipitation is unevenly distributed and shows strong interannual variability. Approximately 60–80% of annual precipitation occurs from July to October, often in the form of heavy rainfall events. Across most of the basin, annual precipitation ranges from 200 to 650 mm.

2.2. Data

Daily SPEI data for the YRB during 1982–2021 were obtained from the global daily SPEI dataset (SPEI-GD) released by Liu et al. [36]. SPEI-GD was developed from ERA5 daily precipitation and Singer’s potential evapotranspiration data [37]. It provides relatively high spatiotemporal resolution and broad spatial coverage. It has shown high simulation accuracy in China and performs well in this region. In this study, the SPEI data have a temporal scale of 5 days and a spatial resolution of 0.25° × 0.25°, covering a total of 1498 grids. The dataset is openly available through the Zenodo platform (https://doi.org/10.5281/zenodo.8060268). Reports such as the China Flood and Drought Disaster Bulletin, the China Water Resources Bulletin, and Historical Droughts in China were used to validate the identification results of DFAA events.

2.3. Methods

2.3.1. Standardized Precipitation Evapotranspiration Index (SPEI)

The SPEI is a climatic drought index developed from the SPI. It is based on a simple water-balance framework and explicitly incorporates the influence of atmospheric evaporative demand on moisture fluxes [38]. The detailed calculation procedure can be found in Reference [37]. Because SPEI calculated at longer accumulation timescales is less sensitive to precipitation anomalies and responds less clearly to abrupt shifts in rainfall, daily SPEI at a 5-day accumulation timescale was used here to identify DFAA events. According to the SPEI drought and flood classification standard [39], SPEI ≥ 0.5 was classified as flood, whereas SPEI ≤ −0.5 was classified as drought (Table 1).

2.3.2. Identification of DFAA Events

In this study, the focus is mainly placed on the drought-to-flood process for two reasons. On the one hand, in the study area, this type of event is often associated with greater disaster losses and more severe secondary risks [40]. For example, antecedent drought may weaken soil infiltration capacity and enhance runoff generation and concentration efficiency, thereby amplifying the risk of rainstorm-induced flooding. On the other hand, the typical hazard chain characterized by prolonged moisture deficit followed by short-duration intense precipitation is more consistent with the integrated response of the SPEI to changes in moisture surplus and deficit [38]. This makes the SPEI-based identification framework using run theory more coherent in terms of physical interpretation.
Because drought and flood conditions differ in their temporal response characteristics, the durations of the drought phase and the flood phase were treated separately [9]. Therefore, run theory was employed to identify DFAA events. As a time-series analysis framework, run theory can effectively extract multiple attributes of drought and flood events [40]. Event identification was carried out at both the grid and basin scales.
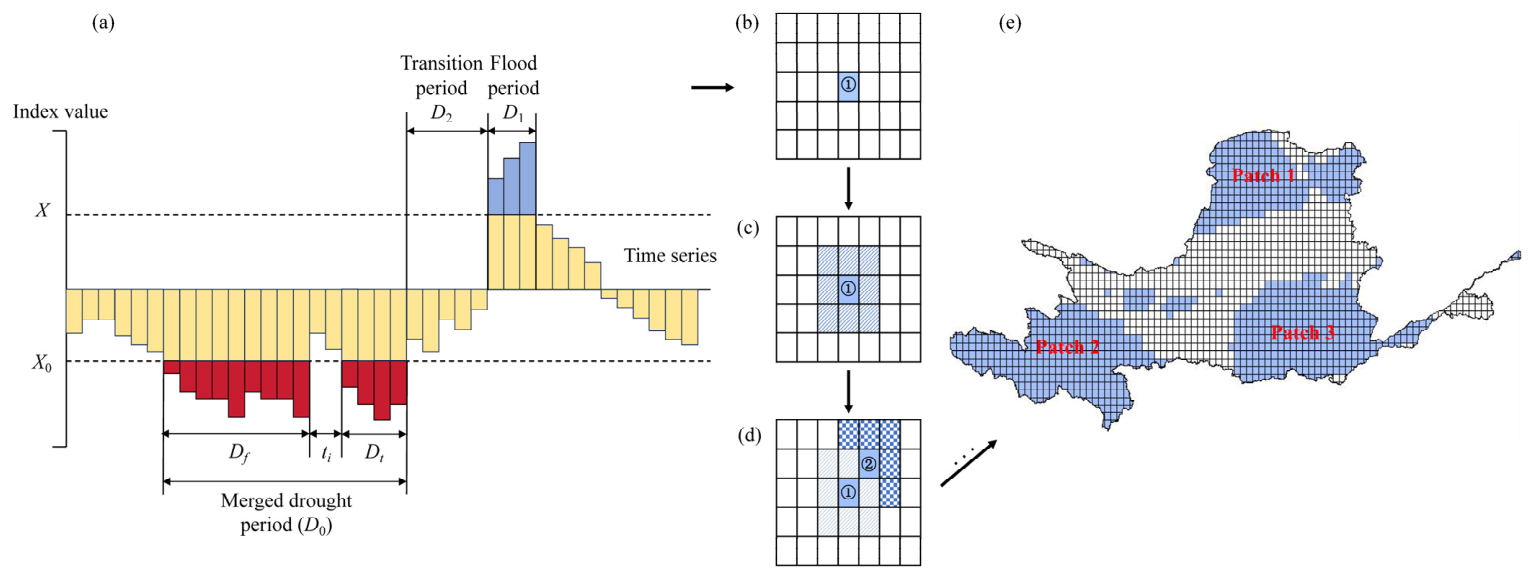
For grid-scale DFAA events identification, threshold values X0 and X1, together with duration thresholds D0, D1, and D2, were defined for the SPEI time series of an individual grid cell. A drought (flood) event was identified when the index remained below X0 (above X1) for no less than D0 (D1). When the interval between the drought phase and the subsequent flood phase did not exceed D2, that grid cell was considered to have experienced a DFAA event. According to the SPEI classification criteria, the upper bound of mild drought (−0.5) and the lower bound of mild flood (0.5) were selected as X0 and X1, respectively, and the transition period D2 between drought and flood was set to 5 d [23].
For basin-scale DFAA event identification, the analysis was based on the results of grid-scale event detection. Starting from the first grid identified as having experienced a DFAA event, the surrounding 3 × 3 neighborhood was examined to determine whether other affected grids were present. If such grids were found, they were marked, and the search then continued outward from the newly marked grids until no additional neighboring event grids could be identified. Spatially contiguous grids identified in this way were defined as DFAA patches. When the total area of these patches exceeded A0, that is, the prescribed area threshold relative to the total basin area, a basin-scale DFAA event was preliminarily identified. The event-identification procedure based on run theory is illustrated in Figure 2.
The identified DFAA events were characterized by three metrics: occurrence frequency, duration, and intensity. Occurrence frequency denotes the total number of such events during the study period, duration represents the persistence of the drought-to-flood transition within an event, and intensity describes the magnitude of the abrupt alternation. The calculation formula for DFAA intensity is as follows:
Q = i = 1 m SPEI i + j = 1 n SPEI j m + n
where SPEIi is the SPEI value on day i during the drought phase, m is the drought duration, SPEIj is the SPEI value on day j during the flood phase, and n is the flood duration. The larger the Q value, the greater the intensity of DFAA.

2.3.3. Determination of Identification Thresholds

To determine the key thresholds in Section 2.3.2, a total of 84 threshold combinations were designed. Specifically, the drought-duration threshold D0 was set to 5, 10, 15, and 20 d; the flood-duration threshold D1 was set to 3, 5, and 7 d; and the area threshold A0 was set to 30%, 35%, 40%, 45%, 50%, 55%, and 60%. These combinations were designed to cover, as comprehensively as possible, potential DFAA processes under different intensity levels and spatial extents.
First, the total number of identified events was counted for each threshold combination. Combinations that produced clearly anomalous event counts were excluded by comparison with the historical occurrence frequency of DFAA events in the study area, thereby yielding a preliminary screening of candidate schemes. Subsequently, historical drought and flood disaster records were used to further select the combinations with better identification performance. Finally, representative historical DFAA events were validated at both the grid and basin scales, and the optimal threshold combination for the study region was determined.

3. Results

3.1. Identification Thresholds for DFAA Events

3.1.1. Number of DFAA Events Under Different Threshold Combinations

The number of DFAA events identified under the representative threshold combinations for the YRB is presented in Table 2, and the results for all 84 threshold combinations have been moved to Table S1 in the Supplementary Materials. The number of identified events is particularly sensitive to D0. As D0 increases from 5 d to 20 d, the number of identified events declines markedly. At the same time, increases in the flood-duration threshold D1 and the area threshold A0 also lead to a synchronous reduction in the number of identified events. When the thresholds are set too low, for example, D0 = 5 d, the identification results are more easily affected by meteorological fluctuations. Under such conditions, some short-duration and relatively weak grid-scale drought-to-flood transitions may be counted as events, resulting in a substantial overestimation of basin-scale event numbers and failing to adequately reflect actual drought-to-flood transitions. In contrast, when the thresholds are overly strict, for example, D0 = 20 d and A0 ≥ 45%, the number of drought-to-flood transitions satisfying the criteria decreases sharply, with a large number of zero values appearing in the results. This leads to an insufficient statistical sample and is inconsistent with actual conditions.
Previous studies on DFAA events in the YRB have generally reported event numbers ranging from 10 to 25 [20,26]. From the perspective of basin-scale representativeness, an area threshold of 35% provides a better balance between regional coverage and event detectability. If an area threshold of 30% is adopted, localized and short-duration processes are more likely to be included, thereby weakening the constraint implied by a “basin-scale event”. By contrast, thresholds above 40% cause the number of identified events to decrease rapidly, making it more difficult to capture the regionally coordinated drought-to-flood transitions that do occur under the highly heterogeneous spatial background of the YRB. When compared with historical records, the threshold combination of “15 d–3 d–35%” performs better, yielding a higher proportion of identified events that match documented historical cases and thus higher identification accuracy.

3.1.2. Validation Analysis of a Representative Grid-Scale DFAA Event

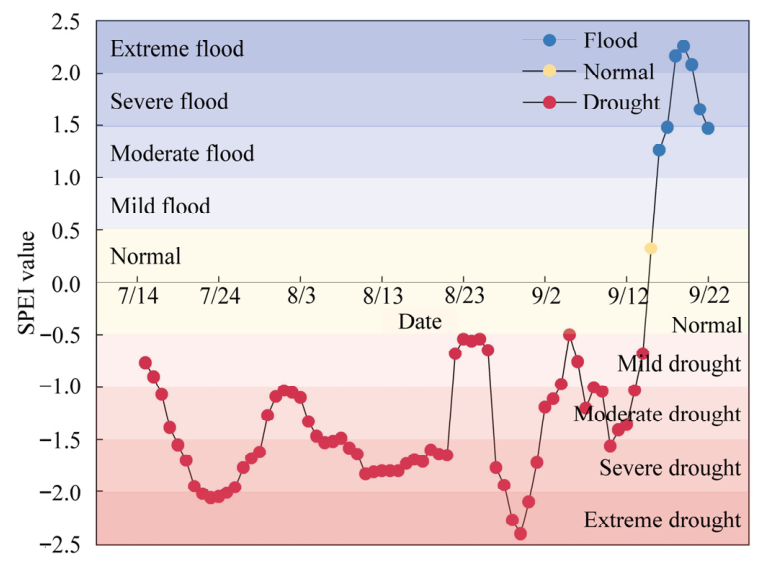
To evaluate the identification performance at the grid scale, a representative grid cell located at 110.8750° E, 34.8750° N was selected. This grid covers part of Yuncheng City, Shanxi Province, with relatively detailed historical records. The DFAA event that occurred in this grid from 15 July to 22 September 2018 was taken as a representative case for analysis. The evolution of this representative grid-scale event identified on the basis of SPEI is shown in Figure 3. The SPEI value in this grid fell below −0.5 on 15 July, reaching mild drought or more severe drought conditions. The drought phase lasted for 62 d, during which two peaks of extreme drought occurred, with SPEI values of −2.06 on 23 July and −2.40 on 30 August. The drought ended on 14 September. On 15 September, the SPEI rose to 0.32, corresponding to normal conditions. Flood conditions then developed rapidly, reaching moderate flood status on 16 September. The flood phase lasted for 7 d, and the SPEI reached 2.25 on 19 September, corresponding to an extreme flood peak. The flood ended on 22 September. This sequence clearly represents a typical DFAA event.
According to statistics released by the People’s Government of Yuncheng, Shanxi Province [41], Yuncheng experienced a pronounced summer drought in 2018. Beginning in late July, the city was affected by persistent high temperatures and scarce rainfall, and the dry conditions intensified into an extreme rainfall deficit in August. From 17 July to 24 August, the city-wide cumulative mean precipitation was only 34.6 mm, substantially below the climatological average for the same period. Records from the Ministry of Emergency Management of China [42] indicate that, since 18 September, southern Shanxi, including Yuncheng, experienced moderate to heavy rainfall, with local rainstorms that triggered flood disasters and caused damage to crops. The identified results are therefore broadly consistent with the documented onset, development, and termination of the actual drought-to-flood event.

3.1.3. Validation Analysis of a Representative Basin-Scale DFAA Event

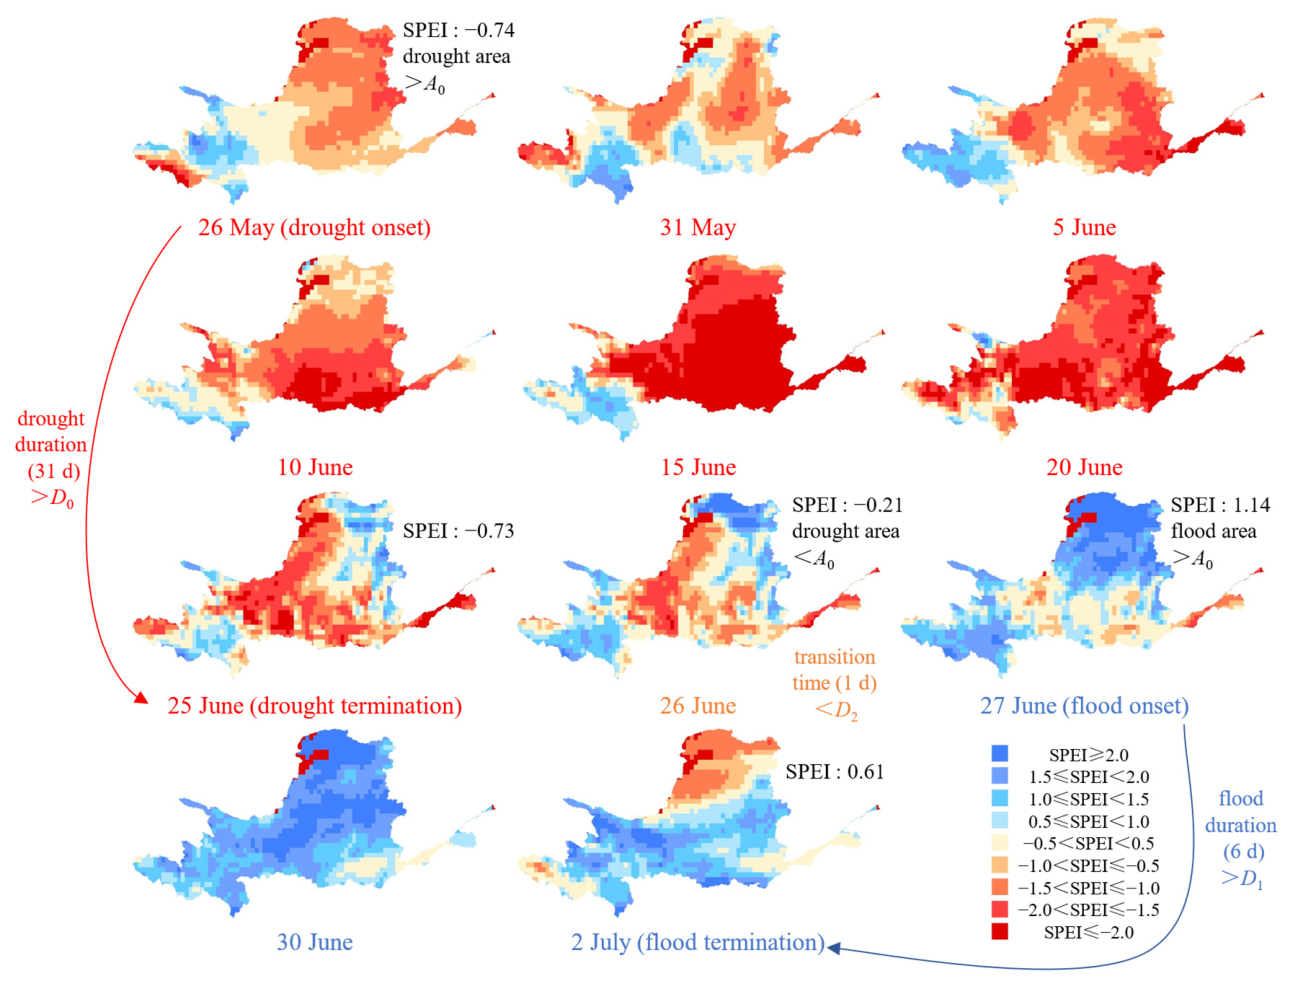
A basin-scale DFAA event that occurred in 2012, from 26 May to 2 July, was selected as a representative case to validate the identification performance at the basin scale. The evolution of this basin-scale event identified using SPEI is shown in Figure 4. By 26 May, a large area of drought had already formed across the middle and lower reaches of the basin, dominated overall by mild to moderate drought, with some local areas reaching severe drought. By 31 May, the drought area had expanded further. Most of the central-eastern and northern parts of the basin remained under mild to moderate drought conditions, while some local fluctuations occurred in the southern and western regions; nevertheless, the basin as a whole was still in the drought development stage. After entering June, the drought intensified continuously. By 5 June, most of the basin had reached at least moderate drought conditions, and some eastern and central-eastern areas experienced severe drought. In mid- to late June, both the spatial extent and intensity of drought reached their peak. After 20 June, although most of the basin remained under moderate to severe drought, drought conditions in some areas had begun to fluctuate and weaken. By 25 June, some parts of the central-eastern and northern basin had gradually returned to normal conditions, and the drought process had essentially ended, with a total duration of 31 d. After 26 June, the basin rapidly shifted from drought to flood. On 27 June, the northern and central-eastern parts of the basin entered the flood phase first, with widespread mild to moderate flood conditions and severe flooding in some local areas. By 30 June, the flood extent had expanded gradually, and almost the entire basin was dominated by moderate to severe flood conditions, while some northern and central-eastern areas reached extreme flood status. On 2 July, widespread flooding still persisted across the basin, although its intensity had already weakened compared with the earlier stage. At that point, the flood process had essentially ended, with a total duration of 6 d. This event therefore constitutes a typical basin-scale DFAA event.
According to the China Flood and Drought Disaster Bulletin 2012 [10], “a summer drought occurred in the Huanghuai region in 2012”. In June, precipitation remained persistently below normal across most of the Huanghuai region. Mean precipitation in Henan, Shaanxi, Jiangsu, Anhui, and Shandong provinces was only 5 mm, 11 mm, 21 mm, 32 mm, and 14 mm, respectively, representing deficits of 70–90% relative to the climatological average for the same period. Under the combined effect of prolonged high temperatures and limited rainfall, soil moisture depletion became severe across most parts of the Huanghuai region. At the peak of the drought in late June, the drought-affected cultivated land area in the five provinces of Henan, Shaanxi, Jiangsu, Anhui, and Shandong reached 3151.33 thousand hectares, accounting for 60.9% of the national drought-affected cultivated land area during the same period. After entering July, frequent rainfall occurred across most drought-affected areas, and drought conditions were gradually relieved. During July and August, multiple intense precipitation events occurred in the upper and middle Yellow River, especially in the Shanxi–Shaanxi reach. Flood disasters affected Inner Mongolia, Shaanxi, Gansu, Ningxia, Qinghai, and Henan, and in some local areas, torrential rainfall triggered flash floods and debris flows, causing serious casualties.” This documented process is generally consistent with the identification results. It is worth noting, however, that the identified drought onset occurred about one week earlier than that reported in the historical record. A likely reason is that historical records document agricultural disaster conditions, which are characterized primarily by soil moisture depletion and the extent of affected cropland and thus inherently involve a time lag. In contrast, SPEI identifies drought conditions directly [43,44] and responds sensitively to the cumulative atmospheric water deficit over short periods, enabling it to capture meteorological signals before drought conditions become widespread. Consequently, the drought onset identified by SPEI precedes historical records by approximately one week, demonstrating the genuine early warning capability of SPEI as a meteorological drought indicator. Admittedly, the stability of this lead time is influenced by local precipitation variability and may fluctuate across individual events, yet the overall trend remains consistent.

3.2. Variation Characteristics of Grid-Scale DFAA Events

3.2.1. Temporal Variation

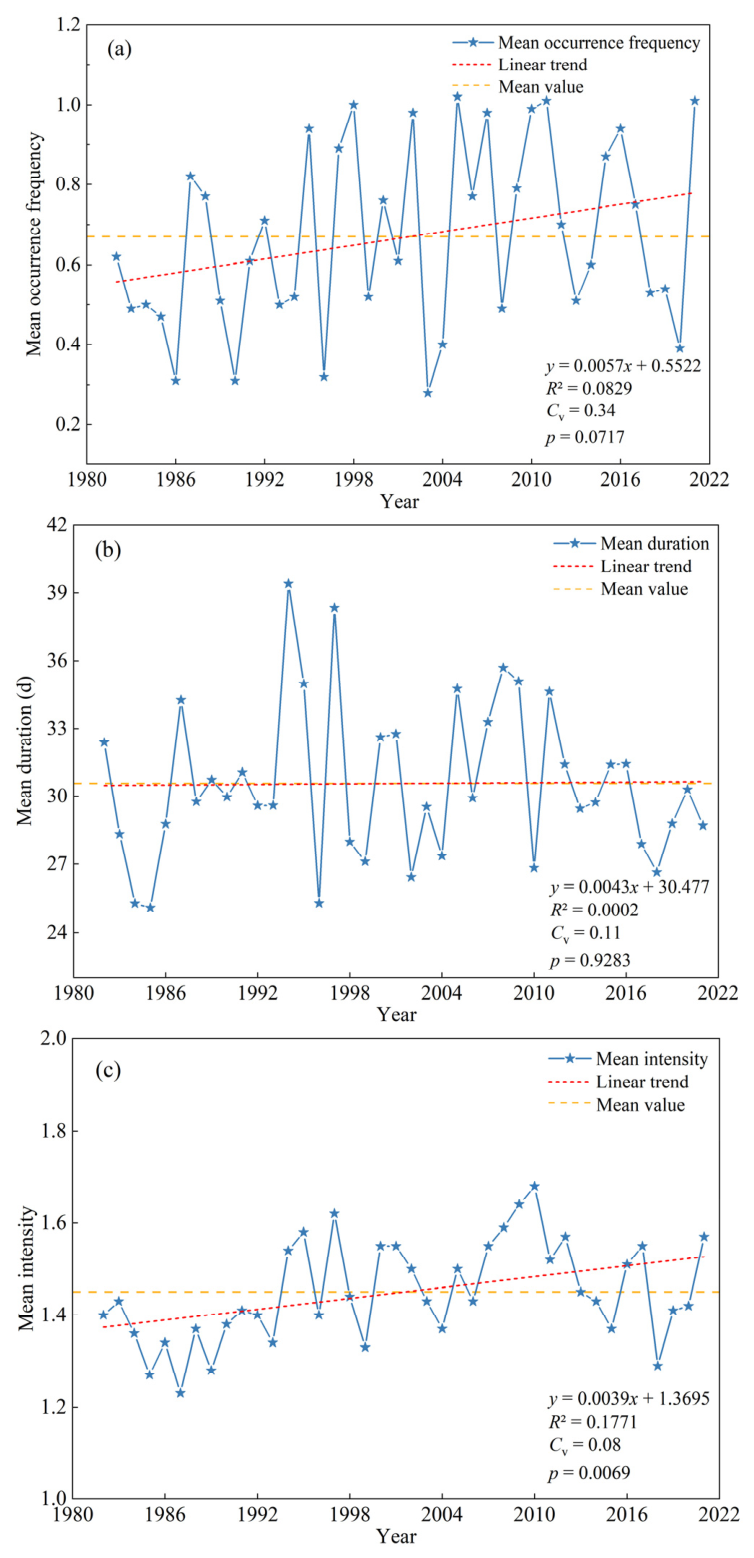
The mean occurrence frequency of grid-scale DFAA events shows pronounced interannual fluctuations during 1982–2021 (Figure 5a). The multi-year mean occurrence frequency is 0.67, with a coefficient of variation (Cv) of 0.34, and p is 0.0717, indicating substantial year-to-year variability and a markedly uneven temporal distribution. More specifically, the mean occurrence frequency was generally low during the 1980s, with most years falling below the long-term average. After the 1990s, the amplitude of fluctuation increased and in some years rose significantly above the mean. Since 2000, high-occurrence-frequency years have become more common. Around 1998, 2003, 2005, 2011, and 2021, the mean occurrence frequency approached or exceeded 1.0, whereas a distinct trough appeared around 2004, highlighting strong interannual variability. Overall, the mean occurrence frequency of grid-scale DFAA events during 1982–2021 is characterized by a slow upward trend, marked fluctuations, and clear differences among periods, with relatively high levels in recent years.
The mean duration of grid-scale DFAA events displays only a slight increasing trend during 1982–2021 (Figure 5b), with only a modest elongation and no pronounced long-term change. The multi-year mean duration is 30.57 d, p is 0.9283, and Cv is 0.11, suggesting relatively weak interannual fluctuations and high overall stability. In detail, the mean duration mostly varies between 27 d and 35 d. Larger fluctuations occurred in the mid-1980s and the late 1990s, and the maximum value over the entire study period appeared around 1994, reaching nearly 39 d. After 2000, although some stage-like increases and decreases are still evident, values in most years fluctuate around the long-term mean, and no persistent and significant prolongation is observed after 2010. In general, the mean duration of grid-scale DFAA events during 1982–2021 is characterized by relatively smooth variation, limited fluctuations, and overall temporal stability.
The mean intensity of grid-scale DFAA events follows an overall upward trajectory with fluctuations during 1982–2021 (Figure 5c), although the increase is modest. The multi-year mean intensity is 1.45, p is 0.0069, and Cv is 0.08, indicating relatively weak interannual variability and an overall stable pattern. Specifically, mean intensity values were generally low from the mid- to late 1980s, with most years below the long-term average. After the mid- to late 1990s, they gradually increased and entered a relatively distinct high-value period around 2008–2011, with the maximum value of the full study period occurring around 2010 and approaching 1.70. Although some decline is observed thereafter, values in most years remain close to or above the mean. Overall, the mean intensity of grid-scale DFAA events during 1982–2021 is characterized by a gradual increase, weak interannual fluctuations, and an overall stable temporal pattern.

3.2.2. Spatial Distribution

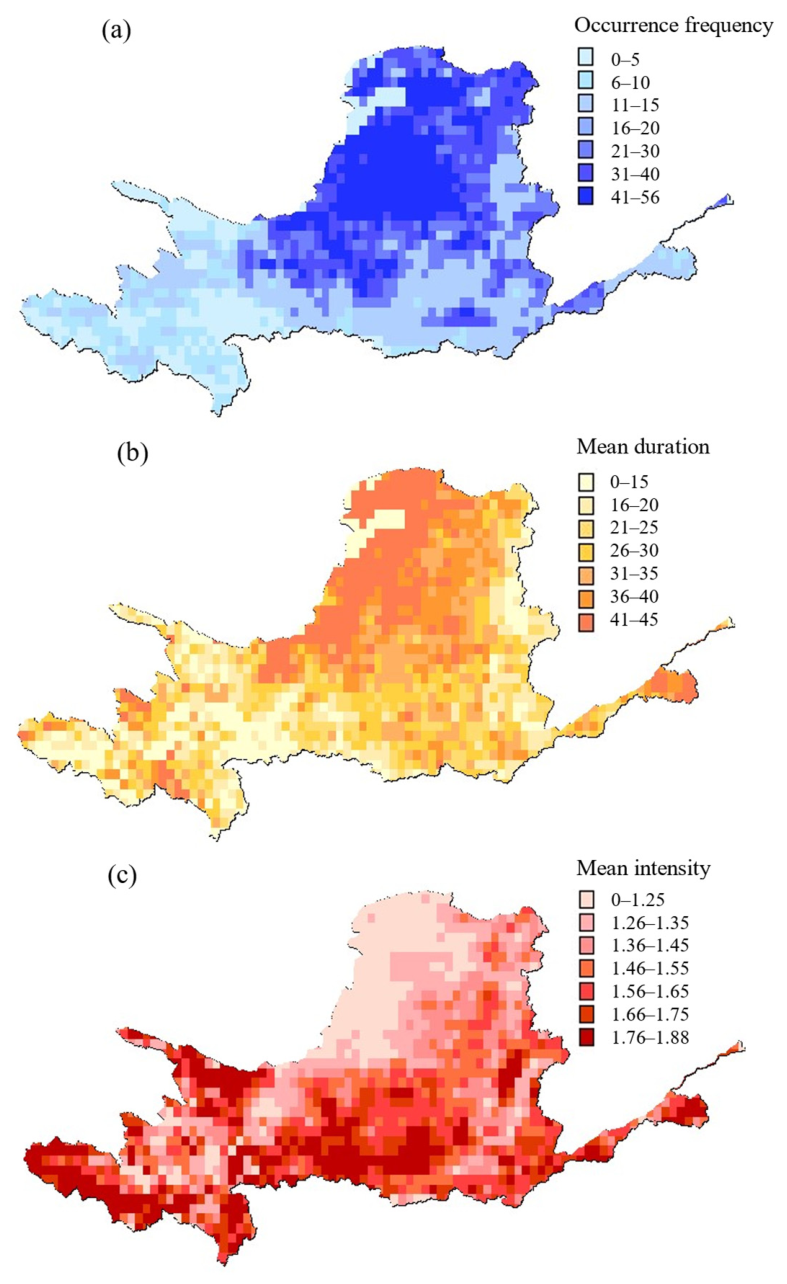
The occurrence frequency of grid-scale DFAA events generally exhibits a spatial pattern of being higher in the middle and lower reaches and lower in the upper reaches during 1982–2021 (Figure 6a). High-occurrence-frequency areas are concentrated across much of the middle reaches, where event frequencies generally range from 31 to 56. In particular, the extremely high-occurrence-frequency core, with frequencies of 41–56, is extensively clustered in the interior of the middle basin, including most of the Loess Plateau and the Hetao region, indicating that this geographical zone is highly prone to DFAA events. By contrast, low-occurrence-frequency areas are mainly distributed in the upper reaches and source region of the Yellow River. Over this broad area, frequencies are mostly below 15, while extremely low-occurrence-frequency grids, with frequencies of 0–5, are concentrated in the westernmost and southwestern marginal parts of the basin. In addition, medium-occurrence-frequency areas, with frequencies of 16–30, are primarily distributed around the periphery of the high-occurrence-frequency core as transitional zones, forming a spatial gradient from the low-occurrence-frequency upper reaches to the high-occurrence-frequency middle reaches. Overall, the middle reaches of the YRB appear to be the most sensitive and responsive region to DFAA events.
The regions with relatively high mean duration of grid-scale DFAA events during 1982–2021 show a distinct patchy distribution pattern (Figure 6b). These areas are mainly distributed across much of the Loess Plateau in the middle reaches and around the Hetao Plain in the northern upper reaches. In these regions, the mean duration of DFAA events is generally longer than 31 d, and some extreme high-value centers are concentrated in the middle reaches. In addition, scattered high-duration centers also occur in the southwestern part of the Yellow River source region, reflecting the complexity of climatic processes in this high-altitude area. Areas with relatively short mean duration, ranging from 0 d to 20 d, are more dispersed and are mainly found in the terminal lower reaches, in parts of the northern inland-drainage area, and in scattered marginal zones of the upper basin. In these regions, the transition from drought to flood tends to occur more rapidly, resulting in a relatively short overall event duration. Areas with intermediate duration, ranging from 21 d to 30 d, are the most widely distributed across the basin and serve as broad spatial transition zones between the high- and low-duration areas.
The mean intensity of grid-scale DFAA events during 1982–2021 exhibits a spatial pattern of being higher in the west than in the east and higher in the south than in the north (Figure 6c). The intensity values range from 0 to 1.88. High-intensity areas, with values of 1.66–1.88, are mainly concentrated in the source region of the upper Yellow River, around the Qilian Mountains, and in the Fenwei Plain and the northern foothills of the Qinling Mountains in the southern middle reaches. In these areas, the mean intensity of drought-to-flood transitions generally exceeds 1.66, and the extreme high-value centers, with values of 1.76–1.88, display clear contiguous clustering. By contrast, low-intensity areas, with values of 0–1.35, are extensively distributed across the Ordos Plateau in the northern basin, the inland-drainage area, and parts of the northern middle reaches, where mean intensity values are mostly below 1.25. Intermediate-intensity areas, ranging from 1.36 to 1.65, provide broad spatial connectivity across the basin. These areas are mainly distributed around the peripheries of the high-value centers and extend through much of the middle reaches.

3.3. Variation Characteristics of Basin-Scale DFAA Events

3.3.1. Characteristics of DFAA Events in the YRB

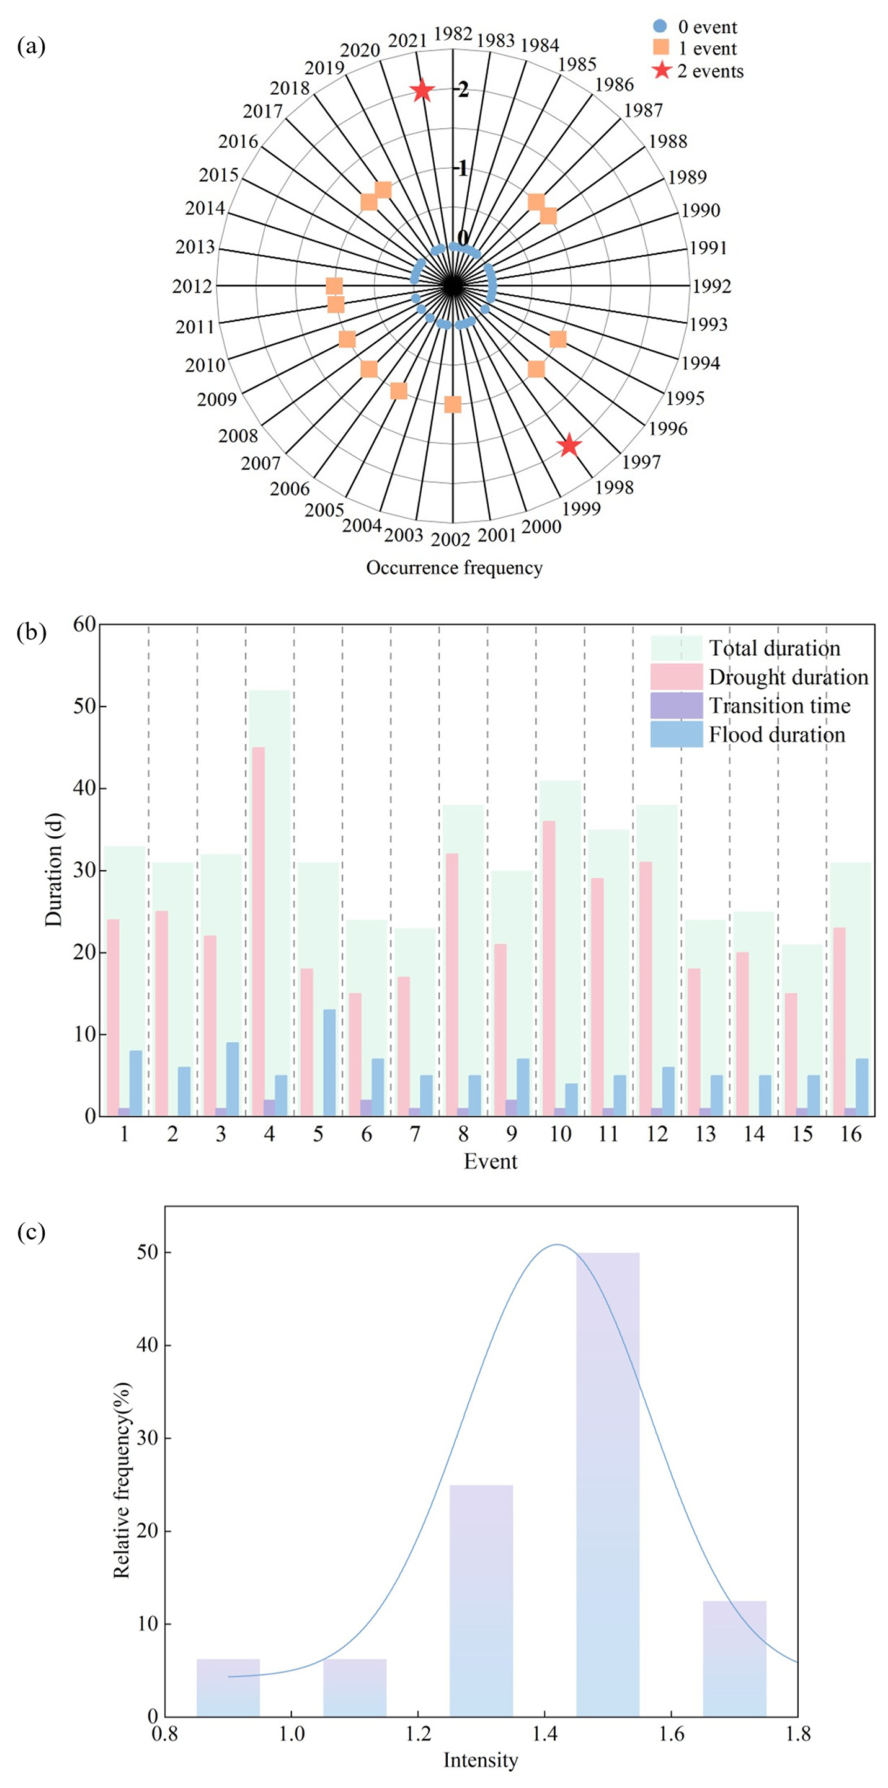
A total of 16 events were identified in the YRB during the study period (Table 3). In terms of timing, these events occurred mainly from April to October, with the highest concentration from April to July. From a decadal perspective, relatively few events were identified in the 1980s, whereas the number increased noticeably after the 1990s and remained relatively high throughout the 2000s and 2010s. Although the 2020s cover only a short period in this study, three events had already been identified. In terms of total duration, the 16 events ranged from 21 d to 52 d, with a mean total duration of 31.81 d. Event No. 4 was the longest, lasting 52 d, whereas Event No. 15 was the shortest, lasting 21 d. In terms of transition time, the shift from drought to flood was generally rapid, ranging from 0 d to 2 d. Most events completed the transition within 1 d. Events No. 2, No. 5, and No. 14 shifted directly from drought to flood with a transition time of 0 d, indicating strong abruptness. In terms of intensity, the identified events ranged from 0.96 to 1.79, with a mean intensity of 1.42. Event No. 10 had the greatest intensity of 1.79, whereas Event No. 1 had the lowest intensity of 0.96.
The 16 DFAA events in the YRB occurred in total during 1982–2021 (Figure 7a), corresponding to a mean annual occurrence frequency of 0.4 events per year. Over the 40-year study period, such events occurred in 14 years, accounting for 35.0% of all years, whereas no event occurred in the remaining 26 years. In terms of interannual distribution, DFAA events in the YRB were generally characterized by single occurrences within a given year. In most event years, only one event was recorded, indicating that repeated basin-scale occurrences within the same year were relatively uncommon. Only 1998 and 2021 recorded two events, the highest annual occurrence frequency during the study period. From the perspective of decadal change, the total numbers of events in 1980s, 1990s, 2000s, and 2010s were 2, 4, 5, and 5, respectively, accounting for 12.5%, 25.0%, 31.25%, and 31.25% of all identified events. Overall, the occurrence frequency of events in the YRB showed an increasing trend across decades.
The 16 DFAA events in the YRB had a mean total duration of 31.81 d (Figure 7b), including a mean drought duration of 24.44 d, accounting for 76.8% of the total duration, and a mean flood duration of 6.38 d, accounting for 20.1%. In terms of duration distribution, total event duration ranged from 21 d to 52 d, and 62.5% of the events were concentrated within 21–32 d. Only two events lasted more than 40 d. Among them, Event No. 4 has the longest duration of 52 d, whereas Event No. 15 has the shortest duration of 21 d. Drought duration ranged from 15 d to 45 d. In 12 events, the drought phase lasted 20 d or longer, accounting for 75.0% of all events. Event No. 4 had the longest drought phase of 45 d, whereas Events No. 6 and No. 15 had the shortest drought phases, both lasting 15 d. By contrast, flood duration was generally shorter and more concentrated, mostly ranging from 4 d to 9 d. Flood duration does not exceed 7 d in 15 events, accounting for 93.75% of the total, and only Event No. 5 reaches 13 d.
The 16 DFAA events in the YRB ranged overall from 0.8 to 1.8 during 1982–2021 (Figure 7c). More specifically, the intensity was mainly concentrated in the range of 1.2–1.6. Among these, the interval 1.4–1.6 accounted for the highest proportion, approximately 50%, and thus represented the dominant intensity class. The interval 1.2–1.4 ranked second, accounting for approximately 25%. By contrast, the lower-intensity intervals of 0.8–1.0 and 1.0–1.2, as well as the higher-intensity interval of 1.6–1.8, each accounted for relatively small proportions, at approximately 6.25%, 6.25%, and 12.5%, respectively. The peak of the intensity distribution occurred around 1.4–1.5, yielding a relatively clear unimodal pattern overall. This indicates that DFAA events in the YRB during the study period were dominated by moderate-intensity events, whereas very weak and very strong events occurred less frequently, resulting in a relatively concentrated distribution in intensity.

3.3.2. Characteristics of DFAA Events in Level-II Water Resource Subregions

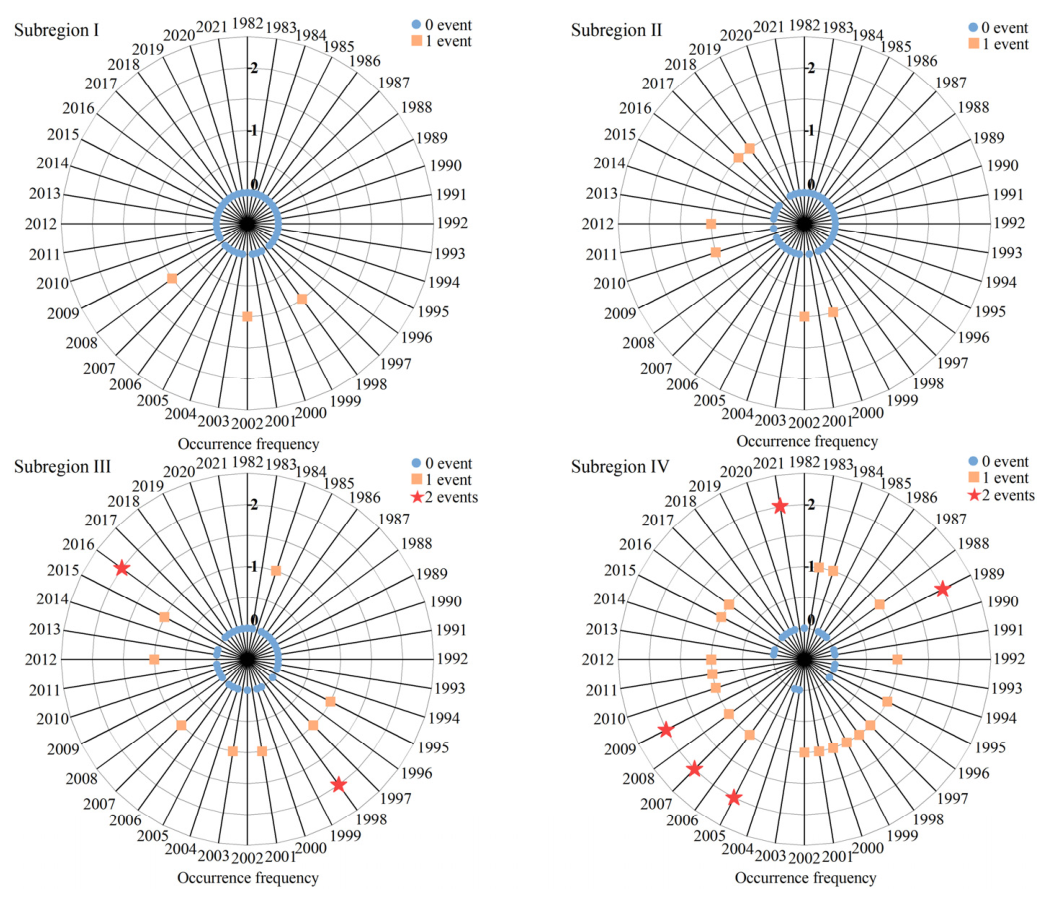
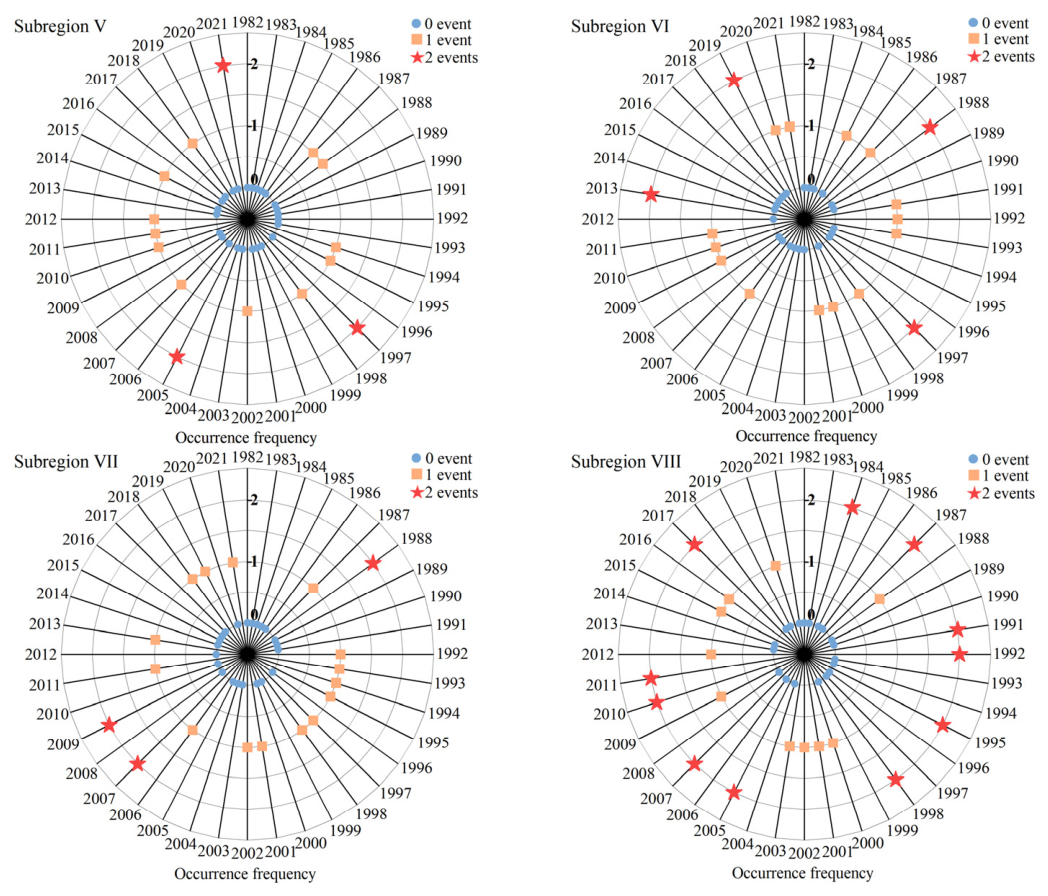
The occurrence frequency of DFAA events in the level-II water resource subregions shows significant spatial heterogeneity (Figure 8). Overall, it exhibits an increasing pattern from the upstream source region to the middle and lower reaches, as well as the inland region. Subregions I and II, which are high-altitude upstream areas, have the lowest occurrence frequencies in the YRB. During 1982–2021, no event occurred in most years in these two subregions, and only a few isolated years recorded a single event. Upon entering the middle and lower reaches, event occurrence frequency increased markedly. In Subregions III, IV, V, and VI, years with one event became much more common, and some years even experienced two events. The inland-drainage area (Subregion VIII) represents the core area with the most pronounced response to DFAA. It not only had the highest total number of events among all subregions but also showed a much higher occurrence frequency of two events occurring within the same year than any other subregion. By comparison, the reach below Huayuankou (Subregion VII) was also a high-occurrence-frequency area, but the occurrence frequency of two events within a single year was slightly lower than that in the middle-basin core areas and the inland-drainage area.
From the perspective of temporal evolution, DFAA events in all subregions displayed clear interannual fluctuations during 1982–2021. Event frequencies increased noticeably after 2000 compared with the earlier period. During the 1980s and the early 1990s, most subregions were characterized mainly by one event per year, and event years were relatively scattered. After the beginning of the twenty-first century, especially during the last two decades, years with two events became significantly more frequent in the middle reaches and the inland-drainage area. For example, since the 2010s, the proportions of years with two events have increased markedly in Subregions IV, V, VI, and VIII.
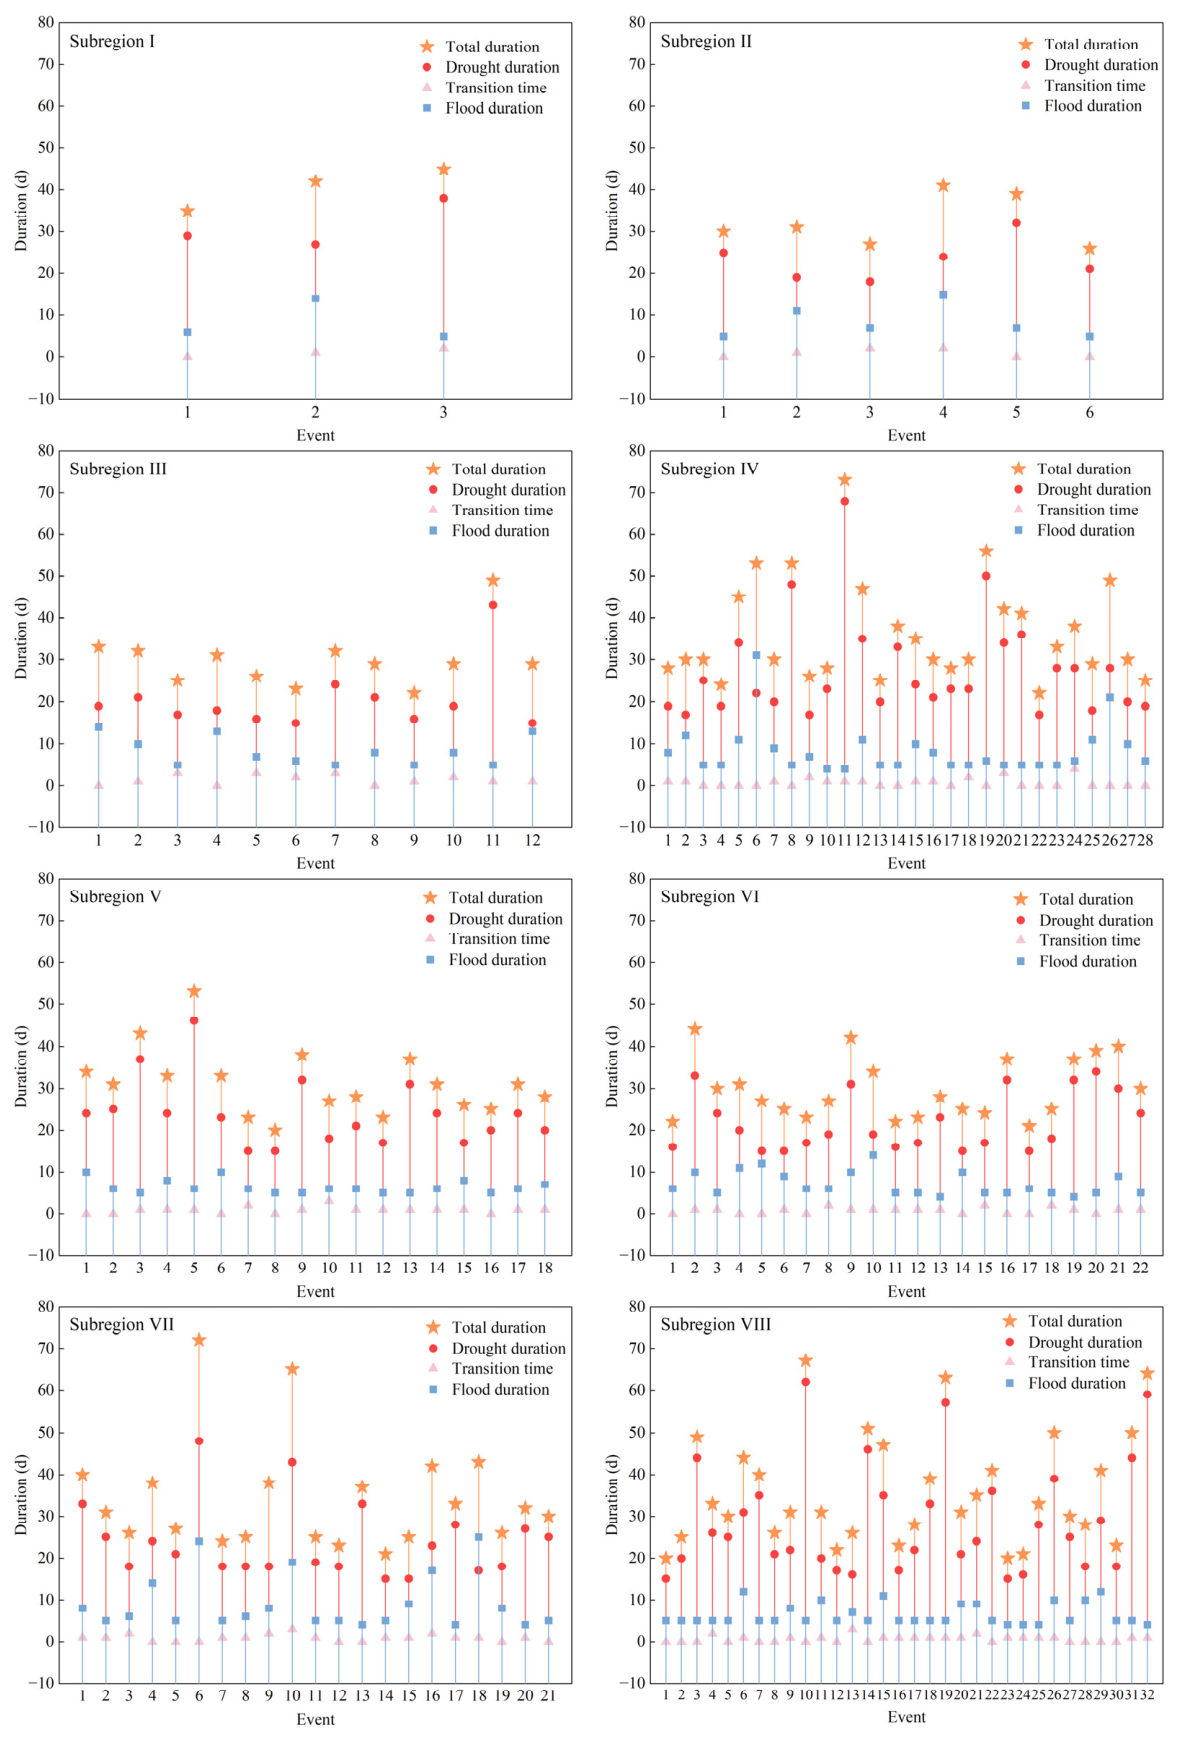
The variation in event duration across the level-II water resource subregions is shown in Figure 9. The upstream subregions, namely Subregions I and II, had the fewest events, with only three and six events, respectively; however, the mean total duration of individual events in these areas was relatively long, generally remaining around 30–40 d. In contrast, Subregion IV in the middle basin and the inland-drainage area (Subregion VIII) were not only the most event-prone, with 28 and 32 events, respectively, but also exhibited the widest variation in duration. In these subregions, the maximum total duration exceeded 70 d, whereas the minimum was around 20 d. In terms of duration structure, all subregions across the basin showed a high degree of consistency: drought duration dominated total event duration, usually accounting for 70–90% of the total, and largely determined fluctuations in total duration. By contrast, flood duration was relatively uniform in spatial distribution and mostly remained stable between 5 d and 15 d.
From the perspective of temporal evolution, event duration in each subregion displayed clear interannual fluctuations as well as marked extremes. During 1982–2021, total duration did not show a single linear increasing or decreasing tendency but instead exhibited frequent alternations between peaks and troughs. During the 1980s and early 1990s, fluctuations in duration were relatively moderate in all subregions, and total durations were mostly close to or below the long-term average. However, from the late 1990s onward, and especially after entering the twenty-first century, the extremity of duration increased substantially. In several subregions, such as IV, VII, and VIII, DFAA events with total durations exceeding 60 d or even 70 d occurred repeatedly, reflecting a marked strengthening in the persistence of the antecedent drought process in the time dimension. At the same time, fluctuations in drought duration were highly synchronized with those in total duration. Although both total duration and drought duration varied over time, transition time remained consistently at a very low level, close to 0 d, throughout the 40-year period and showed almost no change.
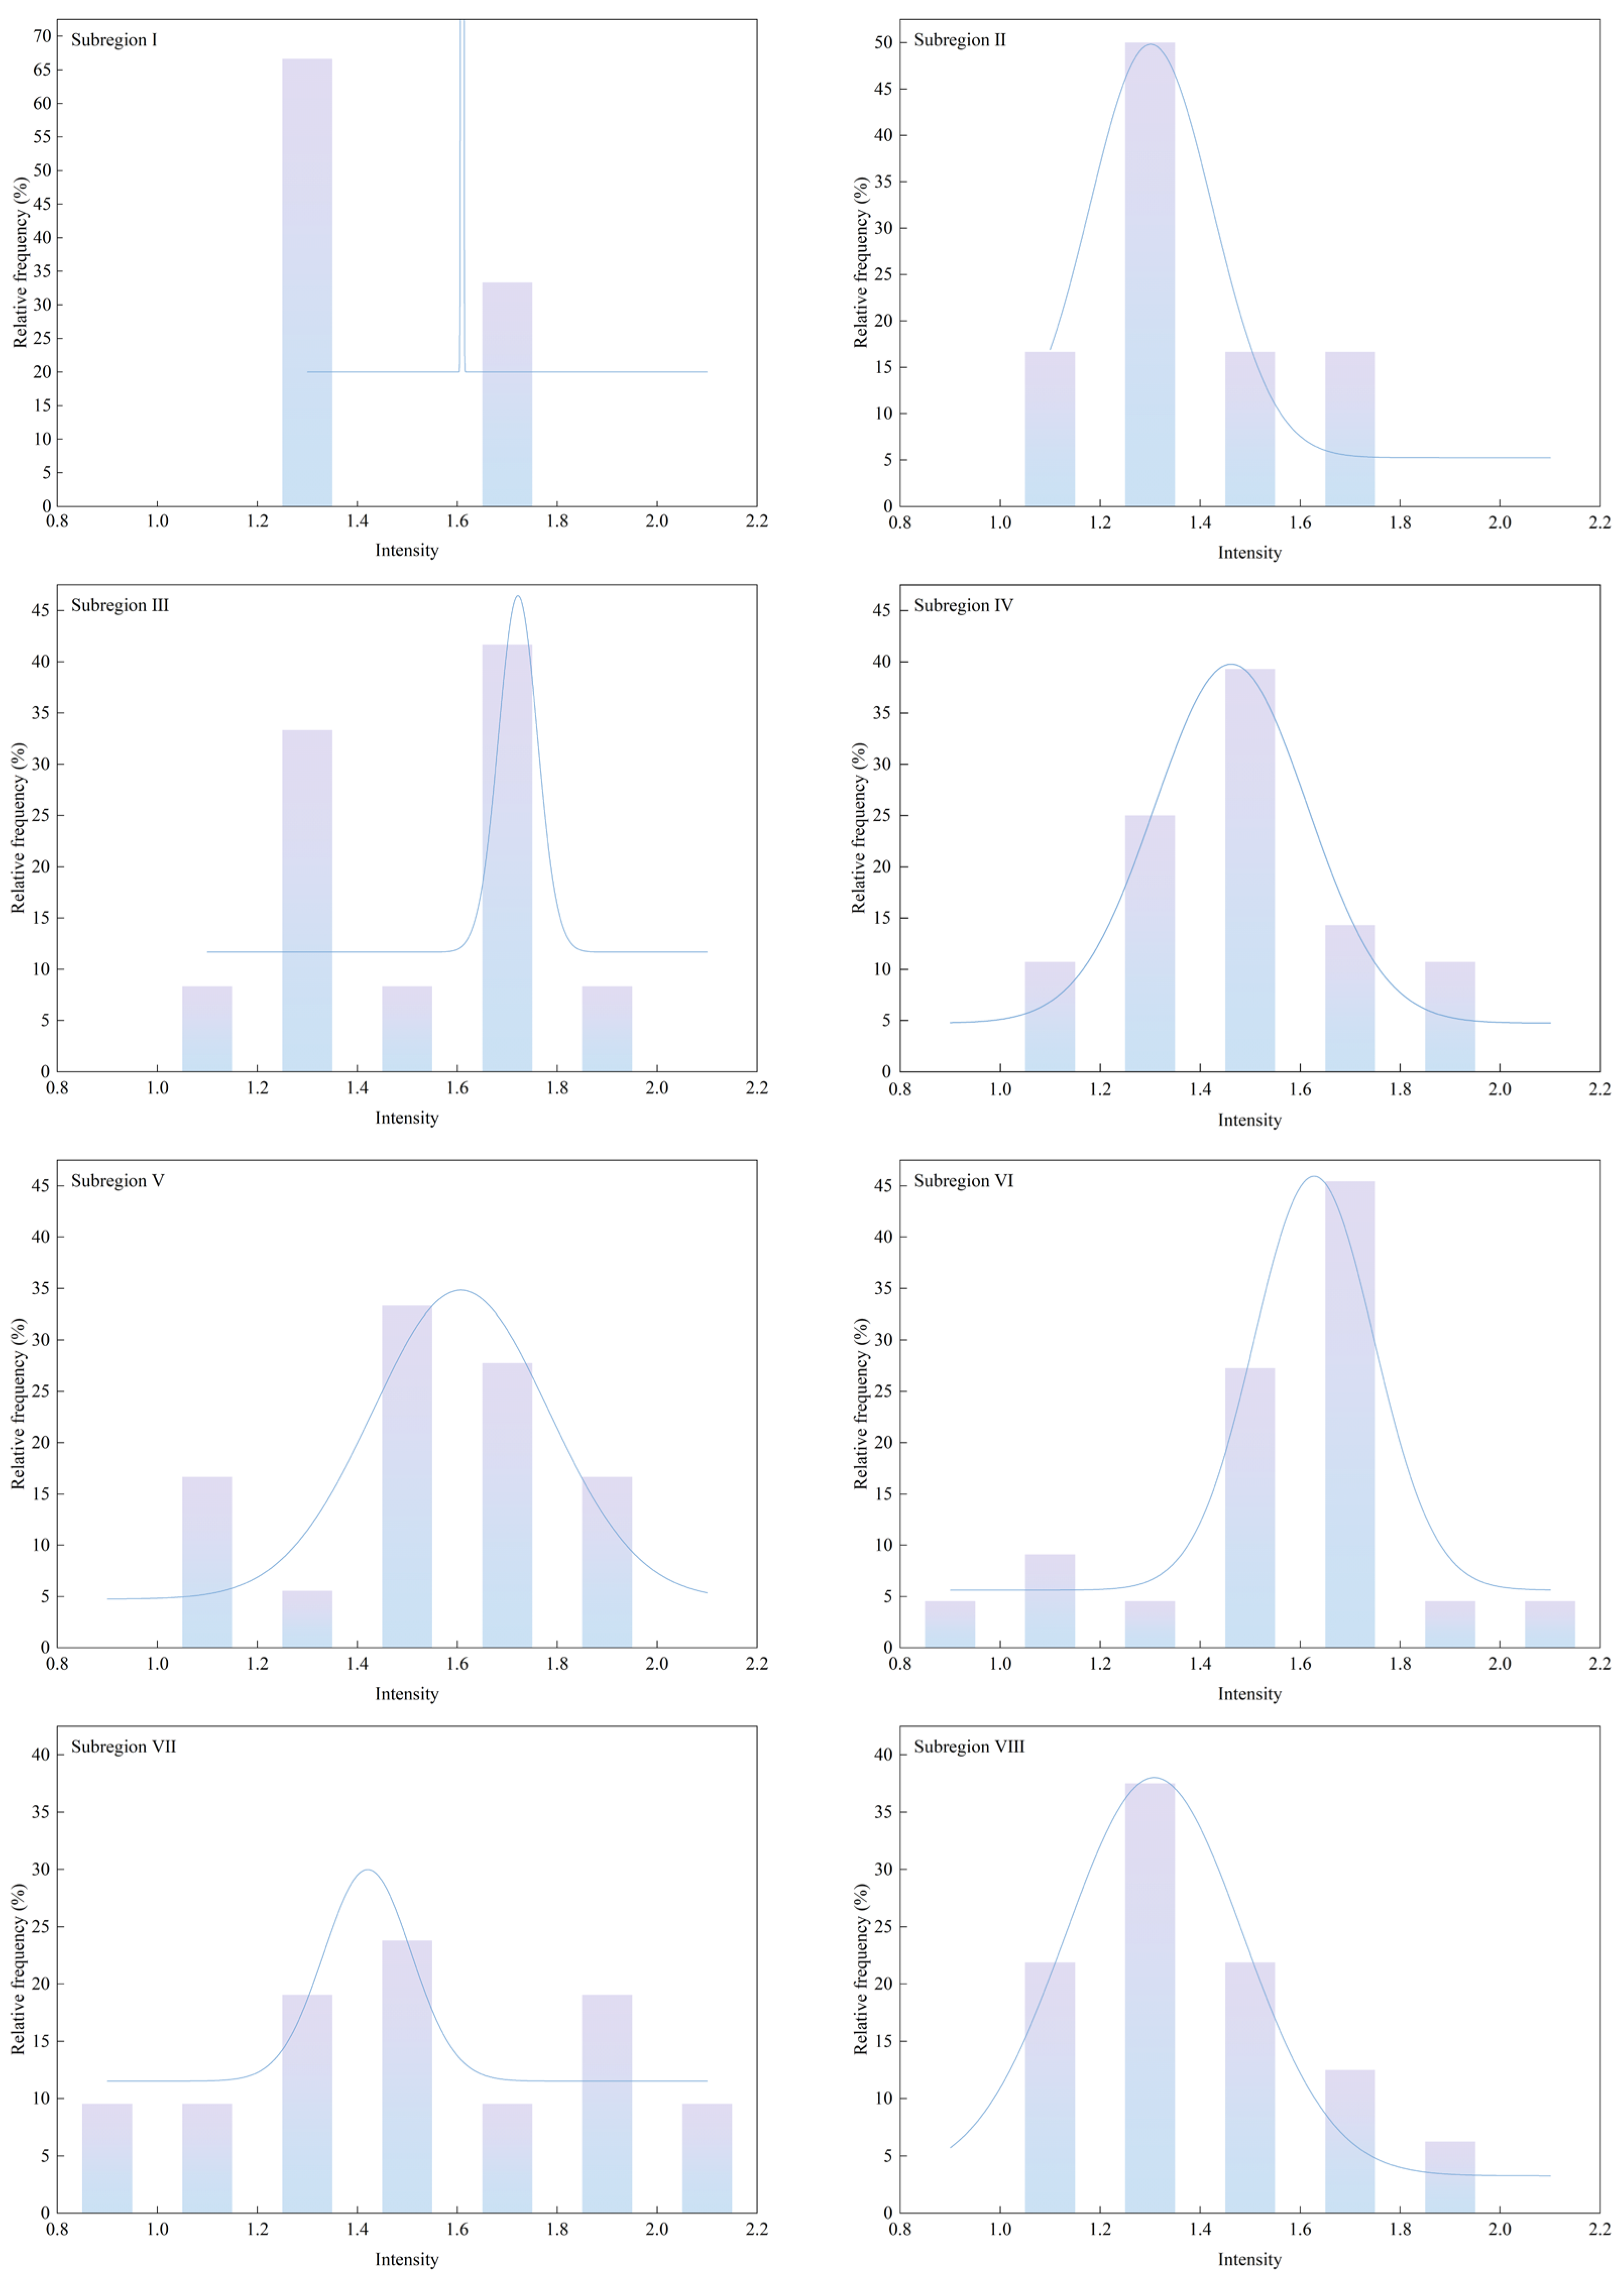
The intensity of DFAA events in the level-II water resource subregions shows clear spatial differences (Figure 10). In the upstream Subregions I and II, the intensity is concentrated mainly within the interval 1.2–1.4. In Subregion I, the distribution is relatively concentrated, with approximately 66.7% of events falling within 1.2–1.4 and the remaining 33.3% within 1.6–1.8. It should be noted that only three DFAA events were identified in Subregion I, and the small sample size led to a relatively concentrated peak in the fitted distribution. In Subregion II, although a small number of events also occur in the intervals 1.4–1.6 and 1.6–1.8, the overall distribution is still centered on 1.2–1.4, accounting for approximately 50.0%, indicating that upstream events are generally dominated by relatively low-intensity processes.
By contrast, the middle-basin Subregions III, IV, V, and VI are characterized by generally higher intensities and represent the principal high-intensity zones of DFAA in the YRB. In Subregion III, the intensity is concentrated mainly within 1.6–1.8, accounting for approximately 41.7%. The intensity peaks in Subregions IV and V are both near 1.5. This indicates that events in the central and eastern middle reaches are generally of moderate to relatively high intensity. Subregion VI is even more concentrated, with most events falling within 1.5–1.7; the proportion of high-intensity events is the largest, at approximately 45.5%, making this subregion the most prominent high-intensity area in the YRB. From the upstream to the middle reaches, the intensity increases clearly.
In the downstream Subregion VII, the intensity distribution is relatively dispersed. Events are concentrated mainly within 1.3–1.5, accounting for approximately 27.3%, but a certain proportion also falls within 1.8–2.0, accounting for approximately 18.2%. This suggests that, compared with the middle reaches, DFAA events in the lower reaches are overall slightly weaker, although some strong events still occur, and interannual as well as inter-event differences are relatively large. As for Subregion VIII, in the inland-drainage area, the intensity is concentrated mainly within 1.2–1.4, accounting for approximately 38.9%, followed by 1.4–1.6, accounting for approximately 22.2%. The overall distribution is therefore relatively low and concentrated, indicating that the intensity in the inland-drainage area is generally weaker.
Overall, the intensity pattern of DFAA across the level-II water resource subregions can be summarized as follows: the upstream region is dominated by the interval 1.2–1.4; the middle reaches are generally stronger and are concentrated mainly within 1.4–1.8; the lower reaches are centered on 1.3–1.5 but with relatively large fluctuations; and the inland-drainage area is concentrated around 1.2–1.4. This pattern reflects pronounced spatial heterogeneity in the strength of DFAA processes among the level-II water resource subregions.

4. Discussion

The identification method based on daily SPEI and run theory shows good applicability in the YRB. On the one hand, compared with monthly scale indices, it is better able to capture rapid drought-to-flood transitions. On the other hand, through the aggregation of contiguous patches, it explicitly incorporates spatiotemporal continuity at the basin scale for DFAA events [28,32]. In this study, different threshold combinations were first preliminarily screened according to the occurrence frequency of identified DFAA events. Subsequently, typical DFAA events were validated at both the grid and basin scales using historical drought and flood disaster records. Finally, a relatively appropriate threshold combination was determined. Furthermore, research on threshold determination requires further strengthening to comprehensively incorporate multiple dimensions such as frequency, duration, and intensity. Meanwhile, the sensitivity of spatiotemporal distribution patterns to threshold determination also needs further study [45].
The identification results of this study are generally consistent with previous studies on the YRB in terms of the overall pattern. A total of 16 events were identified in the YRB during 1982–2021, with a mean annual occurrence frequency of 0.4 events per year. The occurrence frequency shows an increasing trend across decades, and the spatial pattern is characterized by fewer events in the upper reaches and relatively more events in the middle and lower reaches as well as the inland region. This finding is generally consistent with the results of Jiang et al. [22], who pointed out that DFAA risk in the YRB shows marked spatial differences and that the middle and lower reaches are high-risk areas. However, some differences are also observed. Shi et al. [9] reported that flood-to-drought events dominate in that basin and that their spatial pattern is relatively uniform, whereas the drought-to-flood events identified in the entire YRB in this study exhibit stronger spatial heterogeneity. In particular, high-occurrence-frequency areas are mainly concentrated in the middle and lower reaches and the inland region, whereas high-intensity areas are more distributed in parts of the upper reaches and the southern part of the middle reaches. Furthermore, at the level-II water resource subregion scale, Subregions IV, VI, VII, and VIII show relatively high event frequencies and large fluctuations in duration. This is broadly consistent with previous studies showing marked spatial heterogeneity in the YRB and relatively greater drought–flood activity in the middle and lower reaches [22,46]. However, at a finer scale, different subregions within the basin differ in both event occurrence frequency and process intensity, which further refines the understanding of the spatial heterogeneity of DFAA in the YRB [47]. Some studies have indicated that the frequency and intensity of DFAA events in the YRB are likely to exhibit an overall increasing trend, with regional disparities potentially intensifying further under future climate change scenarios [26]. The impacts of climate change on the spatiotemporal evolution characteristics of DFAA events in the YRB need to be further strengthened.
The spatiotemporal evolution characteristics of DFAA identified in this study are likely the result of the combined effects of climate warming, regional hydroclimatic gradients, and land-surface and human influences. Climate warming can, on the one hand, enhance atmospheric evaporative demand and intensify antecedent drought and, on the other hand, increase the moisture-holding capacity of the atmosphere, thereby raising the likelihood of heavy precipitation and increasing the probability of rapid transitions from drought to flood [3,48]. Meanwhile, within the YRB, differences in aridity gradients, complex topography, monsoon influence, and the intensity of human activities further regulate moisture transport and runoff generation processes, leading to a mismatch between the high-occurrence-frequency zones and the high-intensity zones [32,49]. Under continued warming, the risk of DFAA may intensify further [50,51]. Future studies should therefore integrate multi-source hydroclimatic information, improve threshold-setting methods, and strengthen research on climatic dynamic mechanisms and future scenario projections, so as to enhance the capacity to cope with compound disaster risks.

5. Conclusions

Based on daily SPEI data and run theory, this study developed an identification method for DFAA events and applied it to the quantitative identification of such events in the YRB during 1982–2021. Temporal variations and spatial distribution characteristics were then analyzed at both the grid and basin scales. The results of the study are as follows.
(1)
Through multi-threshold combination screening and validation against historical drought and flood records, the proposed identification method showed good applicability in the YRB. The optimal parameter combination was determined to be a drought duration of 15 d, a flood duration of 3 d, a transition time of 5 d, and an area threshold of 35%. Validation using representative historical cases at both the grid and basin scales further demonstrated that the method can effectively capture the spatiotemporal continuity of DFAA events. The identification results are in good agreement with historical records, indicating that the proposed method is reliable.
(2)
Grid-scale DFAA events during 1982–2021 showed clear temporal variation and spatial heterogeneity. The mean occurrence frequency had an overall slow increasing trend, and the mean frequency, mean duration, and mean intensity were 0.67, 30.57 d, and 1.45 events, respectively. Grid-scale DFAA events generally had a pattern of being more occurrence-frequent in the middle and lower reaches and less occurrence-frequent in the upper reaches. Regions with relatively high mean duration had a distinct patchy distribution, mainly located in the middle reaches of the YRB and the northern part of the upper reaches. The mean intensity had a pattern of being higher in the west than in the east and higher in the south than in the north.
(3)
For basin-scale DFAA events, a total of 16 DFAA events were identified in the YRB during 1982–2021, corresponding to a mean annual occurrence frequency of 0.4 events per year and an overall increasing trend across decades. The mean total duration of these events was 31.81 d, and the intensity ranged from 0.96 to 1.79, mainly concentrated within 1.2–1.6. DFAA events were generally less frequent in the upper reaches and more frequent in the middle and lower reaches and the inland-drainage area. For the level-II water resource subregions, Subregions IV, VI VII and VIII had higher occurrence frequencies and larger fluctuations in duration.

Supplementary Materials

The following supporting information can be downloaded at: https://www.mdpi.com/article/10.3390/w18091053/s1, Table S1: Numbers of identified DFAA events under different threshold combinations.

Author Contributions

Methodology, H.X. and X.Z.; validation, W.C. and C.L.; formal analysis, H.S.; investigation, W.C. and C.L.; resources, X.Z.; data curation, W.C.; writing—original draft preparation, H.X. and H.S.; writing—review and editing, H.X. and H.S. and W.C. All authors have read and agreed to the published version of the manuscript.

Funding

This research was funded by Key Scientific and Technological Project of Henan Province, China, grant number 252102320238; Key Research and Development Project of Henan Province, grant number 261111321600; and National Key Research and Development Program project, grant number 2023YFC3006603.

Data Availability Statement

The global daily SPEI dataset (SPEI-GD) was downloaded from https://doi.org/10.5281/zenodo.8060268. The analyzed data will be made available on reasonable request.

Conflicts of Interest

The authors declare no conflicts of interest.

References

  1. IPCC. Climate Change 2021: The Physical Science Basis. Contribution of Working Group I to the Sixth Assessment Report of the Intergovernmental Panel on Climate Change; Cambridge University Press: Cambridge, UK, 2021. [Google Scholar]
  2. Xiong, J.; Yang, Y. Climate Change and Hydrological Extremes. Curr. Clim. Change Rep. 2025, 11, 1. [Google Scholar] [CrossRef] [Scilit]
  3. Gebrechorkos, S.; Sheffield, J.; Vicente-Serrano, S.; Funk, C.; Miralles, D.; Peng, J.; Dyer, E.; Talib, J.; Beck, H.; Singer, M.; et al. Warming accelerates global drought severity. Nature 2025, 642, 628–635. [Google Scholar] [CrossRef] [Scilit]
  4. Djebou, D.; Singh, V.; Frauenfeld, O. Analysis of watershed topography effects on summer precipitation variability in the southwestern United States. J. Hydrol. 2014, 511, 838–849. [Google Scholar] [CrossRef] [Scilit]
  5. Li, C.; Li, T.; Lin, A.; Gu, D.; Zheng, B. Relationship between summer rainfall anomalies and sub-seasonal oscillations in South China. Clim. Dyn. 2015, 44, 423–439. [Google Scholar] [CrossRef] [Scilit]
  6. Wang, H.; Wang, S.; Shu, X.; He, Y.; Huang, J. Increasing Occurrence of Sudden Turns from Drought to Flood Over China. J. Geophys. Res. Atmos. 2024, 129, e2023JD039974. [Google Scholar] [CrossRef] [Scilit]
  7. Qiao, Y.; Xu, W.; Meng, C.; Liao, X.; Qin, L. Increasingly dry/wet abrupt alternation events in a warmer world: Observed evidence from China during 1980–2019. Int. J. Climatol. 2022, 42, 6429–6440. [Google Scholar] [CrossRef] [Scilit]
  8. Wang, L.; Guo, S.; Wang, J.; Chen, Y.; Qiu, H.; Zhang, J.; Wei, X. A novel multi-scale standardized index analyzing monthly to sub-seasonal drought-flood abrupt alternation events in the Yangtze River basin. J. Hydrol. 2024, 633, 130999. [Google Scholar] [CrossRef] [Scilit]
  9. Shi, W.; Huang, S.; Liu, D.; Huang, Q.; Han, Z.; Leng, G.; Wang, H.; Liang, H.; Li, P.; Wei, X. Drought-flood abrupt alternation dynamics and their potential driving forces in a changing environment. J. Hydrol. 2021, 597, 126179. [Google Scholar] [CrossRef] [Scilit]
  10. Ministry of Water Resources of the People’s Republic of China. Bulletin of Flood and Drought Disasters in China 2012; China Water & Power Press: Beijing, China, 2013.
  11. Xinhua News Agency. Five Frontier Hotspots in Water Science and Technology Research for 2025 Released. 25 November 2025. Available online: https://www.news.cn/local/20251125/803c893646c44685870c28cdd91b433a/c.html (accessed on 4 February 2026).
  12. Zhang, G.; Wang, H.; Gan, T.; Zhang, S.; Zhao, J.; Su, X.; Fu, X.; Shi, L.; Xu, P.; Lu, M.; et al. A comprehensive review of recent progress on the drought-flood abrupt alternation. J. Hydrol. 2025, 661, 133806. [Google Scholar] [CrossRef] [Scilit]
  13. Bai, X.; Wang, Z.; Wu, J.; Zhang, Z.; Zhang, P. A novel multivariate multiscale index for drought-flood abrupt alternations: Considering precipitation, evapotranspiration, and soil moisture. J. Hydrol. 2024, 643, 132039. [Google Scholar] [CrossRef] [Scilit]
  14. Bi, W.; Weng, B.; Yuan, Z.; Yang, Y.; Xu, T.; Yan, D.; Ma, J. Evolution of Drought-Flood Abrupt Alternation and Its Impacts on Surface Water Quality from 2020 to 2050 in the Luanhe River Basin. Int. J. Environ. Res. Public Health 2019, 16, 691. [Google Scholar] [CrossRef] [Scilit]
  15. Li, X.; Yuan, C.; Sun, T.; Fan, H. Identifying the spatiotemporal patterns of drought-flood alternation based on IMERG product in the humid subtropical Poyang Lake basin, China. J. Hydrol. Reg. Stud. 2024, 54, 101912. [Google Scholar] [CrossRef] [Scilit]
  16. Wang, J.; Rong, G.; Li, K.; Zhang, J. Analysis of Characteristics of Dry-Wet Events Abrupt Alternation in Northern Shaanxi, China. Water 2021, 13, 2384. [Google Scholar] [CrossRef] [Scilit]
  17. Bi, W.; Li, M.; Weng, B.; Yan, D.; Dong, Z.; Feng, J.; Wang, H. Drought-flood abrupt alteration events over China. Sci. Total Environ. 2023, 875, 162529. [Google Scholar] [CrossRef] [Scilit]
  18. Liang, Y.; Han, P.; Kim, T.; Zhang, X.; Li, Z.; Liu, H.; Chen, S. Development of drought-flood abrupt alternations identification method based on daily soil moisture index: Spatiotemporal characterization and risk assessment in the middle and lower reaches of Yangtze River Basin. J. Hydrol. Reg. Stud. 2025, 61, 102690. [Google Scholar] [CrossRef] [Scilit]
  19. Song, X.; Lei, X.; Ma, R.; Hou, J.; Liu, W. Spatiotemporal variation and multivariate controls of short-cycle drought-flood abrupt alteration: A case in the Qinling-Daba Mountains of China. Int. J. Climatol. 2023, 43, 4756–4769. [Google Scholar] [CrossRef] [Scilit]
  20. Wang, R.; Li, X.; Zhang, Q.; Cheng, J.; Li, J.; Zhang, D.; Liu, Y. Projection of drought-flood abrupt alternation in a humid subtropical region under changing climate. J. Hydrol. 2023, 624, 129875. [Google Scholar] [CrossRef] [Scilit]
  21. Shan, L.; Zhang, L.; Zhang, Y.; She, D.; Xia, J. Characteristics of dry-wet abrupt alternation events in the middle and lower reaches of the Yangtze River Basin and their relationship with ENSO. Acta Geogr. Sin. 2018, 73, 25–40. [Google Scholar] [CrossRef] [Scilit]
  22. Jiang, S.; Cui, H.; Ren, L.; Yan, D.; Yang, X.; Yuan, S.; Liu, Y.; Wang, M.; Xu, C. Will China’s Yellow River basin suffer more serious combined dry and wet abrupt alternation in the future? J. Hydrol. 2023, 624, 129871. [Google Scholar] [CrossRef] [Scilit]
  23. Sun, J.; Su, B.; Wang, D.; Huang, J.; Wang, B.; Dai, R.; Jiang, T. Temporospatial characteristics of drought-flood abrupt alteration events in China. Water Resour. Hydropower Eng. 2024, 55, 13–23. [Google Scholar]
  24. Meng, C.; Dong, Z.; Wang, Y.; Zhang, Y.; Zhong, D. Evolutionary characteristics of droughts and floods in the Yangtze River basin and their socio-economic exposure. J. Hydroelectr. Eng. 2024, 43, 34–49. [Google Scholar]
  25. Su, J.; Ding, Y.; Liu, Y.; Wang, J.; Zhang, Y. China is suffering from fewer but more severe drought to flood abrupt alternation events. Weather. Clim. Extrem. 2024, 46, 100737. [Google Scholar] [CrossRef] [Scilit]
  26. Ren, J.; Wang, W.; Wei, J.; Li, H.; Li, X.; Liu, G.; Chen, Y.; Ye, S. Evolution and prediction of drought-flood abrupt alternation events in Huang-Huai-Hai River Basin, China. Sci. Total Environ. 2023, 869, 161707. [Google Scholar] [CrossRef] [Scilit]
  27. Li, J.; Wu, C.; Yeh, P.; Xia, C.; Liu, W.; Ju, J.; Zhou, J.; Hu, B.; Yuan, S.; Lv, W.; et al. Characterizing three-dimensional spatiotemporal dynamics of flash drought across three contrasting climate regimes in China. J. Hydrol. 2025, 661, 133678. [Google Scholar] [CrossRef] [Scilit]
  28. Li, W.; Wen, X.; Tan, Q.; Tu, Y.; Yang, T.; Wang, Y.; Yu, X. Exploring spatio-temporal distribution and evolution of dry-wet alternation using a three-dimensional identification method. J. Hydrol. 2022, 612, 128119. [Google Scholar] [CrossRef] [Scilit]
  29. Yu, Y.; Fu, J.; Liu, B.; Huang, Z.; Tan, X. Assessing spatiotemporal variation in dry-wet abrupt alternation using an improved process-based approach. J. Hydrol. Reg. Stud. 2024, 54, 101859. [Google Scholar] [CrossRef] [Scilit]
  30. Bai, X.; Zhao, C.; Tang, Y.; Zhang, Z.; Yang, B.; Wang, Z. Identification, physical mechanisms and impacts of drought-flood abrupt alternation: A review. Front. Earth Sci. 2023, 11, 1203603. [Google Scholar] [CrossRef] [Scilit]
  31. Zhang, B.; Chen, Y.; Chen, X.; Gao, L.; Liu, M. Spatial-Temporal Variations of Drought-Flood Abrupt Alternation Events in Southeast China. Water 2024, 16, 498. [Google Scholar] [CrossRef] [Scilit]
  32. Cui, H.; Jiang, S.; Ren, L.; Qin, T.; Zhu, Q.; Fang, X.; Xu, C. Identification of drought-flood abrupt alternation by a new non-stationary framework considering natural-social system impacts. J. Hydrol. 2025, 654, 132899. [Google Scholar] [CrossRef] [Scilit]
  33. Tang, Q.; Xu, X.; Zhou, Y.; Xie, Y.; Yang, Q.; He, L.; Peng, S.; Hu, Y.; Jin, X.; Fan, Y.; et al. Evolution of drought and flood disasters in the Yellow River Basin and response strategies under the background of global change. Water Resour. Dev. Res. 2025, 25, 13–20. [Google Scholar]
  34. Wang, M.; Bi, W.; Weng, B.; Yu, Z.; Xu, T. Review on impact from drought-flood abrupt alternation on crop growth and yield. Water Resour. Hydropower Eng. 2019, 50, 189–196. [Google Scholar]
  35. Li, Q.; Cao, Y.; Miao, S.; Huang, X. Spatiotemporal Characteristics of Drought and Wet Events and Their Impacts on Agriculture in the Yellow River Basin. Land 2022, 11, 556. [Google Scholar] [CrossRef] [Scilit]
  36. Liu, X.; Yu, S.; Yang, Z.; Dong, J.; Peng, J. The first global multi-timescale daily SPEI dataset from 1982 to 2021. Sci. Data 2024, 11, 223. [Google Scholar] [CrossRef] [Scilit]
  37. Singer, M.; Asfaw, D.; Rosolem, R.; Cuthbert, M.; Miralles, D.; Macleod, D.; Quichimbo, E.; Michaelides, K. Hourly potential evapotranspiration at 0.1° resolution for the global land surface from 1981-present. Sci. Data 2021, 8, 224. [Google Scholar] [CrossRef] [Scilit]
  38. Vicente-Serrano, S.; Beguería, S.; López-Moreno, J. A Multiscalar Drought Index Sensitive to Global Warming: The Standardized Precipitation Evapotranspiration Index. J. Clim. 2010, 23, 1696–1718. [Google Scholar] [CrossRef] [Scilit]
  39. GB/T 20481-2017; Grades of Meteorological Drought. Standards Press of China: Beijing, China, 2017.
  40. Yevjevich, V.M. An Objective Approach to Definitions and Investigations of Continental Hydrologic Droughts; Colorado State University: Fort Collins, CO, USA, 1967. [Google Scholar]
  41. People’s Government of Yuncheng City. Analysis of the Rural Economic Situation in Yuncheng City in the First Three Quarters of 2018. 7 November 2018. Available online: https://www.yuncheng.gov.cn/doc/2019/10/30/18073.shtml (accessed on 28 January 2026).
  42. Ministry of Emergency Management of the People’s Republic of China. Southern North China and Eastern Northwest China Affected by Flood Disasters. 19 September 2018. Available online: https://www.mem.gov.cn/xw/yjglbgzdt/ (accessed on 28 January 2026).
  43. Wu, Z.; Mao, Y.; Li, X.; Lu, G.; Lin, Q.; Xu, H. Exploring spatiotemporal relationships among meteorological, agricultural, and hydrological droughts in Southwest China. Stoch. Environ. Res. Risk Assess. 2016, 30, 1033–1044. [Google Scholar] [CrossRef] [Scilit]
  44. Liu, Q.; Yang, S.; Li, S.; Zhang, H.; Zhang, J.; Fan, H. The optimal applications of scPDSI and SPEI in characterizing meteorological drought, agricultural drought and terrestrial water availability on a global scale. Sci. Total Environ. 2024, 952, 175933. [Google Scholar] [CrossRef] [Scilit] [PubMed]
  45. Yan, J.; Zheng, T.; Zhao, J.; Luo, J. Bridging rarity of drought-flood abrupt alternation events with reverse distributions or reverse copulas. Water Res. 2025, 287, 124433. [Google Scholar] [CrossRef] [Scilit]
  46. Feng, J.; Qin, T.; Lv, X.; Liu, S.; Wen, J.; Chen, J. Frequent drought and flood events in the Yellow River Basin, increasing future drought trends in the middle and upper reaches. Int. J. Appl. Earth Obs. Geoinf. 2025, 139, 104511. [Google Scholar] [CrossRef] [Scilit]
  47. Meng, X.; Lin, C.; Ding, J.; Wang, G.; Zhang, J.; Wang, H.; Chu, C. Spatiotemporal evolution of droughts and floods in the Yellow River Basin: A novel approach combining CMADS-L evaluation, hydroclimatic zonation and CNN-LSTM prediction. J. Hydrol. Reg. Stud. 2025, 58, 102250. [Google Scholar] [CrossRef] [Scilit]
  48. Kreibich, H.; Van Loon, A.; Schröter, K.; Ward, P.; Mazzoleni, M.; Sairam, N.; Abeshu, G.; Agafonova, S.; Aghakouchak, A.; Aksoy, H.; et al. The challenge of unprecedented floods and droughts in risk management. Nature 2022, 608, 80–86. [Google Scholar] [CrossRef] [Scilit] [PubMed]
  49. Liu, W.; Dong, F.; Hu, B.; You, R.; Li, J.; Shao, G. Exploring two-decadal risk variability of drought-flood abrupt alternation in a high-plateau basin. Ecol. Indic. 2023, 156, 111106. [Google Scholar] [CrossRef] [Scilit]
  50. Qiu, J.; He, C.; Liu, X.; Gao, L.; Tan, C.; Wang, X.; Kong, D.; Wigneron, J.; Chen, D.; Xia, J. Projecting dry-wet abrupt alternation across China from the perspective of soil moisture. npj Clim. Atmos. Sci. 2024, 7, 269. [Google Scholar] [CrossRef] [Scilit]
  51. He, N.; Yin, J.; Liu, P.; Fu, X.; Zhang, Q.; Cheng, L.; Moulds, S.; Volchak, A. Global Increases in Dry-Wet Abrupt Alternation Events Under Climate Change. Geophys. Res. Lett. 2025, 52, e2025GL117322. [Google Scholar] [CrossRef] [Scilit]
Figure 1. Geographical location of the study area.
Water 18 01053 g001
Figure 2. Procedure for identifying DFAA events based on run theory.
Water 18 01053 g002
Figure 3. A representative grid (110.8750° E, 34.8750° N) DFAA event identified using SPEI.
Water 18 01053 g003
Figure 4. A representative basin DFAA event identified using SPEI from 26 May to 2 July 2012.
Water 18 01053 g004
Figure 5. Temporal variation characteristics of grid-scale DFAA events during 1982–2021: (a) mean occurrence frequency, (b) mean duration, and (c) mean intensity.
Water 18 01053 g005
Figure 6. Spatial distribution of grid-scale DFAA events during 1982–2021: (a) occurrence frequency, (b) mean duration, and (c) mean intensity.
Water 18 01053 g006
Figure 7. Variation characteristics of DFAA events in the YRB: (a) occurrence frequency, (b) duration, and (c) intensity.
Water 18 01053 g007
Figure 8. Variation in the occurrence frequency of DFAA events across level-II water resource subregions.
Water 18 01053 g008aWater 18 01053 g008b
Figure 9. Variation in the duration of DFAA events across level-II water resource subregions.
Water 18 01053 g009
Figure 10. Variation in the intensity of DFAA events across level-II water resource subregions.
Water 18 01053 g010
Table 1. SPEI-based classification of drought and flood conditions.
CategorySPEI Range
Extreme droughtSPEI ≤ −2.0
Severe drought−2.0 < SPEI ≤ −1.5
Moderate drought−1.5 < SPEI ≤ −1.0
Mild drought−1.0 < SPEI ≤ −0.5
Normal−0.5 < SPEI < 0.5
Mild flood0.5 ≤ SPEI < 1.0
Moderate flood1.0 ≤ SPEI < 1.5
Severe flood1.5 ≤ SPEI < 2.0
Extreme floodSPEI ≥ 2.0
Table 2. Numbers of identified DFAA events under different threshold combinations.
Drought-Duration Threshold D0Flood-Duration Threshold D1Area Threshold A0Number of Identified DFAA Events
10 d3 d30%57
35%40
40%30
5 d30%40
35%28
40%16
15 d3 d30%26
35%16
40%14
5 d30%15
35%11
40%9
20 d3 d30%10
35%8
40%4
5 d30%6
35%4
40%1
Table 3. Identification results of DFAA events in the YRB during 1982–2021.
No.Start DateEnd DateTotal
Duration (d)
Drought
Duration (d)
Drought
Intensity
Transition
Time (d)
Flood
Duration (d)
Flood
Intensity
DFAA
Intensity
118 September 198720 October 198733240.87181.220.96
210 April 198810 May 198831251.33061.261.31
320 June 199521 July 199532221.57192.001.70
416 May 19976 July 199752451.57251.431.55
516 June 199816 July 199831181.470131.591.52
630 August 199822 September 199824151.22271.381.27
721 May 200212 June 200223171.42151.791.51
813 April 200520 May 200538321.46151.141.42
926 May 200724 June 200730211.61271.531.59
101 June 200911 July 200941361.79141.821.79
119 April 201113 May 201135291.43151.381.42
1226 May 20122 July 201238311.16161.551.22
138 July 201731 July 201724181.57151.281.51
1423 March 201816 April 201825201.16051.031.13
1529 April 202119 May 202121151.66151.191.54
1620 May 202119 June 202131231.43170.951.32
Disclaimer/Publisher’s Note: The statements, opinions and data contained in all publications are solely those of the individual author(s) and contributor(s) and not of MDPI and/or the editor(s). MDPI and/or the editor(s) disclaim responsibility for any injury to people or property resulting from any ideas, methods, instructions or products referred to in the content.