Terrain Elevation as a Driver of Anthropocene Trends in the Runoff of Rivers: Insights from the East European Plain



Abstract
1. Introduction
- (1)
- The warming of the lower troposphere within Russia is occurring almost twice as fast as the average warming on the surface of the Earth’s land—approx. 0.5 °C per 10 years; moreover, each subsequent decade, starting from the 1981–1990 period, was warmer than the previous one [20]. Along with the observed increases in air temperature, the last decades have also seen a decline in the duration of snow cover, especially in European Russia (across Russia as a whole, an average of 1.2 days over 10 years from 1976 to 2020). However, the total snowfall amount has increased, particularly in the western part of Russia [21]. In the southern half of European Russia, especially in the steppe zone, there is a slight increase in the amount of heavy rainfall during the warm season of the year [22].
- (2)
- Following the USSR’s collapse in 1991, there was a considerable reduction in arable land (which has sharply slowed or even reversed since the 2010s), especially in the region’s forest zone, as well as changes in crop rotation patterns [23,24,25,26]. Based on our estimates [27], the area of cropland in Russia as a whole decreased by more than a third between 1971–1991 and 2005–2017.
- (3)
- Climate and land use/cover changes have led to considerable seasonal transformations in runoff, primarily in the southern half of the plain. This has resulted in a reduction in meltwater runoff and an increase in low-water runoff during both cold and warm seasons of the year. For example, in the basins of the lower reaches of the Volga (as the longest and most full-flowing river in Europe) and Don rivers, as well as in the southern part of the basin of the Oka River, a decrease in the annual maximum runoff of 40–70% was recorded in most rivers after 1979–1983 [1,28,29,30]. In the basin of the Don River and in the eastern part of the basin of the Volga River, the contribution of floodwaters from snowmelt has decreased to ≤50% of the annual runoff [30,31,32] (50% is a critical level for rivers with an Eastern European-type water regime). In the first half of the 20th century, for comparison, snowmelt floodwaters in these basins accounted for ≥60–70% of annual values [29,30].
- To identify the nature of the impact of H on the changeability of the annual average, maximum and minimum (for the cold and warm seasons of the year) runoff both within the framework of the baseline periods, 1961–1990 and 1991–2020 (spatial variability), and between these periods (spatiotemporal variability).
- To detect spatial variability of the runoff coherence (i.e., manifestation of synchronicity of temporal variability in runoff) of the above-mentioned runoff parameters both within the specified baseline periods and between these periods, and to assess the influence of H on this coherent variability within two subregions of the region under study, the Middle Volga region and the eastern Don River basin.
- To assess the influence of H on the change in the direction and closeness of the mutual correlation between the above-mentioned runoff parameters from 1961–1990 to 1991–2020.
2. Materials and Methods
2.1. Study Region


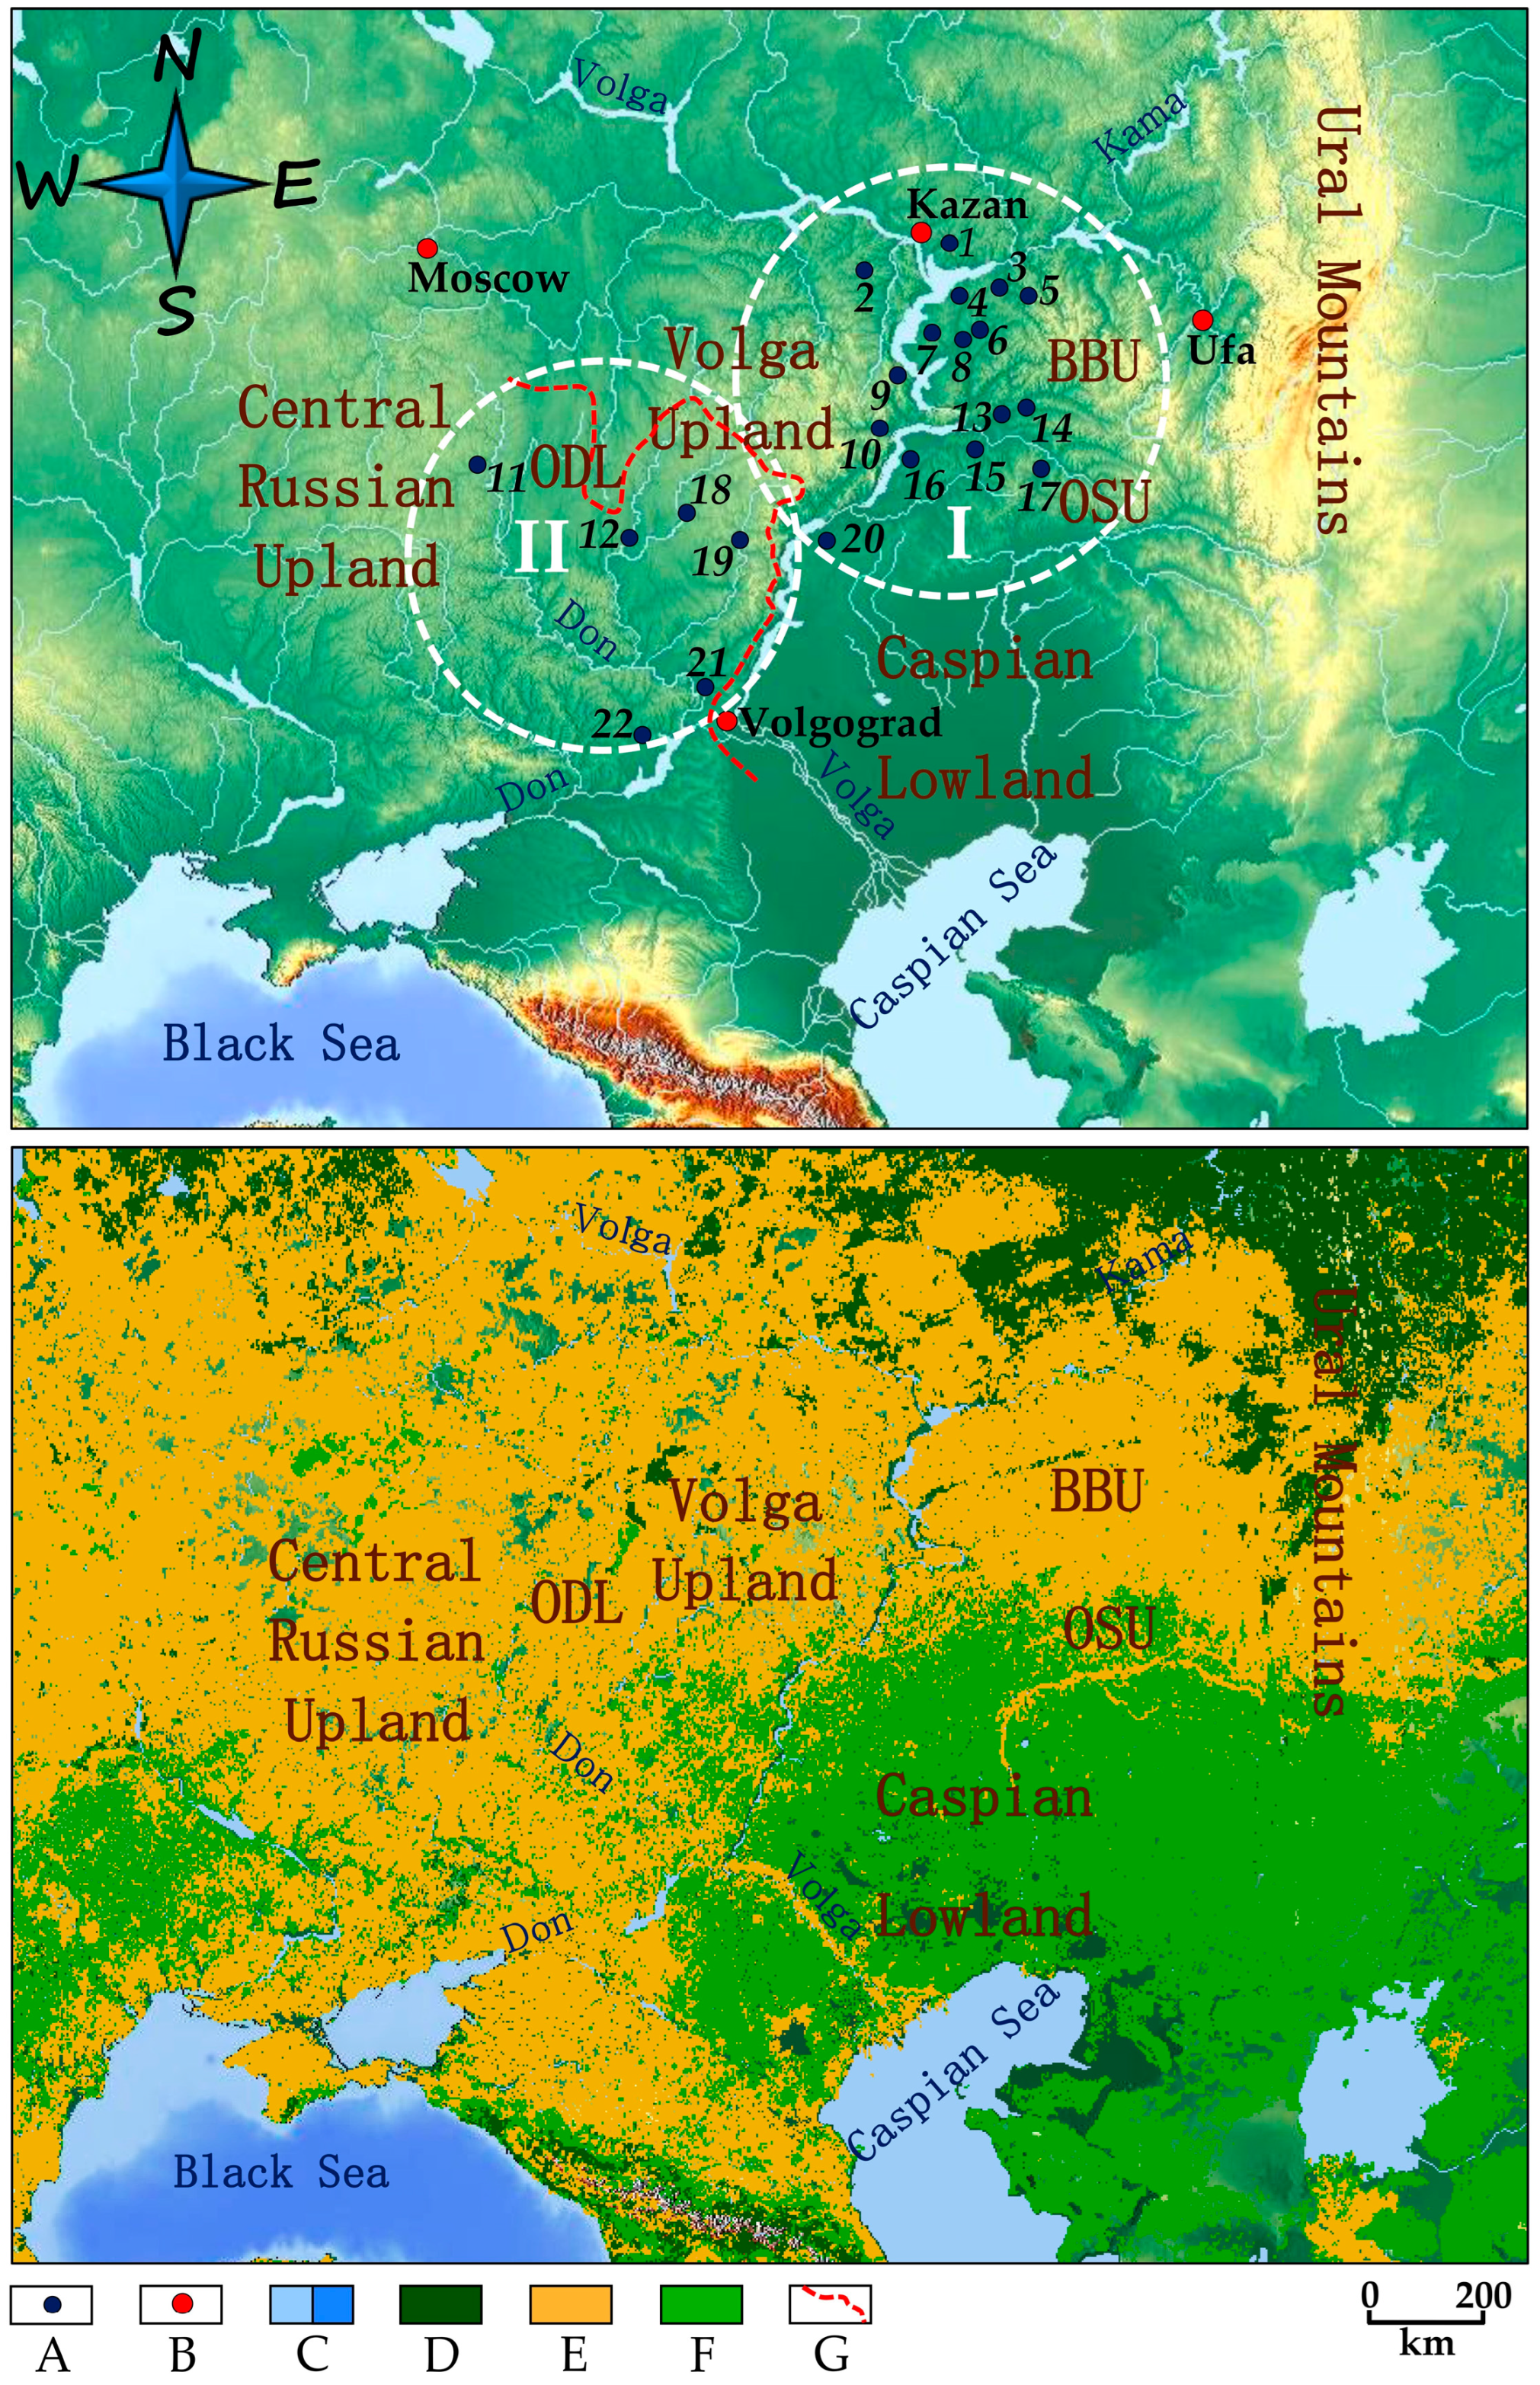
| No. | River | Gauging Station and Its Code 1 | F, km2 | h, m | H, m | Z | Lith | |
|---|---|---|---|---|---|---|---|---|
| Forest–steppe zone | ||||||||
| 1 | Myosha | Pestretsy | 77197 | 3230 | 54.9 | 150 | 5.4 | C |
| 2 | Kubnya | Chuteyevo | 77164 | 930 | 77.3 | 153 | 3.8 | C |
| 3 | Kichui | Utyashkino | 77189 | 1330 | 51.0 | 185 | 5.3 | C |
| 4 | Aktai | Karavayevo | 77201 | 690 | 69.7 | 132 | 3.1 | L |
| 5 | Sheshma | Sloboda Petropavlovskaya | 77179 | 3110 | 59.8 | 205 | 5.0 | C |
| 6 | Maliy Cheremshan | Abalduyevka | 77217 | 1230 | 85.3 | 144 | 3.7 | L |
| 7 | Krasnaya | Krasnaya Reka | 77209 | 311 | 55.0 | 120 | 2.9 | L |
| 8 | Bol’shoy Cheremshan | Novocheremshansk | 77212 | 6050 | 59.5 | 143 | 3.5 | C |
| 9 | Tushonka | Sergeyevka | 77210 | 309 | 54.2 | 227 | 4.0 | C |
| 10 | Syzranka | Repyovka | 77329 | 4380 | 48.0 | 220 | 3.4 | Sed |
| 11 | Sosna | Yelets | 78054 | 16,300 | 106.9 | 210 | 3.7 | S-S |
| 12 | Vorona | Borisoglebsk | 78165 | 13,200 | 84.5 | ND | 3.0 | Ch-O |
| 4256 | 67.2 | 172 | 3.9 | |||||
| Steppe zone | ||||||||
| 13 | Maliy Kinel’ | Poludni | 77298 | 2090 | 49.5 | 165 | 2.6 | C |
| 14 | Bol’shoy Kinel’ | Timashevo | 77292 | 12,000 | 32.2 | 165 | 3.2 | C |
| 15 | Chapayevka | Pod’yom Mikhailovka | 77311 | 1480 | 48.0 | 132 | 1.7 | Lo |
| 16 | Chagra | Novotulka | 77336 | 2550 | 29.7 | 107 | 1.2 | L |
| 17 | Buzuluk | Perevoznikovo | 77270 | 4280 | 61.7 | 162 | 1.6 | C |
| 18 | Khopyor | Balashov | 78138 | 14,300 | 100.8 | 220 | 3.1 | Ch-O |
| 19 | Medveditsa | Lysyye Gory | 78196 | 7610 | 126.6 | 220 | 2.6 | C |
| 20 | Bol’shoy Karaman | Sovetskoye | 77362 | 3470 | 29.0 | 82 | 0.4 | L |
| 21 | Ilovlya | Borovki | 78231 | 8730 | 40.3 | 150 | 0.8 | S-S |
| 22 | Chir | Oblivskaya | 78252 | 8470 | 39.2 | 150 | 1.1 | Lo |
| 6498 | 55.7 | 155 | 1.8 | |||||
2.2. Analyzed Rivers
2.3. Materials
- ▪
- Q—Annual average runoff;
- ▪
- Qmax—Annual maximum runoff (during the spring flood caused by snowmelt);
- ▪
- Qmin-CP—Annual minimum runoff during the ice-covered riverbed period (hereinafter, referred to as the cold period (season), mostly December–March);
- ▪ Qmin-WP—Annual minimum runoff during the absence of ice cover in the river (hereinafter, referred to as the warm period (season), mostly April–November).
2.4. Methods
2.4.1. Analyzed Periods
2.4.2. Statistical Procedures
- The Mann–Kendall test for the presence of a trend and its statistical significance (p-values). The trend line approximation coefficient R2 was also considered as a determination coefficient showing the contribution (in %) of a changing factor (in our case, this is the terrain elevation variability) to the variability of the dependent value (the variability of runoff).
- A set of tests for checking the homogeneity of the obtained correlation relationships (Buishand’s test, Pettitt’s test, and the Standard normal homogeneity test) to identify critical elevation levels of runoff change (the elevation level that matched the results of at least two of the three proposed tests was considered critical).
- White’s test for checking the heteroscedasticity or homoscedasticity of the achieved correlation relationships, i.e., the presence or absence of a unit root in the residuals of the correlation relationship trend, respectively.
2.4.3. Analytical Stages of the Study
- (1)
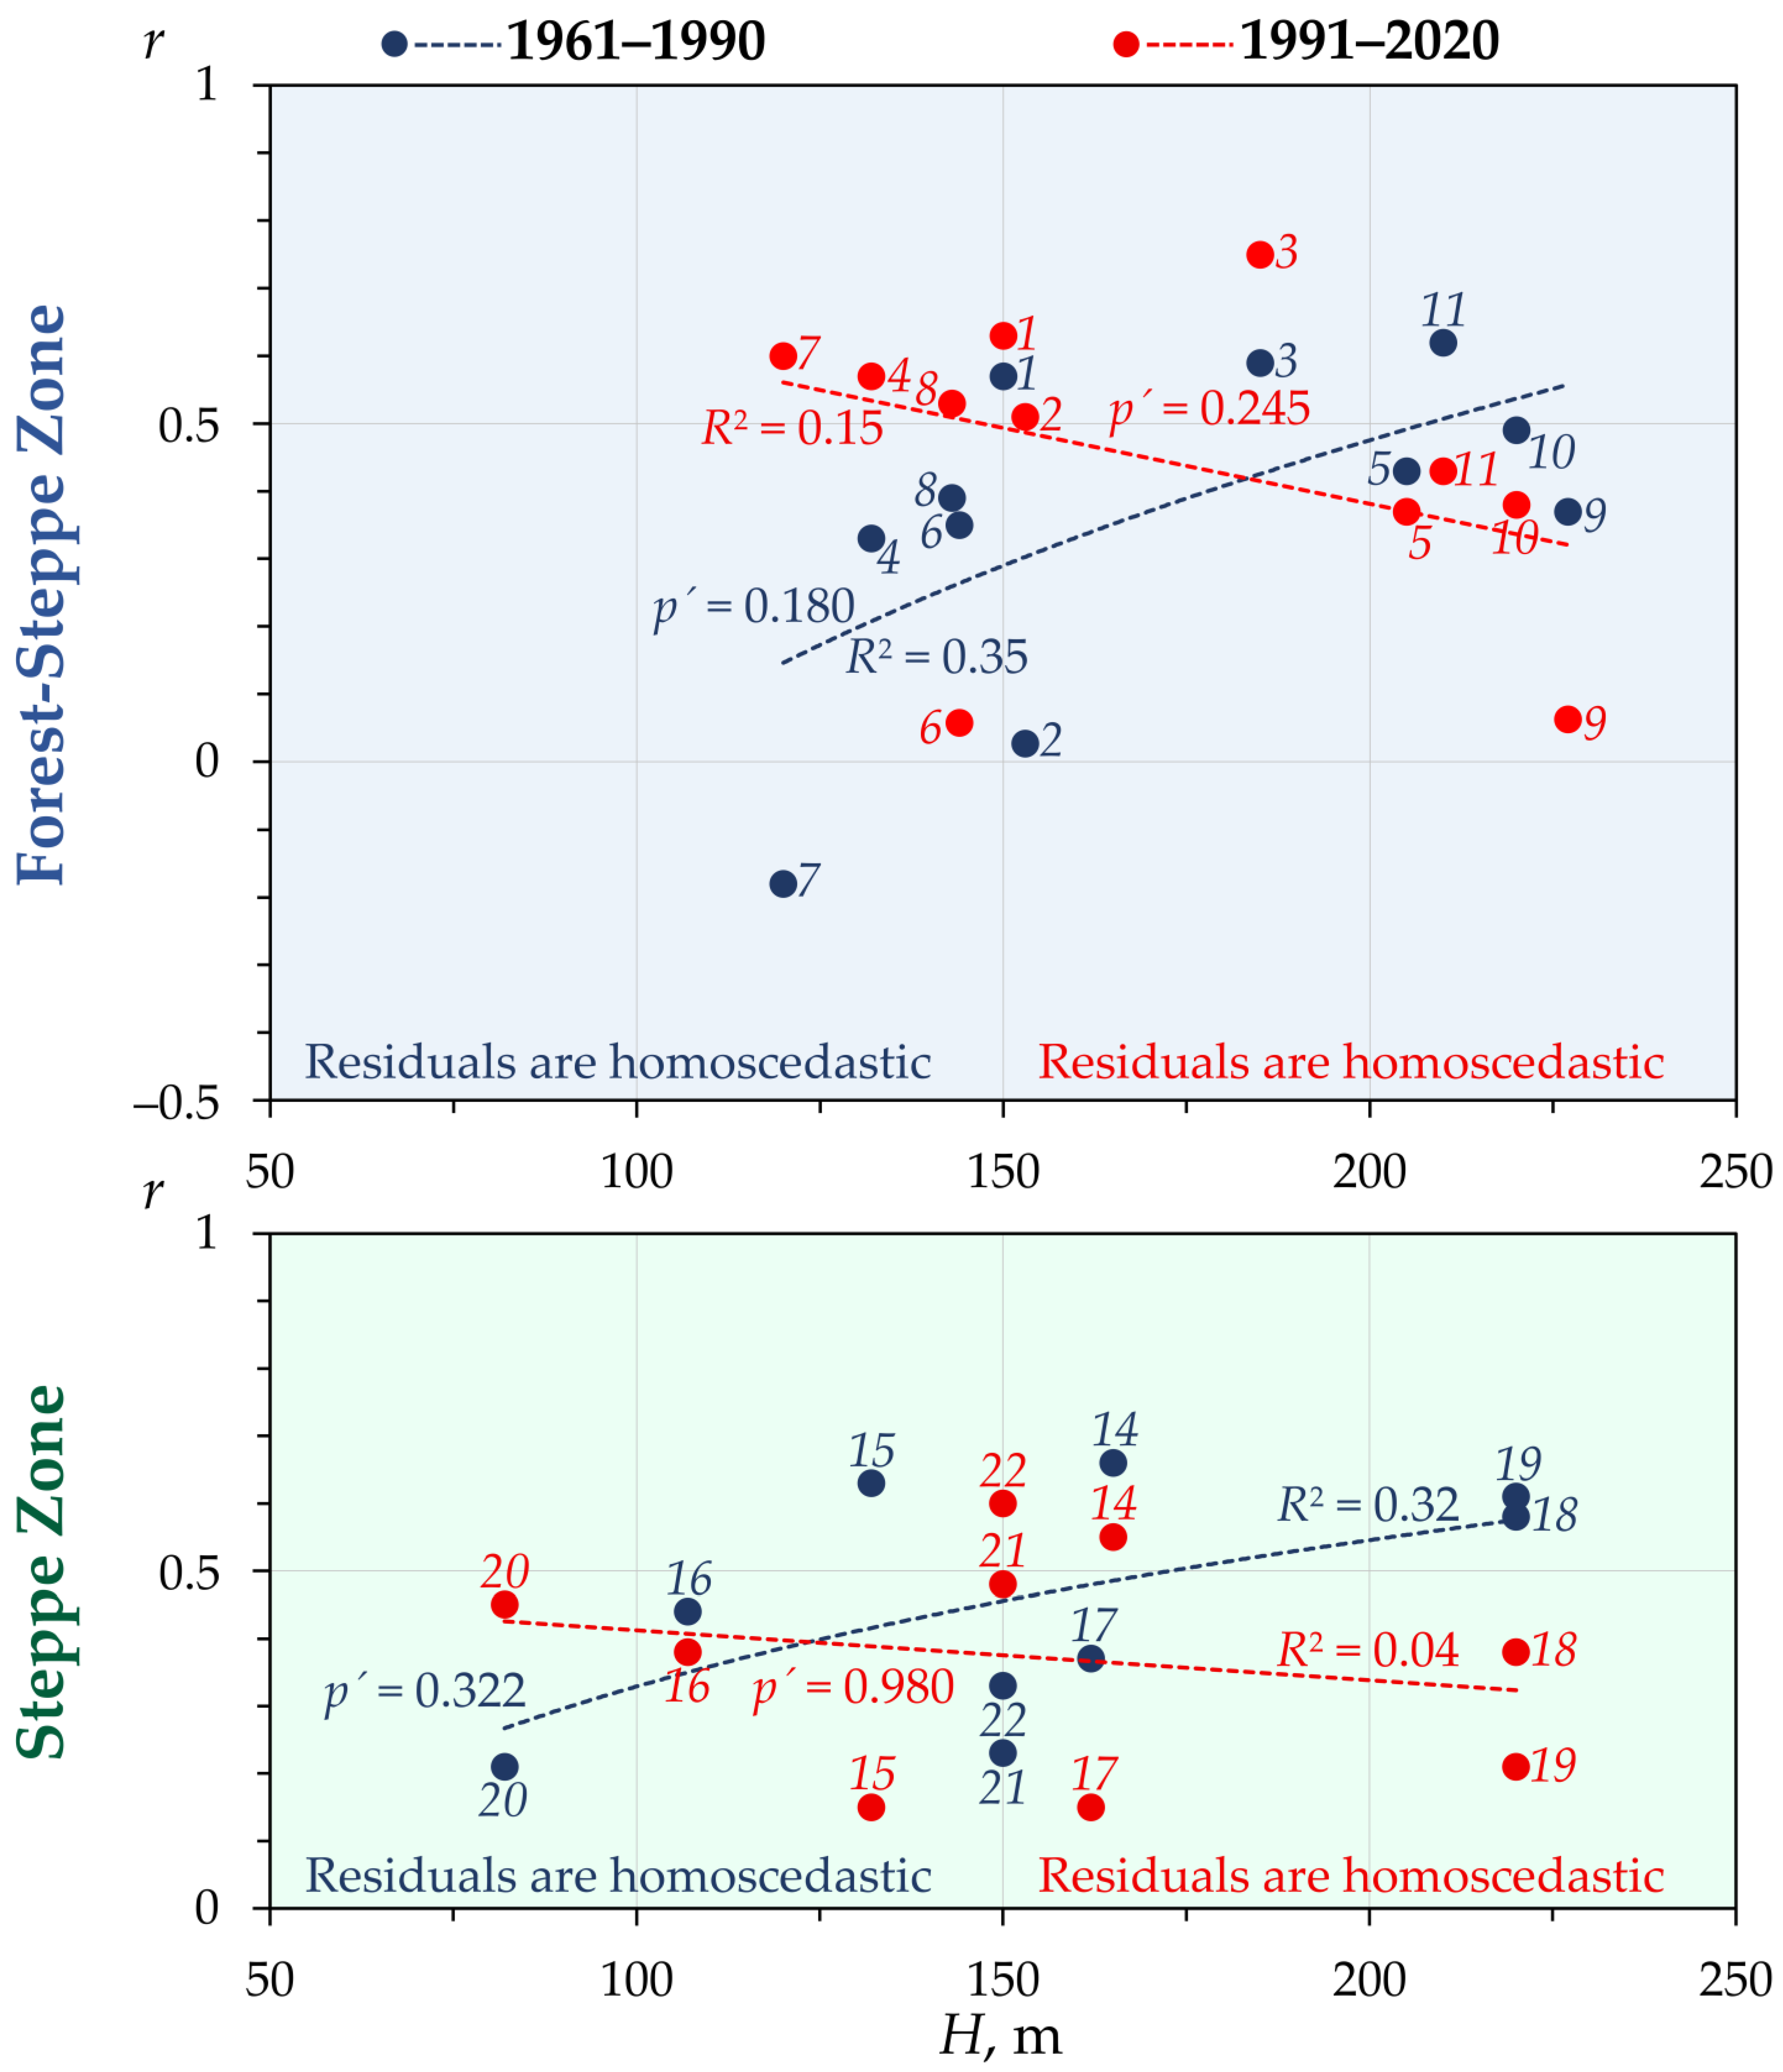
- Terrain Elevation and Spatiotemporal Variability of Runoff. Correlation of the average elevations of the river basins was analyzed (H) with average values of considered runoff parameters in the baseline climatic periods in the forest–steppe and steppe landscape zones of the East European Plain. In this correlation, all average values of a particular runoff parameter (m3 s−1; Q, Qmax, Qmin-CP, and Qmin-WP) were converted into specific values (L s−1 km−2; respectively, Z, Zmax, Zmin-CP, and Zmin-WP) in order to avoid the influence of the river basin (river length) size factor on the homogeneity of the achieved relationships. The correlation trend between H and the corresponding runoff parameter was considered statistically significant at p ≤ 0.05. This correlation was implemented computationally and graphically in the XLSTAT 2016.02.28451 statistical package (for Microsoft Excel).
- (2)
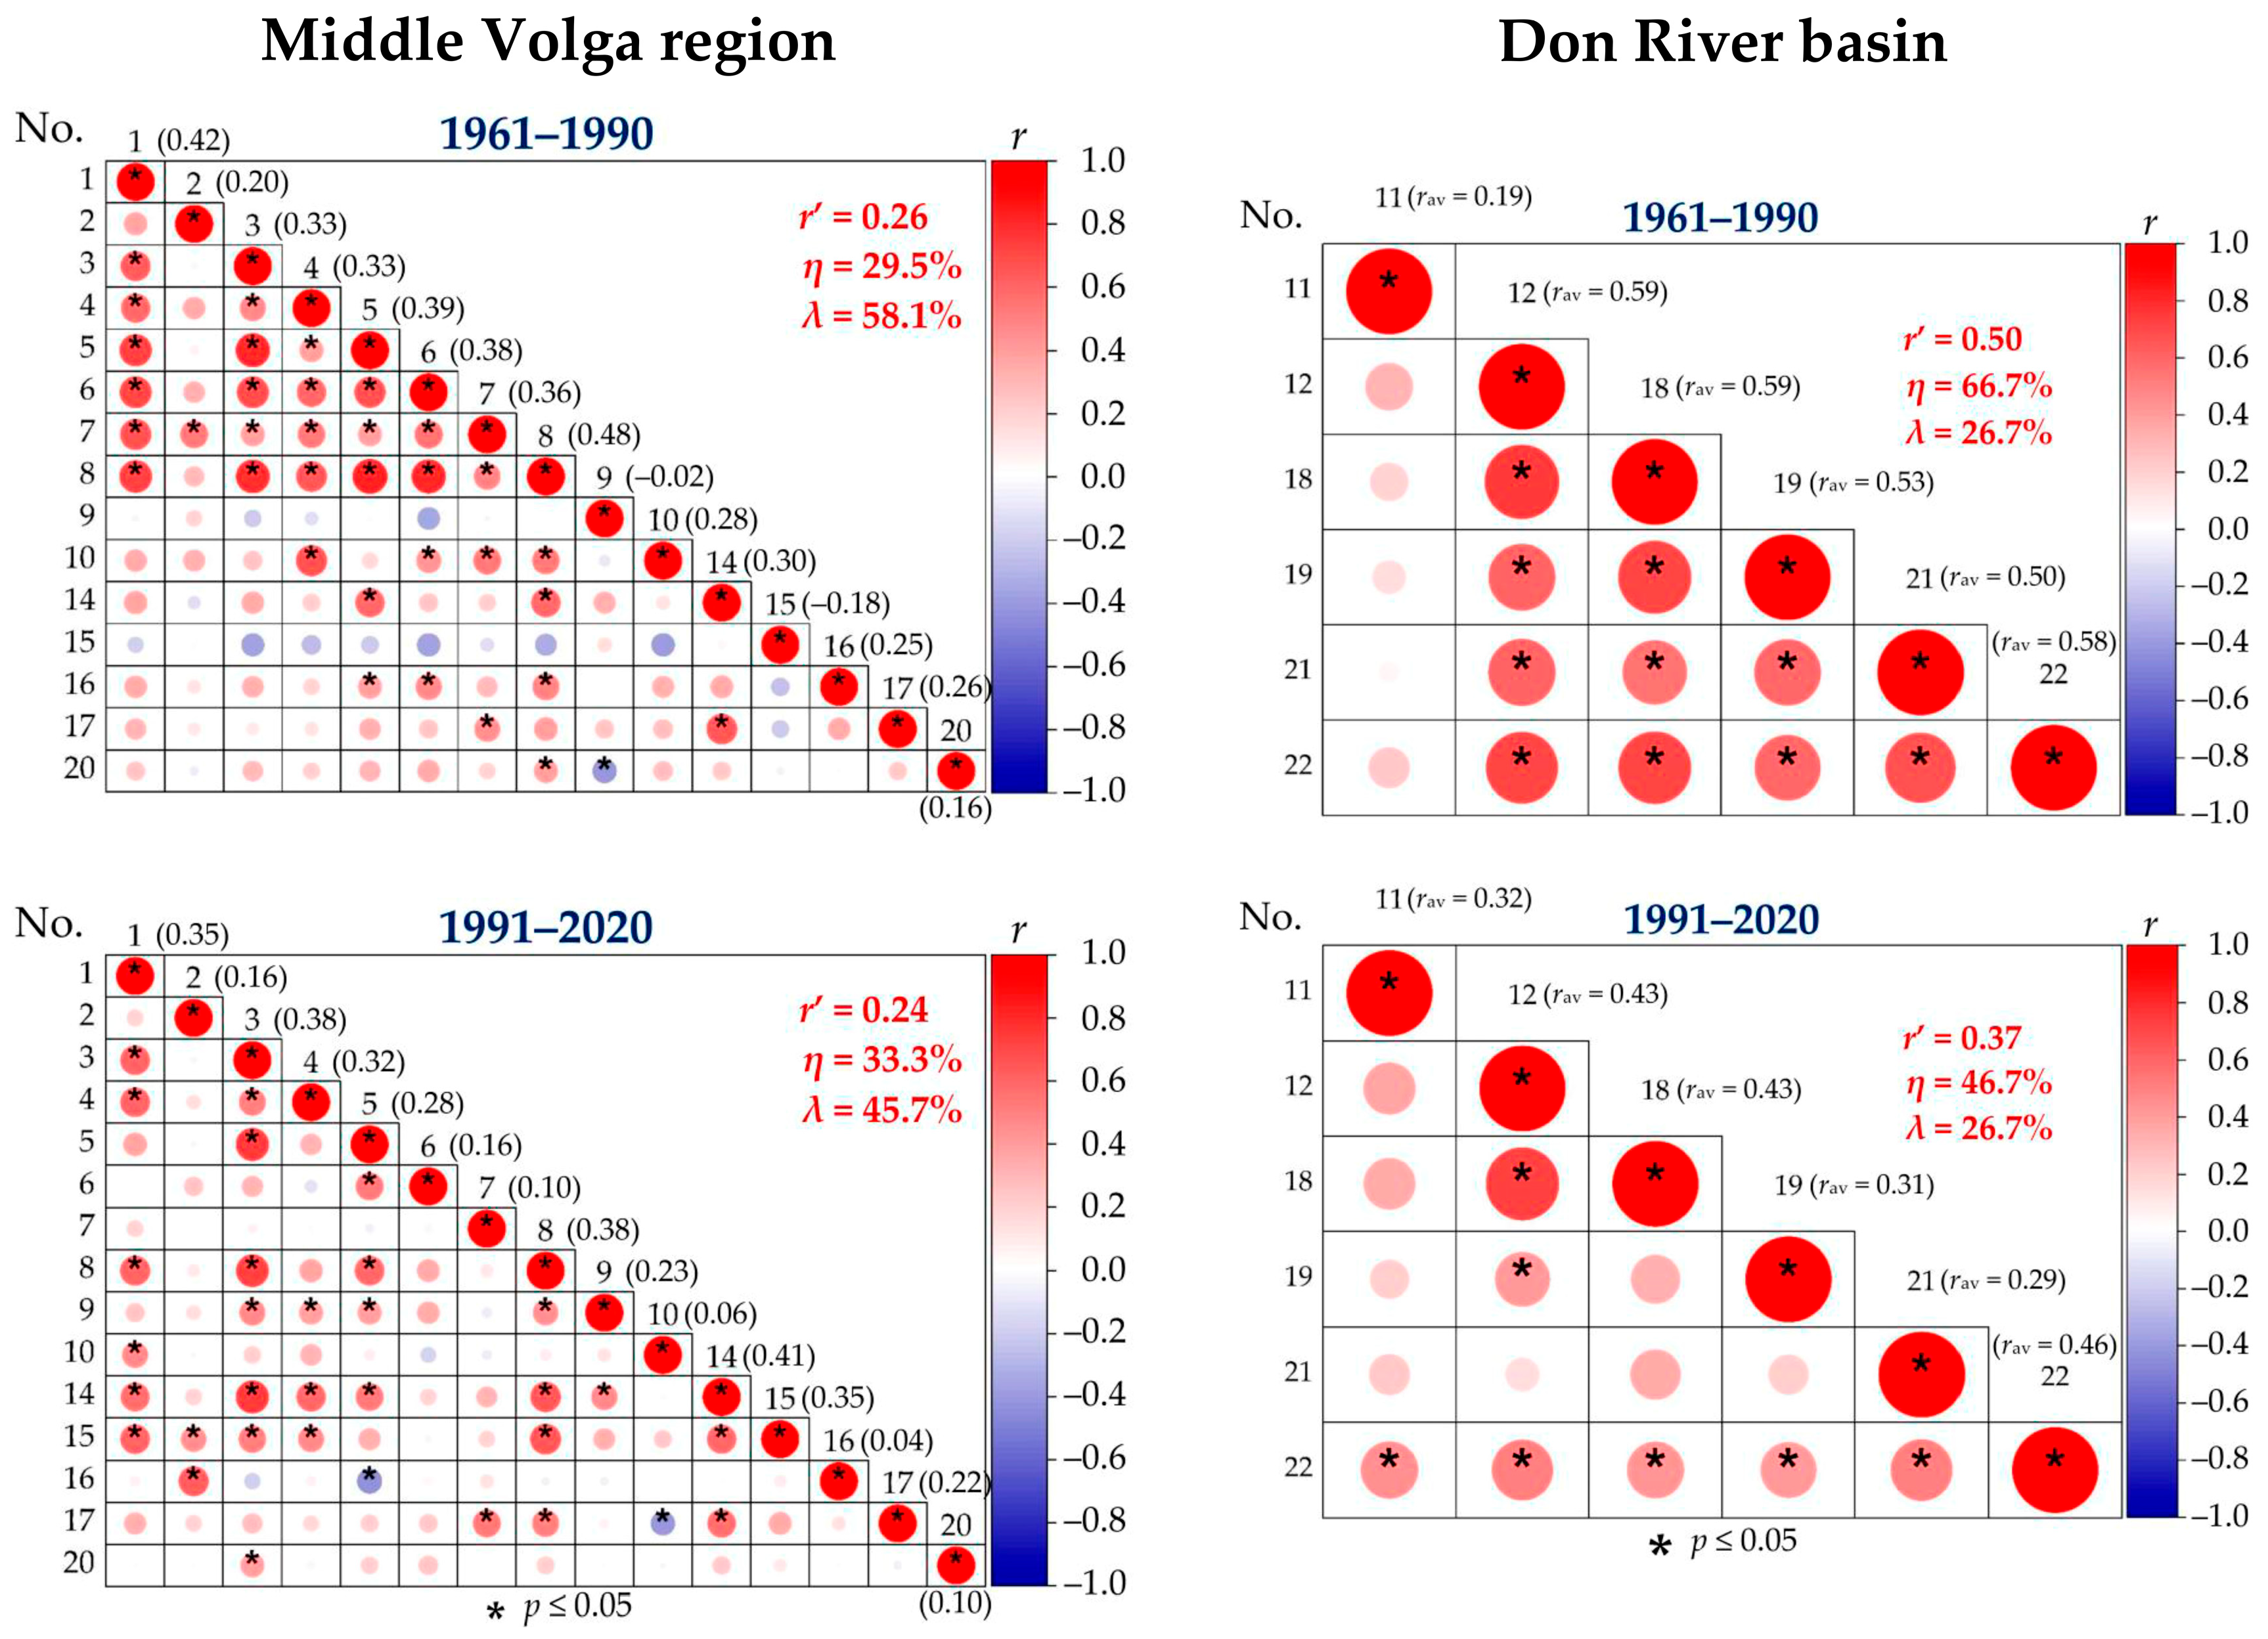
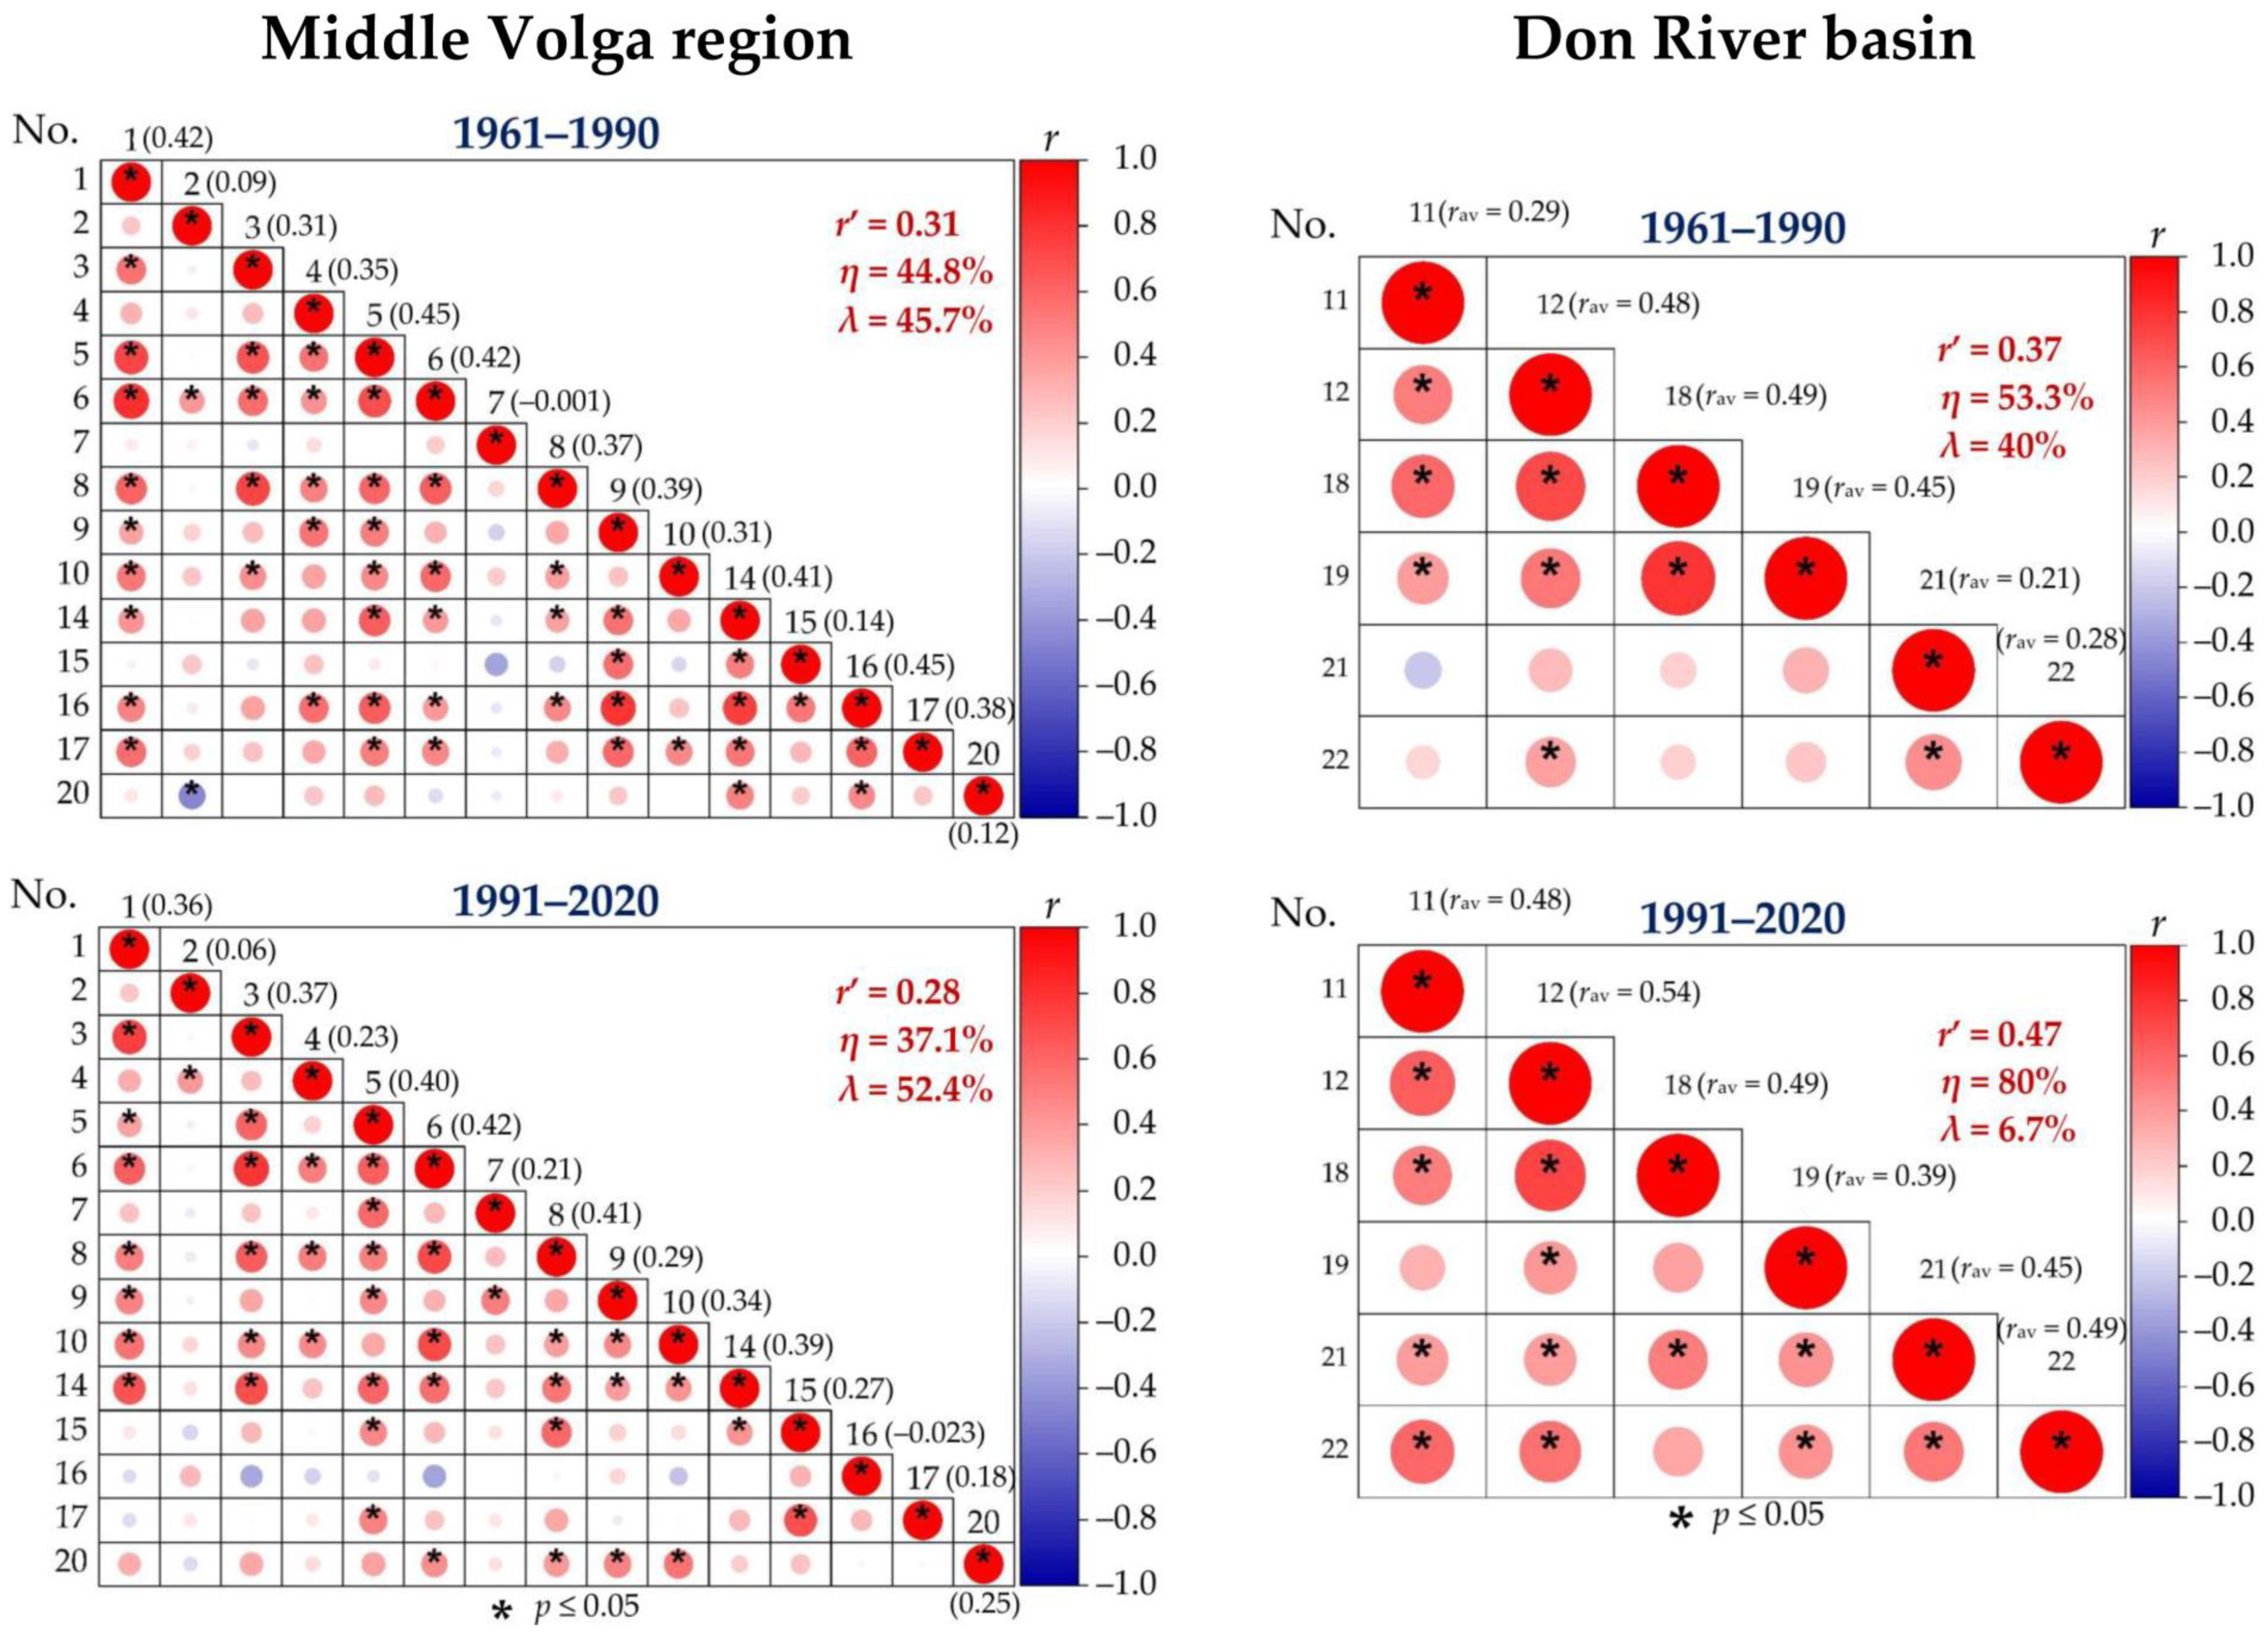
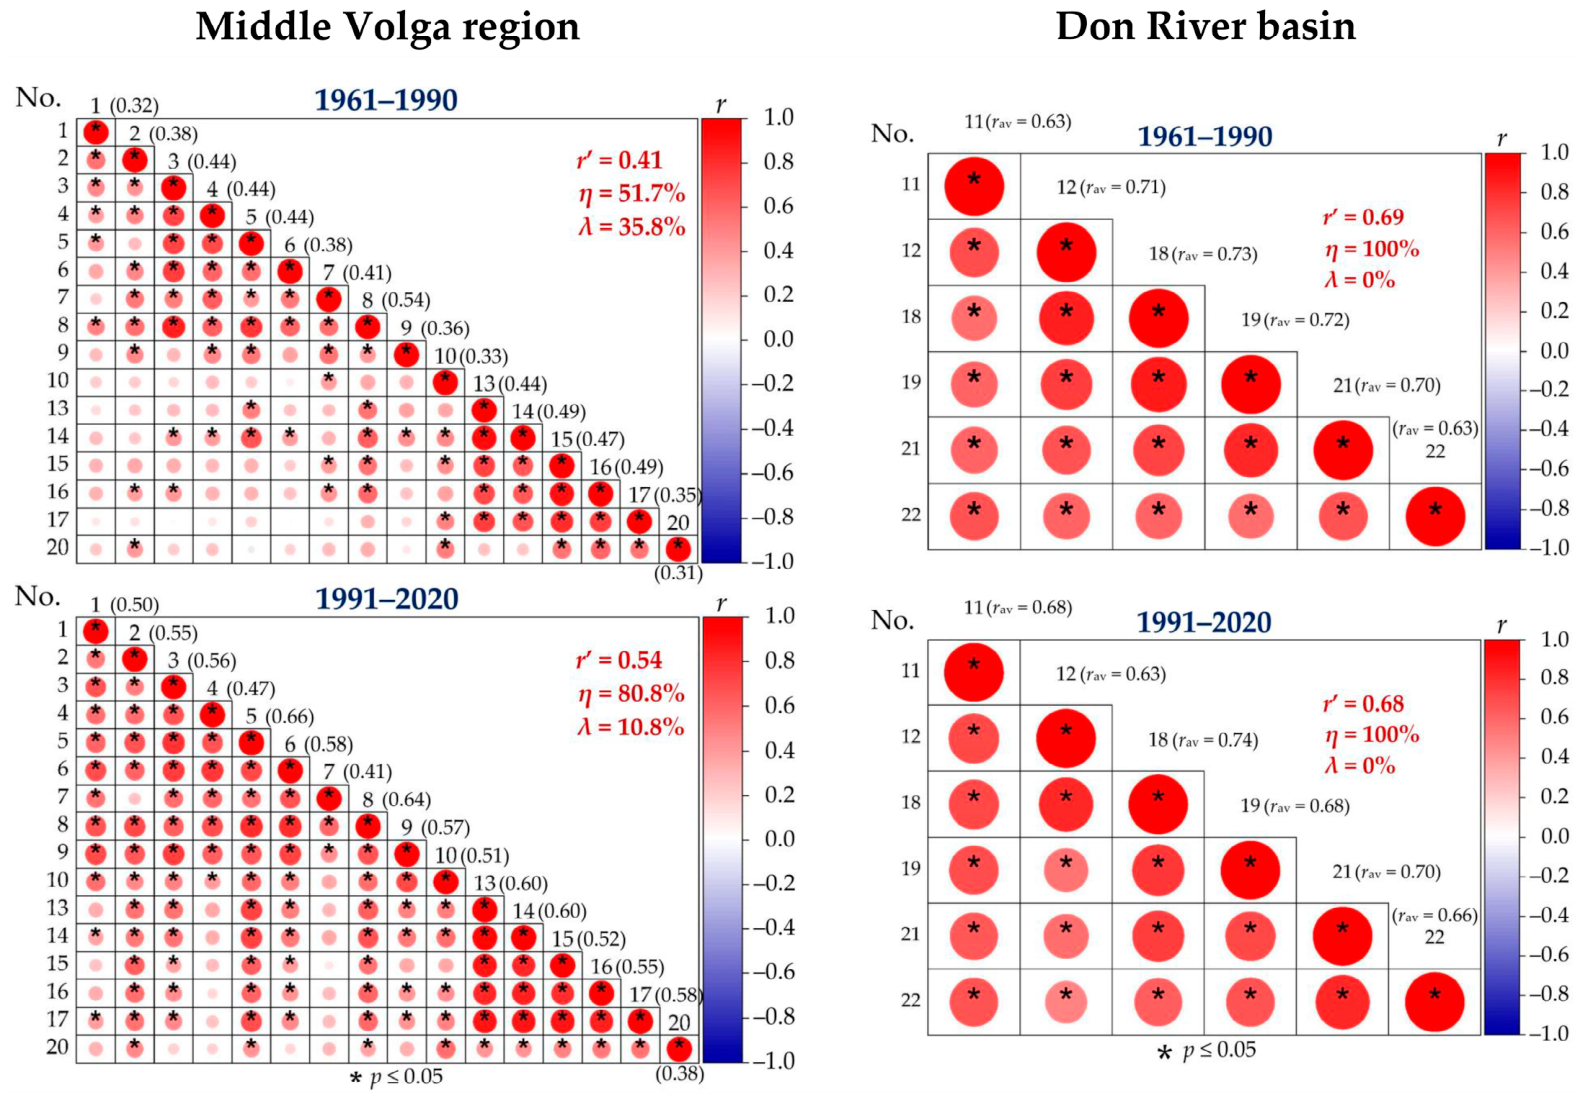
- Terrain Elevation and Spatiotemporal Coherence of Runoff. In each baseline climatic period, for the corresponding runoff parameter, a mutual correlation was carried out for all rivers included in the two study subregions: the Middle Volga region and the eastern part of the basin of the Don River as the most compact subregions of the location of the analyzed river basins in the region. In each subregion, for each river, individual mutual correlation coefficients (rav) were computed, which were then used to calculate the average correlation coefficients for the entire subregion by period (r′). The higher the values of rav and r′, the higher the spatiotemporal coherence of the change in the runoff parameter for the corresponding river (relative to other rivers in the subregion) and the subregion as a whole, respectively (complete coherence of the runoff in the river (or in the subregion) is observed at rav (or r′) = 1.0). The constructed mutual correlation matrices also make it possible to identify both the most representative (with the highest individual correlation coefficients) and “anomalous” rivers (with extremely low coefficients) for further study of the behavior of the long-term dynamics of their runoff. The interbasin mutual correlation procedure was implemented computationally and graphically in the OriginPro 2025b SR1 installation package.
- (3)
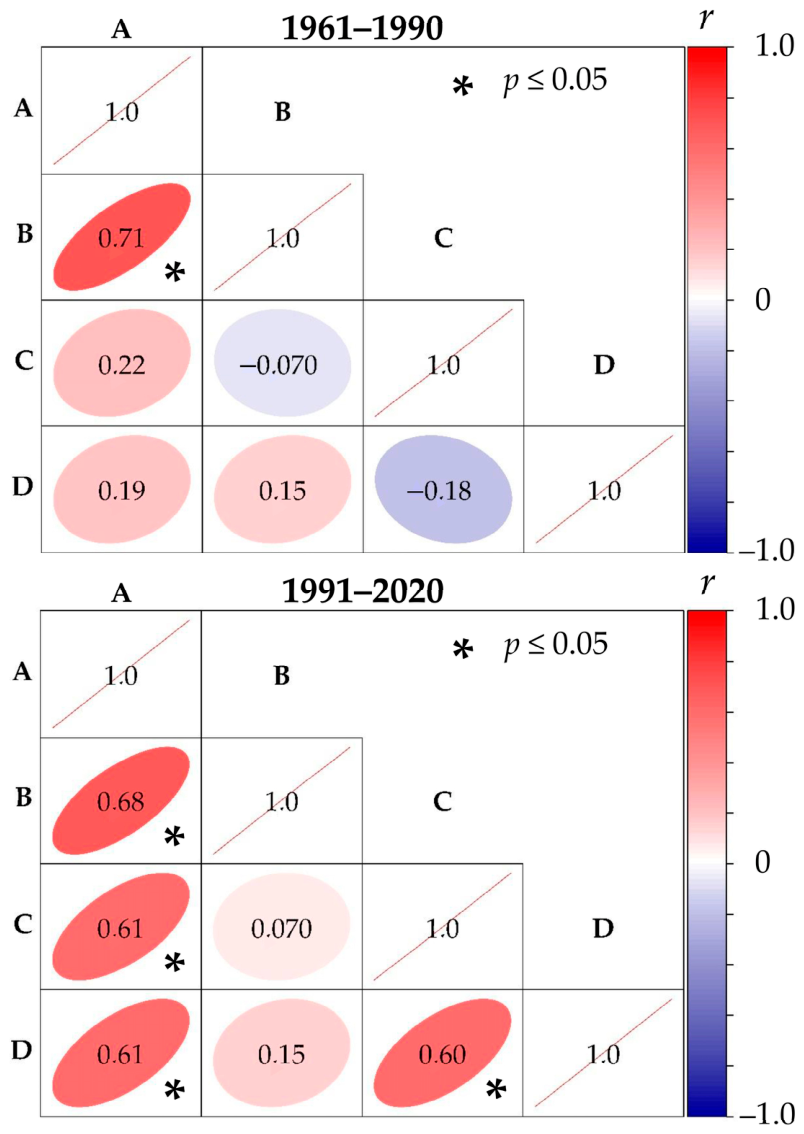
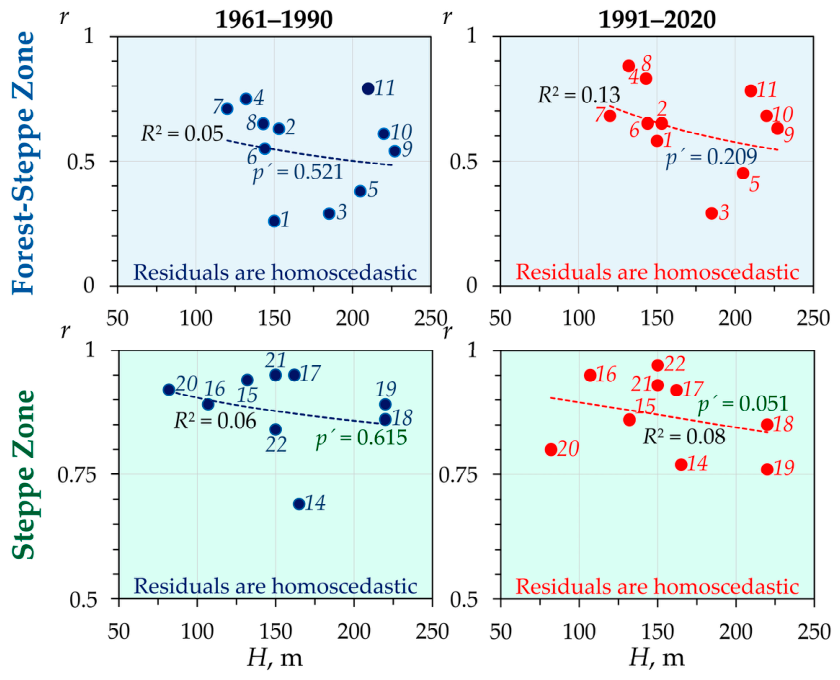
- Terrain Elevation and Intra-annual Runoff Correlation. For each river analyzed, a mutual correlation was carried out between the corresponding runoff parameters in each of the baseline periods. Matrices of such correlations make it possible to identify both the direction and the closeness and statistical significance of intra-annual correlation relationships between the parameters. An example of such a matrix is presented in Figure A2 in Appendix A, using data on the runoff of the “anomalous” Krasnaya River, which flows in the Middle Volga region’s forest–steppe zone. The derived results were then also generalized for the landscape zones under consideration. The mutual correlation procedure was also implemented computationally and graphically in the OriginPro 2025b SR1 installation package.
2.5. Limitations
- (1)
- There is a relatively small number of analyzed rivers in the Don River basin. This makes it difficult, on the one hand, to identify statistically reliable and stable dependencies of trends in runoff change on the elevation of the terrain in the river basin itself, and on the other hand, to reveal statistically significant similarities and differences with the neighboring Middle Volga region.
- (2)
- The average elevations of river basins, although they are a very convincing indicator of intraregional differences in topography, do not give an idea of the distribution of elevations, especially relative ones, within the river basins themselves without knowledge of the average slope gradients (α) in them. Considering the combined impact of these two geomorphic factors (H and α) on runoff will contribute to a more successful identification of stable geomorphic–hydrological dependencies in the region and their use in both scientific and applied issues.
- (3)
- Human activity in river basins (land use/cover changes, water intake for irrigation, creating ponds, etc.) could have had some impact on the identified runoff trends, as well as on interannual and intra-annual runoff variability during the baseline periods under consideration. We did not take this activity into account in our study. This issue requires separate and careful consideration within the framework of a single multifactorial analysis of the topic under study.
3. Study Background
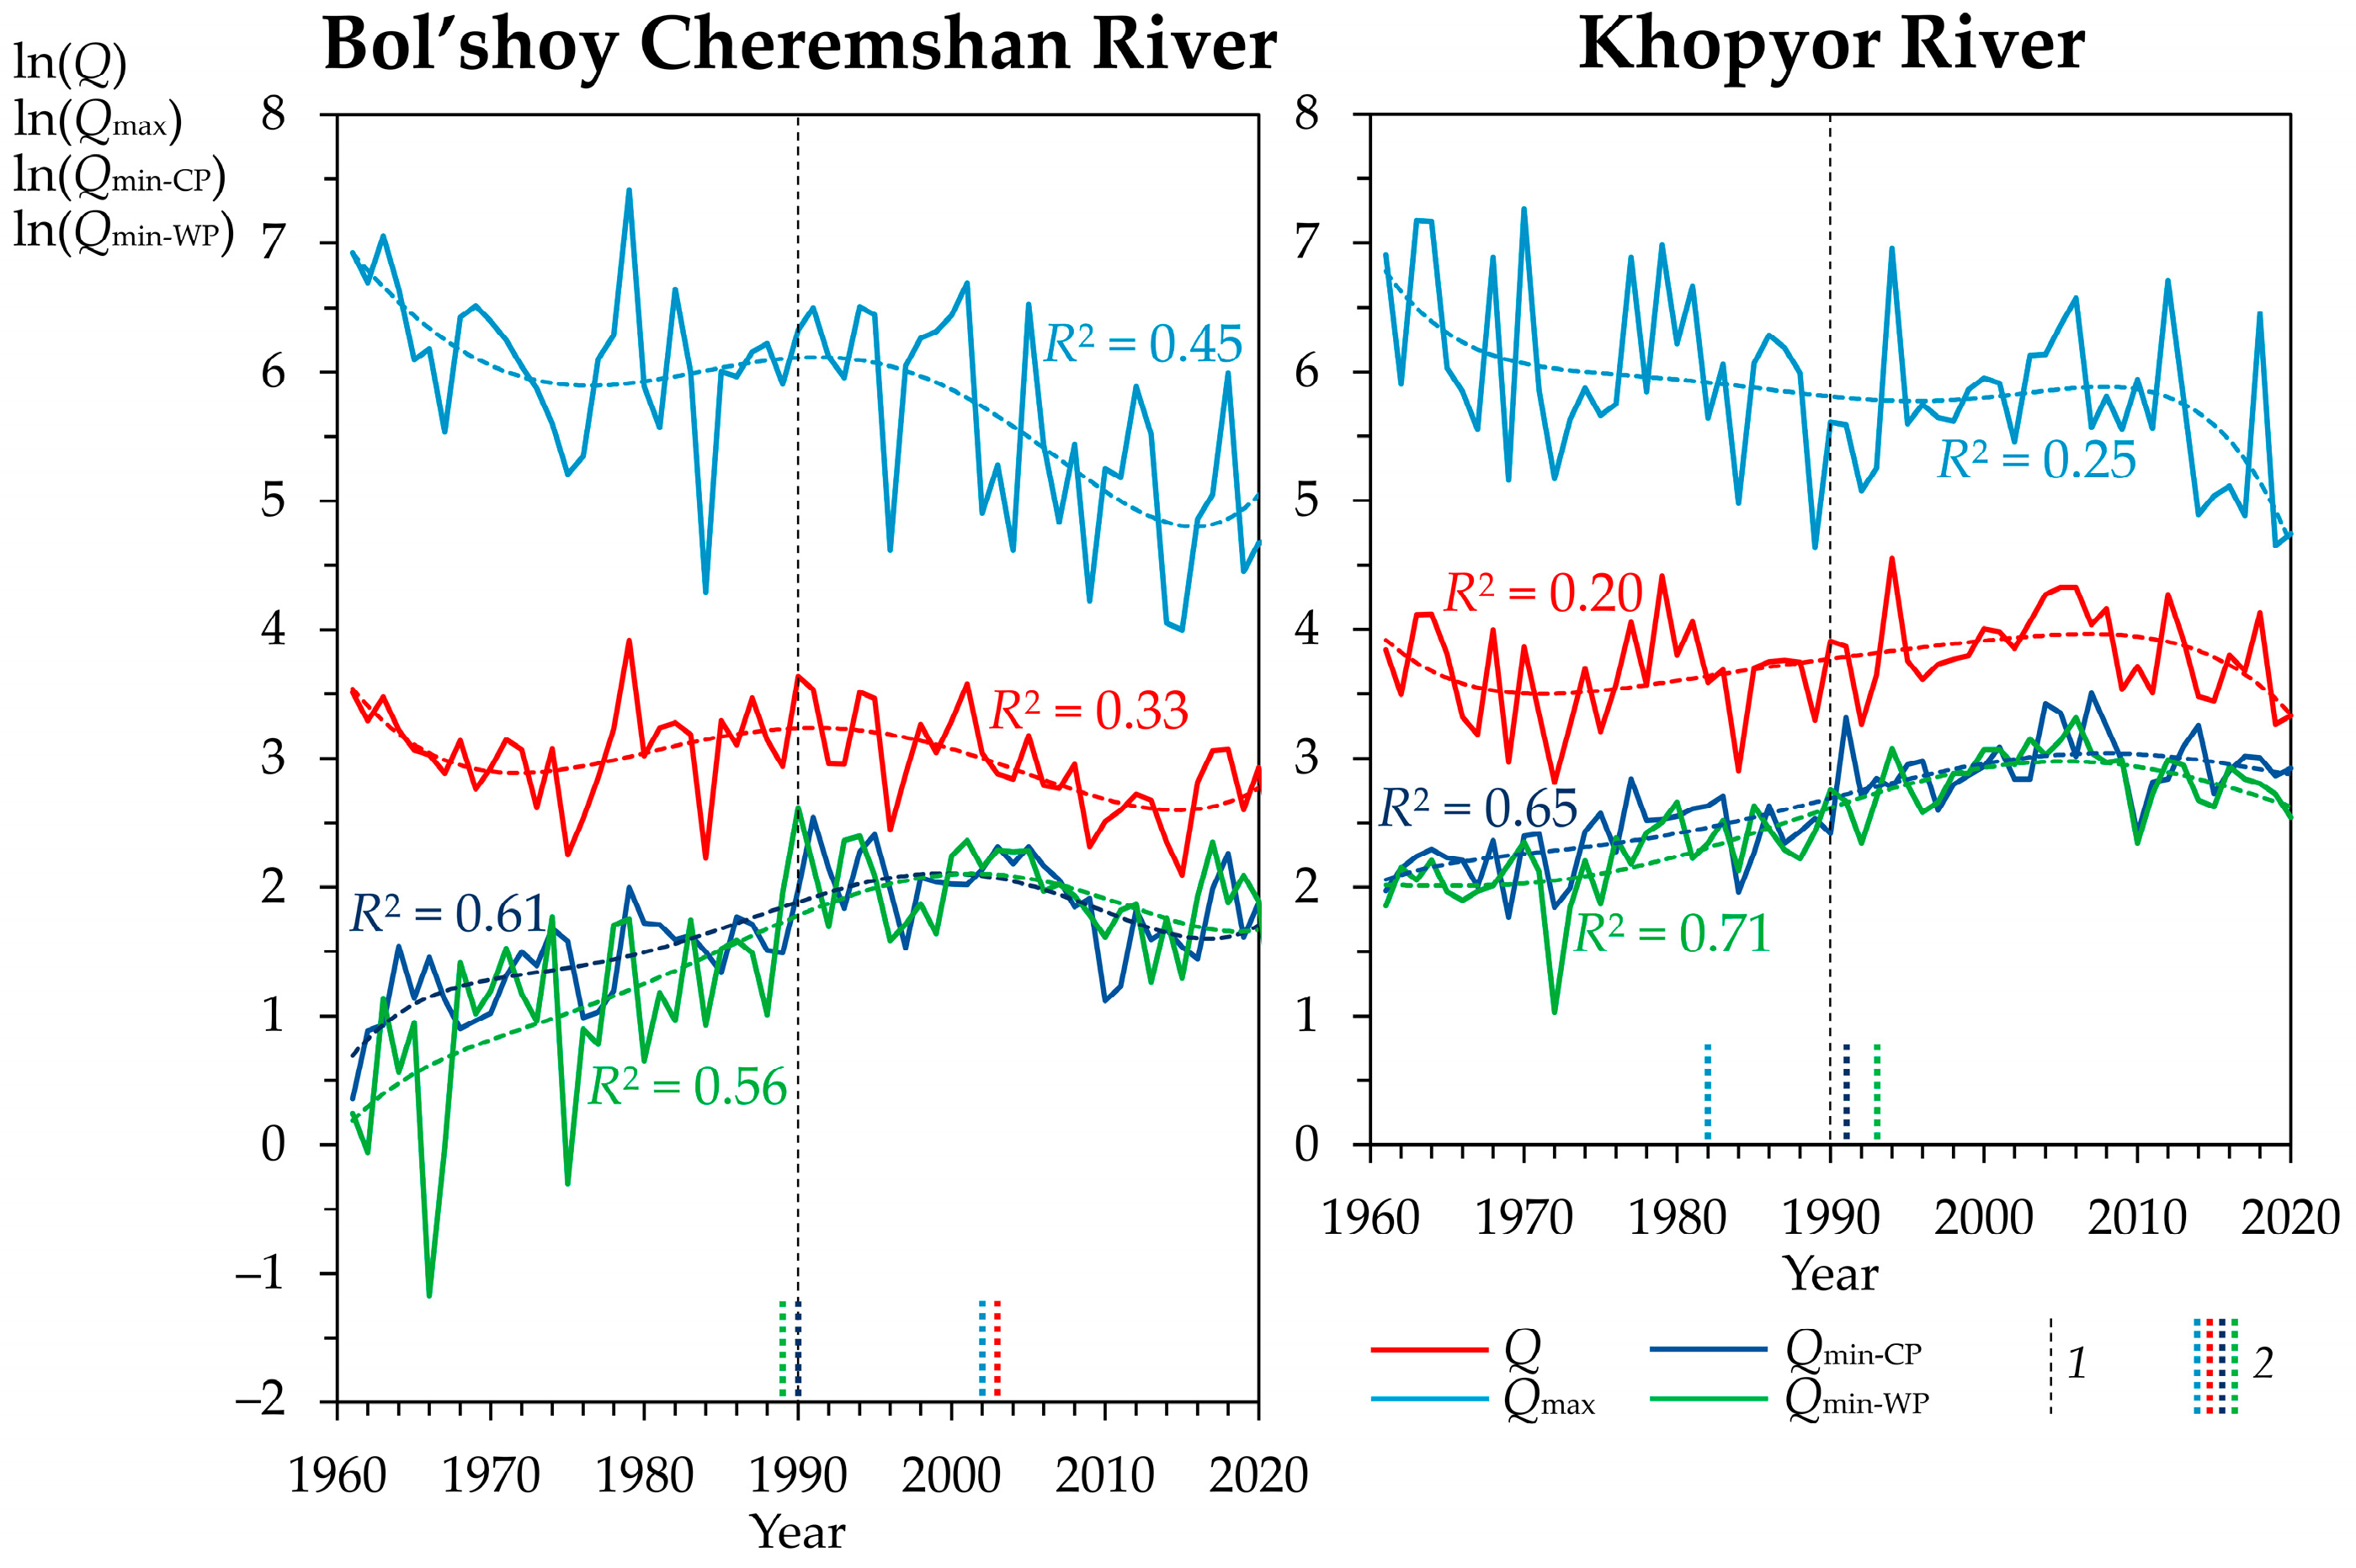
- Between 1960 and 2022, the vast majority of the rivers analyzed (amounting to 77% across the two zones combined) showed an overall downward trend in Q. It is important to note that, despite the presence of prevailing downward trends in Q across the entire study region, in 82–86% of cases, these trends were statistically insignificant.
- Unlike the annual average runoff, Qmax showed a downward trend in both overall and seasonal levels across both considered zones. This decline was more noticeable and generally statistically significant. It is noteworthy that the decline in Qmax in the analyzed rivers in the zone of forest–steppe was, on average, “deeper” (with statistically significant differences) compared to the steppe zone’s rivers.
- Qmin-CP experienced a significant overall increase from 1961 to 2022 (by an average of 96–100% between the periods 1961–1990 and 1991–2020). Most of these trends were statistically significant, particularly in the forest–steppe zone.
- As with Qmin-CP, Qmin-WP had a predominantly increasing trend during the total period studied: in 92–100% of cases in the forest–steppe zone and 78% of cases in the steppe zone.
- The above-mentioned alterations in the examined runoff parameters also entailed changes in their ratios. For example, the decreases in the Qmax/Qmin-CP and Qmax/Qmin-WP ratios between 1961–1990 and 1991–2020 were, on average, 70–73% in the analyzed forest–steppe zone rivers and 65–68% in the steppe zone.
- In the study area as a whole, a slight reduction (by 5–6%) in the interannual changeability (variation coefficient) of Q was noted between 1961–1990 and 1991–2020.
4. Results
4.1. Terrain Elevation and Spatiotemporal Variability of Runoff
- (a)
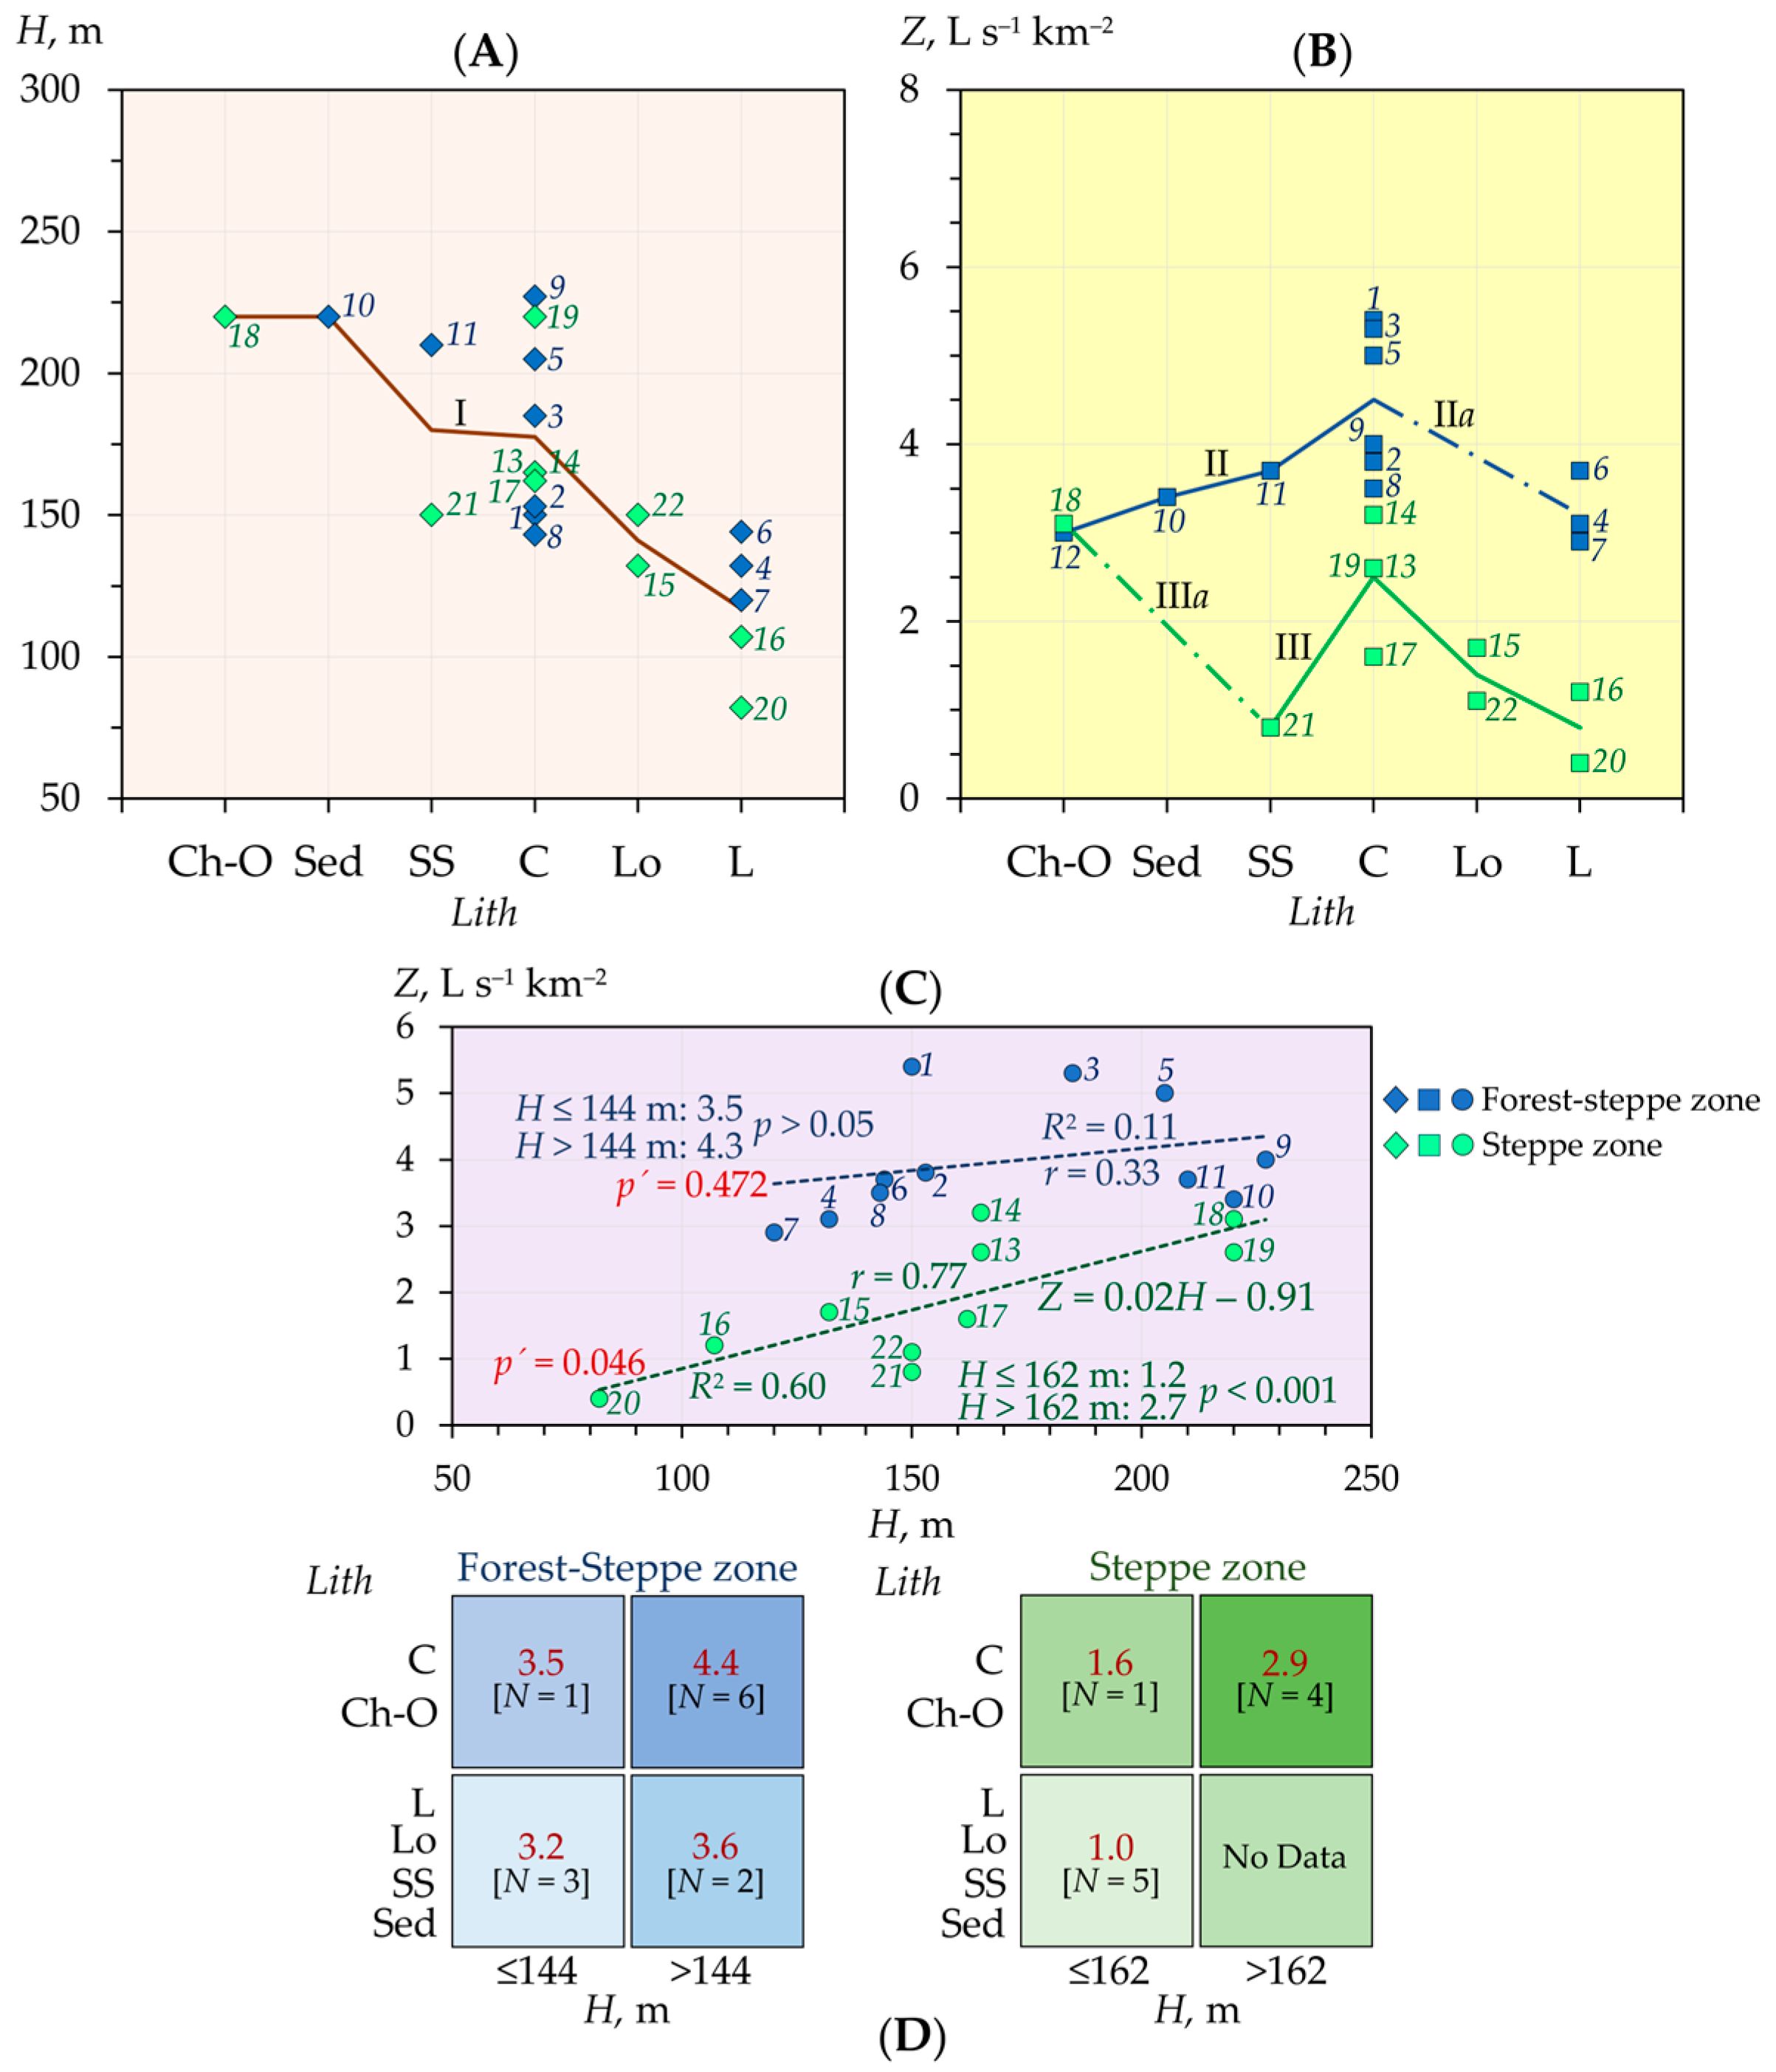
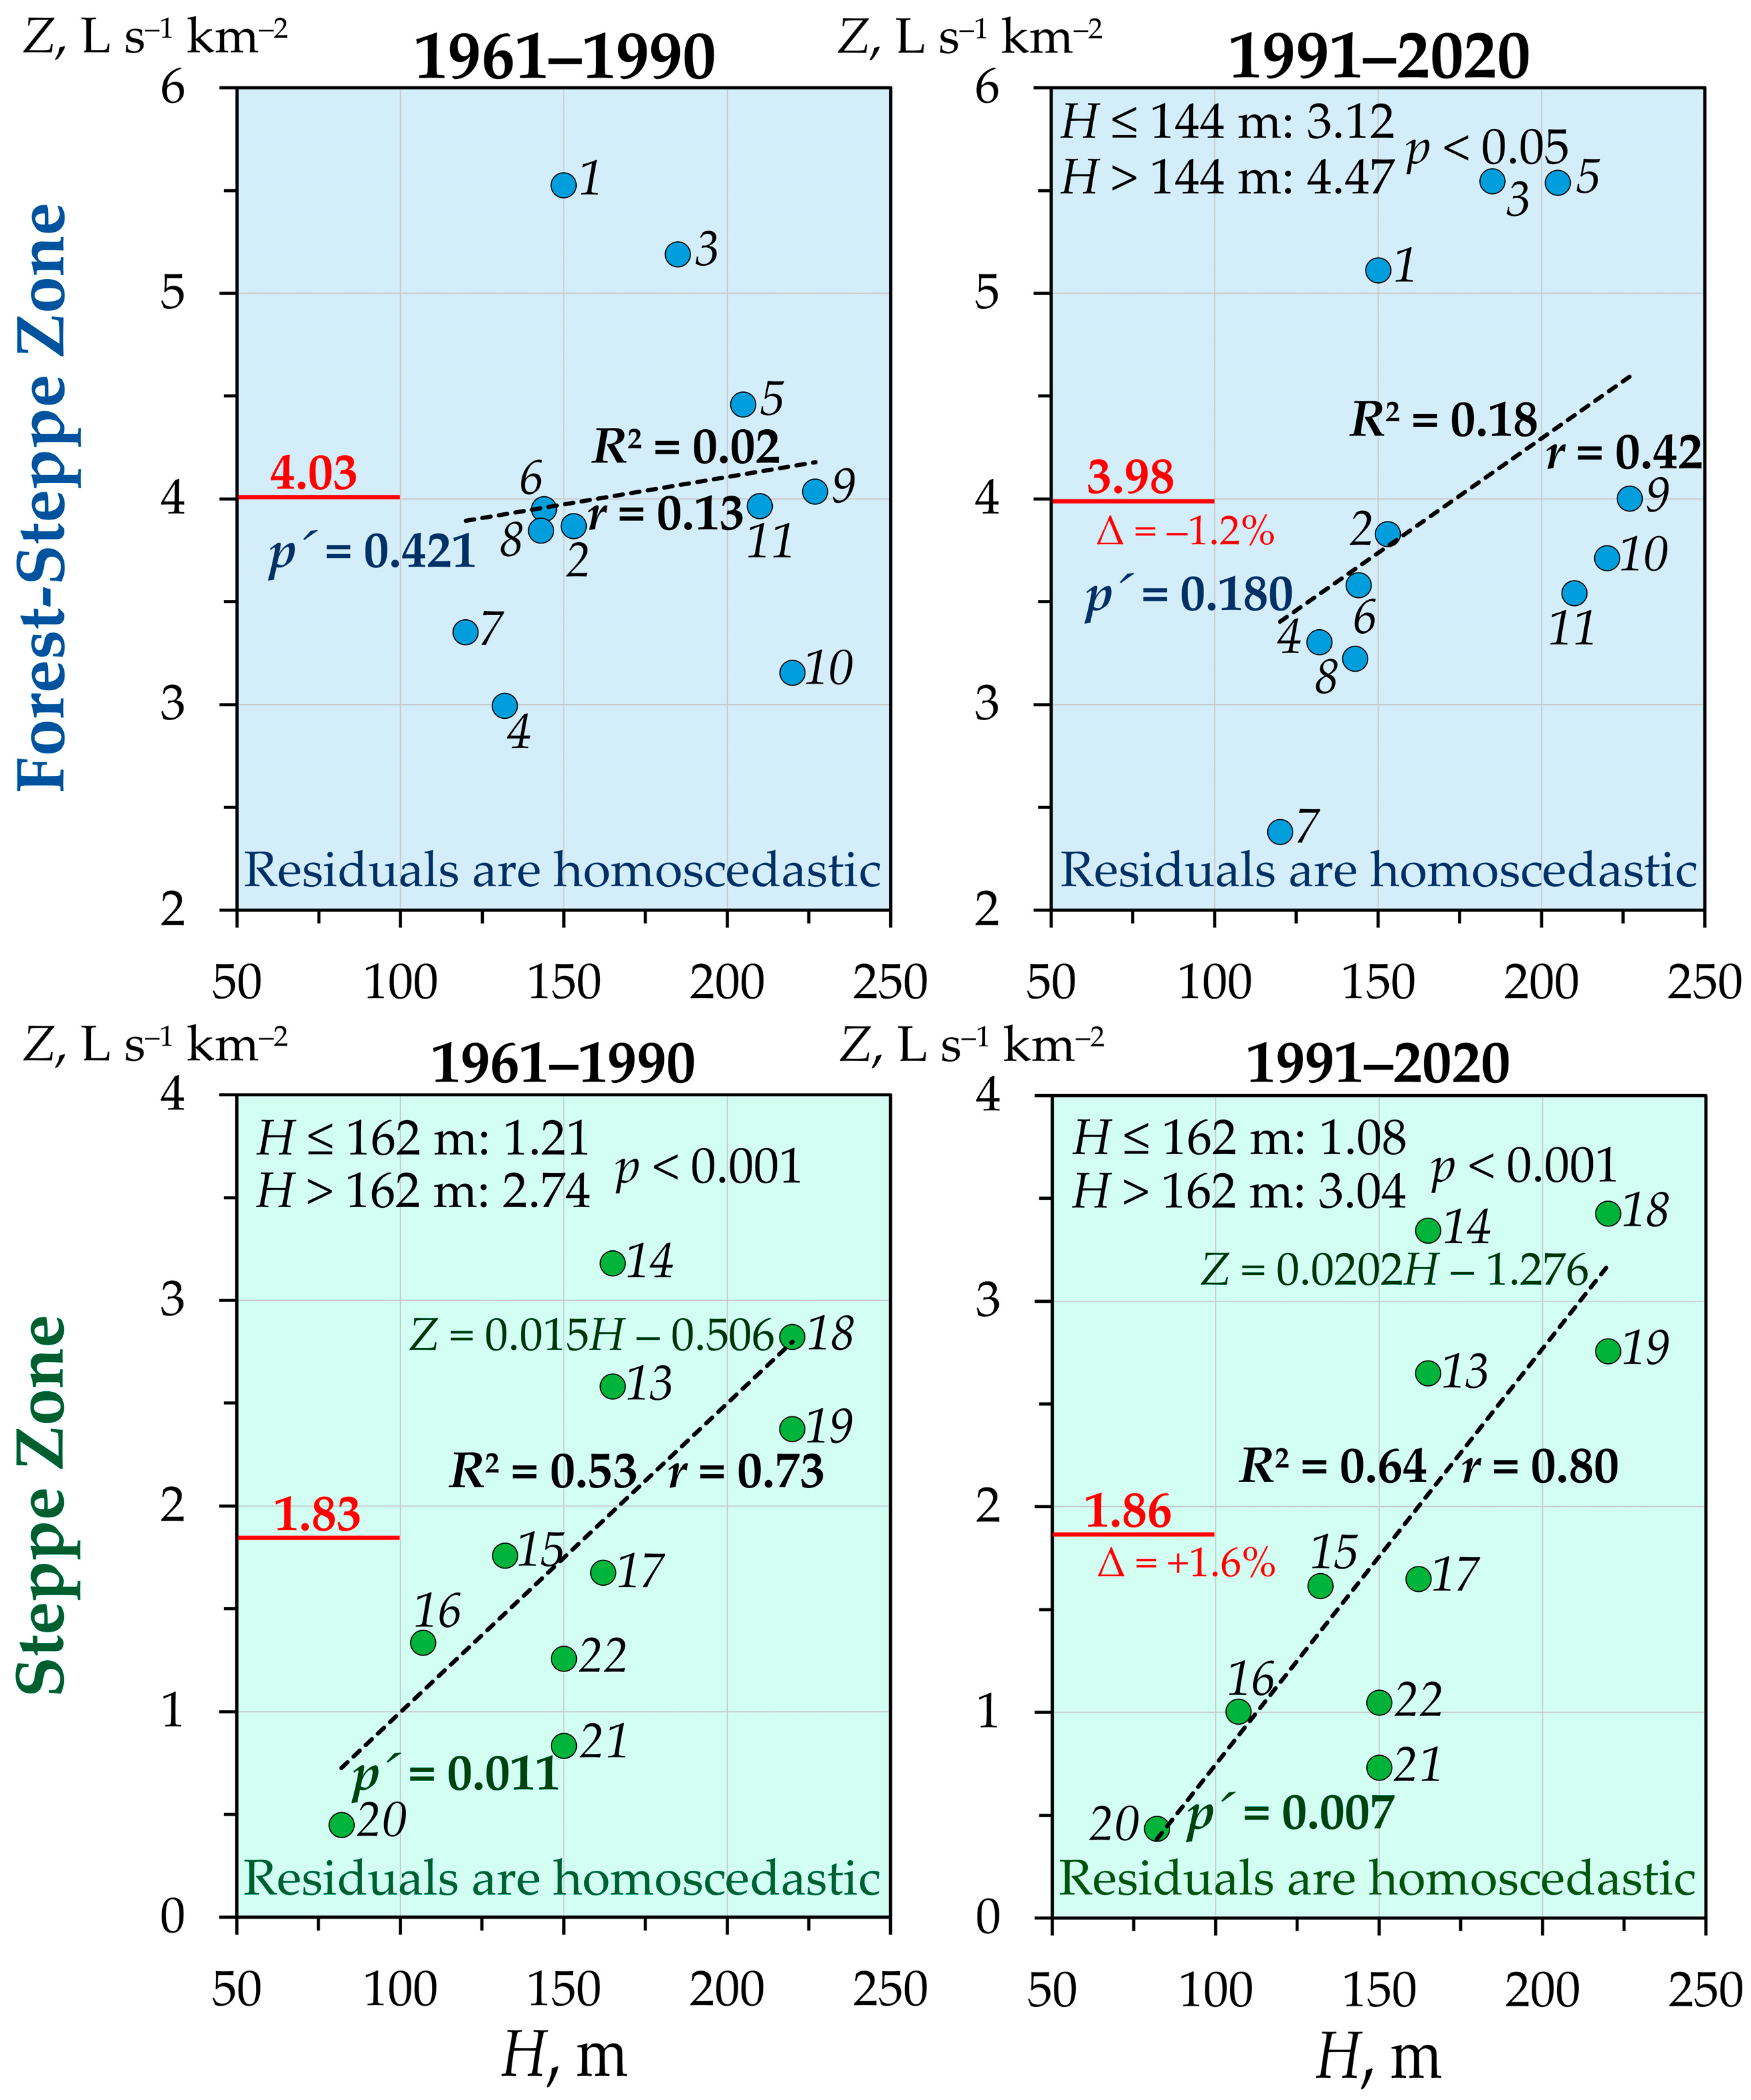
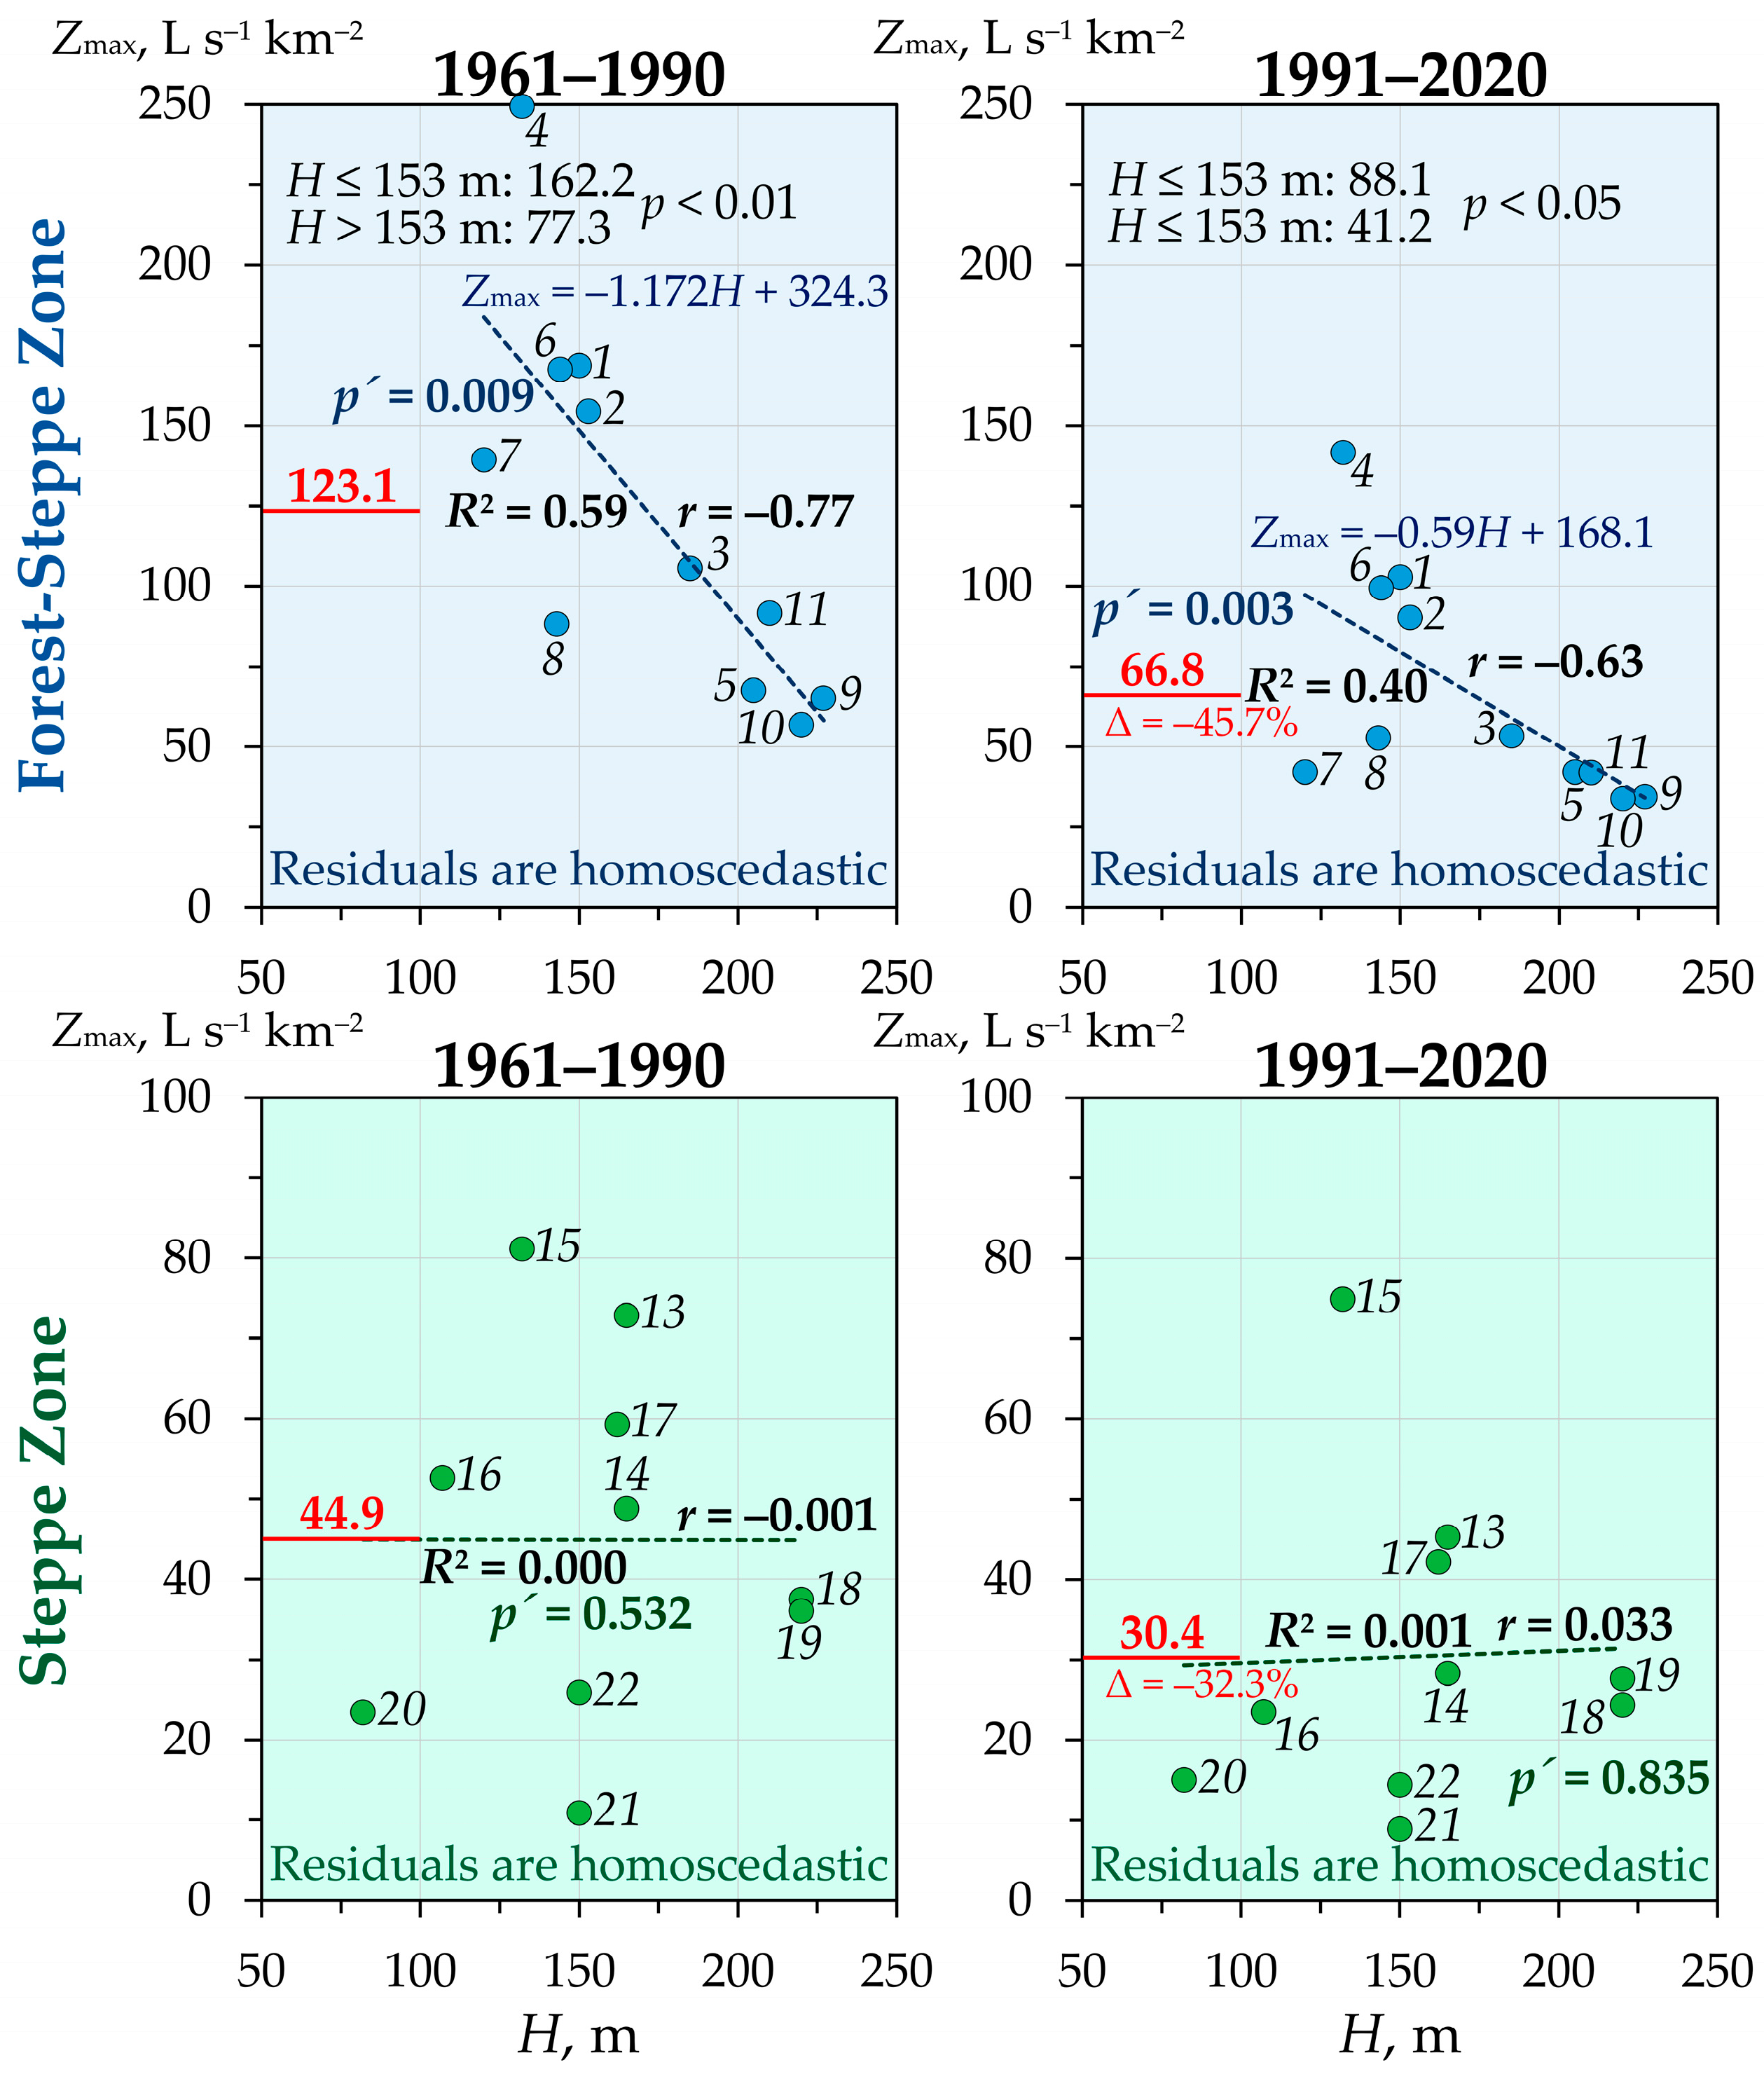
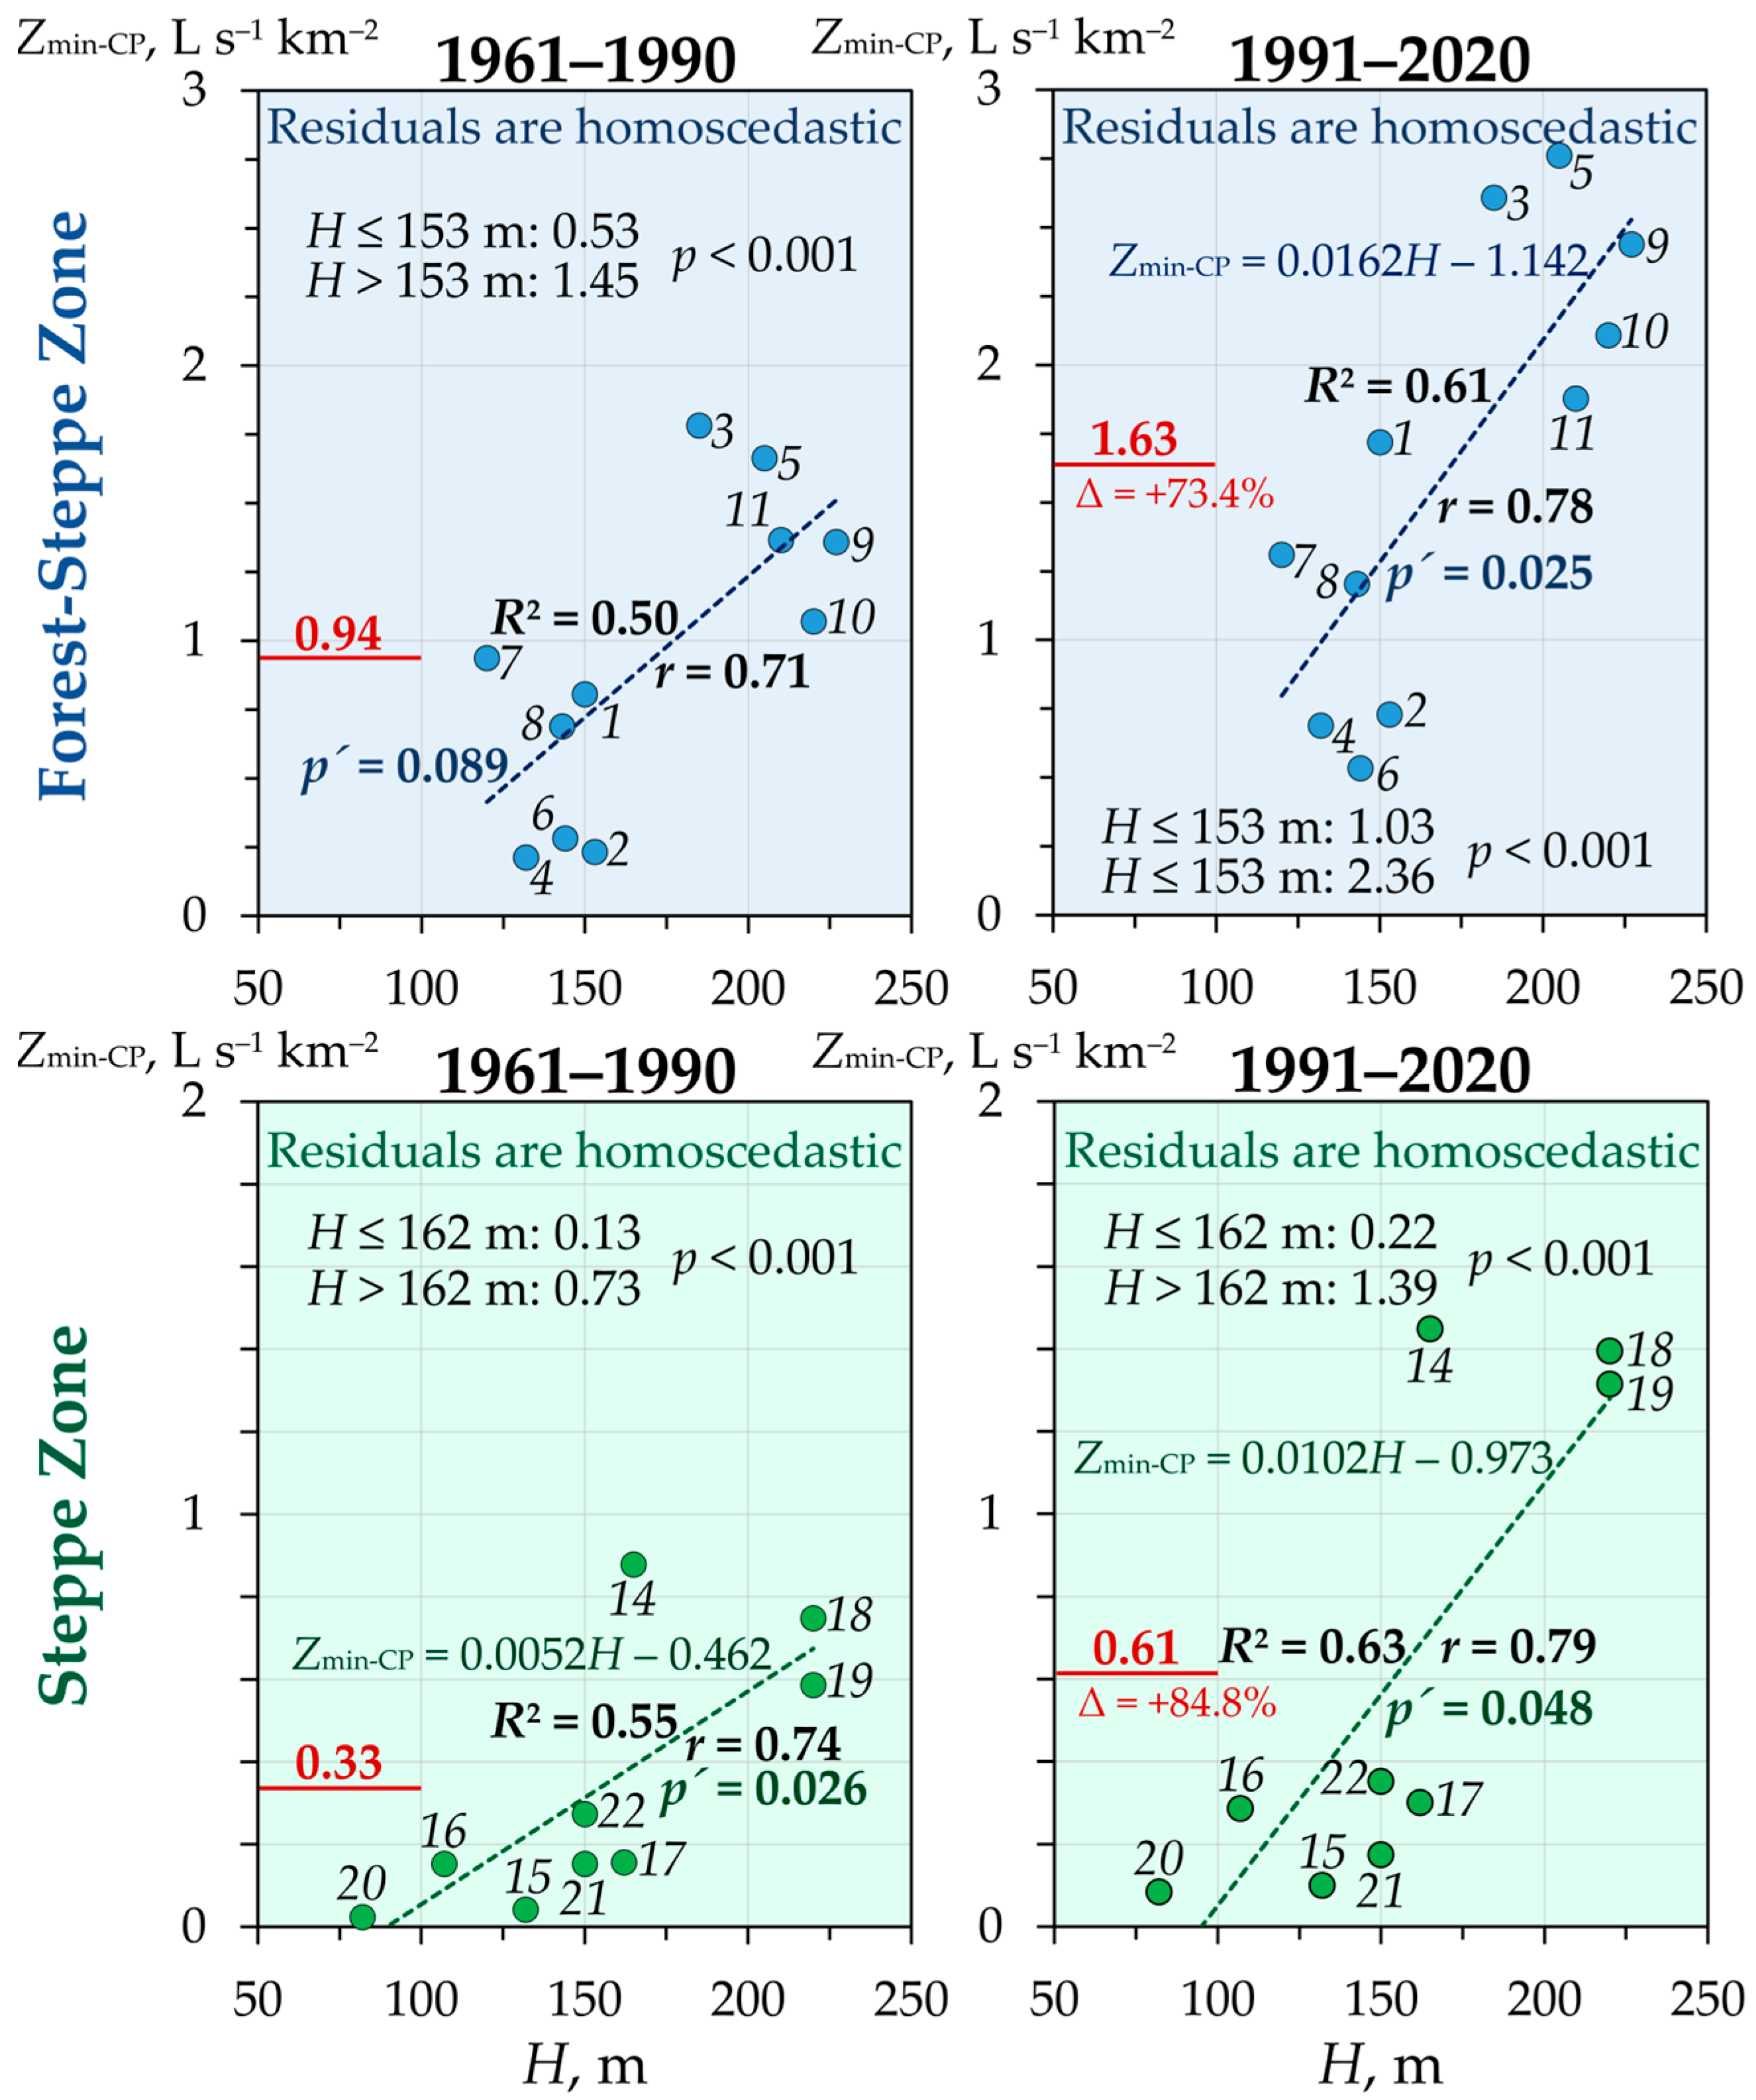
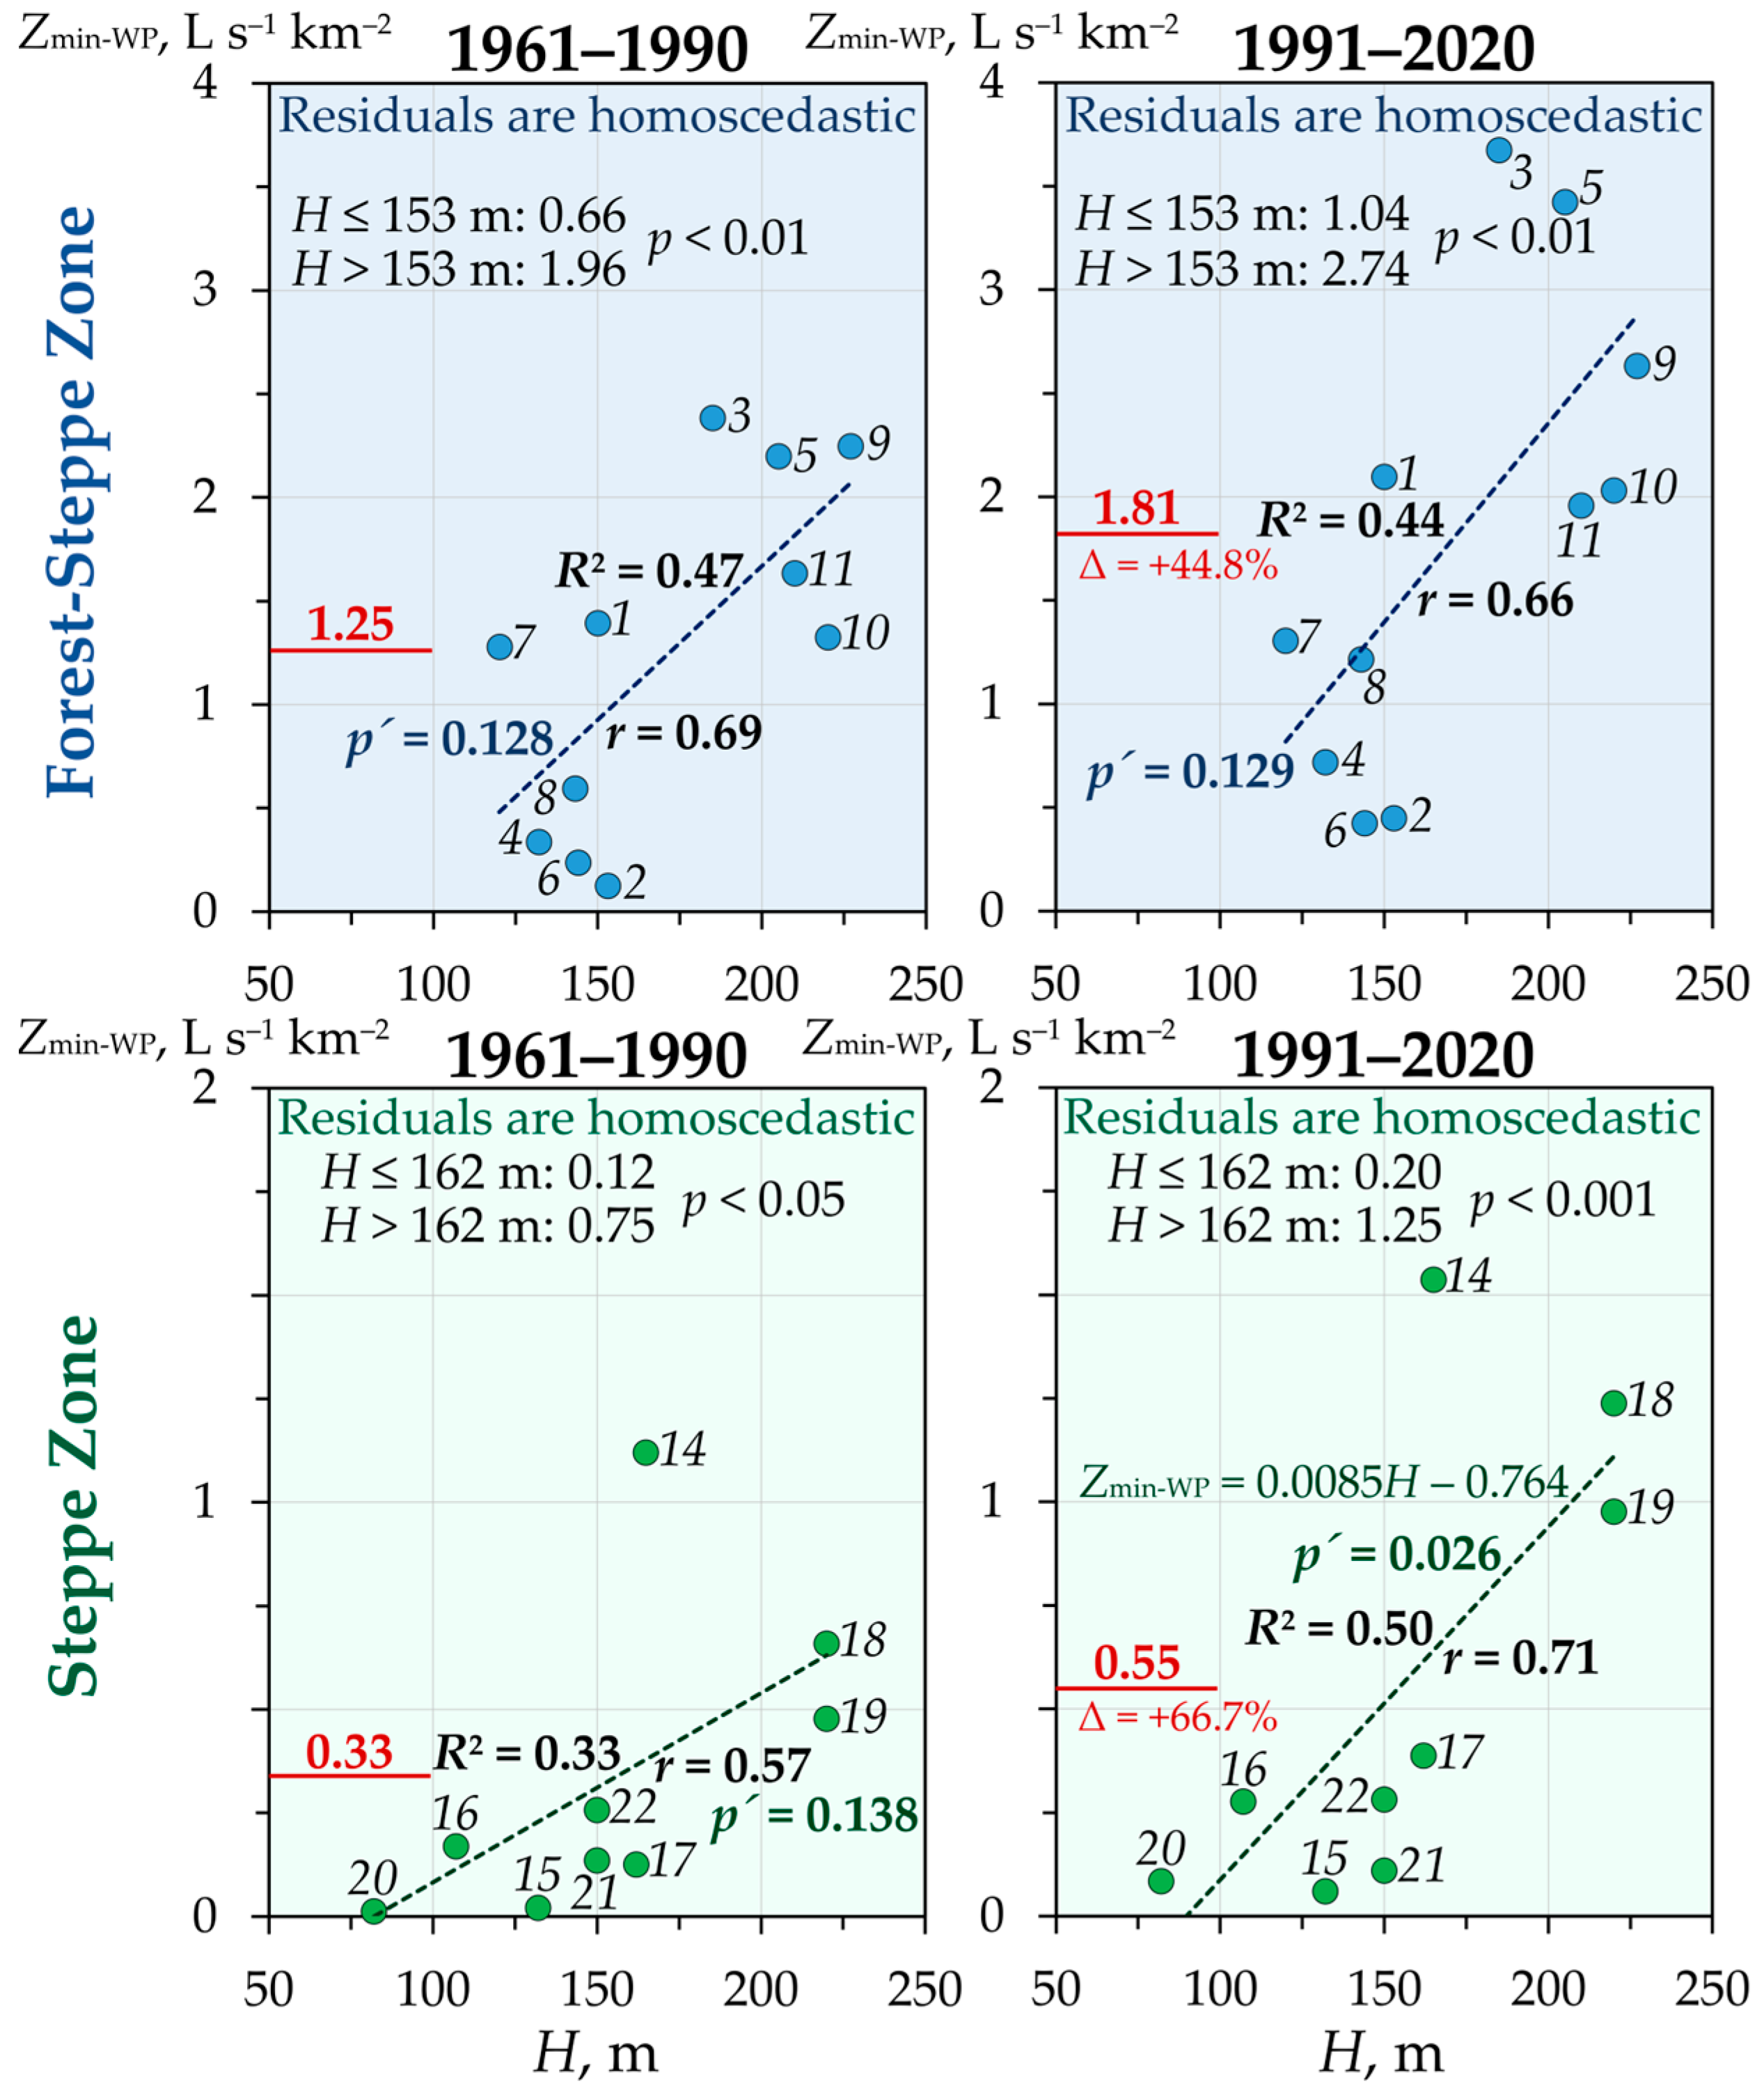
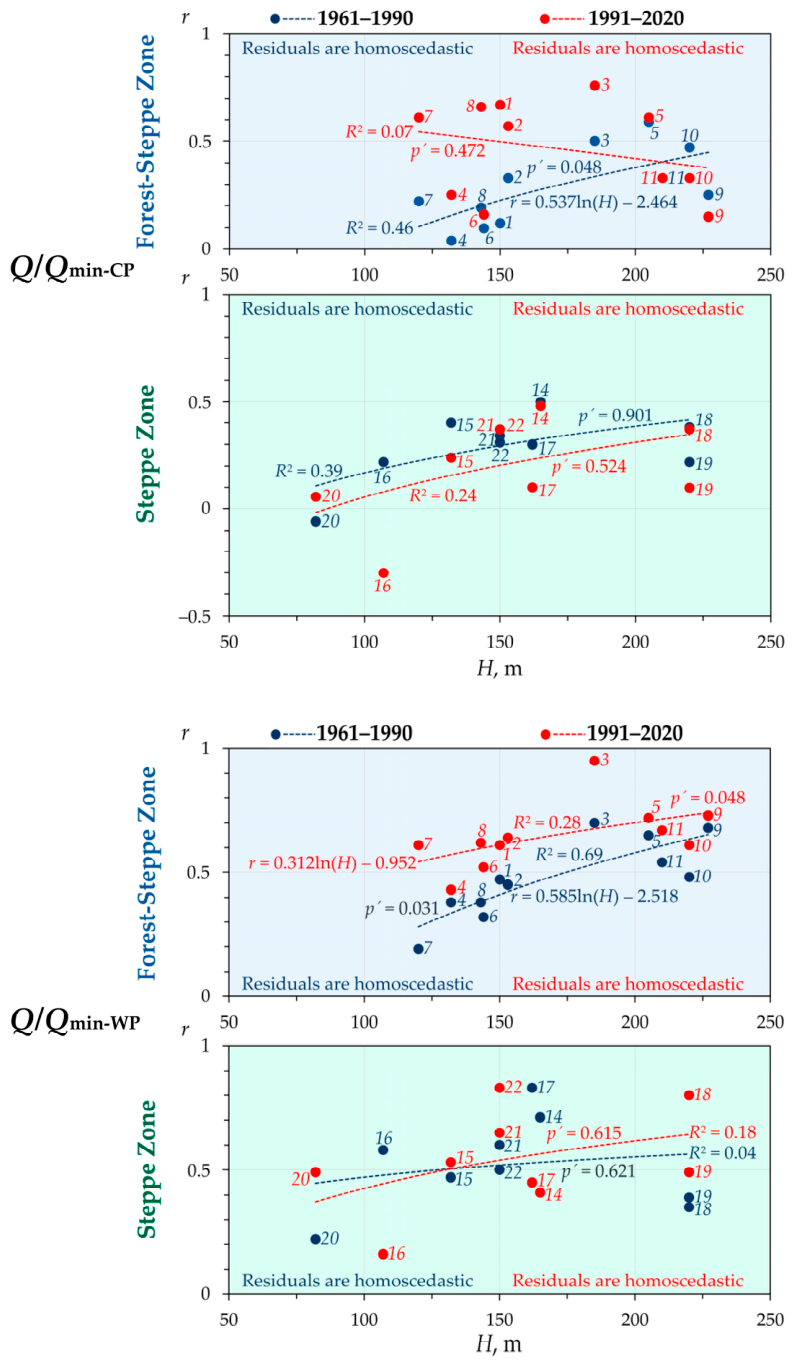
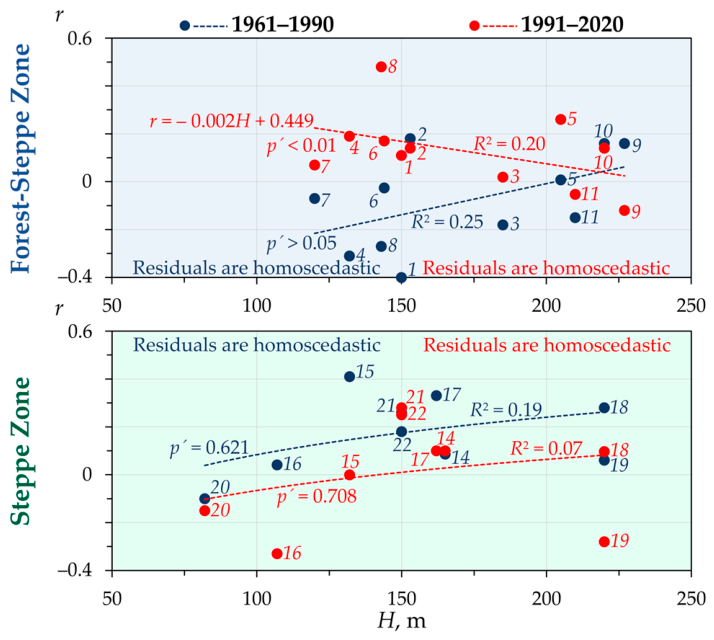
- Through the system of direct and inverse relationships, the considered relief factor H acted as the principal reason for the spatial variability of the annual average specific runoff within the river basins of the steppe zone in both baseline periods; the annual maximum specific runoff in the forest–steppe zone’s river basins in 1961–1990; and the minimum runoff of the cold season in both baseline periods and both landscape zones, except for 1961–1990 in the forest–steppe, where this relationship was not statistically significant (Table 2). With respect to the minimum runoff in the warm season, the positive influence of H was statistically significant only in the second baseline period in the steppe zone’s rivers, where its contribution amounted to half of the total contribution of the controlling factors (see Table 2).
- (b)
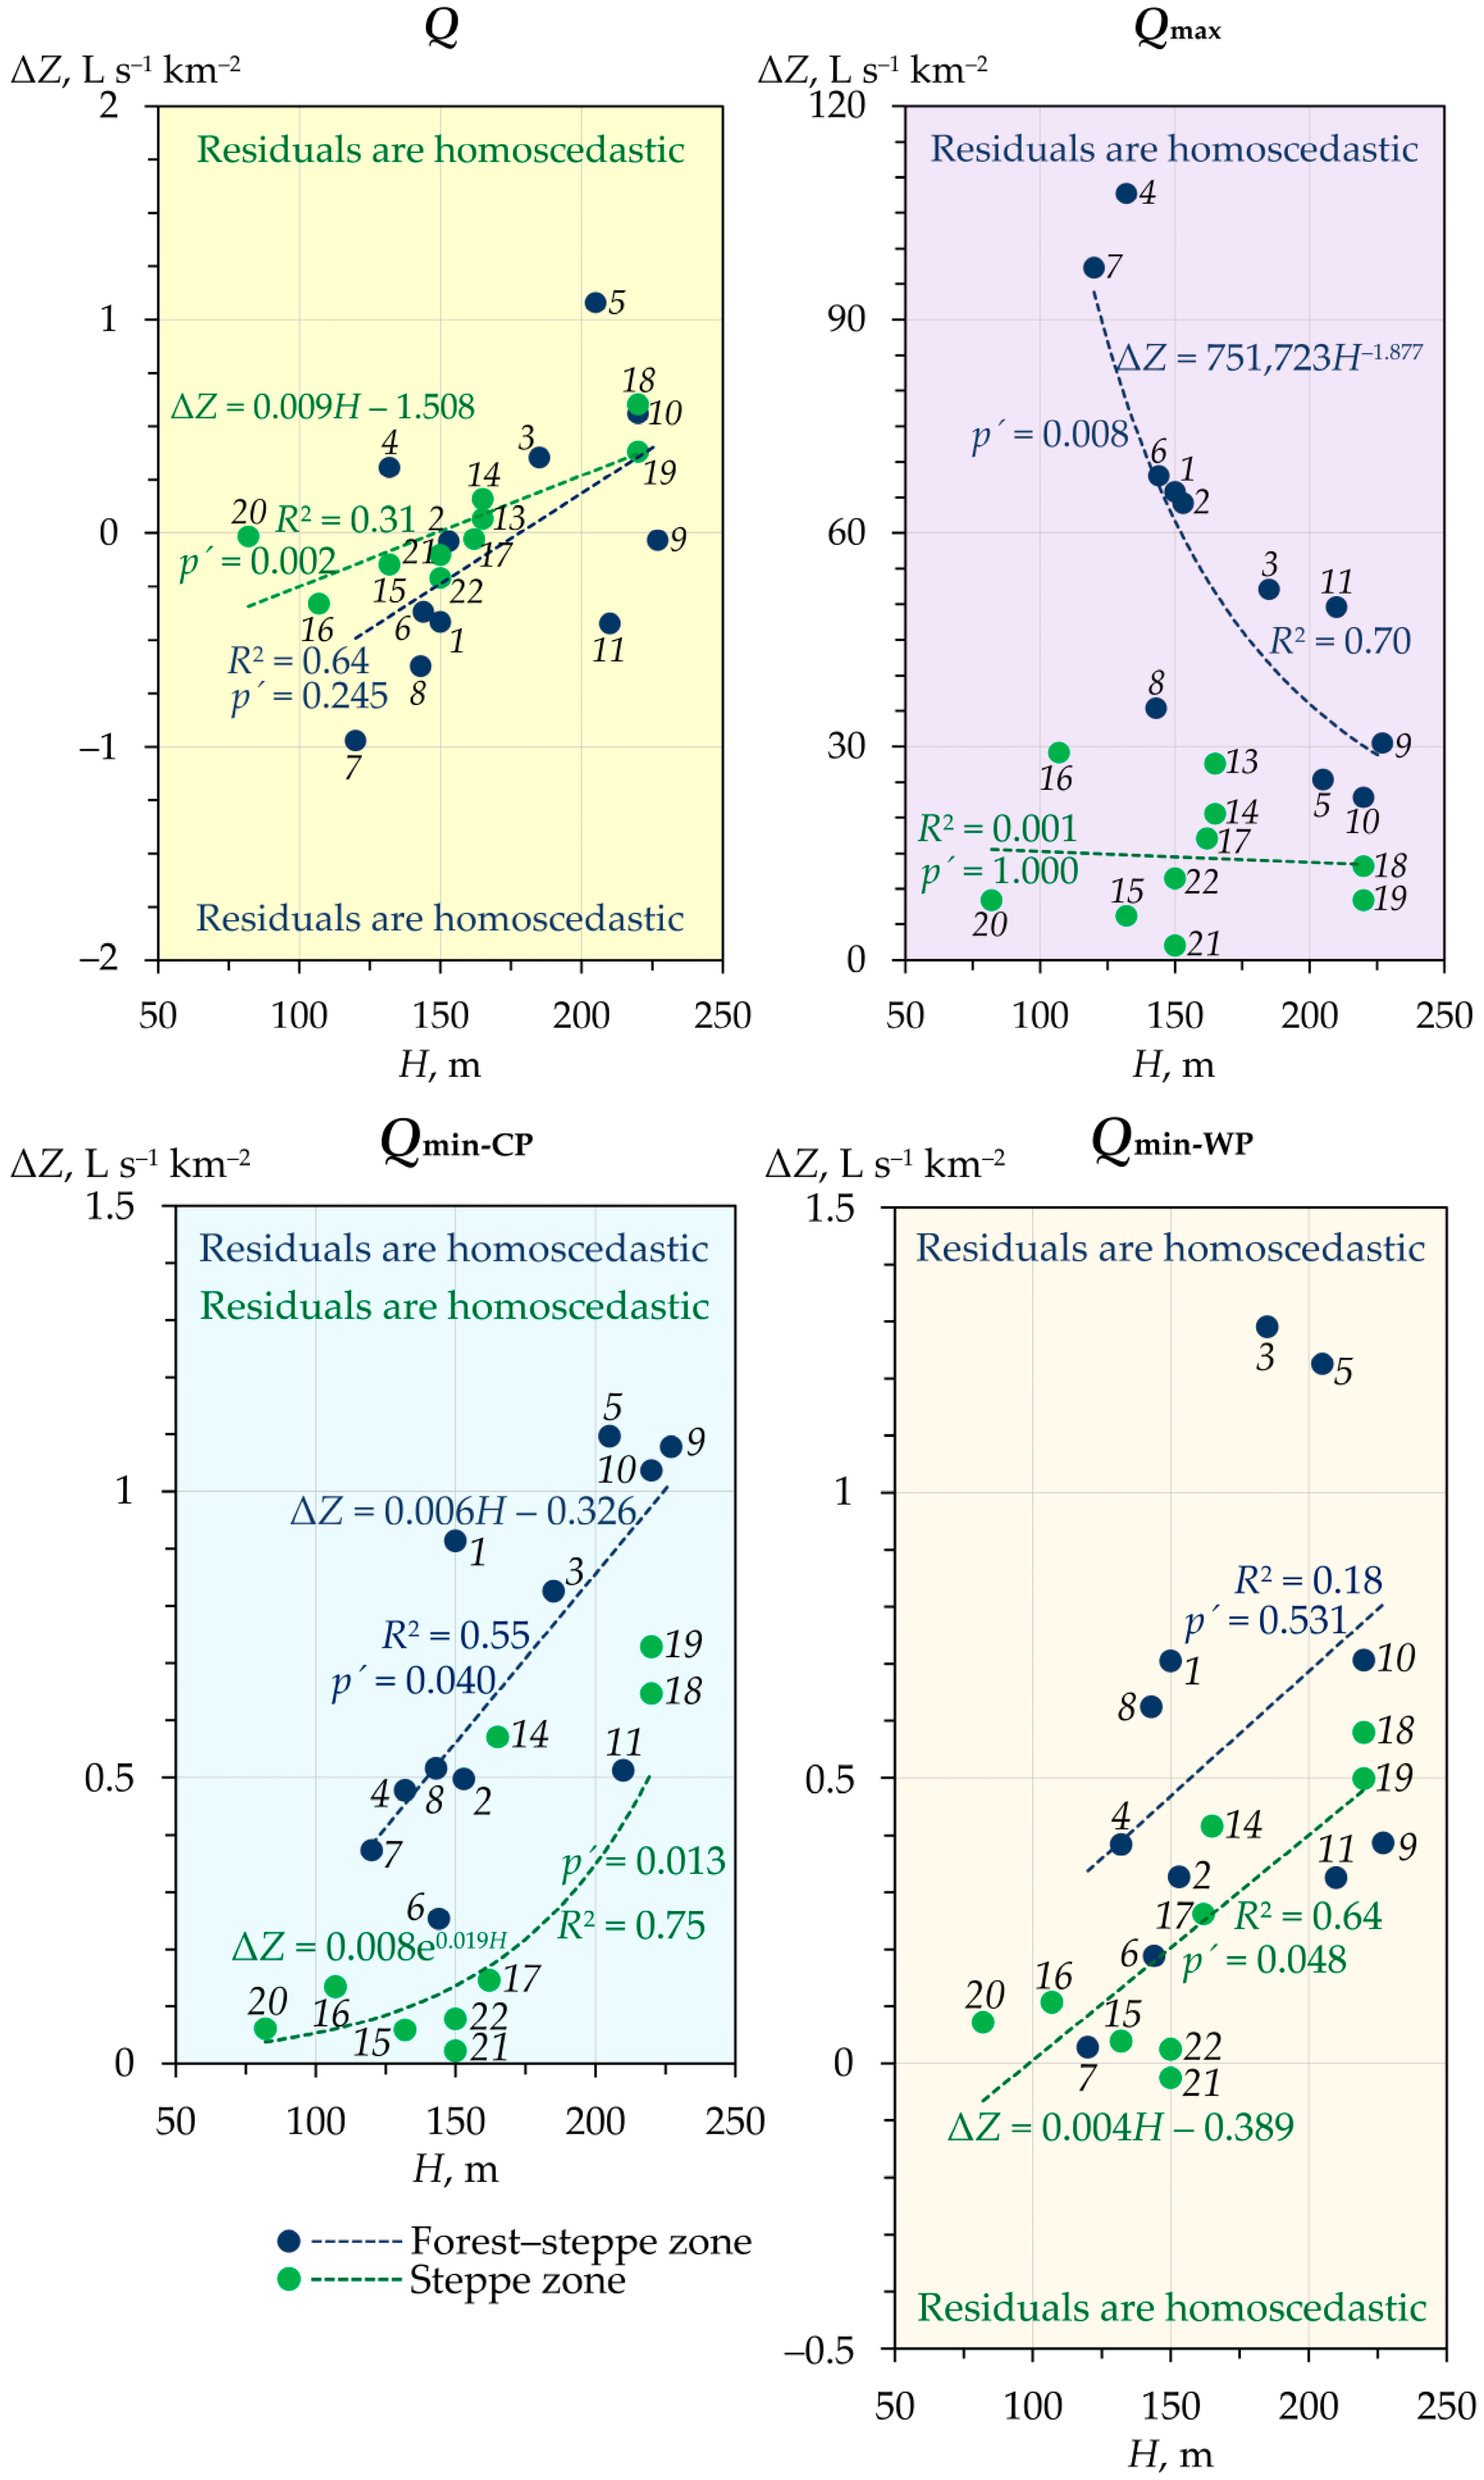
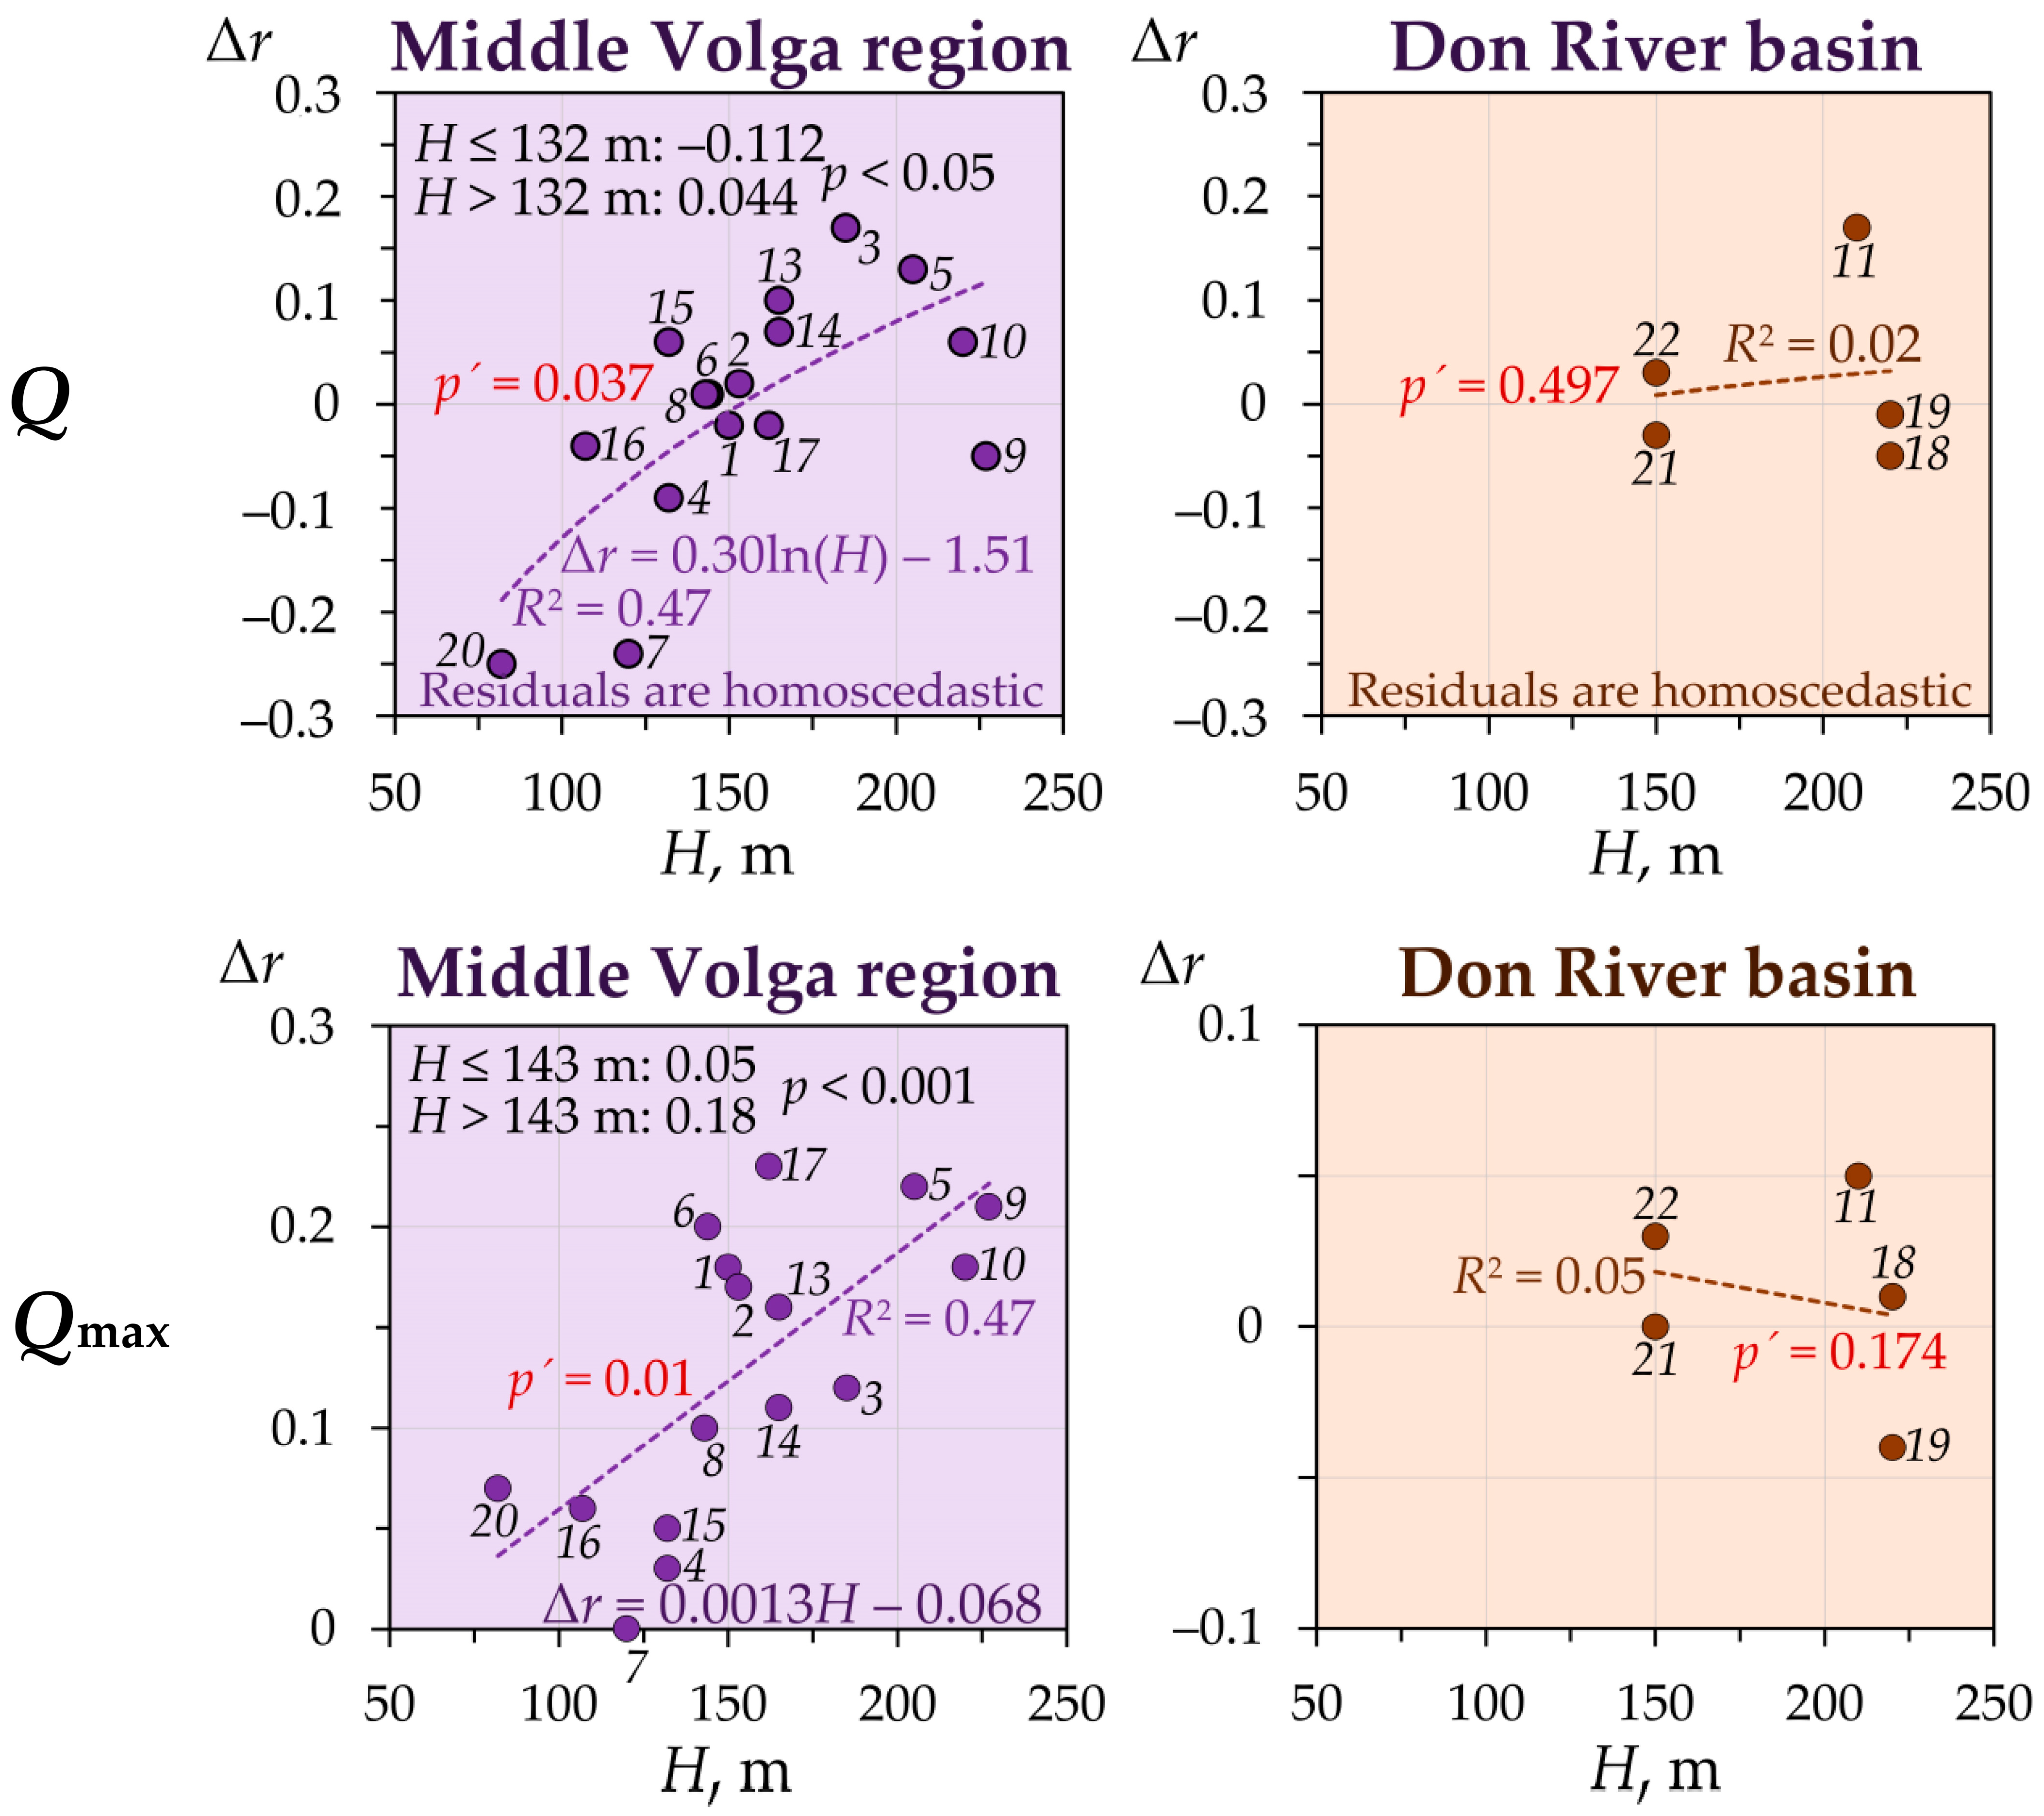
- In the interperiod trends of the Anthropocene, the analyzed relief factor H was the leading cause of spatial variability in the changes in the following parameter of specific runoff (ΔZ): Zmax in the forest–steppe zone, through the inverse relationships ΔZ = f(1/H); Zmin-CP in both zones, and Zmin-WP in the steppe zone through direct relationships, ΔZ = f(H) (see Table 2).
4.2. Terrain Elevation and Spatiotemporal Coherence of Runoff
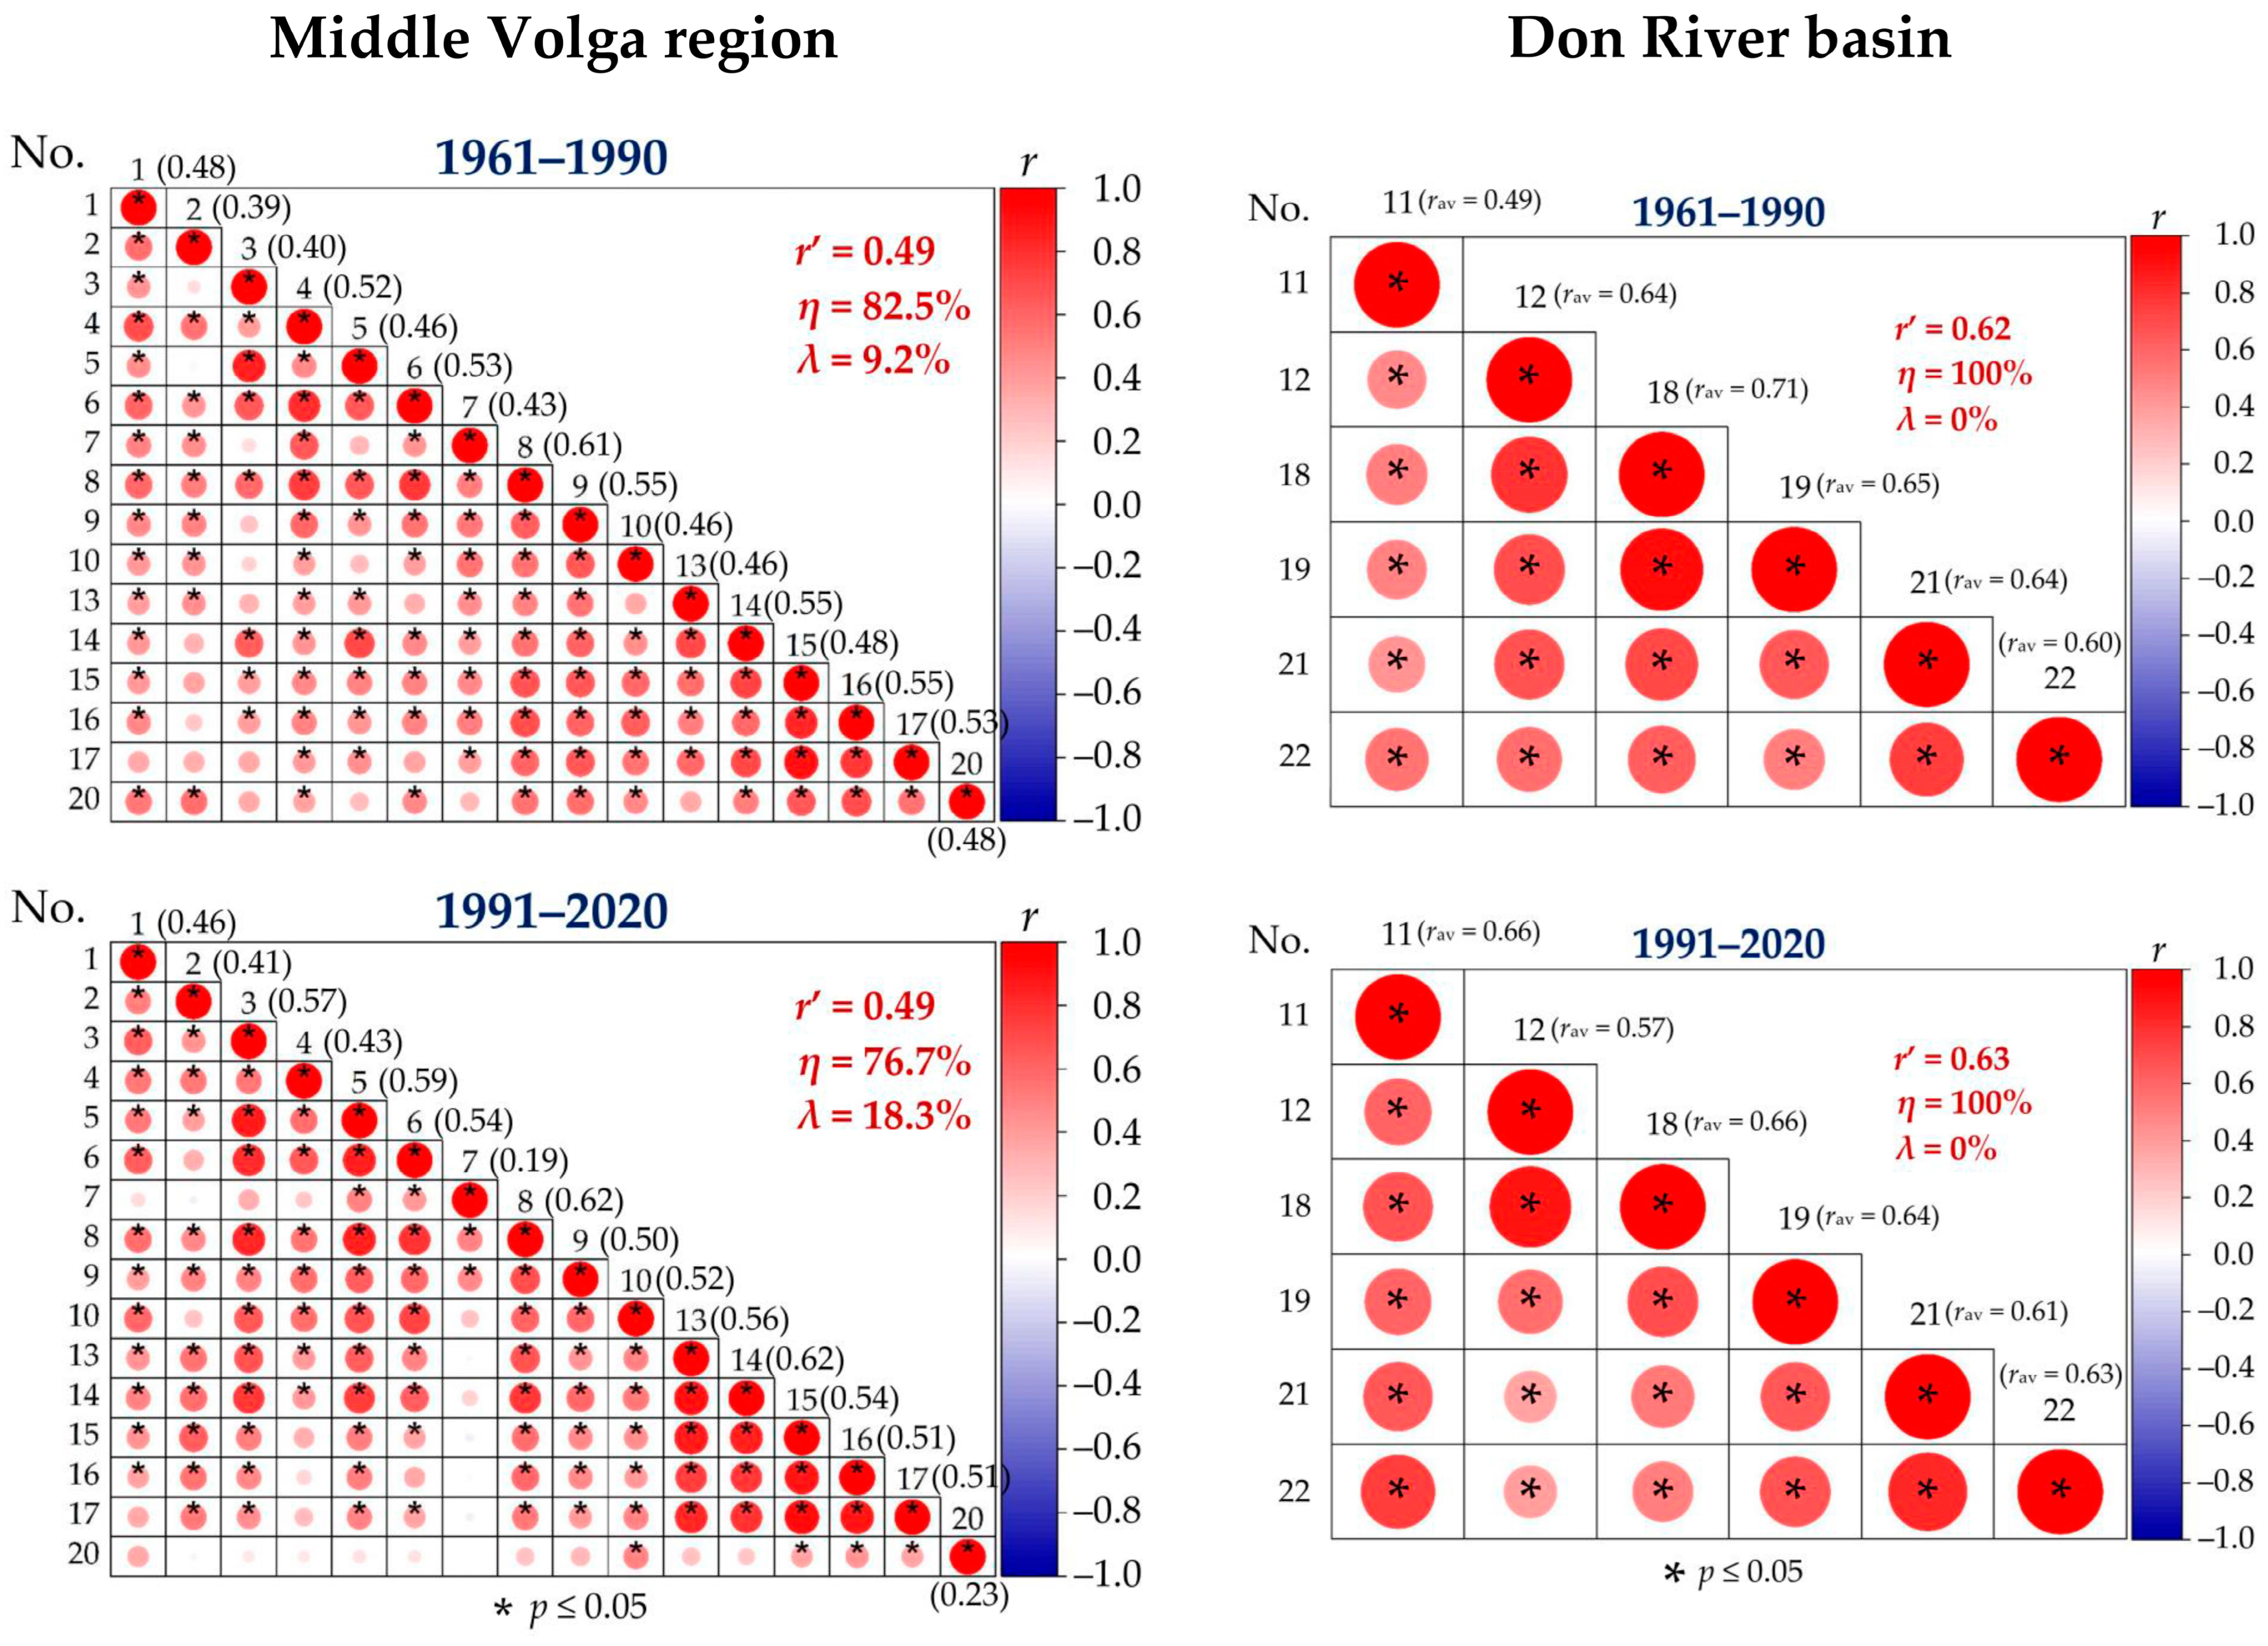
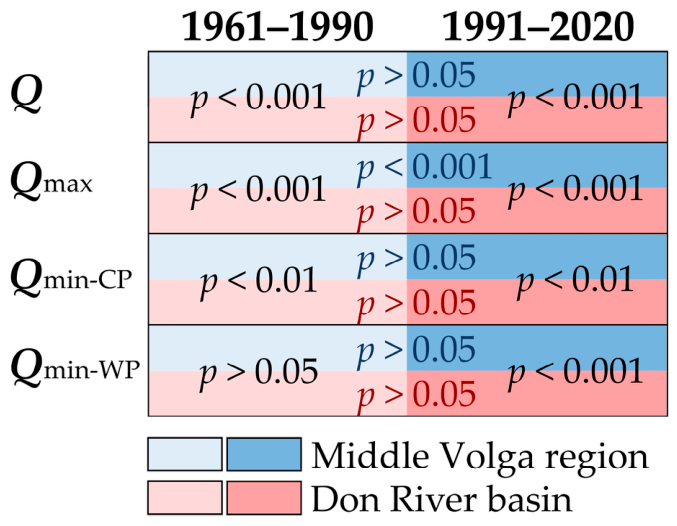
- During both studied baseline climatic periods, the spatiotemporal coherence of all the examined runoff parameters was higher in the rivers of the Don River basin than in the rivers of the Middle Volga region. These differences were statistically significant, except for Qmin-WP variability in 1961–1990 (Figure 11).
- For all the runoff parameters examined, the differences in subregion mean mutual correlation coefficients between 1961–1990 and 1991–2020 were statistically insignificant, except for Qmax variability in the Middle Volga region (see Figure 11).
4.3. Terrain Elevation and Intra-Annual Runoff Correlation
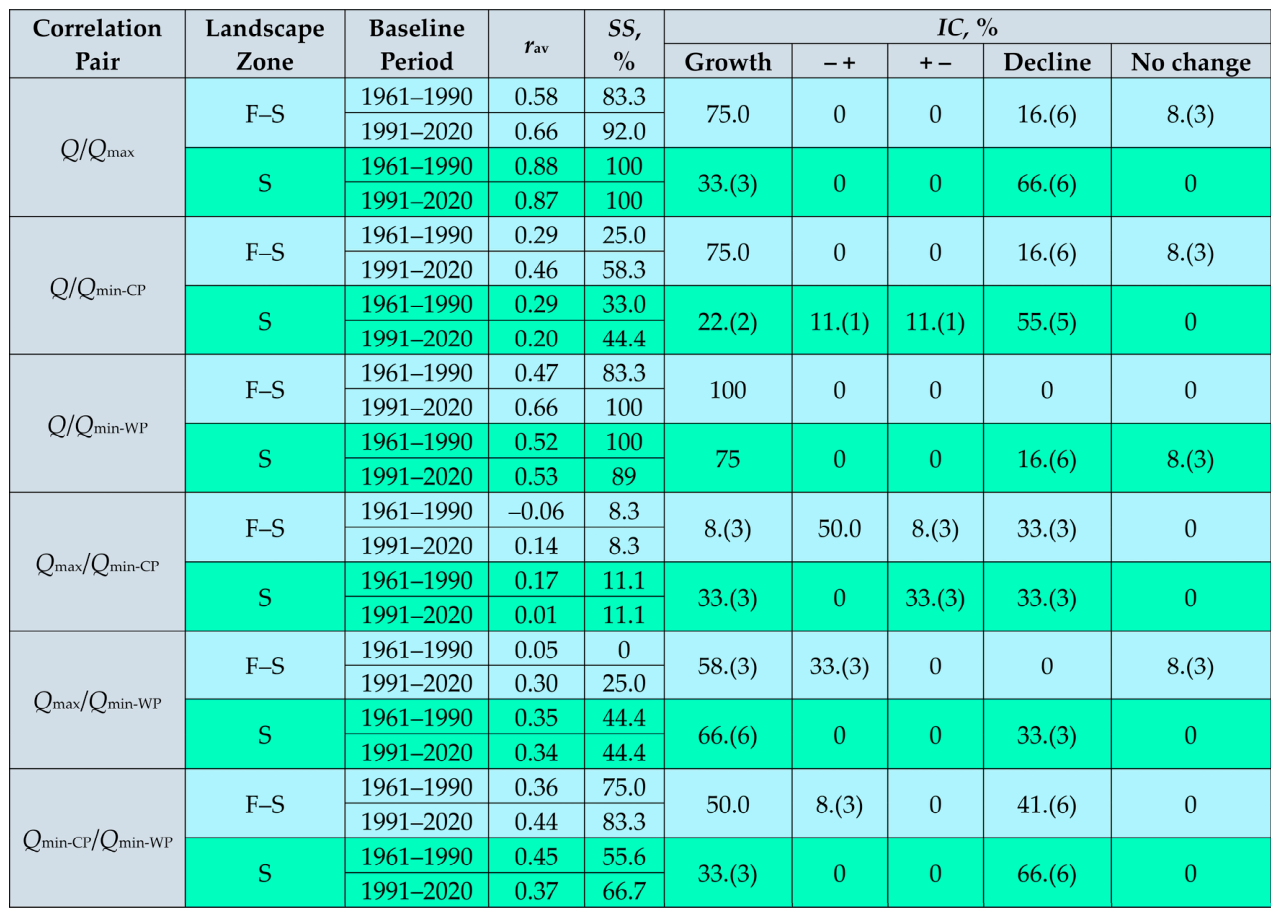
- During both baseline periods, a high correlation between Q and Qmax was observed, especially in the rivers of the steppe zone, where its coefficients were 100% statistically significant (Figure 13). This primarily indicates the still crucial role of spring snowmelt-induced flood runoff, the extreme indicator of which is the maximum runoff, in the formation of the annual runoff of the region’s rivers. Moreover, in the forest–steppe zone, there was even a relative increase in this role in 1991–2020 compared to the previous 30-year baseline period, according to the increased average correlation coefficient.
- The influence of the low-water runoff of the warm season (the extreme indicator of which is Qmin-WP) on annual runoff formation in both landscape zones can be considered relatively high (see Figure 13). The influence of low-water runoff during the cold season (according to Qmin-CP) on the formation of Q was less. However, it should be noted that the correlation of the minimum runoff of both cold and warm seasons with Q tended to increase in the forest–steppe zone in 1991–2020, which also indicates an increment in the influence of these two runoffs on annual runoff formation in this zone during the period of progressive climate warming in recent decades.
- The correlations between Qmax and the minimum runoff in both cold and warm seasons were generally positive, but in most cases statistically insignificant and relatively small in magnitude (see Figure 13). However, in most cases, this positive correlation tended to increase from the first baseline period to the second period.
- A positive correlation between Qmin-CP and Qmin-WP was also observed, which was statistically significant in most cases in both baseline periods, particularly in the forest–steppe. However, while it strengthened from the first to the second period in the forest–steppe, it weakened in the steppe environment (see Figure 13).
5. Discussion
6. Conclusions
Author Contributions
Funding
Data Availability Statement
Conflicts of Interest
Appendix A



References
- Gusarov, A.V.; Beylich, A.A. Anthropocene trends in water flow of small and medium-sized rivers in the east of the East European Plain: The forest-steppe and steppe zones. Hydrology 2025, 12, 242. [Google Scholar] [CrossRef] [Scilit]
- Syvitski, J.P.M.; Vörösmarty, C.J.; Kettner, A.; Green, P. Impacts of humans on the flux of terrestrial sediment to the global coastal ocean. Science 2005, 308, 376–380. [Google Scholar] [CrossRef] [Scilit]
- Poesen, J. Soil erosion in the Anthropocene: Research needs. Earth Surf. Process. Landf. 2018, 43, 64–84. [Google Scholar] [CrossRef] [Scilit]
- Cendrero, A.; Remondo, J.; Beylich, A.A.; Cienciala, P.; Forte, L.M.; Golosov, V.N.; Gusarov, A.V.; Kijowska-Strugała, M.; Laute, K.; Li, D.; et al. Denudation and geomorphic change in the Anthropocene; a global overview. Earth-Sci. Rev. 2022, 233, 104186. [Google Scholar] [CrossRef] [Scilit]
- Syvitski, J.; Restrepo-Ángel, J.; Saito, Y.; Overeem, I.; Vörösmarty, C.J.; Wang, H.; Olago, D. Earth’s sediment cycle during the Anthropocene. Nat. Rev. Earth Environ. 2022, 3, 179–196. [Google Scholar] [CrossRef] [Scilit]
- O’Hara, K.D. Climate Change in the Anthropocene; Elsevier: Amsterdam, The Netherlands; Oxford, UK; Cambridge, MA, USA, 2022. [Google Scholar]
- Gleeson, T.; Cuthbert, M.; Ferguson, G.; Perrone, D. Global Groundwater Sustainability, Resources, and Systems in the Anthropocene. Annu. Rev. Earth Planet. Sci. 2020, 48, 431–463. [Google Scholar] [CrossRef] [Scilit]
- Cao, Z.; Wang, S.; Luo, P.; Xie, D.; Zhu, W. Watershed Ecohydrological Processes in a Changing Environment: Opportunities and Challenges. Water 2022, 14, 1502. [Google Scholar] [CrossRef] [Scilit]
- Williams, M.; Zalasiewicz, J.; Haff, P.; Schwägerl, C.; Barnosky, A.D.; Ellis, E.C. The Anthropocene biosphere. Anthr. Rev. 2015, 2, 196–219. [Google Scholar] [CrossRef] [Scilit]
- Collier, M.J.; Devitt, C. Novel ecosystems: Challenges and opportunities for the Anthropocene. Anthr. Rev. 2016, 3, 231–242. [Google Scholar] [CrossRef] [Scilit]
- Vellend, M.; Baeten, L.; Becker-Scarpitta, A.; Boucher-Lalonde, V.; McCune, J.L.; Messier, J.; Myers-Smith, I.H.; Sax, D.F. Plant biodiversity change across scales during the Anthropocene. Annu. Rev. Plant Biol. 2017, 68, 563–586. [Google Scholar] [CrossRef] [Scilit] [PubMed]
- Sun, G.; Hallema, D.; Asbjornsen, H. Ecohydrological processes and ecosystem services in the Anthropocene: A review. Ecol. Process. 2017, 6, 35. [Google Scholar] [CrossRef] [Scilit]
- Silveira dos Santos, J.; Dodonov, P.; Oshima, J.E.F.; Martello, F.; Santos de Jesus, A.; Ferreira, M.E.; Silva-Neto, C.M.; Ribeiro, M.C.; Collevatti, R.G. Landscape ecology in the Anthropocene: An overview for integrating agroecosystems and biodiversity conservation. Perspect. Ecol. Conserv. 2021, 19, 21–32. [Google Scholar] [CrossRef] [Scilit]
- Stevens, N.; Bond, W.; Feurdean, A.; Lehmann, C.E.R. Grassy ecosystems in the Anthropocene. Annu. Rev. Environ. Resour. 2022, 47, 261–289. [Google Scholar] [CrossRef] [Scilit]
- Jarne, P. The Anthropocene and the biodiversity crisis: An eco-evolutionary perspective. Comptes Rendus Biol. 2025, 348, 1–20. [Google Scholar] [CrossRef] [Scilit] [PubMed]
- Zaman, W.; Ayaz, A.; Puppe, D. Biogeochemical Cycles in Plant–Soil Systems: Significance for Agriculture, Interconnections, and Anthropogenic Disruptions. Biology 2025, 14, 433. [Google Scholar] [CrossRef] [Scilit]
- Lewis, S.; Maslin, M.A. Defining the Anthropocene. Nature 2015, 519, 171–180. [Google Scholar] [CrossRef] [Scilit]
- Zalasiewicz, J.; Waters, C.N.; Williams, M.; Barnosky, A.D.; Cearreta, A.; Crutzen, P.; Ellis, E.; Ellis, M.A.; Fairchild, I.J.; Grinevald, J.; et al. When did the Anthropocene begin? A mid-twentieth century boundary level is stratigraphically optimal. Quat. Int. 2015, 383, 204–207. [Google Scholar] [CrossRef] [Scilit]
- Steffen, W.; Leinfelder, R.; Zalasiewicz, J.; Waters, C.N.; Williams, M.; Summerhayes, C.; Barnosky, A.D.; Cearreta, A.; Crutzen, P.; Edgeworth, M.; et al. Stratigraphic and Earth System approaches to defining the Anthropocene. Earth’s Future 2016, 4, 324–345. [Google Scholar] [CrossRef] [Scilit]
- Kiselev, A.A. (Ed.) Third Assessment Report on Climate Change and Its Consequences in the Russian Federation; Science-Intensive Technologies Publishing: Saint Petersburg, Russia, 2022. Available online: https://www.meteorf.gov.ru/upload/pdf_download/compressed.pdf (accessed on 11 March 2026). (In Russian)
- Krenke, A.N.; Kitaev, L.M.; Turkov, D.V. Climatic role of snow changes in the warming period. RAS Bull. Ser. Geogr. 2001, 4, 44–52. (In Russian) [Google Scholar]
- Chernokulsky, A.; Kozlov, F.; Zolina, O.; Bulygina, O.; Mokhov, I.I.; Semenov, V.A. Observed changes in convective and stratiform precipitation in Northern Eurasia over the last five decades. Environ. Res. Lett. 2019, 14, 045001. [Google Scholar] [CrossRef] [Scilit]
- Mukhin, G.D. Ecological-economic assessment of land use structure within the European territory of Russia during two recent decades. Vestn. Mosk. Univ. Ser. 5 Geogr. 2012, 5, 19–28. (In Russian) [Google Scholar]
- Prishchepov, A.V.; Müller, D.; Dubinin, M.; Baumann, M.; Radeloff, V.C. Determinants of agricultural land abandonment in post-Soviet European Russia. Land Use Policy 2013, 30, 873–884. [Google Scholar] [CrossRef] [Scilit]
- Lyuri, D.I.; Nekrich, A.S.; Karelin, D.V. Cropland dynamics in Russia in 1990–2015 and soil emission of carbon dioxide. Vest. Mosk. Univ. Ser. 5 Geogr. 2018, 3, 70–76. (In Russian) [Google Scholar]
- Nekrich, A.S.; Lyuri, D.I. Changes of the dynamic of agrarian lands of Russia in 1990–2014. Izv. Ross. Akad. Nauk. Seriya Geogr. 2019, 3, 64–77. (In Russian) [Google Scholar] [CrossRef] [Scilit]
- Gusarov, A.V. Land-use/-cover changes and their effect on soil erosion and river suspended sediment load in different landscape zones of European Russia during 1970–2017. Water 2021, 13, 1631. [Google Scholar] [CrossRef] [Scilit]
- Gelfan, A.N.; Frolova, N.L.; Magritsky, D.V.; Kireeva, M.B.; Grigoriev, V.Y.; Motovilov, Y.G.; Gusev, E.M. Climate change impact on the annual and maximum runoff of Russian rivers: Diagnosis and projections. Izv. Atmos. Ocean. Phys. 2023, 59, 153–169. [Google Scholar] [CrossRef] [Scilit]
- Frolova, N.L.; Kireeva, M.B.; Agafonova, S.A.; Yevstigneev, V.M.; Yefremova, N.A.; Povalishnikova, Y.S. Intra-annual distribution of the plain river discharges within the European Russia and its change. Water Sect. Russ. Probl. Technol. Manag. 2015, 4, 4–20. (In Russian) [Google Scholar]
- Frolova, N.L.; Agafonova, S.; Kireeva, M.B.; Povalishnikova, E.S.; Pakhomova, O.M. Recent changes of annual flow distribution of the Volga basin rivers. Geogr. Environ. Sustain. 2017, 10, 28–39. [Google Scholar] [CrossRef] [Scilit]
- Blöschl, G.; Hall, J.; Viglione, A.; Perdigão, R.A.P.; Parajka, J.; Merz, B.; Lun, D.; Arheimer, B.; Aronica, G.T.; Bilibashi, A.; et al. Changing climate both increases and decreases European river floods. Nature 2019, 573, 108–111. [Google Scholar] [CrossRef] [Scilit]
- Gusarov, A.V. The response of water flow, suspended sediment yield and erosion intensity to contemporary long-term changes in climate and land use/cover in river basins of the Middle Volga Region, European Russia. Sci. Total Environ. 2020, 719, 134770. [Google Scholar] [CrossRef] [Scilit]
- Alpatyev, A.M.; Arkhangelsky, A.M.; Podoplelov, N.Y.; Stepanov, A.Y. Physical Geography of the USSR (Zones of the USSR, the European Part, the Caucasus, and the Urals), 2nd ed.; Higher School: Moscow, Russia, 1976. (In Russian) [Google Scholar]
- Levitin, I.E.; Borodko, A.V. (Eds.) National Atlas of Russia. Chapter 2 “Environment (Nature). Ecology”; Roskartografiya Publishing: Moscow, Russia, 2007; Available online: https://nationalatlas.ru/ (accessed on 11 March 2026). (In Russian)
- Dedkov, A.P.; Mozzherin, V.I. Erosion and Sediment Yield on Earth; Kazan University Publishing: Kazan, Russia, 1984. (In Russian) [Google Scholar]
- Butakov, G.P.; Gleiser, I.V.; Dedkov, A.P.; Yermolaev, O.P.; Korotina, N.M.; Mozzherin, V.I. Shilovka’s vicinities. In Middle Volga River. Geomorphological Guide; Dedkov, A.P., Ed.; Kazan University Publishing: Kazan, Russia, 1991; pp. 96–117. (In Russian) [Google Scholar]
- Barabanov, A.T.; Petelko, A.I. Factors of slope spring runoff on gray forest soils in the central forest-steppe. Lomonosov Geogr. J. 2023, 78, 18–27. (In Russian) [Google Scholar] [CrossRef] [Scilit]
- Dzhamalov, R.G.; Rets, E.P.; Bugrov, A.A.; Frolova, N.L. Formation of current groundwater resources in European Russia. Water Resour. 2015, 42, 563–571. [Google Scholar] [CrossRef] [Scilit]
- Dzhamalov, R.G.; Frolova, N.L.; Kireeva, M.B. Current changes in river water regime in the Don River basin. Water Resour. 2013, 40, 573–584. [Google Scholar] [CrossRef] [Scilit]
- Perevedentsev, Y.P.; Mirsaeva, N.A.; Pavlova, V.N. Modern Regional Climate Change and Its Consequences; Kazan University Publishing: Kazan, Russia, 2024. (In Russian) [Google Scholar]
- Filippova, I.A. Minimum Flow of Rivers in the European Territory of Russia and Its Assessment in the Context of Climate Change. Ph.D. Thesis, Institute of Water Problems of the Russian Academy of Sciences, Moscow, Russia, 2014. Available online: https://www.iwp.ru/upload/iblock/0ce/0ceb3c09474b805c2ae7597c5a3be865.pdf (accessed on 11 March 2026). (In Russian)
- Bolgov, M.V.; Korobkina, E.A.; Trubetskova, M.D.; Filimonova, M.K.; Filippova, I.A. Present-day variations of the minimum runoff of the Volga Basin rivers. Russ. Meteorol. Hydrol. 2014, 39, 187–194. [Google Scholar] [CrossRef] [Scilit]
- Sarauskiene, D.; Kriauciuniene, J.; Reihan, A.; Klavins, M. Flood pattern changes in the rivers of the Baltic countries. J. Environ. Eng. Landsc. Manag. 2015, 23, 28–38. [Google Scholar] [CrossRef] [Scilit]
- Nurbatsina, A.; Tursunova, A.; Salavatov, Z. Iintra-annual distribution of runoff of typical rivers of Kazakhstan (on the example of the Buktyrma, Esil, Zhayik rivers). Hydrometeorol. Ecol. 2025, 1, 24–37. (In Russian) [Google Scholar]
- Golosov, V.; Litvin, L.; Kiryukhina, Z.; Yermolaev, O.; Chizhikova, N.; Safina, G. Influence of climate and land use changes on recent trends of soil erosion rates within the Russian Plain. Land Degrad. Dev. 2018, 29, 2658–2667. [Google Scholar] [CrossRef] [Scilit]
- Gusarov, A.V.; Golosov, V.N.; Sharifullin, A.G.; Gafurov, A.M. Contemporary trend in erosion of arable southern chernozems (Haplic Chernozems Pachic) in the west of Orenburg Oblast (Russia). Eurasian Soil. Sci. 2018, 51, 561–575. [Google Scholar] [CrossRef] [Scilit]
- Gusarov, A.V. The impact of contemporary changes in climate and land use/cover on tendencies in water flow, suspended sediment yield and erosion intensity in the northeastern part of the Don River basin, SW European Russia. Environ. Res. 2019, 175, 468–488. [Google Scholar] [CrossRef] [Scilit] [PubMed]
- Gusarov, A.V.; Sharifullin, A.G.; Beylich, A.A. Contemporary trends in river flow, suspended sediment load, and soil/gully erosion in the south of the boreal forest zone of European Russia: The Vyatka River Basin. Water 2021, 13, 2567. [Google Scholar] [CrossRef] [Scilit]





| Parameter | Landscape Zone | Intraperiod Contribution, % | Interperiod Contribution, % | |
|---|---|---|---|---|
| 1961–1990 | 1991–2020 | |||
| Q | Forest–steppe | 2 ns | 18 ns | 31 |
| Steppe | 53 | 64 | 64 ns | |
| Qmax | Forest–steppe | 59 | 40 | 70 |
| Steppe | 0 ns | 0 ns | 0 ns | |
| Qmin-CP | Forest–steppe | 50 ns | 61 | 55 |
| Steppe | 55 | 63 | 75 | |
| Qmin-WP | Forest–steppe | 47 ns | 44 ns | 18 ns |
| Steppe | 33 ns | 50 | 64 | |
Disclaimer/Publisher’s Note: The statements, opinions and data contained in all publications are solely those of the individual author(s) and contributor(s) and not of MDPI and/or the editor(s). MDPI and/or the editor(s) disclaim responsibility for any injury to people or property resulting from any ideas, methods, instructions or products referred to in the content. |
© 2026 by the authors. Licensee MDPI, Basel, Switzerland. This article is an open access article distributed under the terms and conditions of the Creative Commons Attribution (CC BY) license.
Share and Cite
Gusarov, A.V.; Beylich, A.A. Terrain Elevation as a Driver of Anthropocene Trends in the Runoff of Rivers: Insights from the East European Plain. Water 2026, 18, 1052. https://doi.org/10.3390/w18091052
Gusarov AV, Beylich AA. Terrain Elevation as a Driver of Anthropocene Trends in the Runoff of Rivers: Insights from the East European Plain. Water. 2026; 18(9):1052. https://doi.org/10.3390/w18091052
Chicago/Turabian StyleGusarov, Artyom V., and Achim A. Beylich. 2026. "Terrain Elevation as a Driver of Anthropocene Trends in the Runoff of Rivers: Insights from the East European Plain" Water 18, no. 9: 1052. https://doi.org/10.3390/w18091052
APA StyleGusarov, A. V., & Beylich, A. A. (2026). Terrain Elevation as a Driver of Anthropocene Trends in the Runoff of Rivers: Insights from the East European Plain. Water, 18(9), 1052. https://doi.org/10.3390/w18091052