Article

Assessment of Soil Physicochemical Changes, Bioaccumulation of Potentially Toxic Elements, and Okra Growth Parameters Under Different Irrigation Systems with Treated Wastewater


National Research Institute for Rural Engineering, Water, and Forestry (INRGREF), University of Carthage, Hédi Karray Street, P.O. Box 10, Ariana 2080, Tunisia
*
Author to whom correspondence should be addressed.
Water 2026, 18(8), 981; https://doi.org/10.3390/w18080981
Submission received: 13 February 2026 / Revised: 20 March 2026 / Accepted: 22 March 2026 / Published: 20 April 2026
(This article belongs to the Section Wastewater Treatment and Reuse)

Highlights

What are the main findings?
  • Treated wastewater significantly enhances crop growth and yield due to its nutrient richness.
  • Subsurface drip irrigation when paired with TWW improves water use efficiency and reduces salinization risks.
  • TWW changes soil nutrients, concentrating elements at the surface or deeper de-pending on irrigation method.
  • Levels of potentially toxic elements in fruit are safe, but long-term monitoring is needed to avoid accumulation.
What are the implications of the main findings?
  • Treated wastewater can act as a fertilizer substitute under standard conditions.
  • The choice of irrigation system used with treated wastewater is important for risk management.
  • Surface measurements are insufficient; subsurface layers must be monitored to detect hidden degradation
  • Water reuse with efficient irrigation enhances climate adaptation without compro-mising health or soil quality.

Abstract

Treated wastewater (TWW) reuse mitigates water scarcity but may induce soil salinization and trace metal accumulation if improperly managed. This field study evaluated the combined effects of irrigation water quality (TWW vs. well water) and irrigation method (surface vs. subsurface drip irrigation, SDI) on soil chemical properties, okra growth, yield, and nutrient/trace element dynamics under semi-arid Mediterranean conditions. Soil pH remained stable across treatments. Electrical conductivity was not significantly affected by water quality but increased in deeper layers under surface drip irrigation, indicating salt migration. SDI promoted more uniform nutrient distribution and favored Na+ displacement toward deeper layers, reducing root-zone exposure. Cations stratified vertically, with Ca2+, Mg2+, and K+ concentrated in surface layers and Na+ at depth. Water quality exerted a stronger influence than irrigation method. The fertilizing effect of TWW significantly enhanced plant height (53%), leaf dry matter (43%), aboveground biomass (81%), and fruit yield (16.3%). When combined with SDI, TWW improved irrigation water use efficiency by 20%. Although fruit Cd concentrations increased under TWW irrigation, all trace metals remained below international food safety standards. These findings indicate that integrating TWW with SDI enhances productivity and water use efficiency while maintaining short-term food safety, though long-term monitoring remains essential.

1. Introduction

Water resources are under increasing competition among agriculture, domestic use, industry, and ecosystems, particularly in developing countries such as Tunisia. In Tunisia, irrigation is the most water-intensive sector, accounting for approximately 75% of the volume exploited (according to 2021 estimates), making it highly vulnerable to water scarcity [1]. This vulnerability is exacerbated by the negative water imbalance characteristic of the Mediterranean region, where agricultural demands frequently exceed renewable water supplies, necessitating urgent paradigm shifts toward non-conventional water sources [2]. Moreover, agricultural water productivity remains significantly lower than that of other economic sectors. Climate change has further intensified this pressure through declining rainfall, prolonged droughts, and increased climatic variability, thereby restricting agricultural activity and threatening rural livelihoods and food security.
Globally, only about 20% of treated wastewater (TWW) is currently reused [3]. However, climate change and growing water demand are expected to accelerate water reuse, which is projected to reach 26 km3·year−1 by 2030. By 2060, approximately 40% of the global population is expected to live in water-scarce regions [4]. In this context, treated wastewater reuse has emerged as a strategic solution, particularly in low- and middle-income countries where agriculture remains a central pillar of economic stability and food security [5,6,7,8].
The reuse of TWW for irrigation offers several agronomic and environmental benefits. It contributes to freshwater conservation while potentially improving soil quality through the addition of organic matter and essential nutrients (N, P, K). These inputs can enhance soil water retention, reduce compaction, and improve drainage [9,10], often leading to increased crop productivity [11,12,13,14,15,16,17]. Additionally, TWW reuse can reduce reliance on chemical fertilizers and limit surface and groundwater pollution, thereby supporting sustainable agricultural practices [4,18,19,20,21,22,23]. Consequently, wastewater reuse for irrigation is increasingly recognized as a cornerstone of the circular water economy, facilitating the recovery of both water and nutrients [15,23,24].
Extensive long-term research conducted at the Oued Souhil Agricultural Experimental Unit (AEU) has previously demonstrated the high fertilizing value of TWW and its positive impact on crop yields [18,19]. However, these studies also highlighted the risks of nitrate leaching and groundwater pollution associated with the mismanagement of complementary fertilization [22,25]. Recent investigations at the same site have further characterized the spatiotemporal variations of TWW quality from treatment plants to the field [26] and assessed the medium-to-long-term effects of TWW on soil physicochemical indices [27,28]. Furthermore, comparative studies on irrigation techniques, such as subsurface irrigation at varying depths, have begun to address soil water dynamics and efficiency [29]. While these previous studies established a foundational understanding of soil dynamics and water efficiency at the Oued Souhil AEU, the present study provides a novel contribution by focusing specifically on the risk of potentially toxic element (PTE) bioaccumulation in the edible parts of the okra (Abelmoschus esculentus L.) crop. Unlike the aforementioned research, which largely focused on soil indices or general TWW quality, this work establishes a direct link between different irrigation strategies (DI vs. SDI) and the associated human health risk assessment.
Despite these advantages, the seasonal application of TWW raises concerns regarding the accumulation of potentially toxic elements (PTEs) such as Pb, Cd, Co, and Ni in the soil–plant system. Numerous studies have reported the accumulation of metals such as Fe, Mn, Cu, Zn, Pb, Cr, Ni, Cd, and Co in agricultural soils and edible plant tissues, posing significant risks to human health [6,7,16,30,31,32,33,34,35]. The transfer of heavy metals from irrigation water to the soil, and subsequently to vegetables, represents a critical pathway for human exposure [36]. Unlike organic pollutants, PTEs are non-biodegradable and persist in the soil matrix, where they can alter microbial activity and soil structure. Once absorbed by crops, they can reach toxic levels in edible tissues, posing severe health risks including carcinogenic and systemic effects to consumers [37]. Mitigating these risks requires not only appropriate wastewater treatment but also the adoption of efficient irrigation systems that minimize the direct contact between reclaimed water and the plant, while optimizing the soil’s natural capacity for filtration [38].
Advanced irrigation techniques, including surface drip irrigation (DI), alternate partial root-zone irrigation (APRI), and subsurface drip irrigation (SDI), have demonstrated considerable potential for improving crop yields while enhancing water-use efficiency [29,39,40,41,42,43,44]. Among these, SDI is particularly effective in reducing evaporation and runoff losses while limiting direct contact between reclaimed water and the aerial parts of crops, especially those producing edible fruits [45,46]. Moreover, SDI may enhance the filtration of wastewater as the soil profile acts as a natural biological filter [47]. However, concerns related to PTE contamination in TWW continue to constrain the widespread adoption of this technique.
To date, limited research has examined the synergistic effect of treated wastewater and subsurface drip irrigation as a strategy to mitigate PTE accumulation in edible crops. Therefore, this study aims to evaluate whether SDI (installed at a depth of 20 cm) can reduce PTE contamination in okra (A. esculentus L.) fruits irrigated with TWW, compared to DI. Well water (WW) was used as a control treatment. In addition, the study assesses the effects of irrigation water quality and system on soil properties, plant growth, yield, and comprehensive potential human health risks associated with PTE bioaccumulation, through the calculation of Daily Intake of Metals (DIM) and Health Risk Index (HRI), in accordance with [48,49].

2. Materials and Methods

2.1. Study Area and Climate

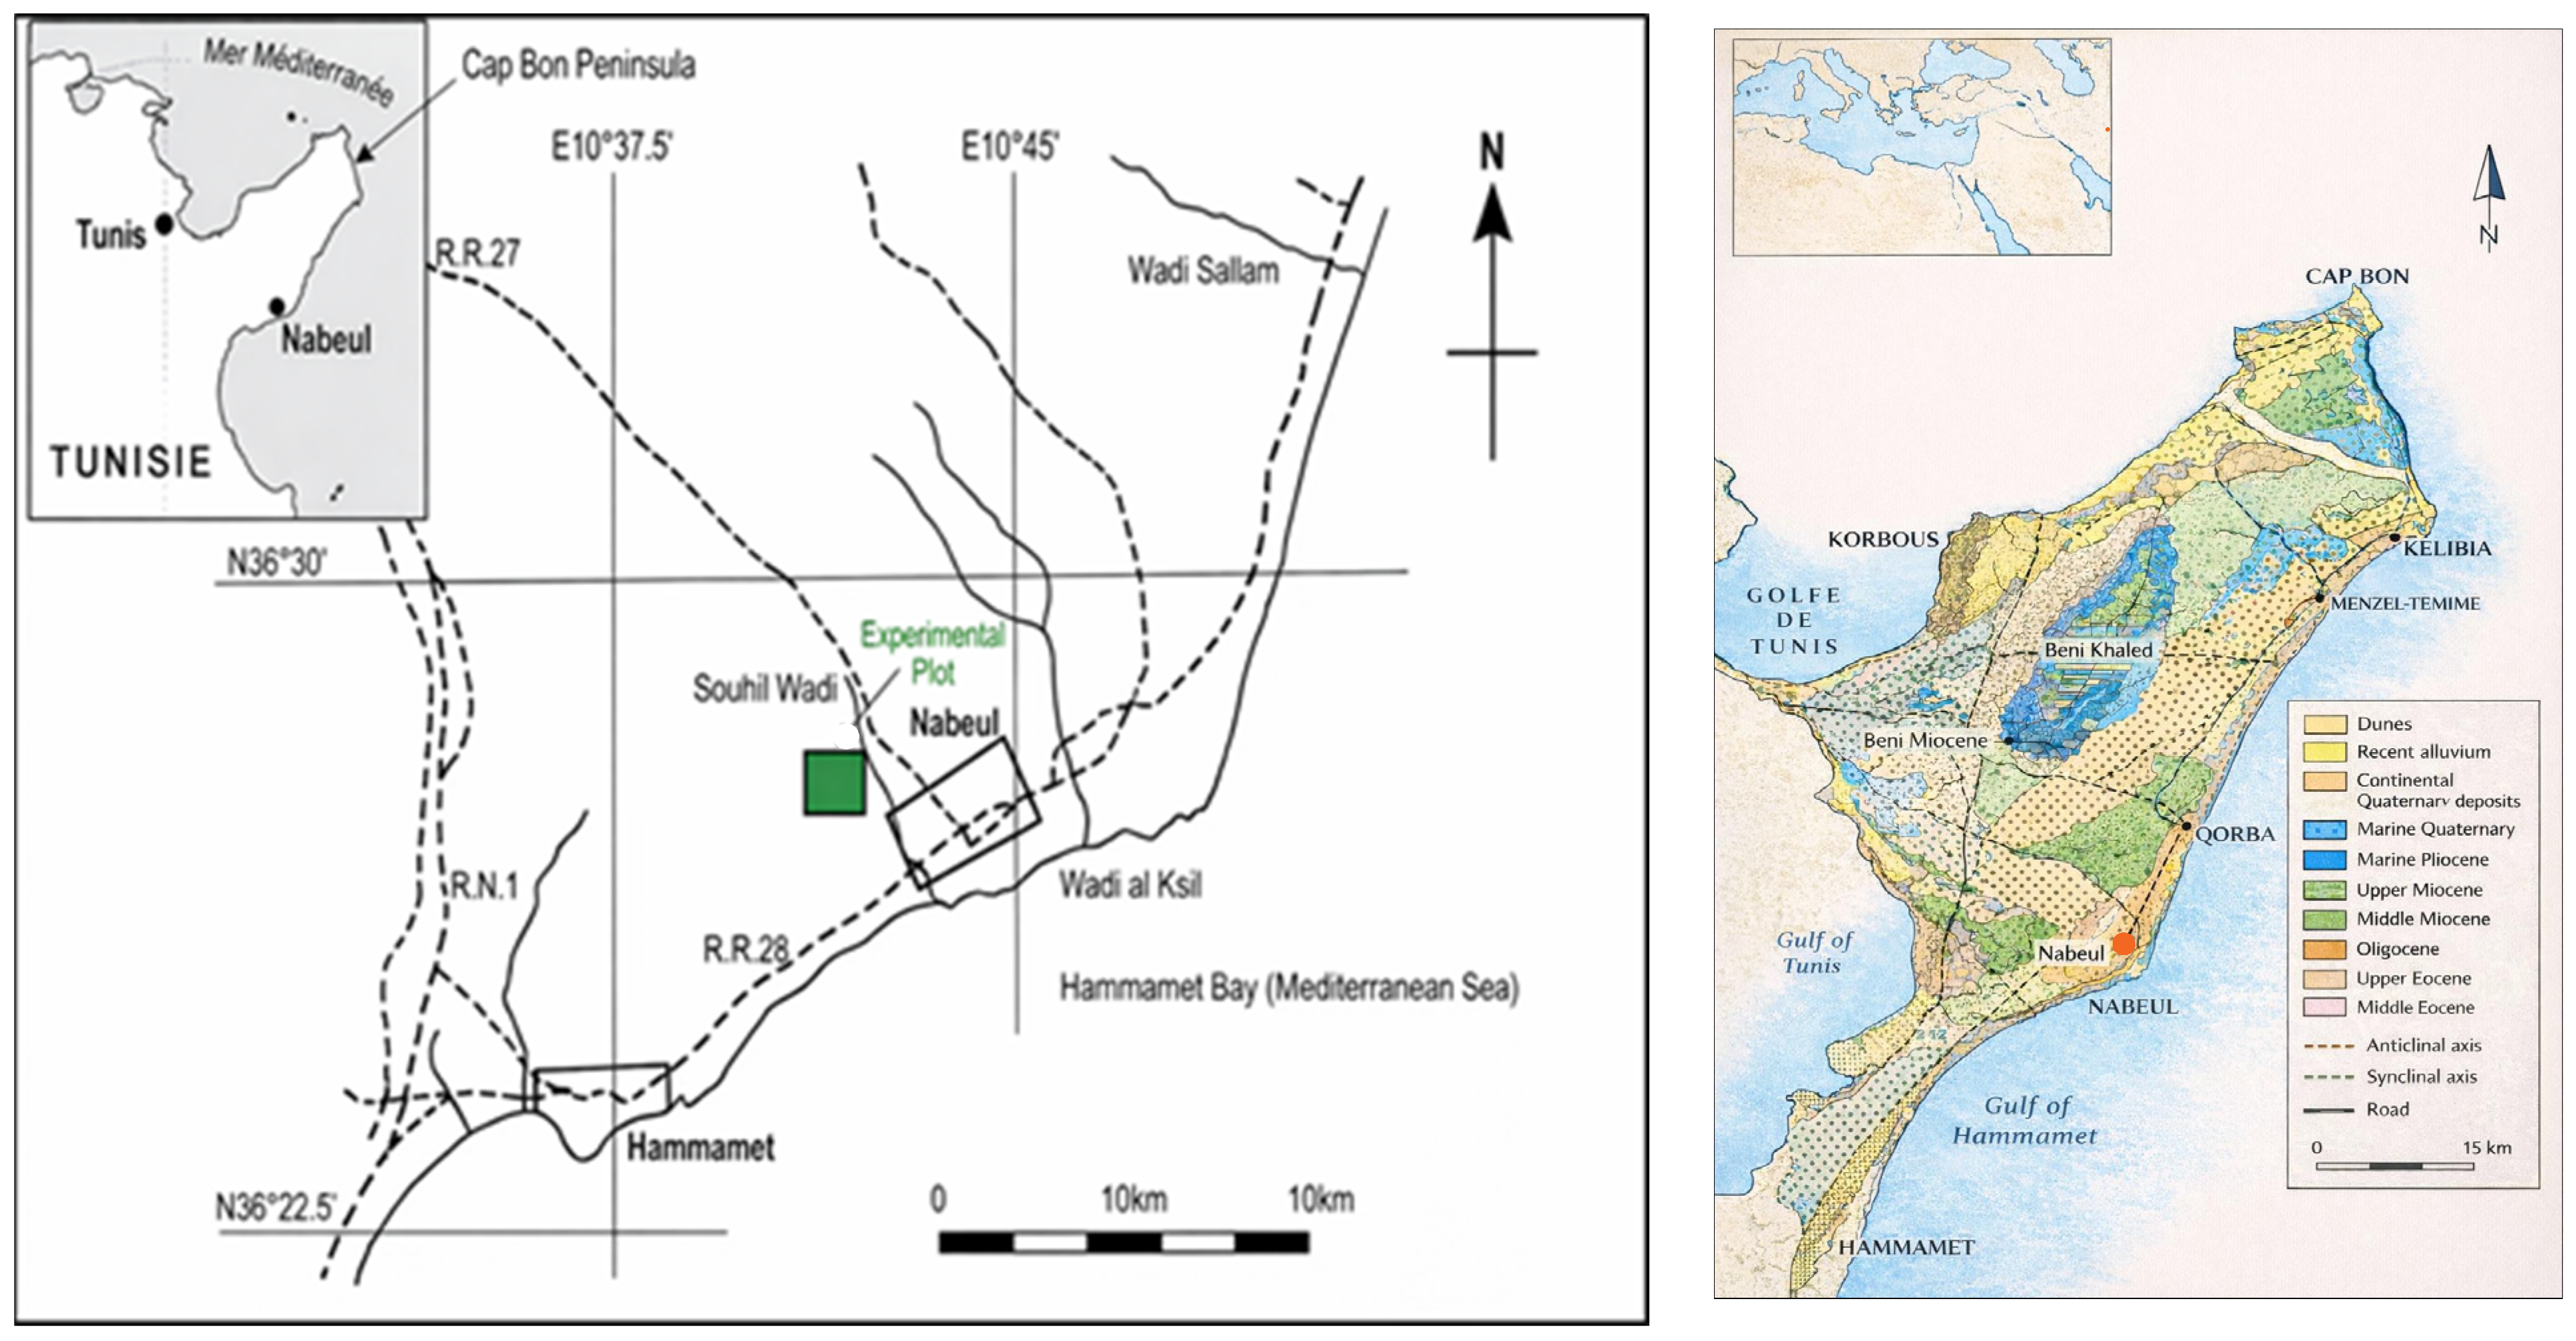
The field experiment was conducted at the Oued-Souhil Agricultural Experimental Unit in Nabeul, Tunisia, managed by the National Institute for Research in Rural Engineering, Water, and Forestry (INRGREF). The experimental unit covers 26 ha within the Oued-Souhil irrigation perimeter, which extends over approximately 400 ha and is predominantly cultivated with citrus orchards, alongside olive trees, cereal crops, and fodder plants. The site is located at 36°27′37″ N and 10°42′24″ E, at an elevation of 25 m above mean sea level, within an upper semi-arid bioclimatic zone, approximately 60 km southeast of Tunis (Figure 1).
The Oued-Souhil perimeter is equipped with a collective irrigation system supplied with treated domestic wastewater subjected to secondary treatment using the activated sludge process. This non-conventional water resource enables the implementation of controlled irrigation strategies under conditions of chronic water deficit.
Climatic conditions at the site are characterized by mild, rainy winters with no frost and hot, dry summers. Based on 25 years of climatic data (1991–2016) recorded at the INRGREF meteorological station, the mean annual precipitation is 413 mm, average minimum temperatures range from 9.5 °C in February to 10 °C in January, while the mean maximum temperature reaches 32 °C in August.
The site-specific climatic water balance was evaluated according to FAO-56 guidelines, using the Penman–Monteith equation to estimate reference evapotranspiration (ET0). Okra (A. esculentus L.), is a crop with high water demand and sensitivity to water stress during vegetative growth, flowering, and pod development. Therefore, irrigation is essential to maintain plant growth, ensure yield stability, and mitigate water stress during the cropping season.

2.2. Experimental Design and Treatments

The field experiment was established using a randomized split-plot design with three replications. Irrigation water quality was assigned as the main plot factor, comprising treated wastewater (TWW) and well water (WW), while the irrigation method constituted the sub-plot factor, including surface drip irrigation (DI) and subsurface drip irrigation (SDI), with laterals installed at a depth of 20 cm below the soil surface.
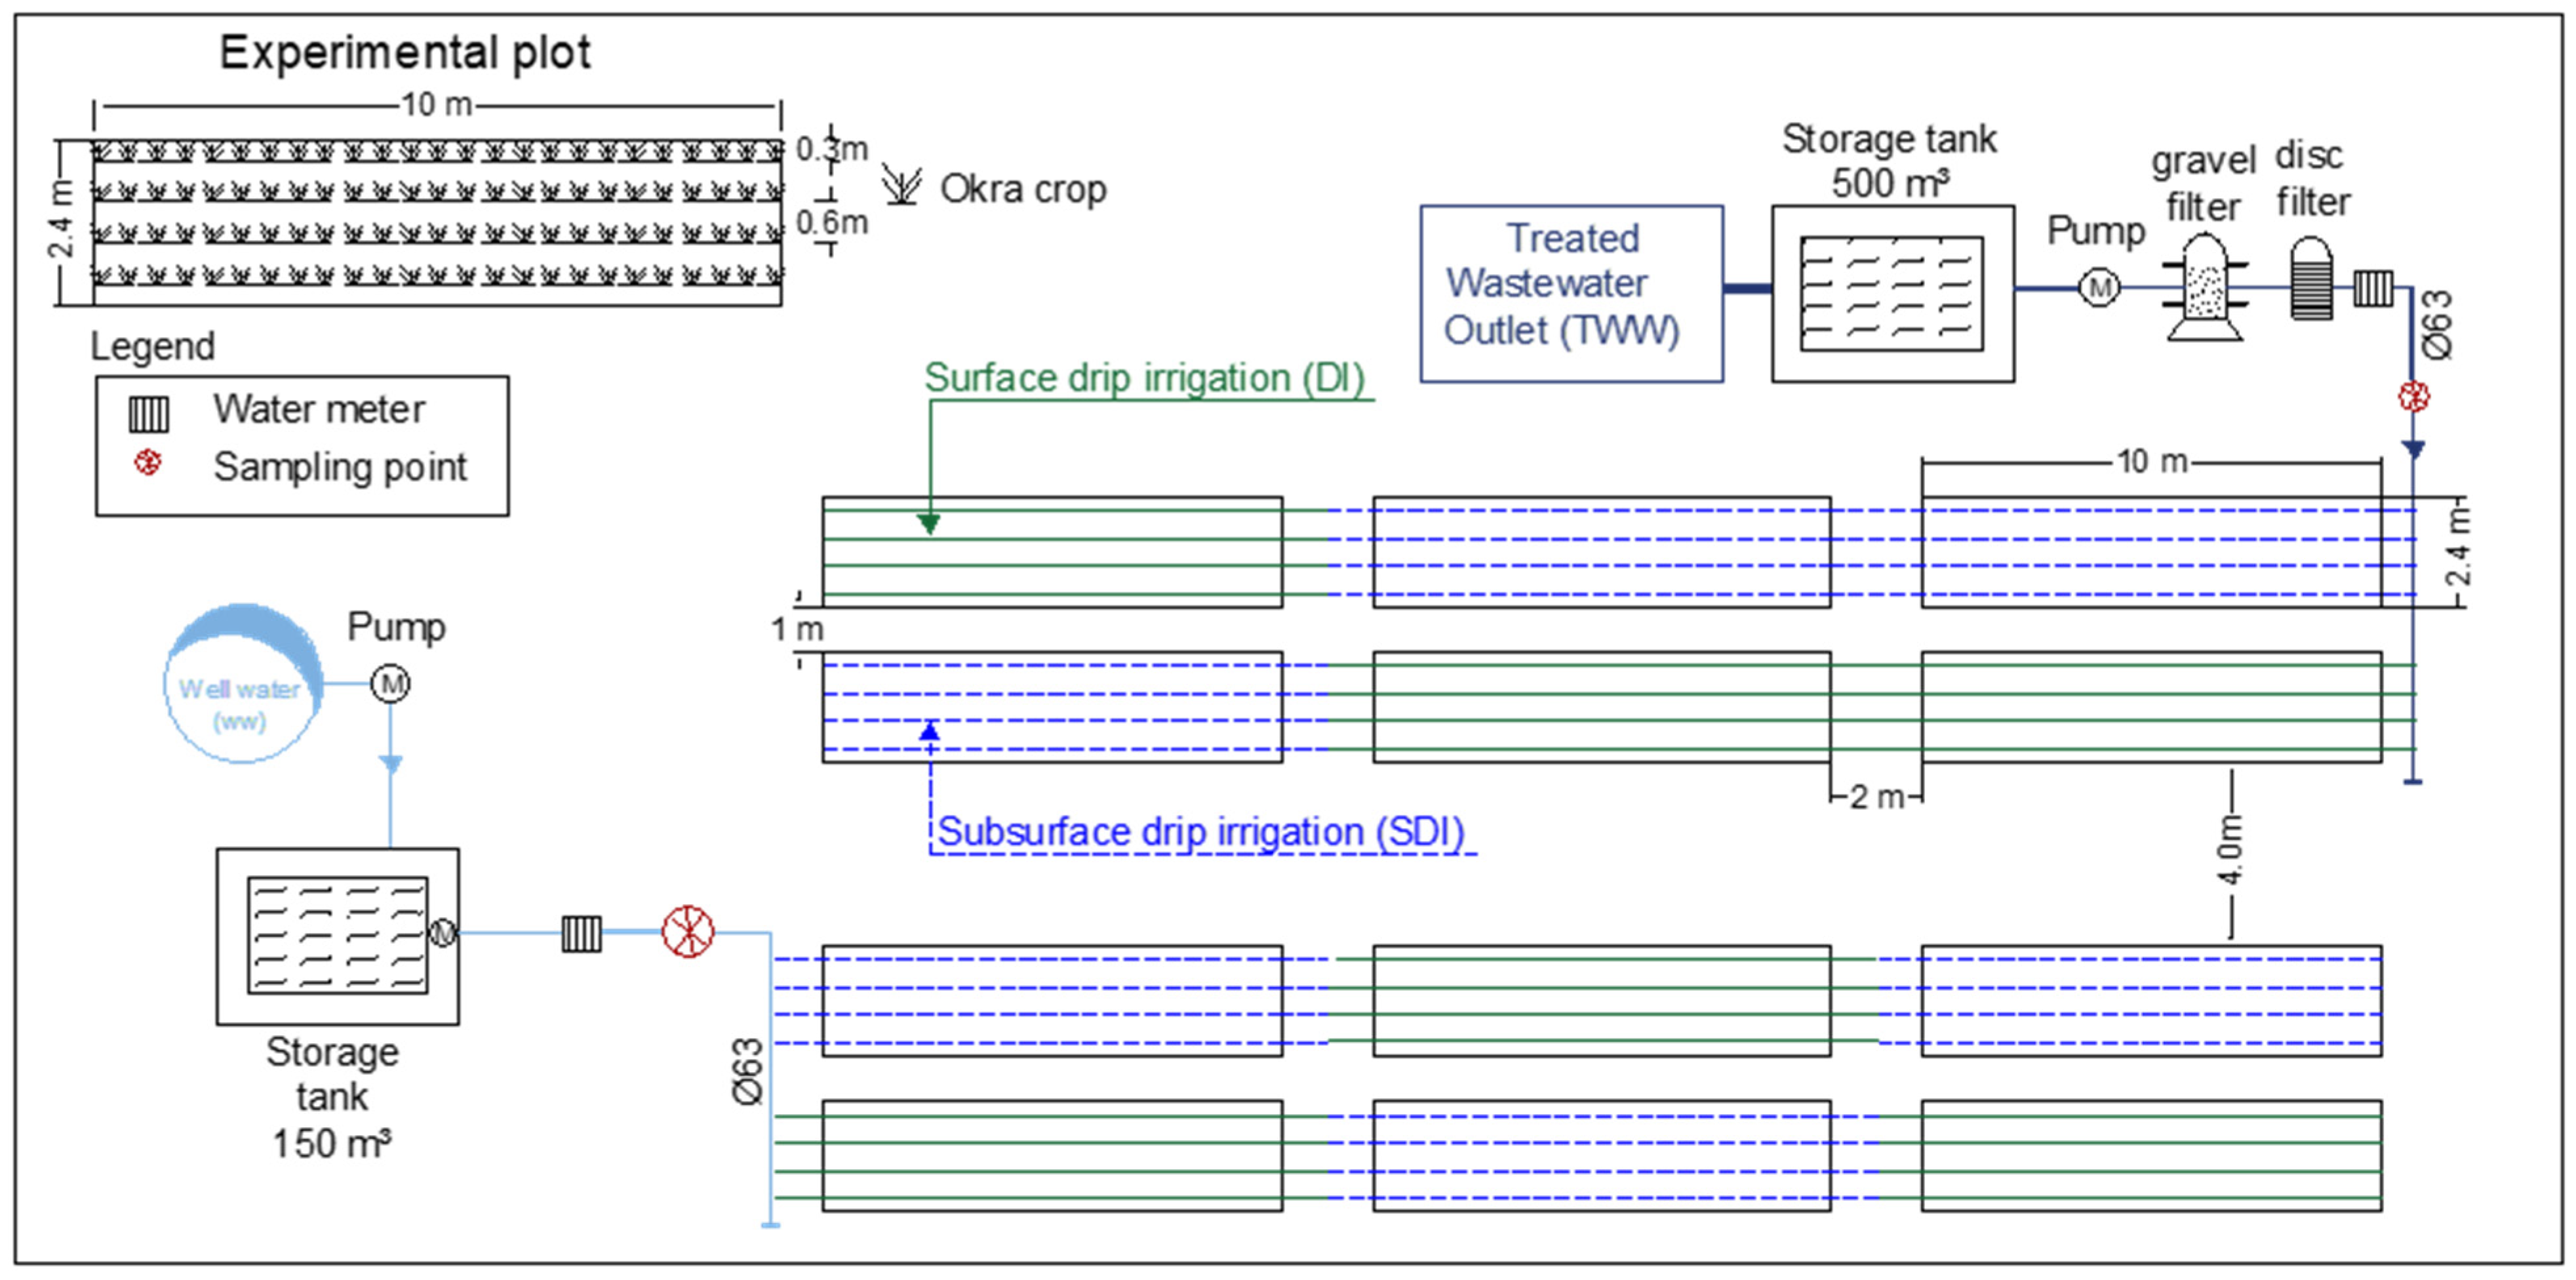
The experimental site covered an area of 600 m2 and was divided into two adjacent blocks according to water quality (WW and TWW). Each block was further subdivided into six plots of 24 m2 (three plots per irrigation method), resulting in a total of 12 plots (four treatments × three replications). Individual plots measured 2.4 m in width and 10 m in length (Figure 2). The four irrigation treatments were: DI-WW (surface drip irrigation with well water), SDI-WW (subsurface drip irrigation with well water), DI-TWW (surface drip irrigation with treated wastewater), and SDI-TWW (subsurface drip irrigation with treated wastewater).
No mineral fertilizers were applied during the experiment. Prior to sowing okra (A. esculentus L.) on 30 May 2023, a pre-irrigation was carried out to ensure soil stabilization and favorable conditions for seed germination. Each plot consisted of four crop rows spaced 0.60 m apart, with an intra-row spacing of 0.40 m. Three seeds were sown per planting hole in a triangular arrangement and later thinned to a single plant at the three-leaf stage. Standard agronomic practices, including weeding and earthing-up, were performed manually across all treatments. Notably, no chemical pesticides or fertilizers were applied during the experimental period to avoid any external input of trace elements.

2.3. Origin and Distribution of Water Sources

The TWW used in this study was supplied by the SE4-Dar Chaabane wastewater treatment plant, approximately 6 km from the experimental unit. At this facility, wastewater undergoes secondary treatment using an activated sludge process before being pumped to the Oued Souhil irrigation perimeter. The TWW is initially stored in an upstream reservoir with a capacity of 4500 m3 and subsequently conveyed by gravity to the experimental unit, where it is held in two geomembrane-lined basins, each with a capacity of 500 m3.
To ensure compatibility with micro-irrigation systems and to minimize clogging risks, the TWW was further filtered through gravel and disc filtration units installed within the framework of the ACCBAT Project (Adaptation to Climate Change through Improved Water Demand Management in Irrigated Agriculture by Introducing New Technologies and Best Agricultural Practices). The filtered water was then distributed to the experimental plots via polyethylene pipelines. Well water (WW), used as a control source, was obtained from a storage basin supplied by a network of shallow wells located within the experimental unit.

2.4. Determination of Okra Water Requirements

Crop water requirements were determined following the FAO-56 methodology using the Penman–Monteith equation to estimate reference evapotranspiration (ET0) from mean climatic data recorded at the experimental station. Crop evapotranspiration (ETc) was calculated by multiplying ET0 by stage-specific crop coefficients (Kc) corresponding to the different phenological stages of okra, as recommended by [50].
Irrigation water requirements (IWR) were then derived using a soil–water balance approach, expressed as:
I W R = K c × E T 0 P e f f R
where IWR denotes the net irrigation water requirement (mm), Kc is the crop coefficient, ET0 is the reference evapotranspiration (mm), Peff is the effective precipitation (mm), and R represents additional contributions such as capillary rise (mm), which were considered negligible under the experimental conditions.

2.5. Irrigation Water Management and Application

During the okra growing season (June–September), the absence of effective rainfall resulted in a total crop water requirement of 479 mm under local climatic conditions. Based on the drip irrigation efficiency reported by [51] estimated at 95%, an additional 5% (approximately 24 mm) was applied to compensate for conveyance and application losses. Irrigation scheduling was carefully managed to prevent depletion beyond the soil available water capacity (AWC), which was determined to be 43.61 mm within the upper 40 cm of the soil profile.
Both surface drip irrigation (DI) and subsurface drip irrigation (SDI) systems were calibrated to apply equivalent water volumes across treatments. Given the sandy loam soil texture, irrigation frequency was increased while individual application depths were reduced to limit deep percolation and nutrient leaching. Over the cropping season, a total of 32 irrigation events were conducted, with delivered water volumes continuously monitored using flow meters installed at each experimental plot.
Overall, the okra crop received a cumulative irrigation depth of 505 mm, corresponding to 5050 m3 ha−1, irrespective of irrigation water source (treated wastewater or well water) or irrigation method (DI or SDI), as summarized in Table 1.

2.6. Sampling Strategy

2.6.1. Irrigation Water Sampling

Irrigation water samples were collected periodically at four key stages of the okra growth cycle from the inlet of each experimental plot for both TWW and WW. Samples were collected in clean polyethylene bottles, filtered where required, and transported to the laboratory under refrigerated conditions for subsequent physicochemical and chemical analyses.

2.6.2. Soil Sampling

Soil samples were collected at two critical stages: before planting and at harvest. Initial soil samples were collected at the beginning of the experiment, prior to sowing and before the first irrigation event, to characterize the baseline soil conditions. Nine soil cores per plot were collected using a 35 mm diameter auger at two depths (0–20 cm and 20–40 cm), given that the okra root has an average depth of 0.4 m [52]. For each depth, three composite samples were prepared by combining three individual cores, resulting in three replicates per soil layer.
At harvest, soil sampling was repeated following the same procedure, with cores collected to a depth of 40 cm in 20 cm increments, corresponding to the effective rooting depth of okra. Samples were taken directly beneath the drippers in each microplot, and one composite sample per depth and replicate was prepared for laboratory analyses.

2.6.3. Plant Sampling and Performance Indices

To evaluate the impact of irrigation treatments on okra productivity and physiological status, several growth parameters and efficiency indices were determined throughout the experimental period.
Growth and Yield Measurements
Plant growth and yield assessments were conducted within a central area of 2.4 m2 in each plot. Ten plants were randomly selected per plot for all measurements. Plant height and stem diameter were recorded weekly from the second week after thinning (30 June 2023) until the final harvest using a graduated ruler and a digital caliper (Model CD-6″ CS, Mitutoyo, Kawasaki, Japan), respectively.
Harvesting was performed when pods reached a length of 3–5 cm (approximately 4–6 days after flowering). The total fruit yield from the ten selected plants constituted one replicate, with three replicates per treatment. Final yield (t·ha−1) was calculated as the cumulative average yield across all harvests.
At the final harvest, the selected plants were uprooted and separated into leaves, stems, fruits, and roots for detailed laboratory analyses.
Physiological and Efficiency Indices
The biomass collected during sampling was further utilized to calculate two key performance indicators: The Water Content (Te%) and the Irrigation Water Use Efficiency (IWUE).
The Water Content (Te%) of the different plant organs (roots, stems, leaves) was determined to evaluate the physiological hydration status of the crop under the various irrigation treatments. After harvesting, the fresh weight (FW) of each organ was immediately measured. The samples were then oven-dried at 70 °C for 48 h until reaching a constant weight to determine the dry weight (DW). The water content was calculated using the following gravimetric equation:
T e   % = 100 × H p 1 + H p
where
H p = F W D W D W
where FW is the fresh weight and DW is the dry weight of the plant organ (g).
The Irrigation Water Use Efficiency (IWUE, kg m−3) was determined to assess the productivity of the applied water, according to [53], as follows:
I W U E = Y T A W
where: Y is the total marketable fruit yield (kg) and TAW is the total applied water during the growing season (m3).

2.7. Analytical Methods and Parameter Calculations

2.7.1. Irrigation Water Analysis

Water pH and electrical conductivity (EC) were measured in situ using a portable pH/EC meter (ELMETRON CPC-401) (CPC-401, Elmetron, Zabrze, Poland). Bicarbonates (HCO3) were determined by titration with standardized sulfuric acid (H2SO4) using methyl orange as an indicator [54].
The chemical oxygen demand (COD) was analyzed using the dichromate reflux method [54]. A 10 mL filtered water sample was digested with potassium dichromate (K2Cr2O7), mercury sulfate (HgSO4), and silver sulfate in sulfuric acid under reflux conditions. The remaining dichromate was titrated with ferrous ammonium sulfate using ortho-phenanthroline as an indicator.
Samples were filtered through 0.45 µm membrane filter, and nutrients (NH4+, NO3, PO43−) were quantified by ion chromatography (Compact IC Pro 881, Metrohm AG, Herisau, Switzerland). Chloride (Cl) was measured using the Mohr method, while sulfate (SO42−) was determined by nephelometry (NF T 90-040) [55]. Major cations (Ca2+, Mg2+) and trace metals (Cd2+, Pb2+, Co2+, Ni2+) were determined using atomic absorption spectrophotometry (Model 3110, PerkinElmer, Waltham, MA, USA), sodium (Na+) and potassium (K+) were measured by flame photometry (PFP7, Jenway, Stone, UK) [56].
Irrigation water sodicity was evaluated using the sodium adsorption ratio (SAR), calculated as [57]:
S A R = N a +   ( C a 2 + M g 2 + )
where ion concentrations are expressed in mmol·L−1.

2.7.2. Soil Analysis

Soil pH, electrical conductivity (EC), and soluble cations (Ca2+, Mg2+, Na+, K+) were determined in saturated paste extracts (SPEs) as described by [58].
Exchangeable Ca2+ and Mg2+ were quantified by EDTA titration, while Na+ and K+ were determined using flame photometry. Concentrations were expressed in meq·L−1 and used to calculate soil SAR (Equation (1)).
Because soil pH exceeded 7, cation exchange capacity (CEC) was estimated as the sum of exchangeable base cations [59]:
C E C   m e q · 100   g 1 = C a 2 + + M g 2 + + K + + N a +  

2.7.3. Plant Analysis and Human Health Risk Assessment

The plant components collected at the final harvest were analyzed to determine their chemical composition, which served as the essential data for assessing both nutritional status and potential risks to human health. Samples were washed with distilled water, oven-dried at 70 °C until constant weight, and ground into a fine powder. For the analysis of potentially toxic elements (PTEs) (Cd, Pb, Co, and Ni), as well as sodium (Na+) and potassium (K+), 0.5 g of oven-dried plant material was digested using a di-acid mixture (HNO3: HClO4, 3:1 v/v). All reagents used in this study were of analytical grade. Nitric acid (HNO3) and perchloric acid (HClO4) were sourced from Merck (Darmstadt, Germany) and PanReac AppliChem (Barcelona, Spain), respectively. After cooling, the digest was filtered and the resulting filtrate was used for elemental analysis following the procedure described by [60]. Concentrations of PTEs were determined by atomic absorption spectrophotometry (Model 3110, PerkinElmer, Waltham, MA, USA). Sodium (Na+) and potassium (K+) were quantified from the same filtrate using a flame photometer (PFP7, Jenway, Stone, UK).
Total phosphorus (P) was also determined from an aliquot of the same filtrate through the formation of a stable yellow phosphovanadomolybdic complex under acidic conditions, followed by spectrophotometric measurement at 420 nm (Model AE-11, Erma Optical Works Ltd., Tokyo, Japan), according to the ICARDA protocol (Estefan et al., 2013) [61].
The concentrations of PTEs measured in the edible okra fruits were subsequently used in toxicological models to evaluate the safety of the crop for human consumption. Two key indicators were calculated to estimate potential human health risks following [48]:
1-
Daily Intake (DIM): The daily intake of metals (DIM) was determined by the following equation.
D I M = C   m e t a l × C f a c t o r × D   f o o d   i n t a k e B W
where Cmetal, Cfactor, Dfood intake and BW represent the PTE concentrations in plants (mg kg−1), conversion factor, daily intake of vegetables and average body weight, respectively. The conversion factor 0.085 was used to convert fresh green vegetable weight to dry weight, as described by [30]. The average daily vegetable intakes for adults and children were considered to be 0.345 and 0.232 kg person−1 day−1, respectively, while the average adult and child body weights were considered to be 55.9 and 32.7 kg, respectively, as used in previous studies [62].
2-
The health risk index (HRI): Representing the non-carcinogenic risk by comparing the EDI to the oral Reference Dose (RfD):
H R I = D I M R f D
Due to the absence of a standardized oral Reference Dose (RfD) for Cobalt in the US-EPA database, only the Daily Intake (DIM) was determined for this element, an indicative RfD of 0.03 mg·kg−1·day−1 was adopted for this study [63]. The RfD values used for Cd, Pb, and Ni were 0.001, 0.0035, and 0.02 mg·kg−1·day−1, respectively, according to [49]. An HRI < 1 indicates that the consumption of the fruits is considered safe for the local population, while an HRI > 1 suggests a potential health risk [48].

2.8. Data Analysis

All collected Data assessing differences between TWW and WW, as well as their effects on soil properties, agronomic growth parameters, nutritional status, and physiological traits, were subjected to analysis of variance (ANOVA) using IBM SPSS Statistics (version 20.0, IBM Corp., Armonk, NY, USA).
  • For soil parameters, a three-way ANOVA was performed to evaluate the effects of WQ, IS and soil depth (H), as well as their double and triple interactions. This approach was chosen to specifically track the vertical migration of salts within the soil profile.
  • For plant growth, yield, and fruit quality parameters, a two-way ANOVA was applied to assess the effects of WQ and IS.
Significant differences among treatment means were determined using Duncan’s multiple range test at a significance level of p < 0.05. In all tables, the levels of significance are indicated as follows: ns (non-significant, p > 0.05), * (p < 0.05), ** (p < 0.01), and *** (p < 0.001).

3. Results

3.1. Soil Characteristics of the Study Area

A survey conducted in the study area in 1998 [64], indicated that soils within treated wastewater irrigation perimeters are predominantly deep and light-textured, typically sandy loams developed on alluvial or marl formations. These observations are consistent with field assessments in the Oued-Souhil perimeter. Soil texture was found to be relatively homogeneous down to a depth of at least 40 cm, and the main physical and chemical properties of the experimental plot are summarized in Table 2.
Based on field measurements, the soil exhibits an average bulk density of 1.435 g·cm−1, with clay, loam, and sand fractions ranging from 9.7–13.5%, 3.1–4.3%, and 83.8–87.7%, respectively. Soil moisture content averages 6.35% at the permanent wilting point (PWP) and 14.8% at field capacity (FC), providing a total available water reserve of 43.61 mm within the top 40 cm. According to the USDA soil classification system [65], the soil is classified as a loamy sand. In accordance with the World Reference Base (WRB) for Soil Resources, the soil is classified as a Haplic Fluvisol, reflecting its alluvial origin and typical profile development at the Oued Souhil site. The soil is moderately alkaline (pH 8.13–8.22), with alkalinity increasing with depth, and maintains low electrical conductivity (0.89–0.91 dS·m−1) across the measured depths. Exchangeable cations and cation exchange capacity (CEC) indicate fertile but non-saline conditions suitable for irrigation with treated wastewater.

3.2. Irrigation Water Quality Monitoring

Physicochemical Composition of Irrigation Water

The physicochemical characteristics of the well water (WW) and treated wastewater (TWW) are summarized in Table 3. All measured parameters of the WW complied with the applicable irrigation water standards. Ammonium concentrations were significantly higher in TWW (48.8 mg·L−1) than in WW (2.36 mg·L−1), although no specific regulatory limit is defined for this parameter under the current standard. Nitrate concentration was markedly higher in WW (111 mg·L−1) compared to TWW (17.7 mg·L−1).
The pH of the WW was near neutral (7.2), while the TWW exhibited a slightly alkaline pH (7.9). Electrical conductivity (EC) was elevated in both water sources, with values of 3.9 and 3.1 mS·cm−1 for WW and TWW, respectively. The chemical oxygen demand (COD) of the TWW reached 98 mg O2·L−1, exceeding the Tunisian guideline value for treated wastewater reuse (<90 mg O2·L−1).
Regarding nutrient composition, the TWW contained higher concentrations of nitrogen (41.9 mg·L−1), phosphorus (3.5 mg·L−1), and potassium (60 mg·L−1) than the WW. In contrast, the WW showed higher levels of calcium (226 mg·L−1), magnesium (92 mg·L−1), and sodium (592 mg·L−1). Sulfate concentrations did not differ significantly between the two water sources.
Both TWW and WW contained potentially toxic elements, including Cd, Co, Ni, and Pb (Table 3). The concentrations of these elements were generally within the limits prescribed by Tunisian regulations for irrigation water. However, cadmium (Cd) concentrations in some TWW samples slightly exceeded the recommended threshold (0.001 mg. L−1). In the TWW, the trace metal concentrations followed the descending order: Pb2+ > Co2+ > Ni2+ > Cd2+.

3.3. Soil Physicochemical Changes

3.3.1. Main Effects of Irrigation Water Quality, Irrigation System, and Soil Depth on Soil Physicochemical Properties

The effects of irrigation water quality, irrigation system, and soil depth on soil physicochemical properties are presented in Table 4.
Based on the ANOVA results (Table 4), water quality (WQ) had no significant effect on soil pH or electrical conductivity (EC) across the studied profiles (p ≥ 0.05); conversely, soil depth (H) and irrigation system (IS) significantly influenced several physicochemical properties. The three-way ANOVA further indicated that WQ significantly affected Na+, Mg2+, and K+ concentrations, as well as the sodium adsorption ratio (SAR). Compared to well water (WW), the use of treated wastewater (TWW) resulted in significantly lower Mg2+ (−23%) and K+ (−13%) contents, accompanied by higher Na+ (+22.5%) concentrations and SAR (+34%) values (p < 0.05).
The IS significantly affected soil Na+ and Mg2+ concentrations, with higher values observed under surface drip irrigation (DI) compared to subsurface drip irrigation (SDI) (p < 0.05). Furthermore, drip irrigation also increased EC (+15.5%) and cation exchange capacity (CEC, +12.7%), whereas no significant effects were detected on soil pH, Ca2+, K+, or SAR (p ≥ 0.05).
Soil depth (H) significantly influenced all measured soil properties except pH (p ≤ 0.05). Electrical conductivity, Na+, and SAR increased with depth, while Ca2+, Mg2+, K+, and CEC were significantly higher in the upper soil (0–20 cm). Notably, Na+ was the only cation that showed enrichment in the subsoil (20–40 cm).
Beyond the individual effects, significant two-way interactions were observed for WQ × IS (EC, Na+, Ca2+, Mg2+, SAR, and CEC), WQ × H (Na+, Ca2+, and SAR), and IS × H (Na+, SAR, and CEC). Most notably the three-way interactions (WQ × IS × H) significantly affected soil pH, Na+, Ca2+, and SAR (Table 4), indicating that the redistribution of these key solutes in the soil profile is simultaneously governed by water quality, the irrigation method, and depth-dependent processes.

3.3.2. Distribution of Soluble Cations Across Soil Depths and Comparison with Background Values

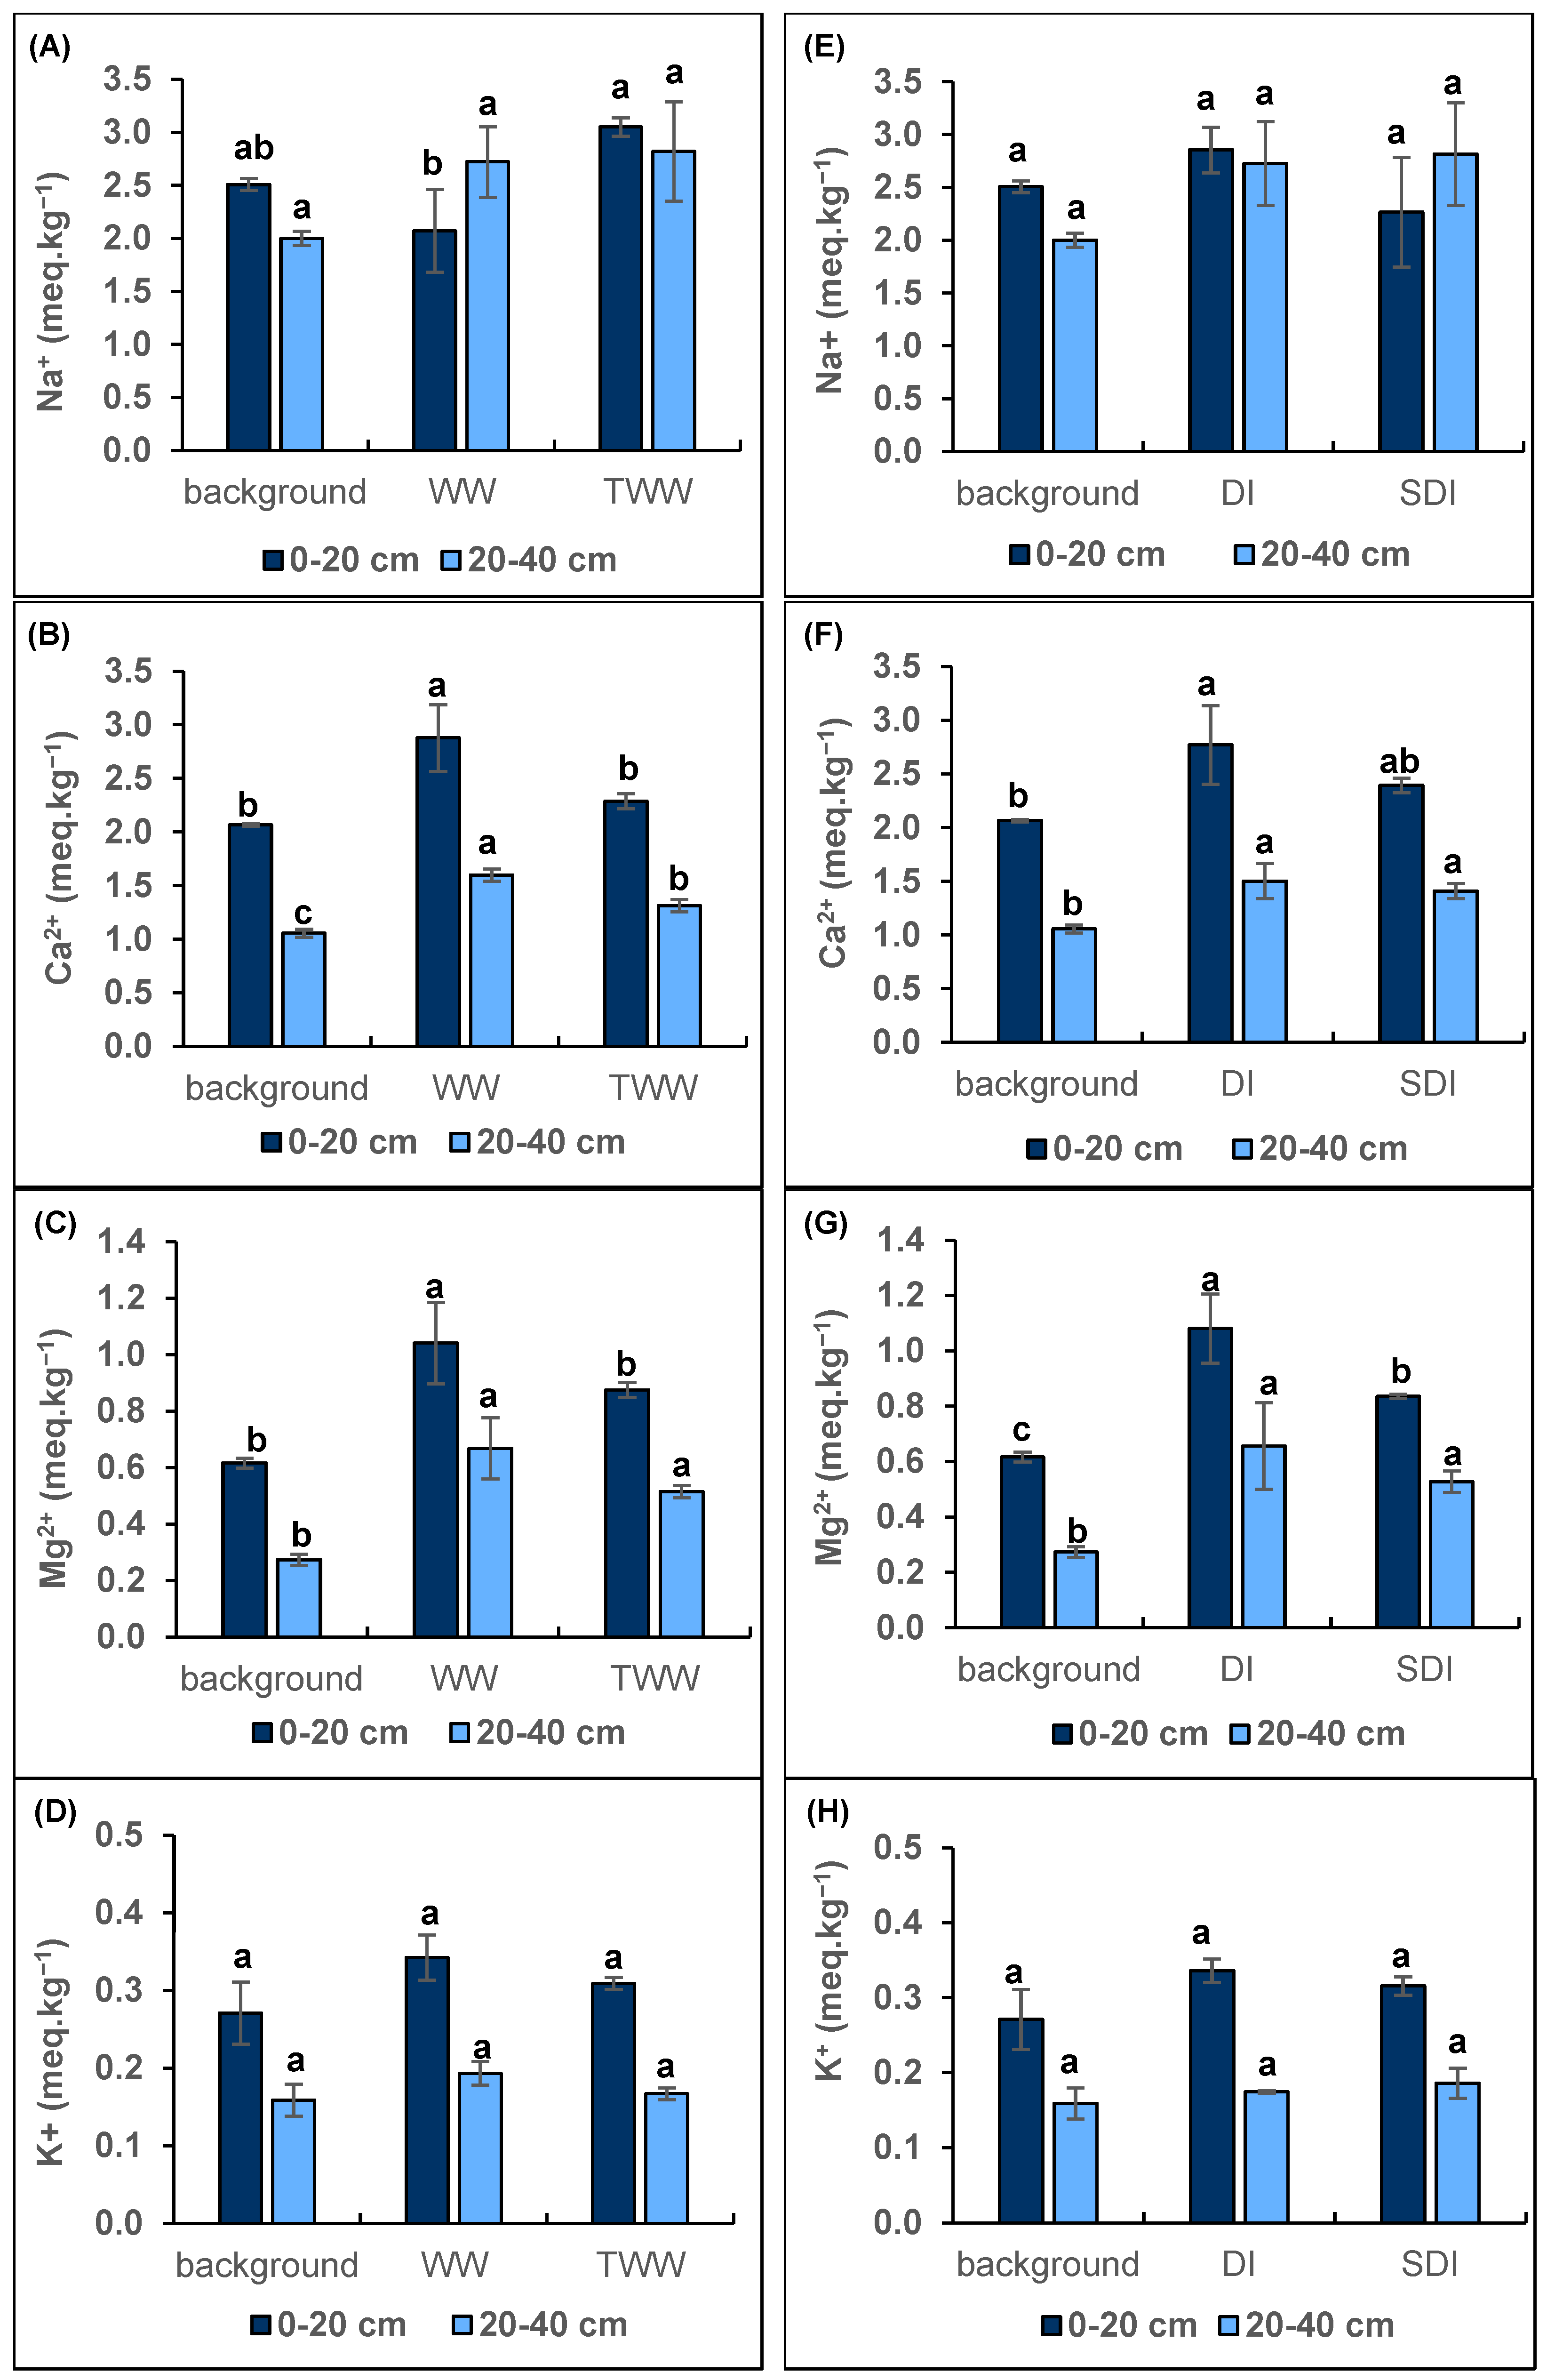
The individual and interactive effects of irrigation water quality and irrigation system on soluble cation concentrations in the topsoil and subsoil, relative to background values, are illustrated in Figure 3. Neither WQ nor IS significantly affected soil K+ concentrations in either layer, as K+ levels remained comparable to background values.
In contrast, Na+, Ca2+, and Mg2+ concentrations in the subsoil significantly exceeded pre-irrigation (background) levels (p ≤ 0.05). The interaction between WQ and soil depth (WQ × H) revealed significant differences in Na+, Ca2+, Mg2+, and K+ concentrations depending on water type and depth (Figure 3A–D). Compared to background values, WW irrigation led to greater increases in Ca2+ and Mg2+ concentrations than TWW, whereas TWW significantly increased Na+ accumulation exclusively in the topsoil.
The interaction between IS and soil depth (IS × H) showed that surface drip irrigation (DI) significantly enhanced Ca2+ and Mg2+ contents in the topsoil compared with both SDI and background levels (Figure 3E–H). In the subsoil, no significant differences between irrigation systems were observed (p ≥ 0.05). Nevertheless, both irrigation systems resulted in significantly higher Ca2+ and Mg2+ concentrations compared with the background values.

3.4. Effects of Irrigation Water Quality and Irrigation System on Okra

3.4.1. Effects of Irrigation Water Quality and Irrigation System on Growth and Agronomic Parameters

The effects of irrigation water quality, irrigation system, and their interaction on okra growth and agronomic parameters were assessed using a two-way analysis of variance (ANOVA) (Table 5).
The results revealed significant main effects (p ≤ 0.05) of both factors on several key growth traits, particularly plant height and biomass-related parameters. Significant IS × WQ interactions were observed for plant height, root fresh and dry weights, and dry biomass components of stems and above-ground parts, indicating that okra growth responses varied according to the combined irrigation management practices.
Overall, WQ exerted a stronger influence on okra growth than the irrigation system itself (Table 6). Treated wastewater consistently resulted in higher values for most measured growth parameters compared to well water.
Specifically, plant height increased by 53% under TWW relative to WW (p ≤ 0.05), highlighting the fertilizing effect of treated wastewater on vegetative development. TWW also significantly enhanced stem fresh and dry weights, as well as total aerial fresh and dry biomass (p ≤ 0.05). Although fresh and dry root weights and trunk diameter did not differ significantly between water types, these parameters showed a consistent upward trend under TWW.
The irrigation system also affected okra growth, albeit to a lesser extent than water quality (Table 6). SDI significantly improved plant height and biomass accumulation compared to DI. Under SDI, plant height increased by 46%, while stem fresh weight, stem dry weight, and above-ground dry biomass increased by 30%, 27%, and 22%, respectively (p ≤ 0.05). In contrast, trunk diameter, leaf biomass, and root biomass were not significantly influenced by IS, suggesting that SDI primarily promoted vertical growth and stem development.
The observed interaction effects between WQ and IS further indicate that combining SDI with treated wastewater provides optimal conditions for okra growth. This combined management approach maximized biomass accumulation, particularly in stems and aerial plant parts, reflecting improved water and nutrient availability in the root zone while minimizing evaporation losses. These results underline the complementary role of subsurface drip irrigation and treated wastewater reuse in enhancing okra agronomic performance under water-limited conditions.

3.4.2. Effects of Irrigation Water Quality and Irrigation System on Yield and Physiological Parameters

Table 7 presents the effects of irrigation water quality, irrigation system, and their interaction on okra fruit yield, plant water content, and irrigation water use efficiency (IWUE). The analysis revealed that WQ significantly influenced fruit yield and IWUE (p ≤ 0.05), whereas the IS had a significant effect on fruit yield only.
Treated wastewater irrigation resulted in a significantly higher fruit yield compared to well water, with an increase of 16.3% (p ≤ 0.05). In addition, IWUE was improved by 20% under TWW irrigation, indicating a more efficient conversion of applied water into marketable yield. These findings confirm the beneficial role of TWW reuse in boosting crop productivity while optimizing water-use efficiency due to its intrinsic nutrient content.
The irrigation system also notably affected okra yield, as subsurface drip irrigation (SDI) increased fruit yield by approximately 15% compared to surface drip irrigation (DI) (p ≤ 0.05). However, no significant differences in IWUE were observed between irrigation systems (p ≥ 0.05). Furthermore, the interaction between WQ and IS was not significant for either fruit yield or IWUE, suggesting that the effects of water quality and irrigation method were largely independent.
Regarding physiological parameters, leaf and above-ground plant water content at harvest were significantly higher under WW irrigation (p ≤ 0.05), whereas root water content was not affected by WQ or IS. These variations may reflect differences in plant developmental stages and growth dynamics at harvest rather than direct treatment effects. Specifically, the lower water content in TWW-irrigated plants might be associated with a more advanced maturation stage induced by the higher nutrient availability.

3.5. Nutrient Status and Trace Metal Accumulation in Okra at Final Harvest

3.5.1. Effects of Irrigation Water Quality and Irrigation System on Leaf Nutrient Concentrations and Fruit Metal Accumulation

Table 8 presents the individual and interactive effects of irrigation water quality and irrigation system on leaf macronutrient concentrations and trace metal accumulation in okra fruits at final harvest. Two-way ANOVA revealed that WQ significantly influenced cadmium (Cd) and nickel (Ni) accumulation in fruits, as well as sodium (Na), phosphorus (P), and potassium (K) concentrations in leaves (p < 0.05).
Cadmium (Cd) concentration in fruits was markedly higher under TWW irrigation, reaching values approximately six times greater than those observed under WW. When expressed on a fresh weight basis, Cd levels exceeded the maximum permissible limits established by [69]. In contrast, fruit Ni concentration decreased by 16.3% under TWW compared to WW. Despite these differences, lead (Pb) and cobalt (Co) concentrations in fruits were not significantly affected by WQ.
Treated wastewater significantly enhanced plant mineral nutrition, increasing Na, P, and K concentrations in leaves by 81%, 19%, and 41%, respectively, compared to WW. Similar increasing trends were observed in fruits (Table 8). These results highlight the fertilizing potential of TWW, particularly for macronutrients essential to plant growth and development.
The irrigation system had no significant effect on Cd and Ni concentrations in fruits; however, it significantly affected Pb and Co accumulation. Subsurface drip irrigation reduced fruit Pb content by 37.1% compared to surface drip irrigation, while increasing Co concentration by 26.7% (p < 0.05). Leaf phosphorus content was also significantly higher under SDI, whereas Na and K concentrations in leaves and fruits were not influenced by irrigation system. A significant WQ × IS interaction was observed only for fruit Ni and leaf P concentrations, suggesting that the effect of water quality on these specific parameters depends on the delivery method.

3.5.2. Distribution and Translocation of Trace Metals Within the Soil–Plant System

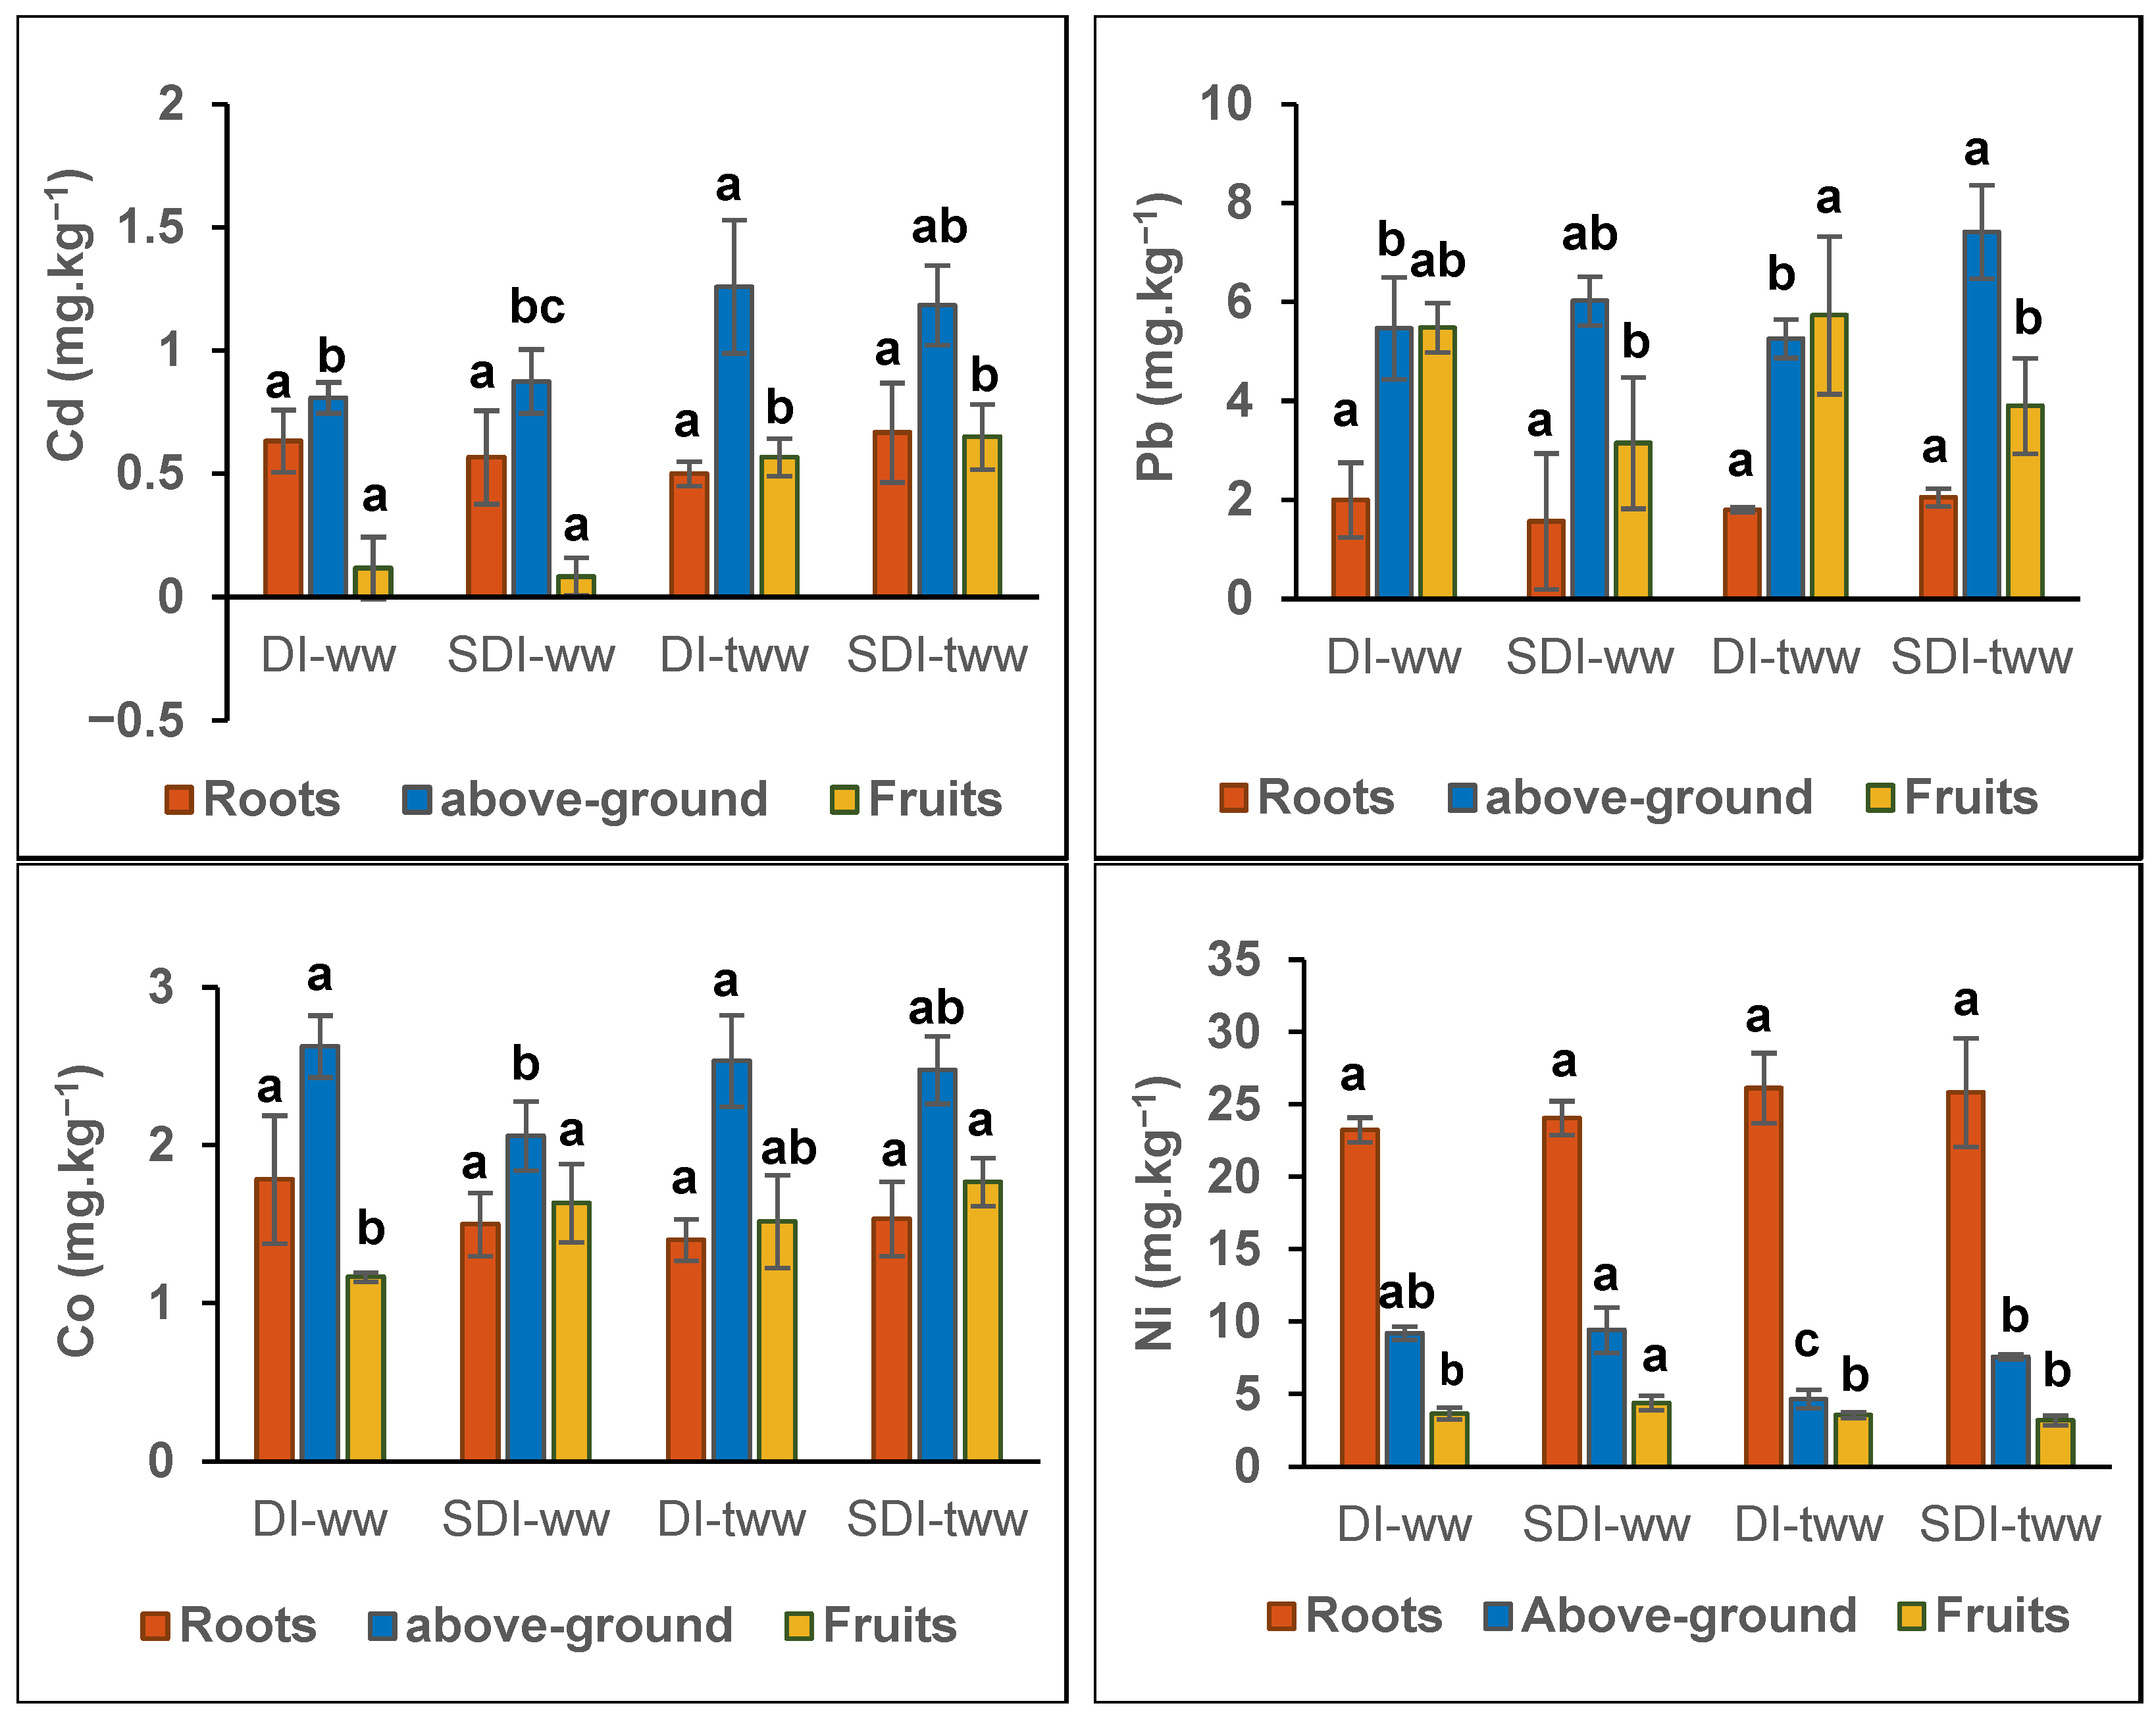
The distribution of trace metals within different okra organs at final harvest provides insight into metal translocation mechanisms under contrasting irrigation strategies (Figure 4).
Overall, when expressed on a fresh weight basis, PTE concentrations in fruits remained below established phytotoxicity and food safety thresholds, irrespective of water quality or irrigation system. However, cadmium (Cd) represented an exception, as its concentrations exceeded the recommended limits in some samples. Nevertheless, under the experimental conditions, the overall levels of the analyzed PTEs suggest that no widespread acute metal toxicity risk is expected for human consumption.
Statistical analysis revealed no significant treatment effects on Cd, Pb, Co, and Ni accumulation in the roots. In general, higher concentrations of Cd, Pb, and Co were detected in the aerial parts and fruits, whereas Ni predominantly accumulated in the roots, suggesting a restricted upward translocation of this specific element. This pattern indicates that roots act as a physiological barrier limiting Ni transfer to the edible organs.
TWW significantly increased Cd and Co concentrations in the fruits, with the highest values observed under SDI combined with TWW irrigation. In contrast, maximum fruit Ni concentrations were recorded under WW irrigation, particularly under SDI. These findings suggest that irrigation water quality primarily controls the metal input into the soil–plant system, while the irrigation system modulates metal mobility and subsequent redistribution within the plant tissues.

3.5.3. Mass Balance and Theoretical Loading of Trace Metal Elements

The mass balance analysis reveals that for all studied elements (Cd, Pb, Co, and Ni), the total input from treated wastewater (TWW) significantly exceeds the amount exported by the okra biomass. As shown in Table 9, the plant’s total export represents only a small fraction of the added metals (ranging from 13% to 25% for the total load).
This result indicates that a substantial portion of the trace metals remains in the soil system. Interestingly, the SDI-TWW system shows the highest total export (137.5 g. ha−1) and the lowest theoretical soil retention for Ni and Pb compared to DI-TWW. This suggests that subsurface irrigation not only improves water use efficiency but also slightly enhances the phyto-extraction potential of the okra crop by placing the nutrients and metals directly in the active root zone. However, since the concentrations in the fruits remain below international safety limits, this ‘soil accumulation’ confirms the soil’s buffering capacity, where the soil matrix acts as the primary sink, protecting the food chain from immediate contamination during a single growing season.

4. Discussion

The discussion is organized in two parts, first addressing the quality of irrigation water, and then examining the combined effects of irrigation water quality and irrigation system on soil properties, okra growth, nutrition, and trace metal accumulation.

4.1. Quality Assessment of Irrigation Water Sources

Irrigation water quality is a key factor affecting crop productivity, soil functioning, groundwater integrity, and environmental sustainability. Depending on its composition, irrigation water may enhance soil fertility by supplying essential minerals and organic nutrients or, conversely, degrade soil quality through the accumulation of toxic elements [57,71]. In this study, both irrigation water sources exhibited pH values within the acceptable range for agricultural reuse (6–9), indicating no immediate risk of soil acidification or alkalinization (Table 3), in agreement with [30]. Electrical conductivity (EC) exceeded 1 mS·cm−1 for both waters, indicating saline conditions, although values remained below Tunisian regulatory limits. The higher EC of the WW (3.9 mS·cm−1) was mainly associated with elevated Mg2+ and Cl concentrations (Table 3), reflecting regional groundwater salinization processes that have been previously linked to seawater intrusion caused by groundwater overexploitation [72].
Compared to WW, the TWW contained higher concentrations of essential plant nutrients, particularly nitrogen, phosphorus, and potassium, confirming its fertilizing potential and its capacity to enhance soil fertility and plant physiological performance [73]. These findings are consistent with earlier work in the same study area, where long-term TWW irrigation led to substantial nutrient accumulation in soils [28]. Nitrogen in the TWW was predominantly present in ammoniacal form (NH4+), which is likely due to incomplete oxidation during the secondary treatment process. In contrast, the WW contained nitrogen mainly as nitrate (NO3), with concentrations exceeding the WHO drinking water guideline value of 50 mg·L−1 [74].
The predominance of ammoniacal nitrogen in TWW, likely resulting from incomplete nitrification during secondary treatment, represents both an agronomic advantage and a management challenge, as NH4+ can stimulate plant growth while simultaneously influencing soil microbial activity [75,76]. Chemical oxygen demand (COD) in the TWW slightly exceeded Tunisian standards NT 106.03 [66], indicating residual organic pollution related to suspended and dissolved solids [75]. Although the TWW generally exhibited lower concentrations of Cu2+, Ni2+, and Zn2+ than the WW, levels of Co2+, Fe2+, and Pb2+ were comparable between the two water sources. Prolonged irrigation with such water may affect soil microbial activity and nutrient dynamics [76,77]. Poor treated wastewater quality during peak irrigation periods has been widely reported in Tunisia, where treatment plants often operate beyond their design capacity; indeed [78] showed that only a limited number of treatment facilities comply with national standards.
Comparison with historical data [79], indicated a long-term deterioration of groundwater quality, characterized by increased salinity and higher Na+ and Cl concentrations, mainly attributed to marine intrusion, groundwater overexploitation, and climate change-induced rainfall scarcity [72]. Elevated nitrate levels are also linked to excessive mineral and organic fertilization as well as uncontrolled wastewater irrigation exceeding crop requirements, particularly in sandy soils where percolation enhances groundwater recharge [22,80]. Similar trends of groundwater degradation due to wastewater discharge have been reported in other regions, such as Pakistan [81]. Comparable impacts on human health through contaminated drinking water, crops, and livestock have also been documented [82]. Although current trace element concentrations remain below Tunisian toxicity thresholds, their progressive increase highlights the need for continuous monitoring and integrated water management to safeguard environmental and public health.

4.2. Soil Chemical Responses to Water Quality and Irrigation System

Despite these marked differences in water composition, soil pH remained stable across all treatments regardless of water quality, irrigation system, or soil depth (Table 4), reflecting a strong soil buffering capacity and the relatively short duration of TWW application. This stability is consistent with recent studies demonstrating that treated wastewater rarely induces rapid pH shifts due to buffering mechanisms involving carbonates, organic matter, and biologically mediated reactions [83,84,85]. Similar observations have been reported under short- to medium-term wastewater irrigation, where no significant pH shifts were detected despite increased nutrient and salt inputs [28,86], supporting the notion that pH is a relatively conservative parameter in buffered soils. More broadly, the literature indicates that significant pH shifts generally occur only after prolonged wastewater irrigation and depend on water composition and soil mineralogy [87]. For instance, pH reductions were often reported under untreated wastewater irrigation, but not under treated wastewater [88], highlighting the importance of treatment efficiency. Overall, our results support the growing consensus that well-managed TWW reuse can preserve soil pH and avoid immediate risks of acidification or alkalinization [73,84]. Furthermore, the absence of significant pH modification played a key role in interpreting trace metal behavior, given that soil pH is a primary regulator of metal solubility and mobility [89,90], with implications that will be further evidenced at the plant bioaccumulation level.
Similarly, soil electrical conductivity (EC) was not significantly affected by irrigation water quality, consistent with studies showing that short-term TWW irrigation does not necessarily induce rapid soil salinization [91]. However, EC exhibited clear vertical and system-related patterns. Surface drip irrigation (DI) resulted in higher EC values in the upper soil layers compared to subsurface drip irrigation (SDI), reflecting enhanced evaporation and salt accumulation near the surface [92]. Soil depth emerged as the dominant factor controlling electrical conductivity (EC), sodium (Na+) concentration, and sodium adsorption ratio (SAR) (Table 4), with deeper layers accumulating higher levels of soluble salts and sodium, indicating downward salt movement with percolating water. Conversely, calcium (Ca2+), magnesium (Mg2+), potassium (K+) and cation exchange capacity (CEC) were concentrated in the surface horizons, underscoring the soil’s key role in regulating solute redistribution under irrigated conditions [93]. This surface-level enrichment reflects the preferential downward movement of monovalent cations supplied by irrigation water, contrasting with the accumulation of divalent cations and organic matter in biologically active layers. Such a mechanism enhances surface CEC and nutrient retention [68,94,95], thereby stabilizing the chemical fertility of the topsoil despite the continuous application of saline marginal water.
Irrigation water quality significantly influenced soil cation dynamics (Table 4), as TWW increased Na+ concentrations and SAR while reducing Mg2+ and K+ levels, consistent with the tendency of sodium-rich reclaimed waters to displace divalent cations from exchange sites [68]. These trends align with recent findings, where TWW irrigation enhanced nutrient availability but increased salinity and sodicity risks in deeper soil layers [91,94]. Although these changes did not yet translate into critical thresholds, they suggest that salinity and sodicity development are gradual processes that depend strongly on irrigation management and soil texture [91,92]. This chemical shift toward higher SAR directly influences the physical stability of the soil matrix. The structural condition of the soil was significantly influenced by both the water quality and the irrigation technique. Our results indicate that the application of TWW contributed a continuous supply of dissolved organic matter (DOM) and suspended solids, which can act as a binding agent to promote soil aggregation over time [27]. However, a potential risk often associated with TWW is the increase in the Sodium Adsorption Ratio (SAR), which can lead to clay dispersion and the clogging of macropores.
Our study highlights a clear advantage of the SDI system over DI in preserving soil structural integrity. In DI plots, the direct impact of water on the surface, coupled with evaporation-driven salt accumulation, increased the risk of surface sealing and soil structural degradation [96,97]. Conversely, by delivering water at a 20 cm depth, SDI maintained a stable moisture gradient and minimized surface mechanical disturbance, preventing physical crusting and preserving the water reserve (43.61 mm) through enhanced pore connectivity [98]. Despite the high sand content of our loamy sand (Haplic Fluvisol), SDI proved crucial in preventing the structural degradation of finer silty-clay fractions. This preserved connectivity facilitated efficient vertical solute transport, avoiding the surface-level stagnation observed under DI [99].
These depth-dependent patterns of solute migration are clearly illustrated in Figure 3, where soluble cation concentrations (Na+, Ca2+, and Mg2+) exceeded background levels in the lower soil layer under both water qualities. Such accumulation reflects the combined effects of gravity-driven downward water redistribution, spatially heterogeneous soil moisture conditions under drip emitters, and a limited effective root water uptake zone, processes commonly reported for drip-irrigated systems in semi-arid environments [100]. Specifically, the single effects of WQ or IS on soluble cations in the two soil layers (surface and bottom) showed no significant impact on soil K+ concentration, consistent with pre-irrigation (background) values. This aligns with recent findings indicating that K+ is often more readily absorbed by crops, particularly under TWW irrigation, which may explain its stable levels despite higher K+ concentrations in TWW [85].
In contrast, Na+ concentrations in the bottom soil layer showed a slight increase compared to background values; however, this difference was not statistically significant (p > 0.05). Conversely, Ca2+ and Mg2+ concentrations significantly exceeded background levels after irrigation (p ≤ 0.05). The observed enrichment of these divalent cations at depth is consistent with previous reports indicating their redistribution within the soil profile, driven by irrigation water movement [95]. The slower uptake of Na+, Ca2+, and Mg2+ compared to their supply rate from irrigation water further supports this observation, as documented in recent research on cation mobility under TWW irrigation [96]. Furthermore, the interaction between water quality and soil depth (WQ x H) revealed that WW significantly increased Ca2+ and Mg2+ concentrations in both soil layers, likely due to the higher baseline concentrations of these elements in the WW [91].
The irrigation system played a pivotal role in modulating these processes. Surface drip irrigation (DI) favored salt and cation accumulation in the upper soil layers due to enhanced evaporation and upward solute transport [85,92,96,101,102,103], whereas subsurface drip irrigation (SDI) promoted a more uniform distribution of water and solutes within the root zone, thereby limiting surface salinization [85]. Indeed, SDI is considered one of the safest methods to apply treated wastewater to crops as it allows the application of the effluent directly to the root zone at low flow rates, reducing leaching and evaporation, increasing the absorption efficiency of nutrients and water, while keeping the upper soil layer relatively dry, thereby reducing weed development [104]. These system-induced differences are particularly important under marginal water use, underscoring the soil’s pivotal buffering role, which acts as a regulator that mediates the transfer of waterborne elements toward plant roots.

4.3. Plant Growth, Biomass Production, and Yield Responses

These soil-level processes translated directly into plant responses. The combined effects of nutrient-enriched TWW and improved water delivery under SDI were reflected in biomass production and yield formation. Analysis of variance showed significant effects of both factors on biomass components (Table 5). Furthermore, mean comparisons revealed that TWW markedly increased leaf, stem, root, and total biomass, particularly under SDI (Table 6). Enhanced leaf dry biomass under TWW highlights the central role of nitrogen availability in stimulating photosynthetic capacity and vegetative growth, consistent with previous observations on various crops irrigated with reclaimed water under semi-arid conditions [11,18,29,39,76,105]. These findings corroborate reports that long-term wastewater irrigation enhances soil fertility through organic matter inputs and nutrient accumulation, thereby supporting higher crop productivity [30,106]. The superiority of SDI in increasing stem and total aboveground dry biomass, irrespective of water quality, underscores the importance of irrigation system efficiency in maintaining favorable soil moisture conditions and minimizing evaporative losses [29,39,107,108,109]. Furthermore, the application of reclaimed water under SDI has been shown to conserve freshwater resources while enhancing crop productivity without inducing negative effects on the investigated soil properties [86].
Fruit yield and irrigation water use efficiency (IWUE) displayed trends similar to those observed for biomass components. TWW increased yield by 16.3% and IWUE by 20%, in agreement with meta-analyses reporting yield gains of up to 19–20% under wastewater irrigation [110]. While yield improvements were primarily attributable to the nutrient inputs, gains in IWUE were largely linked to the adoption of subsurface drip irrigation (SDI) [111]. Similar enhancements in water productivity under wastewater irrigation have been attributed to the combined supply of water and nutrients [29]. Under well water (WW) irrigation, the absence of a marked SDI effect on IWUE further indicates that water quality was the dominant factor controlling water productivity. Variations in leaf and root water content suggest that okra plants adjusted their physiological functioning in response to both irrigation water quality and the irrigation system. Higher leaf water content under WW may reflect slower growth rates and a dilution effect, as observed under nutrient-limited conditions [112], whereas stable root water content across treatments indicates effective osmotic regulation and maintained water uptake under contrasting irrigation regimes [113]. Collectively, these findings reinforce the concept that reclaimed water reuse, when combined with efficient irrigation systems, can support sustainable intensification in water-limited regions [114].

4.4. Trace Metal Accumulation and Food Safety Implications

Trace metal accumulation in fruits provides critical insight into potential food safety implications. Importantly, since no trace metal analyses were conducted on soil samples in this study, the interpretation is restricted to irrigation water composition (Table 3), fruit metal concentrations, and metal levels measured in plant roots and aerial parts (Table 8; Figure 4). Irrigation with treated wastewater (TWW) significantly increased Cd concentrations in okra fruits; however, based on fresh weight these levels remained below international food safety thresholds (Table 8), consistent with numerous studies reporting no associated health risks under controlled wastewater reuse conditions [30,115,116]. This safety margin is further supported by the theoretical mass balance analysis (Table 9), which shows that only a small fraction of the total metal loading (TML) from the TWW was actually exported by the okra biomass (12.7% to 24.9%). The significant positive balance (Input–Output) reinforces the hypothesis that the soil matrix acts as the primary buffer, effectively retaining the majority of the applied PTEs. Previous investigations have nevertheless shown that both adults and children consuming crops grown under wastewater irrigation may ingest appreciable amounts of the studied metals [33], although health risk index values below 1 indicate a relative absence of health risks associated with the consumption of contaminated vegetables [33].
By contrast, a large-scale meta-analysis encompassing 95 studies demonstrated that, although heavy metal concentrations in treated wastewater often comply with regulatory limits, toxic elements such as Pb, Cd, Ni, Cr, and As frequently exceed permissible thresholds in soils and edible plant tissues [117]. This synthesis further revealed that heavy metal concentrations in edible vegetable parts were amplified by a factor of three to nine compared with crops irrigated using freshwater sources [117]. This apparent paradox, continuous metal inputs through TWW irrigation coupled with limited accumulation in plant tissues, underscores the central role of soil–plant interactions in regulating metal transfer [118]. In our case, the unaccounted fraction observed in Table 9 provides quantitative evidence that while immediate food safety concerns are minimized, a significant portion of the applied metals remains within the soil profile. This progressive accumulation highlights a critical sustainability challenge for long-term wastewater reuse, necessitating adaptive monitoring strategies to track soil loading trends and prevent future environmental degradation.
Although TWW represents a recurrent source of Cd, neutral to slightly alkaline soil conditions favor strong adsorption onto carbonates and clay minerals under stable pH conditions, thereby reducing metal mobility and root uptake [96,115]. At the plant level, physiological regulation further limits heavy metal translocation to aerial and edible organs [119], resulting in restricted accumulation despite sustained irrigation inputs. Comparable increases in Cd concentrations under wastewater irrigation have been reported for cabbage, lettuce, green beans, and pepper relative to freshwater irrigation [120]. Nevertheless, average hazard quotient (HQ) and carcinogenic risk (CR) values for Cd in wastewater-irrigated vegetables remained low (HQ < 1) and within permissible ranges. This pattern is primarily attributed to continuous low-dose inputs from reclaimed water rather than enhanced soil metal mobility [114]. Although short-term results indicated no immediate health risk, the observed increase in Cd concentrations under TWW irrigation, particularly under subsurface drip irrigation (SDI), underscores the need for cautious long-term management, as repeated wastewater application may progressively increase soil metal stocks and plant uptake over time [116].
Analysis of other trace elements showed that Ni accumulation in fruits decreased under TWW irrigation, whereas Pb and Co concentrations exhibited limited sensitivity to water quality (Table 8). This highlights the strong influence of soil chemical conditions, particularly pH stability, organic matter inputs, and carbonate content on metal immobilization and phytoavailability [89,120]. Moreover, higher Ni concentrations observed in fruits under WW irrigation (Table 8) indicate that irrigation water composition may constitute a dominant source of specific trace metals, independently of soil properties and irrigation system effects. Several studies have demonstrated that nickel present in irrigation water can be readily taken up by plants and translocated to edible tissues even when soils exhibit low background contamination [121,122] highlighting the direct contribution of irrigation water to Ni accumulation in crops [102].
Irrigation system effects were more evident for certain metals. The contrasting responses of Pb and Co to (SDI) with treated wastewater reflect metal-specific soil–plant interactions rather than inconsistencies in irrigation performance. Reduced Pb accumulation in fruits under SDI is consistent with enhanced immobilization driven by stable soil moisture, pH regulation, carbonate presence, and increased organic carbon inputs, which collectively limit Pb mobility and translocation to edible tissues [89,90,121]. In contrast, Co exhibited higher accumulation in fruits (Table 8), likely due to greater sensitivity to dissolved organic carbon and rhizosphere processes promoting metal mobility under sustained moisture conditions. As a relatively mobile and biologically active trace element, Co may remain phytoavailable even under irrigation systems that effectively limit the uptake of strongly sorbed metals such as Pb [122]. These findings align with previous studies on cauliflower and maize indicating that SDI generally minimizes the uptake of immobile heavy metals while exerting a more nuanced influence on elements with higher mobility and biological activity [123,124]. For example, SDI has been shown to significantly reduce cadmium accumulation in pepper plants compared with other irrigation methods [125], and to result in lower soil Cd and Pb levels relative to sprinkler or flood irrigation systems [126].
Bioaccumulation patterns (Figure 4) further indicate the preferential retention of certain metals in belowground tissues, thereby limiting translocation to fruits. The preferential retention of Ni in roots compared with aerial organs suggests the presence of physiological barriers restricting internal metal transfer, commonly associated with selective xylem loading, vacuolar sequestration, and limited internal mobility [127]. Although nickel is considered highly phloem-mobile and tends to accumulate in actively growing tissues such as root tips and shoot apices [128], its movement to edible organs may remain restricted under specific conditions. Similar exclusion strategies have been reported for several vegetable species, involving limited root-to-shoot translocation of metals such as Cd, Pb, and Ni, as illustrated by predominant Pb and Cd accumulation in roots of Ipomoea aquatica [129]. Likewise, studies on Brassica juncea L. have shown that Zn and Ni may exhibit high accumulation with significant shoot translocation, whereas Pb and Hg are predominantly retained in roots, reflecting contrasting phytoextraction and phytostabilization potentials [130].
Taken together, these results demonstrate that TWW reuse, when combined with subsurface drip irrigation, enhances crop productivity while maintaining trace metal concentrations in edible parts within acceptable limits in the short term. Soil buffering capacity plays a central role in moderating the transfer of salts and metals from irrigation water to plants, and SDI further supports this regulation by stabilizing the root-zone environment. Nevertheless, in line with long-term assessments in similar agroecosystems, the cumulative nature of salt and trace metal inputs under continuous TWW irrigation warrants sustained monitoring and adaptive management to prevent progressive soil degradation and potential food chain contamination, thereby ensuring the long-term preservation of soil quality and food safety [90,107,108].

4.5. Human Health Risk Assessment of Okra Consumption

The health risk assessment, based on the Daily Intake of Metals (DIM) and the Health Risk Index (HRI), was conducted for both adults and children to evaluate the safety of okra fruit consumption (Table 10).
It is important to distinguish the risk assessment of Cobalt (Co) from other potentially toxic elements (PTEs). Unlike Lead (Pb) or Cadmium (Cd), Cobalt is an essential micronutrient for human physiology; however, excessive intake can lead to non-carcinogenic health issues. In the absence of a standardized oral Reference Dose (RfD) for Cobalt in the US-EPA Integrated Risk Information System (IRIS) database, an indicative RfD of 0.03 mg·kg−1·day−1 was adopted for this study. This value is widely recognized in recent toxicological literature for assessing health risks in wastewater-irrigated crops [63]. The calculated HRI for Co in all treatments remained extremely low (≤0.04), indicating that while Co accumulation is present, it does not pose a dietary risk to either adults or children under the current experimental conditions.
Overall, all calculated HRI values for cadmium (Cd), lead (Pb), nickel (Ni), and cobalt (Co) remained consistently below the unity threshold (HRI < 1), indicating the absence of any immediate non-carcinogenic toxic risk for the local population. However, a detailed treatment-specific analysis reveals that lead (Pb) presented the highest risk indices, particularly for children consuming fruits from surface drip irrigation treatments (DI-TWW), where the HRI reached 0.86, a value approaching the safety limit. Conversely, the adoption of subsurface drip irrigation (SDI) significantly reduced lead exposure, with the index dropping to 0.59 for the SDI-TWW treatment in children, thereby confirming the protective role of this irrigation system. Regarding cadmium, although values remain within the safe zone, a notable increase in risk was observed with the use of treated wastewater (TWW), where the HRI was more than six times higher than that of well water (WW) treatments. Nickel and cobalt exhibited very low risk indices, never exceeding 0.13, highlighting their minimal toxicological impact in this experimental context. Globally, the child population appeared more vulnerable to the transfer of potentially toxic elements (PTEs), with HRI values systematically higher than those of adults across all studied treatments, a trend that aligns with the findings of [131]. These results are further supported by [132], regarding the accumulation patterns in wastewater-irrigated vegetables and by [133], concerning the health risks associated with the consumption of contaminated vegetables.

5. Conclusions

This study demonstrates that treated wastewater (TWW) reuse, when combined with subsurface drip irrigation (SDI), constitutes a viable short-term strategy for vegetable production in water-scarce environments. Crop productivity gains were primarily driven by nutrient inputs from TWW, whereas SDI improved irrigation water use efficiency by stabilizing root-zone conditions and moderating salt redistribution. Under the conditions of this single growing season, soil buffering capacity effectively limited short-term risks of salinization and sodicity.
Although TWW irrigation increased cadmium concentrations in okra fruits, the levels generally remained below the international safety limits reported by [70], when expressed on a fresh weight. However, Cd concentrations in some samples exceeded the more stringent maximum levels established by the [69]. Despite this, the partitioning patterns of PTE indicate that soil chemical properties and plant regulatory mechanisms limited their translocation to fruits, thereby reducing potential food safety risks.
While these preliminary results are promising, the cumulative input of salts and trace metals under continuous wastewater reuse calls for sustained monitoring and adaptive management to prevent progressive soil degradation and potential food chain contamination. Long-term sustainability will depend on integrated strategies that align irrigation water quality, system performance, and soil–plant interactions under prolonged reuse conditions.

Author Contributions

Conceptualization: M.N.K.; Methodology: M.N.K.; Investigation: R.G.; Data curation: R.G.; Formal analysis: R.G.; Visualization: M.N.K.; Writing—original draft preparation: M.N.K.; Writing—review and editing: M.N.K. and R.G.; Supervision: M.N.K. All authors have read and agreed to the published version of the manuscript.

Funding

This research was funded by the European Research Executive Agency (REA) under the HORIZON-CL6-2024-FARM2FORK-01 program, TRAN-SAHRA project, grant agreement No. [101182176].

Data Availability Statement

All data presented in this study will be available upon request to the corresponding author via email.

Acknowledgments

Author acknowledges financial support from the European Research Executive Agency (REA). We would like to express our deep gratitude to the Trans-Sahara Project for its invaluable support, which made the publication of this work possible. Its support reflects an unwavering commitment to the advancement of knowledge, and we are sincerely grateful for it.

Conflicts of Interest

The authors declare no conflicts of interest. The funders had no role in the design of the study; in the collection, analysis, or interpretation of data; in the writing of the manuscript; or in the decision to publish the results.

References

  1. Onagri. National Report of the Water Sector Year 2021. Republic of Tunisia Ministry of Agriculture, Water Resources and Fisheries, Office of Planning and Hydraulic Balancing. RNE_2021_V-Anglaise.pdf.
  2. Emmanouil, C.; Manakou, V.; Papamichael, I.; Zopra, A.A.; Bobori, D.; Kungolos, A. Farmers’ opinions on Lake Koronia management as an indispensable factor in integrated water management. Euro-Mediterr. J. Environ. Integr. 2024, 9, 293–309. [Google Scholar] [CrossRef] [Scilit]
  3. Jones, E.R.; Van Vliet, M.T.H.; Qadir, M.; Bierkens, M.F.P. Country-level and gridded estimates of wastewater production, collection, treatment and reuse. Earth Syst. Sci. Data 2021, 13, 237–254. [Google Scholar] [CrossRef] [Scilit]
  4. Dellavia, A.; Marković, M.; Habuda-Stanić, M.; Kovačić, Đ.; Bubalo, A.; Popović, B. Wastewater-Based Crop Irrigation: An Issue or a Solution? Poljoprivreda 2023, 29, 43–52. [Google Scholar] [CrossRef] [Scilit]
  5. Ghernaout, D.; Elboughdiri, N.; Al Arni, S. Water Reuse (WR): Dares, Restrictions, and Trends. Appl. Eng. 2019, 3, 159–170. [Google Scholar]
  6. Poustie, A.; Yang, Y.; Verburg, P.; Pagilla, K.; Hanigan, D. Reclaimed wastewater as a viable water source for agricultural irrigation: A review of food crop growth inhibition and promotion in the context of environmental change. Sci. Total Environ. 2020, 739, 139756. [Google Scholar] [CrossRef] [Scilit] [PubMed]
  7. Hashem, M.S.; Qi, X. Treated Wastewater Irrigation-A Review. Water 2021, 13, 1527. [Google Scholar] [CrossRef] [Scilit]
  8. Ilahi, H.; Adnan, M.; Ur Rehman, F.; Hidayat, K.; Amin, I.; Ullah, A.; Subhan, G.; Hussain, I.; Rehman, M.U.; Ullah, A. Waste Water Application: An Alternative Way to Reduce Water Scarcity Problem in Vegetables: A Review. Ind. J. Pure Appl. Biosci. 2021, 9, 240–248. [Google Scholar] [CrossRef] [Scilit]
  9. Ganjegunte, G.; Ulery, A.; Niu, G.; Wu, Y. Organic carbon, nutrient, and salt dynamics in saline soil and switchgrass (Panicum virgatum L.) irrigated with treated municipal wastewater. Land Degrad. Dev. 2018, 29, 80–90. [Google Scholar] [CrossRef] [Scilit]
  10. Abd-Elwahed, M.S. Influence of long-term irrigation with wastewater on soil quality and its spatial distribution. Ann. Agric. Sci. 2018, 63, 191–199. (In French) [Google Scholar] [CrossRef] [Scilit]
  11. Fonseca, A.; Melfi, A.; Monteiro, F.; Montes, C.; Almeida, V.; Herpin, U. Treated sewage effluent as a source of water and nitrogen for Tifton 85 bermudagrass. Agric. Water Manag. 2007, 87, 328–336. [Google Scholar] [CrossRef] [Scilit]
  12. Pedrero, F.; Alarcon, J.J. Effect of treated wastewater irrigation on lemon trees. Desalination 2009, 246, 631–639. [Google Scholar] [CrossRef] [Scilit]
  13. Xu, J.; Wu, L.; Chang, A.C.; Zhang, Y. Impact of long-term reclaimed wastewater irrigation on agricultural soils: A preliminary assessment. J. Hazard. Mater. 2010, 183, 780–786. [Google Scholar] [CrossRef] [Scilit] [PubMed]
  14. Jaiswal, D.; Eliott, H.A. Long-term phosphorus fertility in wastewater-irrigated cropland. J. Environ. Qual. 2011, 40, 214–223. [Google Scholar] [CrossRef] [Scilit]
  15. Maaß, O.; Grundmann, P. Governing Transactions and Interdependences between Linked Value Chains in a Circular Economy: The Case of Wastewater Reuse in Braunschweig (Germany). Sustainability 2018, 10, 1125. [Google Scholar] [CrossRef] [Scilit]
  16. Gu, X.; Xiao, Y.; Yin, S.; Liu, H.; Men, B.; Hao, Z.; Qian, P.; Yan, H.; Hao, Q.; Niu, Y. Impact of long-term reclaimed water irrigation on the distribution of potentially toxic elements in soil: An in-situ experiment study in the north China plain. Int. J. Environ. Res. Public Health 2019, 16, 649. [Google Scholar] [CrossRef] [Scilit]
  17. Liu, X.; Liu, J.; Huang, C.; Liu, H.; Meng, Y.; Chen, H.; Ma, S.; Liu, Z. The impacts of irrigation methods and regimes on the water and nitrogen utilization efficiency in subsoiling wheat fields. Agric. Water Manag. 2024, 295, 108765. [Google Scholar] [CrossRef] [Scilit]
  18. Khelil, M.N.; Rejeb, S.; Henchi, B.; Destain, J.P. Effect of fertilizer rate and water irrigation quality on the recovery of 15N-labeled fertilizer applied to Sudangrass. Agronomy 2005, 25, 137–143. [Google Scholar] [CrossRef] [Scilit]
  19. Khelil, M.N.; Rejeb, S.; Henchi, B.; Destain, J.P. Effects of irrigation water quality and nitrogen rate on the recovery of 15N fertilizer by sorghum in field study. Commun. Soil Sci. Plant Anal. 2013, 44, 2647–2655. [Google Scholar] [CrossRef] [Scilit]
  20. Martínez, S.; Suay, R.; Moreno, J.; Sergura, M.L. Reuse of tertiary municipal wastewater effluent for irrigation of Cucumis melo L. Irrig. Sci. 2013, 31, 661–672. [Google Scholar] [CrossRef] [Scilit]
  21. Pedrero, F.; Maestre-Valero, J.F.; Mounzer, O.; Alarcón, J.J.; Nicolás, E. Physiological and agronomic mandarin trees performance under saline reclaimed water combined with regulated deficit irrigation. Agric. Water Manag. 2014, 146, 228–237. [Google Scholar] [CrossRef] [Scilit]
  22. Khelil, M.N.; Rejeb, S.; Destain, J.P.; Xanthoulis, D. Does fertilization practices increase residual nitrate nitrogen in soil irrigated with treated wastewater? An experimental trial on maize. Int. J. Environ. Agric. Biotechnol. 2017, 2, 819–830. [Google Scholar] [CrossRef] [Scilit]
  23. Mannina, G.; Gulhan, H.; Ni, B.J. Water reuse from wastewater treatment: The transition towards circular economy in the water sector. Bioresour. Technol. 2022, 363, 127951. [Google Scholar] [CrossRef] [Scilit] [PubMed]
  24. Ghimire, U.; Sarpong, G.; Gude, V.G. Transitioning Wastewater Treatment Plants toward Circular Economy and Energy Sustainability. ACS Omega 2021, 6, 11794–11803. [Google Scholar] [CrossRef] [Scilit] [PubMed]
  25. Khelil, M.N.; Destain, J.P.; Rejeb, S.; Henchi, B. Lateral Losses of 15N-Fertilizer on a Sandy Soil and Its Impact on PlantN-Recovery in Irrigated Sudangrass. ARNP J. Sci. Technol. 2012, 2, 257–264. [Google Scholar]
  26. Sabbahi, S.; Awatef Rouissi, A.; Askri, H.; Ben Ayed, L.; Karanis, P. From wastewater treatment plants to Oued Souhil agricultural experimentation unit: A study of treated wastewater quality reused for irrigation, Tunisia. Desalination Water Treat. 2026, 325, 101624. [Google Scholar] [CrossRef] [Scilit]
  27. Bekir, S.; Zoghlami, R.I.; Boudabbous, K.; Khelil, M.N.; Moussa, M.; Ghrib, R.; Nahdi, O.; Trabelsi, E.; Bousnina, H. Soil Physicochemical Changes as Modulated by Treated Wastewater after Medium-and Long-Term Irrigations: A Case Study from Tunisia. Agriculture 2022, 12, 2139. [Google Scholar] [CrossRef] [Scilit]
  28. Hechmi, S.; Melki, S.; Khelil, M.N.; Ghrib, R.; Gueddari, M.; Jedidi, N. Potential risk of soil irrigation with treated wastewater over 40 years: A field experiment under semi-arid conditions in northeastern Tunisia. J. Arid Land 2023, 15, 407–423. [Google Scholar] [CrossRef] [Scilit]
  29. Mahmoudi, M.; Khelil, M.N.; Hechmi, S.; Latrech, B.; Ghrib, R.; Boujlben, A.; Yacoubi, S. Effect of Surface and Subsurface Drip Irrigation with Treated Wastewater on Soil and Water Productivity of Okra (Abemoschus esculentus) Crop in Semi-Arid Region of Tunisia. Agriculture 2022, 12, 2048. [Google Scholar] [CrossRef] [Scilit]
  30. Rattan, R.K.; Datta, S.P.; Chhonkar, P.K.; Suribabu, K.; Singh, A.K. Long-term impact of irrigation with sewage effluents on heavy metal content in soils, crops and groundwater—A case study. Agric. Ecosyst. Environ. 2005, 109, 310–322. [Google Scholar] [CrossRef] [Scilit]
  31. Kalavrouziotis, I.K.; Robolas, P.; Koukoulakis, P.H.; Papadopoulos, A.H. Effects of municipal reclaimed wastewater on the macro- and micro-elements status of soil and of Brassica oleracea var. Italica, and B. oleracea var. Gemmifera. Agric. Water Manag. 2008, 95, 419–426. [Google Scholar] [CrossRef] [Scilit]
  32. Kalavrouziotis, I.K.; Koukoulakis, P.; Kostakioti, E. Assessment of metal transfer factor under irrigation with treated municipal wastewater. Agric. Water Manag. 2012, 103, 114–119. [Google Scholar] [CrossRef] [Scilit]
  33. Khan, S.; Cao, Q.; Zheng, Y.M.; Huang, Y.Z.; Zhu, Y.G. Health risks of heavy metals in contaminated soils and food crops irrigated with wastewater in Beijing, China. Environ. Pollut. 2008, 152, 686–692. [Google Scholar] [CrossRef] [Scilit]
  34. Elgallal, M.; Fletcher, L.; Evans, B. Assessment of potential risks associated with chemicals in wastewater used for irrigation in arid and semiarid zones: A review. Agric. Water Manag. 2016, 177, 419–431. [Google Scholar] [CrossRef] [Scilit]
  35. Zili, D.; Wu, J.; You, A.; Huang, B.; Cao, C. Effects of heavy metals on soil microbial community structure and diversity in the rice (Oryza sativa L. subsp. Japonica, Food Crops Institute of Jiangsu Academy of Agricultural Sciences) rhizosphere. Soil Sci. Plant Nutr. 2017, 63, 75–83. [Google Scholar] [CrossRef] [Scilit]
  36. Sharafi, K.; Omer, A.K.; Mansouri, B.; Massahi, T.; Soleimani, H.; Moradi, M.; Parnoon, K.; Ebrahimzadeh, G. Transfer of heavy metals from soil to vegetables: A comparative assessment of different irrigation water sources. Heliyon 2024, 10, e32575. [Google Scholar] [CrossRef] [Scilit]
  37. Oloruntoba, A.; Omoniyi, A.O.; Shittu, Z.A.; Ajala, R.O.; Kolawole, A.A. Heavy Metal Contamination in Soils, Water, and Food in Nigeria from 2000–2019: A Systematic Review on Methods, Pollution Level and Policy Implications. Water Air Soil Pollut. 2024, 235, 586. [Google Scholar] [CrossRef] [Scilit]
  38. Adegoke, A.A.; Amoah, I.D.; Stenström, T.A.; Verbyla, M.E.; Mihelcic, J.R. Epidemiological Evidence and Health Risks Associated with Agricultural Reuse of Partially Treated and Untreated Wastewater: A Review. Front. Public Health 2018, 6, 337. [Google Scholar] [CrossRef] [Scilit]
  39. Najafi, P. Effects of using subsurface drip irrigation and treated municipal waste water in irrigation of tomato. Pak. J. Biol. Sci. 2006, 9, 2672–2676. [Google Scholar] [CrossRef] [Scilit]
  40. Aujla, M.S.; Thind, H.S.; Buttar, G.S. Fruit yield and water use efficiency of eggplant (Solanum melongema L.) as infuenced by different quantities of nitrogen and water applied through drip and furrow irrigation. Sci. Hortic. 2007, 112, 142–148. [Google Scholar] [CrossRef] [Scilit]
  41. Sun, Y.; Hu, K.; Fan, Z.; Wei, Y.; Lin, S.; Wang, J. Simulating the fate of nitrogen and optimizing water and nitrogen management of greenhouse tomato in North China using the EU-Rotate_N model. Agric. Water Manag. 2013, 128, 72–84. [Google Scholar] [CrossRef] [Scilit]
  42. El-Sadek, A. Water use optimization based on the concept of Partial Rootzone Drying. Ain Shams Eng. J. 2014, 5, 55–62. [Google Scholar] [CrossRef] [Scilit]
  43. Hashem, M.S.; Zin El-Abedin, T.; Al-Ghobari, H.M. Assessing effects of deficit irrigation techniques on water productivity of tomato for subsurface drip irrigation system. Int. J. Agric. Biol. Eng. 2018, 11, 137–145. [Google Scholar] [CrossRef]
  44. Cheng, M.; Wang, H.; Fan, J.; Zhang, S.; Liao, Z.; Zhang, F.; Wang, Y. A global meta-analysis of yield and water use efficiency of crops, vegetables and fruits under full, deficit and alternate partial rootzone irrigation. Agric. Water Manag. 2021, 248, 106771. [Google Scholar] [CrossRef] [Scilit]
  45. Oliver, M.M.H.; Hewa, G.A.; Pezzaniti, D. Subsurface drip irrigation with reclaimed water: Issues we must think now. Sustain. Irrig. Drain. IV 2012, 168, 203–211. [Google Scholar] [CrossRef] [Scilit]
  46. Kumar, N.; Kumar, S.; Duhan, D.; Singh, A.; Sidhpuria, M.S.; Antil, K.S.; Kumar, A.; Vikas. Production of subsurface drip-irrigated okra under different lateral spacings and irrigation frequencies. Water SA 2023, 49, 164–178. [Google Scholar] [CrossRef] [Scilit]
  47. Oron, G.; Campos, C.; Gillerman, L.; Salgot, M. Wastewater treatment, renovation and reuse for agricultural irrigation in small communities. Agric. Water Manag. 1999, 38, 223–234. [Google Scholar] [CrossRef] [Scilit]
  48. United State, Environmental Protection Agency 2002, Region 9, Preliminary Remediation Goals. Available online: https://semspub.epa.gov/work/05/169528.pdf (accessed on 21 March 2026).
  49. FAO/WHO. Joint FAO/WHO Food Standard Program Codex Committee on Contaminants in Foods, Fifth Session 2013, Rome. Available online: https://www.fao.org/fao-who-codexalimentarius/committees/committee/en/?committee=CCCF (accessed on 21 March 2026).
  50. FAO. Yield Response to Water; Irrigation and drainage bulletin 1987, n°33; FAO: Rome, Italy; 235p. (In French)
  51. Varshney, R.S. The Aral Sea Basin: A Man-Made Environmental Catastrophe. Modern Methods of Irrigation. GeoJournal 1995, 35, 59–63. [Google Scholar] [CrossRef] [Scilit]
  52. Vinje, E. Okra Plant/How to Grow, Care for and Harvest. Planet Natural Research Center. 2022. Published: 31 July 2022, Updated: 29 December 2024. Available online: https://www.planetnatural.com/growing-okra/ (accessed on 28 August 2024).
  53. Agbana, G.H.D.; Dongli, S.; Zhipeng, L.; Elshaikh, N.A.; Guangcheng, S.; Timm, L.C. Effect of deficit irrigation and biochar addition on the growth, yield, and quality of tomato. Sci. Hortic. 2017, 222, 90–101. [Google Scholar] [CrossRef] [Scilit]
  54. APHA; AWWA; WEF. Standard Methods for the Examination of Water and Wastewater, 23rd ed.; American Public Health Association: Washington, DC, USA, 2017. [Google Scholar]
  55. NF T90-040; Water Testing. Sulphate Ion Measurement. Nephelometric Method. AFNOR: Saint-Denis, France, 1986. (In French)
  56. NF A20-603; Iron Ores. Determination of Sodium and/or Potassium Content. Flame Atomic Absorption Spectrometric Method. AFNOR: Saint-Denis, France, 1989.
  57. Saha, S.; Reza, A.H.M.S.; Roy, M.K. Hydrochemical evaluation of groundwater quality of the Tista floodplain, Rangpur, Bangladesh. Appl. Water Sci. 2019, 9, 198. [Google Scholar] [CrossRef] [Scilit]
  58. Rhoades, J.D. Soluble salts. In Methods of Soil Analysis. Part 2. Chemical and Microbiological Properties, 2nd ed.; American Society of Agronomy: Madison, WI, USA, 1982; n° 9; pp. 167–179. [Google Scholar]
  59. Fageria, N.K.; Baligar, V.C. Ameliorating Soil Acidity of Tropical Oxisols by Liming for Sustainable Crop Production. Adv. Agron. 2008, 99, 345–399. [Google Scholar] [CrossRef] [Scilit]
  60. Arora, C.L.; Bajwa, M.S. Comparative study of some methods of oxidation of plant materials for elemental analysis. Curr. Sci. 1994, 66, 314–331. [Google Scholar]
  61. Estefan, G.; Sommer, R.; Ryan, J. Methods of Soil, Plant, and Water Analysis: A Manual for the West Asia and North Africa Region, 3rd ed.; ICARDA: Beirut, Lebanon, 2013; pp. 143–144. Available online: https://hdl.handle.net/20.500.11766/7512 (accessed on 10 March 2026).
  62. Wang, X.; Sato, T.; Xing, B.; Tao, S. Health risks of heavy metals to the general public in Tianjin, China via consumption of vegetables and fish. Sci. Total Environ. 2005, 350, 28–37. [Google Scholar] [CrossRef] [Scilit]
  63. Finley, B.L.; Mannot, A.D.; Paustenbach, D.J.; Gaffney, S.H. Derivation of a chronic oral reference dose for cobalt. Regul. Toxicol. Pharmacol. 2012, 64, 491–503. [Google Scholar] [CrossRef] [Scilit]
  64. Biche. Hydraulic and Environmental Consulting Engineering Office (BICHE), Environmental impact studies on the use of treated wastewater from treatment plants—SE2—SE3 and SE4 for the irrigation of the Bir Rommana—Béni Khiar and Haouaria irrigation schemes in Nabeul. 1998. (In French)
  65. Richards, L.A.; Brown, J.W.; Allison, L.E.; Hayward, H.E.; Bernstein, L.; Fireman, M.; Pearson, G.A.; Wilcox, L.V.; Bower, C.A.; Hatcher, J.T.; et al. Diagnostic and Improvement of Saline and Alkali Soils; United States Salinity Laboratory Staff. Soil and Water Conservation Research Branch, Agricultural Research Service, Agriculture Handbook No. 60; United States Department of Agriculture: Washington, DC, USA, 1954; 166p.
  66. NT 106.03; Environmental Protection–Use of Treated Wastewater for Agricultural Purposes: Physico-Chemical and Biological Specifications. National Institute for Standardization and Intellectual Property: Tunis, Tunisia, 1989. (In French)
  67. United States Environmental Protection Agency (US EPA). Guidelines for Water Reuse; EPA/600/R-12/618; September 2012; U.S. Environmental Protection Agency: Washington, DC, USA, 2012. Available online: https://www.epa.gov/sites/default/files/2019-08/documents/2012-guidelines-water-reuse.pdf (accessed on 14 March 2026).
  68. FAO. Water Quality for Agriculture; FAO irrigation and drainage paper No. 29; FAO: Rome, Italy, 1985. [Google Scholar]
  69. FAO; WHO. Norme Générale Pour les Contaminants et les Toxines Présents Dans les Produits de Consommation Humaine et Animale (CXS 193-1995); Codex Alimentarius Commission: Rome, Italy, 2021. [Google Scholar]
  70. FAO/WHO. Food Additives and Contaminants. Joint Codex Alimentarius Commission, FAO/WHO Food Standards Programme, ALINORM 01/12 A. 2001. Available online: https://fr.Scribd.com/document/472975652/fao-2001-codex-alimentarius-commission (accessed on 14 March 2026).
  71. Hoogendijk, K.; Myburgh, P.A.; Howell, C.L.; Hoffman, J.E. Irrigation of Agricultural Crops with Municipal Wastewater—A Review. S. Afr. J. Enol. Vitic. 2023, 44, 31–54. [Google Scholar] [CrossRef] [Scilit]
  72. Rekaya, M. Pilot Experiment on Artificial Recharge Using Treated Wastewater. Case Study of the Oued Souhil Aquifer (Nabeul, Tunisia); Ministry of Agriculture, Water Resources Department: Tunis, Tunisia, 1986; 21p. (In French)
  73. Rezapour, S.; Nouri, A.; Jalil, H.M.; Hawkins, S.A.; Lukas, S.B. Influence of Treated Wastewater Irrigation on Soil Nutritional-Chemical Attributes Using Soil Quality Index. Sustainability 2021, 13, 1952. [Google Scholar] [CrossRef] [Scilit]
  74. WHO. Guidelines for Drinking-Water Quality: Fourth Edition Incorporating the First and Second Addenda; WHO: Geneva, Switzerland, 2022. [Google Scholar]
  75. Paranychianakis, N.V.; Salgot, M.; Angelakis, A.N. Irrigation with recycled water: Guidelines and regulations. P 77-112. In Treated Wastewater in Agricultures; Levy, G., Fine, P., Barttal, A., Eds.; Blackwell Publishing Ltd.: Oxford, UK, 2011. [Google Scholar]
  76. Urbano, V.R.; Mendonça, T.G.; Bastos, R.G.; Souza, C.F. Effects of treated wastewater irrigation on soil properties and lettuce yield. Agric. Water Manag. 2017, 181, 108–115. [Google Scholar] [CrossRef] [Scilit]
  77. Gatta, G.; Gagliardi, A.; Grazia, D.; Antonio, L.; Matteo, F.; Emanuele, T.; Marcella, M.G. Irrigation with treated municipal wastewater on artichoke crop: Assessment of soil and yield potencialy toxic elements content and human risk. Water 2018, 10, 255. [Google Scholar] [CrossRef] [Scilit]
  78. Cherif, H.; Saidi, H.; Elfil, H. Impact of treated wastewater reuse for irrigation purposes in Tunisia on crop growth, human health and soil. CPQ Nutr. 2018, 1, 1–20. [Google Scholar]
  79. Bahri, A. Utilization of treated wastewaters and sewage sludge in agriculture in Tunisia. Desalination 1987, 67, 233–244. [Google Scholar] [CrossRef] [Scilit]
  80. Rekaya, M.; Brissaud, F. Report II.4. Recharging the Oued Souhil aquifer with secondary effluents and water management. Progress—Quality—Quantity. In Proceedings of the Twenty-First Hydraulics Conference, Sophie-Antipolis, France, 29–31 January 1991; Volume 2. Available online: https://www.persee.fr/doc/jhydr_0000-0001_1991_act_21_2_5186 (accessed on 14 March 2026). (In French)
  81. Hassan, G.Z.; Hassan, F.R.; Punthakey, J.F.; Shabir, G.; Khan, M.A.H. Groundwater Contamination by Wastewater—A Threat for Human–Heath in Punjab Pakistan. Medp. Nutr. Food Sci. 2022, 1, mpnfs–202207001. [Google Scholar]
  82. Iqbal, Z.; Abbas, F.; Mahmoud, A.; Ibrahim, M.; Gul, M.; Yamin, M.; Aslam, B.; Imtiaz, M.; Elahi, N.N.; Qureshi, T.L.; et al. Human health risk of heavy metal contamination in groundwater and source apportionment. Int. J. Environ. Sci. Technol. 2022, 19, 7251–7260. [Google Scholar] [CrossRef] [Scilit]
  83. Weil, R.R.; Brady, N. The Nature and Properties of Soils, 15th ed.; Pearson Education: London, UK, 2017. [Google Scholar]
  84. Heyde, B.J.; Braun, M.; Soufi, L.; Lüneberg, K.; Gallego, S.; Amelung, W.; Axtmann, K.; Bierbaum, G.; Glaeser, S.P.; Grohmann, E.; et al. Transition from irrigation with untreated wastewater to treated wastewater and associated benefits and risks. npj Clean. Water 2025, 8, 6. [Google Scholar] [CrossRef] [Scilit]
  85. Sdiri, W.; AlSalem, H.S.; Al-Goul, S.T.; Binkadem, M.S.; Ben Mansour, H. Assessing the Effects of Treated Wastewater Irrigation on Soil Physico-Chemical Properties. Sustainability 2023, 15, 5793. [Google Scholar] [CrossRef] [Scilit]
  86. Hashem, M.S.; Guo, W.; Qi, X.B.; Li, P.; She, Y.J.; Cui, J.; Li, T. Effect of using reclaimed water via furrow and subsurface drip systems under alternate partial root-zone irrigation mechanism on crops growth and soil properties. Irrig. Sci. 2024, 42, 919–936. [Google Scholar] [CrossRef] [Scilit]
  87. Khalid, S.; Shahid, M.; Irshad, B.N.; Sarwar, T.; Haidar Shah, A.; Khan, N.N. A Review of Environmental Contamination and Health Risk Assessment of Wastewater Use for Crop Irrigation with a Focus on Low and High-Income Countries. Int. J. Environ. Res. Public Health 2018, 15, 895. [Google Scholar] [CrossRef] [Scilit]
  88. Al-naimy, M.A.; Shahin, S.A.; Vranayova, Z.; Zelenakova, M.; Abdel-Hamed, E.M.W. Long-Term Impact of Wastewater Irrigation on Soil Pollution and Degradation: A Case Study from Egypt. Water 2021, 13, 2245. [Google Scholar] [CrossRef] [Scilit]
  89. Kolokotsa, A.; Koukoulakis, P.H.; Kyritsis, S.S.; Kalavrouziotis, I.S. The Impact of Heavy Metal Interactions with pH, Organic Matter and Clays on Soil Toxicity, Under Wastewater and Biosolid Reuse. Water Air Soil Pollut. 2025, 236, 412. [Google Scholar] [CrossRef] [Scilit]
  90. Antoniadis, V.; Golia, E.E.; Liu, Y.T.; Wang, S.L.; Shaheen, S.M.; Rinklebe, J. Soil and maize contamination by trace elements and associated health risk assessment in the industrial area of Volos, Greece. Environ. Inter. 2019, 124, 79–88. [Google Scholar] [CrossRef] [Scilit] [PubMed]
  91. Saleh, M.; Salehi, M.; Khanaki, S.; Ebrahimian, H.; Liaghat, A.; Mousavi, S.M.; Pashapour, S.; Ashrafi, A. Effects of treated wastewater irrigation on soil properties, nutrient uptakes, and crop yields of agronomic crops under different crop rotations. Agric. Water Manag. 2025, 316, 109585. [Google Scholar] [CrossRef] [Scilit]
  92. Diallo, M.D.; Ndiaye, O.; Mahamat Saleh, M.; Tine, A.; Diop, A.; Guisse, A. Comparative study of water and soil salinity in the Northern Niayes region (SENEGAL). Afr. Crop Sci. J. 2015, 23, 101–111. (In French) [Google Scholar]
  93. Wang, M.; Wang, R.; Sun, Q.; Xu, L.; Wang, Y. Integrated Drip Irrigation Regulates Soil Water–Salt Movement to Improve Water Use Efficiency and Maize Yield in Saline–Alkali Soil. Water 2024, 16, 2509. [Google Scholar] [CrossRef] [Scilit]
  94. Zaman, M.; Shahid, S.A.; Heng, L. Irrigation Systems and Zones of Salinity Development. In Guideline for Salinity Assessment, Mitigation and Adaptation Using Nuclear and Related Techniques; Springer: Cham, Switzerland, 2018. [Google Scholar] [CrossRef] [Scilit]
  95. Patra, K.; Parihar, C.M.; Nayak, H.S.; Rana, B.; Singh, V.K.; Jat, S.L.; Panwar, S.; Parihar, M.D.; Singh, L.K.; Sidhu, H.S.; et al. Water budgeting in conservation agriculture-based sub-surface drip irrigation in tropical maize using HYDRUS-2D in South Asia. Sci. Rep. 2021, 11, 16770. [Google Scholar] [CrossRef] [Scilit]
  96. Zhang, F.; Chen, M.; Fu, J.; Zhang, X.; Li, Y.; Xing, Y. Effects of drip irrigation on yield, soil fertility and soil enzyme activity of different potato varieties in Northwest China. Front. Plant Sci. 2023, 14, 1240196. [Google Scholar] [CrossRef] [Scilit]
  97. Majrashi, M.A.; Alasmary, Z.; Ezzat, S.; Ibrahim, H.M.; Harbi, M.A.; Abldubise, A.; Alghamdi, A.G. Effects of Treated Wastewater Irrigation on Pastoral Plant Growth and Soil Properties in Al-Tamriat. Saudi Arabia. Processes 2025, 13, 3110. [Google Scholar] [CrossRef] [Scilit]
  98. Murtaza, G.; Zia-ur-Rehman, M.; Rashid, I.; Qadir, M. Use of Poor-quality Water for Agricultural Production. In Research Developments in Saline Agriculture; Dagar, J., Yadav, R., Sharma, P., Eds.; Springer: Singapore, 2019. [Google Scholar] [CrossRef] [Scilit]
  99. Wang, L.; Blanchy, G.; Cornelis, W.; Garré, S. Changes in soil hydraulic and physio-chemical properties under treated wastewater irrigation: A meta-analysis. Agric. Water Manag. 2024, 295, 108752. [Google Scholar] [CrossRef] [Scilit]
  100. Gao, Y.; Shao, G.; Wu, S.; Xiaojun, W.; Lua, J.; Cui, J. Changes in soil salinity under treated wastewater irrigation: A meta-analysis. Agric. Water Manag. 2021, 255, 106986. [Google Scholar] [CrossRef] [Scilit]
  101. Phene, C.J.; Davis, K.R.; Hutmatcher, R.; Bar-Yosef, B.; Meek, D.W.; Misaki, J. Effect of high frequency surface and subsurface drip irrigation on root distribution of sweet corn. Irrig. Sci. 1991, 12, 135–140. [Google Scholar] [CrossRef] [Scilit]
  102. Lamm Freddie, R.; Trooien Todd, P. Subsurface drip irrigation for corn production: A review of 10 years of research in Kansas. Irrig. Sci. 2003, 22, 195–200. [Google Scholar] [CrossRef] [Scilit]
  103. Mailhol, J.C.; Pierre, R.; Dejean, C.; Rosique, P. Buried drip irrigation: An innovative solution for irrigation under water-restricted conditions. Sci. Eaux Territ. 2013, 11, 26–29. (In French) [Google Scholar] [CrossRef] [Scilit]
  104. Tabatabaeia, S.H.; Mousavib, S.M.; Mirlatifib, S.M.; Sharifniac, R.S.; Pessaraklid, M. Effects of municipal wastewater on soil chemical properties in cultivating turfgrass using subsurface drip irrigation. J. Plant Nutr. 2017, 40, 1133–1142. [Google Scholar] [CrossRef] [Scilit]
  105. Khaskhoussy, K.; Kahlaoui, B.; Misle, E.; Hachicha, M. Impact of Irrigation with Treated Wastewater on Physical-Chemical Properties of Two Soil Types and Corn Plant (Zea mays). J. Soil. Sci. Plant Nutr. 2022, 22, 1377–1393. [Google Scholar] [CrossRef] [Scilit]
  106. Obijianya, C.C.; Yakamercan, E.; Karimi, M.; Veluru, S.; Simko, I.; Eshkabilov, S.; Simsek, H. Agricultural Irrigation Using Treated Wastewater: Challenges and Opportunities. Water 2025, 17, 2083. [Google Scholar] [CrossRef] [Scilit]
  107. Sharma, S.P.; Leskovar, D.I.; Crosby, K.M.; Volder, A.; Ibrahim, A.M.H. Root growth, yield, and fruit quality responses of reticulatus and inodorus melons (Cucumis melo L.) to deficit subsurface drip irrigation. Agric. Water Manag. 2014, 136, 75–85. [Google Scholar] [CrossRef] [Scilit]
  108. Zheng, H.; Ying, H.; Yin, Y.; Wang, Y.; He, G.; Bian, Q.; Cui, Z.; Yang, Q. Irrigation leads to greater maize yield at higher water productivity and lower environmental costs: A global meta-analysis. Agric. Ecosyst. Environ. 2019, 273, 62–69. [Google Scholar] [CrossRef] [Scilit]
  109. Li, N.-N.; Li, J.-H.; Shi, X.-J.; Shi, F.; Tian, Y.; Wang, J.; Hao, X.-Z.; Luo, H.-H.; Wang, Z.-B. Increasing cotton lint yield and water use efficiency for subsurface drip irrigation without mulching. Front. Plant Sci. 2024, 15, 1433719. [Google Scholar] [CrossRef] [Scilit]
  110. Wang, H.J.; Wang, J.; Yu, X. Wastewater irrigation and crop yield: A meta-analysis. J. Integr. Agric. 2022, 21, 1215–1224. [Google Scholar] [CrossRef] [Scilit]
  111. Wu, Q.; Sun, Y.; Zhou, H. Editorial: Enhancing agricultural water management: Techniques for improving crop water efficiency and sustainability. Front. Plant Sci. 2025, 16, 1655207. [Google Scholar] [CrossRef] [Scilit] [PubMed]
  112. Sheng, K.; Xu, L.; Wang, M.; Lei, H.; Duan, A. The end-use quality of wheat can be enhanced by optimal water management without incurring yield loss. Front. Plant Sci. 2022, 13, 1030763. [Google Scholar] [CrossRef] [Scilit]
  113. Chaves, M.M.; Oliveira, M.M. Mechanisms underlying plant resilience to water deficits: Prospects for water-saving agriculture. J. Exp. Bot. 2004, 55, 407. [Google Scholar] [CrossRef] [Scilit]
  114. Borsato, E.; Rosa, L.; Marinello, F.; Tarolli, P.; D’Odorico, P. Weak and Strong Sustainability of Irrigation: A Framework for Irrigation Practices Under Limited Water Availability. Front. Sustain. Food Syst. 2020, 4, 17. [Google Scholar] [CrossRef] [Scilit]
  115. Mohanty, B.; Anirban, D. Heavy metals in agricultural cultivated products irrigated with wastewater in India: A review. AQUA—Water Infrastruct. Ecosyst. Soc. 2023, 72, 851. [Google Scholar] [CrossRef] [Scilit]
  116. Khelil, M.N.; Mahmoudi, M.; Ghrib, R.; Yacoubi, S. Mini review: Sanitary Problems and Trace Metals Bioaccumulation during Drip Irrigation with Treated Wastewater in Okra. Int. J. Agric. Sci. Food Technol. 2024, 10, 94–100. [Google Scholar] [CrossRef] [Scilit]
  117. Othman, Y.A.; Al-Assaf, A.; Tadros, M.J.; Albalawneh, A. Heavy Metals and Microbes Accumulation in Soil and Food Crops Irrigated with Wastewater and the Potential Human Health Risk: A Metadata Analysis. Water 2021, 13, 3405. [Google Scholar] [CrossRef] [Scilit]
  118. Carlton-Smith, C.H.; Davis, R.D. Comparative uptake of heavy metals by forage crops grown on sludge-treated soil. In International Conference, Heavy Metals in the Environment-Heidelberg; CEP Consultants: Edinburgh, UK, 1983; pp. 393–396. [Google Scholar]
  119. Ghosh, A.K.; Bhatt, M.; Agrawal, H. Effect of long-term application of treated sewage water on heavy metal accumulation in vegetables grown in Northern India. Environ. Monit. Assess. 2012, 184, 1025–1036. [Google Scholar] [CrossRef] [Scilit]
  120. Rezapour, S.; Nouri, A.; Alamdari, P.; Akhlaghi, M. Cadmium accumulation in wastewater-irrigated vegetables: Exploring factors, thresholds, health implications, and transfer modeling. J. Agric. Food Res. 2024, 16, 101070. [Google Scholar] [CrossRef] [Scilit]
  121. Alloway, B.J. Heavy Metals in Soils: Trace Metals and Metalloids in Soils and Their Bioavailability, 3rd ed.; Springer: Dordrecht, The Netherlands, 2013; 615p. [Google Scholar] [CrossRef] [Scilit]
  122. Shivali; Kumar, J. Cobalt content and its availability in soils: A review. Int. J. Appl. Res. 2024, 10, 299–308. [Google Scholar] [CrossRef] [Scilit]
  123. Singh, D.; Patel, N.; Patra, S.; Singh, N.; Roy, T.; Gaucci, S.; Hettiarachchi, H. Efficacy of drip irrigation in controlling heavy-metal accumulation in soil and crop. J. Environ. Eng. Sci. 2021, 16, 109–121. [Google Scholar] [CrossRef] [Scilit]
  124. Cakmakci, T.; Sahin, U. Productivity and heavy metal pollution management in a silage maize field with reduced recycled wastewater applications with different irrigation methods. J. Environ. Manag. 2021, 291, 112602. [Google Scholar] [CrossRef] [Scilit]
  125. Liu, Y.; Hu, C.; Li, B.; Ding, D.; Zhao, Z.; Fan, T.; Li, Z. Subsurface drip irrigation reduces cadmium accumulation of pepper (Capsicum annuum L.) plants in upland soil. Sci. Total Environ. 2021, 112, 142650. [Google Scholar] [CrossRef] [Scilit]
  126. Guo, W.; Li, P.; Qi, X.; Hashem, M.S.; Xiao, Y.; She, Y. Influence of Different Irrigation Water Qualities and Irrigation Techniques on the Soil Attributes and Bacterial Community Structure. Agronomy 2022, 12, 3170. [Google Scholar] [CrossRef] [Scilit]
  127. Podar, D.; Maathuis, F.J.M. The role of roots and rhizosphere in providing tolerance to toxic metals and metalloids. Plant Cell Environ. 2022, 45, 719–736. [Google Scholar] [CrossRef] [Scilit] [PubMed]
  128. Page, V.; Feller, V. Heavy Metals in Crop Plants: Transport and Redistribution Processes on the Whole Plant Level. Agronomy 2015, 5, 447–463. [Google Scholar] [CrossRef] [Scilit]
  129. Jha, P.; Samal, A.C.; Santra, S.C.; Dewanji, A. Potencialy toxic elements Accumulation Potential of Some Wetland Plants Growing Naturally in the City of Kolkata, India. Am. J. Plant Sci. 2016, 7, 2112–2137. [Google Scholar] [CrossRef]
  130. Kamal, M.A.; Alali, A.F. Kinetic modeling of heavy metal uptake and translocation in Brassica juncea L. for phytoremediation engineering. Discov. Environ. 2025, 3, 296. [Google Scholar] [CrossRef] [Scilit]
  131. Hassan, J.; Rajib, M.M.R.; Khan, M.N.; Khandaker, S.; Zubayer, M.; Ashab, K.R.; Kuba, T.; Marwani, H.M.; Asiri, A.M.; Hasan, M.M.; et al. Assessment of heavy metals accumulation by vegetables irrigated with different stages of textile wastewater for evaluation of food and health risk. J. Environ. Manag. 2024, 353, 120206. [Google Scholar] [CrossRef] [Scilit]
  132. Aftab, K.; Iqbal, S.; Khan, M.R.; Busquets, R.; Noreen, R.; Ahmad, N.; Kazimi, S.G.T.; Karami, A.M.; Al Sulima, N.M.S.; Ouladsmane, M. Wastewater-Irrigated Vegetables Are a Significant Source of Heavy Metal Contaminants: Toxicity and Health Risks. Molecules 2023, 28, 1371. [Google Scholar] [CrossRef] [Scilit]
  133. Negassa, B.; Dadi, D.; Negasa Eshete Soboksa, N.E.; Samuel Fekadu, S. Presence of Heavy Metals in Vegetables Irrigated with Wastewater-Impacted Rivers and Its Health Risks in Ethiopia: Systematic Review. Environ. Health Insights 2025, 19, 1–13. [Google Scholar] [CrossRef] [Scilit]
Figure 1. Study area and location of the experimental unit (green rectangle) in Nabeul, northeastern Tunisia.
Water 18 00981 g001
Figure 2. Layout of the experimental field and irrigation system.
Water 18 00981 g002
Figure 3. Soluble cation concentrations in soil layers (0–20 and 20–40 cm) as affected by water quality (AD) and irrigation system (EH), compared to background levels. Note: Bars represent means ± SD (n = 3). Within each depth, different letters indicate significant differences (p ≤ 0.05) according to Duncan’s test. Background: initial cation concentrations before sowing; WW: well water; TWW: treated wastewater; DI: surface drip irrigation; SDI: subsurface drip irrigation.
Water 18 00981 g003
Figure 4. Trace metal bioaccumulation (Cd, Pb, Co, Ni) in okra (A. esculentus L.) tissues under different irrigation water qualities and systems. Note: Values are means ± SD (n = 3). Different letters indicate significant differences between treatments (p ≤ 0.05) according to Duncan’s test. WW: well water; TWW: treated wastewater; DI: surface drip irrigation; SDI: subsurface drip irrigation.
Water 18 00981 g004
Table 1. Okra water requirements and irrigation scheduling across different growth stages.
ParametersInitialDevelopmentMid-SeasonLate-SeasonTotal
ET0 (mm/stage)155182163116616
Kc [50]0.450.751.100.8-
Water Requirements (mm)7013718093479
Number of irrigations5911732
irrigation rate (mm/irrigation)15161714-
Applied irrigation (mm/stage) a7514418898505
Note: ET0: Reference evapotranspiration; Kc: crop coefficient as recommended by [50]. Water requirements (ETc) were calculated as ETc = ET0 × Kc. a: Applied irrigation (505 mm) includes an additional 5% (approx. 24 mm) over the requirements to compensate for conveyance and application losses, based on a 95% drip irrigation efficiency [43].
Table 2. Physicochemical properties of the experimental soil at different depths.
ParametersUnits0–20 cm20–40 cm
Physical properties
Clay%13.59.7
Loam%4.33.1
Sand%83.887.7
Bulk densityg·cm−31.481.39
Field Capacity (FC)%16.812.8
Permanent Wilting Point (PWP)%7.695.01
Available Water (AW)mm26.9621.65
Chemical Properties
pH-8.138.22
ECds·m−10.890.91
Na+meq·100 g−12.51 (0.08)2.00 (0.11)
K+meq·100 g−10.27 (0.06)0.16 (0.03)
Ca2+meq·100 g−12.07 (0.02)1.06 (0.05)
Mg2+meq·100 g−10.62 (0.03)0.27 (0.03)
CECmeq·100 g−15.47 (0.06)3.49 (0.19)
Note: FC: soil moisture at field capacity; PWP: soil moisture at permanent wilting point; EC: electrical conductivity; CEC: cation exchange capacity. AW represents the available water in each 20 cm soil layer, calculated as AW = 2 × [Bulk density × (FC − PWP)]. Values in parentheses represent the 95% confidence interval.
Table 3. Physicochemical properties and potentially toxic elements of well water (WW) and treated wastewater (TWW) compared with values reported in standards files.
ParametersIrrigation Water Quality
WW 1TWW 2Tunisian Standards 3Guideline for TWW Reuse 4
pH7.2 ± 0.2 b7.9 ± 0.4 a *6.5–8.56–9
EC (mS·cm−1)3.9 ± 0.4 a3.1 ± 0.2 b7.00<3.1
COD (mg O2·L−1)19.5 ± 0.9 b98 ± 10.1 a<90-
Nutrients (mg·L−1)
N-NH4+2.36 ± 0.8 b48.8 ± 4.2 a-30
N-NO3111 ± 4.7 a17.7 ± 1.7 b--
N totalNdNd 50
HCO3250 ± 7.5 a225 ± 9.3 b--
SO42−432 ± 43.6 ns379 ± 15.6 ns 500
Cl721 ± 17.6 b759 ± 17.5 a<2000-
Ca2+226 ± 12.4 a123 ± 9.7 b<500400
Mg2+92 ± 3.4 a75 ± 7.4 b<20060
P0.13 ± 0.02 b3.5 ± 0.5 a<0.3-
K+46 ± 3.7 b60 ± 5.0 a<5050
Na+592 ± 27.3 a559 ± 44.6 b<500900
SAR (mmol·L−1)8.3 ± 0.3 b9.8 ± 0.9 a-15
Trace elements (mg·L−1)
Cd<LOD0.009 ± 0.0020.010.2
Co0.02 ± 0.002 ns0.029 ± 0.008 ns0.10.05
Ni0.058 ± 0.018 a0.028 ± 0.007 b0.20.2
Pb0.051 ± 0.008 ns0.043 ± 0.005 ns<15
Note: Data are means (n = 4). * Different letters indicate significant differences between values among water types (p < 0.05; Duncan’s multiple range test). 1 Well water, 2 treated wastewater, 3 Tunisian standards (NT106.03, 1989) for treated wastewater reuse in agriculture [66] 4 Permissible limits according to [67] and [68] . ns: non-significant; LOD: limit of detection.
Table 4. Three-way ANOVA results and mean comparison of soil physicochemical properties as affected by irrigation water quality, soil depth, and irrigation system.
FACTORpHECNa+Ca2+Mg2+K+SARCEC
(ds·m−1) (meq·kg−1) (meq·100 g−1)
Water Quality (WQ)
TWW8.239 a0.904 a2.935 a2.066 a0.695 b0.238 b2.687 a0.567 a
WW8.130 a0.984 a2.396 b2.160 a0.855 a0.268 a2.003 b0.576 a
p-value0.1320.48<0.0010.2510.0020.002<0.0010.515
Irrigation System (IS)
DI8.217 a1.008 a2.790 a2.114 a0.869 a0.255 a2.359 a0.605 a
SDI8.151 a0.880 b2.541 b2.113 a0.682 b0.251 a2.331 a0.537 b
p-value0.3530.0040.0040.981<0.0010.5810.55<0.001
Soil Depth (H)
0–20 cm8.149 a0.882 b2.560 b2.771 a0.958 a0.326 a1.946 b0.643 a
20–40 cm8.220 a1.006 a2.771 a1.456 b0.592 b0.180 b2.744 a0.500 b
p-value0.3210.0050.013<0.001<0.001<0.001<0.001<0.001
ANOVA (significance)
WQnsns***ns*******ns
ISns****ns***nsns***
Hns******************
WQ × ISns***********ns******
WQ × H × ISnsns******nsns***ns
Note: Data are means (n = 3). Within each factor, means followed by different letters are significantly different at p ≤ 0.05 according to Duncan’s multiple range test. WQ: water quality; H: soil depth; IS: irrigation system; TWW: treated wastewater; WW: well water; DI: surface drip irrigation; SDI: subsurface drip irrigation; EC: electrical conductivity; SAR: sodium adsorption ratio; CEC: cation exchange capacity. ns: non-significant (p > 0.05); * p < 0.05; ** p < 0.01; *** p < 0.001. Significant p-values are highlighted in bold.
Table 5. Analysis of variance (ANOVA) for the effects of water quality, irrigation 448 technique, and their interaction on agronomic growth parameters of okra (A. esculentus L.).
SOVdfMean Square
PHeTDRFWRDWLFWLDWSFWSDWFAWDAW
(cm)X 1000
IS18518.5 *0.09 ns2.35 ns1.36 ns1.66 ns0.0 ns1933.6 *50.181 *2048.5 *44.8 *
WQ110,700.2 *0.73 ns0.408 ns0.43 ns2.91 ns1.87 *1393.3 *31.752 *1523.7 *383.4 *
IS × WQ13061.3 *0.05 ns15.696 *2.64 *1.03 ns0.03 ns52.634 ns21.168 *39.216 ns16.3 *
Rep2338.70.06 ns4.295 ns0.15 ns2.860.09109.3881.897101.3265.1
Error84164.10.061.5770.3010.980.0942.6111.48236.9361.6
Note: SOV: source of variation; df: degrees of freedom; IS: irrigation system; WQ: water quality; PHe: plant height; TD: trunk diameter; RFW/RDW: root fresh/dry weight; LFW/LDW: leaf fresh/dry weight; SFW/SDW: stem fresh/dry weight; FAW/DAW: fresh/dry aerial weight. ns: non-significant; *: significant at p ≤ 0.05 (Duncan’s multiple range test).
Table 6. Comparison of mean agronomic growth parameters of okra (A. esculentus L.) as influenced by irrigation water quality and irrigation system.
FactorPHeTDRFWRDWLFWLDWSFWSDWFAWDAW
(cm) (g·m−2)
Water Quality**nsnsnsns**************
TWW173 a3.3 a561 a196 a331 a83 a3415 a709 a3747 a799 a
WW113 b3.1 a573 a184 a300 a58 b2734 b383 b3034 b441 b
p-value0.0020.3100.6250.2650.1220.002<0.001<0.001<0.001<0.001
Irrigation System**nsnsnsnsns************
DI116 b3.12 a553 a179 a304 a70 a2673 b481 b2977 b559 b
SDI169 a3.3 a581 a201 a327 a70 a3476 a611 a3803 a681 a
p-value0.0040.2440.2570.0660.2291.00<0.001<0.001<0.001<0.001
Note: Within each factor, means followed by the same letter are not significantly different at p ≤ 0.05 according to Duncan’s test. ns: non-significant (p > 0.05); ** p < 0.01; *** p < 0.001. Significant p-values are highlighted in bold.
Table 7. Yield and physiological traits (water content and irrigation water use efficiency) of okra (A. esculentus L.) as affected by water quality, irrigation system and their interaction.
FactorsFruit YieldLeavesRootsAbove-Ground PartIWUE
t·ha−1Te%kg·m−3
Water quality (WQ)***ns****
WW5.212 b80.613 a67.817 a85.282 a1.00 b
TWW6.063 a75.006 b65.133 a78.873 b1.20 a
p-value0.0300.0030.139<0.0010.028
Irrigation system (IS)*nsnsnsns
DI5.253 b77.114 a67.422 a81.732 a1.00 a
SDI6.021 a78.505 a65.133 a82.423 a1.20 a
p-value0.0410.3170.2790.1470.061
IS × WQnsnsnsnsns
p-value0.2680.8750.6030.0560.260
Note: values represent means (n = 3). Within each column, means followed by the same lowercase letter are not significantly different at p ≤ 0.05 according to Duncan’s multiple range test. ‘ns’ denotes non-significant effects or interactions (p > 0.05); * p < 0.05; ** p < 0.01; *** p < 0.001. Significant p-values are highlighted in bold.
Table 8. Two-way ANOVA of irrigation water quality and system on nutrient content and trace metal accumulation in okra (A. esculentus L.) fruits and leaves.
Fruits at Final HarvestLeafs at Final Harvest
FactorCd
mg·kg−1
Pb
mg·kg−1
Co
mg·kg−1
Ni
mg·kg−1
Na
%
P
%
K
%
Na
%
P
%
K
%
Maximum Levels (MLs)0.05 /0.2 0.1 50 67 ------
Water Quality (WQ)***nsns***********
TWW0.608 a4.817 ns1.642 ns3.367 b0.17 a0.24 a1.25 a0.67 a0.25 a0.24 a
WW0.100 b4.317 ns1.400 ns4.025 a0.14 b0.20 b0.91 b0.37 b0.21 b0.17 b
p-value<0.0010.4800.0770.0170.0140.0020.0010.034<0.0010.015
Irrigation System (IS)ns**nsnsnsnsns**ns
DI0.342 ns5.608 a1.342 b3.600 ns0.16 ns0.22 ns1.16 ns0.43 ns0.22 b0.22 ns
SDI0.367 ns3.525 b1.700 a3.792 ns0.15 ns0.22 ns1.00 ns0.62 ns0.23 a0.19 ns
p-value0.6940.0150.0170.4050.740.740.740.150.0080.116
IS × WQnsnsns*nsnsnsns*ns
p-value0.3690.7210.3900.0340.330.740.170.230.030.116
Note: Values represent means (n = 3). , Maximum levels of PTE established by [69] , Recommended reference value according to [70]. Within each column and factor, means followed by the same lowercase letter are not significantly different at p ≤ 0.05 according to Duncan’s multiple range test. ns: non-significant (p > 0.05); * p < 0.05; ** p < 0.01; *** p < 0.001. Significant p-values are highlighted in bold.
Table 9. Estimated mass balance of potentially trace elements (PTEs) in the soil–plant system under different irrigation system.
[A] Total Input by TWW
(g·ha−1)
[B] Total Export by Okra
(g·ha−1)
[A-−B] Balance (Soil Accumulation/Leaching)
(g·ha−1)
DI-WWSDI-WWDI-TWWSDI-TWWp-ValueDI-WWSDI-WWDI-TWWSDI-TWWp-Value
Cd45.52.3 c2.7 c6.9 b9.1 a<0.00143.2 a42.8 a38.6 b36.4 c<0.001
Pb217.226.925.441.754.50.003190.3 a191.8 a175.5 b162.7 b0.003
Co146.59.410.315.421.0<0.001137.1 a136.2 a131.1 b125.5 b<0.001
Ni141.431.838.431.153.1<0.001109.6 a103.0 b110.3 a88.3 c<0.001
Total550.670.476.895.1137.7 480.0473.8455.5412.9
Note: Values are expressed as mean ± standard deviation (n = 3). DI: surface drip irrigation, SDI: subsurface drip irrigation; WW: well water; TWW: treated wastewater; Significant p-values are highlighted in bold ** p < 0.01; *** p < 0.001.
Table 10. Daily intake of potentially toxic elements (PTEs) and associated health risk index (HRI) for adults and children consuming okra grown under different irrigation systems and water qualities.
TreatmentElementFruit Concentration (mg kg−1)Adults
DIM
Adults
HRI
Children
DIM
Children
HRI
DI-WWCd0.1170.000060.060.000070.07
Pb5.4830.002870.720.003300.83
Ni3.6500.001910.100.002200.11
Co1.1670.000610.02 *0.000700.02 *
SDI-WWCd0.0830.000040.040.000050.05
Pb3.1500.001650.410.001900.47
Ni4.4000.002310.120.002650.13
Co1.6330.000860.03 *0.000980.03 *
DI-TWWCd0.5670.000300.300.000340.34
Pb5.7330.003000.750.003450.86
Ni3.5500.001860.090.002140.11
Co1.5170.000790.03 *0.000910.03 *
SDI-TWWCd0.6500.000340.340.000390.39
Pb3.9000.002040.510.002350.59
Ni3.1830.001670.080.001920.10
Co1.7670.000930.03 *0.001060.04 *
Notes: DIM, daily intake of metals (mg kg−1 body weight day−1); HRI, health risk index. HRI values < 1 indicate no significant non-carcinogenic health risk associated with okra consumption. DI, drip irrigation; SDI, subsurface drip irrigation; WW, well water; TWW, treated wastewater. Values marked with an asterisk (*) correspond to cobalt (Co), for which an oral reference dose (RfD) of 0.03 mg·kg−1·day−1 was adopted according to [63].
Disclaimer/Publisher’s Note: The statements, opinions and data contained in all publications are solely those of the individual author(s) and contributor(s) and not of MDPI and/or the editor(s). MDPI and/or the editor(s) disclaim responsibility for any injury to people or property resulting from any ideas, methods, instructions or products referred to in the content.