Article

Construction of a “Three-Waters” Evaluation Indicator System: A Meta-Analysis

Nanjing Hydraulic Research Institute, Nanjing 210029, China
*
Author to whom correspondence should be addressed.
Water 2026, 18(8), 928; https://doi.org/10.3390/w18080928
Submission received: 3 March 2026 / Revised: 31 March 2026 / Accepted: 9 April 2026 / Published: 13 April 2026

Abstract

The synergistic management of water resources, the water environment, and the water ecology system (“Three-waters” system) is fundamental to ensuring regional water security and advancing sustainable development. However, existing evaluation indicator systems rely on expert experience and lack quantitative screening criteria, leading to indicator overlap and insufficient representativeness, which restricts the scientificity of management decisions. The study proposes a method integrating meta-analysis with case verification to construct an indicator system. A systematic review of 60 publications (1970–2024) from the Web of Science was conducted and a random effects model was used to merge effect sizes and quantify correlations and heterogeneity between indicators and the “Three-waters” system. The results indicate that the industrial water use proportion (R = −0.77) is the main stress factor in the water resources system, the negative effect of total hardness (R = −0.91) is the most significant in the water environment system, the contribution of the benthic diversity index (R = 0.90) is the most prominent in the water ecology system and vegetation coverage (R = 0.74) exhibits a strong positive effect in the social economic system. The case verification confirms the indicator system established under this method is consistent with the actual situation. This study provides methodological support for system diagnosis, coordinated regulation, and policy formulation, promoting the transformation from single-element to systemic water management.

1. Introduction

The 2021 report “Making Peace with Nature” published by the United Nations Environment Programme (UNEP) [1] highlights that, under the pressures of climate change and intensified human activities [2,3,4], the world is confronting crises such as water scarcity, biodiversity loss, and environmental pollution. The imbalance of the water resources–environment–ecology system (“Three-waters” system) has become increasingly pronounced, gradually emerging as a critical bottleneck constraining the sustainable and high-quality development of regional society and economy [5,6]. In response, numerous countries have enacted targeted policies. For instance, the United States Environmental Protection Agency’s (EPA) “Clean Water Act” establishes legal measures for water quality standards and pollutant discharge limits to improve water environmental quality [7]. Similarly, the European Union’s (EU) “Water Framework Directive” (WFD) proposes that the integrated management of water environment and ecology should be implemented on a watershed basis [8]. These policies mark the increasing importance of “Three-waters” system management as a core global water management issue.
The “Three-waters” system constitutes a large and complicated system characterized by interconnections, interactions, and dynamic evolution [9,10]. Water resources development and utilization underpin economic social growth, yet their methods and intensity directly impact the water environment and ecological quality [11]. The quality of the water environment determines the stability and persistence of habitats in the water ecology, while the water ecology improves the water environment through self-purification [12]. A healthy water environment is the fundamental guarantee for the sustainable utilization of water resources [13,14]. The interactions within the “Three-waters” system are shown in Figure 1. A profound understanding and scientific regulation of the mutual feedback relationship between the “Three-waters” are imperative, making coordinated management for the “Three-waters” system critically important [15].
Constructing a comprehensive scientific evaluation indicator system is a key means of quantifying the state of complex systems into comparable and analyzable results [16,17]. Numerous scholars have developed various evaluation systems from multiple scales and perspectives. For instance, Zhang et al. [18] established a water resources–water environment carrying capacity (WR-WECC) evaluation system with 16 indicators for Hunan Province, China, offering a scientific basis for water sustainability in water-rich regions. Yongo et al. [19] applied a Water Quality Index (WQI) method with 11 indicators to assess reservoirs in Brazil, providing a framework for sites lacking historical data. Zhang et al. [20] employed a pressure-state-response-based (PSR) framework to create a 20-indicator river health assessment for Zhengzhou, China, incorporating social economic and anthropogenic factors for a more objective tool. Grzywna et al. [21] utilized a simplified WQI method with eight indicators to evaluate the Danube River in Serbia, presenting a viable method for monitoring multi-source pollution. Furthermore, Ren et al. [22] developed a driving-pressure-state-response-based (DPSR) model with 29 indicators for the Liao River Basin in Jilin, China, facilitating the assessment of impacts from temperature, precipitation, and GDP on ecology system health.
While the need for a “Three-waters” evaluation indicator system is widely acknowledged, existing research suffers from issues such as indicator overlap, incomplete coverage, and limited representativeness. The construction of many systems relies on expert experience or direct adoption, lacking objective and unified screening criteria, resulting in a lack of systematicity [23]. Furthermore, indicators frequently lack quantitative evidence, making it difficult to verify the true strength of their correlation with system status [24]. These limitations hinder systems from holistically and dynamically reflecting the true state of the complex, coupled “Three-waters” system, thereby constraining the scientific validity and practical applicability of evaluation results. To address these limitations, the study introduces meta-analysis [25,26], proposing a method for constructing an indicator system that integrates high-frequency indicator screening, effect size quantification, and case validation. This approach aims to build a systematic, scientific, and operable “Three-waters” evaluation system. As a quantitative literature review method, meta-analysis overcomes the sample size limitations of individual studies and reveals the associations between various indicators and the system through the synthesis of effect sizes.

2. Materials and Methods

2.1. Data Screening Process

Publication screening was conducted using the Web of Science database (WoS, https://www.webofscience.com, accessed on 12 May 2025), which is widely recognized as a comprehensive repository of high-quality peer-reviewed publications. The search spanned publications from 1 January 1970 to 31 December 2024. The search strategy employed keywords categorized into three themes, combined using Boolean logical operators, as detailed in Table 1.
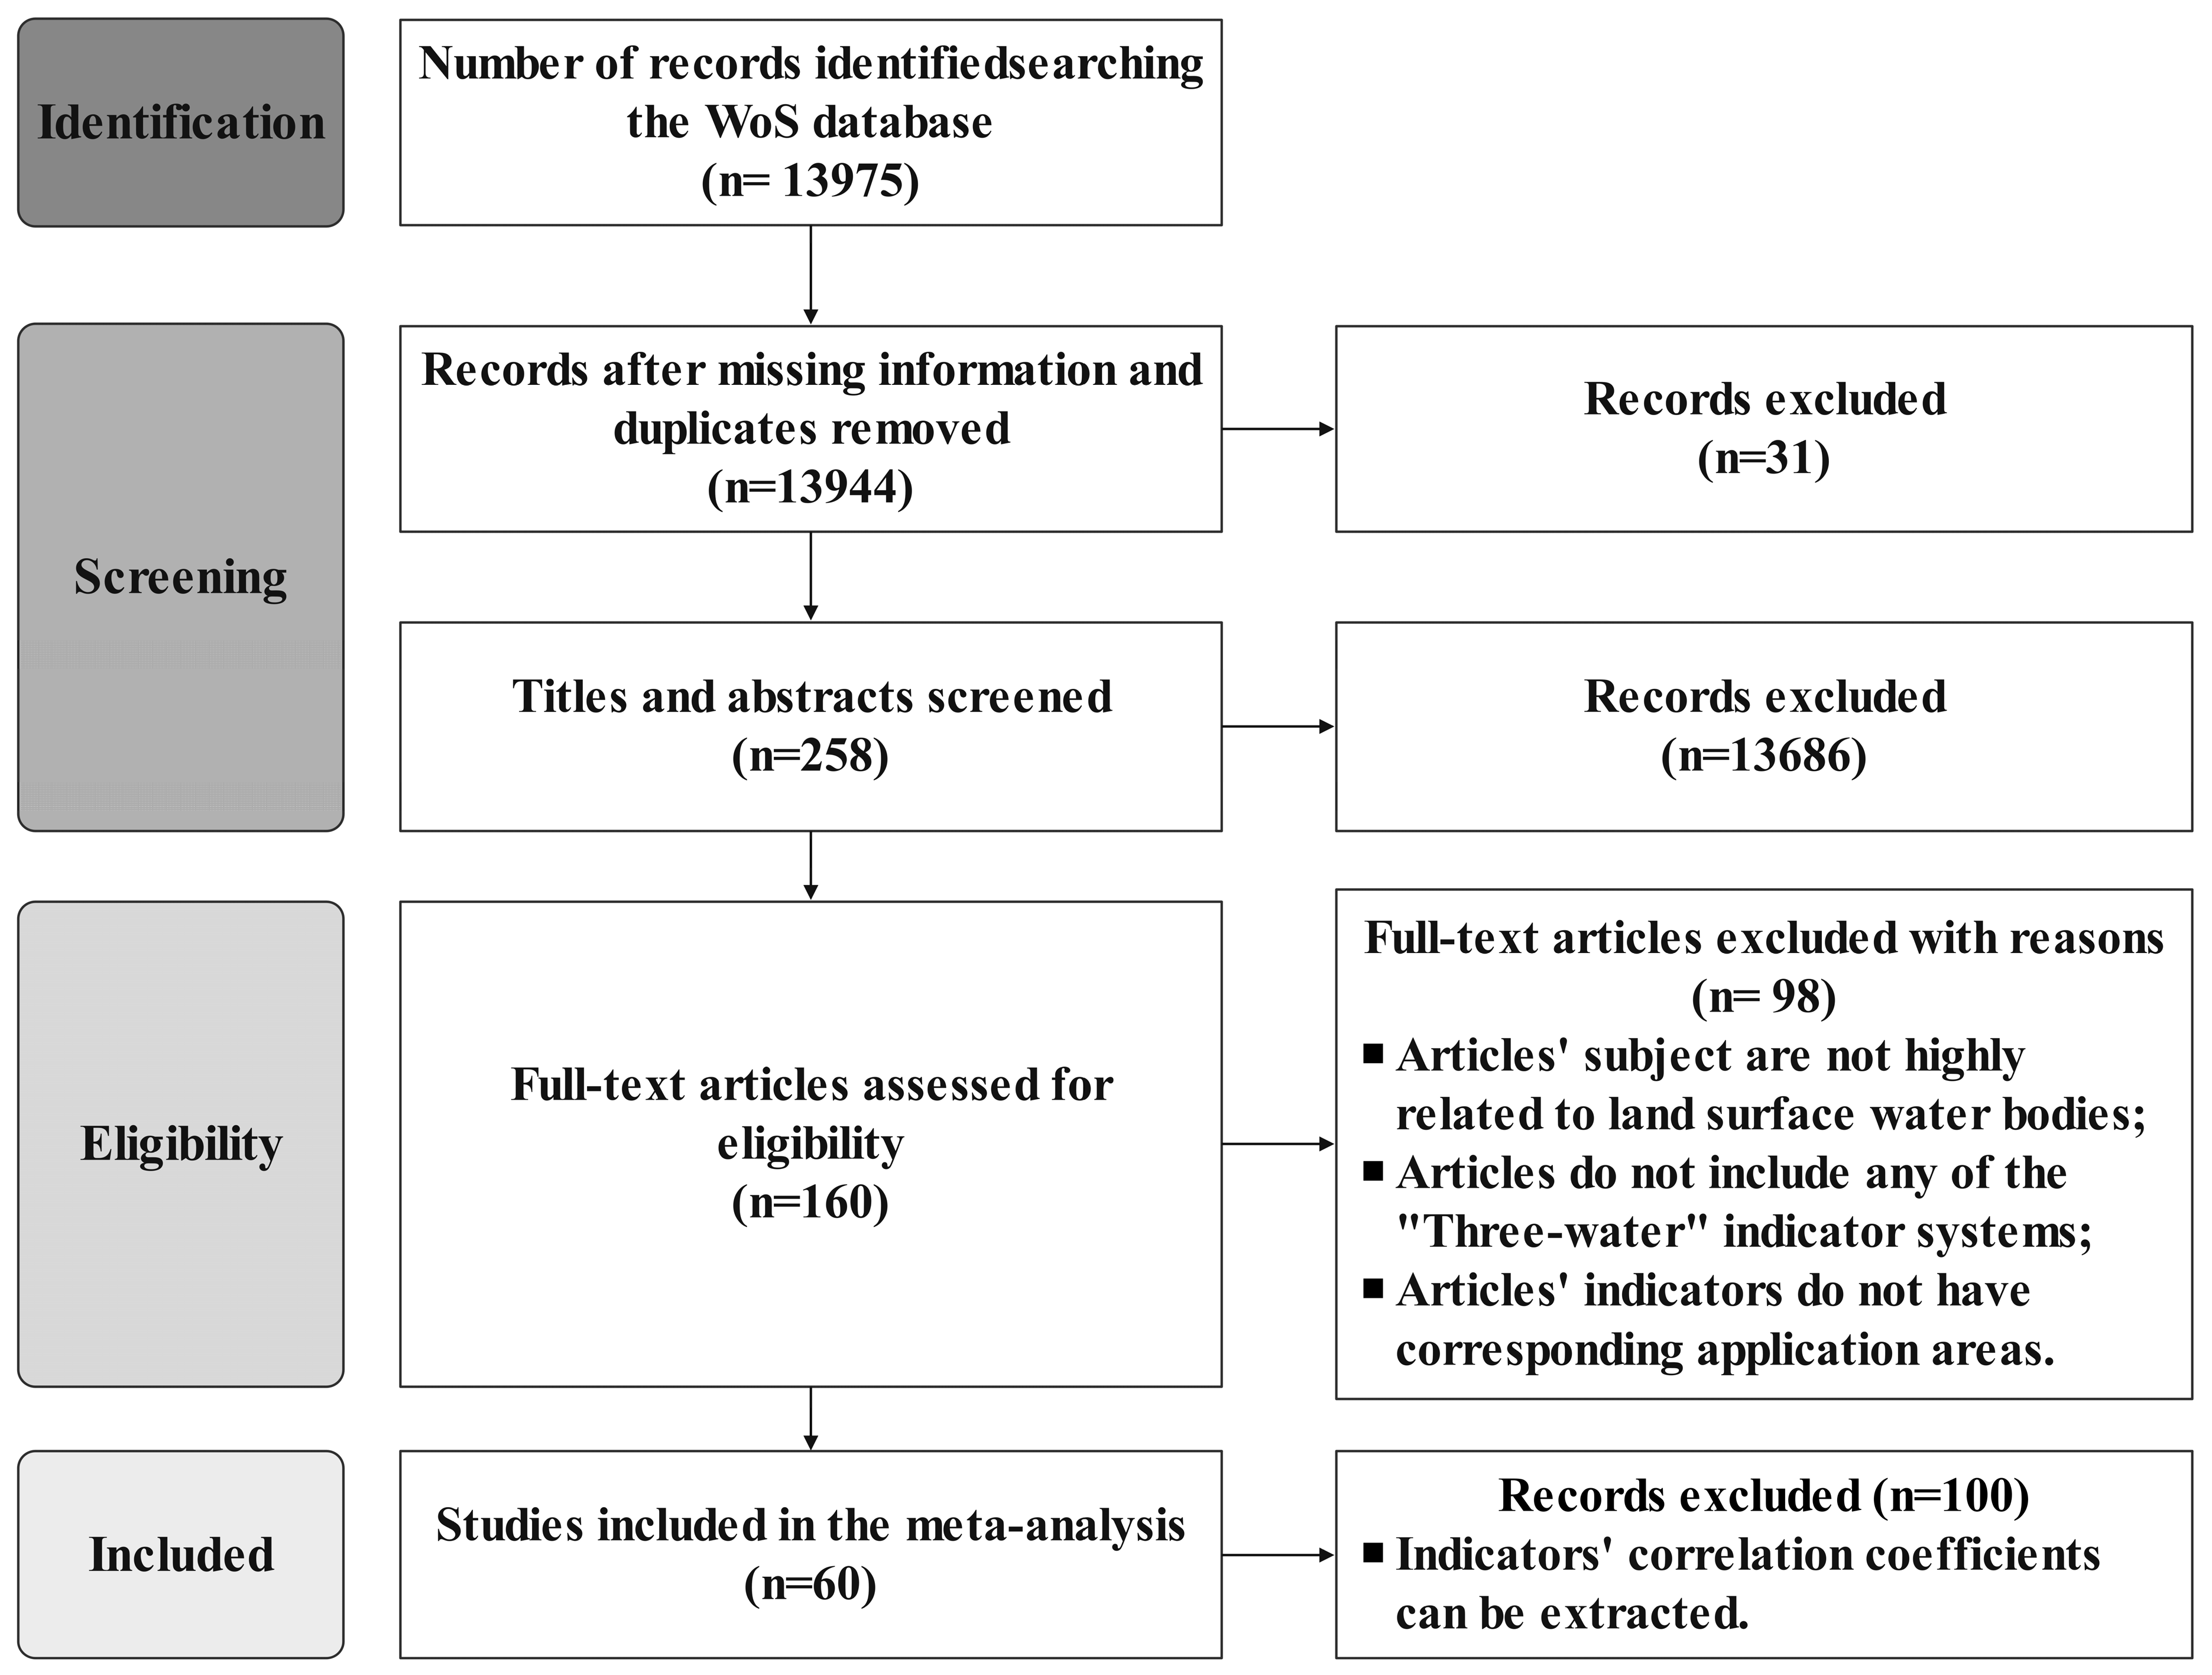
The screening process followed the Preferred Reporting Items for Systematic Reviews and Meta-Analyses (PRISMA) guidelines [27] and is illustrated in Figure 2. A total of 13,975 publications were identified from the initial search. After removing missing information records and duplicates (n = 31), the titles and abstracts were filtered based on whether the publication is based on water resources, water environment, or water ecosystems (remove 13,686 publications). Following title and abstract screening, 258 publications were selected for full-text review. Subsequently, full texts were assessed against the same inclusion criteria, following the three principles: (1) articles’ subjects are highly related to land surface water bodies; (2) articles include any of the “Three-waters” indicator systems; (3) articles’ indicators have corresponding application areas, and 98 publications were removed during this phase. Ultimately, 160 publications were selected as candidate publications for meta-analysis, and after removing publications that could not extract indica-tors’ correlation coefficients, 60 publications were ultimately included for meta-analysis.

2.2. Effect Size Calculation

Information including the study area, evaluation objectives, indicators employed and their weights, correlation coefficients, and sample sizes were extracted from the included publications. To eliminate the influence of dimensionality, the original indicator values were standardized using range normalization.
The Pearson correlation coefficient r was adopted as the effect size, calculated from the standardized indicator values and the comprehensive evaluation scores. This quantifies the direction and strength of the association between individual indicators and the system. The formula for the Pearson correlation coefficient r is as follows:
r = i = 1 n x i x ¯ y i y ¯ i = 1 n x i x ¯ 2 i = 1 n y i y ¯ 2
where r is the Pearson correlation coefficient, x i and y i are the i-th original values of variables x and y, x ¯ and y ¯ are the mean values of variables x and y, and n is the total sample size.
The correlation coefficient r was transformed to Fisher’s Z value to approximate a normal distribution, satisfying the statistical assumptions of subsequent meta-analysis. The effect size Fisher’s Z transformation calculation formula is as follows:
Z = 1 2 ln 1 + r 1 r
where Z is the effect size of a single study, and r is the Pearson correlation coefficient.
To appropriately weight each study in the meta-analysis according to its precision, the standard error of Fisher’s Z-transformed effect size was employed. For a given study with sample size n, the standard error E Z of the effect size Fisher’s Z is as follows:
E Z = 1 n 3
where E Z is the standard error of the effect size Fisher’s Z, and n is the sample size corresponding to the Pearson correlation coefficient r.
A random effects model was selected for the meta-analysis to accommodate the anticipated heterogeneity in effect sizes arising from differences in geography, water body types, and research design. The model allows for variability in the magnitude of effects across different studies, making its conclusions more universal. Subsequently, forest plots were generated to visualize individual effect sizes and their 95% confidence intervals. The analysis was complemented by calculating Fisher’s Z effect sizes and quantifying heterogeneity using the I2 statistic.
Calculate the effect size Fisher’s Z and the standard error E Z for each study using the inverse variance method to obtain summary Fisher’s Z effect sizes Z s u m m a r y . Finally, in order to maintain the statistical characteristics of the original data and enhance the interpretability and applicability of the research conclusions, the summary Fisher’s Z effect sizes were converted into summary correlation coefficient R to comprehensively evaluate the correlation between each indicator and the “Three-waters” system. The formula for the summary correlation coefficient R is as follows:
R = e 2 Z s u m m a r y 1 e 2 Z s u m m a r y + 1
where R is the summary correlation coefficient, and Z s u m m a r y is the summary Fisher’s Z effect size.

2.3. Methodology for Indicator System Construction

The methodology for constructing the indicator system is applicable to various evaluation themes. Taking the “Three-waters” system as an example, this study was divided into four steps.
(1) Indicator Screening: Based on the meta-analysis, frequency statistics were performed on the 60 publications from which correlation coefficients could be calculated. A set of high-frequency indicators was identified [18]. Low-frequency indicators (appearing only once) and unconventional indicators not reported in most studies or measured only under very specific conditions (e.g., trace heavy metals such as cobalt and barium, or organic pollutants such as phenols and cyanides) were excluded. Highly collinear indicators were merged (e.g., integrating various forms of nitrogen into total nitrogen, consolidating multiple algal indices into an algal diversity index) to reduce information redundancy [22].
(2) Effect Size Validation: A random effects model was employed to calculate the effect sizes Fisher’s Z of a single study. Then the summary Fisher’s Z effect sizes Z s u m m a r y were converted into summary correlation coefficient R using the inverse variance method. The summary correlation coefficient R quantifies the strength and direction of the association between each indicator and the state of the “Three-waters” system [25].
(3) Policy Relevance: Reference was made to core monitoring parameters stipulated in key regulations and standards, including the EU “Water Framework Directive” (WFD) [8], the U.S. “Clean Water Act” [7], and China’s “Environmental Quality Standards for Surface Water”.
(4) Case Validation: Typical case studies were selected, and the indicator system derived from the proposed methodology was applied for analytical validation [28].

3. Results

3.1. Construction of the Evaluation Indicator System

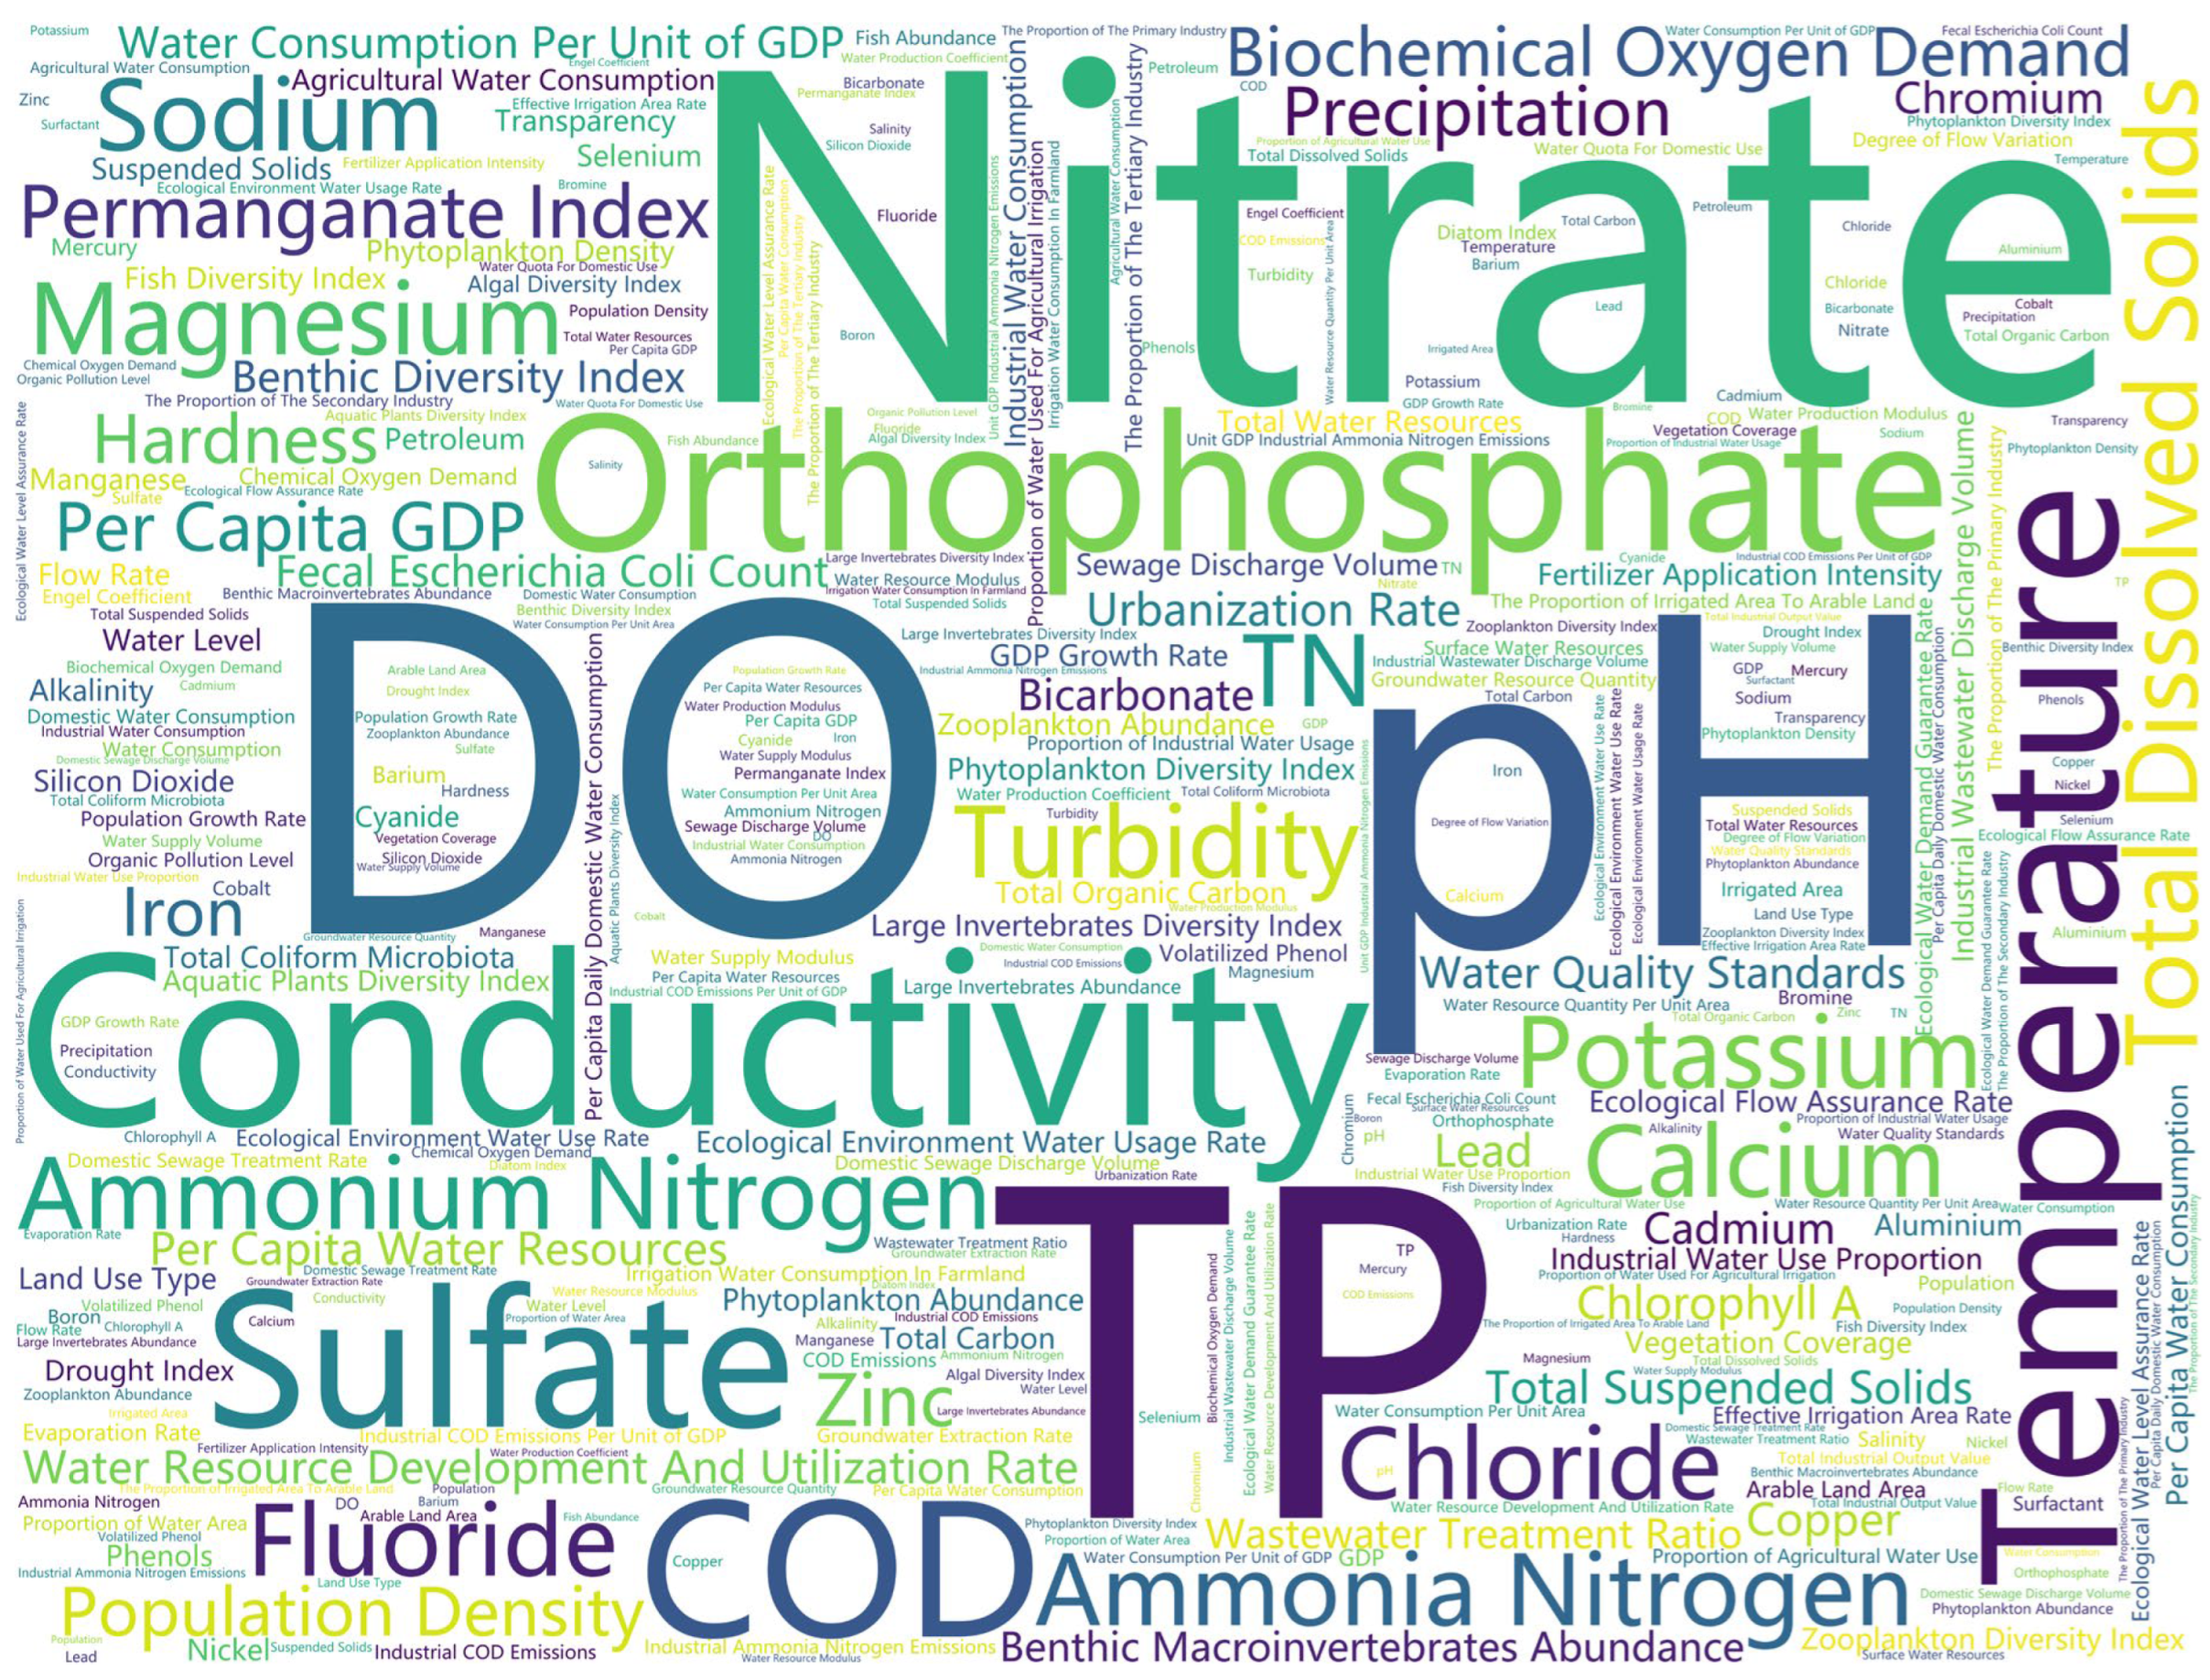
A total of 223 indicators across the “Three-waters” and social economic systems were identified through the extraction and verification of 60 publications. After excluding low-frequency indicators (appearing only once), 98 high-frequency candidate indicators were retained. Figure 3 presents a word cloud generated based on frequency. As illustrated, water quality parameters such as chemical oxygen demand (COD), nitrate (NO3), total phosphorus (TP), phosphate (PO43−-P), and ammonia nitrogen (NH3-N) appear frequently and have prominent font weights. This indicated that water quality parameters are the core elements for evaluating water pollution and health status.
A comprehensive “Three-waters” evaluation indicator system consisting of four major systems, 11 criteria, and 45 indicators was ultimately constructed (Table 2). In practical applications, adjustments should be made according to the specific characteristics of the study region.

3.2. Effect Size

3.2.1. Water Resources System

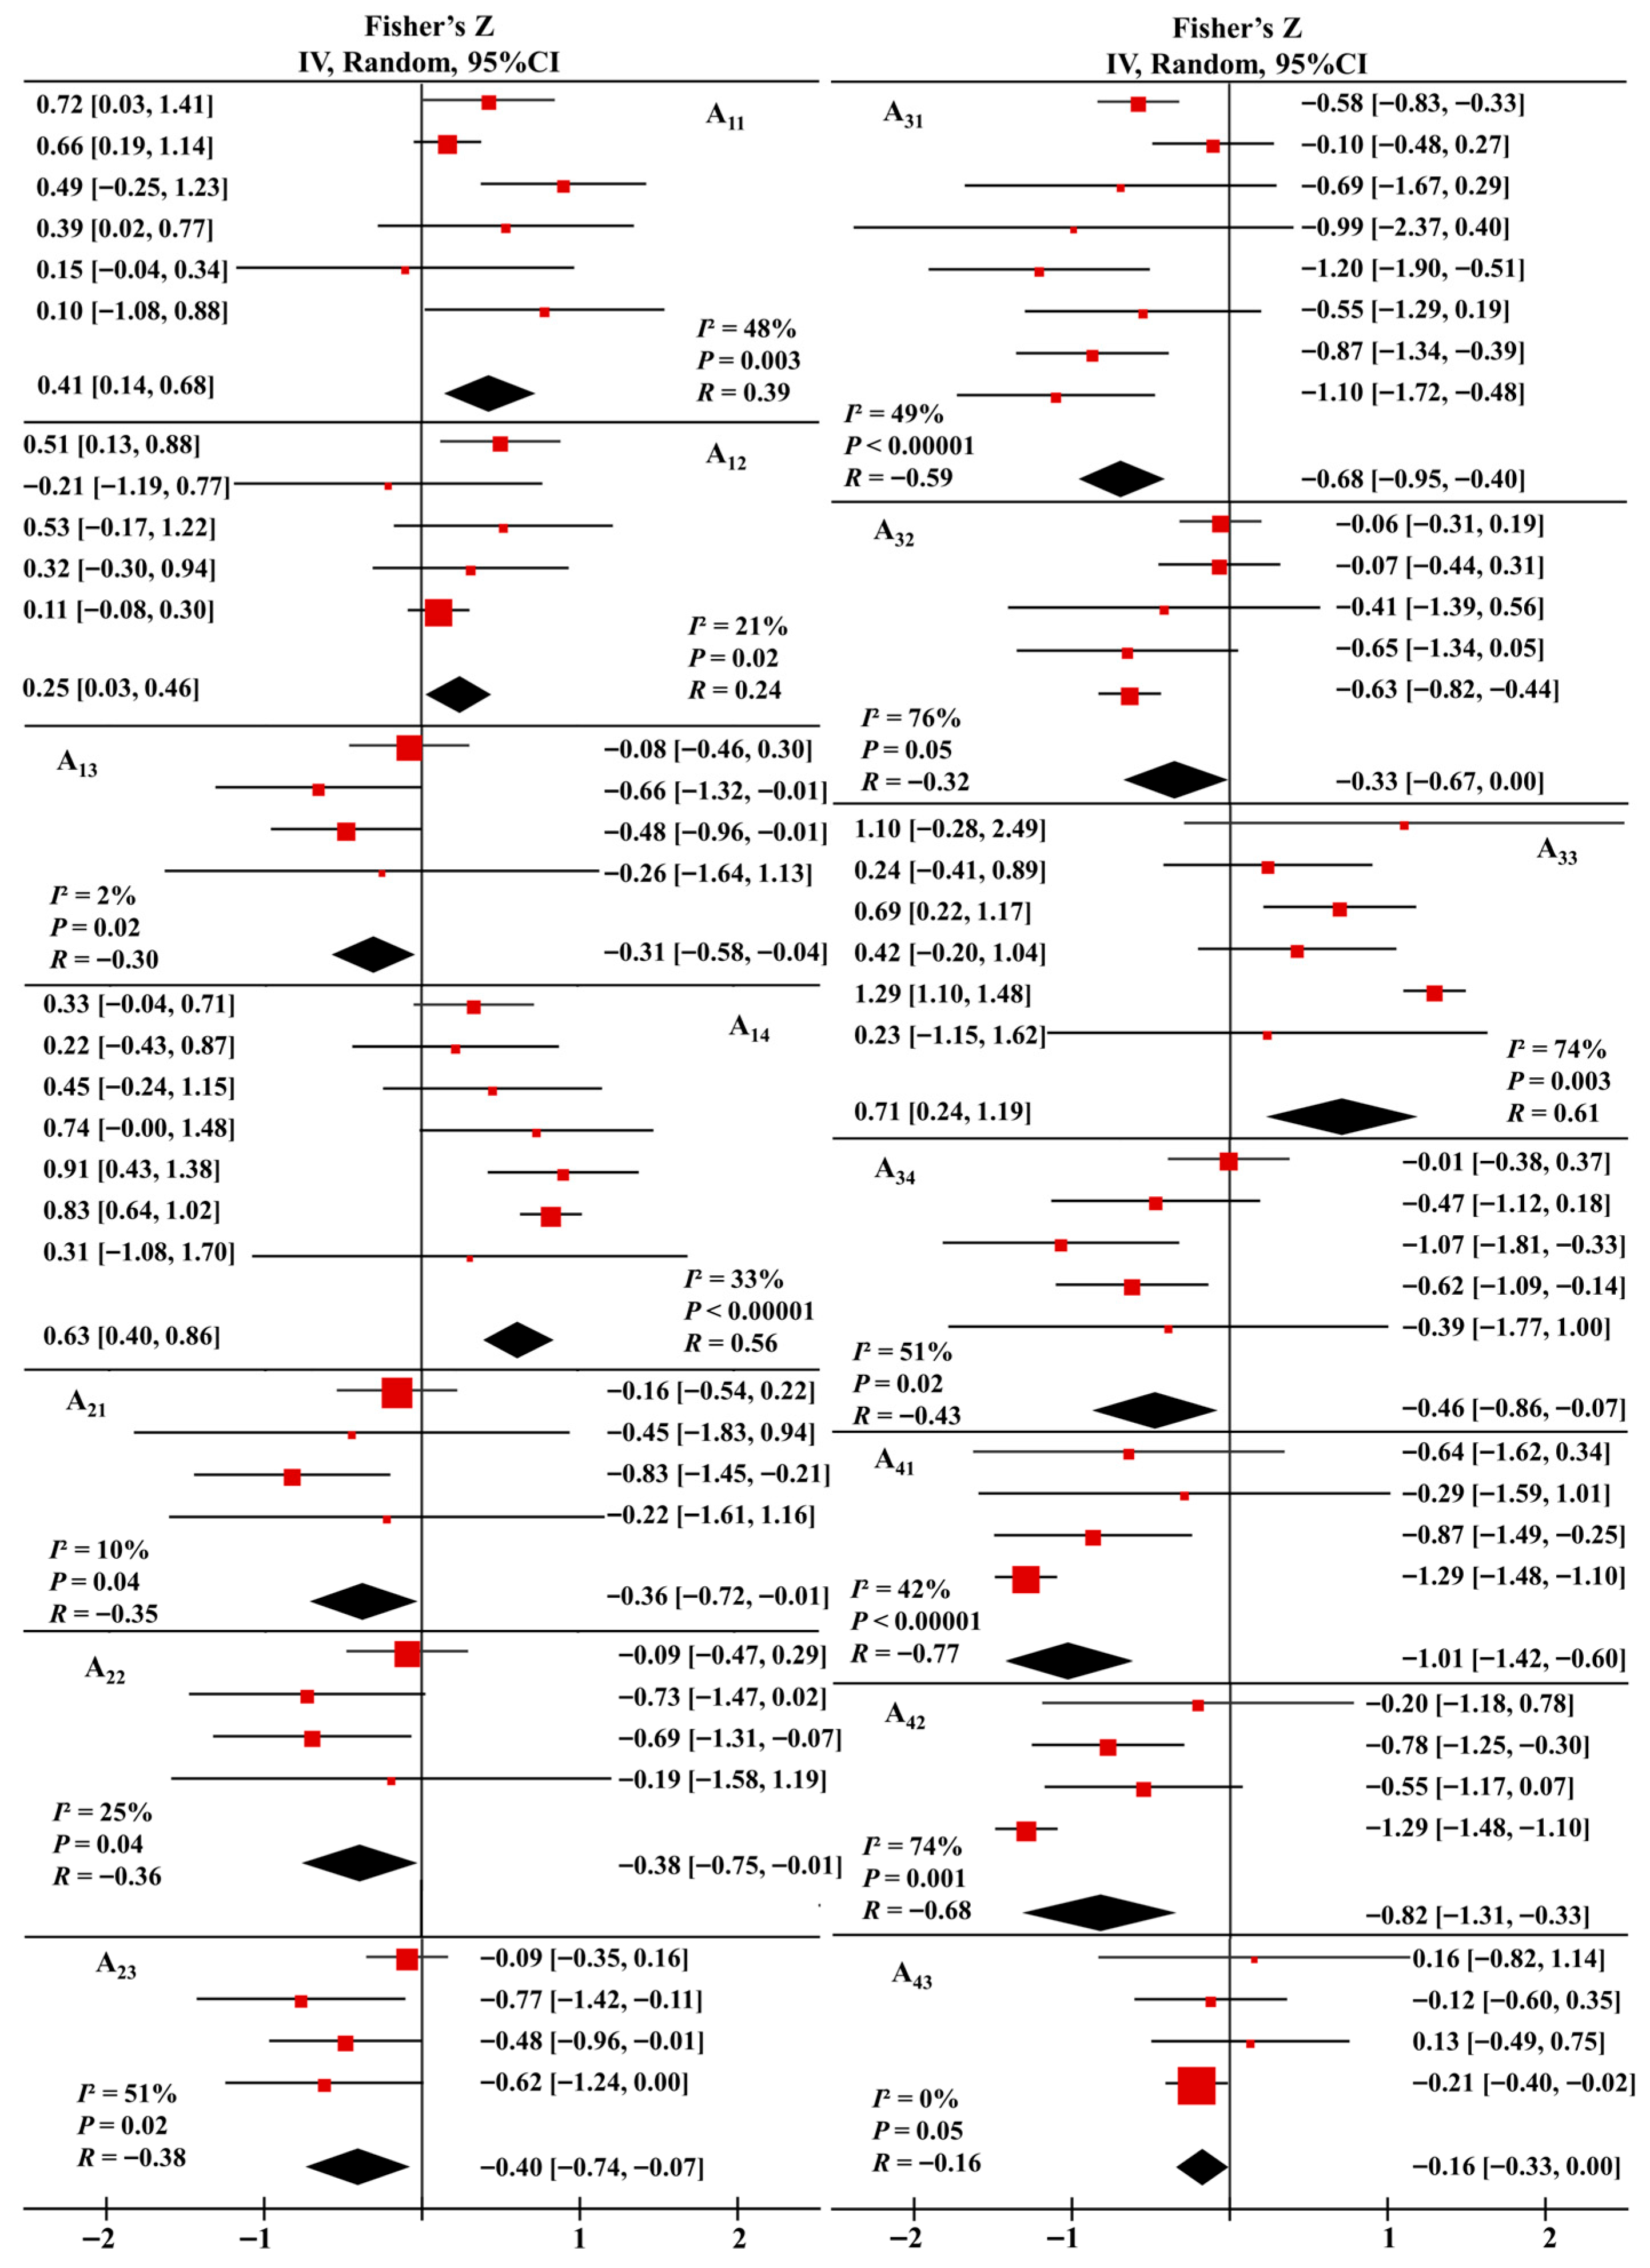
The effect size results of the correlation between water resources system indicators and the “Three-waters” system are presented in Figure 4. The state of the water resources system was determined by both resource availability (A1) and human activity indicators (A2–A4), which exhibited marked differences in effect direction and strength.
Resource availability indicators (A1) generally showed positive correlations. Among them, per capita water resources (A14, R = 0.56) demonstrated the strongest positive correlation, indicating that this indicator can comprehensively reflect the balance between regional water supply and population demand. The positive effect of precipitation (A11, R = 0.39) and total water resources (A12, R = 0.24) further confirmed the fundamental role of the natural water resources supply. In contrast, the evaporation rate (A13, R = −0.30) showed a consistent negative effect, particularly in arid and semi-arid regions, identifying it as a key pressure indicator.
Conversely, indicators related to human activities (A2–A4) predominantly showed negative effects, reflecting the pressure of water resources development and utilization on the system. For water resources development and utilization (A2), groundwater extraction rate (A22, R = −0.36) and fertilizer application intensity (A23, R = −0.38) showed moderate negative correlations, indicating that overexploitation of groundwater and agricultural pollution have a negative impact on the water resources system. In terms of water use efficiency (A3), notably water consumption per unit of GDP (A31, R = −0.59) and irrigation water consumption per unit area (A34, R = −0.43) showed strong negative effects, indicating that extensive and inefficient water use methods have a significant negative impact on the system. In terms of the water use structure (A4), the industrial water use proportion (A41, R = −0.77) and agricultural water use proportion (A42, R = −0.68) revealed the strongest negative effects, indicating high water-consuming economic sectors exert significant stress on the system.

3.2.2. Water Environment System

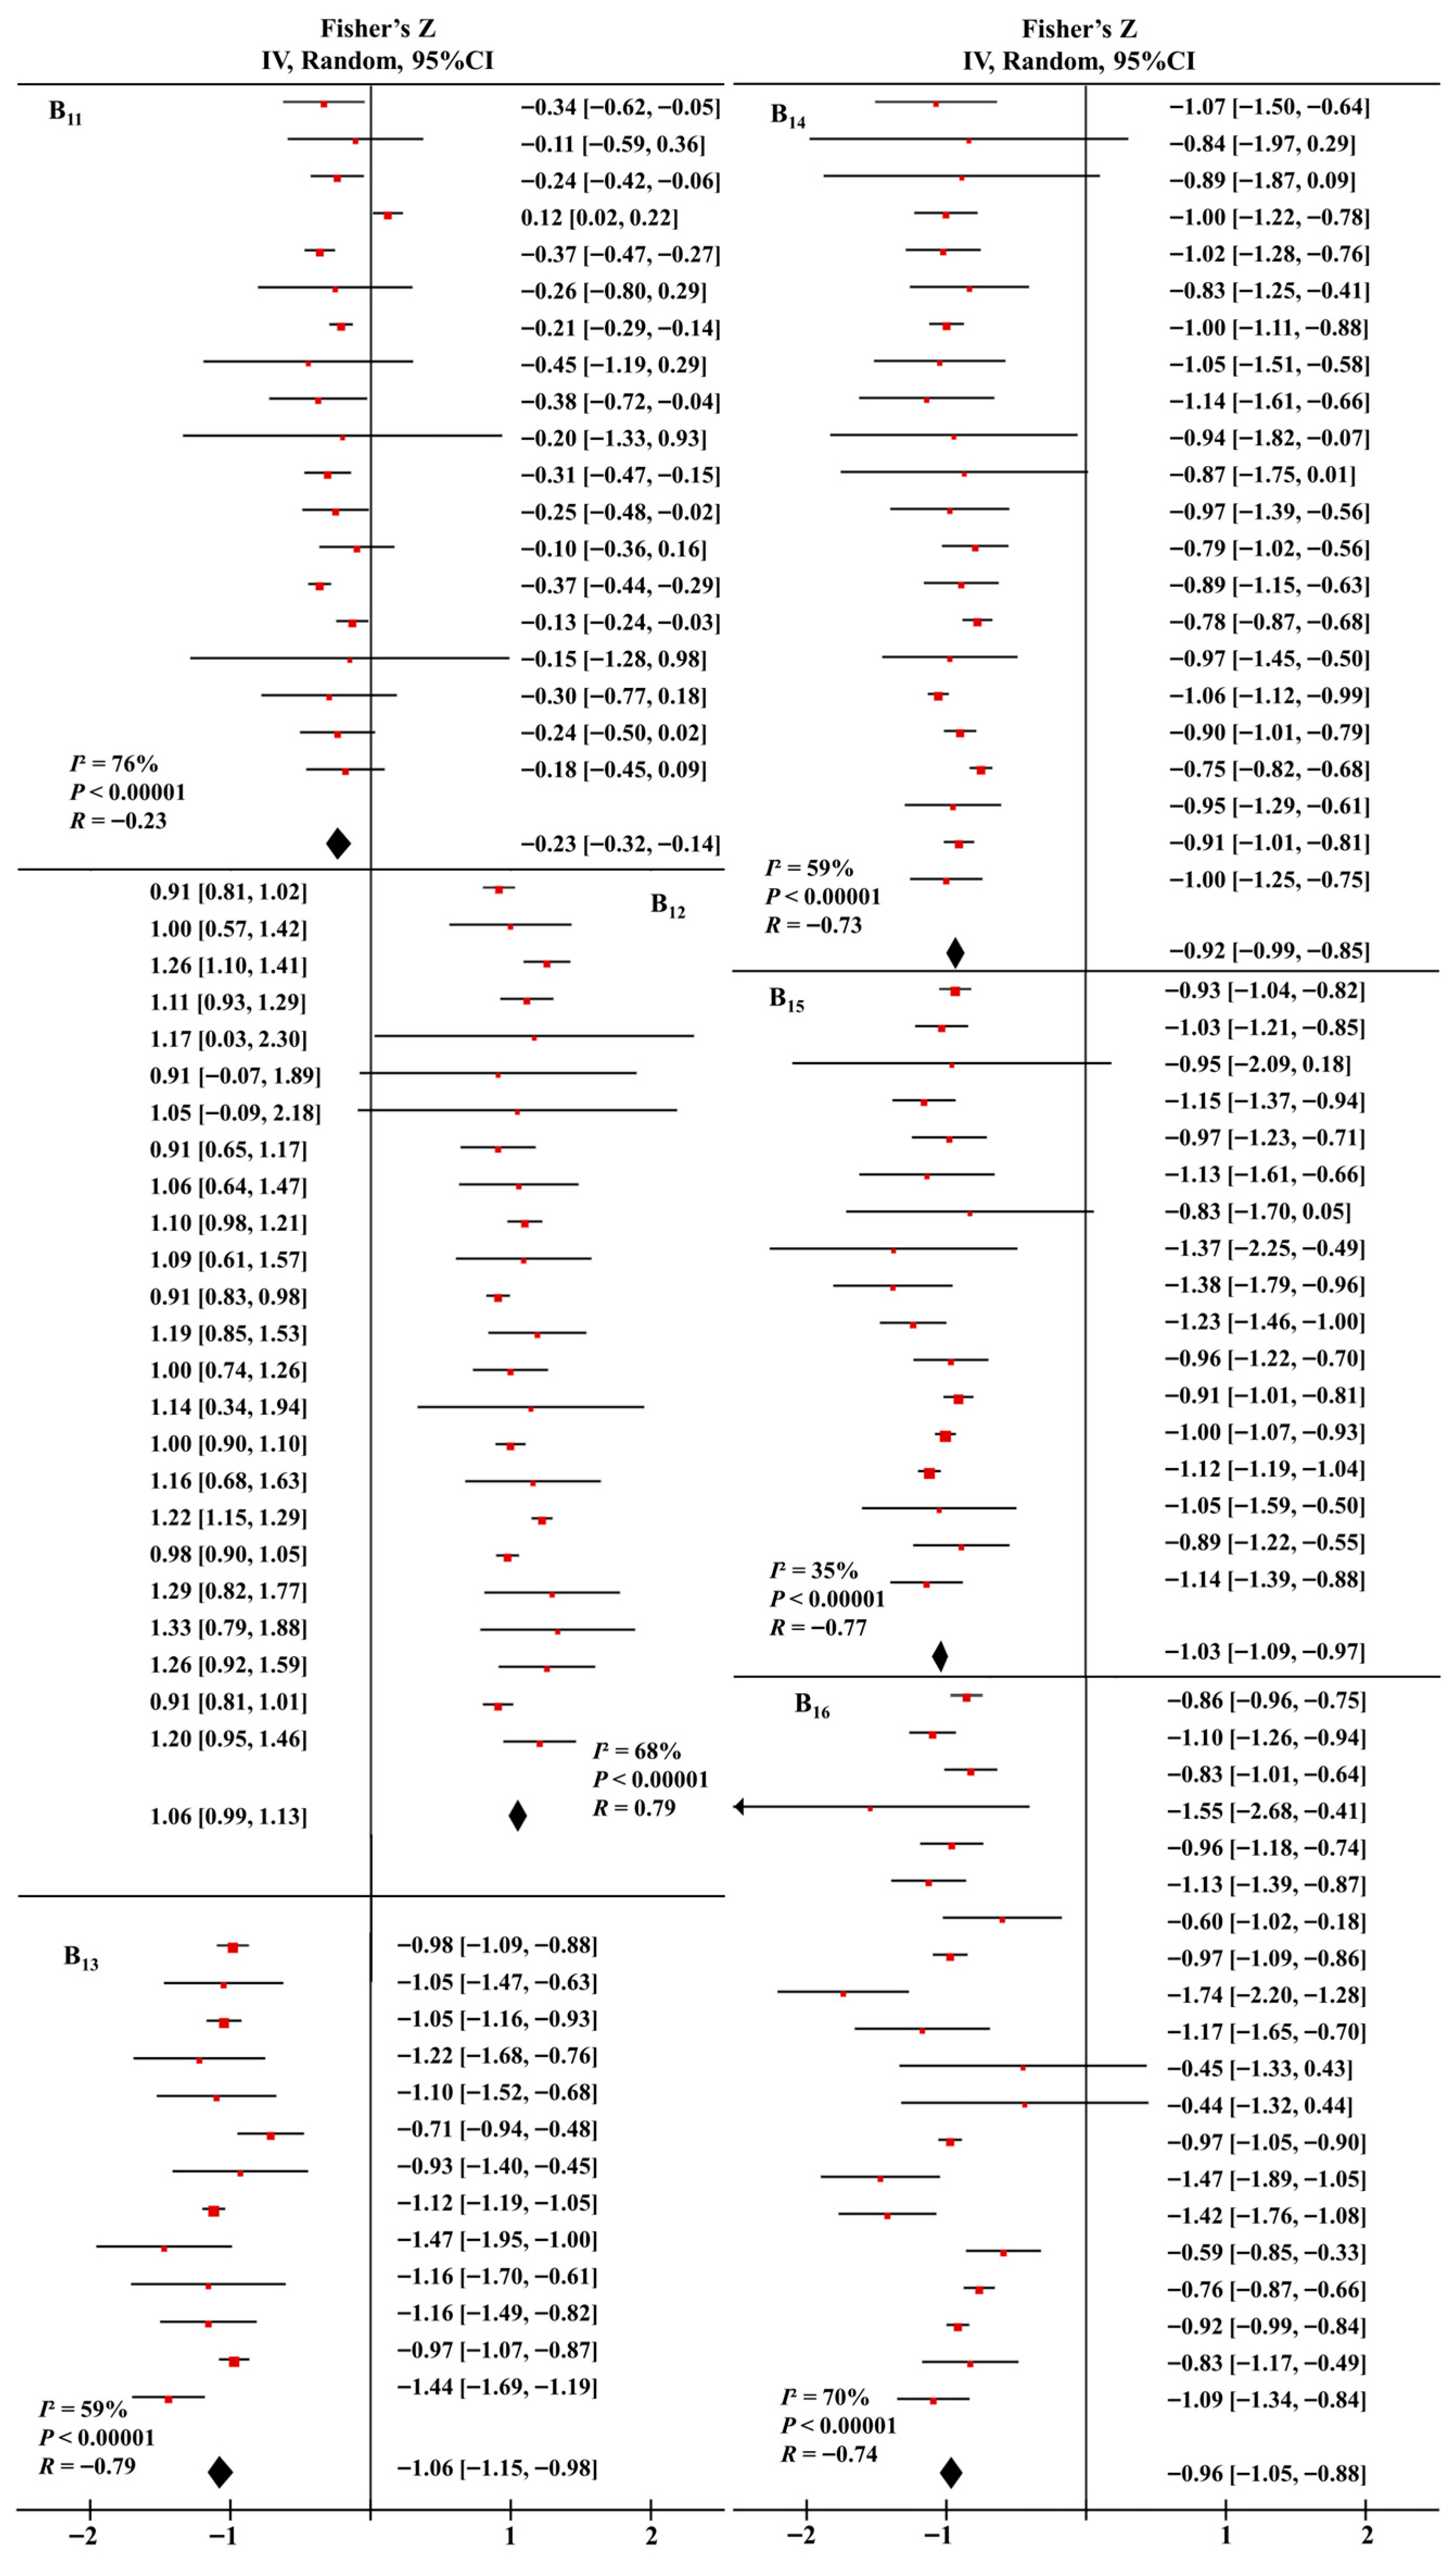
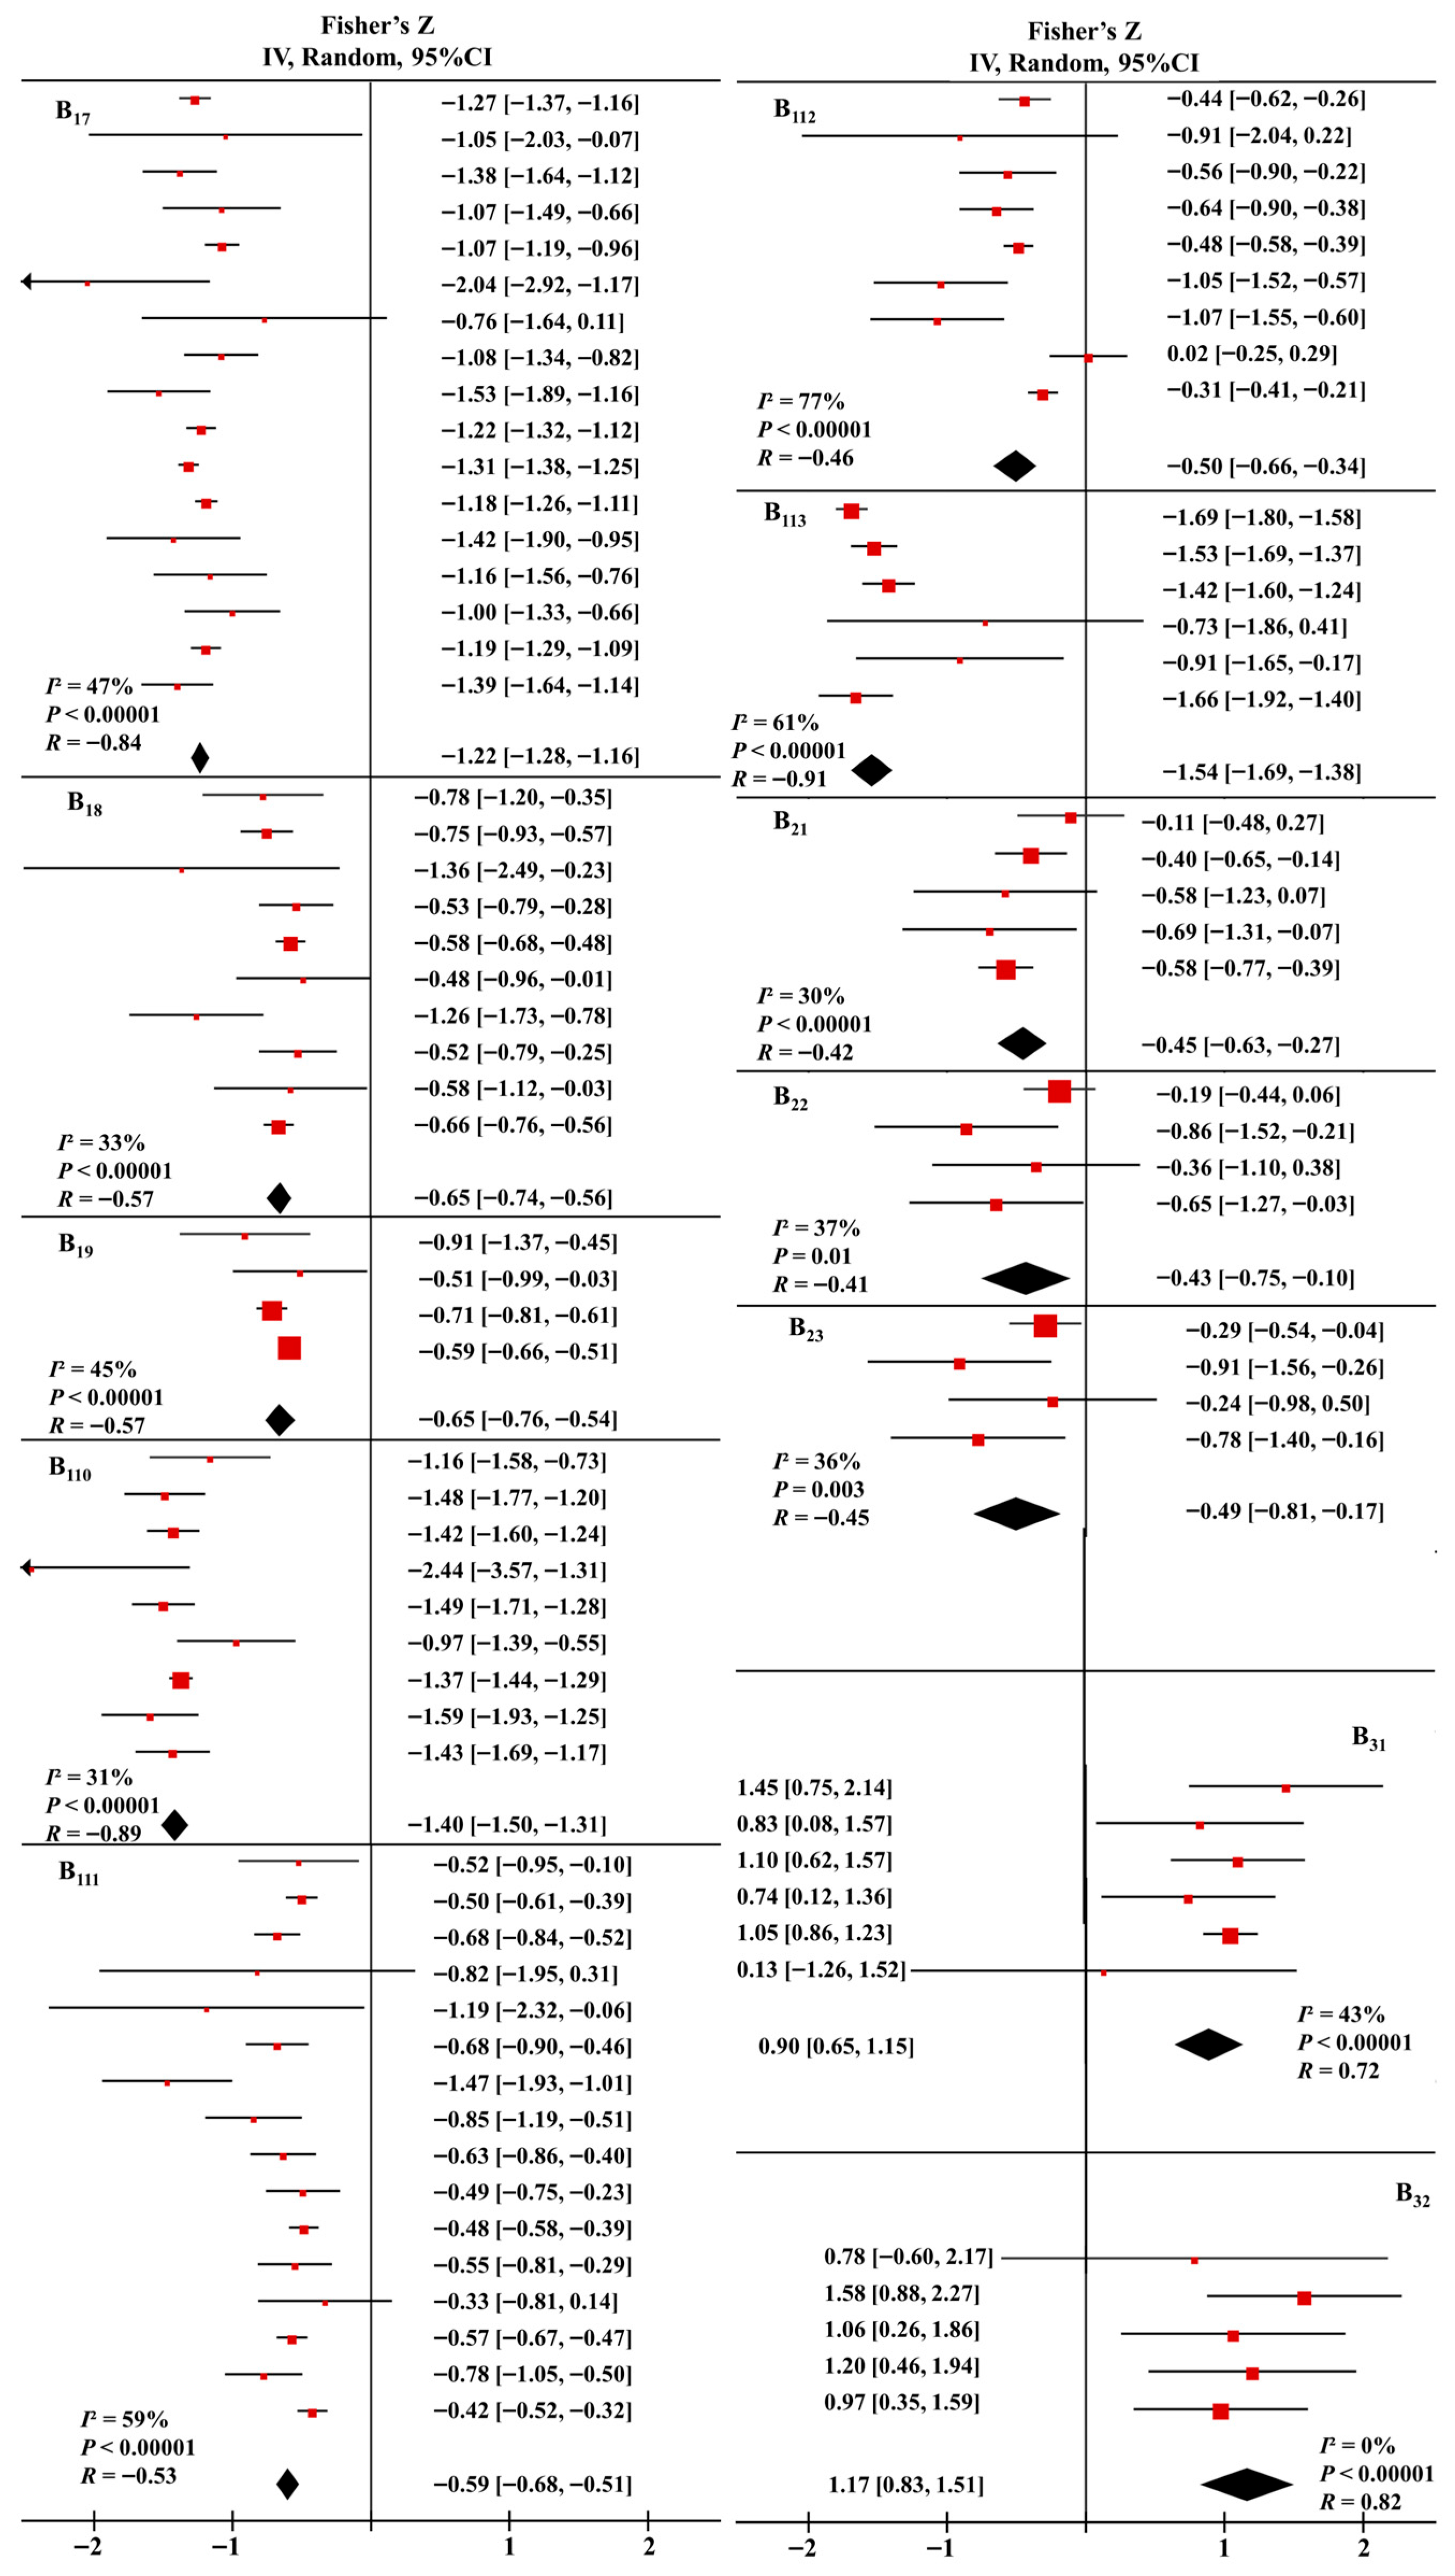
Figure 5 shows the effect size results of the correlation between water environment system indicators and the “Three-waters” system in the forest plot. Analysis of physicochemical indicators revealed significant negative correlations with system health for the vast majority of parameters, except for dissolved oxygen, indicating a widespread negative impact of pollutant accumulation.
Regarding physicochemical properties (B1), total hardness (B113, R = −0.91) showed the strongest negative effect, reflecting the integrated impact of dissolved mineral salts on water bodies. The strong negative effects of ammonia nitrogen (B17, R = −0.84) and total coliforms (B110, R = −0.89) respectively indicated the severe threats from organic and microbial pollution. Moderate to strong negative effects of total nitrogen (B13, R = −0.77) and total phosphorus (B14, R = −0.73) confirmed eutrophication as a core driver of water environment degradation. In contrast, dissolved oxygen (B12, R = 0.79) exhibited the strongest positive effect, and its concentration directly reflected the self-purification capacity and ecological health.
For pollutant discharge (B2), all indicators showed consistently negative correlations. Ammonia nitrogen discharge (B23, R = −0.45) demonstrated a slightly stronger effect than chemical oxygen demand discharge (B22, R = −0.41) and wastewater discharge (B21, R = −0.42), suggesting priority should be given to controlling nitrogenous pollutants.
In water environment management (B3), the strong positive effects of water quality standards (B32, R = 0.82) and wastewater treatment ratio (B31, R = 0.72,) confirmed the effectiveness of engineering and management measures in improving water environment quality.

3.2.3. Water Ecology System

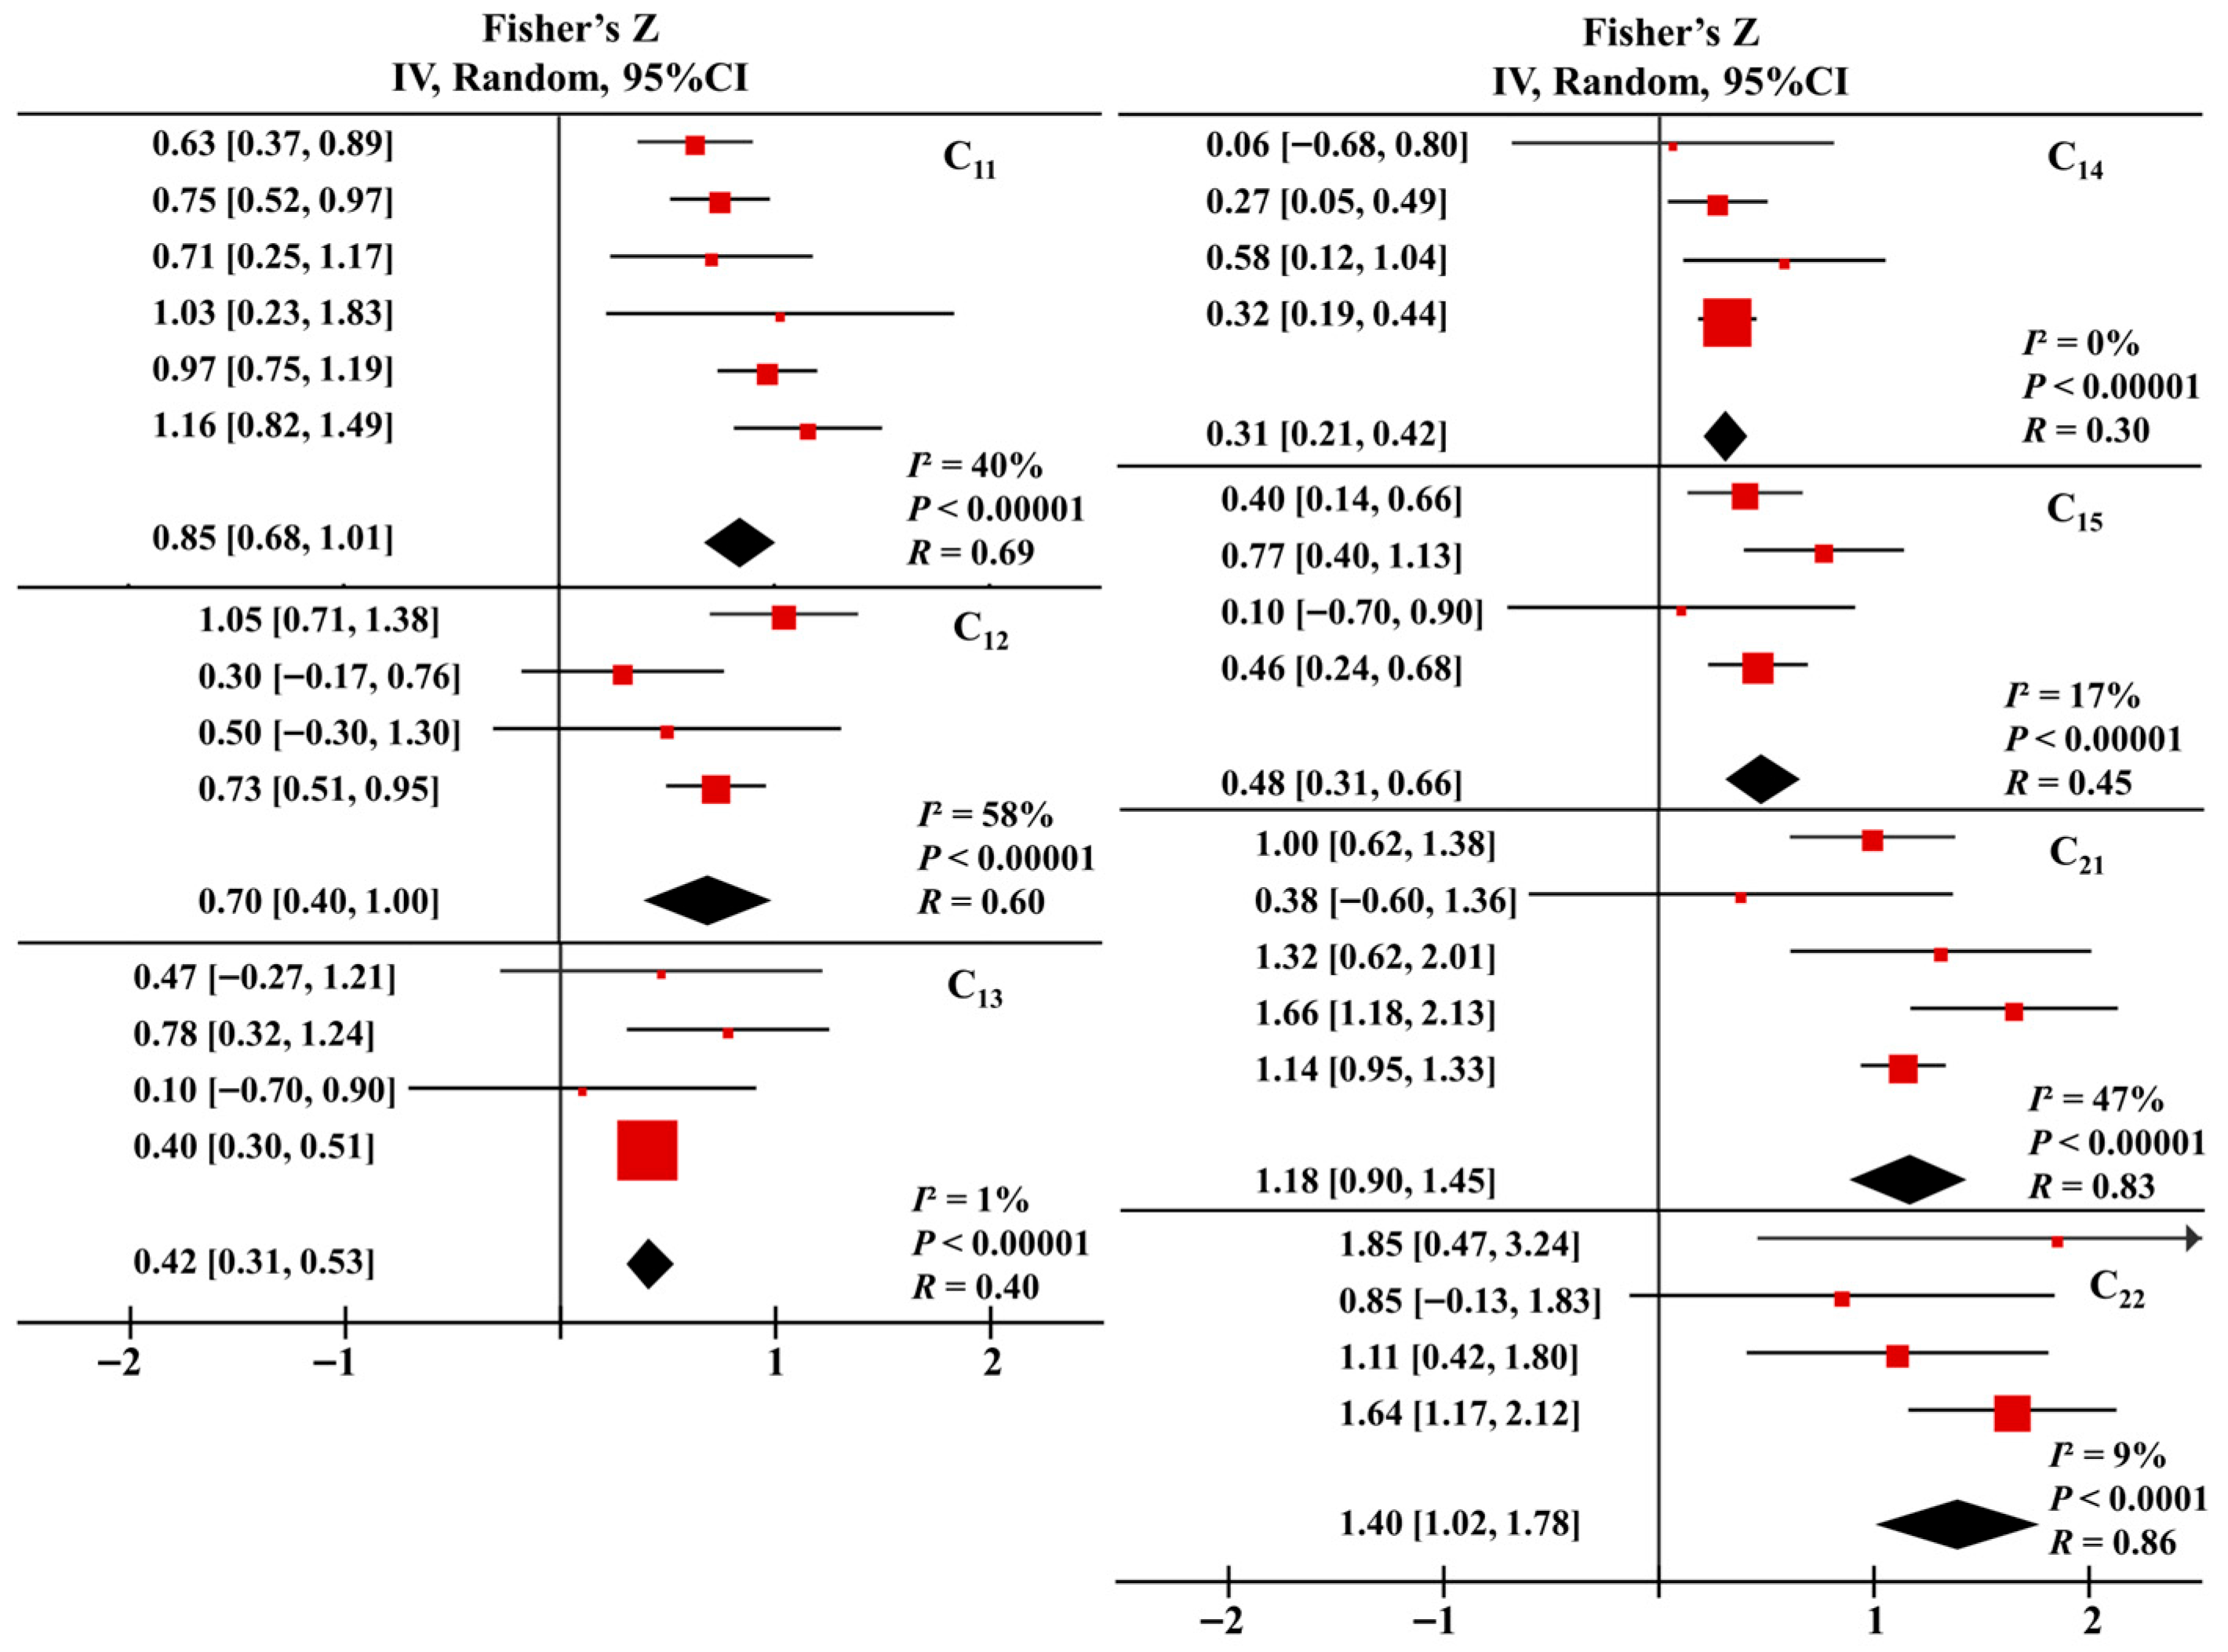
The effect size results of the correlation between water ecology system indicators and the “Three-waters” system are shown in forest plot form in Figure 6. All evaluation indicators showed significant positive correlations with system health, demonstrating that biodiversity richness and guaranteed ecological hydrology conditions were core characteristics and key drivers of water ecology system integrity.
In terms of biodiversity (C1), the benthic diversity index (C11, R = 0.90) showed the strongest positive effect, indicating its high sensitivity to habitat quality and long-term ecological stability. The moderate positive effect of the phytoplankton diversity index (C12, R = 0.70) reflected its indicative value for water ecology system status assessment. Significantly, the diversity of other biological groups, including the zooplankton diversity index (C13, R = 0.38), fish diversity index (C14, R = 0.45), and algal diversity index (C15, R = 0.32) showed significant but comparatively weaker positive effects illustrating the complementary contributions of different trophic levels to water ecology system functioning.
For ecological hydrology (C2), the indicators demonstrated very strong positive effects. The strong correlations for ecological flow assurance rate (C22, R = 0.85) and ecological environment water use rate (C21, R = 0.82) quantified the foundational role of hydrological situation maintenance in water ecology system health.

3.2.4. Social Economic System

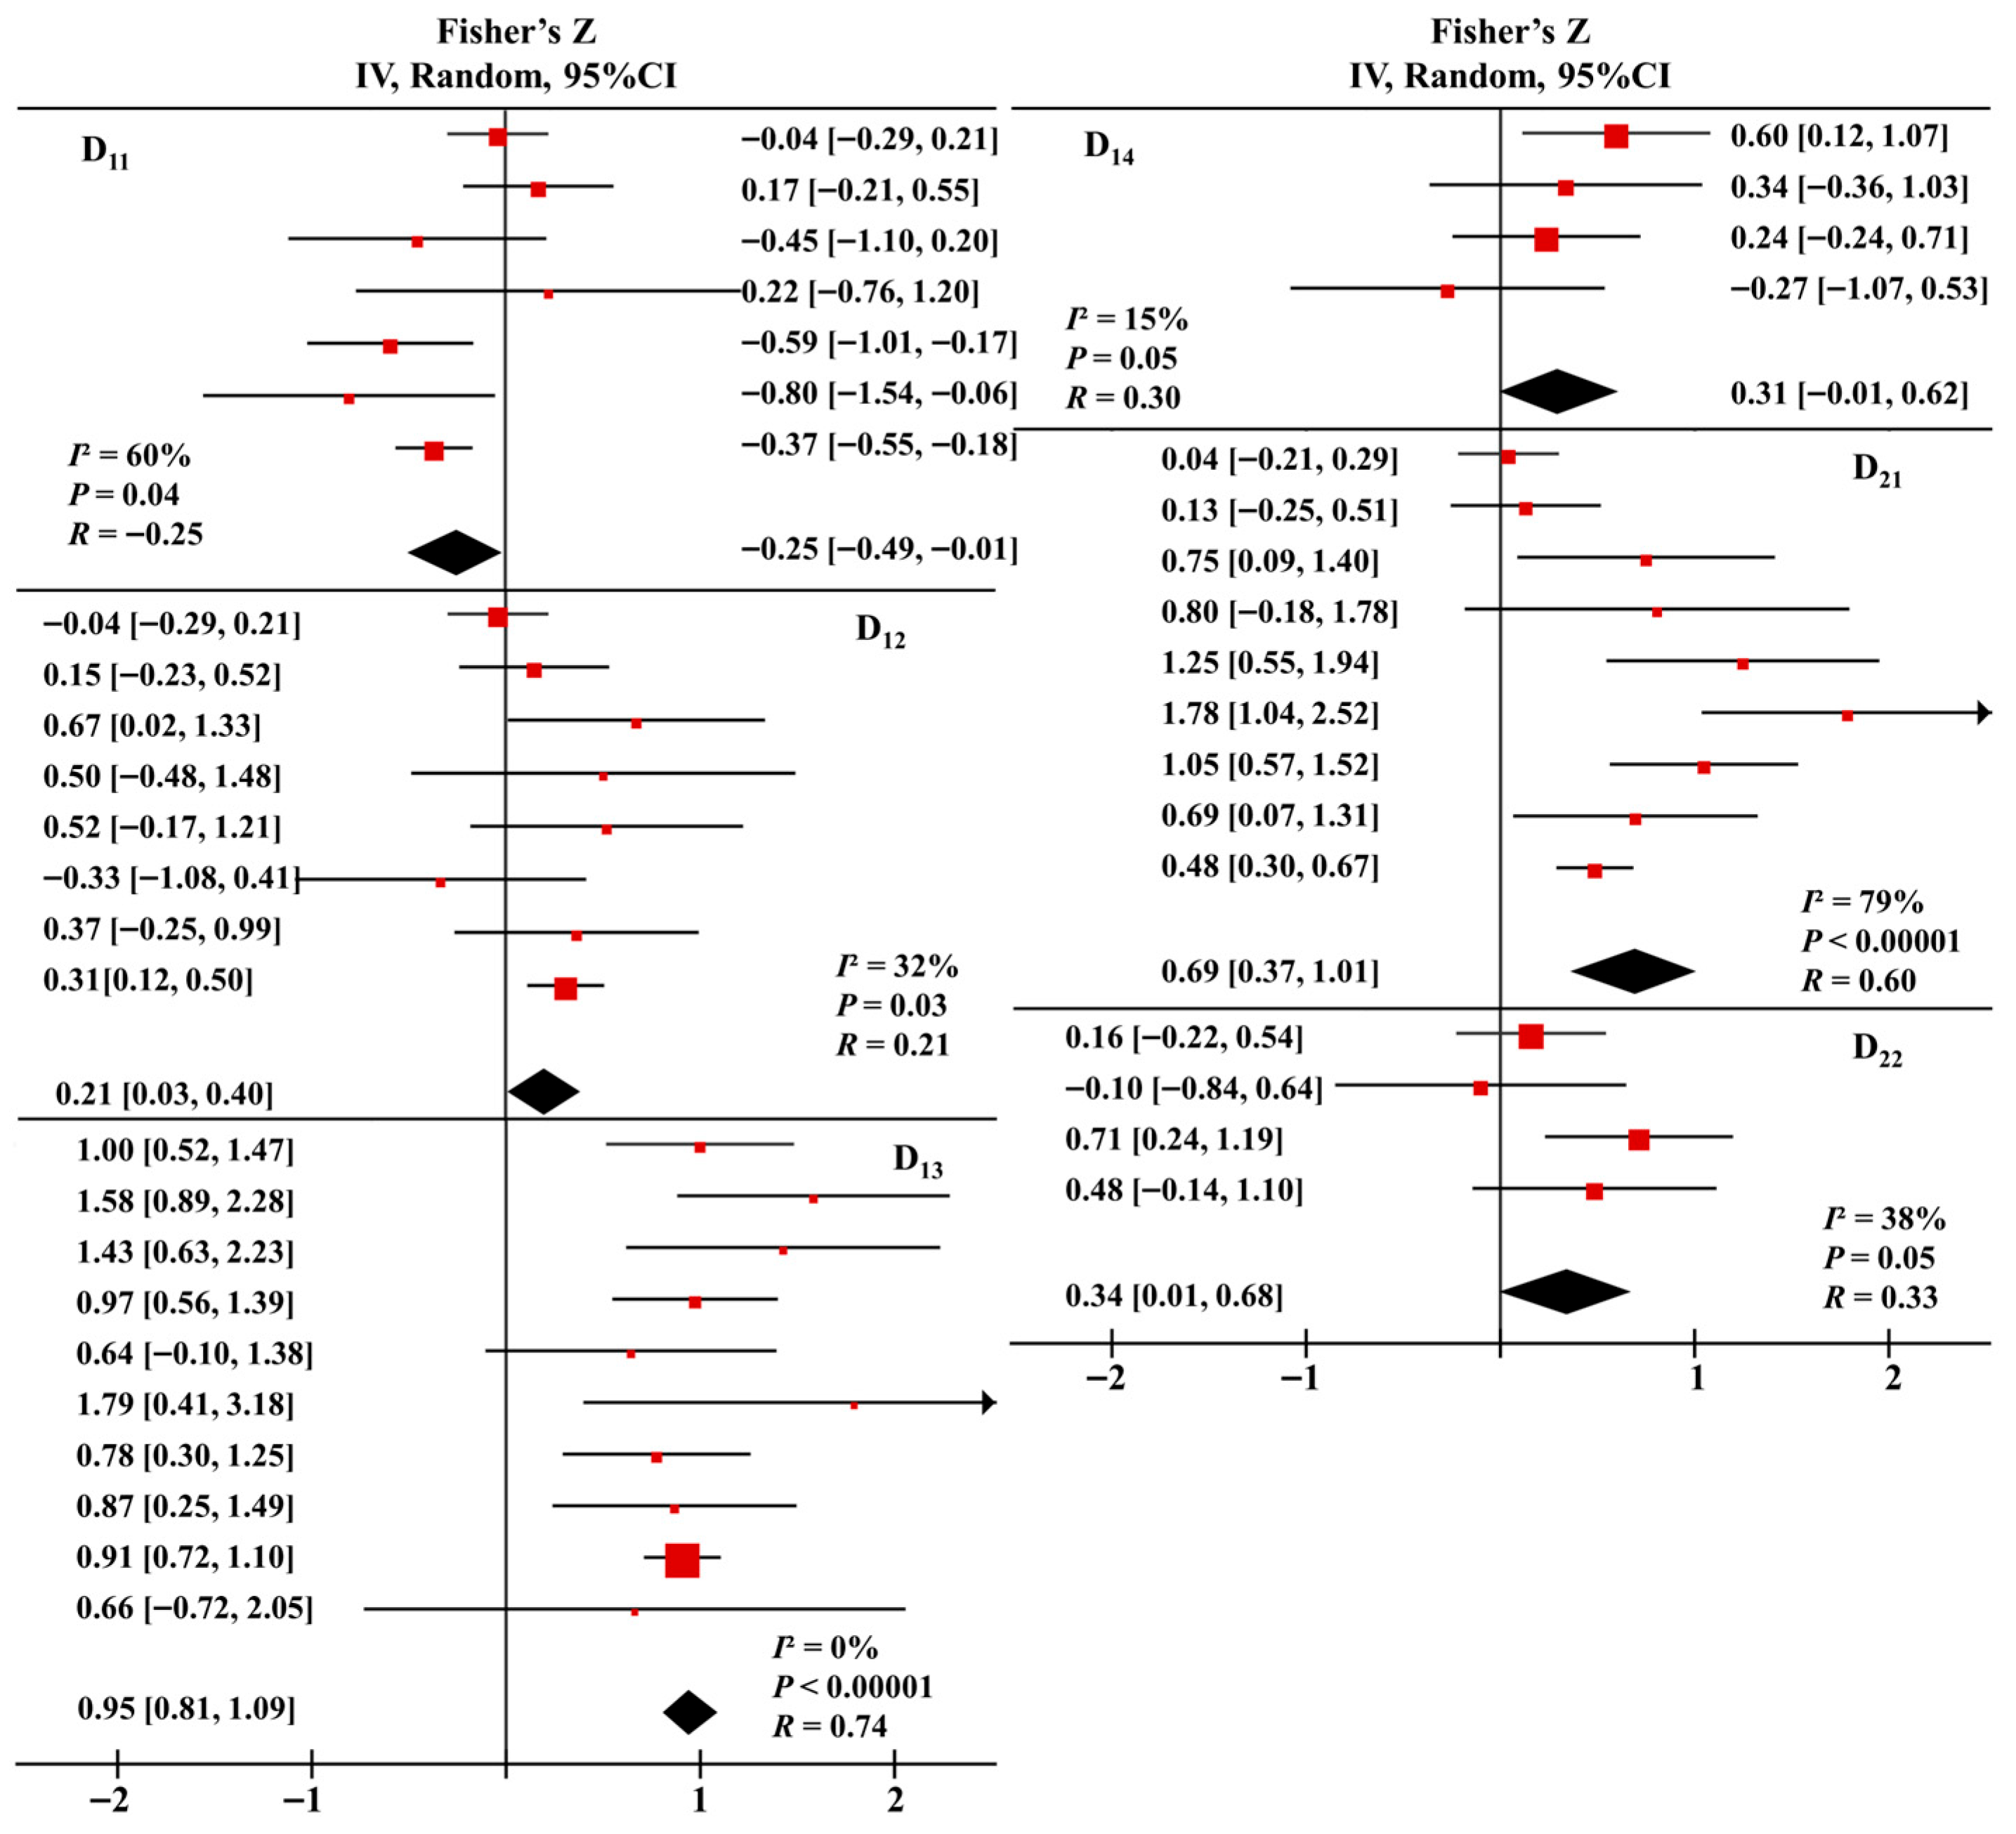
The effect size results of the social economic system indicators are shown in Figure 7. The analysis revealed markedly divergent effects among different social economic indicators, reflecting the complex mechanisms of human social development on the “Three-waters” system.
Among society (D1), population density (D11, R = −0.31) exhibited a negative effect, indicating the fundamental pressure exerted by human settlement on water resources and quality. In contrast, vegetation coverage (D13, R = 0.45) demonstrated a robust and moderate positive effect, confirming the beneficial role of ecological conservation measures. Both urbanization rate (D12, R = 0.05) and land use type (D14, R = −0.07) showed non-significant effects, suggesting their impacts are highly context-dependent and likely moderated by urban planning, environmental infrastructure, and management policies.
Regarding economy (D2), GDP per capita (D21, R = 0.28) showed a significant positive effect, implying that economic development can improve water environment through technological advancement and environmental regulation. However, GDP growth rate (D22, R = 0.12) displayed only a weak positive effect, indicating that pure economic growth may not necessarily improve water environment.

3.3. Heterogeneity Assessment

In the water resources system, the high heterogeneity observed for per capita water consumption (A32, I2 = 76%), effective irrigation area ratio (A33, I2 = 74%), and agricultural water use proportion (A42, I2 = 74%) indicated that these indicators are controlled by regional climate, irrigation technology, and crop patterns. In contrast, lower heterogeneity for industrial water use proportion (A41, I2 = 42%) and water consumption per unit of GDP (A31, I2 = 28%) indicated more consistent negative impacts across different regions.
Within the water environment system, the high heterogeneity of temperature (B112, I2 = 77%) and pH (B11, I2 = 76%) indicated that their relationships were influenced by regional, seasonal, or specific contextual factors. In contrast, the low heterogeneity for water quality standards (B32, I2 = 0%) and chemical oxygen demand (B15, I2 = 35%) suggested stable indicative effects for these metrics across diverse research contexts.
In the water ecology system, the low heterogeneity of benthic (C11, I2 = 15%), zooplankton (C13, I2 = 1%), and fish (C14, I2 = 0%) diversity suggested stable indicative functions across diverse water ecology systems. In contrast, the moderate heterogeneity for phytoplankton diversity (C12, I2 = 58%) may stem from its differential responsiveness to varying nutrient levels. Among ecological hydrology indicators, the very low heterogeneity for ecological flow assurance rate (C22, I2 = 9%) further substantiated the scientific basis for hydrological regulation as a universal management strategy.
For the socio-economic system, the substantial heterogeneity of GDP per capita (D21, I2 = 79%) and population density (D11, I2 = 65%) highlighted that their environmental effects were strongly regulated by regional development levels, technological capacity, and policy frameworks. Conversely, the exceptionally low heterogeneity for vegetation coverage (D13, I2 = 0%) established it as a universally reliable indicator of positive impact.

3.4. Case Validation

3.4.1. Validation Procedure

To assess the effectiveness and diagnostic capability of the “Three-waters” evaluation indicator system based on the meta-analysis in practical applications, two typical cases were selected for validation. The cases employ the following steps to calculate scores:
(1) Indicator data are extracted from the original publications and reclassified according to the “Three-waters” indicator system (Table 2).
(2) Indicators are standardized using the following formula:
x i j = x i j m i n x j m a x x j m i n x j
where x i j is the original value of the j-th indicator for the i-th sample, and x i j is the standardized value (ranging from 0 to 1).
For negative indicators, a transformation of 1 x i j was applied to ensure all indicators were positively oriented.
For each indicator set J within a subsystem, the weight was calculated as:
ω j = R j k J R k
where R j is the absolute value of the effect size for the j-th indicator.
Subsystem scores were calculated using the weighted summation method:
S k = 100 × j = 1 m k ω k j · x k j
where S k is the score for the k-th subsystem (ranging from 0 to 100), m k is the number of indicators within that subsystem, ω k j is the indicator weight, and x k j is the standardized indicator value.

3.4.2. Validation Results

(1)
Shitoukoumen Reservoir
Shitoukoumen Reservoir, located in Jilin Province, serves as the primary drinking water source for Changchun City. Li et al. [28] established four monitoring sections (W1–W4) in this reservoir and assessed its water quality using both the TOPSIS-based Informative Weighting and Ranking (TIWR) method and fuzzy comprehensive evaluation based on the Analytic Hierarchy Process (AHP). Both methods consistently indicated that W2 was the most severely polluted, while W1, W3, and W4 exhibited better water quality. W2 was substantially influenced by wastewater from upstream towns, whereas the other sites were less affected by human activities.
According to the “Three-waters” indicator system (Table 2), seven water environment indicators were extracted from Table 1 of Li et al. (Supplementary Material S1, Table S1). Following standardization and weighted summation as described in Section 3.4.1, water environment scores for each section were obtained (Table 3). The results demonstrated a score ranking of W4 ≈ W1 > W3 > W2, consistent with the conclusions of the original study, confirming that this framework can accurately identify pollution hotspots.
(2)
Lake Tai
Lake Tai is the third-largest freshwater lake in China and has long been afflicted by eutrophication. Li et al. [28] divided 20 monitoring stations into three regions (Area 1: eastern, Area 2: southern, Area 3: northern) and assigned water quality, including Area 1 as Class IV, Area 2 as Class V, and Area 3 as worse than Class V based on China’s “Environmental Quality Standards for Surface Water” (GB 3838-2002) [82].
Following the “Three-waters” indicator system (Table 2), annual mean values for five indicators for the period 2011–2013 were extracted from Table 3 of Li et al. (Supplementary Material S2, Table S5). Water environment scores were calculated for each station and year (Supplementary Material S2, Table S8), and the average scores for each region are presented in Table 4.
The results revealed a score ranking of Area 3 < Area 2 < Area 1, indicating that pollution in the northern region far exceeded that in the southern and eastern regions. The lowest-scoring stations, W10 (38.1–41.9) and W11 (0.0–9.0), were both located in Meiliang Bay, identifying this area as the core pollution hotspot, consistent with the conclusions of the original study. Furthermore, weight analysis indicated that ammonia nitrogen ( ω j = 0.216) and total nitrogen ( ω j = 0.203) exerted the greatest influence on water quality. At stations W10 and W11, the concentrations of these two indicators far exceeded the Class V standard, clearly identifying nitrogen pollution as the primary cause of eutrophication in Lake Tai.

4. Discussion

The construction of a multi-dimensional, multi-objective “Three-waters” evaluation indicator system is a complex systematic project involving the coordinated integration of ecological, environmental, resource, social, and economic dimensions [17]. This study synthesized 60 high-quality publications through meta-analysis, calculated the summary effect sizes of each indicator, constructed a “Three-waters” evaluation indicator system, and quantified the strength and direction of associations between each indicator and system.

4.1. Methodological Contributions

Conventional approaches to indicator system construction often rely on expert experience or directly adopt indicators from existing studies, lacking objective screening criteria [16]. In contrast, the meta-analysis employed in this study followed the PRISMA guidelines for systematic publication screening, grounding indicator selection in empirical evidence drawn from a broad range of relevant studies. This approach effectively reduces subjectivity in indicator selection and ensures transparency and reproducibility [83].
The methodological contributions are threefold. First, the summary correlation coefficient R provides a quantitative basis for assigning indicator weights. Second, heterogeneity assessment using the I2 statistic distinguishes indicators with consistent effects from those requiring context-specific interpretation. Low-heterogeneity indicators can serve as core indicators, whereas high-heterogeneity indicators are context-dependent, laying the foundation for differentiated evaluation [84]. Third, validation through two case studies confirms the effectiveness and diagnostic capability of the proposed indicator system in practical applications. The “systematic screening, frequency analysis, effect size analysis, and case validation” methodological framework developed in this study offers a reference for constructing evaluation systems in other complex domains.

4.2. Management Implications

In the water resources system, the strong negative effect of the industrial water use proportion (R = −0.77) indicates that industrial water consumption is a major stressor in most regions. Adjusting water allocation and industrial structure and promoting water-saving technologies can yield significant benefits. Meanwhile, the moderate positive effect of the effective irrigation area ratio (R = 0.61) suggests that, when properly managed, irrigation infrastructure can positively contribute to system sustainability. Expanding irrigation infrastructure, coupled with efficient water delivery systems, supports investment in modern irrigation technologies [85].
In the water environment system, total hardness exhibited the strongest negative correlation (R = −0.91). Given that most water quality assessments prioritize nutrients and organic pollutants [33], this finding suggests that water quality evaluation frameworks should be extended beyond conventional eutrophication parameters to a broader range of factors. In particular, salinity management and groundwater extraction control deserve greater attention in arid and semi-arid regions. Moreover, the positive effects of the wastewater treatment ratio (R = 0.72) and water quality standards (R = 0.82) provide theoretical support for continued investment in treatment facilities.
In the water ecology system, the strong positive effect of the benthic diversity index (R = 0.90) confirms the rationale for prioritizing this indicator in monitoring programs. The consistently low heterogeneity observed for benthic (I2 = 15%), zooplankton (I2 = 1%), and fish diversity (I2 = 0%) indicates that these indicators have stable diagnostic functions across different water bodies. Furthermore, the strong effects of the ecological flow assurance rate (R = 0.85) and environmental water use rate (R = 0.82) provide quantitative support for policies mandating minimum flow requirements [23].
In the social economic system, the strong positive effect of vegetation coverage (R = 0.74) suggests that land use policies promoting forest protection, afforestation, and green infrastructure can generate synergistic benefits across the “Three-waters” subsystems.

4.3. Limitations and Prospects

4.3.1. Situational Differentiation Evaluation

A summary of existing “Three-waters” evaluation studies reveals that current evaluation systems tend to emphasize indicator universality while paying insufficient attention to regional variations in hydrometeorology, topography, and socio-economic development. Consequently, differentiated indicator systems have not yet been developed. The significant heterogeneity observed for indicators such as per capita water consumption (I2 = 76%) and water temperature (I2 = 77%) demonstrates that indicator performance varies substantially across climates (such as arid and humid regions) and social economic backgrounds (such as developed and developing regions). Future efforts should combine core indicators selected from low-heterogeneity indicators to ensure cross-regional comparability with context-specific customization. Strengthening comparative analyses across regions, establishing mechanisms for indicator transformation, and enhancing the regional adaptability and transferability of evaluation systems are essential.

4.3.2. Scale Dependency of Indicators

The indicators screened in this study were derived from studies conducted at different spatial scales, ranging from individual rivers to entire basins. However, effective water management requires coordination across multiple spatial scales, from river reaches to sub-watersheds to entire basins, and then addressing the issue of multi-scale linkage. For example, the benthic diversity index (R = 0.90) is highly reliable at the reach scale, but its effect size may diminish with increasing spatial aggregation. Conversely, vegetation coverage (R = 0.74) shows a strong correlation at the basin scale, but its ecological effect may decrease as the spatial scale shrinks. Future research should leverage remote sensing grid data and hydrologic response units, conduct multi-scale meta-analyses to quantify how effect sizes vary across spatial scales, and develop tailored indicator sets for different river segments, thereby constructing multi-scale evaluation frameworks that link indicators across spatial hierarchies.

4.3.3. Dynamic Evaluation Framework

Current evaluation indicators are essentially static, capturing the state at a single point in time. Yet the “Three-waters” system exhibits distinct temporal characteristics and stage-dependent evolutionary patterns. Static evaluation cannot distinguish whether a system is improving or degrading, nor can it attribute observed conditions to specific policy interventions. The effect sizes obtained in this study can serve as initial weights for dynamic evaluation. However, transitioning to a dynamic framework requires integrating time-series data, trend analysis, and predictive modeling [86]. Emerging capabilities such as remote sensing time series, machine learning, and system dynamics modeling offer tools to address this limitation. Future research should prioritize the development of dynamic evaluation methods capable of tracking system evolution and supporting adaptive management [87].

5. Conclusions

This study aimed to overcome limitations of indicator overlap, incomplete coverage, and limited representativeness in the “Three-waters” evaluation indicator system by proposing a methodology for constructing an indicator system that integrates meta-analysis-based quantitative screening with case validation. The study systematically quantified 60 high-quality publications from the WoS between 1970 and 2024. Through frequency statistics, correlation-based deduplication, effect size validation, and integration with global water management standards, a comprehensive “Three-waters” evaluation indicator system was ultimately constructed. This system encompassed four major systems (“Three-waters” and social economic systems), 11 criteria, and 45 core indicators. The rationality of the indicator system was subsequently validated through practical case studies.
Within the water resources system, the effective irrigation area ratio (R = 0.61) exhibited a moderate positive correlation, while the proportion of industrial water use (R = −0.77) showed a strong negative correlation. In the water environment system, the water quality standards (R = 0.82) demonstrated a strong positive correlation, whereas total hardness (R = −0.91) exhibited the most significant negative effect. All indicators within the water ecology system displayed positive correlations, with the benthic macroinvertebrate diversity index (R = 0.90) showing the strongest positive effect. Within the socio-economic system, vegetation coverage (R = 0.74) exhibited a strong positive correlation, while population density (R = −0.25) showed a weak negative correlation. Furthermore, case validation results were consistent with the conclusions of the original studies, confirming the rationality of this framework.
Examining the key characteristics of each system reveals specific management priorities. For the water resources system, the focus should be on securing supply, enhancing use efficiency, and optimizing allocation structure, primarily by controlling groundwater extraction and agrochemical application intensity while rationally adjusting industrial and agricultural water shares. The water environment system necessitates prioritized management of key pollutants such as total nitrogen, total phosphorus, and ammonia nitrogen, coupled with improved wastewater treatment rates and water quality compliance, while maintaining adequate dissolved oxygen levels. The water ecology system requires enhanced protection of biodiversity, and guaranteed ecological base flows and environmental water allocations. For the social economic system, strategies should aim to increase vegetation coverage, promote green economic development, such as channeling GDP per capita growth into environmental protection, and mitigate potential pressures from population density and urbanization.
This study made two primary contributions: (1) Methodologically, the study introduces meta-analysis into the systematic construction and integration of the “Three-waters” evaluation indicator system. By providing quantitative evidence, it reduces subjective bias and offers an objective basis for indicator selection. (2) Theoretically, it proposes a comprehensive indicator system framework, reveals the differential applicability of various evaluation indicators, identifies key impact indicators, and provides a reference for constructing related evaluation systems, thereby offering scientific support for the coordinated management of the “Three-waters” system.

Supplementary Materials

The following supporting information can be downloaded at: https://www.mdpi.com/article/10.3390/w18080928/s1, Table S1: Raw data for the Shitoukoumen reservoir; Table S2: Normalized values for all indicators; Table S3: |R| values and normalized weights ωj; Table S4: Water environment scores for Shitoukoumen Reservoir sites; Table S5: Raw data for Lake Tai; Table S6: Normalized values for all indicators; Table S7: |R| values and normalized weights ωj; Table S8: Water environment scores for Lake Tai sites.

Author Contributions

Conceptualization, J.X. and J.D.; methodology, J.X.; validation, J.X., X.W. and S.W.; formal analysis, J.X.; writing—original draft preparation, J.X.; writing—review and editing, J.X. and J.D.; supervision, S.W. All authors have read and agreed to the published version of the manuscript.

Funding

This study is funded by Science and Technology Project of Jiangxi Provincial Department of Water Resources of China (202527ZDKT24); Science and Technology Project of Jiangxi Provincial Department of Water Resources of China (202527ZDKT23); and Postgraduate Thesis Fund of Nanjing Hydraulic Research Institute (Yy124001).

Data Availability Statement

The original contributions presented in this study are included in the article. Further inquiries can be directed to the corresponding author.

Conflicts of Interest

The authors declare no conflicts of interest.

References

  1. Baste, I.A.; Watson, R.T. Tackling the Climate, Biodiversity and Pollution Emergencies by Making Peace with Nature 50 Years After the Stockholm Conference. Glob. Environ. Change 2022, 73, 102466. [Google Scholar] [CrossRef]
  2. Yang, N.; Zhang, L.; Yu, H.; Gao, J.; Zhang, H.; Xu, Y.; Wan, X. Quantifying the Impact of Climate Change and Human Activities on Multiobjective Water Resource Management in the Hanjiang River Basin, China. J. Water Resour. Plan. Manag. 2025, 151, 5025001. [Google Scholar] [CrossRef]
  3. Schilling, J.; Hertig, E.; Tramblay, Y.; Scheffran, J. Climate Change Vulnerability, Water Resources and Social Implications in North Africa. Reg. Environ. Change 2020, 20, 15. [Google Scholar] [CrossRef]
  4. Mengistu, T.D.; Chang, S.W.; Chung, I. Modeling and Prediction of Climate Change Impacts on Water Resources Vulnerability: A Multi-Model Approach. J. Environ. Manag. 2025, 388, 126025. [Google Scholar] [CrossRef]
  5. Shibao, L.; Xiao, B.; Wei, L.; Ning, W. Impacts of Climate Change on Water Resources and Grain Production. Technol. Forecast. Soc. Change 2019, 143, 76–84. [Google Scholar]
  6. Bashabsheh, A.Q.; Alzboon, K.K. Impact of Climate Change on Water Resources in the Yarmouk River Basin of Jordan. J. Arid Land 2024, 16, 1633–1647. [Google Scholar] [CrossRef]
  7. Ward, A.S.; Wade, J.; Kelleher, C.; Schewe, R.L. Clarify Jurisdiction of US Clean Water Act. Science 2023, 379, 148. [Google Scholar] [CrossRef]
  8. Solaun, O.; Borja, Á.; González, M.; Fontán, A. Assessing the Hydromorphological Status of Transitional and Coastal Water Bodies in the Basque Country, Under the European Water Framework Directive. Ecol. Indic. 2025, 173, 113404. [Google Scholar] [CrossRef]
  9. Tao, M.; Zhao, Y.; Jiang, Q.; Wang, Z.; Li, B. Study on the Coupled Coordination of Water Resources Consumption and Economic Development in Heilongjiang Province Under Different Scenarios Based on SD Model. Agric. Water Manag. 2025, 315, 109560. [Google Scholar] [CrossRef]
  10. Zhang, Y.; Khan, S.U.; Swallow, B.; Liu, W.; Zhao, M. Coupling Coordination Analysis of China’s Water Resources Utilization Efficiency and Economic Development Level. J. Clean. Prod. 2022, 373, 133874. [Google Scholar] [CrossRef]
  11. Li, J.; Shen, Z.; Liu, G.; Jin, Z.; Liu, R. The Effect of Social Economy-Water Resources-Water Environment Coupling System on Water Consumption and Pollution Emission Based on Input-Output Analysis in Changchun City, China. J. Clean. Prod. 2023, 423, 138719. [Google Scholar] [CrossRef]
  12. Luo, Z.; Zuo, Q. Evaluating the Coordinated Development of Social Economy, Water, and Ecology in a Heavily Disturbed Basin Based on the Distributed Hydrology Model and the Harmony Theory. J. Hydrol. 2019, 574, 226–241. [Google Scholar] [CrossRef]
  13. He, L.; Du, X.; Zhao, J.; Chen, H. Exploring the Coupling Coordination Relationship of Water Resources, Socio-Economy and Eco-Environment in China. Sci. Total Environ. 2024, 918, 15. [Google Scholar] [CrossRef]
  14. Huiling, L.U.; Lihua, Z.; Yong, C.; Yiwei, A.N.; Caixia, H. Degree of Coupling and Coordination of Eco-Economic System and the Influencing Factors: A Case Study in Yanchi County, Ningxia Hui Autonomous Region, China. J. Arid Land 2017, 9, 446–457. [Google Scholar]
  15. Tao, J.; Xie, Y.; Zhou, H.; Xu, Y.; Zhao, G. Cross-County Characteristics of Water–Ecology–Economy Coupling Coordination in the Wuding River Watershed, China. Land 2022, 11, 2283. [Google Scholar] [CrossRef]
  16. Wang, S.; Yang, J.; Wang, A.; Yan, Y.; Li, T. Coupled Coordination of Water Resources–Economy–Ecosystem Complex in the Henan Section of the Yellow River Basin. Water Supply 2022, 22, 8835–8848. [Google Scholar] [CrossRef]
  17. Zhou, R.; Jin, J.; Wu, C.; Zhou, L.; Zhang, L.; Cui, Y.; Zhang, Y.; Zhou, Y. Connection Number Based Model for Coordination Development Evaluation of Regional Water Resources, Social Economy and Ecological Environment Complex System. J. Environ. Manag. 2023, 339, 117913. [Google Scholar] [CrossRef]
  18. Zhang, J.; Zhang, C.; Shi, W.; Fu, Y. Quantitative Evaluation and Optimized Utilization of Water Resources-Water Environment Carrying Capacity Based on Nature-Based Solutions. J. Hydrol. 2019, 568, 96–107. [Google Scholar] [CrossRef]
  19. Yongo, E.; Mutethya, E.; Zhang, P.; Lek, S.; Fu, Q.; Guo, Z. Comparing the Performance of the Water Quality Index and Phytoplankton Index of Biotic Integrity in Assessing the Ecological Status of Three Urban Rivers in Haikou City, China. Ecol. Indic. 2023, 157, 111286. [Google Scholar] [CrossRef]
  20. Zhang, K.Z.K.; Shen, J.S.J.; Han, H.H.H.; Jia, Y.J.Y. Urban River Health Analysis of the Jialu River in Zhengzhou City Using the Improved Fuzzy Matter-Element Extension Model. Water 2019, 11, 1190. [Google Scholar] [CrossRef]
  21. Grzywna, A.; Grabić, J.; Różańska-Boczula, M. Occurrences of Water Quality Assessment Using Improvised Water Quality Index at the Danube River, Serbia. Desalin. Water Treat. 2023, 285, 67–77. [Google Scholar] [CrossRef]
  22. Ren, Y.; Zhang, F.; Li, J.; Zhao, C.; Jiang, Q.; Cheng, Z. Ecosystem Health Assessment Based On AHP-DPSR Model and Impacts of Climate Change and Human Disturbances: A Case Study of Liaohe River Basin in Jilin Province, China. Ecol. Indic. 2022, 142, 109171. [Google Scholar] [CrossRef]
  23. Xu, H.; Cao, L.; Wang, L.; Zheng, X. Development of a New Water Ecological Health Assessment Method for Small River in Shanghai, China. J. Water Clim. Change 2021, 12, 1123–1134. [Google Scholar] [CrossRef]
  24. Wang, Z.; Li, X.; Li, Y.; Liu, H.; Lin, C.; Sun, J.; Wang, Q. Unveiling the Occurrence and Ecological Risks of Triclosan in Surface Water through Meta-Analysis. Environ. Pollut. 2024, 361, 124901. [Google Scholar] [CrossRef] [PubMed]
  25. Vasseghian, Y.; Rad, S.S.; Vilas-Boas, J.A.; Khataee, A. A Global Systematic Review, Meta-Analysis, and Risk Assessment of the Concentration of Vanadium in Drinking Water Resources. Chemosphere 2021, 267, 128904. [Google Scholar] [CrossRef]
  26. Eric, J.; Lehrer, M.W.Y.S. An Introduction to Meta-Analysis. Int. J. Radiat. Oncol. Biol. Phys. 2023, 115, 564–571. [Google Scholar]
  27. Moher, D.; Liberati, A.; Tetzlaff, J.; Altman, D.G. Preferred Reporting Items for Systematic Reviews and Meta-Analyses: The PRISMA Statement. Int. J. Surg. 2010, 8, 336–341. [Google Scholar] [CrossRef]
  28. Li, Z.; Yang, T.; Huang, C.; Xu, C.; Shao, Q.; Shi, P.; Wang, X.; Cui, T. An Improved Approach for Water Quality Evaluation: TOPSIS-Based Informative Weighting and Ranking (TIWR) Approach. Ecol. Indic. 2018, 89, 356–364. [Google Scholar] [CrossRef]
  29. Ren, B.; Zhang, Q.; Ren, J.; Ye, S.; Yan, F. A Novel Hybrid Approach for Water Resources Carrying Capacity Assessment by Integrating Fuzzy Comprehensive Evaluation and Analytical Hierarchy Process Methods with the Cloud Model. Water 2020, 12, 3241. [Google Scholar] [CrossRef]
  30. Hu, A.; Li, Q. A Pressure-State-Response-Support Framework for Assessing Regional Water Environmental Carrying Status. Front. Environ. Sci. 2022, 10, 1023180. [Google Scholar] [CrossRef]
  31. Pan, G.; Xu, Y.; Yu, Z.; Song, S.; Zhang, Y. Analysis of River Health Variation Under the Background of Urbanization Based on Entropy Weight and Matter-Element Model: A Case Study in Huzhou City in the Yangtze River Delta, China. Environ. Res. 2015, 139, 31–35. [Google Scholar] [CrossRef]
  32. Guo, Y.; Ma, X.; Zhang, H. Assessment of Water Resources Carrying Capacity of Yangtze River Basin and its Driving Factors. Pol. J. Environ. Stud. 2023, 32, 5083–5094. [Google Scholar] [CrossRef]
  33. You, D.; Fan, Y.; Zheng, B. Basin Water Environmental Safety Assessment Based on Fuzzy Comprehensive Evaluation Method: A Case Study. Desalin. Water Treat. 2018, 121, 316–322. [Google Scholar] [CrossRef]
  34. Qi, Q.; Wang, Z.; Yin, H.; Zhang, Z.; Wang, F. Construction and Application of a Seasonal River Health Evaluation System in Arid and Semi-Arid Areas. Water 2024, 16, 691. [Google Scholar] [CrossRef]
  35. Yan, L.; Jiao, D.; Yongshi, Z. Evaluation of Regional Water Resources Carrying Capacity in China Based on Variable Weight Model and Grey-Markov Model: A Case Study of Anhui Province. Sci. Rep. 2023, 1, 13490. [Google Scholar] [CrossRef]
  36. Wang, Y.; Li, M.; Zhao, J.; Yang, J. Evaluation of River Health and Human Well-Being in the Heihe River Basin Using the SMI-P Method: A Case Study of the Zhangye City. Water 2024, 16, 2701. [Google Scholar] [CrossRef]
  37. Wu, F.; Zhuang, Z.; Liu, H.; Shiau, Y. Evaluation of Water Resources Carrying Capacity Using Principal Component Analysis: An Empirical Study in Huai’an, Jiangsu, China. Water 2021, 13, 2587. [Google Scholar] [CrossRef]
  38. Wang, T.; Jian, S.; Wang, J.; Yan, D. Research on Water Resources Carrying Capacity Evaluation Based on Innovative RCC Method. Ecol. Indic. 2022, 139, 108876. [Google Scholar] [CrossRef]
  39. Nuong, B.T.; Darby, S.; Chung, N.T.; Du Duong, B.; Trang, V.Q. Water Resources Sustainability Assessment in the Vietnamese Srepok River Basin. Water Environ. J. 2024, 38, 234–246. [Google Scholar] [CrossRef]
  40. Kumar, A.; Matta, G.; Bhatnagar, S. A Coherent Approach of Water Quality Indices and Multivariate Statistical Models to Estimate the Water Quality and Pollution Source Apportionment of River Ganga System in Himalayan Region, Uttarakhand, India. Environ. Sci. Pollut. Res. 2021, 28, 42837–42852. [Google Scholar] [CrossRef]
  41. An, K.; Park, S.S.; Shin, J. An Evaluation of a River Health Using the Index of Biological Integrity Along with Relations to Chemical and Habitat Conditions. Environ. Int. 2002, 28, 411–420. [Google Scholar] [CrossRef]
  42. Said, A.; Stevens, D.K.; Sehlke, G. An Innovative Index for Evaluating Water Quality in Streams. Environ. Manag. 2004, 34, 406–414. [Google Scholar] [CrossRef]
  43. Sun, W.; Xia, C.; Xu, M.; Guo, J.; Sun, G. Application of Modified Water Quality Indices as Indicators to Assess the Spatial and Temporal Trends of Water Quality in the Dongjiang River. Ecol. Indic. 2016, 66, 306–312. [Google Scholar] [CrossRef]
  44. Shafi, M.; Prakash, C.; Gani, K.M. Application of Remodeled Water Quality Indices for the Appraisal of Water Quality in a Himalayan Lake. Environ. Monit. Assess. 2022, 194, 576. [Google Scholar] [CrossRef]
  45. Chen, J.; Wang, Y.; Li, F.; Liu, Z. Aquatic Ecosystem Health Assessment of a Typical Sub-Basin of the Liao River Based on Entropy Weights and a Fuzzy Comprehensive Evaluation Method. Sci. Rep. 2019, 1, 14045. [Google Scholar] [CrossRef] [PubMed]
  46. Wu, Z.; Wang, X.; Chen, Y.; Cai, Y.; Deng, J. Assessing River Water Quality Using Water Quality Index in Lake Taihu Basin, China. Sci. Total Environ. 2018, 612, 914–922. [Google Scholar] [CrossRef] [PubMed]
  47. Su, Y.; Li, W.; Liu, L.; Li, J.; Sun, X.; Hu, W. Assessment of Medium and Small River Health Based on Macroinvertebrates Habitat Suitability Curves: A Case Study in a Tributary of Yangtze River, China. Water Policy 2020, 22, 602–621. [Google Scholar] [CrossRef]
  48. Zhao, Y.C.; Zhang, S.L.; Chen, J.L.; Huang, X.; Huang, Y.F.; Kong, F.Q. Assessment of River Health in the Haihe River Basin Based on Water Quality, Aquatic Life, and Physical Habitat. Appl. Ecol. Environ. Res. 2023, 22, 539–554. [Google Scholar] [CrossRef]
  49. Sinha, K.; Das, P. Assessment of Water Quality Index Using Cluster Analysis and Artificial Neural Network Modeling: A Case Study of the Hooghly River Basin, West Bengal, India. Desalin. Water Treat. 2015, 54, 28–36. [Google Scholar] [CrossRef]
  50. Sharifinia, M.; Mahmoudifard, A.; Gholami, K.; Namin, J.; Ramezanpour, Z. Benthic Diatom and Macroinvertebrate Assemblages, a Key for Evaluation of River Health and Pollution in the Shahrood River, Iran. Limnology 2016, 17, 95–109. [Google Scholar] [CrossRef]
  51. Ye, H.; Chen, L.; Zou, K.; Wu, W.; Dan, R.; Wang, Y. Coupling Monte Carlo Simulation with CRITIC-Enhanced Water Quality Assessment for the Weishui Reservoir. Water Supply 2024, 24, 601–614. [Google Scholar] [CrossRef]
  52. Arpine, H.; Gayane, S. Determination of Background Concentrations of Hydrochemical Parameters and Water Quality Assessment in the Akhuryan River Basin (Armenia). Phys. Chem. Earth 2016, 94, 2–9. [Google Scholar] [CrossRef]
  53. Zalenska, Y.A.; Kopilevych, V.A. Environmental Assessment of Surface Water Quality in the Umanka River Basin. J. Water Chem. Technol. 2023, 45, 496–502. [Google Scholar] [CrossRef]
  54. Huang, R.; Han, L.; Zhang, H.; Pan, M.; Peng, H. Evaluation and Analysis of Water Quality at the Dahuofang Reservoir Based on the Fuzzy Evaluation and Analytical Hierarchy Process. Appl. Mech. Mater. 2013, 316–317, 748. [Google Scholar]
  55. Ubuoh, E.A.; Nwogu, F.U.; Ossai-Abeh, E.Q.; Ikwuemesi, J.C.; Oke, A.O.; Umoh, J.D. Evaluation of Hydro-Chemical Facies and Surface Water Quality Dynamics Using Multivariate Statistical Approaches in Southern Nigeria. Sci. Rep. 2024, 14, 31600. [Google Scholar] [CrossRef]
  56. Takić, L.; Mladenović-Ranisavljević, I.; Vuković, M.; Mladenović, I. Evaluation of the Ecochemical Status of the Danube in Serbia in Terms of Water Quality Parameters. Sci. World J. 2012, 2012, 930737. [Google Scholar] [CrossRef]
  57. Benvenuti, T.; Kieling-Rubio, M.; Klauck, C.; Rodrigues, M. Evaluation of Water Quality at the Source of Streams of the Sinos River Basin, Southern Brazil. Braz. J. Biol. 2015, 75, S98–S104. [Google Scholar] [CrossRef]
  58. Gupta, A.N.; Kumar, D.; Singh, A. Evaluation of Water Quality Based on a Machine Learning Algorithm and Water Quality Index for Mid Gangetic Region (South Bihar Plain), India. J. Geol. Soc. India 2021, 97, 1063–1072. [Google Scholar] [CrossRef]
  59. Ma, L.; Abuduwaili, J.; Li, Y.; Abdyzhapar Uulu, S.; Mu, S. Hydrochemical Characteristics and Water Quality Assessment for the Upper Reaches of Syr Darya River in Aral Sea Basin, Central Asia. Water 2019, 11, 1893. [Google Scholar] [CrossRef]
  60. Gupta, S.; Nayek, S.; Chakraborty, D. Hydrochemical Evaluation of Rangit River, Sikkim, India: Using Water Quality Index and Multivariate Statistics. Environ. Earth Sci. 2016, 75, 567. [Google Scholar] [CrossRef]
  61. Angela, C.; Javier, C.; Teresa, G.; Marisa, M. Hydrological Evaluation of a Peri-Urban Stream and its Impact on Ecosystem Services Potential. Glob. Ecol. Conserv. 2015, 3, 628–644. [Google Scholar] [CrossRef]
  62. Kim, J.Y.; An, K. Integrated Ecological River Health Assessments, Based on Water Chemistry, Physical Habitat Quality and Biological Integrity. Water 2015, 7, 6378–6403. [Google Scholar] [CrossRef]
  63. Gad, M.; El-Safa, M.M.A.; Farouk, M.; Hussein, H.; Alnemari, A.M.; Elsayed, S.; Khalifa, M.M.; Moghanm, F.S.; Eid, E.M.; Saleh, A.H. Integration of Water Quality Indices and Multivariate Modeling for Assessing Surface Water Quality in Qaroun Lake, Egypt. Water 2021, 13, 2258. [Google Scholar] [CrossRef]
  64. Radu, E.; Ionescu, P.; György, D.; Ivanov, A.; Diacu, E. Multivariate Statistical Analysis for Quality Assesment of Aquatic Ecosystem on the Lower Danube. J. Environ. Prot. Ecol. 2014, 15, 412–424. [Google Scholar]
  65. Das, A. Multivariate Statistical Approach for the Assessment of Water Quality of Mahanadi Basin, Odisha. Mater. Today Proc. 2022, 65, A1–A11. [Google Scholar] [CrossRef]
  66. Rodriguez-Nuñez, E.; Hernandez-Mendoza, C.; Perez-Moreno, V.; Cardenas, A. Pollution Evaluation of the El Pueblito River in Queretaro, Mexico, Using the Water Quality Index. Water 2022, 14, 3040. [Google Scholar] [CrossRef]
  67. Varadinova, E.D.; Fikova, R.P. Representativeness of Monitoring Sites for Ecological Status Evaluation of Water Bodies: Case Study of Chetirka (Logodashka) River and its Tributaries, SW Bulgaria. Acta Zool. Bulg. 2021, 73, 557–563. [Google Scholar]
  68. Munyika, S.; Kongo, V.; Kimwaga, R. River Health Assessment Using Macroinvertebrates and Water Quality Parameters: A Case of the Orange River in Namibia. Phys. Chem. Earth 2014, 76–78, 140–148. [Google Scholar] [CrossRef]
  69. Atique, U.; An, K. Stream Health Evaluation Using a Combined Approach of Multi-Metric Chemical Pollution and Biological Integrity Models. Water 2018, 10, 661. [Google Scholar] [CrossRef]
  70. Lin, T.; Yu, H.; Wang, Q.; Hu, L.; Yin, J. Surface Water Quality Assessment Based on the Integrated Water Quality Index in the Maozhou River Basin, Guangdong, China. Environ. Earth Sci. 2021, 80, 361–368. [Google Scholar] [CrossRef]
  71. Muhammad, A.; Shangguan, D.; Rasool, G.; Khan, A.A.; Butt, A.Q.; Hussain, A.; Mukhtar, M.A. A Localized Evaluation of Surface Water Quality Using GIS-Based Water Quality Index Along Satpara Watershed Skardu Baltistan, Pakistan. ISPRS Int. J. Geo-Inf. 2024, 13, 393. [Google Scholar] [CrossRef]
  72. Zhang, J.; Xiang, J.; Ma, Q.; Li, C.; Xu, X. Water Ecological Health Evaluation of Urban River: A Case Study of Zaogang River, China. Front. Ecol. Evol. 2024, 12, 1478024. [Google Scholar] [CrossRef]
  73. Su, K.; Wang, Q.; Li, L.; Cao, R.; Xi, Y.; Li, G. Water Quality Assessment Based on Nemerow Pollution Index Method: A Case Study of Heilongtan Reservoir in Central Sichuan Province, China. PLoS ONE 2022, 17, e0273305. [Google Scholar] [CrossRef]
  74. Fernando Gudino-Sosa, L.; Escalera-Gallardo, C.; Cruz-Cardenas, G.; Moncayo-Estrada, R.; Teodoro Silva-Garcia, J.; Flores-Magallon, R.; Damian-Arroyo, M.; Antonio Chavez-Tinoco, M. Water Quality Assessment in a Subtropical River and Tributaries Combining Physicochemical and Aquatic Macroinvertebrates. Hidrobiologica 2022, 32, 33–50. [Google Scholar] [CrossRef]
  75. Su, K.; Wang, Q.; Li, L.; Cao, R.; Xi, Y. Water Quality Assessment of Lugu Lake Based on Nemerow Pollution Index Method. Sci. Rep. 2022, 12, 13613. [Google Scholar] [CrossRef] [PubMed]
  76. Huang, X.; Sillanpaa, M.; Gjessing, E.T.; Peraniemi, S.; Vogt, R.D. Water Quality in the Southern Tibetan Plateau: Chemical Evaluation of the Yarlung Tsangpo (Brahmaputra). River Res. Appl. 2011, 27, 113–121. [Google Scholar] [CrossRef]
  77. Zhang, Y.; Zhu, H.; Li, B.; Yang, G.; Wan, R. Aquatic Ecosystem Health Assessment of Poyang Lake through Extension Evaluation Method. Water 2021, 13, 211. [Google Scholar] [CrossRef]
  78. Murtaugh, P.A.; Pooler, P.S. Evaluating Ecological Indicators: Lakes in the Northeastern United States. Environ. Monit. Assess. 2006, 119, 83–96. [Google Scholar] [CrossRef]
  79. Chon, T.; Qu, X.; Cho, W.; Hwang, H.; Tang, H.; Liu, Y.; Choi, J.; Jung, M.; Chung, B.S.; Lee, H.Y.; et al. Evaluation of Stream Ecosystem Health and Species Association Based on Multi-Taxa (Benthic Macroinvertebrates, Algae, and Microorganisms) Patterning with Different Levels of Pollution. Ecol. Inform. 2013, 17, 58–72. [Google Scholar] [CrossRef]
  80. Harris, J.H.; Silveira, R. Large-Scale Assessments of River Health Using an Index of Biotic Integrity with Low-Diversity Fish Communities. Freshw. Biol. 1999, 41, 235–252. [Google Scholar] [CrossRef]
  81. Cejudo, E.; Acosta-González, G.; Alvarado-Flores, J.; Peniche-Pérez, J.C.; Bautista-García, J.E.; Leal-Bautista, R.M.; Ortega-Camacho, D.; Rosiles-González, G.; Caballero-Vázquez, J.A.; Hernández-Zepeda, C. The Condition Status Index for Doline Lakes in Urban Areas. Sci. Rep. 2024, 14, 26815. [Google Scholar] [CrossRef]
  82. GB 3838-2002; Environmental Quality Standards for Surface Water. China Environmental Science Press: Beijing, China, 2002.
  83. Lazarus Katlego Mogane, T.M.T.A. A Comprehensive Review of Water Quality Indices for Lotic and Lentic Ecosystems. Environ. Monit. Assess. 2023, 195, 926. [Google Scholar] [CrossRef] [PubMed]
  84. Yang, Y.; Noble, D.W.A.; Spake, R.; Senior, A.M.; Lagisz, M.; Nakagawa, S. A Pluralistic Framework for Measuring, Interpreting and Decomposing Heterogeneity in Meta-Analysis. Methods Ecol. Evol. 2025, 16, 2710–2725. [Google Scholar] [CrossRef]
  85. Namavar, M.; Moghaddam, M.R.A.; Shafiei, M. Developing an Indicator-Based Assessment Framework for Assessing the Sustainability of Urban Water Management. Sustain. Prod. Consump. 2023, 40, 1–12. [Google Scholar] [CrossRef]
  86. Wu, C.; Nie, B.; Wang, X.; Jin, J.; Zhou, Y.; Bai, X.; Cui, Y.; Zhou, L.; Zhang, L. Set Pair Analysis and System Dynamics Coupling Approach for Structure Simulation and Variation Trend Evaluation of Water Resources Spatial Equilibrium System. J. Am. Water Resour. Assoc. 2025, 61, e13237. [Google Scholar] [CrossRef]
  87. Zhu, M.; Wang, J.; Yang, X. A Review of the Application of Machine Learning in Water Quality Evaluation. Eco-Environ. Health 2022, 1, 107–116. [Google Scholar] [CrossRef] [PubMed]
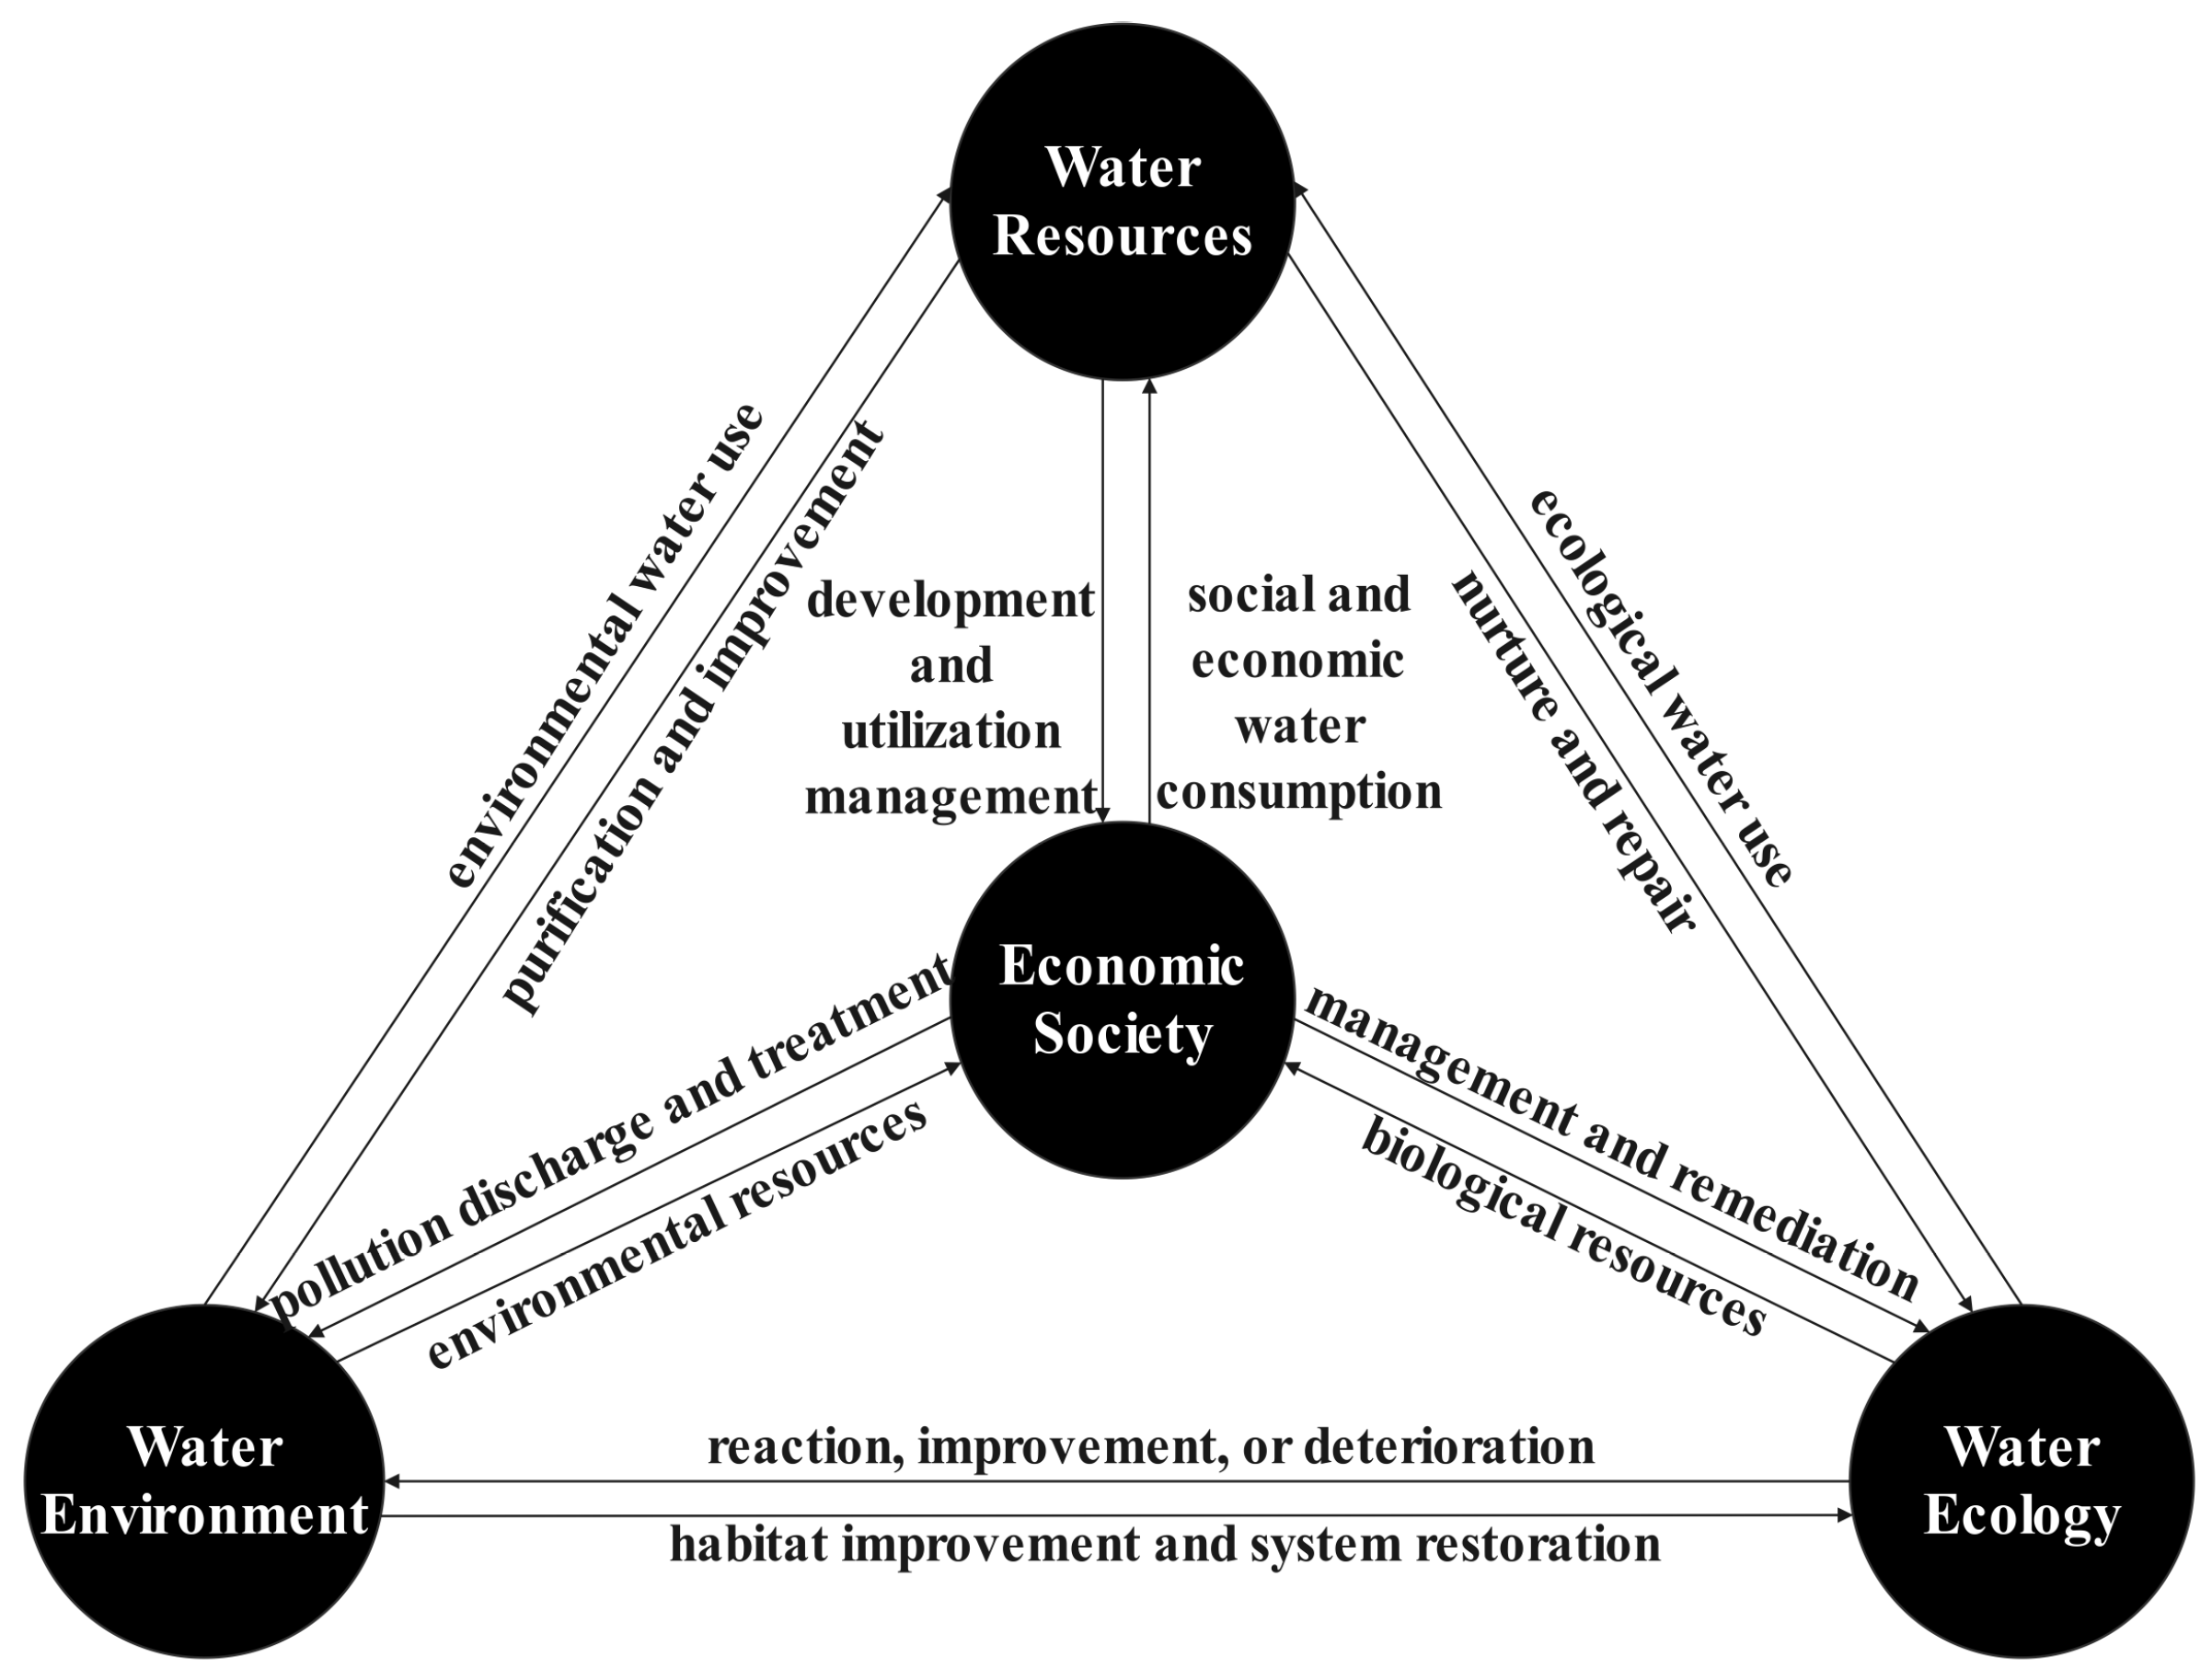
Figure 1. Interaction relationship diagram of the “Three-waters” system.
Water 18 00928 g001
Figure 2. Screening process of publications about “Three-waters” system (adapted from PRISMA guidelines).
Water 18 00928 g002
Figure 3. Indicator word cloud of “Three-waters” system.
Water 18 00928 g003
Figure 4. Effect sizes of water resources indicators [16,18,29,30,31,32,33,34,35,36,37,38,39,40]. (The red square represents the effect size Fisher’s Z of this study, and its size represents the weight of each study. The larger the weight, the larger the square area. The length of the black lines at both ends of the block represents the 95% confidence interval of each effect variable. The black diamond represents the summary effect size and confidence interval, with the area being the total sample size).
Water 18 00928 g004
Figure 5. Effect sizes of water environment indicators [16,18,28,29,30,31,32,33,35,36,38,40,41,42,43,44,45,46,47,48,49,50,51,52,53,54,55,56,57,58,59,60,61,62,63,64,65,66,67,68,69,70,71,72,73,74,75,76]. (Legends refer to Figure 4).
Water 18 00928 g005aWater 18 00928 g005b
Figure 6. Effect sizes of water ecology indicators [16,18,29,32,34,37,48,50,62,63,77,78,79,80,81]. (Legends refer to Figure 4).
Water 18 00928 g006
Figure 7. Effect sizes of social economic indicators [16,18,29,30,32,33,34,35,36,37,38,41,45,72]. (Legends refer to Figure 4).
Water 18 00928 g007
Table 1. Classification of keywords (Boolean logical operator connection).
CategoryKeywords
Meta-analysisMeta-analysis OR System evaluation OR Indicator evaluation
“Three-waters” systemWater resources OR Water environment OR Water Ecology OR Water Resources–Water Environment–Water Ecology
SubjectRiver OR Lake OR Basin
Table 2. Construction of the “Three-waters” evaluation indicator system.
SystemCriteriaIndicator
Water resources system (A)Water resources availability (A1)Precipitation (A11)
Total water resources (A12)
Evaporation (A13)
Per capita water resources (A14)
Water resources development and utilization (A2)Utilization ratio of water resources (A21)
Groundwater extraction rate (A22)
Fertilizer application intensity (A23)
Water use efficiency (A3)Water consumption per unit of GDP (A31)
Per capita water consumption (A32)
Effective irrigation area ratio (A33)
Irrigation water consumption per unit area (A34)
Water use structure (A4)Industrial water use proportion (A41)
Agricultural water use proportion (A42)
Domestic water use proportion (A43)
Water environment system (B)Physicochemical properties (B1)pH (B11)
Dissolved oxygen (B12)
Total nitrogen (B13)
Total phosphorus (B14)
Chemical oxygen demand (B15)
Biochemical oxygen demand (B16)
Ammonia nitrogen (B17)
Turbidity (B18)
Chlorophyll a (B19)
Total coliforms (B110)
Conductivity (B111)
Temperature (B112)
Total hardness (B113)
Pollutant discharge (B2)Wastewater discharge (B21)
Chemical oxygen demand discharge (B22)
Ammonia nitrogen discharge (B23)
Water environment management (B3)Wastewater treatment ratio (B31)
Water quality standards (B32)
Water ecology system (C)Biodiversity (C1)Benthic diversity index (C11)
Phytoplankton diversity index (C12)
Zooplankton diversity index (C13)
Fish diversity index (C14)
Algal diversity index (C15)
Ecological hydrology (C2)Ecological environmental water use rate (C21)
Ecological flow assurance rate (C22)
Social economic system (D)Society (D1)Population density (D11)
Urbanization rate (D12)
Vegetation coverage (D13)
Land use type (D14)
Economy (D2)Gross domestic product (GDP) per capita (D21)
GDP growth rate (D22)
Table 3. Water environment scores for monitoring sections in Shitoukoumen Reservoir.
SiteW1W2W3W4
S k 88.411.971.089.7
Table 4. Average water environment scores for different regions of Lake Tai (2011–2013).
S k Area 1Area 2Area 3
201185.990.574.2
201275.981.572.3
201378.681.471.2
Disclaimer/Publisher’s Note: The statements, opinions and data contained in all publications are solely those of the individual author(s) and contributor(s) and not of MDPI and/or the editor(s). MDPI and/or the editor(s) disclaim responsibility for any injury to people or property resulting from any ideas, methods, instructions or products referred to in the content.