


Abstract
Sustainable development of regional water resources requires objective classification of lake systems according to dominant hydrochemical processes. The aim of the study was to develop a data-driven hydrochemical typology of natural lakes in Polissya based on the Self-Organizing Map (SOM) method to identify functionally distinct water quality regimes and justify management decisions within the basin approach. The study covered nine lakes of different genesis and trophic status. Key water quality indicators were analyzed: total nitrogen (TN), biochemical and chemical oxygen demand (BOD5, COD), suspended solids (TSS), iron (Fe), and total dissolved solids (TDS). Descriptive statistics, correlation analysis, and neural network SOM modeling with subsequent clustering were applied. The results revealed strong positive correlations between TN, BOD5, COD, and TSS, indicating joint control by biogenic and organic processes, while TDS showed negative correlations with organic indicators, reflecting mineralization control. SOM classification allowed us to identify three hydrochemical clusters: background systems with low anthropogenic load; organically enriched lakes with intense biogeochemical cycling; and mineralization-controlled water bodies dominated by geogenic factors. It has been established that spatial features of land use and morphometric characteristics (depth, type of feeding, hydrological connectivity) determine the sensitivity of lakes to external loads and their location.
1. Introduction
Freshwater lakes are important components of regional hydrological systems and play a key role in maintaining ecological balance and supporting biodiversity [1]. In addition to their ecological functions, lakes provide numerous ecosystem services, including water supply, recreation, and regulation of biogeochemical cycles [2]. However, lake ecosystems are highly sensitive to both natural environmental variability and anthropogenic pressures originating from their catchments [3]. Changes in land use, agricultural intensification, urban expansion, and hydrological modifications may significantly influence the chemical composition of lake waters by altering nutrient fluxes, organic matter inputs, and mineral content [4].
The hydrochemical characteristics of lakes are controlled by a complex interaction of geological, hydrological, and landscape factors. In many regions, the composition of surrounding land cover represents one of the most important determinants of water quality. Forested catchments typically function as natural buffers that limit nutrient transport and stabilize hydrological regimes [5,6]. In contrast, agricultural areas may contribute substantial amounts of nitrogen compounds and suspended particles due to fertilizer application and soil erosion [7]. The lakes of the Polissya region in Eastern Europe represent a heterogeneous group of freshwater systems formed under diverse geological and geomorphological conditions. Glacial, karst, floodplain, and peat-bog lakes occur within relatively small spatial scales, resulting in significant variability in morphometry, hydrological connectivity, and trophic status. These differences contribute to the formation of distinct hydrochemical regimes and influence the sensitivity of lakes to external environmental pressures.
Traditional hydrochemical assessments often rely on the analysis of individual indicators such as total nitrogen (TN), biochemical oxygen demand (BOD5), chemical oxygen demand (COD), total suspended solids (TSS), total iron (Fe), and total dissolved solids (TDS). While these parameters provide valuable information on specific aspects of water quality, their interpretation is frequently complicated by the simultaneous influence of multiple interacting processes. The potential influence of different land-use types on hydrochemical indicators is summarized in Table 1. Although these relationships are widely recognized in environmental studies, their relative importance may vary depending on regional landscape structure, hydrological connectivity, and lake morphometry.
Table 1.
Potential influence of land-use types on hydrochemical indicators.
Nutrient enrichment, organic matter decomposition, mineral inputs from groundwater, and particulate transport may occur concurrently, creating complex hydrochemical patterns that are difficult to interpret using univariate approaches alone. Consequently, the identification of dominant processes controlling lake water quality increasingly requires the application of multivariate analytical techniques capable of integrating multiple indicators into a coherent classification framework. In recent years, machine-learning approaches have been increasingly applied in environmental sciences to explore complex hydrochemical datasets [8]. Among these methods, the Self-Organizing Map (SOM) algorithm has proven to be particularly useful for environmental data exploration and classification. SOM is an unsupervised neural network method that projects multidimensional datasets onto a low-dimensional lattice while preserving the topological relationships between observations [9]. This property makes the method well suited for detecting hidden structures and identifying groups of samples characterized by similar environmental conditions [10]. In hydrochemical studies, SOM has been successfully used to classify water bodies, reveal spatial patterns in water quality, and distinguish between natural geochemical processes and anthropogenic influences [11]. Despite the growing application of multivariate and machine-learning methods in water quality studies, the hydrochemical diversity of natural lakes in the Polissya region remains insufficiently systematized. Most available studies focus on individual lakes or specific indicators of water quality, while regional-scale classifications that integrate hydrochemical parameters with catchment characteristics are still limited [12,13,14]. As a result, the identification of dominant hydrochemical regimes and their controlling factors remains incomplete, which complicates the development of basin-oriented management approaches and targeted monitoring strategies.
Integrated Water Resources Management (IWRM) is a widely adopted concept in environmental governance that promotes the coordinated development and management of water, land, and related resources in order to maximize ecological sustainability, economic efficiency, and social equity. The IWRM approach emphasizes the integration of surface waters, groundwater, and catchment landscapes, while accounting for interactions among natural processes, human activities, and ecosystem services. In lake-dominated regions such as the Polissia lowlands, this framework is especially relevant because the hydrochemical condition of lakes is strongly determined by processes occurring within their surrounding catchments, including land-use practices, hydrological connectivity, and biogeochemical cycling.
The present study aims to develop a hydrochemical typology of natural lakes in the Polissya region based on multivariate analysis of key water quality indicators. A SOM approach was applied to classify lakes according to similarities in nutrient, organic matter, particulate, and mineralization characteristics. The specific objectives of the study were: (i) to evaluate the variability of selected hydrochemical parameters among representative lakes of different origin and trophic status; (ii) to identify dominant relationships between indicators of nutrient enrichment, organic matter dynamics, and mineralization; (iii) to apply SOM-based clustering for the classification of lake hydrochemical regimes; and (iv) to interpret the resulting typology in relation to catchment land use and limnological characteristics. The proposed classification is intended to support cleaner water management strategies and provide a scientific basis for regional water resource protection within the basin management framework.
2. Materials and Methods
2.1. Study Area and Limnological Characteristics of the Lakes
The study was conducted on nine representative freshwater lakes located within the Polissya region of north-western Ukraine (Figure 1). This region is characterized by a high density of natural lakes formed under diverse geological and geomorphological conditions, including glacial, karst, floodplain, and fluvioglacial processes [15].
Figure 1.
Geographical location of the studied lakes within the Polissia region (Western Ukraine).
These lakes represent an important component of the regional hydrological network and provide valuable habitats for aquatic ecosystems. Their hydrochemical characteristics are influenced by differences in morphometry, hydrological connectivity, and surrounding landscape structure. The spatial distribution of the investigated lakes and sampling sites: Domashnie (S1), Liubiaz (S2), Nobel (S3), Pisochne (S4), Svityaz (S5), Solynka (S6), Somyne (S7), Turske (S8), and Karasyn (S9) is presented in Figure 1. The studied water bodies are located within several major river basins of the region, including the Prypiat, Turia, and Western Bug catchments. Many of these lakes are situated within wetland-dominated landscapes typical for Polissya, where groundwater inflow, peat soils, and limited surface runoff significantly influence hydrological and hydrochemical conditions.
The main morphometric and limnological characteristics of the investigated lakes, including geographic coordinates, surface area, depth, trophic status, hydrological connectivity, and conservation priority, are summarized in Table 2. Morphological origin also varies among the studied lakes.
Table 2.
Morphometric and limnological characteristics of the studied lakes.
Several lakes of the Shatsk lake group, including Pisochne and Svityaz, are of karst origin and are primarily supplied by groundwater and atmospheric precipitation (Table 2). Floodplain lakes such as Liubiaz and Nobel are hydrologically connected to the Prypiat River and therefore experience periodic water exchange with the river system [16]. Other lakes, including Solynka, represent wet-land-associated basins receiving water mainly from peat-bog environments. These differences in geological origin and hydrological connectivity create contrasting hydrochemical regimes among the studied systems. Most lakes in the region experience seasonal ice cover during winter, reflecting the temperate continental climate of the area. Trophic conditions range from oligotrophic and oligo-mesotrophic systems, such as Svityaz and Pisochne, to eutrophic lakes including Liubiaz, Turske, and Karasyn. All studied lakes are located within a lowland region of similar elevation and climatic conditions, which supports the assumption of broadly comparable hydrological regimes.
2.2. Hydrochemical Sampling and Analysis
Hydrochemical sampling was conducted during an autumn field campaign (October 2025), under relatively stable post-stratification conditions and prior to ice formation. This period was selected to minimize short-term hydrological variability and to ensure comparability between sites. All studied lakes are located within a lowland region of similar elevation and climatic conditions, which supports the assumption of comparable hydrological regimes. To further improve spatial representativeness, each sampling site corresponds to a defined lake basin (catchment), as shown in Figure 1. The sampling locations (S1–S9) were selected to represent the central or most hydrologically integrated part of each lake, avoiding nearshore zones, inflows, and local disturbances. Sampling coordinates for each lake are provided in Table 2. At each site, a grab (spot) sample was collected from the upper water layer (approximately 0.3–0.5 m below the surface), which is consistent with standard procedures for surface water quality assessment in lakes. The selection of surface sampling was justified by the relatively shallow depth and weak or absent thermal stratification in most studied lakes during the sampling period. In accordance with [17], the sampling strategy considered the potential horizontal and vertical heterogeneity of lake water. For relatively small and morphometrically simple lakes, a single central sampling point is considered sufficient to characterize water quality, whereas more complex systems require multiple sampling locations. In this study, the selected points were assumed to adequately represent the general hydrochemical conditions of each lake. Water samples were collected using pre-cleaned polyethylene bottles. Prior to sampling, all containers were rinsed with lake water to avoid contamination. Sampling was performed under comparable meteorological conditions and within a consistent time window to reduce diurnal variability effects. The hydrochemical parameters, including TN, BOD5, COD, TSS, TDS, and Fe, were measured. Analytical methods, associated standards, and measurement uncertainties are presented in Table 3.
Table 3.
Analytical methods and measurement uncertainty of hydrochemical parameters.
These parameters were selected because they represent major indicators of nutrient loading, organic matter content, and mineralization processes in freshwater ecosystems [18,19]. Laboratory determinations were performed using standard analytical procedures commonly applied in hydrochemical studies of freshwater systems. TN concentrations were determined after digestion using spectrophotometric methods. BOD5 concentrations were measured using the five-day incubation method under controlled conditions, while COD concentrations were determined by the dichromate oxidation method. TSS concentrations were quantified gravimetrically after filtration and drying of the residue, and TDS concentrations were determined by evaporation of the filtered sample followed by gravimetric measurement. Fe concentrations were analyzed using spectrophotometry techniques following appropriate sample preparation. Measurement uncertainty values reflect combined analytical and instrumental error as specified in the respective methodological guidelines.
2.3. Land-Use Analysis of Lake Catchments
The structure of land use in the vicinity of the studied lakes was evaluated to determine potential relationships between catchment characteristics and hydrochemical conditions. Spatial analysis was carried out using geographic information system (GIS) techniques in the software environment of Quantum GIS (Version 1.7.4) [20]. To ensure consistency between the land cover classification presented in Figure 2 and the analytical framework used in this study, the original 10 land cover classes were aggregated into four generalized land-use categories: Forest, Agriculture, Wetlands, and Built-up. Specifically, Tree cover was assigned to Forest, Cropland to Agriculture, Herbaceous wetlands and Mangroves to Wetlands, and Built-up retained as a separate category. The remaining classes (Shrubland, Grassland, Permanent water bodies, Bare/sparse vegetation, and Moss and lichen) were not directly included in the four primary land-use categories due to their transitional, heterogeneous, or non-terrestrial nature. These classes were retained in Figure 2 to preserve the completeness of the original land cover dataset and to allow visual assessment of landscape heterogeneity, but they were excluded from the aggregated statistical analysis. For each lake (S1–S9), a buffer zone with a radius of 1000 m was generated around the shoreline to represent the immediate catchment area that most directly influences water quality through surface runoff and near-shore processes. The buffer-based approach represents a simplified proxy and does not fully capture hydrologically delineated catchments. This spatial extent was selected as an operational approximation of the local drainage zone affecting hydrochemical inputs, particularly for relatively small and shallow lakes where short-distance transport processes may dominate. Land-cover information was obtained from the CORINE Land Cover database [21]. The original land-cover classes were reclassified into five generalized categories relevant to hydrochemical processes: forest, agricultural land, wetlands, water surface, and built-up areas. This grouping reflects major landscape types that differ in their capacity to generate nutrient runoff, organic matter inputs, and mineral components entering lake systems. The spatial distribution of these land-cover categories within each buffer zone was calculated using GIS overlay analysis. The percentage share of each land-use class was determined relative to the total area of the buffer zone for every lake. The resulting dataset characterizes the dominant landscape structure surrounding each sampling site and provides a basis for evaluating the potential influence of land use on hydrochemical parameters.
Figure 2.
Land use and land cover patterns within the buffer zones of the studied lakes (S1–S9).
2.4. Statistical Analysis of Hydrochemical Variability
Descriptive statistical analysis was applied to characterize the central tendency and variability of hydrochemical parameters across all investigated lakes. For each indicator, the minimum, maximum, mean (M), and standard deviation (SD) were calculated using concentrations expressed in mg/L. These statistics were used to evaluate the overall range of variation and to facilitate inter-lake comparisons of hydrochemical conditions. Linear relationships among hydrochemical variables were examined using Pearson’s correlation analysis [22,23]. The correlation coefficient Pearson (r) was used to quantify the strength and direction of associations between variables representing nutrient loading, organic matter content, suspended particulate matter, and mineralization processes. The strength of correlations was interpreted according to commonly accepted thresholds: |r| < 0.30 indicates weak correlation, 0.30–0.49 moderate correlation, 0.50–0.69 noticeable correlation, 0.70–0.89 strong correlation, and |r| ≥ 0.90 very strong correlation. Positive coefficients indicate synchronous variation in two variables, whereas negative coefficients indicate inverse relationships. To further explore multivariate relationships and identify the main factors controlling hydrochemical variability, principal component analysis (PCA) was applied. PCA is a widely used multivariate statistical technique that transforms a set of interrelated variables into a smaller number of orthogonal components that explain the maximum variance of the dataset [24,25]. Prior to PCA, hydrochemical variables were standardized to eliminate the effect of differences in measurement scales. Principal components with eigenvalues greater than 1 were considered significant and retained for interpretation. The loadings of variables on each component were analyzed to identify groups of parameters representing common hydrochemical processes. High positive or negative loadings were interpreted as strong contributions of a variable to a particular component, allowing identification of dominant factors such as nutrient enrichment, organic pollution, mineralization, or geochemical inputs. All statistical analyses were performed using the software environment JASP (Version 0.14.3).
2.5. Self-Organizing Map Modelling and Cluster Identification
Multivariate classification of the studied lakes was performed using the SOM algorithm. SOM represents an unsupervised neural network technique designed to project multidimensional datasets onto a low-dimensional lattice while preserving the topological relationships between observations. This method is particularly effective for identifying non-linear structures and patterns in complex environmental datasets [26,27]. The SOM analysis was implemented in MATLAB (MathWorks, Natick, MA, USA) using SOM Toolbox 2.0. The network architecture consisted of two layers: an input layer representing the hydrochemical variables and an output layer composed of neurons arranged on a two-dimensional rectangular grid. Each neuron is associated with a prototype vector (weight vector) describing a characteristic pattern of hydrochemical indicators. Prior to training, all variables were min–max normalized in order to eliminate scale effects and ensure equal contribution of each parameter to the learning process. The SOM was trained using a batch learning algorithm with a Gaussian neighbourhood function, which iteratively adjusts neuron weight vectors toward input data according to similarity measures. During the training process, neighbouring neurons in the lattice update their weights simultaneously, allowing the network to preserve the topology of the original multidimensional data space. The weight vector of each neuron is defined to Equation (1). The SOM was implemented as a two-dimensional hexagonal lattice consisting of a 4 × 5 neuron grid (20 nodes), which provided an appropriate balance between map resolution and the relatively small size of the hydrochemical dataset. SOM was preferred over conventional clustering approaches (e.g., k-means applied to PCA scores) due to its ability to preserve topological relationships and to capture non-linear structures in multidimensional environmental data. This makes SOM particularly suitable for exploratory analysis of complex hydrochemical systems where multiple interacting processes occur simultaneously.
where m is the number of hydrochemical variables and wi represents the weight of parameter in neuron i.
Wi = [wi1, wi2, …, wim]
After SOM training, clusters were delineated by grouping neurons with similar prototype vectors. For this purpose, a non-hierarchical K-means clustering algorithm was applied to the SOM codebook vectors. The optimal number of clusters was determined by minimizing the Davies–Bouldin index, which evaluates cluster compactness and separation. Lower index values indicate a better-defined clustering structure. For each cluster, a representative hydrochemical profile was obtained by averaging the weight vectors of all neurons belonging to that cluster. These averaged vectors characterize the typical hydrochemical conditions associated with each cluster. To facilitate comparison among parameters, cluster-level weights were min–max normalized, producing values in the range 0–1. These normalized weights represent the relative contribution of each hydrochemical parameter to cluster formation. The strength of parameter influence was classified according to normalized value ranges (Table 4), following the approach proposed by [28].
Table 4.
Classification of parameter influence based on normalized SOM weights.
Relationships between SOM clusters and hydrochemical variables were visualized using Sankey diagrams, which allow the identification of dominant parameters associated with each cluster and illustrate the distribution of parameter influence within the clustering structure. The quality of clustering was evaluated using several complementary metrics that characterize both internal cluster structure and topological representation accuracy. The quantization error (QE) was calculated to estimate the average distance between each observation vector and its corresponding best matching unit (BMU) [29]. Lower QE values indicate better representation of the dataset by the trained SOM. The topographic error (TE) was used to assess how well the SOM preserves the topology of the input space [29]. This metric measures the proportion of data vectors for which the first and second BMUs are not adjacent neurons. Smaller TE values indicate better topological preservation. In addition, cluster separation and compactness were assessed using the silhouette index, which measures the degree to which observations are correctly assigned to clusters. Silhouette values range from −1 to 1, where higher values indicate well-separated clusters with high internal similarity. Cluster robustness was quantified by calculating the frequency with which observations were assigned to the same cluster across repeated SOM trainings [30]. High assignment consistency indicates stable clusters that are not sensitive to small variations in the dataset.
3. Results and Discussion
3.1. Land-Use Patterns in Lake Catchments
The spatial structure of land use within the 1000 m buffer zones surrounding the studied lakes (S1–S9) reflects substantial heterogeneity in the landscape composition of the Polissia region and provides an important context for interpreting hydrochemical variability. The distribution of major land-cover categories is illustrated in Figure 2, while the quantitative structure of land cover is summarized in Table 5.
Table 5.
Structure of the earth cover in the buffer zone 1000 m around the studied lakes.
The forest ecosystems constitute the dominant landscape element in the majority of lake catchments, whereas agricultural land, wetlands, and minor built-up areas represent secondary components of the surrounding landscape. Across the investigated sites, forest cover accounts for 48.6–70.4% of the buffer zone area, indicating that most lakes are embedded within relatively natural landscapes. Agricultural land represents the second most important land-use category, ranging from 12.6% to 32.7%, whereas wetlands occupy 8.6–12.1% of the surrounding territory (Table 5). Water surfaces within the buffer zones account for 4.3–7.4%, reflecting the presence of connected small basins or shoreline morphology, while built-up areas remain negligible (0.5–1.8%), suggesting limited urban pressure on the investigated lake systems (Table 5).
Despite the overall dominance of forest landscapes, individual lakes exhibit distinct land-use configurations that may influence external nutrient inputs and hydrological interactions. The catchments of Domashnie (S1) and Liubiaz (S2) display relatively mixed land-use patterns. In S1, forest ecosystems occupy 62.3% of the buffer zone, while agricultural land constitutes 18.5% and wetlands 12.1%. This mosaic landscape, visible in Figure 2, combines semi-natural vegetation with cultivated areas, suggesting potential pathways for diffuse nutrient transport to the lake. A more pronounced agricultural influence is observed in the catchments of Liubiaz (S2) and Nobel (S3). Agricultural land accounts for 26.8% and 32.7% of the buffer zones of these lakes, respectively, while forest cover decreases to 55.1% in S2 and 48.6% in S3. Such land-use patterns are consistent with the floodplain character of these systems and their hydrological connectivity with the Prypiat River, where riparian landscapes often combine natural vegetation with cultivated land. In this context, agricultural runoff may represent a relevant external source of nutrients and suspended matter [31,32]. In contrast, several lakes are located within strongly forested environments. The catchment of Pisochne (S4) exhibits the highest proportion of forest cover (70.4%) and the lowest agricultural share (12.6%), reflecting its location within the protected area of Shatsk National Nature Park. Similar conditions are observed for Svityaz (S5) and Turske (S8), where forest ecosystems account for 64.9% and 66.5% of the surrounding landscape, respectively. These forest-dominated catchments are generally associated with reduced nutrient export due to effective natural buffering and lower soil disturbance [33,34]. Wetland-associated landscapes are particularly evident in the catchment of Solynka (S6), where wetlands represent 11.5% of the buffer zone in combination with 52.7% forest cover. Such a landscape structure is consistent with the dystrophic character of this lake and the influence of peat-bog hydrological systems, which typically contribute humic substances and iron-rich waters. Comparable but less pronounced wetland presence is observed around Karasyn (S9) and Domashnie (S1), where wetland areas exceed 10% of the buffer zone. Intermediate land-use patterns occur in the catchments of Somyne (S7) and Karasyn (S9), where forest cover remains dominant (59.8% and 61.2%, respectively), while agricultural land constitutes 24.3% and 21.4% of the surrounding area. These mixed landscapes represent transitional conditions between natural forest-dominated catchments and more intensively used agricultural areas [35].
Overall, the spatial distribution of land-use categories indicates that the investigated lakes are located primarily within semi-natural forest–wetland landscapes with varying degrees of agricultural influence. The consistently low proportion of built-up areas across all catchments indicates that urban pollution is likely not a dominant driver of external hydrochemical loading. Instead, diffuse agricultural inputs and natural geochemical processes are expected to play a more important role [36]. At the same time, variability in landscape structure is primarily associated with differences in the relative proportions of forested and agricultural land. This variability provides an important environmental context for interpreting patterns of nutrient enrichment, organic matter dynamics, and mineralization processes discussed in the subsequent sections.
3.2. Environmental Drivers of Hydrochemical Variability
The hydrochemical composition of the investigated lakes demonstrates considerable variability that reflects differences in nutrient supply, organic matter accumulation, mineralization processes, and hydrological connectivity within the Polissia lake systems. The distribution of the main hydrochemical indicators is illustrated in Figure 3a,b, which summarizes the concentration ranges observed across the studied lakes. TN concentrations ranged from 1.13 to 2.33 mgN/L, with a mean value of 1.79 mgN/L and a standard deviation of 0.35 mgN/L. The relatively limited range of variation suggests generally moderate nutrient enrichment across the investigated lakes. Such conditions are consistent with the predominantly forested catchments identified in Section 3.1, where natural vegetation limits intensive nutrient runoff. At the same time, the observed variability indicates that individual lakes experience different levels of nitrogen input associated with local hydrological conditions and landscape structure. Indicators related to organic matter exhibited a broader range of variability. BOD5 varied between 3.8 and 9.2 mgO2/L (M = 6.47 mgO2/L; SD = 1.42 mgO2/L), indicating substantial differences in the amount of biodegradable organic material present in the water column. COD showed even greater variability, ranging from 16.0 to 40.3 mgO/L (M = 25.56 mgO/L; SD = 6.98 mgO/L). The wide variability of COD reflects the combined influence of autochthonous organic production and allochthonous inputs derived from surrounding terrestrial ecosystems, particularly wetlands and forest litter. TSS ranged from 6.88 to 14.3 mg/L, with a mean value of 11.78 mg/L and SD = 3.44 mg/L. Fe concentrations exhibited substantial differences between the investigated lakes, ranging from 0.078 to 0.76 mg/L (M = 0.285 mg/L; SD = 0.234 mg/L). Elevated iron levels were typically associated with dystrophic or humic-influenced lakes, where reducing conditions and complexation with dissolved organic matter enhance Fe mobility in the water column. Such conditions are characteristic of peat-influenced catchments and wetlands, which represent an important landscape component in several of the studied basins. In contrast, TDS displayed the widest absolute range among the analyzed parameters, varying from 125 to 465 mg/L (M = 223 mg/L; SD = 110 mg/L). This parameter primarily reflects differences in mineralization controlled by groundwater inflow, lithological composition of the basin, and hydrological isolation of individual lakes. Systems with stronger groundwater influence tend to exhibit higher ionic content, whereas lakes dominated by organic inputs and surface runoff typically show lower mineralization levels [37]. Overall, the observed variability of hydrochemical indicators indicates that the studied lakes represent a heterogeneous group of aquatic systems in which nutrient enrichment, organic matter accumulation, and mineralization processes operate with different intensities.
Figure 3.
Variability and interrelationships in Polissia lakes: (a)—distribution of concentrations; (b)—radar diagrams of the variability of water quality parameters across the studied lakes; (c)—Pearson correlation coefficients between hydrochemical parameters.
The relationships between the analyzed hydrochemical variables are illustrated in Figure 3b, which presents the Pearson correlation matrix for the studied dataset. A very strong positive relationship was observed between BOD5 and COD (r = 0.95), indicating that both parameters respond to the same underlying process, namely the accumulation and transformation of organic matter within the lake ecosystems [38]. Similarly, TN demonstrated a strong positive correlation with COD (r = 0.82) and a noticeable correlation with BOD5 (r = 0.65). These relationships suggest that nutrient availability is closely linked with biological productivity and the generation of biodegradable organic compounds in the studied lakes. TSS showed weaker but still discernible associations with parameters representing nutrient and organic matter dynamics [39]. TSS displayed moderate positive correlations with BOD5 (r = 0.37) and COD (r = 0.33), and a weaker relationship with TN (r = 0.27). Fe exhibited a different correlation pattern reflecting its geochemical behavior in aquatic systems [39]. A moderate positive relationship between Fe and TSS (r = 0.68) suggests that iron is largely associated with particulate and colloidal fractions in the water column. Such associations are typical of lakes characterized by high organic matter content and reducing conditions that promote the mobilization of Fe from sediments [40]. At the same time, Fe showed weak to moderate negative correlations with TN (r = −0.36) and COD (r = −0.36), indicating that iron enrichment may occur under geochemical conditions different from those governing nutrient-driven biological processes. TDS demonstrated pronounced negative correlations with TN (r = −0.66), BOD5 (r = −0.73), COD (r = −0.71), and TSS (r = −0.64). This relationship highlights a clear separation between two types of hydrochemical regimes within the investigated lakes. One group of systems is characterized by higher mineralization and stronger groundwater influence, whereas another group is dominated by organic matter accumulation and nutrient cycling processes. These include nutrient availability and biological productivity, organic matter inputs from surrounding landscapes, sediment–water interactions, and groundwater-driven mineralization processes.
3.3. SOM-Based Classification and Interpretation
To identify dominant hydrochemical regimes and reveal hidden structures within the dataset, a Self-Organising Map (SOM) approach was applied to the standardized hydrochemical variables (TN, BOD5, COD, TSS, Fe, and TDS). The trained SOM projected the multidimensional hydrochemical dataset onto a two-dimensional lattice, allowing the identification of groups of lakes with similar water-quality characteristics. The component planes of the trained SOM are presented in Figure 4, which illustrates the spatial distribution of normalized hydrochemical parameters across the neural network grid. Each component plane represents the relative contribution of a specific variable to the hydrochemical structure of the dataset. The visualization reveals clear gradients in parameter distribution, indicating the presence of distinct hydrochemical regimes among the investigated lakes.
Figure 4.
SOM analysis of hydrochemical parameters in Polissia lakes: (a)—TN; (b)—BOD5; (c)—COD; (d)—TSS; (e)—Fe; (f)—TDS.
The TN component plane (Figure 4a) indicates that elevated nitrogen concentrations are concentrated primarily within one group of neurons corresponding to a specific cluster of lakes. In contrast, lower TN values dominate the remaining regions of the SOM lattice. A similar spatial pattern is observed for BOD5 (Figure 4b) and COD (Figure 4c), where higher normalized values occur within the same region of the map, indicating a strong association between nutrient enrichment and organic matter accumulation. The TSS component plane (Figure 4d) shows elevated values mainly in the same region characterized by high organic matter indicators, suggesting that suspended particulate matter is partly associated with biological production and organic enrichment. The Fe component plane (Figure 4e) also exhibits increased values within this area, indicating enhanced sediment–water interactions and redox-sensitive processes under conditions of high organic loading. In contrast, the TDS component plane (Figure 4f) demonstrates a markedly different spatial pattern, with the highest values located in a separate region of the SOM lattice, reflecting hydrochemical regimes dominated by mineralization processes rather than organic matter dynamics. Overall, the SOM structure reveals a clear separation between lakes characterized by low background nutrient conditions, organic-matter-enriched systems, and mineralization-controlled waters, indicating fundamentally different environmental controls on hydrochemical composition.
According to the SOM-based clustering solution, three hydrochemical groups were distinguished: Cluster 1: Svityaz (S5), Somyne (S7); Cluster 2: Domashnie (S1), Liubiaz (S2), Nobel (S3), Solynka (S6), Turske (S8); Cluster 3: Pisochne (S4), Karasyn (S9). The reliability of the obtained SOM model was evaluated using several complementary quality indicators. QE was 0.176, indicating a good representation of the input hydrochemical dataset by the trained neural network. TE was 0.041, demonstrating that the SOM effectively preserved the topological relationships among observations. In addition, the mean silhouette coefficient of 0.63 confirmed a well-defined clustering structure with clear separation between groups of lakes. Cluster robustness was further assessed using a bootstrap resampling procedure, in which the SOM training and clustering were repeated across multiple resampled datasets. The resulting cluster stability coefficients ranged from 0.83 to 0.92, indicating a high degree of consistency in lake classification. The results of this analysis are summarized in Table 6, which presents the composition and stability of the identified clusters. Cluster 2 demonstrated the highest stability (0.92) and included the largest number of lakes characterized by similar hydrochemical conditions. Clusters 1 and 3 also showed high stability values (0.86 and 0.83, respectively), confirming that the identified hydrochemical regimes represent robust and reproducible patterns rather than artifacts of the dataset.
Table 6.
Cluster stability based on bootstrap SOM analysis.
To facilitate interpretation of the SOM classification, the relationships between clusters, lakes, and hydrochemical variables were visualized using a Sankey diagram (Figure 5). In this diagram, the width of the flows represents the normalized SOM weights (0–1) describing the relative contribution of each hydrochemical parameter to cluster formation.
Figure 5.
Sankey diagram the relative contributions (normalized SOM weights) of hydrochemical parameters to cluster formation and their links with individual lakes.
The Sankey visualization clearly illustrates the differentiation of three hydrochemical regimes within the studied lake systems (Figure 5). Cluster 1 includes Svityaz (S5) and Somyne (S7) and represents lakes with near-background hydrochemical conditions. This cluster is characterized by very low normalized contributions of TSS (0.16–0.18) and low contributions of BOD5 and COD (0.16–0.38), indicating limited accumulation of organic matter. TN also exhibits very low influence (0.13–0.14), reflecting weak nutrient enrichment. Iron shows a low contribution (0.31–0.37), whereas TDS demonstrates moderate influence (0.42–0.51). In hydrochemical terms, these lakes are characterized by relatively low concentrations of nutrients, suspended solids, and organic matter, indicating minimal anthropogenic disturbance and dominance of natural geochemical processes. Such systems may serve as regional reference lakes representing baseline conditions for water-quality assessment. Cluster 2 comprises Domashnie (S1), Liubiaz (S2), Nobel (S3), Solynka (S6), and Turske (S8) and represents lakes dominated by organic matter accumulation and nutrient enrichment. This cluster is characterized by high normalized contributions of TN, BOD5, COD, and TSS (0.67–0.74), indicating intensified organic matter loading and active biological processes. Fe also shows elevated influence (0.84–0.88), suggesting enhanced sediment–water interactions and redox transformations in organic-rich environments. In contrast, TDS contributions remain relatively low to moderate (0.25–0.55), indicating that mineralization processes play a secondary role in shaping hydrochemical conditions. Overall, the hydrochemical regime of Cluster 2 reflects intensive internal biogeochemical cycling, accumulation and degradation of organic matter, and possible influence of diffuse catchment inputs. These lakes may therefore be more vulnerable to eutrophication processes, highlighting the importance of nutrient-management strategies in their catchments. Cluster 3 includes Pisochne (S4) and Karasyn (S9) and is primarily controlled by mineralization processes. This cluster shows a high normalized influence of TDS (0.67–0.78), indicating elevated ionic content and stronger geochemical control by groundwater and lithological factors. In contrast, the influence of TN and TSS remains relatively low (0.23–0.33), while BOD5, COD, and Fe fall within the low to moderate range (0.27–0.29). These characteristics indicate hydrochemical conditions dominated by geogenic mineralization rather than organic pollution or nutrient enrichment. From a management perspective, such lakes require attention to hydrogeological processes and groundwater–surface water interactions rather than nutrient reduction measures [41].
Overall, the SOM-based classification demonstrates that the hydrochemical diversity of Polissia lakes can be effectively represented by three major regimes: background systems with minimal anthropogenic influence, organic-matter-dominated lakes with active biogeochemical cycling, and mineralization-controlled systems governed primarily by geogenic processes. The differentiation of these regimes provides a useful framework for understanding regional hydrochemical variability and supports the development of targeted lake-management strategies based on the dominant environmental drivers operating within each group of lakes.
3.4. Influence of Catchment Land Use and Morphometry
To further clarify the environmental controls underlying the hydrochemical differentiation revealed by the SOM analysis, the relationships between catchment land-use structure, morphometric characteristics of the lakes, and hydrochemical parameters were examined. The statistical relationships between land-use categories and hydrochemical parameters are summarized in Figure 6a,b, which presents Pearson correlation coefficients between hydrochemical variables and the structure of land cover within the 1000 m buffer zones around the lakes. Clear contrasts are evident between forest-dominated and agriculturally influenced catchments. Forest cover shows consistent negative correlations with nutrient and organic matter indicators, including TN (r = −0.61), BOD5 (r = −0.55), COD (r = −0.48), and TSS (r = −0.39). These relationships indicate that forest ecosystems function as an effective natural buffer, reducing diffuse nutrient runoff and limiting the input of particulate matter into lake systems. In contrast, agricultural land exhibits strong positive correlations with several hydrochemical variables. The highest associations are observed for TN (r = 0.72) and BOD5 (r = 0.67), followed by COD (r = 0.63) and TSS (r = 0.58). These relationships indicate that agricultural landscapes represent an important source of nutrient enrichment and organic matter inputs to the lakes. A moderate positive relationship between agricultural land and TDS (r = 0.54) also suggests that agricultural runoff may contribute to increased mineralization through the transport of dissolved ions. Wetland ecosystems display a distinct pattern of relationships with hydrochemical variables. The strongest correlation is observed between wetlands and Fe (r = 0.62), reflecting the influence of peat-rich environments and reducing conditions that enhance iron mobilization in aquatic systems. Wetlands also show moderate positive relationships with COD (r = 0.45) and BOD5 (r = 0.38), indicating that humic substances derived from peatlands and wetland vegetation contribute to the organic matter pool of the lakes. Although built-up areas represent only a minor fraction of the landscape in the studied catchments, they demonstrate moderate positive correlations with several hydrochemical indicators, including TN (r = 0.41) and TDS (r = 0.37). These relationships likely reflect localized anthropogenic influences associated with settlements and recreational infrastructure in certain lake areas [42].
Figure 6.
Pearson correlation coefficients matrix (a) and relationship between land use structure and hydrochemical parameters (b); PCA biplot showing relationships between hydrochemical parameters, land-use variables and SOM clusters (c); average land use indicators for SOM clusters (d).
To quantitatively characterize the identified clusters, the median values and standard deviations (±SD) of hydrochemical parameters were calculated (Table 7). The results reveal clear differentiation among the clusters in terms of nutrient content, organic matter indicators, suspended solids, iron concentration, and mineralization. Cluster 1 is characterized by relatively low concentrations of total nitrogen (1.2 ± 0.1 mg/L), BOD5 (4.2 ± 0.5 mgO2/L), COD (18 ± 3 mgO/L), TSS (7.5 ± 1.0 mg/L), and Fe (0.15 ± 0.05 mg/L), along with moderate TDS values (180 ± 40 mg/L), indicating background hydrochemical conditions with limited anthropogenic influence. In contrast, Cluster 2 exhibits the highest levels of nutrients and organic matter indicators, including TN (1.9 ± 0.3 mg/L), BOD5 (7.5 ± 1.0 mgO2/L), COD (32 ± 5 mgO/L), TSS (13.0 ± 1.5 mg/L), and Fe (0.55 ± 0.15 mg/L), reflecting enhanced biogeochemical activity and organic enrichment. Cluster 3 is distinguished by elevated mineralization, as evidenced by the highest TDS values (380 ± 70 mg/L), while maintaining moderate levels of TN (1.3 ± 0.2 mg/L), BOD5 (5.0 ± 0.6 mgO2/L), COD (22 ± 3 mgO/L), TSS (9.0 ± 1.2 mg/L), and Fe (0.30 ± 0.10 mg/L), indicating a hydrochemical regime primarily controlled by geogenic factors.
Table 7.
Cluster-specific hydrochemical characteristics (median ± SD).
Overall, these quantitative patterns support the SOM-based classification and provide a concise representation of the dominant hydrochemical gradients across the studied lakes (Table 7).
To explore the relationship between of land use, hydrochemistry, and SOM classification, PCA was performed (Figure 6c). The first two principal components explain 75.69% of the total variance, indicating that the main patterns of hydrochemical variability are well represented in the ordination space. The first principal component (PC1) accounts for 55.22% of the variance and represents the dominant gradient of nutrient and organic matter enrichment associated with agricultural land use. Positive loadings on PC1 are observed for TN (0.86), BOD5 (0.82), COD (0.78), TSS (0.74), and TDS (0.69), while agricultural land cover shows a strong positive loading (0.81). In contrast, forest cover exhibits a pronounced negative loading (−0.79) along the same axis, indicating that forest-dominated catchments are associated with lower concentrations of nutrients and organic matter in lake waters. The second principal component (PC2) explains 20.47% of the variance and reflects a secondary gradient related primarily to wetland influence and redox-sensitive geochemical processes. This component is strongly associated with Fe (loading 0.83) and with the wetlands land-use category (loading 0.68), suggesting that iron dynamics in the studied lakes are largely controlled by the hydrological and geochemical conditions typical of peatland environments. Under such conditions, reducing processes in organic-rich soils and sediments promote the mobilization of dissolved iron, which is subsequently transported into adjacent lake basins. The spatial arrangement of SOM clusters within the PCA ordination further supports this interpretation. Cluster 1, representing lakes surrounded predominantly by forest landscapes, is located in the negative sector of PC1 and is associated with relatively low concentrations of nutrients and suspended matter. Cluster 2 occupies an intermediate position along the PC1 gradient, reflecting mixed catchment characteristics with moderate agricultural influence and corresponding hydrochemical conditions. In contrast, Cluster 3 is clearly positioned in the positive sector of PC1, where hydrochemical parameters related to nutrient enrichment (TN, BOD5, COD, and TSS) show their highest loadings. This cluster corresponds to lakes located in catchments with the greatest proportion of agricultural land, indicating a stronger influence of diffuse nutrient inputs from surrounding landscapes. Overall, the PCA results demonstrate that catchment land use represents a primary environmental driver of hydrochemical variability in the studied Polissia lakes, with agricultural landscapes promoting nutrient enrichment and forest ecosystems exerting a buffering effect. At the same time, the second environmental gradient associated with wetlands highlights the importance of peatland hydrology and redox processes in regulating Fe concentrations and shaping specific hydrochemical characteristics of individual lake systems [43].
The relationships between catchment land use and hydrochemical regimes become particularly evident when examining the average landscape composition associated with each SOM cluster (Figure 6d). Cluster 1, representing lakes with near-background hydrochemical conditions, is characterized by a high proportion of forest cover (62.3%), combined with moderate shares of agricultural land (22.2%) and wetlands (9.2%). Built-up areas constitute only a small fraction of the catchments (0.8%). This landscape configuration is consistent with the hydrochemical characteristics identified earlier, including low concentrations of nutrients and suspended solids. Forest-dominated catchments likely limit external nutrient inputs through effective soil stabilization, high infiltration capacity, and biological nutrient uptake [44,45]. Cluster 2, which includes lakes characterized by elevated organic matter indicators and higher nutrient concentrations, displays a somewhat different landscape structure. The proportion of agricultural land increases to 24.9%, while forest cover decreases slightly to 57.0%. Wetlands represent 10.7% of the catchment area, and built-up areas account for approximately 1.2%. The increased share of agricultural land in this cluster supports the interpretation that diffuse nutrient runoff from cultivated areas contributes to the observed hydrochemical enrichment. Cluster 3, associated with mineralization-controlled hydrochemical regimes, is characterized by relatively high forest cover (65.8%) and a lower proportion of agricultural land (17.0%) compared with Cluster 2. Wetlands occupy 10.9% of the catchment area, while built-up areas represent about 0.8%. This landscape composition suggests that hydrochemical conditions in these lakes may be influenced not only by land use but also by geochemical factors such as groundwater inflow and basin lithology. Overall, the observed land-use gradient across the SOM clusters indicates variation in the relative proportions of forest and agricultural landscapes within lake catchments. Although several lakes are influenced by agricultural areas, their hydrochemical structure is primarily associated with elevated TDS levels, suggesting a potential influence of natural geochemical processes rather than direct nutrient enrichment [46]. However, factors such as groundwater inflow and basin lithology were not directly assessed in this study and therefore remain hypothetical explanations requiring further investigation.
The integration of SOM classification with land-use structure and hydrochemical indicators provides important insights into the biogeochemical functioning of the studied lake systems. Lakes belonging to Cluster 1 represent relatively stable ecosystems where hydrochemical conditions are largely regulated by natural landscape processes. High forest cover promotes nutrient retention within soils and vegetation, limiting the transfer of nitrogen and organic matter to the aquatic environment. As a result, these lakes exhibit low nutrient concentrations, reduced organic loading, and relatively balanced biogeochemical cycles. In Cluster 2, the increased influence of agricultural landscapes results in enhanced external nutrient supply, which stimulates biological productivity and organic matter accumulation. Elevated values of TN, BOD5, COD, and TSS in this cluster reflect intensified biological production, organic matter decomposition, and sediment–water interactions. These processes may increase the risk of eutrophication, particularly in shallow lakes where internal nutrient recycling can further amplify productivity [47]. Cluster 3 represents a different hydrochemical regime in which lake chemistry is controlled primarily by geochemical mineralization processes rather than biological productivity. Forest-dominated catchments support relatively stable hydrochemical conditions, agricultural landscapes promote nutrient enrichment and organic matter accumulation, whereas groundwater-driven mineralization governs the chemistry of a smaller group of lakes with distinct geochemical characteristics [47,48]. In the PCA space, Cluster 3 is positioned along the positive axis of PC1, which is strongly associated with nutrient and organic matter indicators (TN, BOD5, COD, and TSS) as well as agricultural land use (Figure 6c). This placement primarily reflects the contribution of these variables to overall variance structure across the dataset. In contrast, the SOM classification emphasizes similarity in multivariate profiles and preserves non-linear relationships among variables. Within this framework, Cluster 3 is characterized by relatively elevated mineralization and moderate levels of nutrient and organic indicators, distinguishing it from the more strongly enriched systems grouped in Cluster 2. The higher proportion of forest cover and lower agricultural share associated with Cluster 3 further support the interpretation that geogenic and hydrogeological controls, rather than diffuse nutrient inputs, play a dominant role in shaping its hydrochemical regime. Therefore, PCA highlights variance-driven gradients dominated by nutrient-related variables, whereas SOM identifies structurally coherent groups based on the overall balance of hydrochemical processes. When considered together, these methods provide complementary perspectives, indicating that Cluster 3 occupies an intermediate position along the nutrient gradient while remaining primarily controlled by mineralization processes.
3.5. Implications for Sustainable Water Management
The hydrochemical patterns identified in the studied Polissia lakes highlight the importance of considering both catchment land use and internal lake processes when developing strategies for sustainable water management. The integration of hydrochemical analysis, landscape metrics, and SOM classification revealed clear environmental gradients associated with agricultural pressure, forest buffering capacity, and wetland-driven geochemical processes. These findings provide a scientific basis for translating hydrochemical diagnostics into practical water management measures, particularly within the framework of IWRM [49,50]. The results of the present study demonstrate that landscape structure acts as a primary driver of hydrochemical variability, with agricultural areas contributing to elevated concentrations of nutrients and organic matter, while forest-dominated catchments exert a stabilizing influence on water quality. Wetland systems, in turn, play a distinct role in regulating iron dynamics through redox-controlled geochemical processes. These interactions highlight the need for water management strategies that address not only the lake basins themselves but also the broader landscape context of lake catchments. The SOM-based classification provides a practical tool for identifying groups of lakes that share similar hydrochemical regimes and environmental drivers. Such classification allows water managers to move beyond individual lake assessments and instead adopt cluster-based management strategies, where lakes with comparable ecological characteristics can be addressed through similar monitoring and mitigation approaches. For example, lakes belonging to clusters associated with higher nutrient concentrations and greater agricultural influence require targeted measures aimed at reducing diffuse nutrient inputs from surrounding catchments. In contrast, lakes located in forest-dominated landscapes generally exhibit lower levels of nutrient enrichment and may primarily require conservation-oriented management to maintain existing ecological conditions.
The conceptual integration of these results into a broader management perspective is illustrated in Figure 7a,b, which presents a framework linking SOM-derived hydrochemical clusters with elements of the IWRM approach. In this scheme, hydrochemical monitoring and multivariate data analysis form the scientific foundation for identifying environmental drivers and classifying lakes according to their hydrochemical regimes. The resulting SOM clusters serve as an intermediate step connecting scientific assessment with practical management decisions. Through this integration, hydrochemical diagnostics can inform catchment-scale planning, including land-use regulation, protection of forested buffer zones, and the conservation of wetland systems that play an important role in regulating biogeochemical processes. Within the proposed framework, hydrochemical indicators such as TN, BOD5, COD, TSS, Fe, and TDS act as operational variables that reflect the cumulative influence of landscape processes on lake ecosystems. Their analysis through SOM and complementary statistical methods enables the identification of dominant environmental gradients and provides an objective basis for evaluating water quality conditions across multiple lakes. By linking these hydrochemical patterns to catchment characteristics, the proposed approach supports the development of adaptive management strategies tailored to specific environmental conditions [51,52,53,54,55].
Figure 7.
Process linkages underlying the identified lake clusters (a), and conceptual integration of SOM-derived clusters into the IWRM framework: (b) IWRM governance framework; (c) SOM-based hydrochemical classification.
The relationships identified in this study between land-use structure and hydrochemical indicators are consistent with patterns reported in other freshwater ecosystems. Forest-dominated catchments are widely recognized for their buffering capacity, which reduces the export of nutrients and suspended matter through increased infiltration, soil stabilization, and biological uptake. For instance, research on forest management and water quality has shown that forested landscapes generally limit nutrient runoff and contribute mainly natural organic matter derived from vegetation and litter inputs [56]. Similarly, investigations of forest catchments surrounding through-flow lakes demonstrated that surface runoff from forested areas typically results in relatively stable hydrochemical conditions characterized by moderate organic matter inputs but limited anthropogenic nutrient enrichment [57]. In contrast, agricultural landscapes are frequently associated with elevated concentrations of nitrogen compounds and suspended solids due to fertilizer application, soil disturbance, and enhanced surface runoff.
The hydrochemical variability observed in the studied Polissia lakes reflects the combined influence of nutrient loading, organic matter dynamics, and mineralization processes, which are strongly controlled by catchment characteristics and hydrological connectivity. Similar mechanisms have been documented in previous studies focusing on surface waters of northwestern Ukraine, particularly within river systems influenced by large water-use infrastructures. For example, investigations of the Styr River within the zone of influence of power plant water discharge demonstrated that suspended solids and particulate fractions can significantly affect the transport of matter between technogenic water systems and natural water bodies. The presence of dispersed particles in recirculating cooling systems was shown to contribute to increased suspended matter loads in receiving waters, thereby influencing hydrochemical variability and sediment transport processes [58]. These findings are consistent with the variability of TSS observed in the present study, where differences in suspended solids concentrations were associated with sediment resuspension and catchment-derived particulate inputs. In addition to particulate transport, the carbonate system of cooling water may influence the geochemical balance of adjacent aquatic environments. Studies of the circulating cooling water system of the Rivne Nuclear Power Plant demonstrated that carbonate equilibria in industrial water systems can affect pH conditions in nearby river waters, particularly in the Styr River [59]. Such processes illustrate the broader importance of carbonate chemistry and buffering capacity in shaping hydrochemical regimes of regional surface waters. Although the lakes examined in this study are primarily influenced by natural catchment processes, similar geochemical controls may contribute to variations in mineralization and TDS observed across different lake types. These technological factors highlight the complex interactions between industrial water management and natural hydrochemical systems, emphasizing the importance of understanding chemical stability and buffering mechanisms when assessing aquatic ecosystem responses [60]. Furthermore, statistical analysis of organic pollution indicators in the Styr River has demonstrated strong relationships among COD, BOD, and organic carbon parameters under anthropogenic influence [61]. These results are comparable to the strong correlations observed between BOD5 and COD in the present study, indicating that the accumulation and transformation of organic matter represent a key driver of hydrochemical variability in freshwater ecosystems. The interaction between organic matter inputs, redox conditions, and mineralization processes influences both nutrient availability and trace element mobility, which corresponds to the patterns observed in this study, particularly the relationships between Fe, organic matter indicators, and hydrological conditions [62,63].
The observed hydrochemical clustering cannot be explained solely by land use. Morphometric characteristics such as depth and hydrological connectivity appear to play an equally important role in controlling nutrient dynamics, sediment resuspension, and mineralization processes. Numerous studies have demonstrated that agricultural intensification represents one of the primary drivers of nutrient enrichment in freshwater systems, often promoting eutrophication processes and increased organic matter accumulation in lakes and reservoirs [5,6]. Wetland ecosystems represent another important landscape component influencing lake hydrochemistry. Peat soils and reducing conditions typical of wetlands can significantly increase the mobilization of Fe and dissolved organic carbon, thereby altering the geochemical composition of adjacent water bodies. Previous studies have reported elevated Fe concentrations and humic substances in wetland-influenced lakes, reflecting the influence of peat-derived organic matter and redox-controlled geochemical processes [64,65]. Such mechanisms are consistent with the positive relationship observed in this study between wetland coverage and Fe concentrations. Finally, although built-up areas occupy only a minor proportion of the catchments analyzed in this work, urbanized landscapes can influence hydrochemical conditions through the introduction of dissolved ions and anthropogenic pollutants derived from infrastructure, road runoff, and wastewater inputs. Recent large-scale analyses of lakes have shown that human activities in developed areas may significantly alter ionic composition and increase specific conductance and total dissolved solids in freshwater systems [66]. Similarly, studies of urbanizing lake basins have demonstrated that urban expansion may modify hydrological balance and enhance the transport of dissolved substances into lake waters [67]. These findings support the interpretation that the hydrochemical variability observed in the Polissia lakes is strongly linked to the structure of surrounding landscapes. Forest ecosystems primarily contribute to the stabilization of hydrochemical regimes, agricultural areas promote nutrient enrichment and suspended matter transport, wetlands influence Fe and organic matter dynamics, while built-up areas may contribute to increased mineralization and anthropogenic contaminants.
Overall, the integration of SOM-based hydrochemical classification with the IWRM framework provides a methodological pathway for translating complex environmental datasets into actionable management knowledge. The limited dataset restricts the statistical generalization of the results. Therefore, the applied multivariate analysis should be interpreted as an exploratory tool for pattern detection rather than a confirmatory statistical inference. Such an approach is particularly valuable for regions characterized by numerous small lakes and heterogeneous landscapes, where traditional lake-by-lake management may be inefficient. By emphasizing the connections between catchment land use, hydrochemical processes, and ecosystem responses, this framework contributes to the development of science-based strategies for sustainable lake and watershed management in the Polissia region and comparable temperate lake districts.
4. Conclusions
This study demonstrates that hydrochemical variability of Polissia lakes is governed by the interaction of nutrient dynamics, organic matter processes, and groundwater-driven mineralization. The SOM-based typology revealed three distinct hydrochemical regimes, which correspond not only to land-use patterns but also to intrinsic lake characteristics such as depth and hydrological connectivity. These findings support the application of integrated, basin-oriented management strategies within the IWRM framework. However, the limited temporal coverage of the dataset requires cautious interpretation. Future studies should incorporate seasonal monitoring to validate the proposed typology. The spatial distribution of SOM clusters within the PCA space supports the interpretation that the hydrochemical typology reflects underlying catchment-scale environmental controls. The proposed integration of SOM-based hydrochemical classification into an IWRM framework provides a practical approach for translating complex monitoring data into management-relevant knowledge. By grouping lakes according to dominant hydrochemical regimes and environmental drivers, the approach enables the development of cluster-specific monitoring strategies and catchment management measures. Such a framework is particularly relevant for lake-rich regions such as Polissia, where sustainable water management requires coordinated consideration of lake ecosystems and their surrounding landscapes.
Author Contributions
Conceptualization, O.B. and P.K.; methodology, O.B. and P.K.; software, O.B. and P.K.; validation, O.B., P.K. and O.T.; formal analysis, O.T.; investigation, P.K.; resources, O.T.; data curation, O.B. and O.K.; writing—original draft preparation, O.B., P.K., O.K. and O.T.; writing—review and editing, O.B. and P.K.; visualization, P.K.; supervision, O.B.; project administration, O.B. All authors have read and agreed to the published version of the manuscript.
Funding
This research received no external funding.
Data Availability Statement
The original contributions presented in this study are included in the article. Further inquiries can be directed to the corresponding author.
Conflicts of Interest
The authors declare no conflicts of interest.
References
- Bănăduc, D.; Simić, V.; Cianfaglione, K.; Barinova, S.; Afanasyev, S.; Öktener, A.; McCall, G.; Simić, S.; Curtean-Bănăduc, A. Freshwater as a Sustainable Resource and Generator of Secondary Resources in the 21st Century: Stressors, Threats, Risks, Management and Protection Strategies, and Conservation Approaches. Int. J. Environ. Res. Public Health 2022, 19, 16570. [Google Scholar] [CrossRef] [Scilit] [PubMed]
- Schernewski, G.; Neumann, T.; Piehl, S.; Swer, N.M. Ecosystem-Model-Based Valuation of Ecosystem Services in a Baltic Lagoon: Long-Term Human Technical Interventions and Short-Term Variability. Environments 2025, 12, 35. [Google Scholar] [CrossRef] [Scilit]
- Dumieński, G.; Lisowska, A.; Sulich, A.; Nowak, B. Social–Ecological Systems for Sustainable Water Management Under Anthropopressure: Bibliometric Mapping and Case Evidence from Poland. Sustainability 2026, 18, 993. [Google Scholar] [CrossRef] [Scilit]
- Markogianni, V.; Zotou, I.; Smeti, E.; Lampou, A.; Matiatos, I.; Karaouzas, I.; Dimitriou, E. Watershed Dynamics in the Prespa Lakes: An Integrated Assessment of Stream Inflow Effects. Water 2026, 18, 518. [Google Scholar] [CrossRef] [Scilit]
- Ozdemir, S.; Celebi, A.; Dede, G.; Maghrebi, M.; Danandeh Mehr, A. Impact of Land Use Change on Lake Pollution Dynamics: A Case Study of Sapanca Lake, Turkey. Water 2025, 17, 182. [Google Scholar] [CrossRef] [Scilit]
- Alciaturi, G.; Gil, A. Land Use and Land Cover Maps for Stream Water Quality Assessment in Spatial Buffers: A Systematic Review of Recent Trends (2020–2024). Land 2025, 14, 1858. [Google Scholar] [CrossRef] [Scilit]
- Omoregie, A.I.; Silini, M.O.E.; Wong, L.S.; Rajasekar, A. Nitrogen Eutrophication in Chinese Aquatic Ecosystems: Drivers, Impacts, and Mitigation Strategies. Nitrogen 2025, 6, 92. [Google Scholar] [CrossRef] [Scilit]
- Muñoz-Alegría, J.A.; Núñez, J.; Oyarzún, R.; Chávez, C.A.; Arumí, J.L.; Rodríguez-López, L. A Bibliometric-Systematic Literature Review (B-SLR) of Machine Learning-Based Water Quality Prediction: Trends, Gaps, and Future Directions. Water 2025, 17, 2994. [Google Scholar] [CrossRef] [Scilit]
- Almegdadi, O.; Marcelino, J.; Fakhreddine, S.; Manso, J.M.; Marques, N.C. Self-organizing maps for water quality assessment in reservoirs and lakes: A systematic literature review. Ecol. Inform. 2026, 93, 103542. [Google Scholar] [CrossRef] [Scilit]
- Rahman, A.T.M.S.; Kono, Y.; Hosono, T. Self-organizing map improves understanding on the hydrochemical processes in aquifer systems. Sci. Total Environ. 2022, 846, 157281. [Google Scholar] [CrossRef] [Scilit]
- Tang, W.; Lu, Z. Application of self-organizing map (SOM)-based approach to explore the relationship between land use and water quality in Deqing County, Taihu Lake Basin. Land Use Policy 2022, 119, 106205. [Google Scholar] [CrossRef] [Scilit]
- Mironova, N.; Kalda, G.; Lishchuk, O. Hydrochemical and toxicological composition in technogenic lakes of Male Polissya in Ukraine. J. Civ. Eng. Environ. Archit. 2013, 30, 59–65. [Google Scholar] [CrossRef] [Scilit]
- Khilchevskyi, V.; Ilyin, L.; Pasichnyk, M.; Zabokrytska, M.; Ilyina, O. Hydrography, hydrochemistry and composition of sapropel of Shatsk Lakes. J. Water Land Dev. 2022, 55, 184–193. [Google Scholar] [CrossRef] [Scilit]
- Ilyin, L.V.; Ilyina, O.V. Dynamics of hydromorphological parameters of lakes of Shatsk National Nature Park (1933–2021). In Proceedings of the 16th International Conference on Monitoring of Geological Processes and Ecological Condition of the Environment, Kyiv, Ukraine, 15–18 November 2022; p. 1. [Google Scholar] [CrossRef] [Scilit]
- Vlasyuk, A.; Zhukovskyy, V.; Zhukovska, N.; Pinchuk, O.; Rajab, H. Mathematical modeling of heat, mass and moisture transfer in catalytic porous media. Wseas Trans. Appl. Theor. Mech. 2020, 15, 52–59. [Google Scholar] [CrossRef] [Scilit]
- Biedunkova, O.; Kuznietsov, P.; Mandryk, O. Study of the dominant modes of formation and variability of potentially toxic element concentrations and their impact on environmental quality. Chemosphere 2025, 388, 144688. [Google Scholar] [CrossRef] [Scilit]
- ISO 5667-4:2016; Water Quality—Sampling—Part 4: Guidance on Sampling from Lakes, Natural and Man-Made. International Organization for Standardization (ISO): Geneva, Switzerland, 2016. Available online: https://cdn.standards.iteh.ai/samples/55450/7c17cfbf6e364627abb15576361d7c42/ISO-5667-4-2016.pdf (accessed on 6 January 2026).
- Gopchak, I.; Basiuk, T.; Bialyk, I.; Pinchuk, O.; Gerasimov, I. Dynamics of changes in surface water quality indicators of the Western Bug River basin within Ukraine using GIS technologies. J. Water Land Dev. 2019, 42, 67–75. [Google Scholar] [CrossRef] [Scilit]
- Biedunkova, O.; Kuznietsov, P.; Tsos, O.; Boiaryn, M.; Karaim, O. Sustainable Hydrochemical Reference Conditions in the Headwaters of Western Ukraine. Sustainability 2026, 18, 821. [Google Scholar] [CrossRef] [Scilit]
- Quantum GIS. Available online: https://api.qgis.org/api/1.7/index.html (accessed on 6 January 2026).
- CORINE Land Cover. Available online: https://land.copernicus.eu/en/products/corine-land-cover (accessed on 6 January 2026).
- Wu, C.; Wu, X.; Lu, C.; Sun, Q.; He, X.; Yan, L.; Qin, T. Hydrogeochemical Characterization and Its Seasonal Changes of Groundwater Based on Self-Organizing Maps. Water 2021, 13, 3065. [Google Scholar] [CrossRef] [Scilit]
- Timalsina, R.; Acharya, S.; Đurin, B.; Awasthi, M.P.; Pant, R.R.; Joshi, G.R.; Byanju, R.M.; Panthi, K.P.; Joshi, S.; Kumar, A.; et al. An Assessment of Seasonal Water Quality in Phewa Lake, Nepal, by Integrating Geochemical Indices and Statistical Techniques: A Sustainable Approach. Water 2025, 17, 238. [Google Scholar] [CrossRef] [Scilit]
- Biedunkova, O.; Kuznietsov, P.; Korbutiak, V.; Petruk, A.; Gabrielyan, B.; Andreji, J.; Grokhovska, Y.; Konontsev, S. Dominant Meristic Traits of Fish and Their Association with Habitat Water Quality Parameters: A Case Study. Fishes 2025, 10, 561. [Google Scholar] [CrossRef] [Scilit]
- Iannone, A.; Dominech, S.; Zhang, C.; Pacifico, L.R.; De Falco, A.; Albanese, S. Principal Component Analysis to Discriminate and Locate Natural and Anthropogenic Sources of Contamination Within a Strongly Anthropized Region: A Technical Workflow. Environments 2025, 12, 163. [Google Scholar] [CrossRef] [Scilit]
- Kohonen, T. Self-Organizing Maps, 3rd ed.; Springer: Berlin/Heidelberg, Germany, 2001. [Google Scholar] [CrossRef] [Scilit]
- Reusch, D.B.; Alley, R.B.; Hewitson, B.C. North Atlantic climate variability from a self-organizing map perspective. J. Geophys. Res. 2007, 112, D02104. [Google Scholar] [CrossRef] [Scilit]
- Vesanto, J.; Alhoniemi, E. Clustering of the self-organizing map. IEEE Trans. Neural Netw. 2000, 11, 586–600. [Google Scholar] [CrossRef] [Scilit] [PubMed]
- Singha, S.S.; Singha, S.; Kumar, P. Groundwater quality assessment in Nalgonda District, Telangana, India: A comprehensive approach using self organizing map. Discov. Sustain. 2025, 6, 185. [Google Scholar] [CrossRef] [Scilit]
- Yu, L.; Chu, Y.; Zhou, Z.; Zhang, J.; Li, S.; Li, H.; Zhang, Z.; Zhang, F.; Shi, Z. Heavy Metal Source Apportionment, Environmental Capacity, and Health Risk Assessment in Agricultural Soils of a Rice-Growing Watershed in Eastern China. Agriculture 2025, 15, 2275. [Google Scholar] [CrossRef] [Scilit]
- Yang, Z.; Chen, Y.; Guo, D.; Jiao, F.; Zhou, B.; Sun, F. Importance Classification Method for Signalized Intersections Based on the SOM-K-GMM Clustering Algorithm. Sustainability 2025, 17, 2827. [Google Scholar] [CrossRef] [Scilit]
- Mester, T.; Benkhard, B.; Vasvári, M.; Csorba, P.; Kiss, E.; Balla, D.; Fazekas, I.; Csépes, E.; Barkat, A.; Szabó, G. Hydrochemical Assessment of the Kisköre Reservoir (Lake Tisza) and the Impacts of Water Quality on Tourism Development. Water 2023, 15, 1514. [Google Scholar] [CrossRef] [Scilit]
- Ramião, J.P.; Carvalho-Santos, C.; Pinto, R.; Pascoal, C. Modeling the Effectiveness of Sustainable Agricultural Practices in Reducing Sediments and Nutrient Export from a River Basin. Water 2022, 14, 3962. [Google Scholar] [CrossRef] [Scilit]
- Karlsen, C.S.; Flindt, M.R.; Sønderup, M.J.; Madsen, M.H.; Egemose, S. Impact of Land Use and Runoff on Stream Quality. Sustainability 2019, 11, 5479. [Google Scholar] [CrossRef] [Scilit]
- Paná, S.; Gauto, V.H.; Bonansea, M.; Camacho, V.; Asís, I.d.V.; Ferral, A. From Land to Rivers: Exploring Landscape Connectivity and Nutrient Transport in River Basins. Sustainability 2025, 17, 10680. [Google Scholar] [CrossRef] [Scilit]
- Kashirina, E.; Gorbunov, R.; Kerimov, I.; Gorbunova, T.; Drygval, P.; Chuprina, E.; Nikiforova, A.; Lineva, N.; Drygval, A.; Kelip, A.; et al. Spatial Distribution of Geochemical Anomalies in Soils of River Basins of the Northeastern Caucasus. Geosciences 2025, 15, 380. [Google Scholar] [CrossRef] [Scilit]
- Greggio, N.; Giambastiani, B.M.S.; Mollema, P.; Laghi, M.; Capo, D.; Gabbianelli, G.; Antonellini, M.; Dinelli, E. Assessment of the Main Geochemical Processes Affecting Surface Water and Groundwater in a Low-Lying Coastal Area: Implications for Water Management. Water 2020, 12, 1720. [Google Scholar] [CrossRef] [Scilit]
- Xu, X.; Wu, C.; Xie, D.; Ma, J. Sources, Migration, Transformation, and Environmental Effects of Organic Carbon in Eutrophic Lakes: A Critical Review. Int. J. Environ. Res. Public Health 2023, 20, 860. [Google Scholar] [CrossRef] [Scilit] [PubMed]
- Osafo, N.O.A.; Jan, J.; Valero, A.; Porcal, P.; Petrash, D.A.; Borovec, J. Organic matter character as a critical factor determining the fate and stability of its association with iron in sediments. J. Soils Sediments 2022, 22, 1865–1875. [Google Scholar] [CrossRef] [Scilit]
- Jargal, N.; Atique, U.; Mamun, M.; An, K.-G. Seasonal and Long-Term Connections between Trophic Status, Sestonic Chlorophyll, Nutrients, Organic Matter, and Monsoon Rainfall in a Multipurpose Reservoir. Water 2021, 13, 1720. [Google Scholar] [CrossRef] [Scilit]
- Jiann, K.T.; Santschi, P.H.; Presley, B.J. Relationships Between Geochemical Parameters (pH, DOC, SPM, EDTA Concentrations) and Trace Metal (Cd, Co, Cu, Fe, Mn, Ni, Pb, Zn) Concentrations in River Waters of Texas (USA). Aquat. Geochem. 2013, 19, 173–193. [Google Scholar] [CrossRef] [Scilit]
- Chen, Y.; Wang, L.; Liang, T.; Xiao, J.; Li, J.; Wei, H.; Dong, L. Major ion and dissolved heavy metal geochemistry, distribution, and relationship in the overlying water of Dongting Lake, China. Env. Geochem Health 2019, 41, 1091–1104. [Google Scholar] [CrossRef] [Scilit]
- Safeeq, M.; Fares, A. Groundwater and Surface Water Interactions in Relation to Natural and Anthropogenic Environmental Changes. In Emerging Issues in Groundwater Resources; Fares, A., Ed.; Advances in Water Security; Springer: Cham, Switzerland, 2016. [Google Scholar] [CrossRef] [Scilit]
- Furgała-Selezniow, G.; Jankun-Woźnicka, M.; Kruk, M.; Omelan, A.A. Land Use and Land Cover Pattern as a Measure of Tourism Impact on a Lakeshore Zone. Land 2021, 10, 787. [Google Scholar] [CrossRef] [Scilit]
- Parastatidou, E.; Ntona, M.M.; Kazakis, N.; Pliakas, F.-K. Coupling Driving Force–Pressure–State–Impact–Response–Management Framework with Hydrochemical Data for Groundwater Management on Sithonia Peninsula, Greece. Geosciences 2025, 15, 24. [Google Scholar] [CrossRef] [Scilit]
- Gaur, M.L. Catchment Scale Forest-Water Interfaces for Pollution Management. In Water Quality, Assessment and Management in India; Yadav, S., Negm, A.M., Yadava, R.N., Eds.; Earth and Environmental Sciences Library; Springer: Cham, Switzerland, 2022. [Google Scholar] [CrossRef] [Scilit]
- Oyarzún, C.E.; Godoy, R.; De Schrijver, A.; Staelens, J.; Lust, N. Water chemistry and nutrient budgets in an undisturbed evergreen rainforest of southern Chile. Biogeochemistry 2004, 71, 107–123. [Google Scholar] [CrossRef] [Scilit]
- Patel, P.; Raju, N.J.; Reddy, B.C.S.R.; Suresh, U.; Gossel, W.; Wycisk, P. Geochemical processes and multivariate statistical analysis for the assessment of groundwater quality in the Swarnamukhi River basin, Andhra Pradesh, India. Environ. Earth Sci. 2016, 75, 611. [Google Scholar] [CrossRef] [Scilit]
- Nekos, A.; Boiaryn, M.; Lugowska, M.; Tsos, O.; Netrobchuk, I. Assessment of the ecological condition of the Western Bug river basin according to the macrophyte index for rivers (MIR). Visnyk V. N. Karazin Kharkiv Natl. Univ. Ser. Geol. Geogr. Ecol. 2021, 54, 316–328. [Google Scholar] [CrossRef] [Scilit]
- Stathi, E.; Kastridis, A.; Myronidis, D. A Methodological Approach (TOPSIS) to Water Management in Water-Scarce Areas Under Climate Variability Conditions. Climate 2025, 13, 78. [Google Scholar] [CrossRef] [Scilit]
- Pereira, A.C.; Mulligan, C.N. Practices for Eutrophic Shallow Lake Water Remediation and Restoration: A Critical Literature Review. Water 2023, 15, 2270. [Google Scholar] [CrossRef] [Scilit]
- Zhang, K.; Li, T.; Chai, Y.; Dai, B.; Pan, Q.; Wu, J.; Zhou, Q.; Zhao, L.; Huang, Y. Internal Cycling Influences Nutrient Changes Leading to Altered Nutrient Limitation in Eutrophic Lake. Water 2025, 17, 2604. [Google Scholar] [CrossRef] [Scilit]
- Natarajan, S.; Mohan, K. Integrated Assessment of Groundwater Quality and Recharge Potential for Sustainable Water Resource Management using Hydrogeochemical Analysis, GIS And AHP Techniques. Water Air Soil Pollut. 2026, 237, 404. [Google Scholar] [CrossRef] [Scilit]
- Dahlab, S.; Derhab, N.; Elkhwesky, Z.; Rahmoune, H.; Daru, G.R.; Yuqin, Z. Water quality in northeastern algeria: Empirical investigations utilizing the water quality index alongside principal component analysis. Euro-Mediterr J. Environ. Integr. 2026, 11, 65. [Google Scholar] [CrossRef] [Scilit]
- Granata, F.; Di Nunno, F. Pathways for Hydrological Resilience: Strategies for Adaptation in a Changing Climate. Earth Syst. Environ. 2026, 10, 203–231. [Google Scholar] [CrossRef] [Scilit]
- Shah, N.W.; Baillie, B.R.; Bishop, K.; Ferraz, S.; Högbom, L.; Nettles, J. The effects of forest management on water quality. For. Ecol. Manag. 2022, 522, 120397. [Google Scholar] [CrossRef] [Scilit]
- Klimaszyk, P.; Rzymski, P.; Piotrowicz, R.; Joniak, T. Contribution of surface runoff from forested areas to the chemistry of a through-flow lake. Environ. Earth Sci. 2014, 73, 3963–3973. [Google Scholar] [CrossRef] [Scilit]
- Kuznietsov, P.; Biedunkova, O. Evaluating the impact of dispersed particles in the water of a power plant recirculating cooling system on the discharge of suspended solids into a natural water body. East. Eur. J. Enterp. Technol. 2023, 6, 6–16. [Google Scholar] [CrossRef] [Scilit]
- Kuznietsov, P.M.; Biedunkova, O.O. The formation of the carbonate system of circulating cooling water of the Rivne NPP and its influence on changes in the surface waters pH levels of the Styr river. IOP Conf. Ser. Earth Environ. Sci. 2023, 1254, 012102. [Google Scholar] [CrossRef] [Scilit]
- Kuznietsov, P.M.; Biedunkova, O.O. Technological and Environmental Problems in the Stabilization Treatment of the Main Condenser Cooling Circuit by Sulfuric Acid. J. Eng. Sci. 2023, 10, H1–H8. [Google Scholar] [CrossRef] [Scilit]
- Kuznietsov, P.; Biedunkova, O. Multivariate regression studies for the investigation of the COD, BOD, and TOC concentrations in the water of the Styr River within the zone of influence of the power plant discharge. Water Pract. Technol. 2024, 19, 1412. [Google Scholar] [CrossRef] [Scilit]
- Biedunkova, O.; Kuznietsov, P. Investigation of the formation and variability of dissolved inorganic carbon and dissolved organic carbon in the water of a small river (on the example of the Styr River, Ukraine). Environ. Monit. Assess. 2024, 196, 1115. [Google Scholar] [CrossRef] [Scilit] [PubMed]
- Klimov, S.; Pinchuk, O.; Kunytskiy, S.; Klimova, A. Limiting horizontal water filtration using drainage-screened modules. J. Water Land Dev. 2019, 43, 90–95. [Google Scholar] [CrossRef] [Scilit]
- Debnath, P.; Biswas, A.; Chaudhuri, P.; Mitra, S. Assessment of hydro-chemical characteristics and pollution status in Rudrasagar Lake ecosystem integrating pollution indices and geospatial techniques: A framework for sustainable wetland management. Clean. Water 2025, 4, 100142. [Google Scholar] [CrossRef] [Scilit]
- Wu, Y.; Wang, Z.; Xu, L.; Feng, W.; Fan, H. Temporal responses of hydrochemical variables and dissolved Fe(II) to flooding at a lake riparian wetland under different vegetation revealed by high-resolution DGT. J. Environ. Manag. 2021, 294, 112930. [Google Scholar] [CrossRef] [Scilit]
- Sun, X.; Cheruvelil, K.S.; Hanly, P.J.; Webster, K.E.; Soranno, P.A. Interactions between human activities and natural processes shape specific conductance and ion composition of United States lakes. Water Res. 2026, 294, 125486. [Google Scholar] [CrossRef] [Scilit]
- Chen, C.; Xie, M.; Du, Y.; Jia, B. Impact of urbanization on hydrological balance in urban lakes: A case study of Dianchi Lake. Discov. Appl. Sci. 2025, 7, 5. [Google Scholar] [CrossRef] [Scilit]
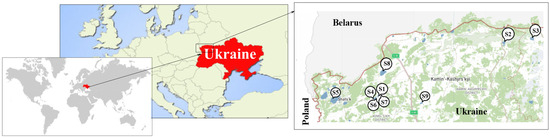
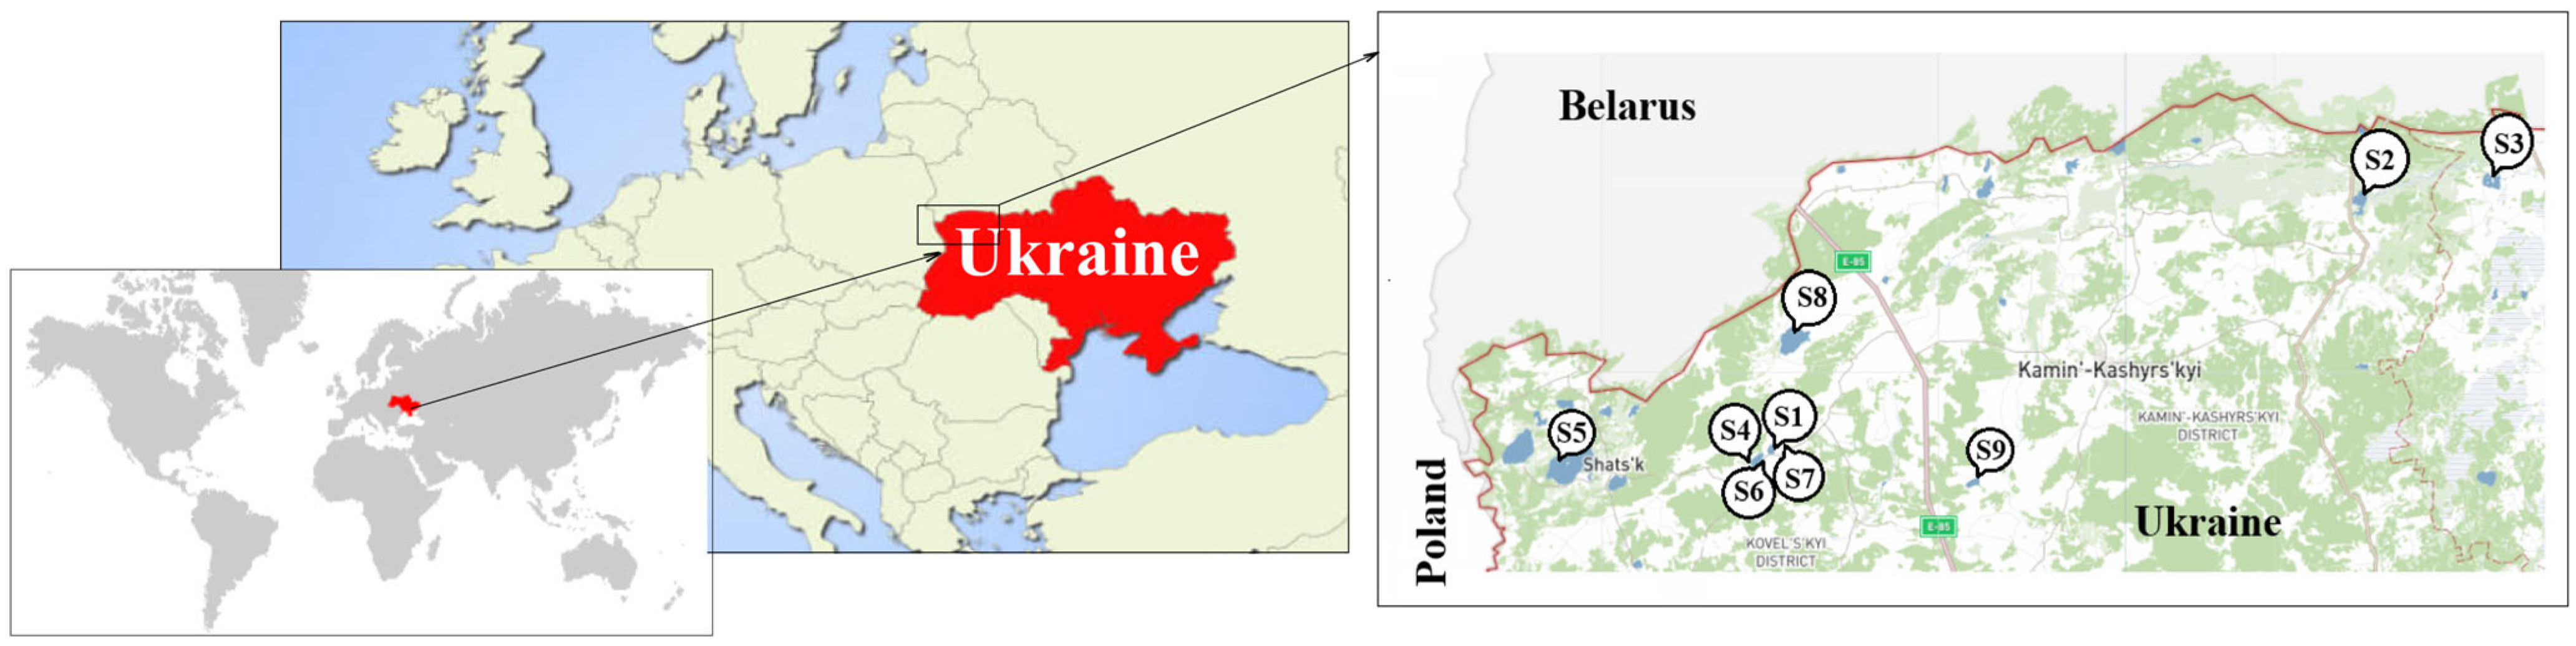
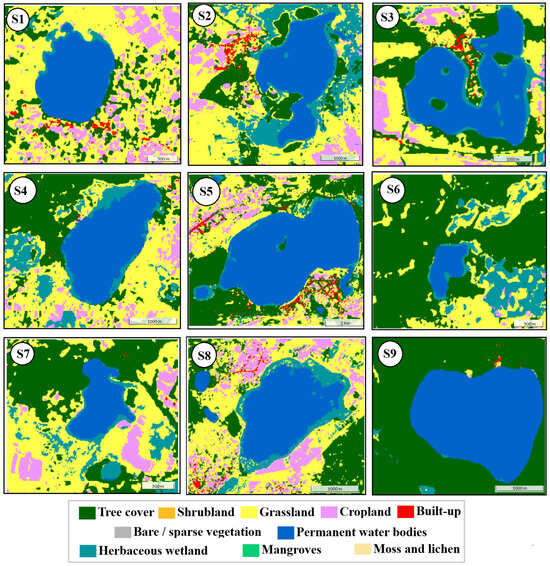
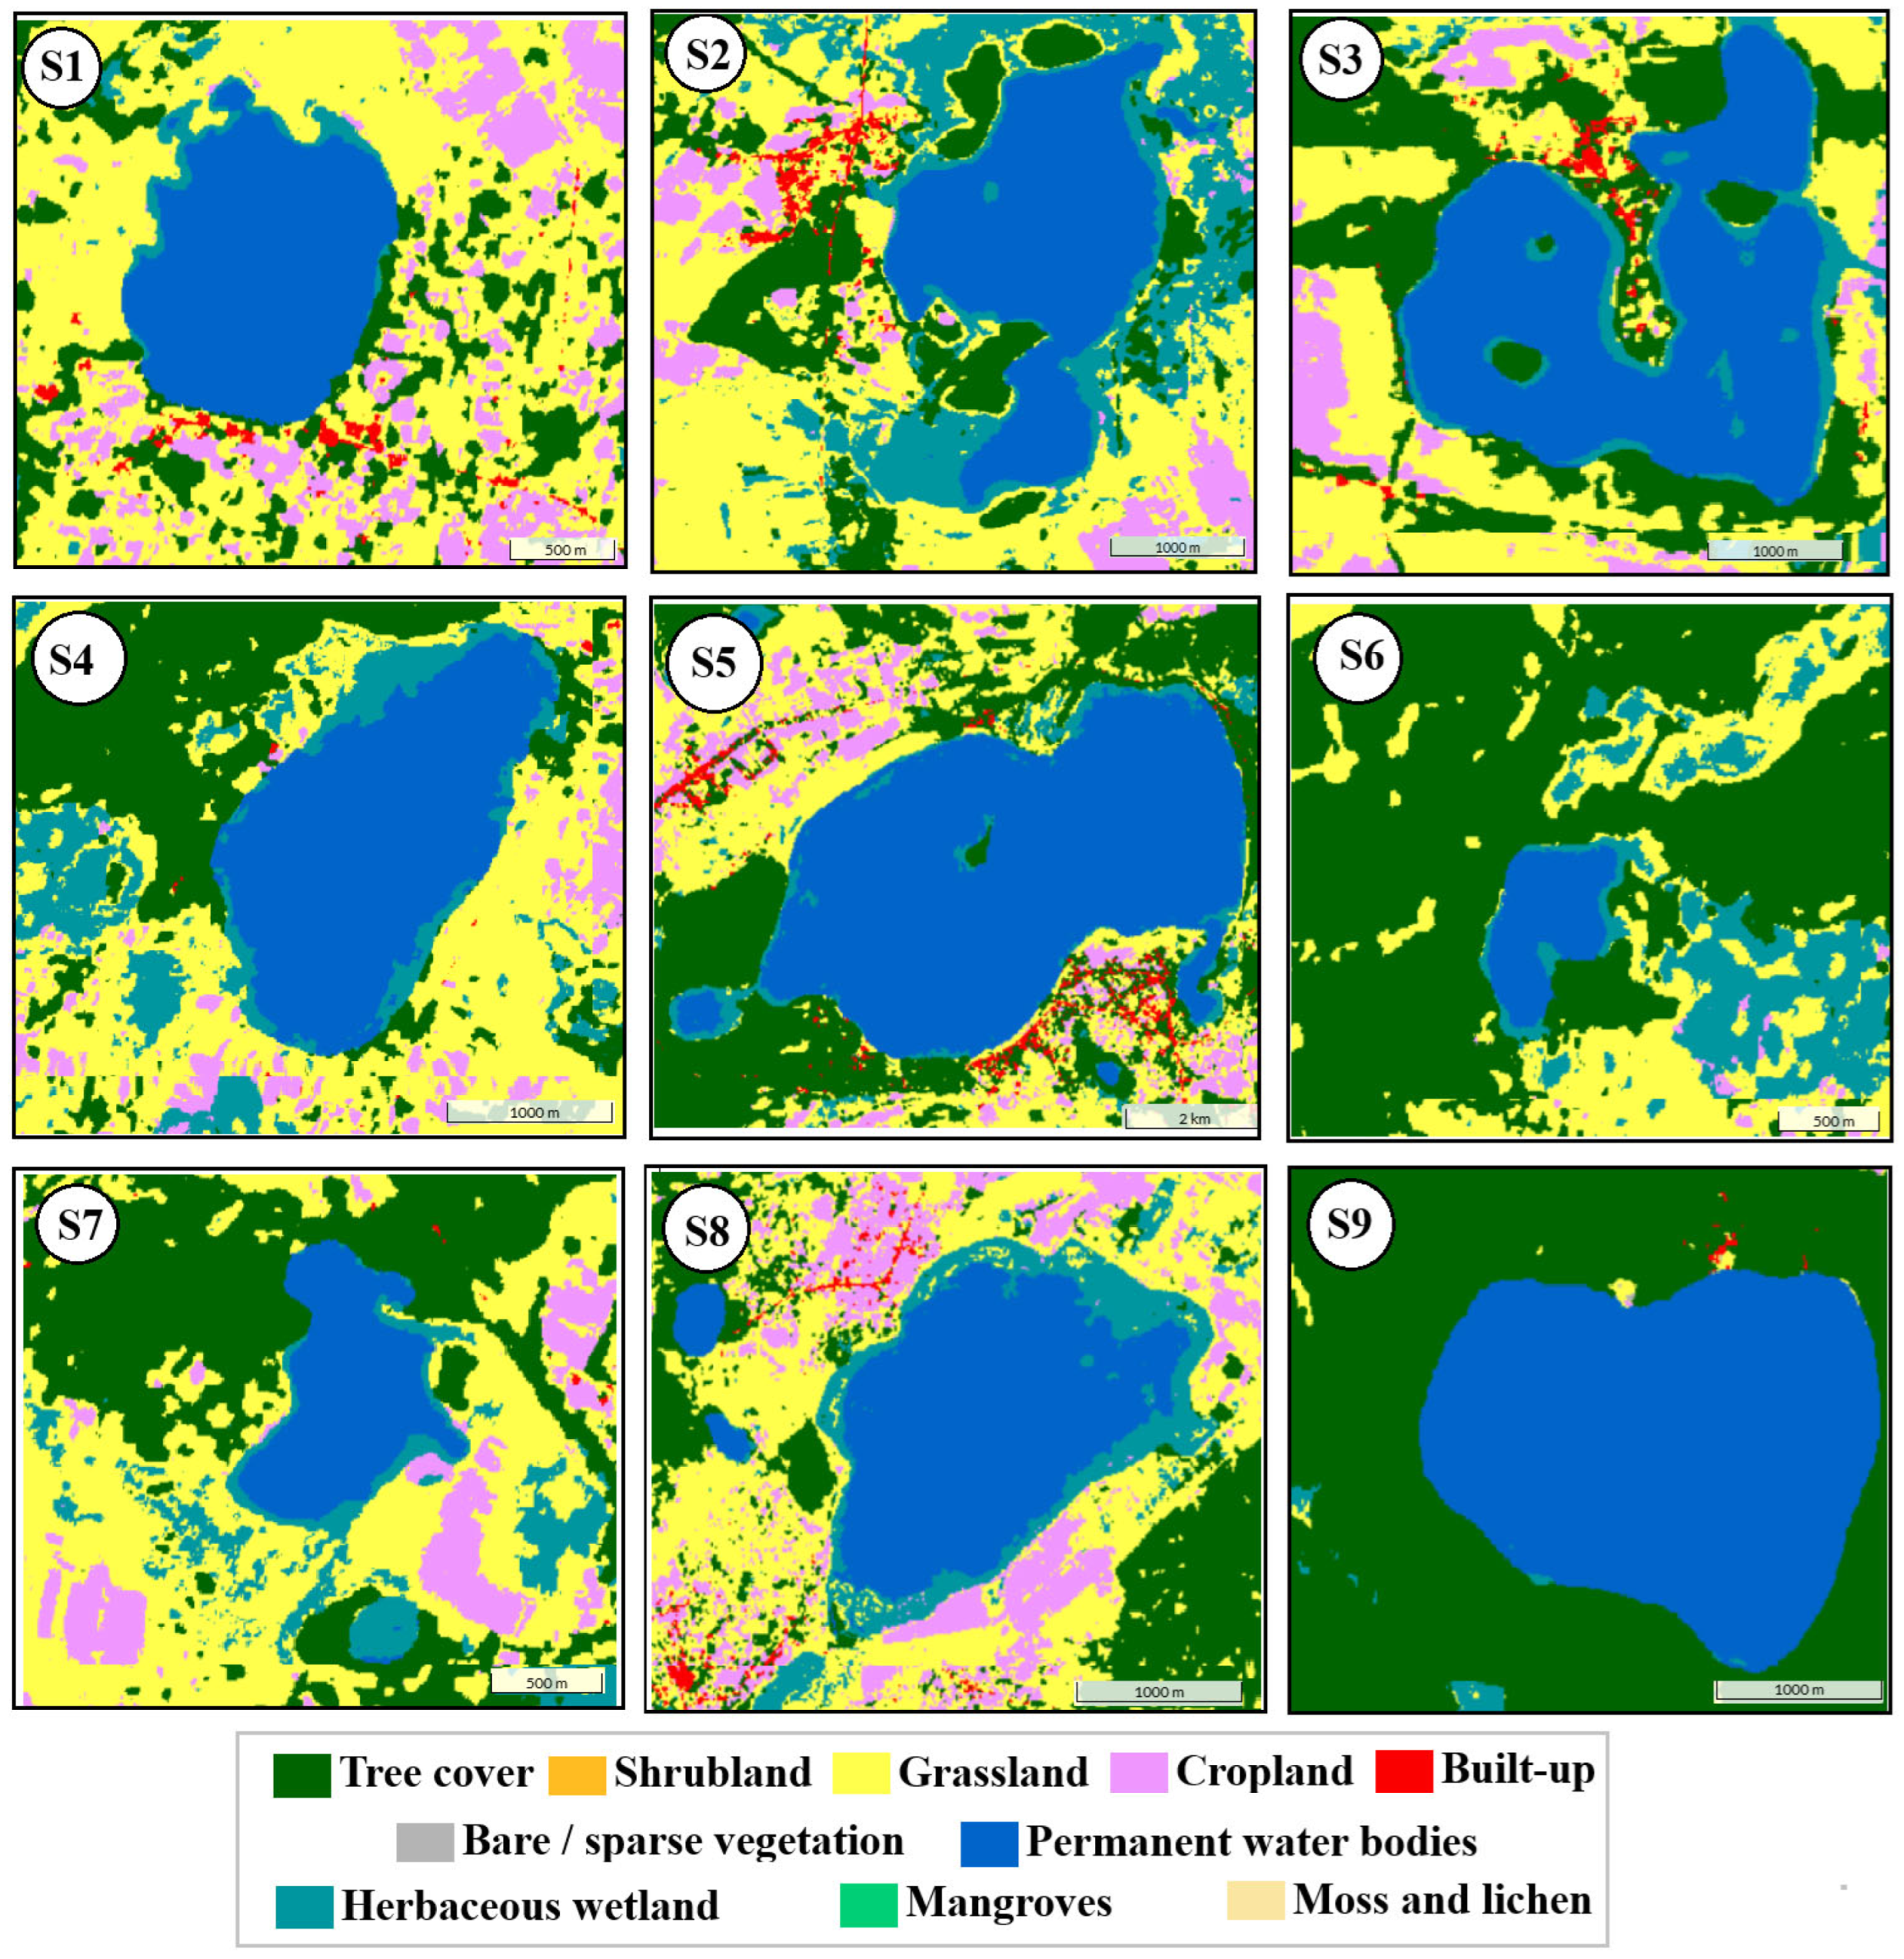
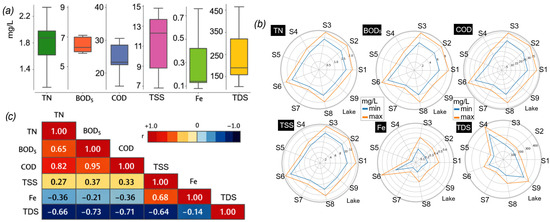
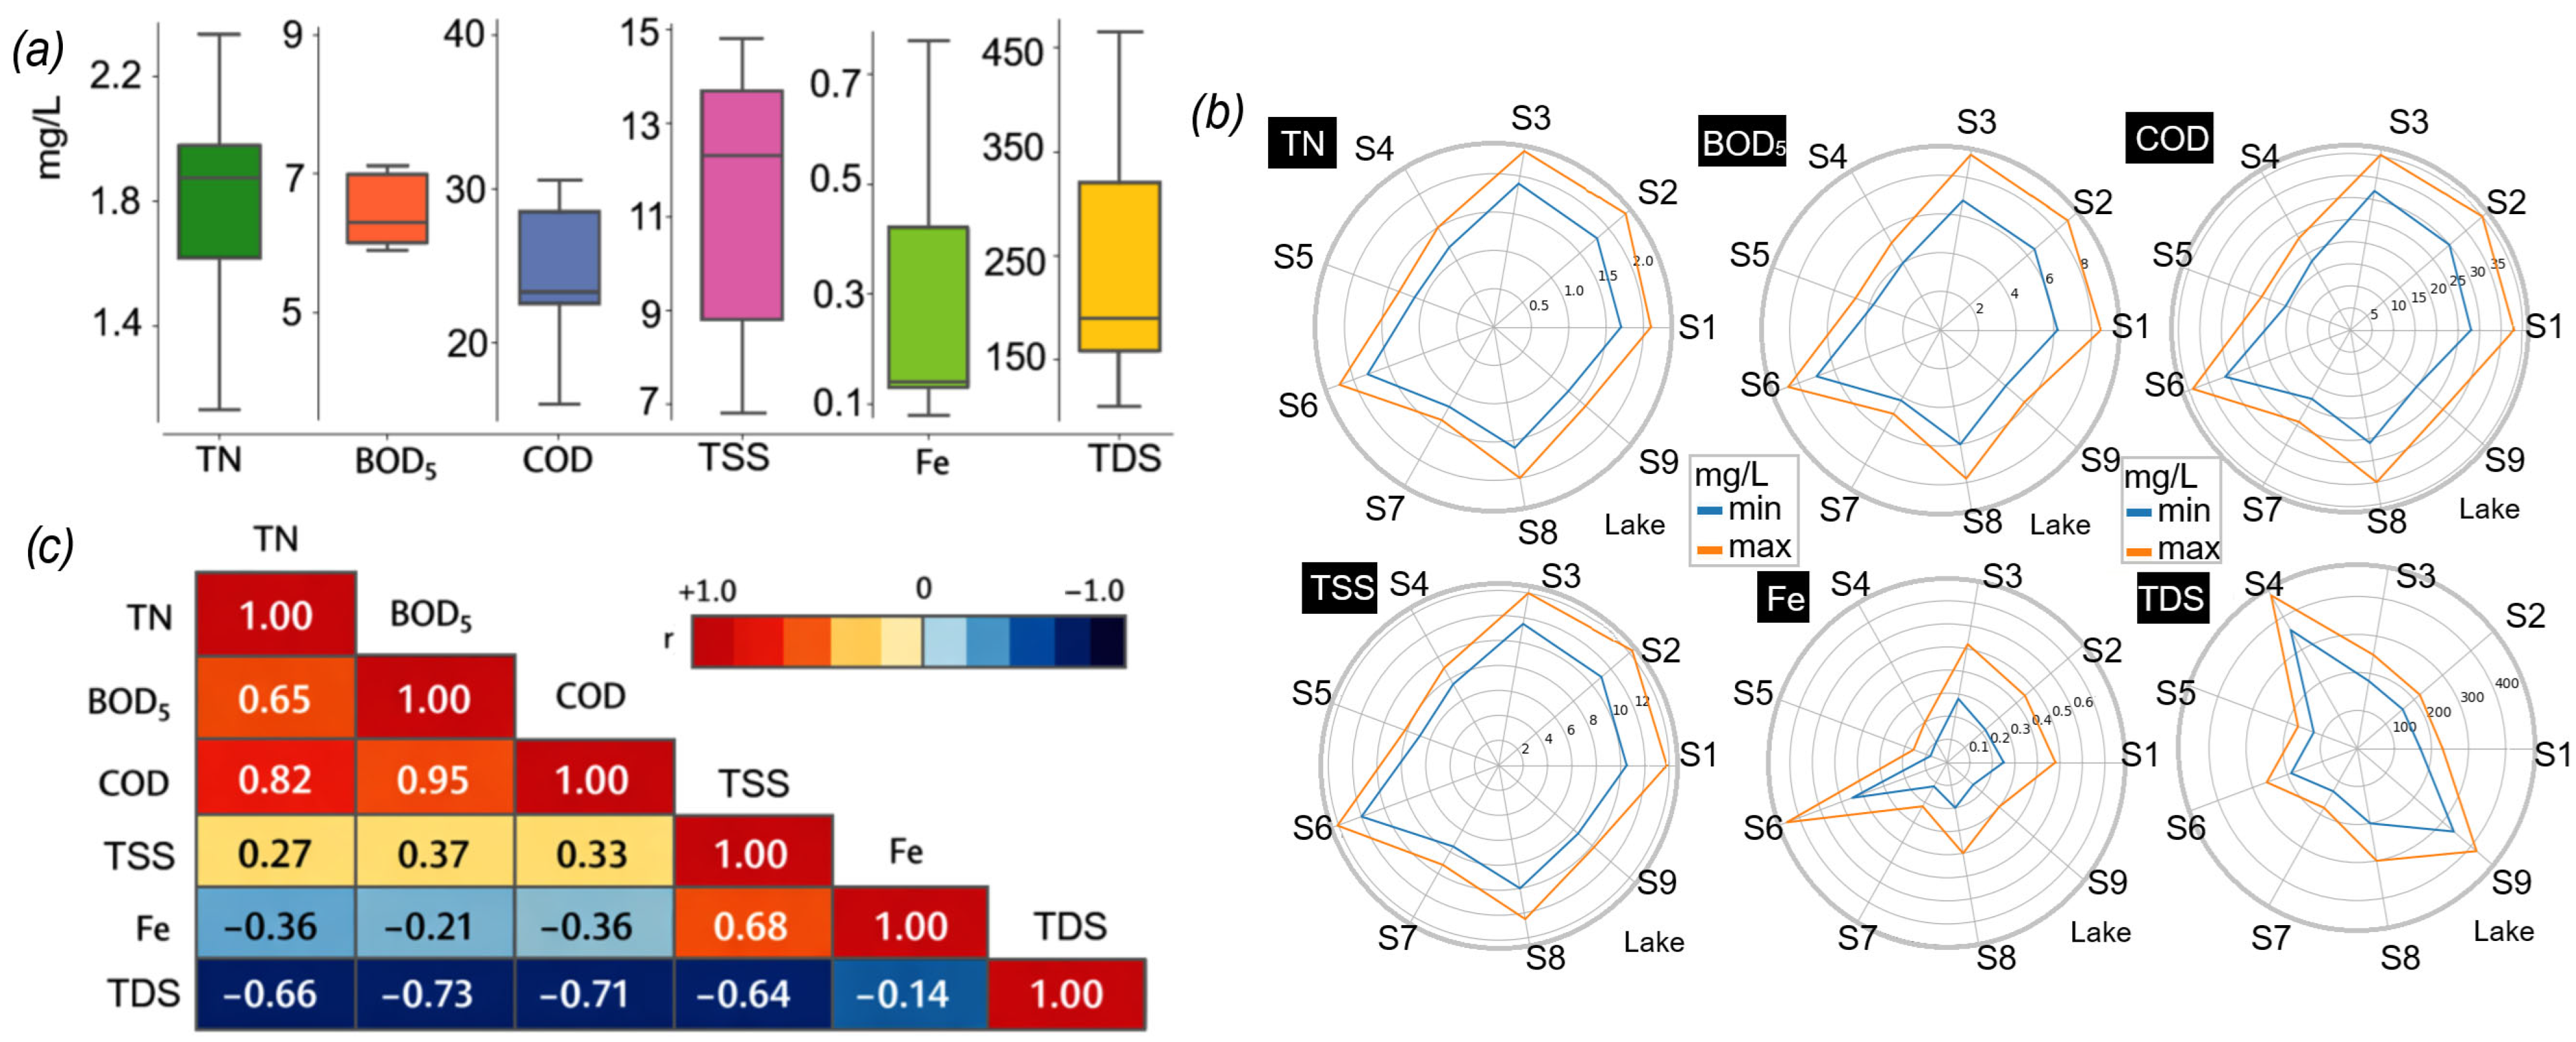
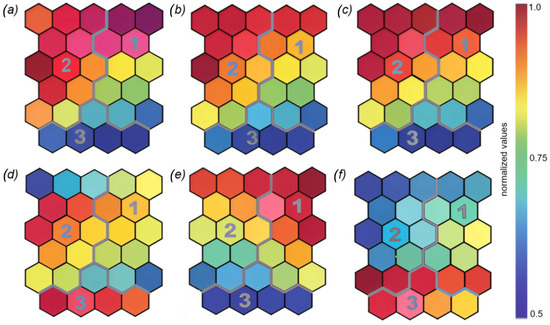
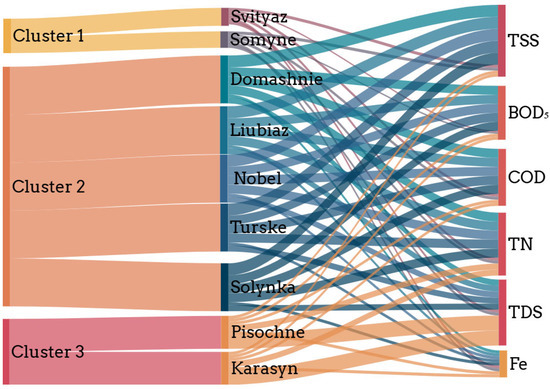
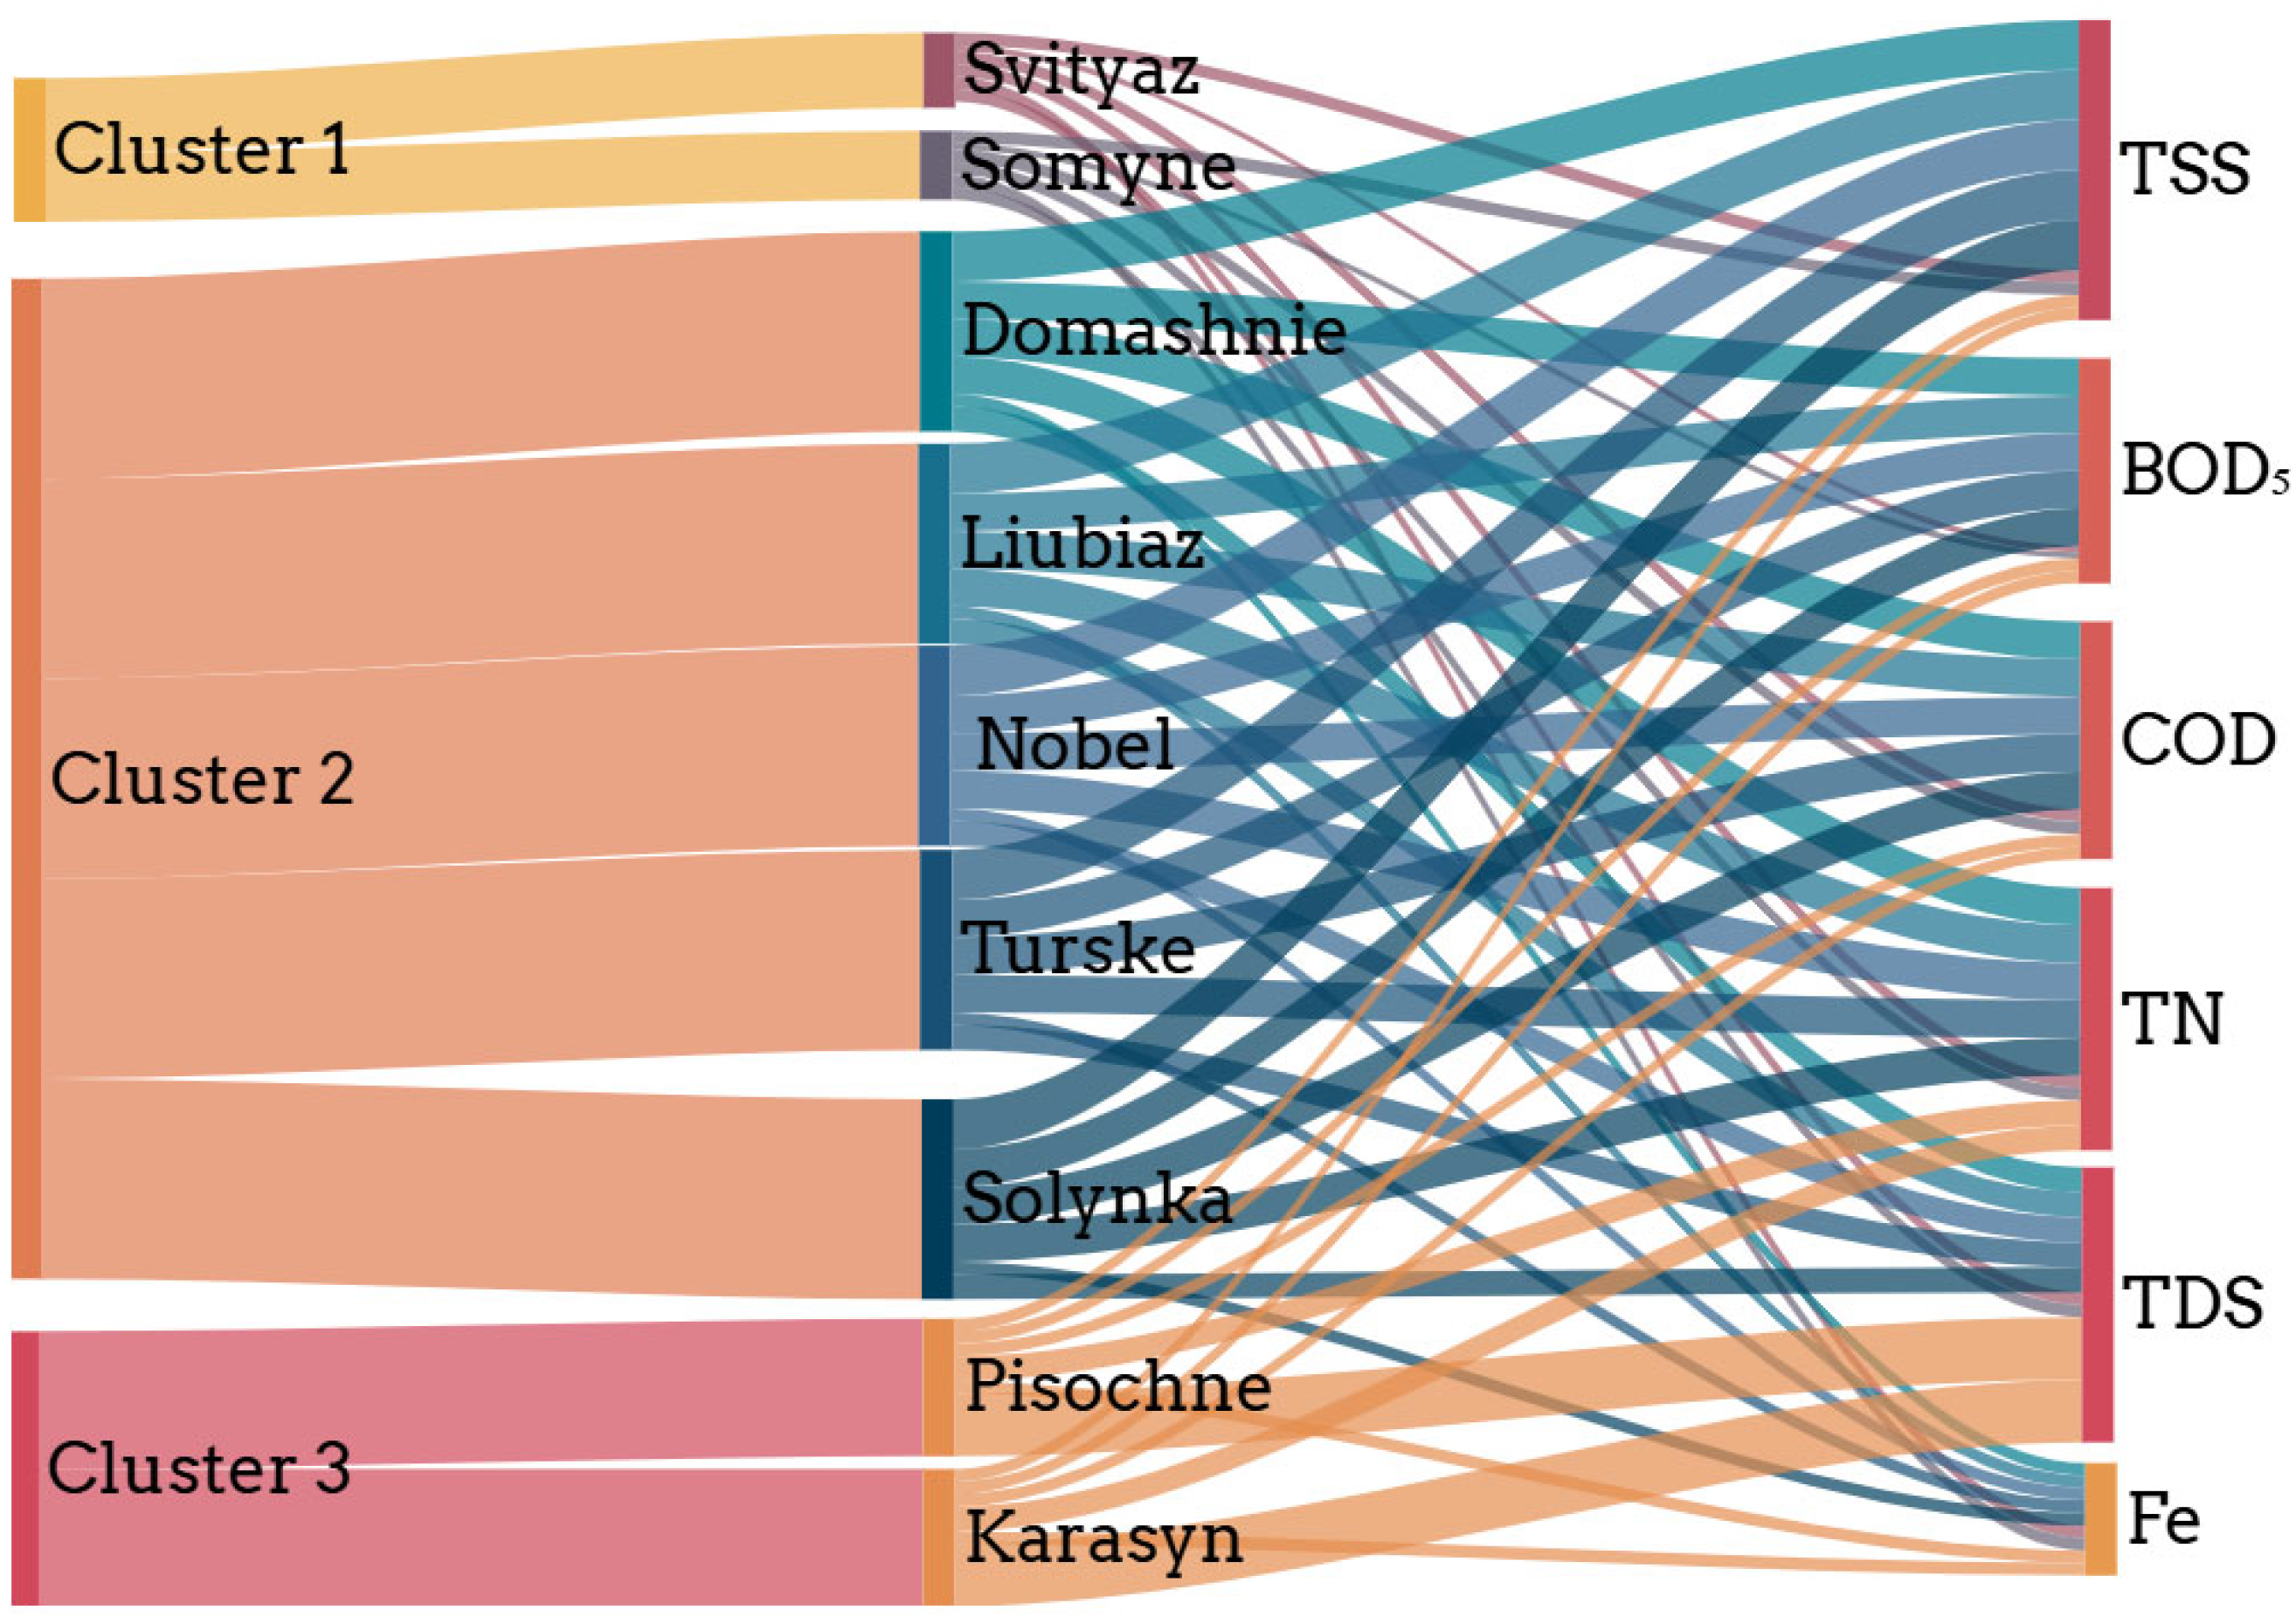
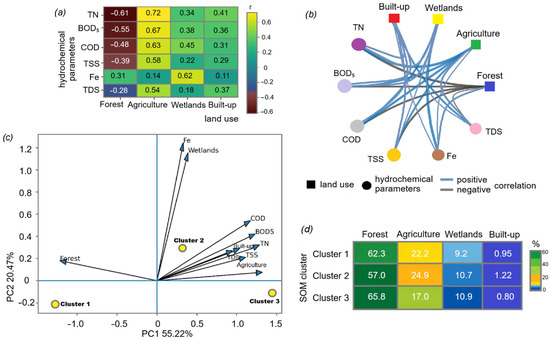
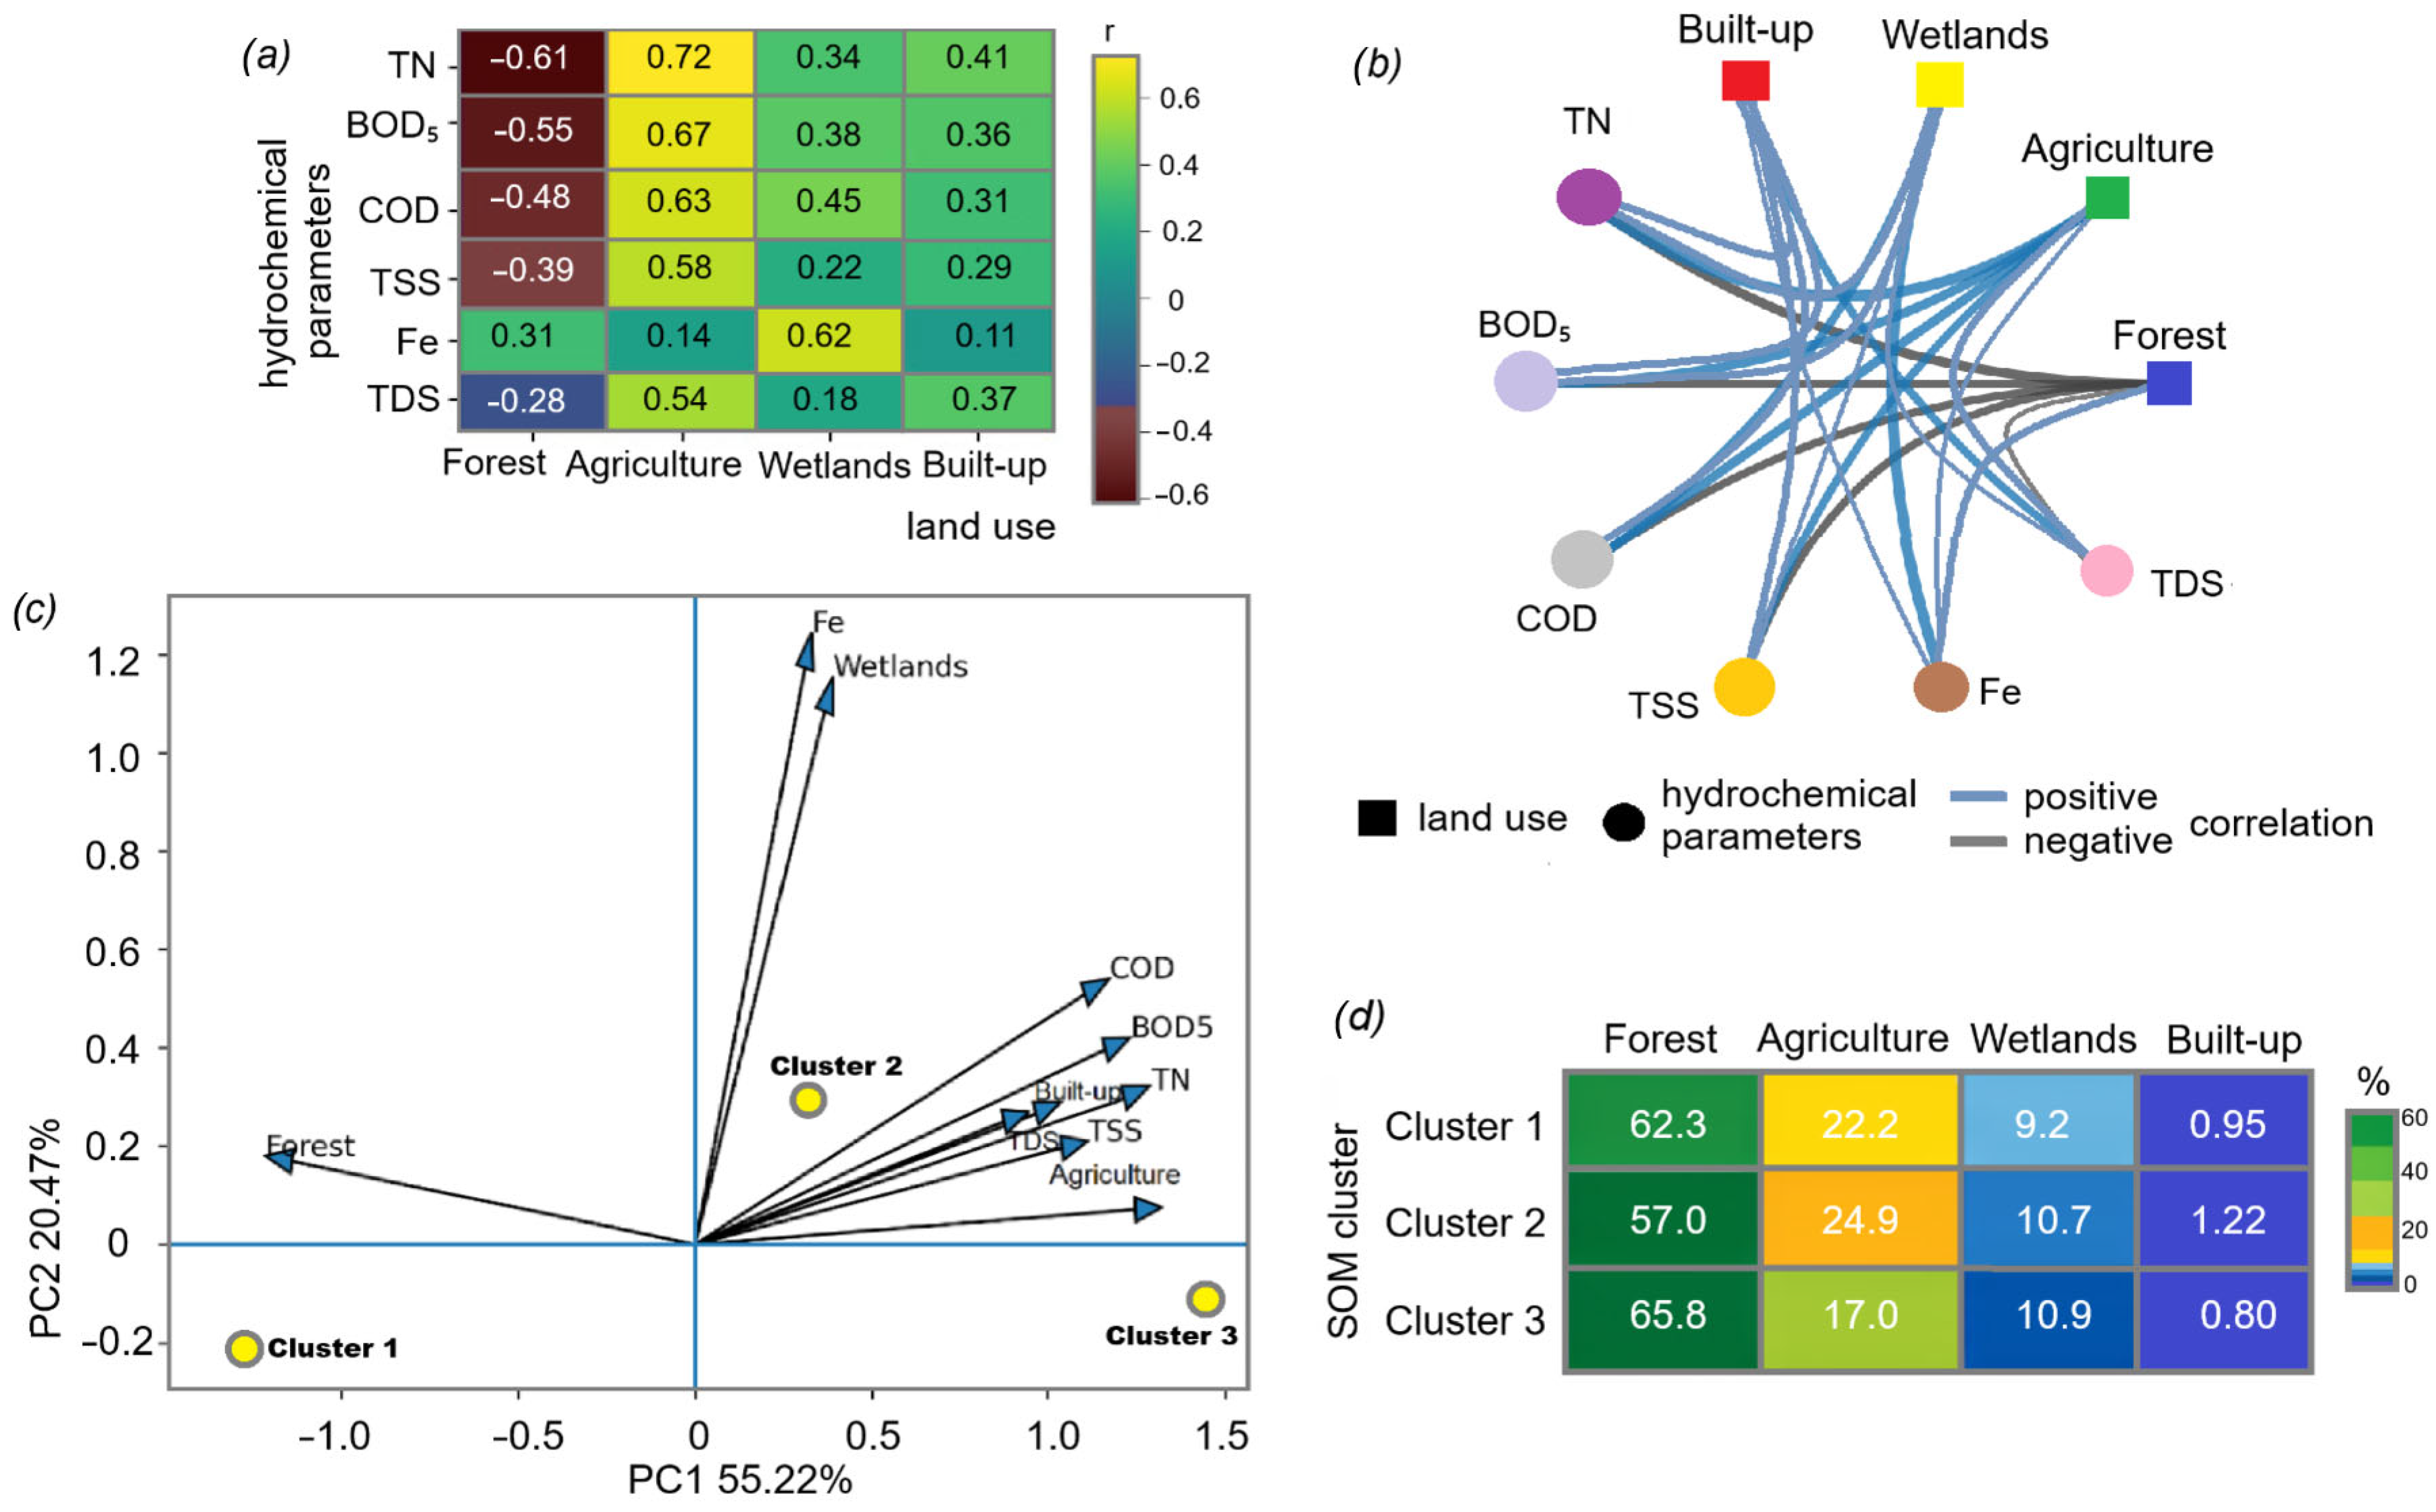
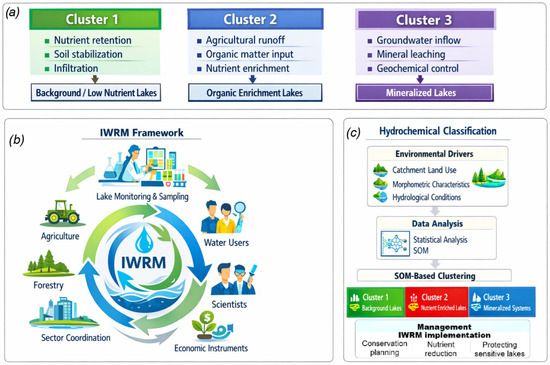
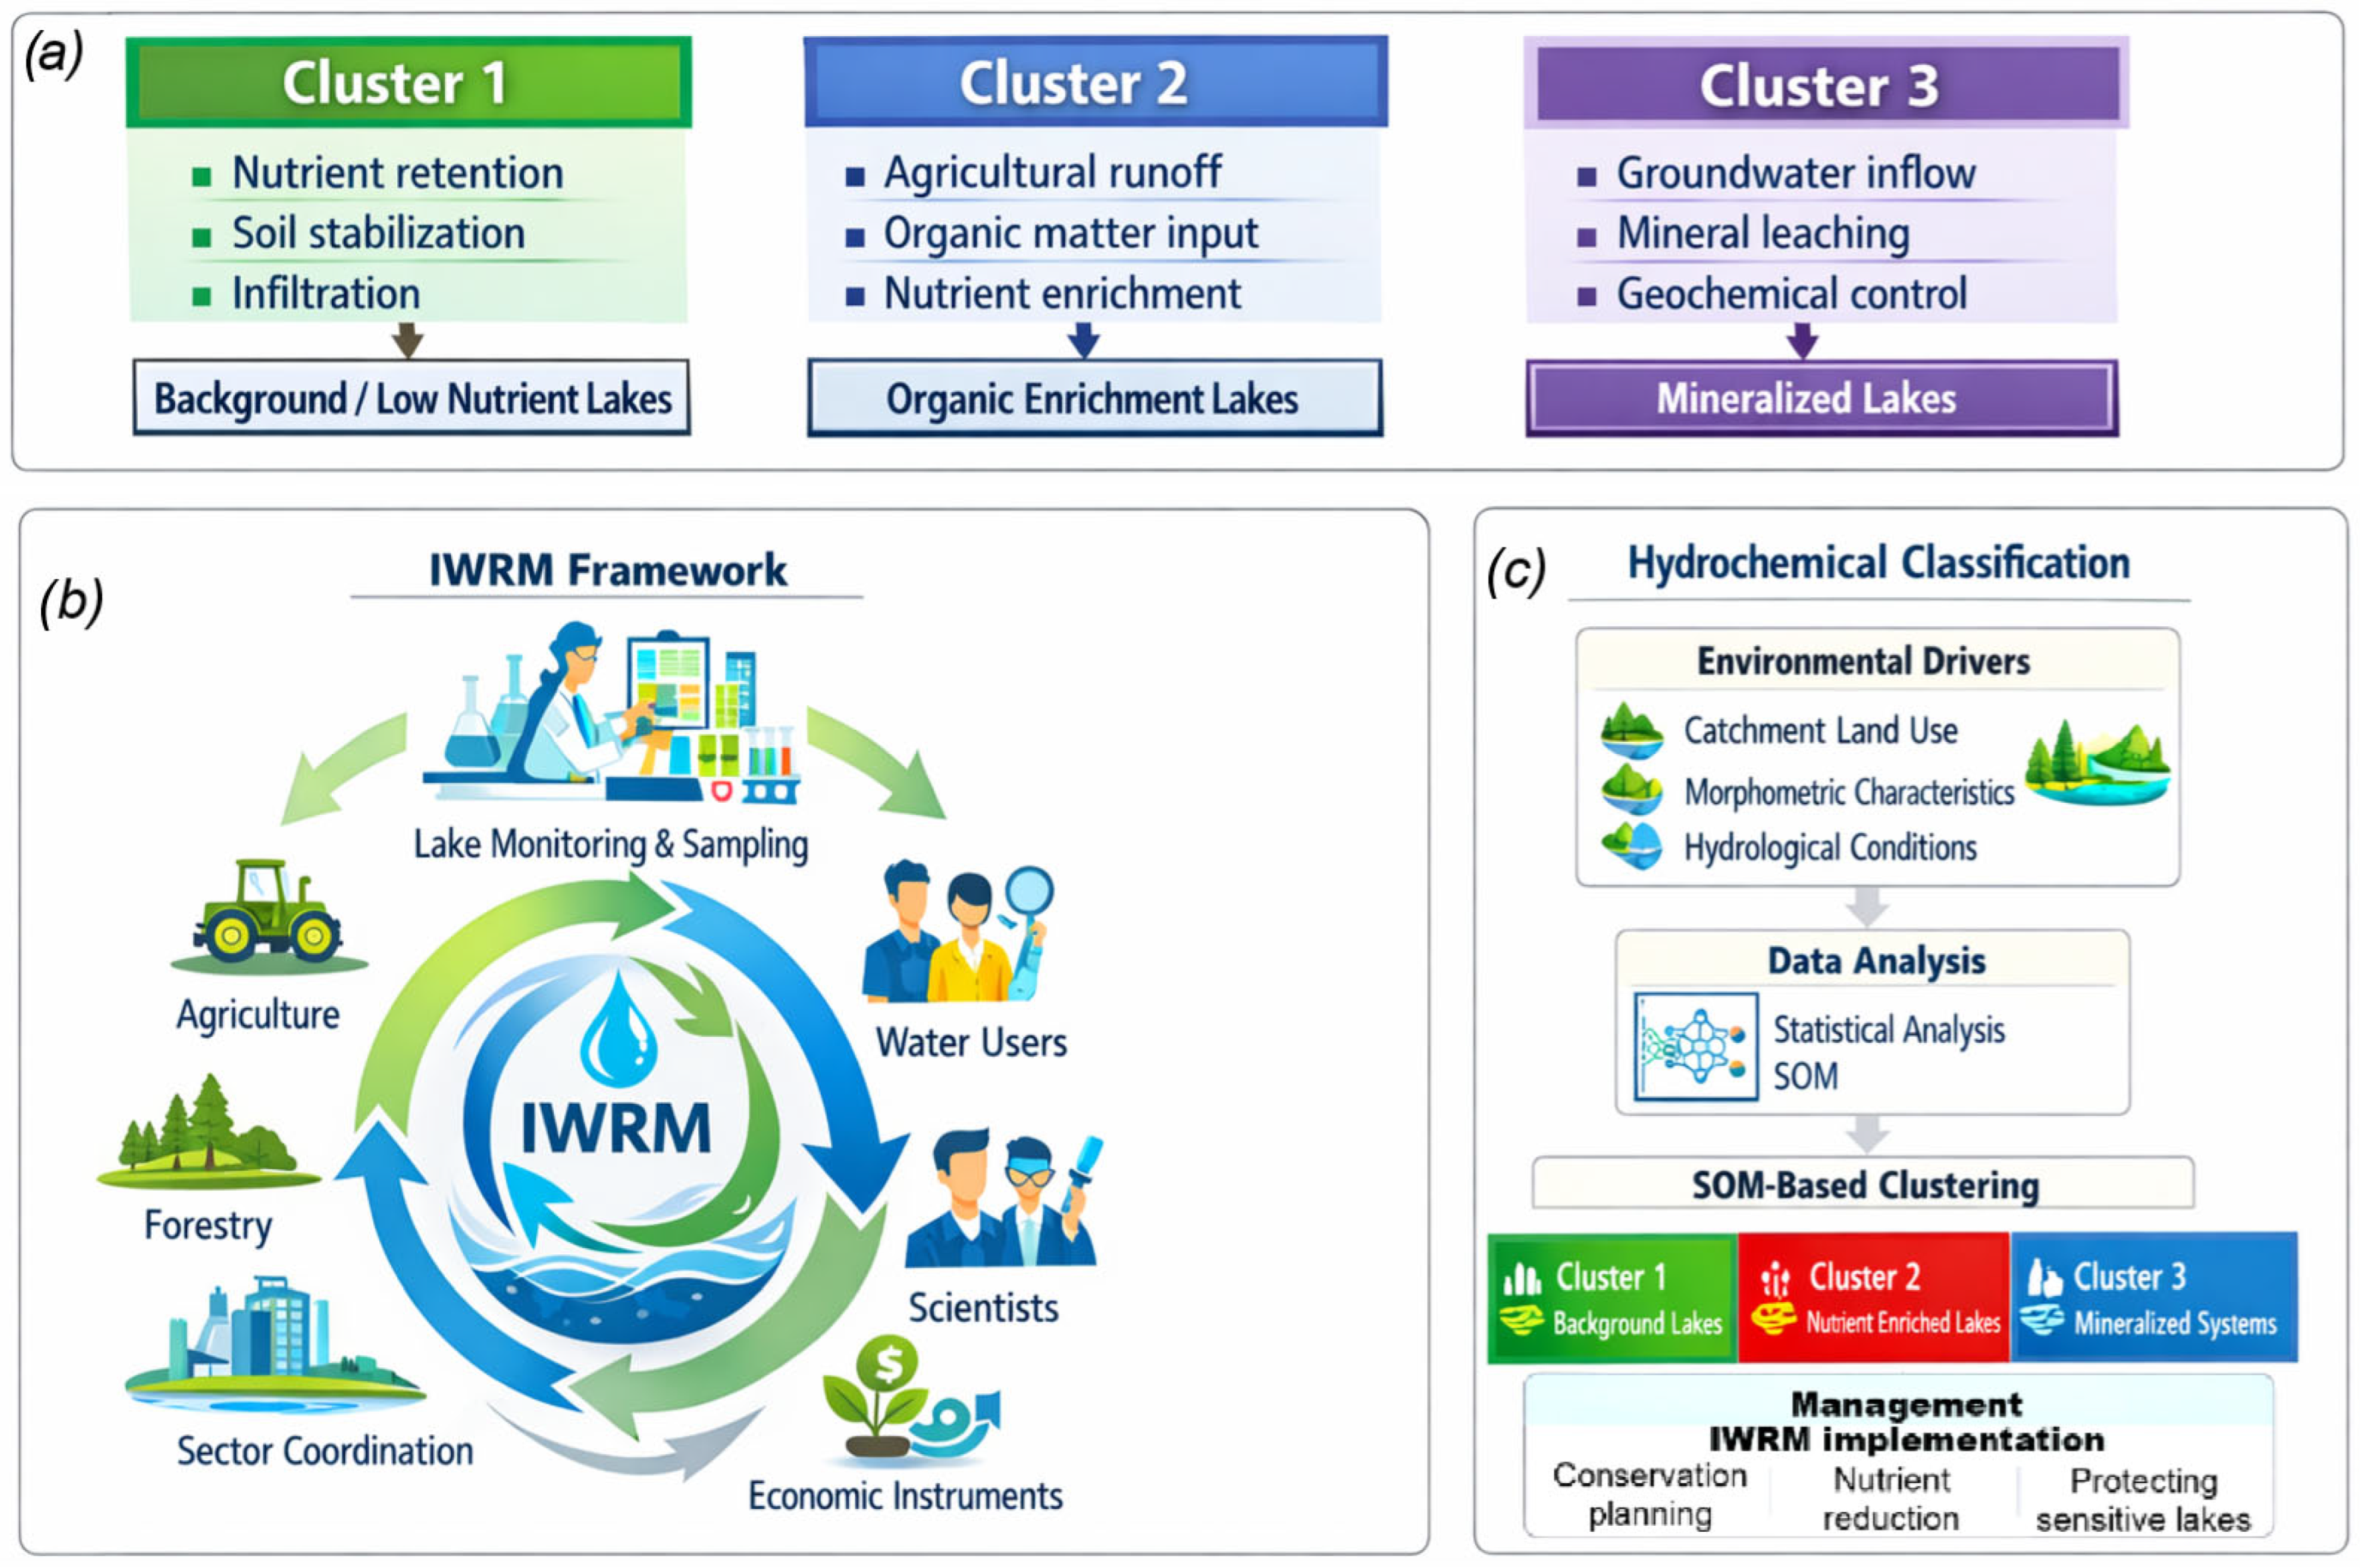

Disclaimer/Publisher’s Note: The statements, opinions and data contained in all publications are solely those of the individual author(s) and contributor(s) and not of MDPI and/or the editor(s). MDPI and/or the editor(s) disclaim responsibility for any injury to people or property resulting from any ideas, methods, instructions or products referred to in the content. |
© 2026 by the authors. Licensee MDPI, Basel, Switzerland. This article is an open access article distributed under the terms and conditions of the Creative Commons Attribution (CC BY) license.