Article

Overestimation Risk in River-Lake Health Assessment: Dual Uncertainty (Indicator-Weight) Perspective

1
Poyang Lake Hydrology and Water Resources Monitoring Center, Nanchang 330000, China
2
Jiangxi Provincial Hydrological Monitoring Center, Nanchang 330000, China
*
Author to whom correspondence should be addressed.
Water 2026, 18(13), 1590; https://doi.org/10.3390/w18131590
Submission received: 8 December 2025 / Revised: 12 June 2026 / Accepted: 17 June 2026 / Published: 30 June 2026

Abstract

River-lake health assessment is critical for ecological governance, but overestimation risk induced by dual uncertainties (predictive uncertainty of indicator values and methodological uncertainty of weights) compromises the reliability of assessment results and governance decisions. To address this gap, this study proposes a general risk analysis framework integrating dual uncertainty quantification and overestimation risk coupling. First, a multi-dimensional assessment system with 12 key indicators (covering hydrology, water quality, aquatic biology, and social services) was established via Meta-analysis and quantitative screening. For uncertainty quantification: the Physics-Informed Neural Networks (PINN) model was used to characterize indicator value uncertainty based on 1264 historical monitoring samples; four complementary weighting methods (AHP, EWM, CRITIC, PCA) were integrated with a game theory-based framework (Nash equilibrium) to resolve weight conflicts, and weight uncertainty was quantified via normal distribution assumption (mean = coordinated weight, standard deviation = 1/10 of mean). The First-Order Second-Moment (FOSM) method was then adopted to establish a coupled “dual uncertainties-overestimation risk” model, quantifying the probability and magnitude of overestimation risk. Validated in Poyang Lake (China’s largest freshwater lake), results identified total phosphorus (TP), total nitrogen (TN), and Fish Biological Loss Index (FBLI) as high-risk indicators, with maximum allowable thresholds of 5.10–7.40, 7.04–9.38, and 6.05–9.02 across risk levels (1–50%), respectively. The comprehensive overestimation risk score ranged from 74.16 to 81.17, providing actionable thresholds for governance. This framework systematically addresses the insufficient consideration of dual uncertainties in existing studies, offering a scientific and operable tool for improving the reliability of river-lake health assessment and supporting targeted ecological protection decisions globally.

1. Introduction

River-lake ecosystems are core carriers sustaining global hydrological cycles and ecological balance, playing irreplaceable strategic roles in regulating regional climate, ensuring water security, preserving biodiversity, and supporting socio-economic sustainable development [1,2,3]. As a core technical support for ecological governance, river-lake health assessment systematically characterizes the structural integrity and functional stability of ecosystems through scientific indicator systems and evaluation methods [4]. It provides targeted technical basis for accurately identifying ecological risks and formulating governance policies, with the reliability of its results directly influencing the rational allocation of ecological protection resources and the effectiveness of management measures [5]. However, in practical assessment processes, affected by data availability and methodological limitations, most existing studies adopt multi-year averages or single-period measured values for indicator prediction, which tends to generate optimistic predicted values; meanwhile, weighting methods often prioritize indicators that directly reflect health status, leading to weight allocation that may amplify the optimistic tendency [6,7,8]. Under this common tendency, the coupling of indicator prediction deviation and weight dispute will highly likely cause overestimation risk, which has become a common issue in current river-lake health assessment. This may lead to overestimation of the actual health level of ecosystems, further resulting in inadequate targeting of governance measures and failure of ecological risk prevention, threatening the long-term sustainable operation of river-lake systems. Therefore, constructing a risk analysis framework for river-lake health assessment that considers multiple uncertainties, and quantifying the probability and deviation degree of overestimation risk, holds significant theoretical value and practical significance for improving the scientificity of assessment results and enhancing the effectiveness of ecological governance decisions.
The global academic community has conducted extensive systematic research on river-lake health assessment, promoting the field’s continuous evolution from single-dimensional description to multi-dimensional, refined evaluation [9]. In terms of indicator system construction, research has evolved from early single-dimensional evaluation focusing on water quality physicochemical indicators (e.g., dissolved oxygen, chemical oxygen demand) to comprehensive frameworks integrating natural and social dimensions [10,11,12]. Representative systems such as the River and Lake Health Assessment Guidelines (EPA) and the “River Health Index” (Australia) have been developed globally, while researchers have also constructed evaluation systems tailored to the ecological characteristics of river-lakes in different regions by integrating multiple indicators including hydrology, water quality, biology, landscape, and social services [13,14,15]. The core idea is to improve the comprehensiveness and representativeness of evaluation by fully covering key ecosystem processes. In terms of indicator weighting methods, three mainstream approaches have been formed: subjective weighting, objective weighting, and integrated weighting. Subjective methods, represented by the Analytic Hierarchy Process (AHP) and Delphi method, fully integrate expert knowledge of watershed ecological characteristics and management priorities. Objective methods, centered on the Entropy Weight Method (EWM) and coefficient of variation method, determine indicator importance based on statistical characteristics of monitoring data [16,17,18,19]. Some studies have attempted to balance the advantages of subjective experience and objective data through combined weighting methods [20]. In terms of evaluation models, traditional methods such as fuzzy comprehensive evaluation and gray relational analysis have gradually been supplemented by artificial intelligence technologies including machine learning and neural networks, enabling dynamic simulation and prediction of river-lake health status [21,22,23]. Meanwhile, methods such as Monte Carlo (MC) simulation and risk matrices have been applied in uncertainty analysis, advancing evaluation from “deterministic conclusions” to “probabilistic descriptions” [24]. These studies have provided important technical support for global river-lake ecological protection and governance, effectively promoting the improvement and sustainable utilization of ecosystem service functions.
In the field of river-lake health assessment, overestimation risk specifically refers to the systematic deviation that the evaluated health level is significantly higher than the real ecological status of river-lake ecosystems. This risk is caused by the coupling of predictive uncertainty of indicator values and methodological uncertainty of weights, which will directly mislead ecological governance decisions, reduce the effectiveness of protection measures, cause the misallocation of ecological protection resources, and ultimately threaten the long-term sustainable operation of river-lake systems. At present, the overestimation risk has not been paid enough attention in existing studies. The lack of quantitative risk analysis will lead to unreliable assessment results and invalid governance decisions. Therefore, it is urgent to carry out targeted research on overestimation risk, which is of great theoretical value and practical significance to improve the scientificity of river-lake health assessment and the effectiveness of ecological governance.
There remain critical research gaps in the coupled analysis of multiple uncertainties and the quantification of overestimation risk in assessment processes, which are core bottlenecks in current research: (1) Insufficient quantification of indicator value uncertainty. River-lake ecological indicators are affected by multiple factors such as seasonal hydrological fluctuations, extreme weather events, and human activity disturbances, showing significant spatiotemporal variability. However, most existing studies adopt deterministic data such as multi-year averages or single-period measured values for evaluation, lacking systematic characterization of the predictive uncertainty of indicator values. Even when some studies use models to predict indicator values, they fail to fully consider the deviation distribution characteristics between historical predictions and actual values, resulting in evaluation results that cannot reflect the dynamic fluctuation laws of ecosystems. (2) Incomplete consideration of weight uncertainty. Different weighting methods have inherent differences in theoretical foundations and data dependence—subjective methods focus on expert experience judgments, while objective methods rely on statistical characteristics of data—often leading to conflicting weight results. Although existing studies mostly obtain a single coordinated weight through combined weighting, they lack quantitative description of the uncertainty of weights themselves (e.g., weight fluctuations caused by expert judgment deviations and data variability), ignoring the potential impact of weight uncertainty on evaluation results. (3) Unclear coupled mechanism between dual uncertainties and overestimation risk. Most existing studies analyze the uncertainty of indicator values or weights in isolation, lacking effective methods to couple the two and quantify their impact on the overestimation risk of evaluation results. Even though some studies recognize the existence of uncertainty, they have not established a quantitative relationship model between uncertainty and overestimation risk, making it impossible to accurately identify high-risk indicators and comprehensive risk levels. These gaps result in existing evaluation methods being unable to avoid decision-making risks caused by overestimation risk, restricting the practical application effectiveness of river-lake health assessment in complex ecological governance scenarios.
Purely measured statistical data can only reflect the ecological status of monitored years, while long-term river-lake health assessment is often hindered by discontinuous monitoring, missing historical sampling records and inconsistent monitoring frequencies. The predicted values of historical indicators solve the above problems from three aspects. Firstly, they fill the data gaps of years without field monitoring, and form an integrated continuous time series for multi-year comparative evaluation. Secondly, combined predicted and observed data can separate regular natural periodic fluctuations from abnormal degradation caused by human activities, avoiding misjudgment of the main factors affecting river-lake health. Thirdly, the complete historical series supported by prediction values can support trend extrapolation, which helps to discover latent ecological deterioration risks in advance and enhance the practical guiding significance of assessment results for watershed governance.
To address the aforementioned research gaps, this paper develops a general framework combining dual uncertainty quantification and overestimation risk coupling analysis with three key innovations. First, we build a standardized dual uncertainty quantification system for indicators and weights: PINN models reconstruct historical indicators and quantify prediction uncertainty, while Nash equilibrium game theory unifies multi-source weights, with weight uncertainty quantified via normal distribution assumptions. Second, a dual uncertainty–overestimation risk coupled model is established using the efficient FOSM method. Derived risk formulas quantify single and overall evaluation overestimation risks and characterize the overestimation risk induced by overlapping dual uncertainties. Third, the framework is validated via a Poyang Lake case study, which identifies high-risk indicators (TP, TN, FBLI) and generates risk zoning maps to support watershed management. This research remedies the deficiency of dual uncertainty–risk coupling research and forms an integrated technical pipeline from uncertainty measurement to decision assistance, providing a new research paradigm for scientific river-lake health evaluation.

2. Methodology

2.1. Dual Uncertainty Quantification

In the river-lake health assessment and risk quantification of this study, two core technical-level uncertainties must first be addressed in a targeted manner: the predictive uncertainty of evaluation indicator values and the methodological uncertainty of indicator weights. Both directly affect the accuracy of subsequent evaluation results and the reliability of risk quantification. From the perspective of indicator values, since real-time measured data for the current period are not fully available during the management decision-making phase, the current evaluation indicator values in this study need to be predicted based on historical sequences (e.g., multi-year averages, previous year’s results) or trend extrapolation. This “historical data-driven prediction” inherently carries a risk of deviation, which may lead to a disconnect between predicted values and measured values due to failure to cover sudden disturbances in the current period (e.g., extreme weather events, changes in human activities), thereby constituting the core uncertainty at the indicator value level. Regarding indicator weights, there is no unified technical standard for their determination. The subjective weighting method, objective weighting methods, and comprehensive weighting method selected in this study yield significantly different weight results due to differences in their theoretical foundations and data dependence characteristics. This inherent methodological difference directly gives rise to weighting uncertainty, which will further amplify evaluation deviations if not properly addressed.
To systematically quantify the aforementioned dual uncertainties, a hierarchical processing approach is adopted in this study: For the predictive uncertainty of indicator values, quantitative characterization is achieved by statistically analyzing the deviation distribution between historical predicted values and corresponding measured values, and clarifying key statistical characteristics such as mean and standard deviation. For the methodological uncertainty of indicator weights, multi-method weighting is first employed to fully cover methodological differences in weights. Subsequently, a game theory fusion framework is introduced, with the Nash equilibrium as the coordination criterion, to perform secondary fusion of multiple sets of weight vectors. This approach not only retains core information from various methods and mitigates weight conflicts but also completes the quantitative description of weighting uncertainty by constructing a feasible weight subspace and assuming it follows a normal distribution (with the expectation as the coordinated weight and the standard deviation reasonably set based on the expectation). The targeted handling of the aforementioned dual uncertainties provides direct technical support for the subsequent coupled quantification of dual uncertainties-overestimation risk.

2.1.1. Uncertainty of Health Assessment Indicators via PINN

In this study, the Physics-Informed Neural Networks (PINN) [25] approach is employed for predicting values of river-lake health assessment indicators. The PINN incorporates core physical constraints of river-lake systems, including hydrodynamic continuity for hydrological indicators, mass conservation for water quality pollutant transmission, and biogeochemical laws for aquatic biological indicators, which ensures the physical consistency of prediction results. The uncertainty associated with indicators is assessed through the following procedures:
Step 1. Suppose there exist z health assessment indicators, each characterized by m measured values. Accordingly, the historical measurement data of these health assessment indicators are converted into time series, denoted as R j , t , j = 1 , 2 , , m , t = 1 , 2 , , z .
Step 2. The PINN model is first trained with n preceding indicator data points (satisfying n < m). Following calibration, the model is applied to predict the (n + 1)th indicator value R ^ n + 1 , t , with the prediction error associated with this value calculated as per the expression provided hereafter:
ε 1 , t = R ^ n + 1 , t R n + 1 , t ,   t = 1 , 2 , , z
Step 3. Likewise, training of the PINN is conducted using the indicator data covering the prior n + 1-year period. The validated PINN model is then applied to estimate the indicator value at the (n + 2)th time step, and the prediction discrepancy corresponding to this (n + 2)th value is derivable via the following expression:
ε 2 , t = R ^ n + 2 , t R n + 2 , t ,   t = 1 , 2 , , z
Step 4. By analogy, perform forecasting for the indicator values spanning the (n + 2)th to mth time steps, and subsequently derive a prediction discrepancy sequence (exhibiting a length of m − n) corresponding to these indicator values as presented hereinafter:
ε m n , t = R ^ m , t R m , t   t = 1 , 2 , , z
Step 5. It is assumed herein that the forecast deviations of indicator values conform to a normal distribution N 0 , σ t 2 , t = 1 , 2 , , z . Based on the Central Limit Theorem, this assumption is reasonable for the large-sample dataset. For the standard deviation, the computational approach is specified hereinafter:
σ t = 1 m n 1 j = 1 m n ε j , t 0 2 ,   t = 1 , 2 , , z
Step 6. Parameter optimization of the PINN model is performed using the entire indicator sequence, enabling the prediction of the (m + 1)th indicator value R ^ t . The subsequent value of the indicator is then expressible as follows:
R t = R ^ t + ε t ,   t = 1 , 2 , , z
Thus, the expected value and variance corresponding to the t th indicator value can be attained via the subsequent equations:
E R t = E R ^ t + ε t = E R ^ t + E ε t = E R ^ t + 0 = R ^ t
D R t = D R ^ t + ε t = D R ^ t + D ε t = 0 + D ε t = σ t 2
where E and D are the expected value and variance.

2.1.2. Uncertainty of Assessment Indicator Weights

Weight Probabilistic Characteristics
In order to flexibly address the uncertainty associated with indicator weights during river-lake health assessment, we directly consider the probabilistic characteristics of these weights, which can be characterized by a probability density function f W w . Specifically, four typical scenarios are identified for the weight distribution:
(1) A unique deterministic value [24]
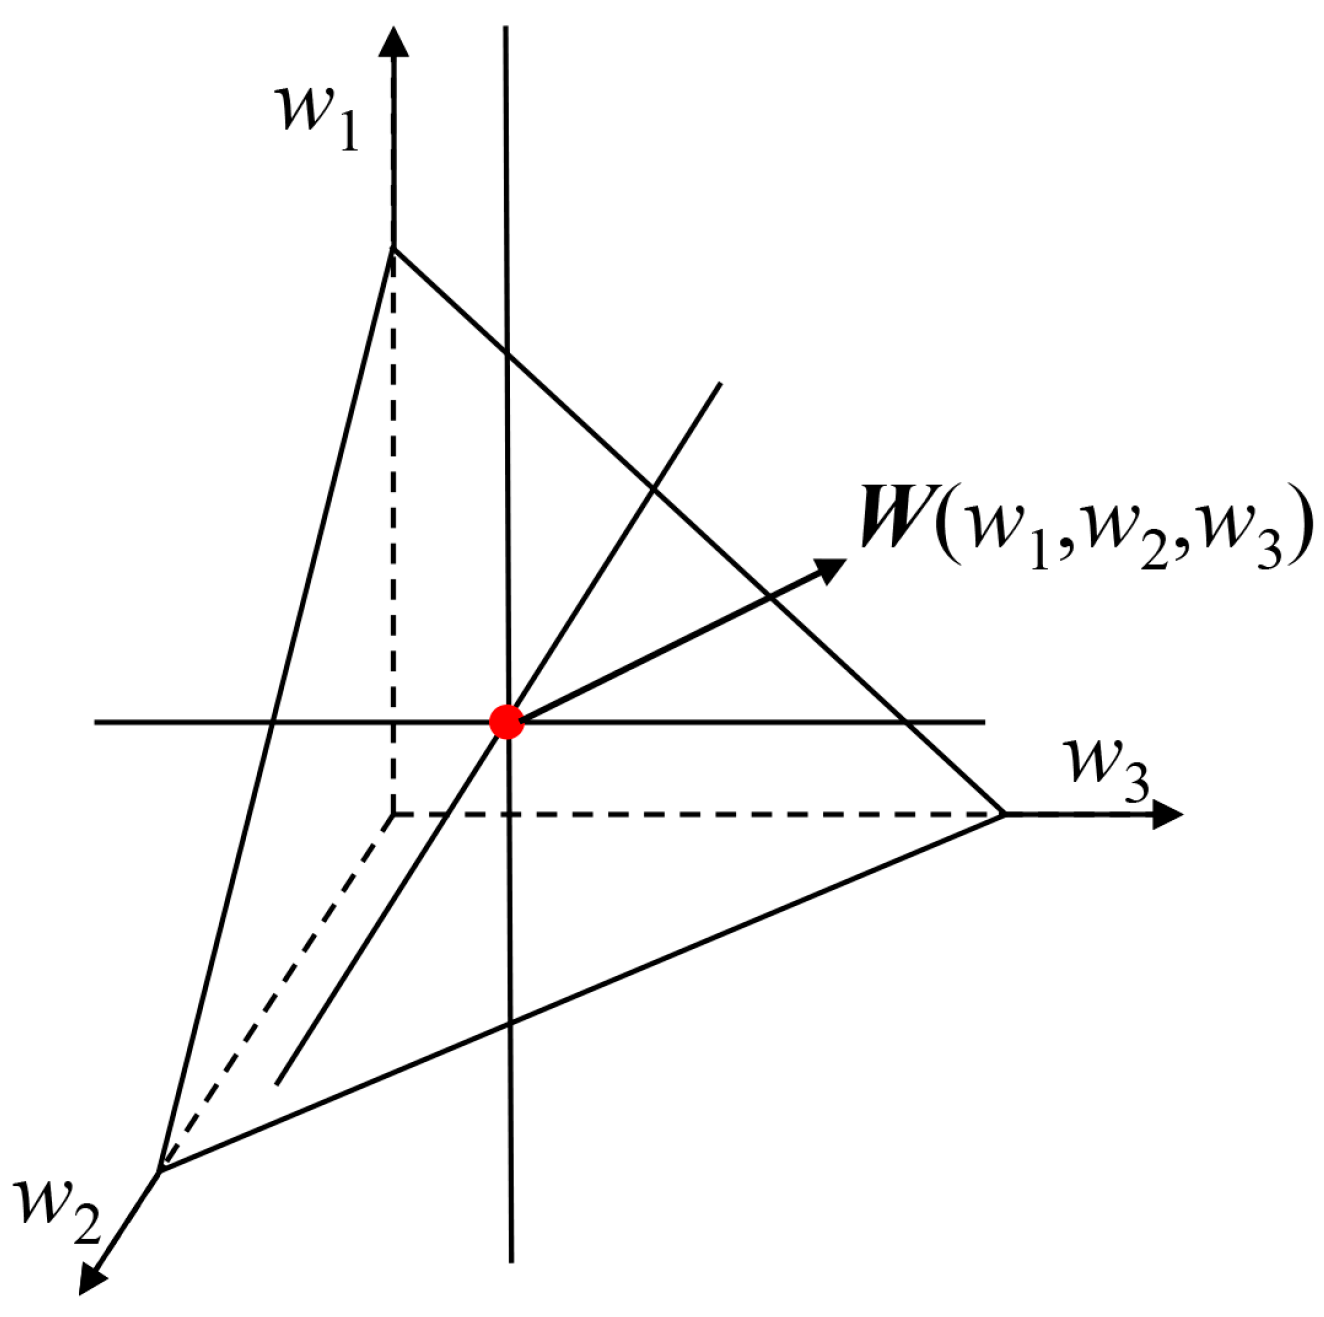
Under the scenario where indicator weights are assigned deterministic values, the weight configuration is uniquely confirmed. To illustrate this, consider a three-dimensional framework corresponding to three assessment indicators: the indicator weights are represented as a point W(w1, w2, w3), where w1, w2, and w3 stand for the respective weights of the three indicators (Figure 1).
(2) A uniform distribution over a predefined interval
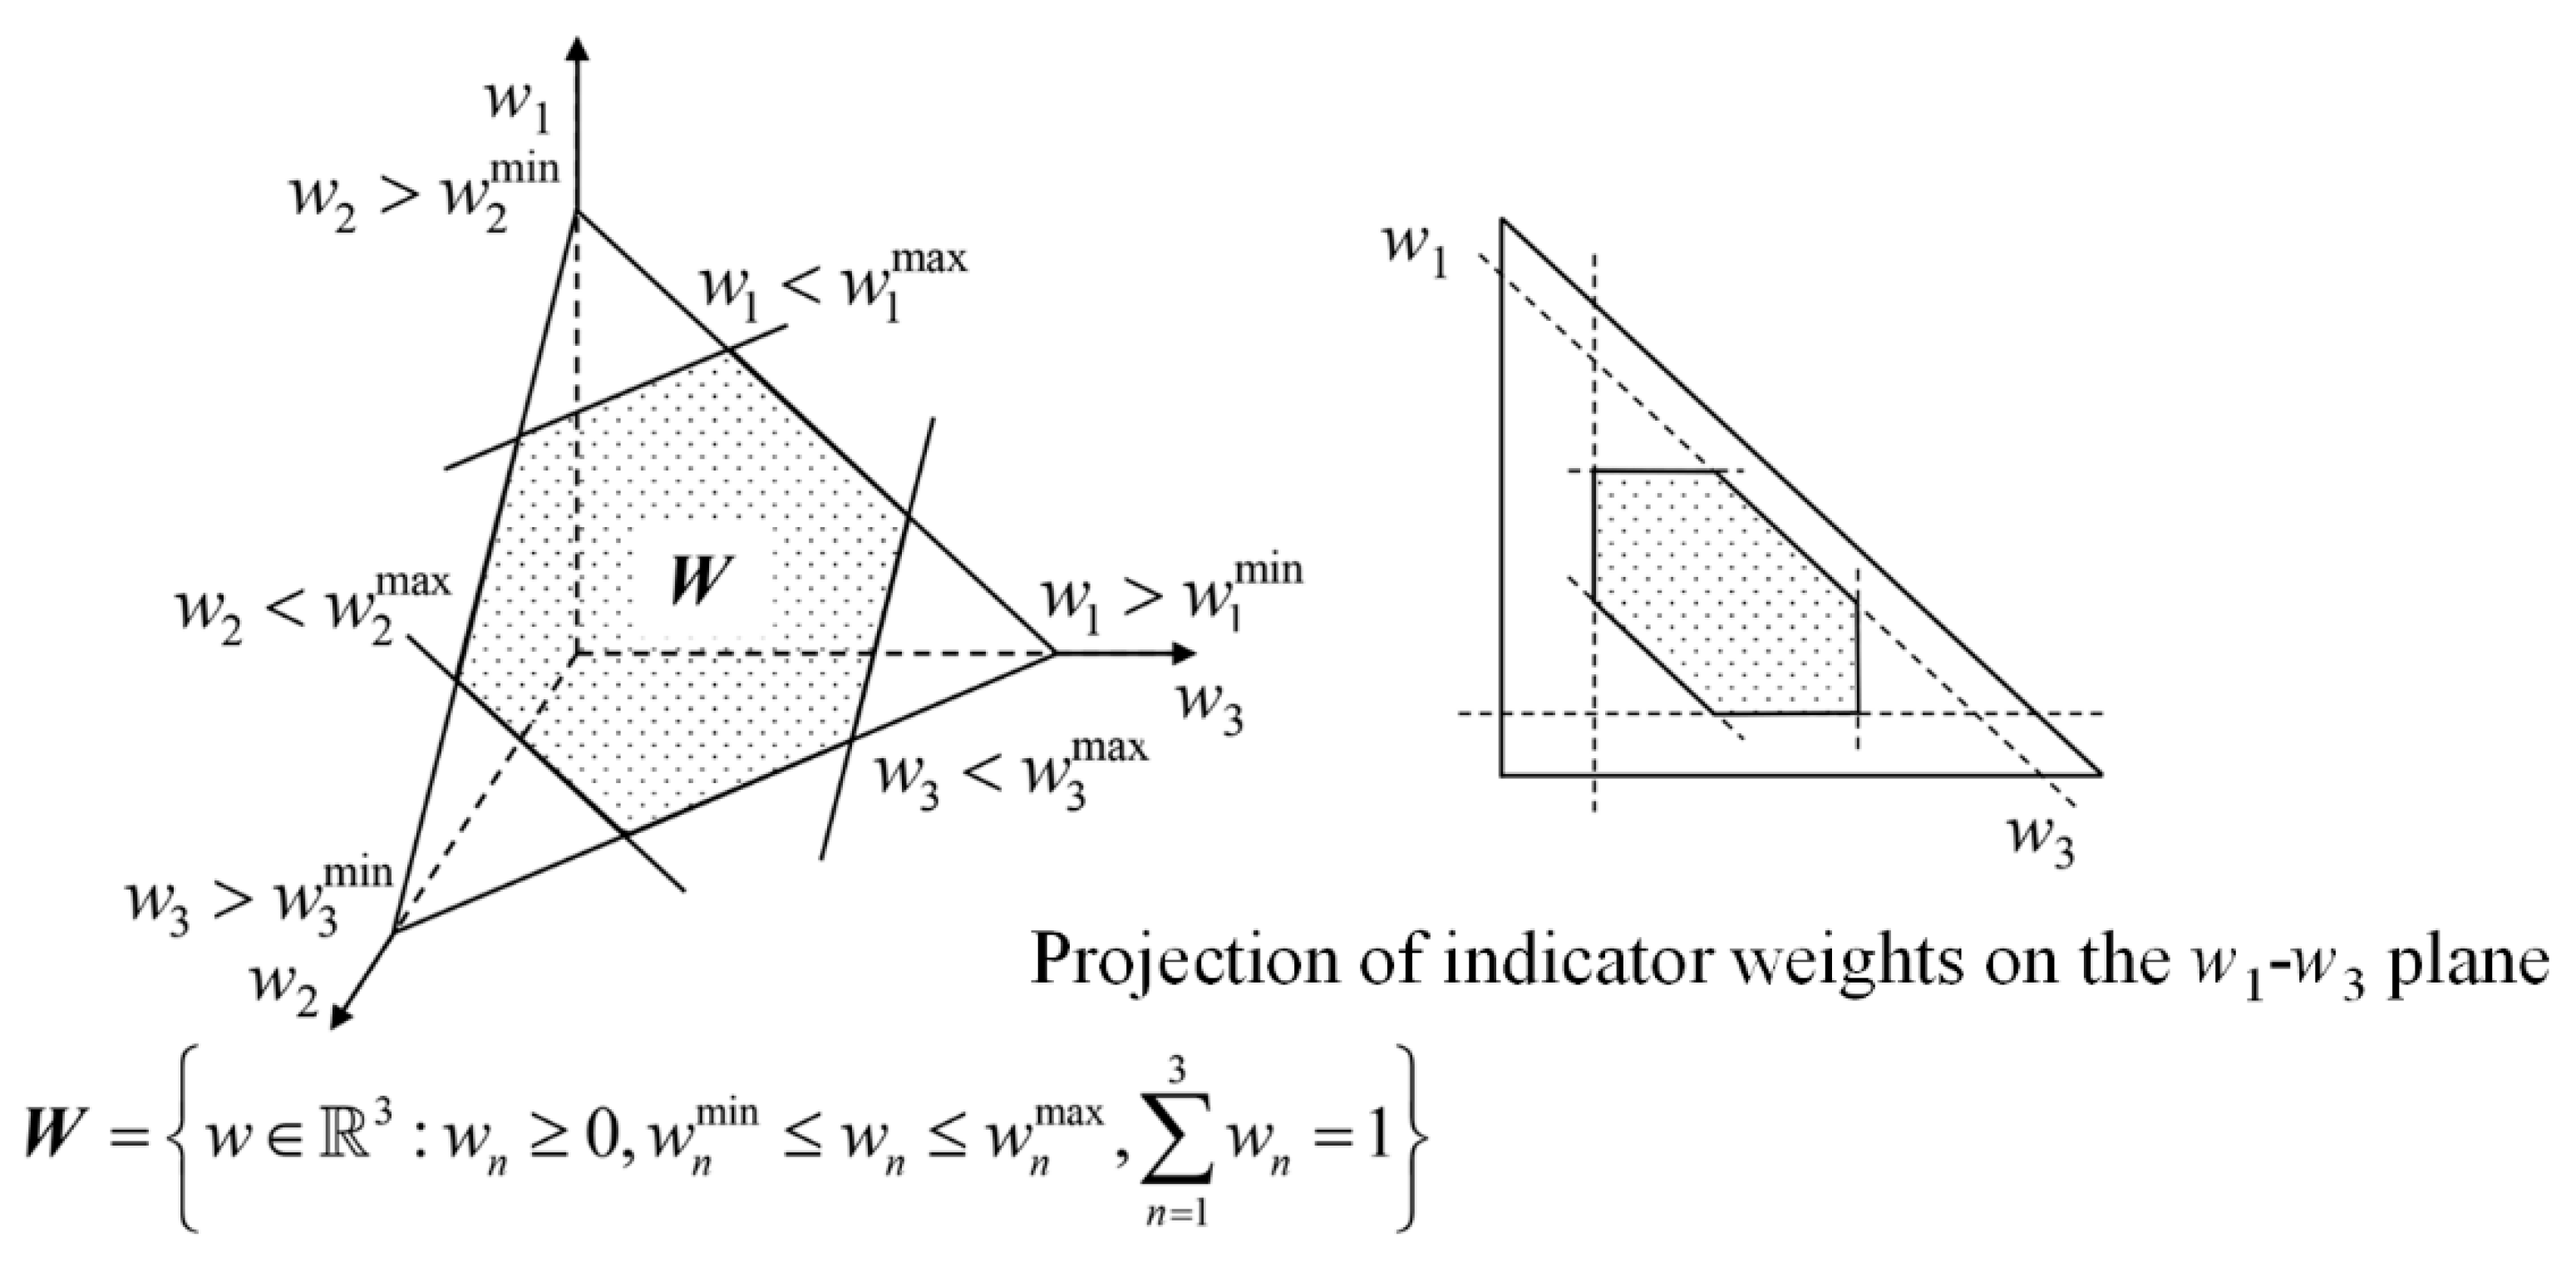
During the river-lake health assessment process, owing to the complexity inherent in assessment indicators, disparities between different weighting methods, and variations in expert judgments, reaching a consistent view regarding indicator weights proves particularly challenging when confronted with incomplete and uncertain information. In such scenarios, employing fixed quantitative values to characterize weights may fail to reflect the intrinsic variability of indicators and methodological discrepancies. Interval-based weight estimation offers a more robust methodology for conveying this uncertainty while mitigating information loss. For instance, in a three-dimensional space, assuming indicator weights exhibit a uniform distribution within specified intervals, the weight configuration forms a hexagonal plane (illustrated in Figure 2), whose specific mathematical expression is provided as follows:
W = w 3 : w n 0 , w n min w n w n max , n = 1 3 w n = 1
(3) Any arbitrary distribution within a given interval
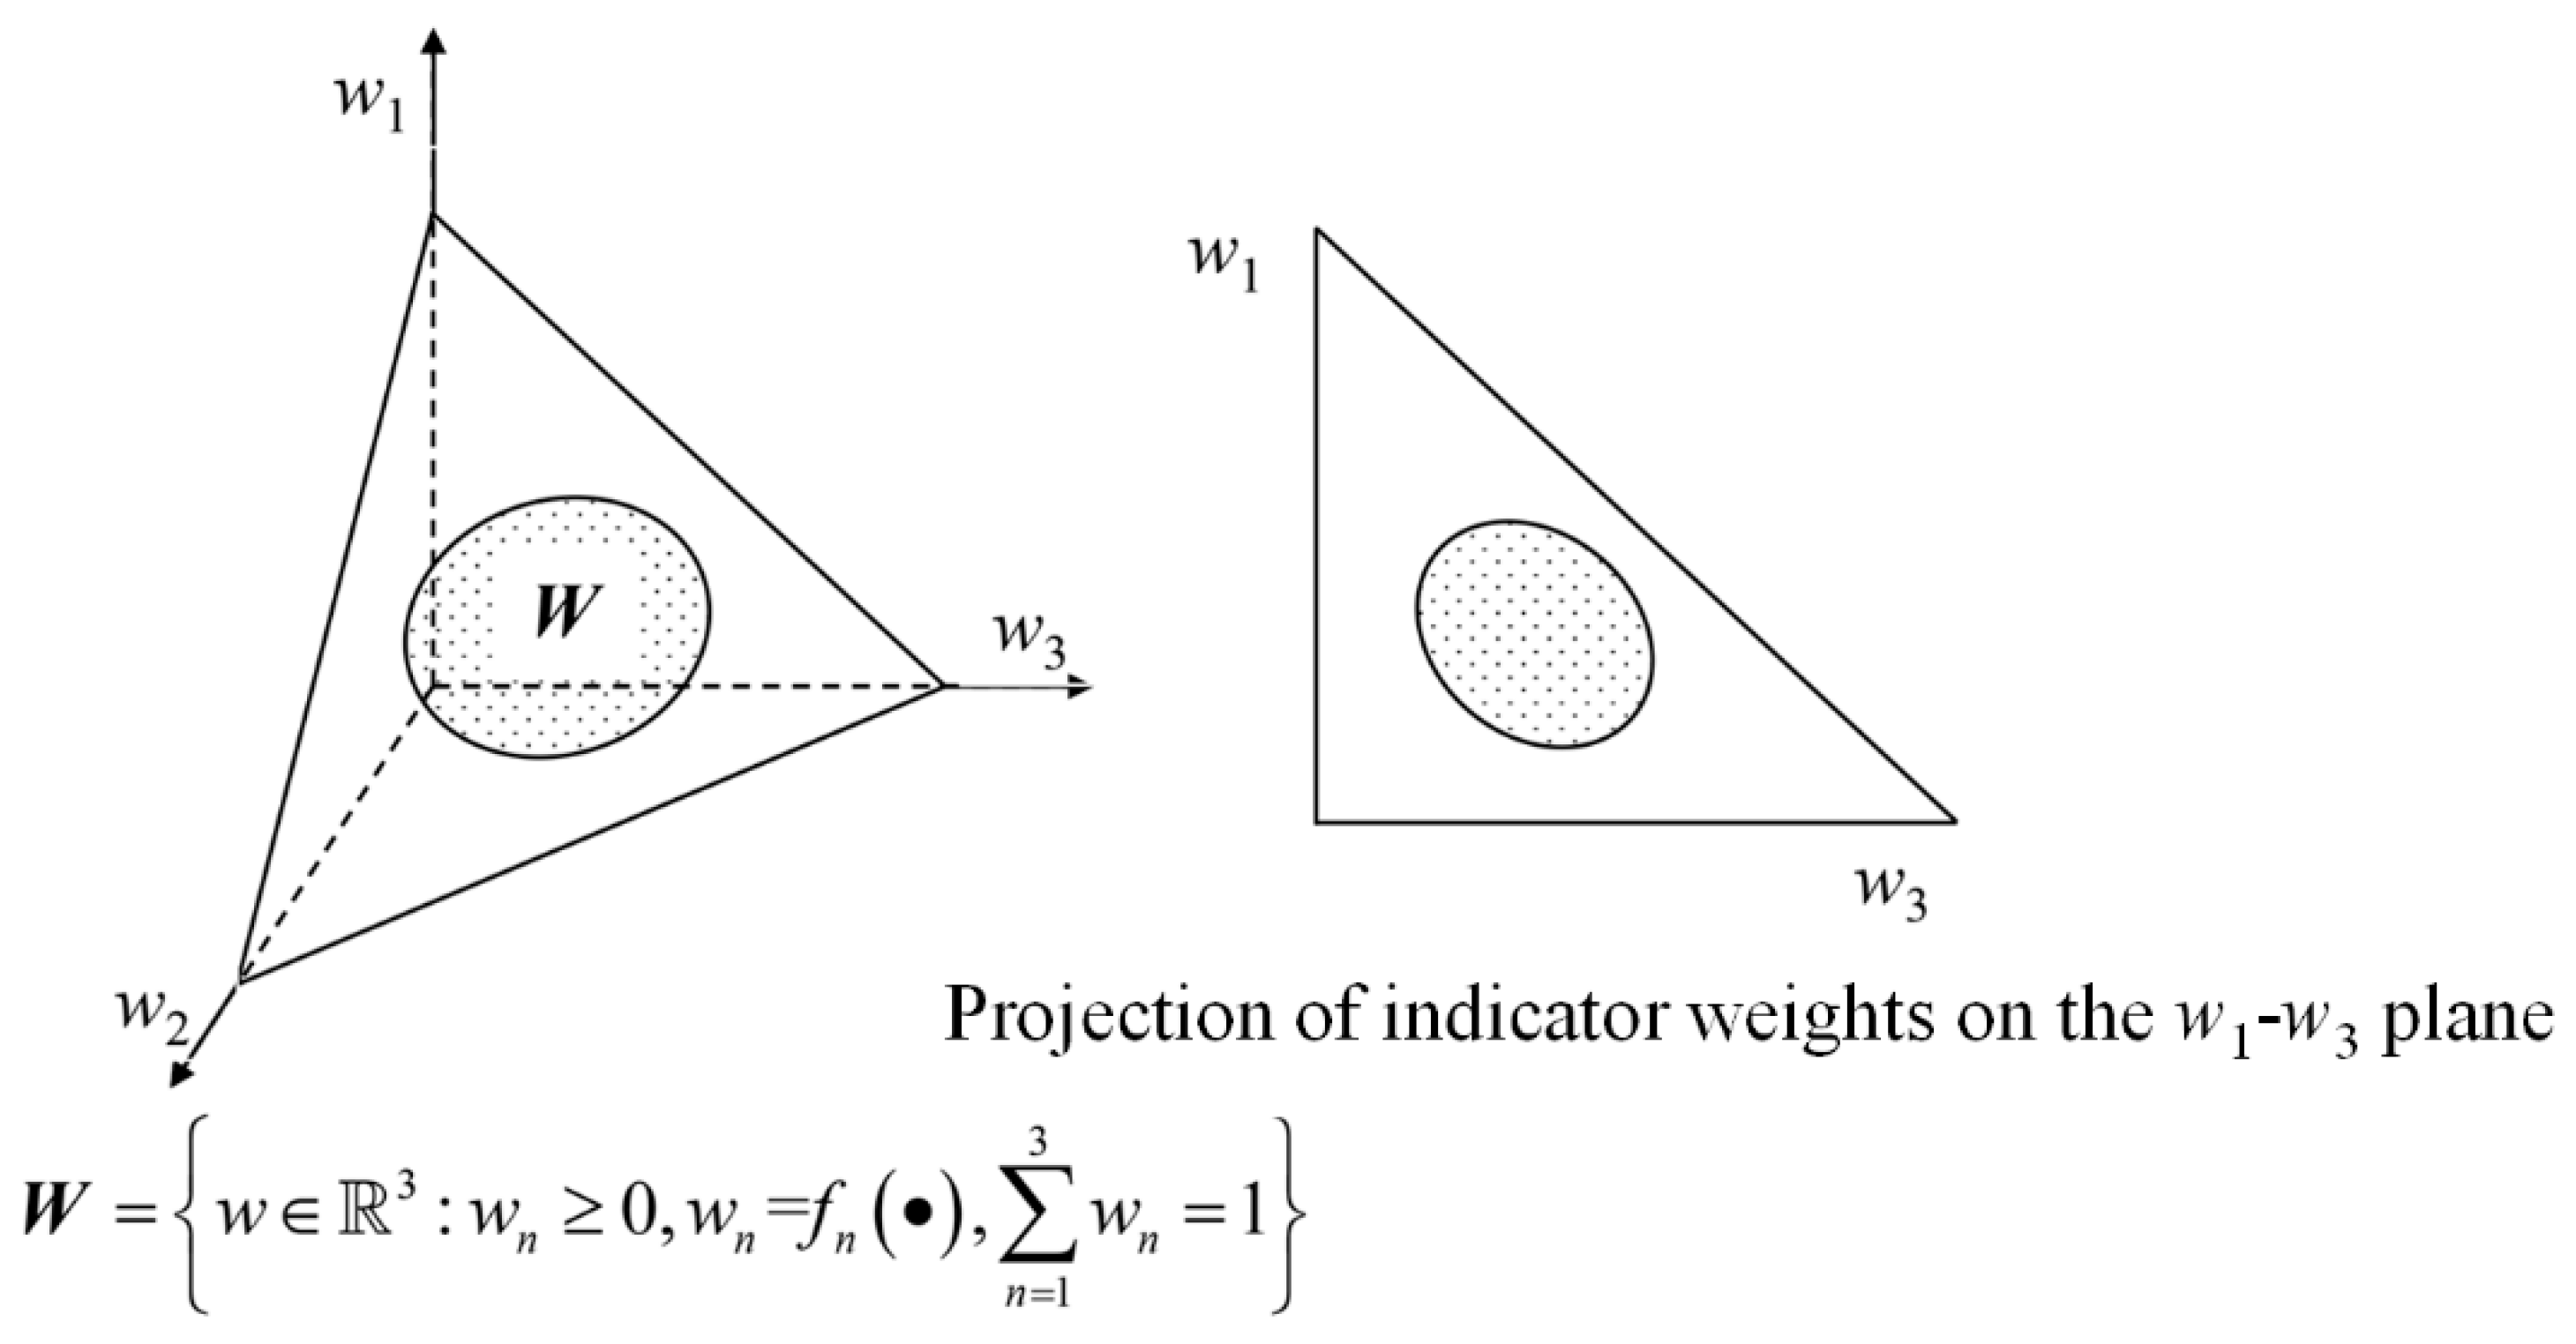
Apart from the aforementioned uniform distribution of indicator weights over specified intervals, the weights can also be characterized in a more universal form: exhibiting any arbitrary distribution within given intervals. To illustrate this with a three-dimensional space, the corresponding weight distribution domain is represented by the shaded region illustrated in Figure 3, whose specific mathematical expression is provided as follows:
W = w 3 : w n 0 , w n = f n , n = 1 3 w n = 1
(4) No prior information regarding the indicator weights is available
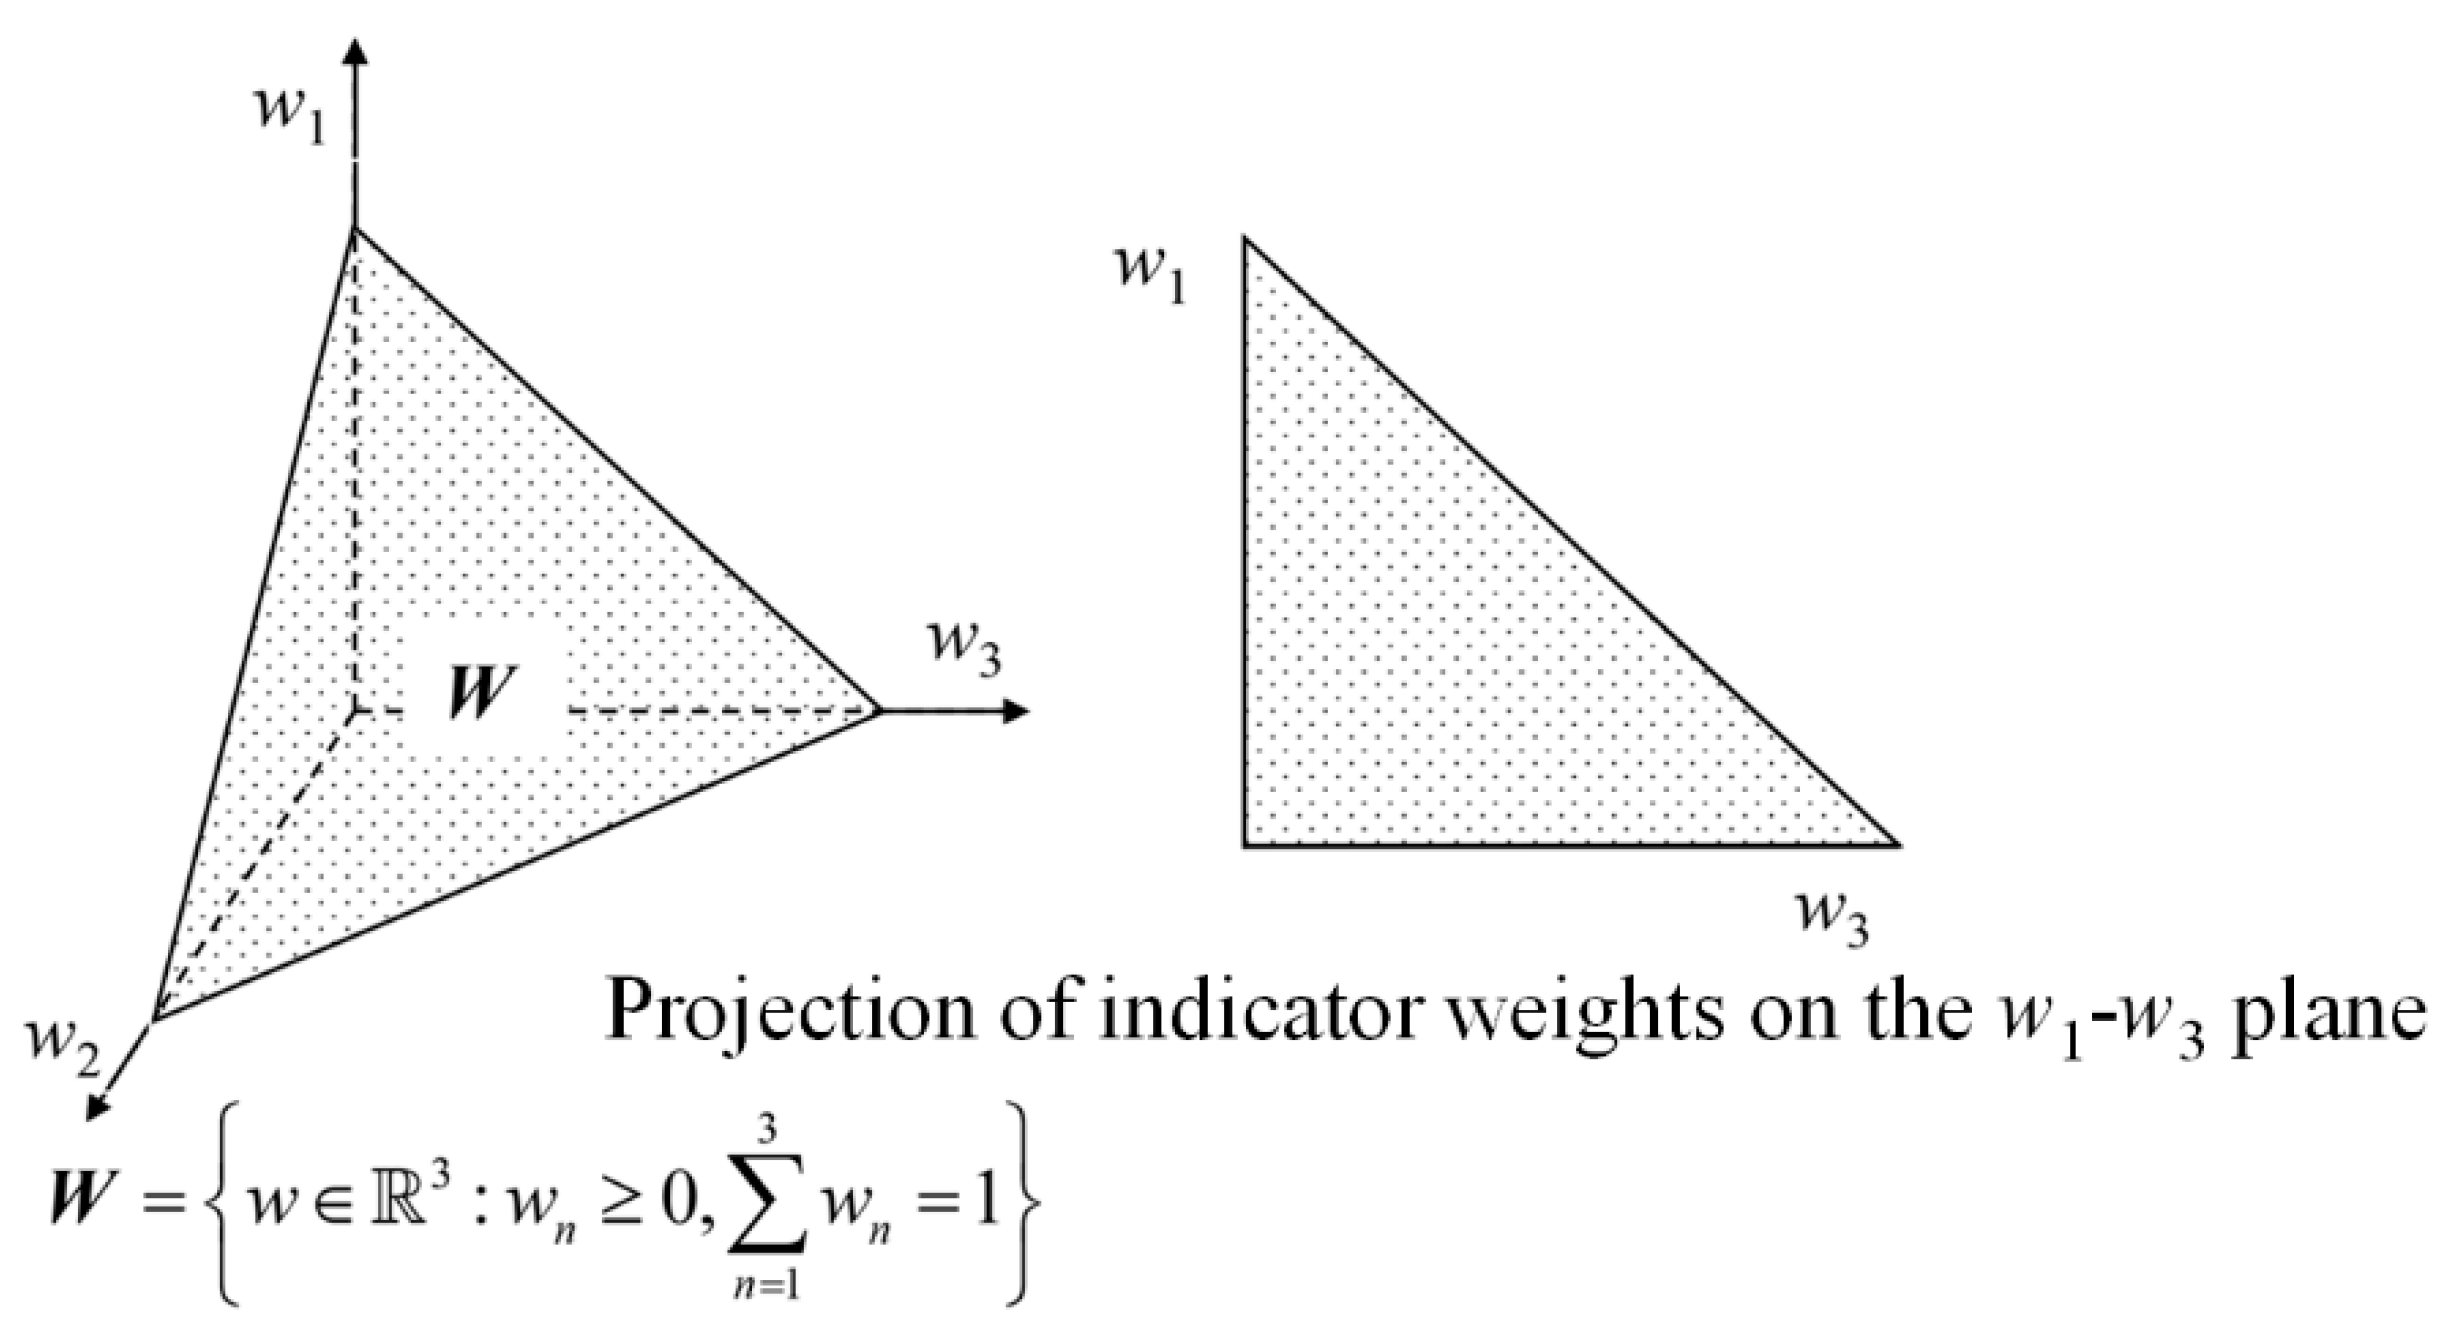
Yet another specific scenario involves the challenge of reliably determining accurate weight information for indicators at the initial evaluation stage, owing to factors including insufficient prior knowledge and constraints of the assessment context. To address this situation, the feasible scope of the entire weight space is explored via the methodology of inverse weight analysis, thereby offering relevant reference information. Taking a three-dimensional domain as an illustration, the feasible weight range in this case is depicted as the triangular region shown in Figure 4, with its specific mathematical formulation presented as follows:
W = w 3 : w n 0 , n = 1 3 w n = 1
Complementary Weighting Strategies for Assessment Indicators
Given the necessity of comprehensively capturing the relative significance of individual assessment indicators while reinforcing the objectivity and robustness of final assessment results, researchers have developed a spectrum of weight calculation methodologies. Herein, four complementary classic approaches [24] are selected, each addressing distinct aspects of weight derivation based on varied theoretical underpinnings:
(1) Hierarchical subjective weighting method:
Analytic Hierarchy Process (AHP) [26], a structured decision-making framework that elaborates indicator weights by hierarchically decomposing the assessment system, conducting pairwise comparisons of indicator importance, and verifying consistency to quantify relative priorities.
(2) Information disorder-based objective method:
Entropy Weight Method (EWM) [27], which infers indicator weights by measuring the degree of data disorder (entropy value) within assessment datasets—lower entropy corresponds to higher information validity, thereby assigning greater weight to indicators with more discriminative information.
(3) Variability-correlation integrated method:
Criteria Importance Through Intercriteria Correlation (CRITIC) [28], an objective weighting technique that synthesizes two key data characteristics—indicator internal variability (reflecting data fluctuation intensity) and inter-indicator correlation (representing information overlap)—to yield weights that balance data uniqueness and redundancy.
(4) Dimensionality reduction-driven weighting method:
Principal Component Analysis (PCA) [29], which focuses on extracting key information from high-dimensional assessment data through principal component decomposition. Weights are derived from the variance contribution rate of each principal component, ensuring that weights align with the data’s intrinsic structural importance while achieving effective data compression.
Game Theory-Driven Weight Conflict Resolution for River-Lake Health Assessment
Game theory, as a systematic mathematical paradigm for analyzing strategic interactions within structured incentive systems, is uniquely suited to addressing phenomena marked by competitive or reciprocal tradeoffs—an attribute highly relevant to multi-criteria assessment contexts [30,31,32]. Within river-lake health assessment, indicator weights derived from distinct weighting methodologies often present inherent contradictions, rooted in the methods’ varying theoretical underpinnings, data sensitivity, and emphasis on different assessment dimensions (e.g., ecological integrity vs. hydrological functionality). To reconcile these conflicts and enhance the robustness of weight determination, this study integrates game theory into river-lake health assessment, adopting a core framework that implements secondary fusion and aggregation of conflicting weight vectors guided by the Nash equilibrium principle—ultimately achieving effective conflict resolution.
Each weight set generated by the aforementioned weighting approaches is designated as a basic weight vector, denoted as
w k = w 1 k , w 2 k , , w n k , k = 1 , 2 , , L , where L represents the total number of weighting methods employed. These vectors originate from the diverse methodological choices outlined in Section 2.2.2, ensuring consistency with the study’s multi-method weighting strategy. The general form of any linear combination of these basic weight vectors—capturing the aggregated weight logic under game theory—can be formulated as follows:
w b = k = 1 L α k w k ( α k > 0 ,   k = 1 L α k = 1 )
where α k serves as the combination weight.
Guided by the Nash equilibrium as the core coordination criterion, this study pursues a balanced compromise across the basic weight vectors derived from diverse weighting approaches. The goal is to ultimately determine coordinated weights that minimize the cumulative deviation between the aggregated weight set and each individual basic weight vector. The optimization objective function is formulated as follows:
min i = 1 L α i w i w k 2 ( k = 1 , 2 , , L )
This established optimization framework is solvable via a suite of classical optimization techniques—such as Genetic Algorithm (GA) [33], Particle Swarm Optimization (PSO) [34], or Simulated Annealing (SA) [35]—or through established computational tools. Through this solution process, the optimal coefficients for linear combination are derived as: α 1 * , α 2 * , , α L * . Subsequent to resolving weight conflicts, the coordinated weight vector is further computed via the following formulation:
w * = k = 1 L α k * w k
Building on the preceding analysis, the game-theoretic optimization approach enables the two-stage fusion and integration of initial basic weight vectors into a unified coordinated weight vector. On this basis, the weight feasibility subspace (WFS) is defined as a localized domain radiating outward from the central coordinated weight point, with its mathematical expression given as follows:
WFS = w R n : w j 0 , w j * 1 λ w j w j * 1 + λ , j = 1 n w j = 1
Here, λ characterizes the weight uncertainty level, whose magnitude corresponds to the conflict intensity among diverse weighting approaches. Specifically, a lower λ value is applicable when inter-method conflicts are relatively mild and the optimized coordinated weights are closely aligned; conversely, a higher λ is warranted for significant inter-method discrepancies, so as to yield a more expansive weight feasibility subspace with broader coverage.
Employing the weight feasibility subspace is demonstrably more rational than relying solely on coordinated weights—this approach integrates the maximum possible weight-related information into the uncertainty analysis of river-lake health assessment, thereby mitigating information loss. Furthermore, weight uncertainty can be quantified via any probability distribution type bounded by interval constraints within the boundaries of the weight feasible domain.
Characterization of Weight Uncertainty
Within a specific river-lake health assessment context, indicator weights are subject to the influence of multiple interrelated factors, with no single factor identifiable as the dominant driver. Guided by the Central Limit Theorem (CLT) [36], a random variable typically exhibits a normal distribution, N E η , σ 2 η , when shaped by numerous independent factors without a decisive controlling element. Accordingly, this study presumes that the weight uncertainty distribution within a defined assessment scope conforms to a normal distribution. The mean (expectation) of this distribution is designated as the coordinated weight vector, while the standard deviation is defined as one-tenth of the mean value. The rationality of this distributional assumption is validated via the 3σ rule inherent to normal distributions.

2.2. Overestimation Risk of River-Lake Health

The essence of this risk lies in a systematic evaluation bias caused by the superposition of dual uncertainties. It not only distorts the true health status of river-lake ecosystems but is also likely to result in misaligned management decisions (e.g., insufficient investment in ecological protection, inadequate intensity of governance measures), thereby triggering secondary ecological risks. Accordingly, after completing the quantitative characterization of dual uncertainties, the core objective of this study is to establish a coupled relationship model of “dual uncertainties-overestimation risk” based on the statistical characteristics of predicted indicator value deviations and the distribution laws of the feasible weight subspace; clarify the definition boundaries of overestimation risk (i.e., the difference and probability distribution between predicted and actual health levels); and propose specific quantitative calculation methods for the risk (e.g., indicators such as risk occurrence probability and risk deviation degree). Ultimately, this study aims to achieve accurate identification and quantification of the overestimation risk of river-lake health, providing technical support for avoiding decision-making biases and enhancing the scientificity of river-lake governance.

2.2.1. Identification of Overestimation Risk in River-Lake Health Assessment

First, the logical relationships among core concepts are clearly defined: Indicator prediction uncertainty is the basic source of systematic deviation in assessment. Overestimation risk is the phenomenon that the predicted health level is systematically higher than the actual level due to optimistic indicator prediction and weight tendency. Overestimation risk is the quantitative characterization of overestimation risk, including its occurrence probability and deviation magnitude.
Meanwhile, overestimation risk is directly driven by the dual uncertainty of indicator values and weights: the uncertainty of indicator values dominates the prediction deviation, and the uncertainty of weights amplifies the deviation degree. The coupling effect of the two dual uncertainties is the core mechanism for the formation of overestimation risk.
Based on the general definition of risk as the combination of the probability of an adverse event and its corresponding consequences, this study specifically tailors the conceptualization of overestimation risk to the context of river-lake health assessment. Guided by the preceding analysis of dual uncertainties (predictive uncertainty of indicator values and methodological uncertainty of weights), the overestimation risk of river-lake health is defined as the integrated measure of: (1) the probability that the predicted health level (derived from historically projected indicator values and uncertain weights within the feasible weight subspace) exceeds the actual health level (calculated using current measured indicator values and game theory-based coordinated weights); and (2) the magnitude of this discrepancy, which reflects the severity of overestimation risk.
This definition inherently incorporates the dual uncertainty-driven mechanism of risk formation, emphasizing both the likelihood of overestimation and the extent of deviation—two core dimensions of risk quantification in ecological assessment. Based on this rigorous definition, the mathematical expression for the overestimation risk of river-lake health is formulated as follows:
P f t = Prob S t < C t = Prob R t w t < C t
where t denotes the index of assessment indicators, t = 1 , 2 , , z . P f t characterizes the overestimation risk associated with the t-th indicator. S t designates the current measured value of the t-th indicator, corresponding to the actual river-lake health level in this study. C t designates the historically predicted value of the t-th indicator, which serves as the basis for prior management decision-making.

2.2.2. Calculation of Overestimation Risk in River-Lake Health Assessment

Selection of Overestimation Risk Quantification Method for River-Lake Health
Considering the dual uncertainty drivers of river-lake health overestimation risk—predictive variability of indicator values and methodological uncertainty of weights—three prevalent quantitative techniques for risk evaluation are assessed for applicability: the direct integration approach, Monte Carlo (MC) simulation [37], and the First-Order Second-Moment (FOSM) method [24]. The direct integration approach demands explicit analytical derivations and numerical integration of the risk response function, which is infeasible for complex river-lake health risk assessments—especially when accounting for the interactive effects of dual uncertainties that hinder the derivation of explicit functional relationships.
Notably, MC simulation has gained widespread acceptance across various risk evaluation domains. Yet, its computational precision is highly contingent on sample size, rendering the method computationally intensive and time-consuming. This characteristic is incompatible with the timeliness demands of overestimation risk assessment, which necessitates prompt support for adaptive river-lake governance decisions. By comparison, the FOSM method necessitates merely the first two statistical moments (i.e., mathematical expectation and variance) of random variables—specifically, the uncertain indicator values and weights—to quantify risk magnitudes. Moreover, the FOSM method is robust to slight deviations from normality, and minor non-normality of prediction errors will not significantly affect the reliability of risk results. This renders it a pragmatic and efficient approach for complex systems with dual uncertainty drivers.
To address potential accuracy limitations of FOSM, advanced extensions such as the First-Order Third-Moment (FOTM) and Second-Order Third-Moment (SOTM) methods have been developed [38]. Nonetheless, while enhancing assessment precision, these advanced techniques incur elevated computational burdens and more stringent data quality prerequisites—constraints that are often difficult to satisfy in practical river-lake health evaluations where monitoring data may be scarce or incomplete. Balancing computational feasibility, assessment accuracy, and data adaptability, the FOSM method is ultimately selected for overestimation risk quantification in this study.
FOSM has demonstrated robust applicability in uncertainty-informed ecological risk assessments. To establish a theoretical foundation for subsequent formula derivation, this section first outlines the fundamental theoretical underpinnings of the FOSM method, followed by the development of a tailored overestimation risk calculation formula aligned with the dual uncertainty context of the present research.
FOSM-Based Quantification Method for River-Lake Health Overestimation Risk
The overestimation risk in river-lake health assessment is defined as the probability that the predicted health level (derived from historically projected indicator values and uncertain weights within the feasible weight subspace) exceeds the actual health level. For the purpose of risk quantification, the following formulation is adopted for the performance function Y t :
Y t = Y t R t , w t = R t w t C t
Building on the aforementioned performance function, the overestimation risk of river-lake health is formally expressed as
P f = Prob Y t < 0
Equation (17) incorporates two uncertainty-related variables identified in the preceding analysis: predictive evaluation indicator values and their corresponding weights. Consistent with the core requirements of the FOSM framework for risk quantification, the mathematical expectations of these two stochastic variables are indispensable inputs. Accordingly, the quantification of river-lake health overestimation risk proceeds as follows:
(1) Overestimation Risk Quantification for the t-th Indicator
To streamline the derivation process, the following shorthand notations are adopted for each variable:
y = Y t   R * = E R t   w * = E w t
Consequently, we express the performance function as
y = y R , w = R w C t
Performing a Taylor series expansion of y = y R , w centered at the mean point R * , w * and retaining only the first-order terms (i.e., neglecting quadratic and higher-order components), y can be approximated as
y = y R * , w * + y R * R R * + y w * w w * = R * w * C t + w * R R * + R * w w *
Subsequently, the mathematical expectation E y and variance D y can be expressed as
E y = E R * w * C t + w * R R * + R * w w * = E R * w * C t + w * E R R * + R * E w w * = R * w * C t
D y = D R * w * C t + w * R R * + R * w w * = D R * w * C t + D w * R R * + D R * w w * = D R * w * C t + w * 2 D R D R * + R * 2 D w D w * = 0 + w * 2 D R 0 + R * 2 D w 0 = w * 2 D R + R * 2 D w
After reverting to the original non-abbreviated symbols (undoing the prior shorthand), the mean and variance of Y t can be expressed as
E Y t = E R t E w t C t
D Y t = E w t 2 D R t + E R t 2 D w t
Building on the derived mean and variance, the reliability index β t and associated overestimation risk P f t of the t-th indicator can be derived as
β t = E Y t D Y t = E R t E w t C t E w t 2 D R t + E R t 2 D w t
P f t = F β t = 1 F β t
(2) Quantification of Comprehensive Overestimation Risk
Under the assumption that uncertainties associated with the indicator value and weight of the t-th indicator exclusively influence the t-th indicator itself—i.e., the performance functions corresponding to distinct indicators are mutually independent—accordingly, the mathematical expectation and variance of the performance function for comprehensive river-lake health evaluation are formulated as follows:
E Y = E t = 1 z Y t = t = 1 z E Y t = t = 1 z E R t E w t C t
D Y = D t = 1 z Y t = t = 1 z D Y t = t = 1 z E w t 2 D R t + E R t 2 D w t
Building on the derived mathematical expectation and variance of the comprehensive performance function, the comprehensive reliability index β and corresponding comprehensive overestimation risk P f may be further derived as
β = E Y D Y = t = 1 z E R t E w t C t t = 1 z E w t 2 D R t + E R t 2 D w t
P f = F β = 1 F β
It should be noted that the FOSM method may introduce computational errors from ignoring high-order Taylor expansion terms. To illustrate that such accuracy limitations exert negligible influence on our research, two analyses are supplemented. The function of our health assessment model has extremely weak nonlinearity between weight variables, which inherently restrains the error of FOSM.

3. Study Area

3.1. Study Area Overview

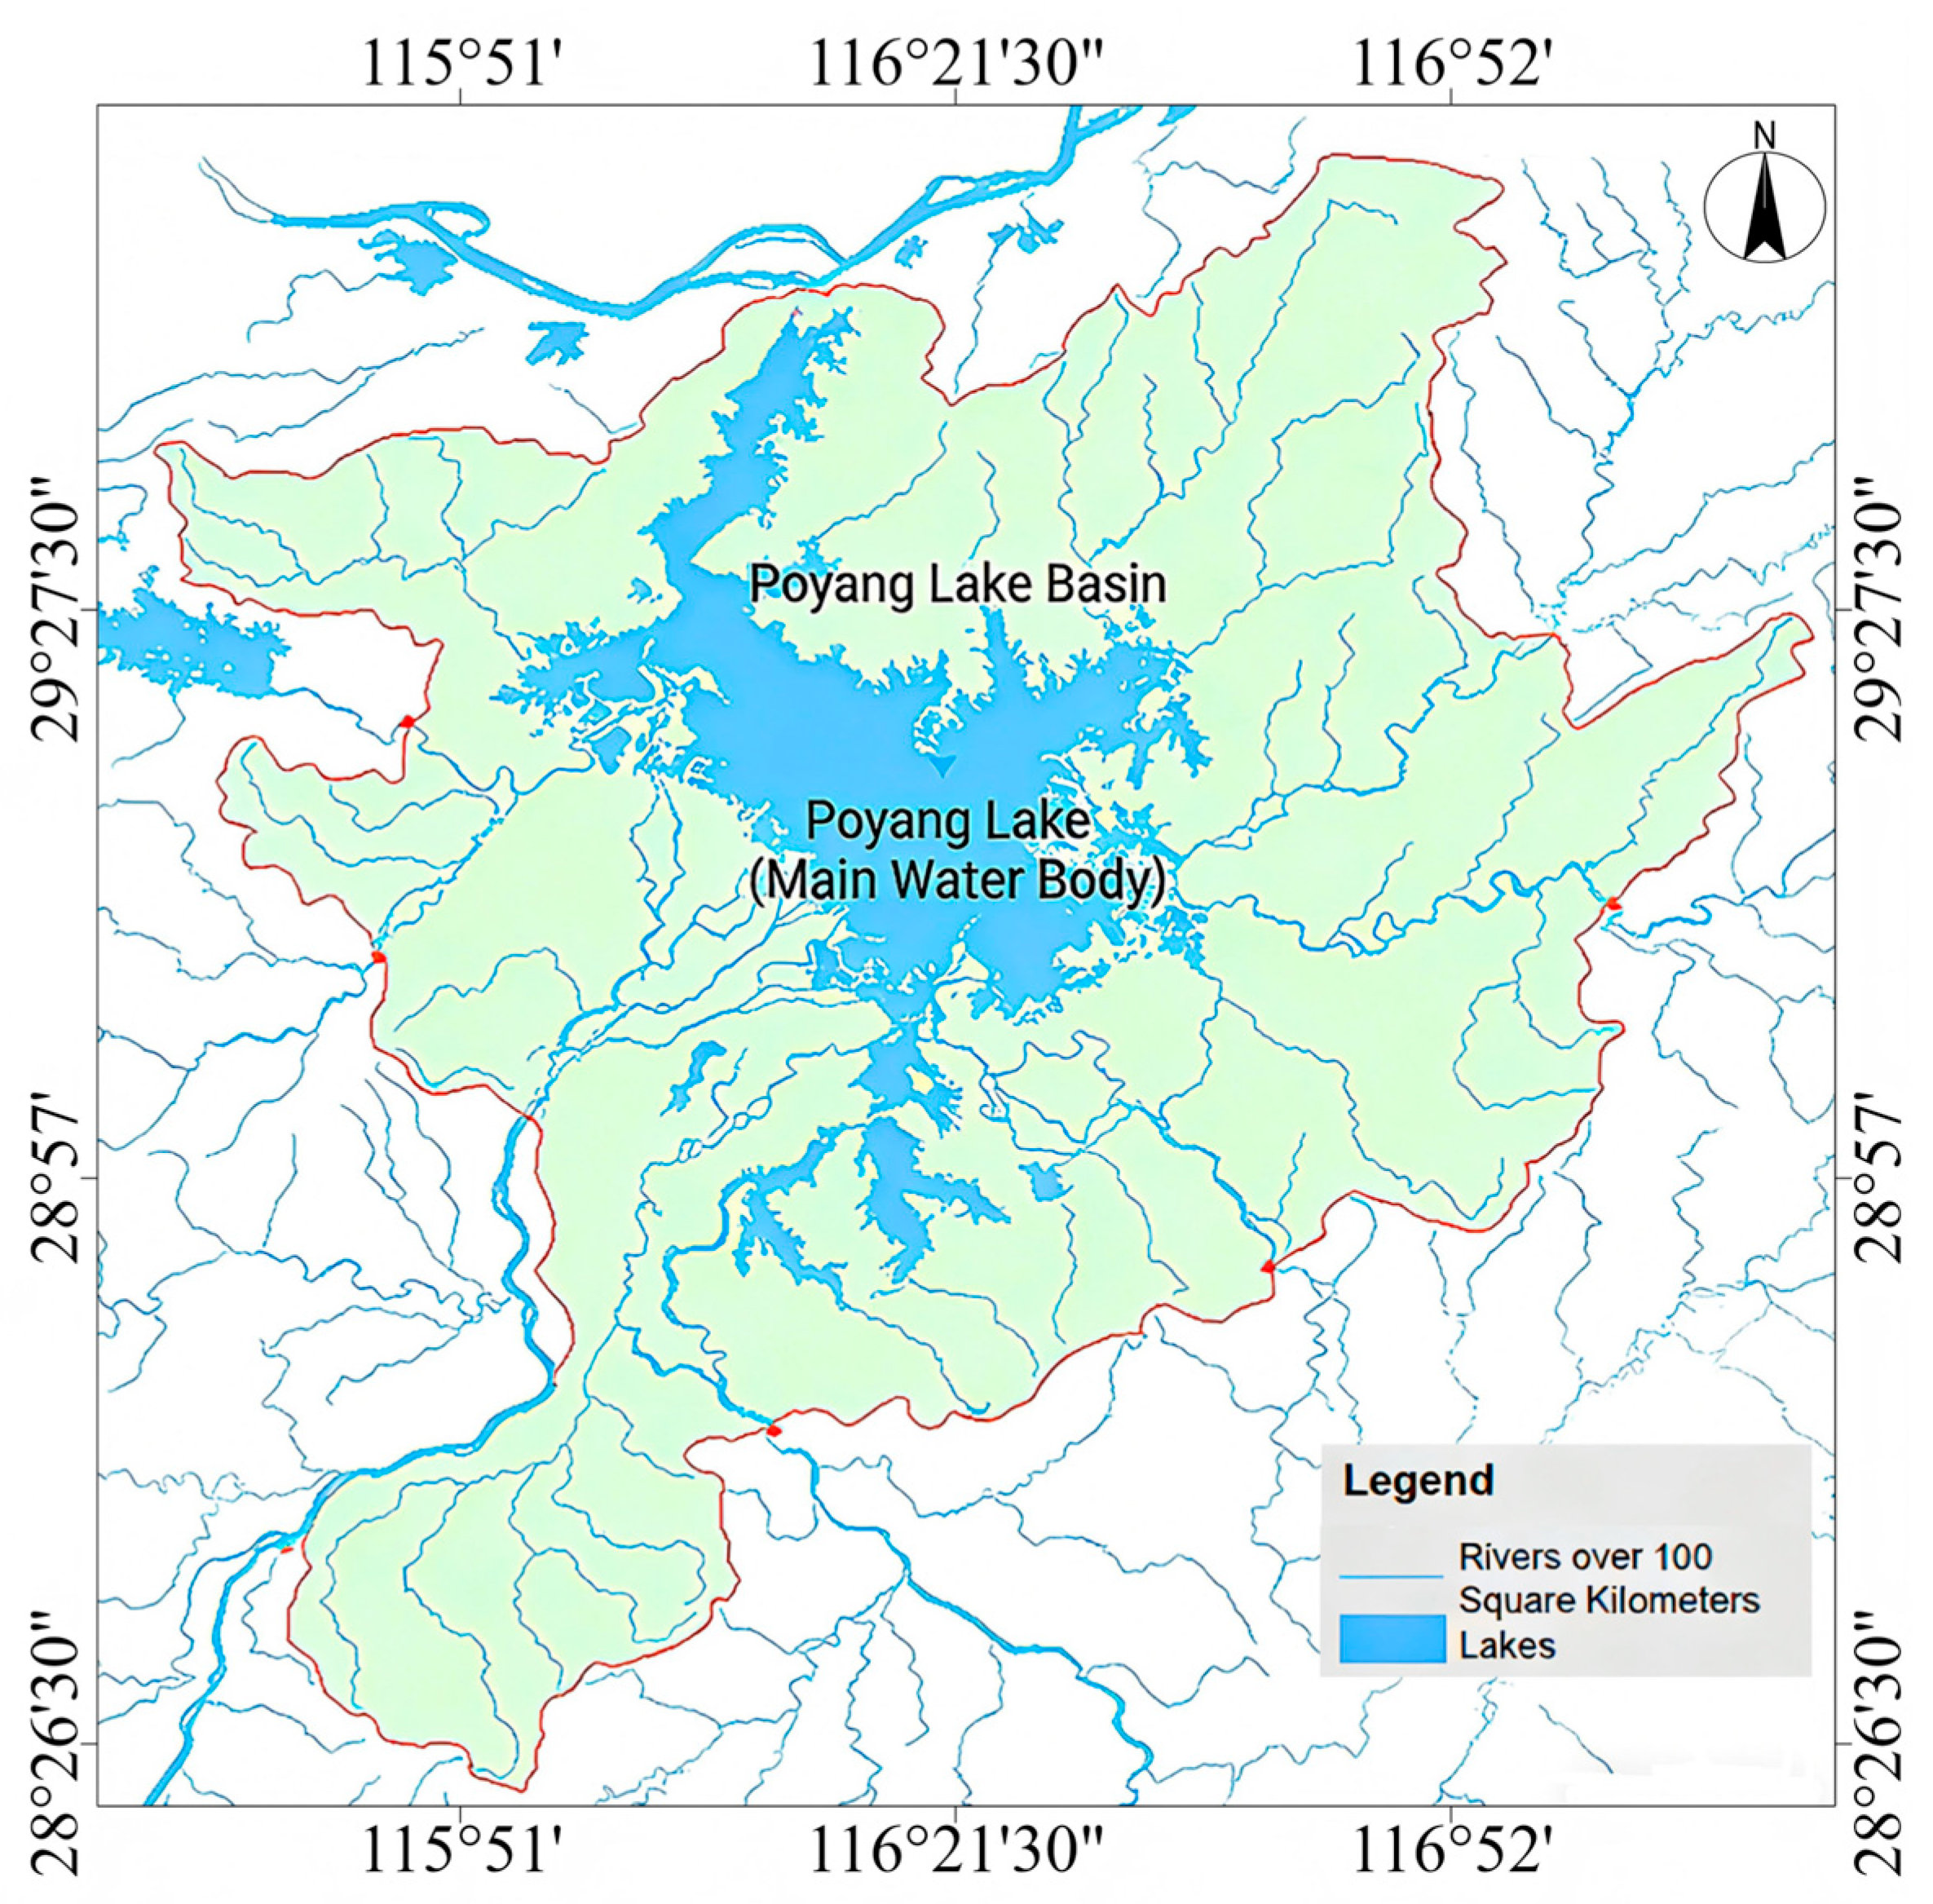
Poyang Lake, the largest freshwater lake in China, is geographically situated between 28°22′–29°45′ N latitude and 115°47′–116°45′ E longitude in northern Jiangxi Province (Figure 5). Its catchment spans 162,200 km2, covering most of Jiangxi Province and parts of Hubei, Anhui, Fujian, Zhejiang, and Guangdong provinces, with the lake’s northern outlet directly connecting to the Yangtze River mainstem. As a typical subtropical seasonal lake, it exhibits pronounced hydrological dynamism: the water surface area varies from 4741 km2 at a water level of 21 m (flood season) to 225 km2 at 12 m (dry season), representing a 20-fold fluctuation driven by monsoonal precipitation and Yangtze River backwater effects. This hydrological complexity forms a hierarchical river-lake system fed by five major tributaries (Ganjiang, Fuhe, Xinjiang, Raohe, and Xiuhe), underscoring its role as a core component of the Yangtze River Basin’s ecological security barrier.
Ecologically, Poyang Lake provides critical ecosystem services, including flood regulation (retaining an average of 30 billion m3 of floodwater annually), water supply for 10 million residents and 2 million mu of irrigated farmland, biodiversity conservation (supporting over 130 fish species and serving as a key wintering ground for >500,000 migratory birds, including the critically endangered Siberian crane), and regional climate modulation through latent heat exchange. However, in recent decades, anthropogenic pressures (e.g., agricultural non-point source pollution, sand mining, and water resource development) and climate change have induced significant ecological degradation. Monitoring data from 2018 to 2020 indicate persistent eutrophication (total phosphorus [TP] concentrations averaging 0.08 mg/L, total nitrogen [TN] 1.2 mg/L, and chlorophyll-a [Chl-a] 7.6 μg/L), coupled with reduced wetland area, degraded aquatic vegetation coverage, and declining biological integrity. These challenges highlight the necessity of robust health assessment frameworks to guide evidence-based ecological governance. Given its ecological significance, well-documented environmental challenges, and the need to address assessment uncertainties, Poyang Lake was selected as the case study area.

3.2. Multi-Dimensional Assessment Framework

A core prerequisite for river-lake health assessment lies in establishing an assessment indicator system that accurately reflects system complexity—a consensus widely recognized in the field of aquatic ecological governance. This consensus emphasizes three fundamental requirements for assessment indicator systems: dimension comprehensiveness (covering natural–social interaction processes), selection objectivity (free from reliance on subjective experience), and application adaptability (aligning with basin management practices). However, significant practical flaws persist in current assessment indicator system construction: most studies rely on expert subjective weighting or direct adoption of indicator combinations from single cases, lacking a quantitative screening process based on large-sample data. This leads to an experience-driven characteristic in indicator design—either excessive weighting of certain environmental factors due to high information redundancy (e.g., using a single organic pollution indicator to characterize both oxygen-consuming organic load and eutrophication potential) or one-sided assessment resulting from the omission of key dimensions such as satisfaction status of the lake’s minimum ecological water level (LMEL-S) and water resource development and utilization rate (WRDUR). A more prominent issue is the frequent separation between evaluation modules of natural systems (hydrology, water quality, aquatic biology) and social service functions, which fails to capture the evolutionary laws of river-lake health under the interaction of these two systems (e.g., the crowding-out effect of water resource development intensity on ecological baseflow satisfaction is not integrated into the assessment framework).
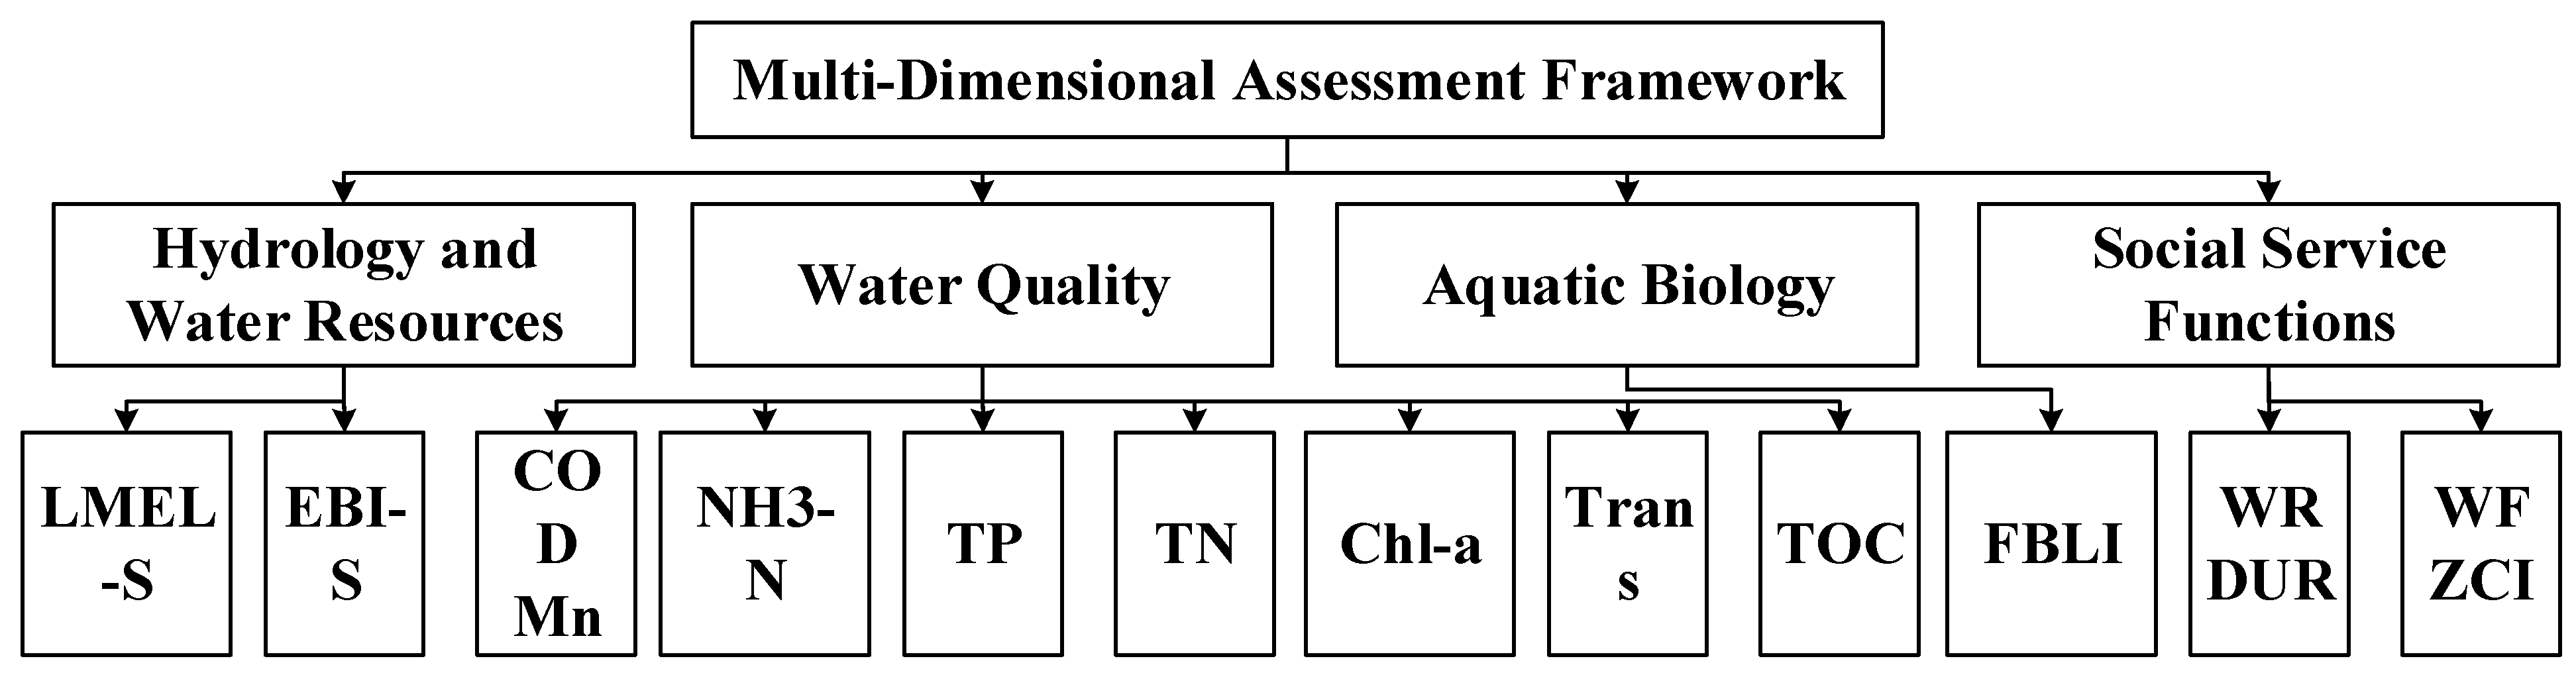
To address these practical challenges, this study adopted a Meta-analysis approach to systematically integrate 160 river-lake health assessment-related studies published in the Web of Science database from 1970 to 2024, constructing a standardized assessment indicator pool. The assessment indicator system was optimized through a three-step quantitative screening process: ① Frequency statistics to identify 45 core assessment indicators with relatively high occurrence frequencies (including total phosphorus (TP), total organic carbon (TOC), Fish Biological Loss Index (FBLI), water function zone compliance index (WFZCI), etc.); ② Pearson correlation analysis to eliminate redundant indicators with high information redundancy (e.g., removing indicators highly correlated with total nitrogen (TN) to avoid nutrient information overlap); ③ Correlation verification to select indicators strongly associated with river-lake health status. Ultimately, a comprehensive framework covering four criterion layers was established, and 12 key assessment indicators were determined after redundancy reduction and optimization (structure shown in Figure 6): Hydrology and Water Resources (LMEL-S, satisfaction status of the ecological baseflow of major inflowing rivers (EBI-S)); Water Quality (oxygen-consuming organic pollution—permanganate index (CODMn)/ammonia nitrogen (NH3-N); water eutrophication status—TP/TN/chlorophyll a (Chl-a)/transparency (Trans)/TOC); Aquatic Biology (FBLI); Social Service Functions (WRDUR, WFZCI).
The innovative value of this assessment indicator system is reflected through specific technical pathways and practical effects: ① Based on the systematic integration of 160 studies and multi-round quantitative screening, the system effectively reduces indicator information redundancy while achieving full coverage of four core modules (hydrology, water quality, aquatic biology, and social service functions). By replacing redundant organic pollution indicators with eutrophication-specific TOC, it resolves the structural contradiction of “either redundancy or missing dimensions” in traditional indicator systems, forming a logically consistent assessment framework that strictly adheres to the principle of “no overlap and no omission”. ② A three-in-one technical pathway of bibliometric screening-correlation verification-practical adaptability optimization was established. The correlation verification focuses on the corresponding relationship between indicators and core characterization factors of river-lake health (e.g., TOC directly reflects organic carbon availability for eutrophication), while the practical adaptability optimization considers the availability of monitoring data in Poyang Lake (e.g., prioritizing commonly monitored indicators such as CODMn, NH3-N, and TOC), avoiding the scientific flaws of subjective weighting and experience-based indicator selection in traditional methods. ③ For the first time, social service function factors such as WRDUR and WFZCI are coupled with natural system indicators. The interaction between indicators is used to characterize the natural–social dual-driving mechanism (e.g., quantifying the negative correlation between WRDUR and EBI-S), providing an operable assessment tool for the accurate diagnosis of Poyang Lake’s health status and multi-factor coordinated regulation (e.g., balancing water resource development and ecological protection). Its methodology can directly support the transformation of water governance from single water quality improvement to natural–social system coordinated optimization.
When applying this optimized assessment indicator system to Poyang Lake’s health assessment, two inherent uncertainties of complex river-lake systems must be addressed: ① Predictive variability of indicator values—significant spatiotemporal variability in the concentrations of water quality indicators such as TP, TN, Chl-a, and TOC due to Poyang Lake’s seasonal hydrological fluctuations, coupled with data gaps for indicators such as Trans and FBLI in some remote coastal areas, may lead to deviations between predicted indicator values and actual conditions. ② Methodological uncertainty in weighting—obvious differences in weight assignment for social service function indicators (e.g., WRDUR) between the Entropy Weight Method (objective weighting) and Analytic Hierarchy Process (AHP, subjective weighting). Such differences in priority ranking may introduce systematic assessment biases. The superposition of these dual uncertainties will directly increase the risk of overestimating Poyang Lake’s actual health status, potentially leading to misallocation of ecological protection resources or insufficient targeting of governance policies.
This study adopts the PINN model and normal distribution assumption to quantitatively identify the above uncertainties, and uses the FOSM method to quantify overestimation risk, so as to obtain more reliable and accurate assessment results.

4. Results

4.1. Uncertainty Analysis of Health Assessment Indicators

A total of 1264 valid samples of the 12 key assessment indicators (detailed in Section 4.1) were systematically accumulated through field monitoring campaigns and historical dataset integration in the Poyang Lake basin. Given the inherent dimensional discrepancies among indicators (e.g., units of concentration for TP/TN (mg/L), ratio for WRDUR (%), and categorical scores for FBLI) and the mixed attribute of original indicators (both benefit-type and cost-type), a normalization process was implemented to eliminate the interference of scale differences and unify all indicators into benefit-type metrics with a standardized scoring range of 0–100. Specifically, cost-type indicators (e.g., CODMn, NH3-N, TP, TN) were transformed using a reverse normalization method to ensure that higher scores consistently correspond to better lake health status, while benefit-type indicators (e.g., LMEL-S, EBI-S, WFZCI) were normalized via a linear scaling approach, which facilitates subsequent weighted aggregation and cross-indicator comparison.
For the calibration of the PINN model, 600 consecutive time-series samples were selected from the normalized dataset. This selection strategy prioritizes temporal continuity to preserve the inherent hydrological and ecological variability of the lake system, thereby avoiding potential biases caused by random sampling and ensuring the model captures the dynamic relationships between indicators and health status. Subsequently, the mathematical expectations (mean values) and standard deviations (as measures of indicator variability) for each normalized assessment indicator were derived using the uncertainty quantification method proposed in Section 2.1. These key statistical parameters, which lay the foundation for subsequent reliability index calculation and overestimation risk analysis, are comprehensively summarized in Table 1.

4.2. Uncertainty Analysis of Assessment Indicator Weights

To determine the relative importance of the 12 key assessment indicators, the four representative weighting methods detailed in Section 2.2—Analytic Hierarchy Process (AHP, subjective), Entropy Weight Method (EWM, objective), CRITIC method (variability-correlation integrated), and Principal Component Analysis (PCA, dimensionality reduction-driven)—were independently applied to calculate initial indicator weights. The complete set of initial weight results is summarized in Table 2. A comparative analysis of Table 2 reveals noticeable discrepancies in weight assignments across the four methods, leading to inherent conflicts in priority ranking. This inconsistency arises from the distinct underlying logics of each approach: subjective methods (AHP) integrate expert knowledge of Poyang Lake’s hydrological–ecological characteristics and management priorities, while objective methods (EWM, CRITIC, PCA) rely on statistical properties of the 1264-sample dataset (e.g., data variability, inter-indicator correlation). Such differences result in divergent weight allocations for natural system indicators (e.g., TP, Chl-a) and social service function indicators (e.g., WRDUR, WFZCI), reflecting the inherent tradeoffs between expert judgment and data-driven insights.
To resolve these conflicts and integrate complementary information from subjective and objective weighting, the game theory-based optimization approach proposed in this study was employed for weight coordination and aggregation. This method quantifies the conflict intensity between different weight sets via a minimax strategy, iteratively adjusting weight coefficients to maximize consensus among multiple weighting results while preserving the core information of each individual method. The final coordinated weights derived from this optimization process are also presented in Table 2, offering a scientifically balanced basis for subsequent comprehensive health assessment.
To characterize the inherent uncertainty of indicator weights (attributed to data variability, expert judgment deviations, and methodological limitations), all coordinated weights were defined as normally distributed random variables with interval constraints within the weight feasible region (0 < weight < 1). Specifically, the mean (μ) of each normal distribution was set equal to the corresponding coordinated weight, and the standard deviation (σ) was calibrated as one-tenth of the mean (σ = μ/10). This parameterization strategy ensures that weight randomness is rationally bounded without relying on unsubstantiated data: according to the 3σ rule of normal distribution, random weight values will fall within the interval [μ − 3σ, μ + 3σ] with a probability of 99.7%. Given the σ = μ/10 setting, the lower bound (μ − 3σ = 0.7μ) remains strictly greater than 0, and the upper bound (μ + 3σ = 1.3μ) is constrained by the inherent feasible region limit (weight < 1). This design balances the need to represent weight uncertainty with the physical constraints of weight assignment, as coordinated weights are inherently derived from normalized initial weights (0 < initial weight < 1) and game theory aggregation preserves this boundary constraint. Thus, the random weight values will remain within the feasible region for practical application, ensuring the validity of subsequent stochastic risk analysis. This setting is supported by the empirical variability among the four weighting methods (AHP, EWM, CRITIC, PCA) in Table 2, as the weight dispersion range calculated by different methods is generally consistent with one-tenth of the coordinated mean weight. The rationality of this distributional assumption is validated via the 3σ rule inherent to normal distributions.

4.3. Overestimation Risk in Poyang Lake Health Assessment

Prior to analyzing the overestimation risk of Poyang Lake’s health assessment results, a risk level interval of 1–50% was defined to cover the typical risk spectrum of lake ecosystem health evaluation—this interval aligns with the uncertainty range commonly reported in global freshwater lake assessment studies, ensuring the rationality of risk threshold setting. Based on this interval, the corresponding reliability indices were retrieved from the standard normal distribution table, and these indices were further converted into quantitative threshold values for the 12 key assessment indicators (detailed in Section 4.3). Specifically, the derived threshold values represent the maximum allowable performance limits of each indicator under different risk levels: exceeding these thresholds indicates that the health assessment result of Poyang Lake may be overestimated to an unacceptable extent, potentially leading to biased ecological governance decisions.
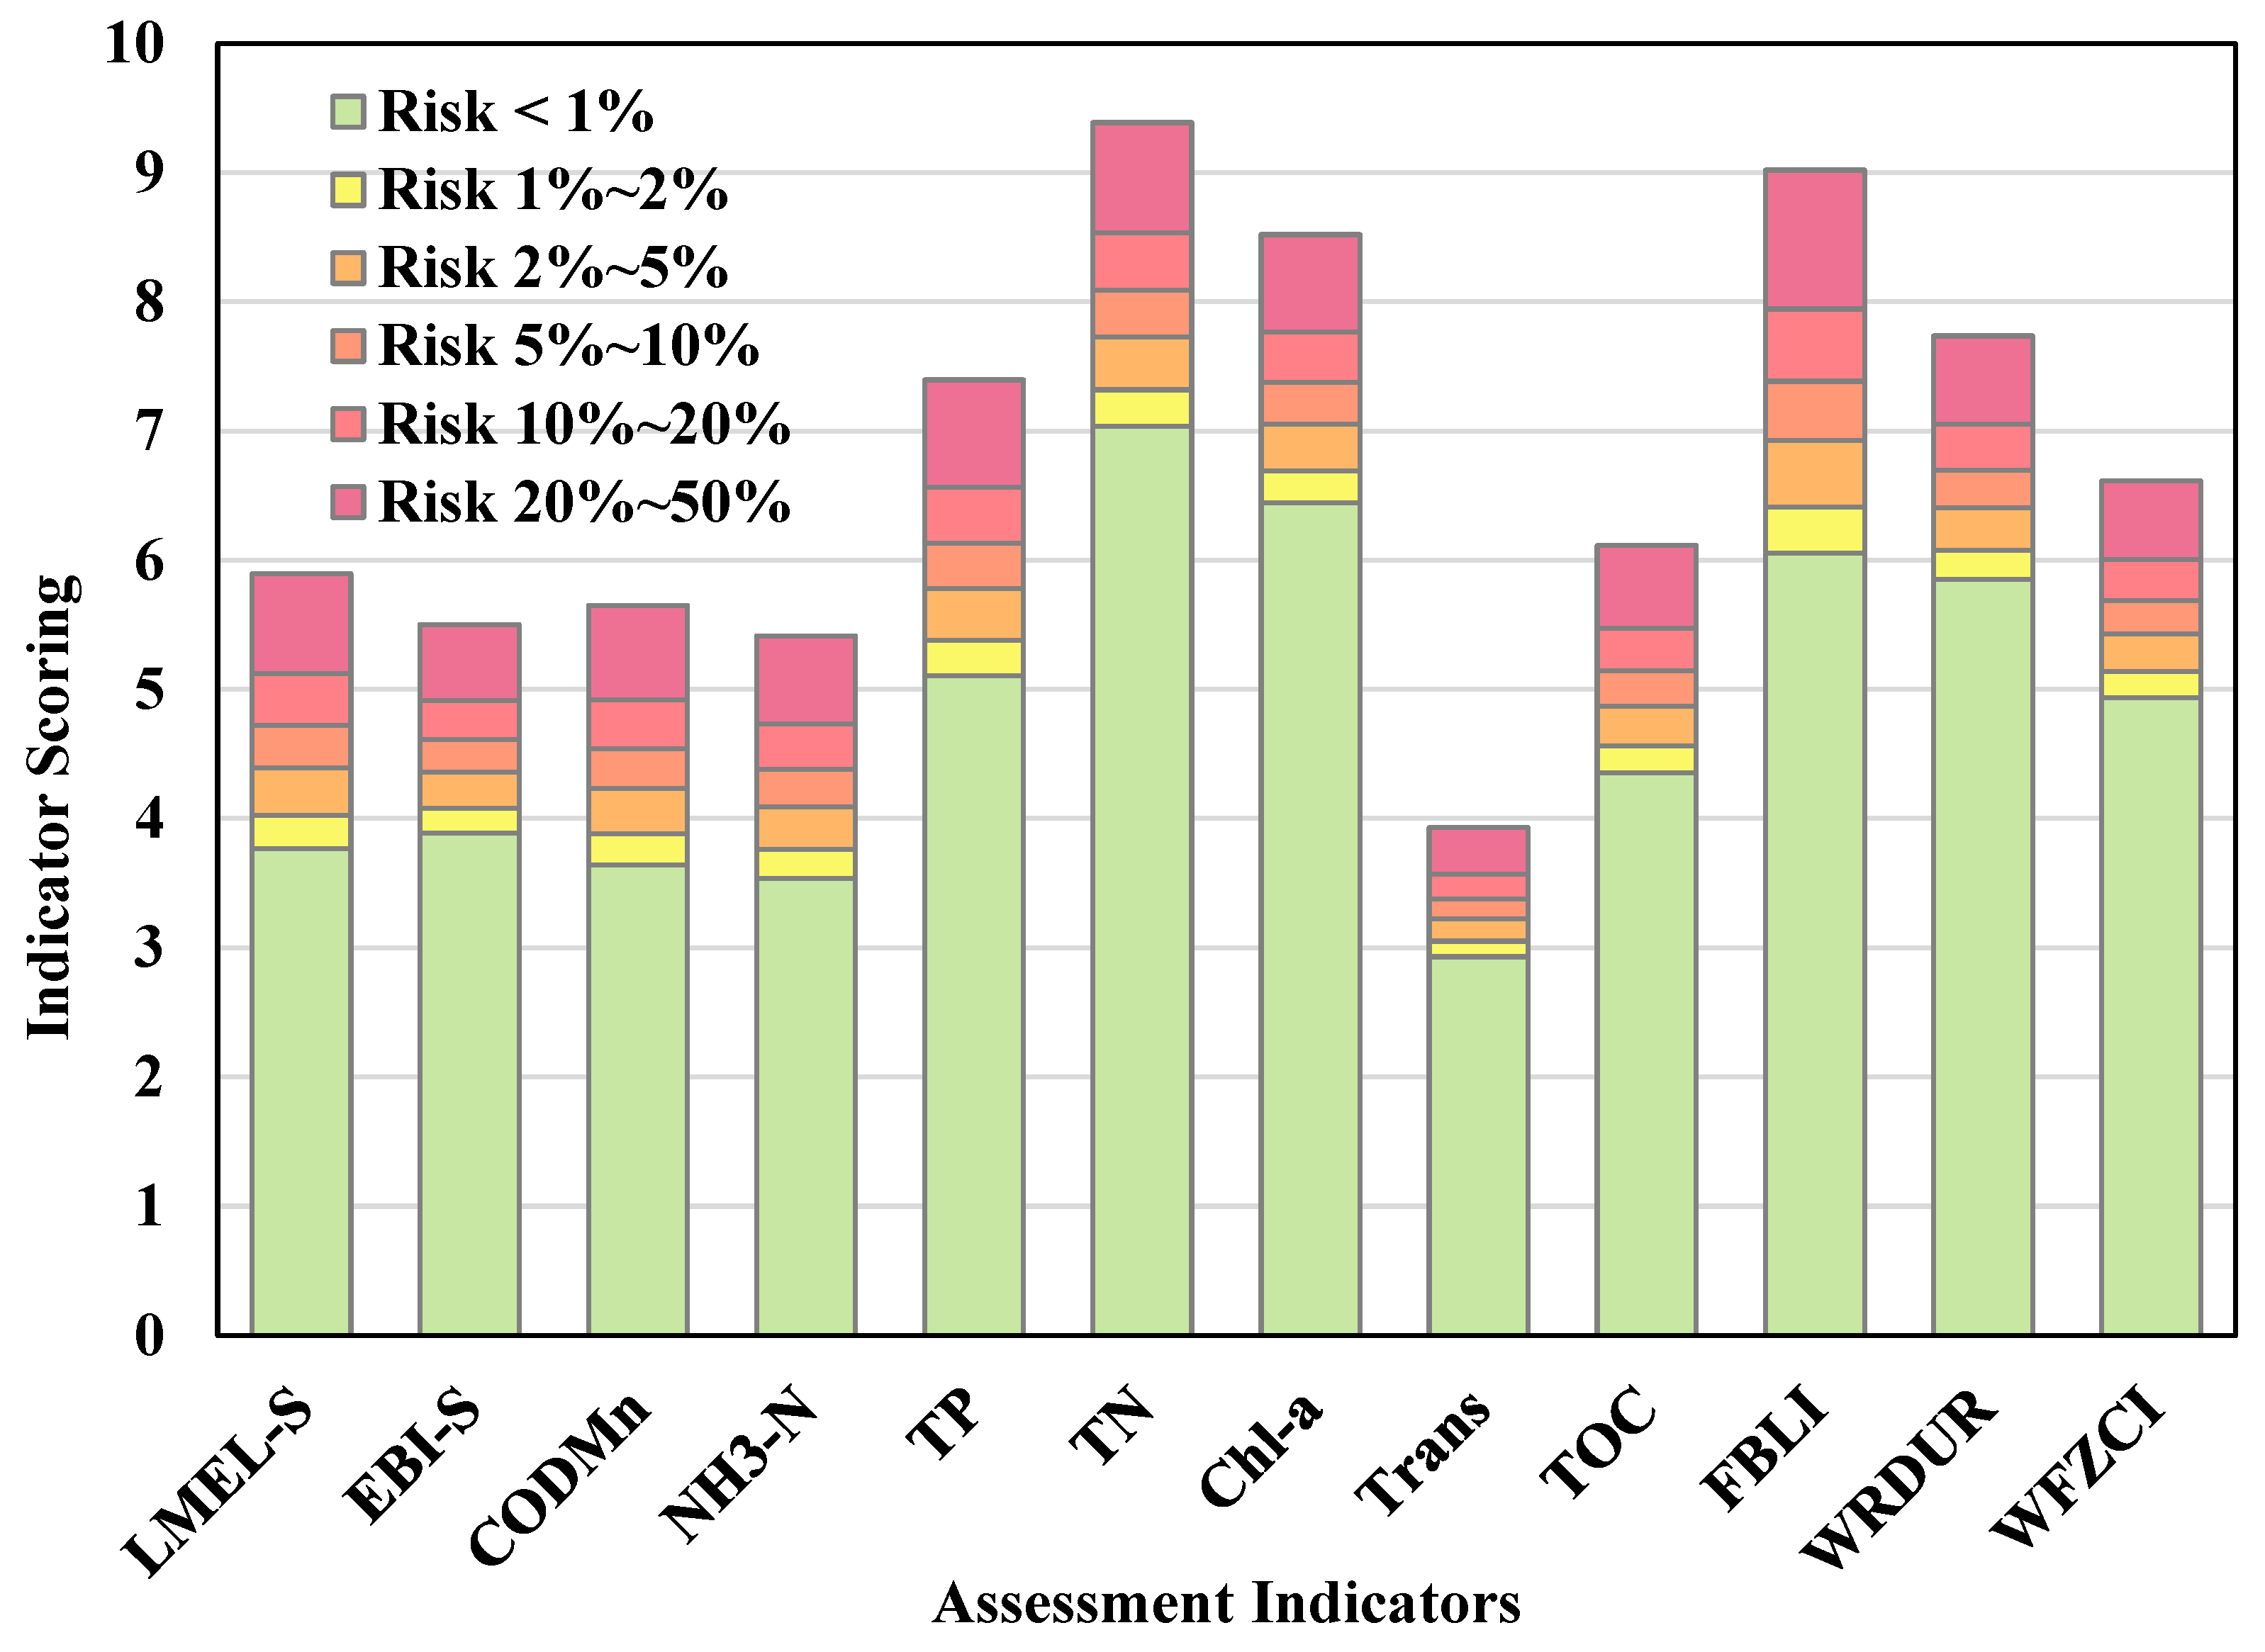
The comprehensive results of Poyang Lake’s health assessment overestimation risk analysis, including the maximum allowable indicator thresholds, corresponding risk levels, and associated overestimation probabilities, are summarized in Table 3. To facilitate intuitive understanding of the risk distribution characteristics across indicators, Figure 7 presents a histogram of the evaluation risks for each key assessment indicator, generated from the quantitative data in Table 3. This visualization employs a color-coded scheme to distinguish the risk levels associated with specific indicator threshold values, with distinct colors corresponding to different risk intervals. Such a color differentiation design enables researchers and water resource managers to quickly identify high-risk indicators (e.g., TP, Chl-a, or WRDUR) and their corresponding overestimation magnitudes, providing intuitive and targeted data support for the refinement of Poyang Lake’s health assessment framework and the optimization of ecological protection policies.

5. Discussion

5.1. Ecological Interpretation

Total phosphorus (TP), total nitrogen (TN) are key indicators of lake eutrophication, which are easily affected by seasonal hydrological fluctuations, non-point source pollution input and external disturbance, leading to strong spatiotemporal variability and large prediction deviations of indicator values. Meanwhile, the Fish Biological Loss Index (FBLI) is a comprehensive biological indicator closely related to hydrological regime, water quality and habitat integrity, with complex response mechanism and high sensitivity to weight uncertainty. The superposition of indicator value uncertainty and weight uncertainty makes these three indicators show significantly higher overestimation risk than other indicators.
Consistent with most of the previous studies on large freshwater lakes, this study identifies nutrient indicators (TP, TN) as key factors affecting lake health assessment results. Different from traditional deterministic assessment studies that ignore uncertainty, this study further quantifies the overestimation risk driven by dual uncertainties, which is more in line with the actual dynamic characteristics of lake ecosystems. The identification results of high-risk indicators are also supported by relevant studies on Poyang Lake, confirming the reliability of the proposed framework.
The FOSM method is efficient in risk quantification under uncertainty superposition, but it is based on linear approximation assumption. In nonlinear ecological systems with complex interaction mechanisms (such as the nonlinear response of aquatic organisms to nutrient changes), the linear approximation of FOSM may lead to slight deviation in risk calculation results, which is a common limitation of moment-based uncertainty analysis methods in ecological application.

5.2. Core Contributions

Methodological innovation: A standardized dual uncertainty quantification system was developed, integrating PINN-based indicator prediction, game theory-driven weight coordination, and normal distribution-based uncertainty characterization. This addresses the longstanding limitation of insufficient quantification of indicator value and weight uncertainty in existing studies, realizing systematic, operable, and reproducible description of multiple uncertainties in river-lake health assessment. The approach enhances the rigor of uncertainty-informed ecological evaluation by linking historical data dynamics, methodological differences, and statistical distribution characteristics.
Theoretical advancement: A general coupled model of dual uncertainties and overestimation risk was established, clarifying the quantitative relationship between uncertainty sources and overestimation risk. This fills the critical gap in existing research where uncertainty analysis is often isolated (focusing on either indicator values or weights) and lacks a risk coupling mechanism. The derived formulas for single-indicator and comprehensive overestimation risk provide a new theoretical foundation for quantifying evaluation bias, advancing the field from “deterministic assessment” to “probabilistic risk characterization.”
Practical relevance: Validated through a case study of Poyang Lake—a large subtropical seasonal lake with significant ecological and socio-economic value—the framework demonstrates strong adaptability and scalability. It converts abstract uncertainty into actionable risk thresholds and decision-support tools, guiding the rational allocation of ecological protection resources and improving the scientificity of governance decisions. For instance, the identification of TP, TN, and FBLI as high-risk indicators directly informs targeted eutrophication control and biodiversity conservation measures in Poyang Lake, with implications for similar freshwater ecosystems globally.

5.3. Limitations

This study assumes weight uncertainty follows a normal distribution, a simplification of complex real-world conditions where weight variability may be influenced by unmodeled factors (e.g., regional differences in management priorities, data quality variations). Future research could explore more flexible distribution models (e.g., triangular distribution, log-normal distribution) based on larger sample sizes and diverse river-lake types.
While the framework is designed to be general, the case study focuses on Poyang Lake, and its generalizability requires further verification across other ecosystem types (e.g., rivers, reservoirs, arid-region lakes) and climate zones. Differences in hydrological regimes, pollution sources, and ecological characteristics may affect the performance of the framework, necessitating context-specific parameter optimization.
The current framework does not account for the dynamic evolution of uncertainties under external disturbances (e.g., climate change, land-use change, extreme human activities). This limits its applicability in long-term dynamic assessment, where uncertainty sources and their impacts may vary over time.

5.4. Future Directions

Future research should prioritize the following avenues to expand and refine the proposed framework:
Enhance generalizability: Validate the framework across diverse river-lake ecosystems (e.g., alpine lakes, urban rivers, reservoir systems) and climate zones, optimizing model parameters to improve robustness and adaptability to different ecological contexts.
Improve uncertainty characterization: Integrate advanced statistical methods and machine learning techniques (e.g., ensemble learning, Bayesian inference) to refine the characterization of indicator value and weight uncertainty, exploring the impact of non-normal weight distributions on risk quantification results.
Incorporate dynamic disturbances: Integrate dynamic factors (e.g., climate change scenarios, land-use change projections, extreme event frequency) into the uncertainty analysis framework, developing a dynamic risk assessment model to support adaptive management of river-lake ecosystems.
Strengthen policy integration: Establish a closed-loop management mechanism linking risk assessment results to practical governance policies, translating research outcomes into actionable measures (e.g., targeted monitoring plans, adaptive management strategies) to enhance the real-world impact of the framework.

6. Conclusions

This study addresses a critical gap in river-lake health assessment: overestimation risk induced by dual uncertainties (predictive uncertainty of indicator values and methodological uncertainty of weights). A general risk analysis framework integrating uncertainty quantification, weight coordination, and overestimation risk coupling was developed and validated through a case study of Poyang Lake, yielding actionable insights for ecological assessment and governance.
Systematic quantification of dual uncertainties: Leveraging 1264 historical monitoring samples from the Poyang Lake basin, the Physics-Informed Neural Networks (PINN) model was employed to predict indicator values, with historical prediction deviations following a normal distribution to enable quantitative characterization of indicator value uncertainty. For weight uncertainty, four complementary weighting methods—Analytic Hierarchy Process (AHP), Entropy Weight Method (EWM), CRITIC, and Principal Component Analysis (PCA)—generated divergent initial weights, reflecting inherent tradeoffs between expert judgment and data-driven insights. These conflicts were resolved via a game theory-based framework guided by the Nash equilibrium criterion, yielding scientifically balanced coordinated weights. Further assuming a normal distribution (mean = coordinated weight, standard deviation = 1/10 of the mean) achieved standardized quantification of weight uncertainty, with the 3σ rule verifying that random weights strictly fall within the feasible region (0 < weight < 1), ensuring methodological rigor.
Reliable quantification of overestimation risk: The First-Order Second-Moment (FOSM) method—selected for its balance of computational efficiency and accuracy—was adopted to establish a coupled model linking dual uncertainties to overestimation risk. Derived formulas for single-indicator and comprehensive overestimation risk quantified both the probability and magnitude of overestimation risk. Results identified total phosphorus (TP), total nitrogen (TN), and the Fish Biological Loss Index (FBLI) as high-risk indicators in Poyang Lake, with maximum allowable thresholds ranging from 5.10 to 7.40, 7.04 to 9.38, and 6.05 to 9.02, respectively, across risk levels of 1–50%. These indicators are most prone to overestimation and require prioritized monitoring and management.
Practical applicability of the framework: The comprehensive overestimation risk score for Poyang Lake ranged from 74.16 to 81.17 across the defined risk interval, providing clear thresholds for ecological governance. The color-coded risk histogram intuitively visualized high-risk indicators and their deviation magnitudes, offering targeted support for optimizing the assessment indicator system and adjusting governance priorities—such as strengthening eutrophication control and ecological baseflow protection. Notably, the framework’s modular design ensures its transferability to other river-lake ecosystems beyond Poyang Lake.


Author Contributions

Conceptualization: Y.W. and J.D.; Methodology: Y.W., X.L. and Z.X.; Formal analysis and investigation: Y.W., X.L., Z.X., F.L. and H.L.; Writing—original draft preparation: Y.W.; Writing—review and editing: Y.W., J.D. and Z.X.; Funding acquisition: Y.W.; Supervision: J.D. All authors have read and agreed to the published version of the manuscript.

Funding

This work is supported by Science and Technology Project of the Department of Water Resources of Jiangxi Province (Grant No. 202527ZDKT24; 202527ZDKT23).

Data Availability Statement

All data and materials are available from the corresponding author on request.

Conflicts of Interest

The authors declare no conflicts of interest.

References

  1. Kuriata-Potasznik, A.; Szymczyk, S.; Skwierawski, A. Influence of cascading river–lake systems on the dynamics of nutrient circulation in catchment areas. Water 2020, 12, 1144. [Google Scholar] [CrossRef]
  2. Nixdorf, E.; Chen, M.; Lin, H.; Lei, X.H.; Kolditz, O. Monitoring and modeling of water ecologic security in large river-lake systems. J. Hydrol. 2020, 591, 125576. [Google Scholar] [CrossRef]
  3. Qiu, J.J.; Yuan, S.Y.; Tang, H.W.; Zhang, Q.; Wolter, C.; Nikora, V. Ecological connectivity of river-lake ecosystem: Evidence from fish population dynamics in a connecting channel. Water Resour. Res. 2024, 60, e2024WR037495. [Google Scholar] [CrossRef]
  4. Liu, W.J.; Deng, M.; Wang, Y.R.; Li, L.; Senbati, Y.; Xue, Y.P.; Song, K.; Wu, F.C. Unraveling pathogen dynamics in rivers flowing into Taihu Lake: Insights from high-throughput sequencing and environmental correlations. Water Res. X 2025, 29, 100406. [Google Scholar] [CrossRef]
  5. Fu, B.L.; Li, Y.; Zhang, B.; Yin, B.S.; Zhu, H.L.; Xin, Z.F. Study on method for assessment of the physical structure integrity in Chagan Lake in China based on remote sensing. Water Sci. Technol. 2014, 70, 1510–1518. [Google Scholar] [CrossRef] [PubMed][Green Version]
  6. Yang, G.S.; Zhang, Q.; Wan, R.R.; Lai, X.J.; Jiang, X.; Li, L.; Dai, H.C.; Lei, G.C.; Chen, J.C.; Lu, Y.J. Lake hydrology, water quality and ecology impacts of altered river–lake interactions: Advances in research on the middle Yangtze River. Hydrol. Res. 2016, 47, 1–7. [Google Scholar] [CrossRef]
  7. Wang, J.Y.; Ma, Y.K.; Zhou, X.H.; Wang, S.; Fu, Y.J.; Gao, S.H.; Meng, X.Y.; Shen, Z.Y.; Chen, L. Integrated ecological-health risk assessment of ofloxacin. J. Hazard. Mater. 2025, 487, 137178. [Google Scholar] [CrossRef] [PubMed]
  8. Liu, W.Y.; Wang, D.; Singh, V.P.; Wang, Y.K.; Zeng, X.K.; Ni, L.L.; Tao, Y.W.; Wu, J.C.; Liu, J.F.; Zou, Y.; et al. A hybrid statistical model for ecological risk integral assessment of PAHs in sediments. J. Hydrol. 2020, 583, 124612. [Google Scholar] [CrossRef]
  9. Xu, Z.A.; Li, T.; Bi, J.; Wang, C. Spatiotemporal heterogeneity of antibiotic pollution and ecological risk assessment in Taihu Lake Basin, China. Sci. Total. Environ. 2018, 643, 12–20. [Google Scholar] [CrossRef] [PubMed]
  10. Huang, D.J.; Tian, C.C.; Wu, W.T.; Shen, D.D.; Sang, J.; Wang, H. Comprehensive River health evaluation indicator system and its application. Pol. J. Environ. Stud. 2025, 34, 187119. [Google Scholar] [CrossRef] [PubMed]
  11. Pander, J.; Geist, J. Ecological indicators for stream restoration success. Ecol. Indic. 2013, 30, 106–118. [Google Scholar] [CrossRef]
  12. Ndatimana, G.; Dusabe, M.C.; Albrecht, C. Bridging riverine and lacustrine systems: Macroinvertebrate indicators of ecological health in the Rwandan Congo basin. Environ. Monit. Assess. 2025, 197, 1218. [Google Scholar] [CrossRef] [PubMed]
  13. Yu, S.Y.; Sturm, K.; Gibbes, B.; Kennard, M.J.; Veal, C.J.; Middleton, D.; Fisher, P.L.; Rotherham, S.; Hamilton, D.P. Developing best practice guidelines for lake modelling to inform quantitative microbial risk assessment. Environ. Model. Softw. 2022, 150, 105334. [Google Scholar] [CrossRef]
  14. Cao, F.M.; Li, Z.Z.; He, Q.; Lu, S.Y.; Qin, P.; Li, L.L. Occurrence, spatial distribution, source, and ecological risk assessment of organochlorine pesticides in Dongting Lake, China. Environ. Sci. Pollut. Res. 2021, 28, 30841–30857. [Google Scholar] [CrossRef] [PubMed]
  15. Wan, R.R.; Yang, G.S.; Dai, X.; Zhang, Y.H.; Li, B. Water security-based hydrological regime assessment method for lakes with extreme seasonal water level fluctuations: A case study of Poyang Lake, China. Chin. Geogr. Sci. 2018, 28, 456–469. [Google Scholar] [CrossRef]
  16. Gayen, J.; Datta, D. Application of pressure–state–response approach for developing criteria and indicators of ecological health assessment of wetlands: A multi-temporal study in Ichhamati floodplains, India. Ecol. Process. 2023, 12, 34. [Google Scholar] [CrossRef]
  17. Cai, S.Y.; Zuo, D.P.; Wang, H.X.; Han, Y.N.; Xu, Z.X.; Wang, G.Q.; Yang, H. Improvement of drought assessment capability based on optimal weighting methods and a new threshold classification scheme. J. Hydrol. 2024, 631, 130758. [Google Scholar] [CrossRef]
  18. Liu, Y.; Mu, Z.; Dong, W.; Huang, Q.; Chai, F.; Fan, J.J. Establishment of an evaluation indicator system and evaluation criteria for the Weihe River ecological watersheds. Water 2024, 16, 2393. [Google Scholar] [CrossRef]
  19. Cunha-Zeri, G.; Guidolini, J.F.; Branco, E.A.; Ometto, J.P. How sustainable is the nitrogen management in Brazil? A sustainability assessment using the Entropy Weight Method. J. Environ. Manag. 2022, 316, 115330. [Google Scholar] [CrossRef] [PubMed]
  20. Xie, C.; Yang, Y.F.; Liu, Y.; Liu, G.Q.; Fan, Z.W.; Li, Y. A nation-wide framework for evaluating freshwater health in China: Background, administration, and indicators. Water 2020, 12, 2596. [Google Scholar] [CrossRef]
  21. Yang, Z.; Yang, K.; Su, L.W.; Hu, H. Two-dimensional grey cloud clustering-fuzzy entropy comprehensive assessment model for river health evaluation. Hum. Ecol. Risk Assess. 2020, 26, 726–756. [Google Scholar] [CrossRef]
  22. Zhou, K. Application of set-pair analysis and extension coupling model in health evaluation of the Huangchuan River, China. Appl. Water Sci. 2022, 12, 198. [Google Scholar] [CrossRef]
  23. Zhang, P.; Cai, L.; Yang, Z.; Chen, X.J.; Qiao, Y.; Chang, J.B. Evaluation of fish habitat suitability using a coupled ecohydraulic model: Habitat model selection and prediction. River Res. Appl. 2018, 34, 937–947. [Google Scholar] [CrossRef]
  24. Luo, T.S.; Sun, X.F.; Zhou, H.L.; Xu, Y.P.; Zhang, Y. A reservoir group flood control operation decision-making risk analysis model considering indicator and weight uncertainties. Water 2025, 17, 2145. [Google Scholar] [CrossRef]
  25. Brecht, R.; Cardoso-Bihlo, E.; Bihlo, A. Physics-informed neural networks for tsunami inundation modeling. J. Comput. Phys. 2025, 536, 114066. [Google Scholar] [CrossRef]
  26. Gass, S.I. Model world: The great debate—MAUT versus AHP. Interfaces 2005, 35, 308–312. [Google Scholar] [CrossRef]
  27. Wu, J.Z.; Zhang, Q.A. Multicriteria decision making method based on intuitionistic fuzzy weighted entropy. Expert Syst. Appl. 2011, 38, 916–922. [Google Scholar] [CrossRef]
  28. Zhang, Q.; Fan, J.H.; Gao, C.B. CRITID: Enhancing CRITIC with advanced independence testing for robust multi-criteria decision-making. Sci. Rep. 2024, 14, 25094. [Google Scholar] [CrossRef] [PubMed]
  29. Fujimori, K.; Goto, Y.; Liu, Y.; Taniguchi, M. Sparse principal component analysis for high-dimensional stationary time series. Scand. J. Stat. 2023, 50, 1953–1983. [Google Scholar] [CrossRef]
  30. Yu, J.G.; Liu, S.; Zou, Y.F.; Wang, G.J.; Hu, C.Q. Auction Theory and Game Theory Based Pricing of Edge Computing Resources: A Survey. IEEE Internet Things J. 2025, 12, 32394–32418. [Google Scholar] [CrossRef]
  31. Ahmad, F.; Al-Fagih, L. Travel behaviour and game theory: A review of route choice modeling behaviour. J. Choice Model. 2024, 50, 100472. [Google Scholar] [CrossRef]
  32. Yarar, N.; Yoldas, Y.; Bahceci, S.; Onen, A.; Jung, J. A Comprehensive Review Based on the Game Theory with Energy Management and Trading. Energies 2024, 17, 3749. [Google Scholar] [CrossRef]
  33. Zhou, C.W.; Liu, G.; Liao, S.M. Probing dominant flow paths in enhanced geothermal systems with a genetic algorithm inversion model. Appl. Energy 2024, 360, 122841. [Google Scholar] [CrossRef]
  34. Priya, G.V.; Ganguly, S. Multi-swarm surrogate model assisted PSO algorithm to minimize distribution network energy losses. Appl. Soft Comput. 2024, 159, 111616. [Google Scholar] [CrossRef]
  35. Wu, Y.N.; Wang, H.; Li, M.H.; Tan, H.; Wang, D.; Sheng, M.Q. The adaptive two-stage ant colony Simulated Annealing Algorithm for solving the Traveling Salesman Problem. RAIRO-Oper. Res. 2025, 59, 1199–1213. [Google Scholar] [CrossRef]
  36. Chernozhukov, V.; Chetverikov, D.; Kato, K. Central limit theorems and bootstrap in high dimensions. Ann. Probab. 2017, 45, 2309–2352. [Google Scholar] [CrossRef]
  37. Loukas, A.; Quick, M.C.; Russell, S.O. A physically based stochastic-deterministic procedure for the estimation of flood frequency. Water Resour. Manag. 1996, 10, 415–437. [Google Scholar] [CrossRef]
  38. Kuang, Y.Q.; Xiong, L.H.; Yu, K.X.; Liu, P.; Xu, C.Y.; Yan, L. Comparison of first-order and second-order derived moment approaches in estimating annual runoff distribution. J. Hydrol. Eng. 2018, 23, 04018034. [Google Scholar] [CrossRef]
Figure 1. A unique deterministic value.
Water 18 01590 g001
Figure 2. A uniform distribution over a predefined interval.
Water 18 01590 g002
Figure 3. Any arbitrary distribution within a given interval.
Water 18 01590 g003
Figure 4. No prior information regarding the indicator weights is available.
Water 18 01590 g004
Figure 5. Map of Study Area.
Water 18 01590 g005
Figure 6. Poyang Lake River-Lake Health Evaluation Index System.
Water 18 01590 g006
Figure 7. Histogram of the evaluation risks for each key assessment indicator.
Water 18 01590 g007
Table 1. Mathematical expectations and standard deviations for each normalized assessment indicator.
IndicatorMeanStd. Dev.IndicatorMeanStd. Dev.
LMEL-S72.38.55Chl-a90.42.79
EBI-S71.05.46Trans82.73.57
CODMn80.79.31TOC76.45.55
NH3-N85.69.45FBLI83.98.36
TP71.86.29WRDUR88.42.72
TN86.13.38WFZCI85.63.68
Table 2. Assessment indicator weights and their stochastic uncertainty specifications.
IndicatorAHPEWMCRITICPCACoordinated WeightMeanStd. Dev.
LMEL-S0.1200.0720.0720.0620.0850.0820.008
EBI-S0.1200.0630.0740.0530.0850.0780.008
CODMn0.0450.0810.0720.0820.0680.0700.007
NH3-N0.0350.0820.0630.0730.0670.0630.006
TP0.0850.1120.1030.1120.1030.1030.010
TN0.0750.1020.1170.1420.1120.1090.011
Chl-a0.0850.0920.0980.1020.1010.0940.009
Trans0.0350.0510.0420.0620.0410.0480.005
TOC0.0450.1010.0820.0920.0780.0800.008
FBLI0.1550.0910.1020.0820.1080.1080.011
WRDUR0.1050.0810.0920.0720.0820.0880.009
WFZCI0.0950.0710.0810.0620.0700.0770.008
Table 3. Maximum allowable thresholds of key assessment indicators under different acceptable risk levels.
IndicatorMaximum Allowable Thresholds Under Different Acceptable Risk Levels
Pft,max = 1%Pft,max = 2%Pft,max = 5%Pft,max = 10%Pft,max = 20%Pft,max = 50%
LMEL-S3.774.024.394.725.125.89
EBI-S3.894.084.364.614.925.50
CODMn3.643.884.234.544.925.65
NH3-N3.543.764.094.384.735.41
TP5.105.385.786.136.567.40
TN7.047.327.738.098.539.38
Chl-a6.446.697.057.377.778.52
Trans2.933.053.223.383.573.93
TOC4.354.564.875.145.476.11
FBLI6.056.416.927.387.949.02
WRDUR5.856.086.406.707.057.74
WFZCI4.945.145.435.696.006.61
Comprehensive score74.1675.0076.2277.3078.6281.17
Disclaimer/Publisher’s Note: The statements, opinions and data contained in all publications are solely those of the individual author(s) and contributor(s) and not of MDPI and/or the editor(s). MDPI and/or the editor(s) disclaim responsibility for any injury to people or property resulting from any ideas, methods, instructions or products referred to in the content.