Article

Projections of Temperature-Driven Changes in Seasonal Ice Coverage Around Prince Edward Island, Canada


1
Canadian Centre for Climate Change and Adaptation, University of Prince Edward Island, St. Peters Bay, PE C0A 2A0, Canada
2
School of Climate Change and Adaptation, University of Prince Edward Island, Charlottetown, PE C1A 4P3, Canada
*
Author to whom correspondence should be addressed.
Water 2026, 18(7), 777; https://doi.org/10.3390/w18070777
Submission received: 8 February 2026 / Revised: 23 March 2026 / Accepted: 23 March 2026 / Published: 25 March 2026
(This article belongs to the Special Issue Coastal Flood Hazard Risk Assessment and Mitigation Strategies)

Highlights

What are the main findings?
  • Seasonal ice coverage metrics correlate well with near-surface air temperatures via freezing degree days.
  • Ice coverage around Prince Edward Island in the southern Gulf of Saint Lawrence is projected to decrease by 66–96% this century, depending on the emission scenario.
  • The rate of change in ice coverage is linked to a site’s exposure to wind and waves.
  • Areas with lower baseline ice coverage are losing ice at an increased rate.
  • Ice changes are evident in the historical data with a >40% decrease observed from 1981 to 2025.
What are the implications of the main findings?
  • Reduction or elimination of seasonal ice has impacts on the local biodiversity, geomorphology, and economy.
  • A variety of outcomes across the province may elicit different appropriate responses.
  • The methodology presented requires minimal input data and uncomplicated analysis.

Abstract

Seasonal ice is typically present in the southern Gulf of Saint Lawrence from December through March; however, climate change is predicted to reduce this season and alter local ecosystems, geomorphologies, and infrastructure. This impact assessment ascertains the influence of climate change on the ice coverage along Prince Edward Island’s coast. Ice concentration data from 50 study sites were logarithmically correlated with cumulative freezing degree days (FDDs). Correlations were generally good (mean R2 = 0.63), although poorer values were observed in areas with greater exposure to wind and waves. An ensemble of the CMIP6 models’ forecasts of future temperatures showed that FDD will drop from an average of 487 °C days during the historical period (1981–2025) to less than 164 °C days in the 2090s under a low-emission scenario, SSP1-2.6. For the same study period, a high-emission scenario (SSP5-8.5) projects FDD to drop to 28 °C days by the end of the century, while a moderate-emission scenario (SSP2-4.5) forecasts 97 °C days annually. Seasonal ice indices demonstrated a similarly substantial decrease, from an average historical value of 11.1 to 3.8, 3.2, and 0.8 for SSP1-2.6, SSP2-4.5, and SSP5-8.5, respectively. The length of the ice season was also analyzed, with mean season lengths for the 2090s ranging from 3 to 24 days, depending on the emission scenario, representing a 70–96% reduction in season length from the baseline observation. Mild variations were measured in the rate of ice loss throughout the province; however, significant differences in the ice coverage’s baseline values, due to local currents and wave exposure, led to a broad range in the relative proportions of ice loss, with areas along the eastern coastline projecting zero ice winters. Over the next 80 years, projections point to a considerable decline in ice coverage around Prince Edward Island.

1. Introduction

The global temperature has already risen by more than 1 °C above pre-industrial levels and will continue to rise until at least mid-century [1]. One of the many ramifications of global warming is the minimization or elimination of seasonal ice formation in temperate and polar climates. Prince Edward Island (PEI), situated in the southern Gulf of St. Lawrence, is Canada’s smallest province with an area of 5660 km2. The island is located within the Dfb Koppen classification zone, with a mild-summer humid continental climate. The annual mean temperature is 6.1 °C, although temperatures vary substantially throughout the year [2]. During August and July, the warmest months of the year, the average daily high is 23 °C. By contrast, mean temperatures in January and February are −7 °C, with a low of −12 °C. Near-surface air temperatures drop below freezing around mid-November and persist through the winter months. Ice is formed in the coastal areas starting in late December. As winter ends and the Gulf warms, the ice typically begins to break up in March, and waters are ice-free by the end of April [2].
With a coastline of over 1100 km of soft sandstone bedrock, PEI is particularly vulnerable to coastal erosion [3]. Sea ice provides excellent erosion protection over the winter season [4]. Landfast ice offers extensive shoreline defense, reducing erosion rates to insignificant levels during the ice season [5,6]. Ice floes also offer protection in the form of wave attenuation and fetch interruption, which diminishes the destructive power of coastal winter storms [7]. Models have demonstrated that ice floe concentration is inversely correlated to wave height and frequency [8]. This seasonal protection threatens to disappear as climate change-induced warming inhibits ice formation in the Gulf of St. Lawrence [9]
Biodiversity in the Gulf is also strongly influenced by seasonal ice, causing changes to the productivity and distribution of benthic and pelagic species [10,11,12]. Studies have demonstrated geographic and seasonal shifts in phytoplankton blooms and zooplankton communities [13,14,15]. Elsewhere, significant losses in biodiversity have been observed in correlation with ice loss, with nematodes and flatworms being particularly at risk [16]. Losses of such species have impacts across the food chain. Additionally, hooded and harp seals inhabiting Atlantic Canada use sea ice as a refuge for pupping and nursing [17]. A 2005 study demonstrated the link between low ice coverage and seal pup mortality [18]. Land-based coastal species also experience effects from accelerated coastal erosion due to ice loss [11]. Threatened local species, such as piping plovers and bank swallows, are particularly vulnerable to such changes.
Maritime activity in the province will also be impacted by reduced ice coverage. The Canadian Coast Guard offers seasonal icebreaking services, required for navigation assistance, harbor breakouts, flood control, and rescue operations during ice-heavy conditions [19]. Climate change-driven ice reduction in the area may allow the Coast Guard to safely reduce capacity and decommission vessels. Commercial shipping, fishing, and transportation industries may have opportunities to extend their active seasons.
This work aims to assess the imminent impacts of climate change on sea ice around Prince Edward Island. A 2021 report commissioned by the province evaluated threats posed by climate change and concluded that “coastal erosion poses the greatest level of risk to PEI by 2050,” and local concerns about the loss of coastal protection by seasonal ice are mounting [20]. The analysis demonstrated here correlates air temperature data to nearshore ice concentrations, allowing for the extrapolation of readily available temperature projections to yield regional sea ice projections. This temperature-based methodology provides important information to local residents and policymakers and can be easily applied to other temperate communities facing this issue.
This paper is organized as follows: (1) analysis of temperature changes across PEI for 1981–2100 using an ensemble of CMIP6 GCMs; (2) calculation of cumulative freezing degree days using historical temperature data and future projections; (3) correlation of historical FDD with two ice metrics, seasonal ice index, and season length; and (4) projections of future ice coverage using three emission scenarios.

2. Materials and Methods

This study followed the basic methodology of Fenech and MacLellan for rapid assessment of the impacts of climate change [21]. Data analyses were performed in R (v. 4.2.2). Past climate data for the Charlottetown airport weather station (ID: GHCND:CA008300300) was sourced from Environment Canada [2]. Note that the season of interest spans November through April and that this period is denoted as winter of the new year (e.g., November 1980 to April 1981 is called winter 1981). The historical dataset comprises winters 1981–2025. Daily average temperatures in October never dropped below the freezing temperature of seawater during the historical period. Complete ice breakup was observed by April 30 in 44 of 45 historical datasets, with the outlying 2015 season experiencing lingering ice in some areas for the first week of May. Temperature projections were derived from an ensemble of 21 CMIP6 global climate models accessed via the Copernicus Climate Change Service Climate Data Store [22]. Results were differentiated by shared socioeconomic pathway (SSP), including projections of SSP1-2.6, SSP2-4.5, and SSP5-8.5 representing low-, medium-, and high-emission scenarios. Models were selected based on the criteria of existing historical experiments and projections for each scenario included in the database.
Freezing conditions were quantified using cumulative freezing degree days (FDDs), a widely used index for evaluating the length of time with appropriate temperatures for ice development. FDD is calculated as the sum of average daily degrees below freezing for a given period; this analysis used −1.8 °C as the freezing threshold for seawater (Equation (1)). To capture the full seasonal range of freezing conditions, FDDs were calculated for the period of November 1 through April 30. Any freezing events outside of this range are deemed outliers and were excluded from the analysis.
FDD = ∑ (−1.8 °C − Tmean)    for Tmean < −1.8 °C
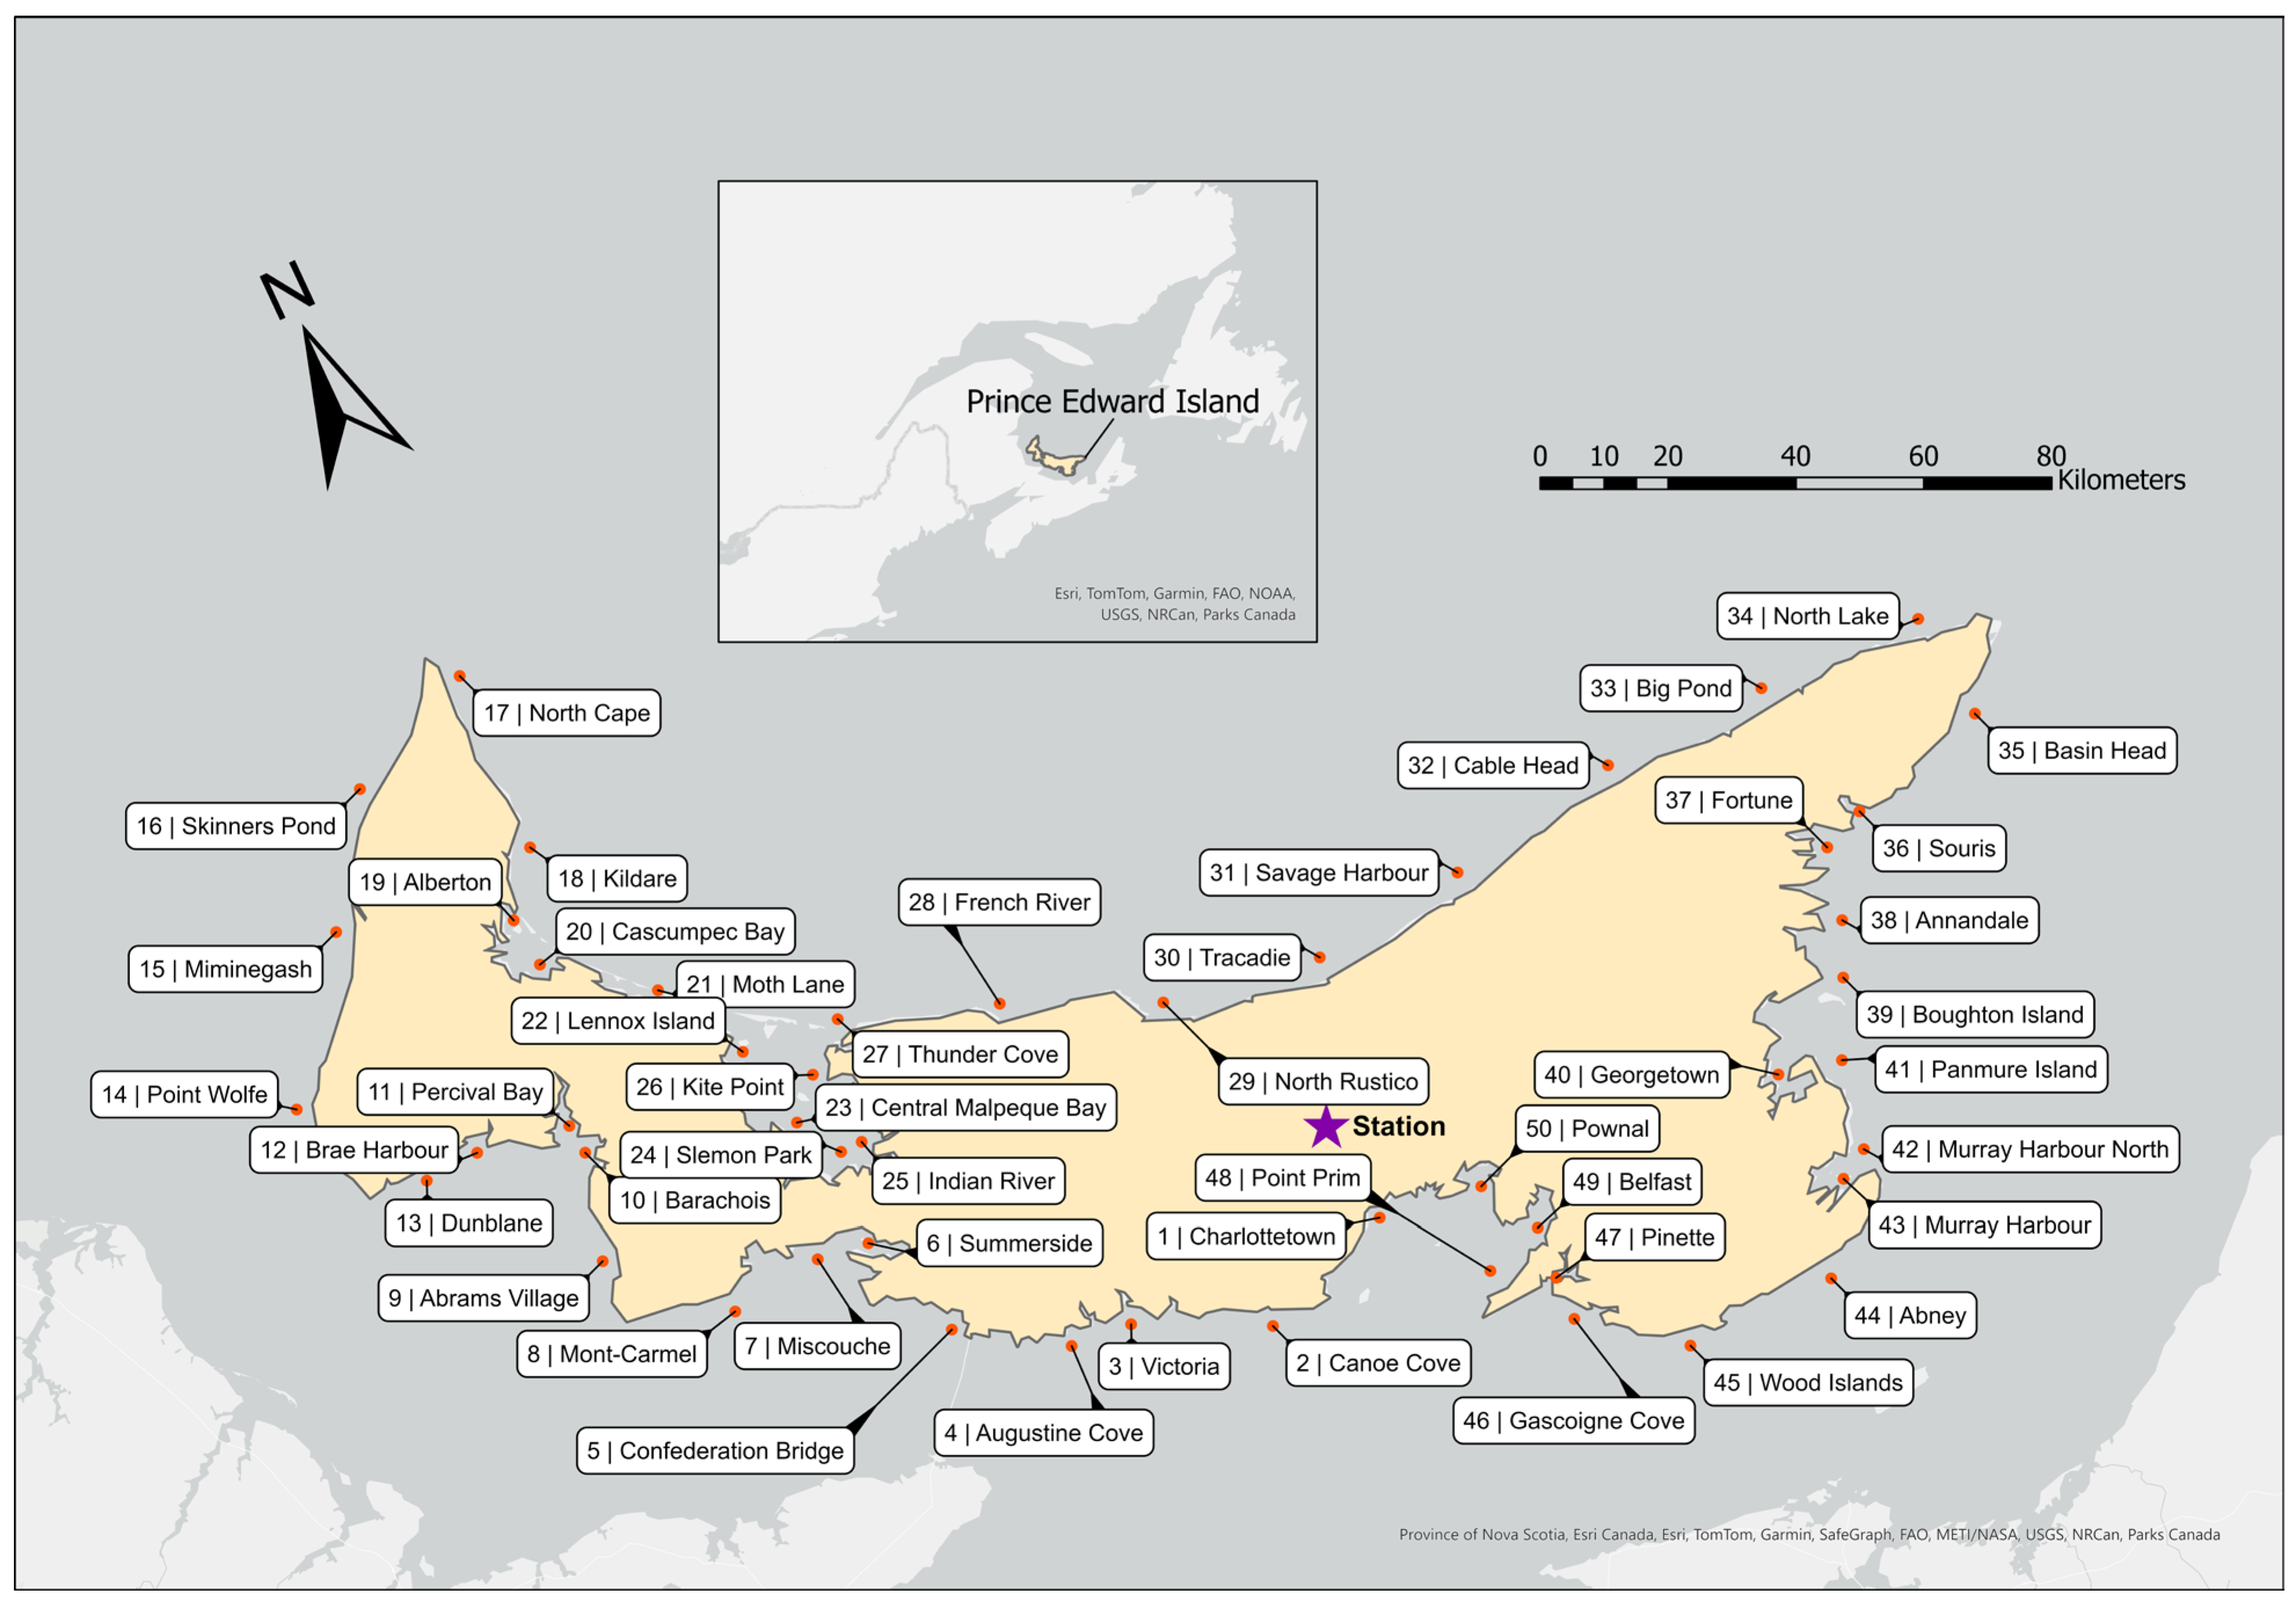
Weekly eastern coast regional ice data was downloaded from the Canadian Ice Service online archive [23]. Using ArcGIS Pro 3.1.3, values for total ice concentration were extracted at 50 designated points in nearshore areas around the province to ensure complete coverage of the provincial coastline. A map of the study area is shown in Figure 1, and the list of points used in this analysis can be found in Table S1. The sum of ice concentrations over the defined period for a particular single study site, the seasonal ice index (SII), is the parameter used to assess annual ice coverage in this analysis (Equation (2)). Cice is the total concentration of ice reported in tenths in the polygon intersecting the study site from the CIS data. Since the ice profiles in the area rarely display partial ice coverage, SII may be considered analogous to the duration of ice season in weeks.
SII = ∑ Cice
Six different models were assessed in R 4.2.2 for the correlation of FDD with SII. The linear model function, lm(), was used for correlation types linear, linear through zero, log(FDD) versus SII, and second-degree polynomial of FDD versus SII. The nonlinear least squares function, nls(), was used with the self-starting logistic model, SSlogis, for the sigmoid correlation. The piecewise models were generated using the multiple changepoint function, mcp(), from the mcp package (version 0.3.4) with support from the rjags package (version 4.15) using 10,000 iterations from 10 chains across 3 cores. The piecewise models were compared to similarly generated linear models using leave-one-out cross-validation with the loo() function in the loo package (version 2.7.0). Mann–Kendall tests were performed using the mk.test() function of the trend package (version 1.1.6).
Logarithmic regressions were performed to assess the correlation between the seasonal ice index at each site and cumulative annual freezing degree days in Charlottetown. The Charlottetown weather station was the only location in the province with adequate temporal coverage. Air temperatures across Prince Edward Island are typically very consistent, varying by less than 1 °C (see the Supplementary Materials for additional context on PEI temperatures). These logarithmic relationships were used to forecast future ice coverage (as SII) based on temperature projections. This correlation was deemed sufficient when the coefficient of determination (R2) was greater than 0.2 [24]. Strong positive correlations were obtained for each of the fifty study sites.

3. Results

3.1. Temperature

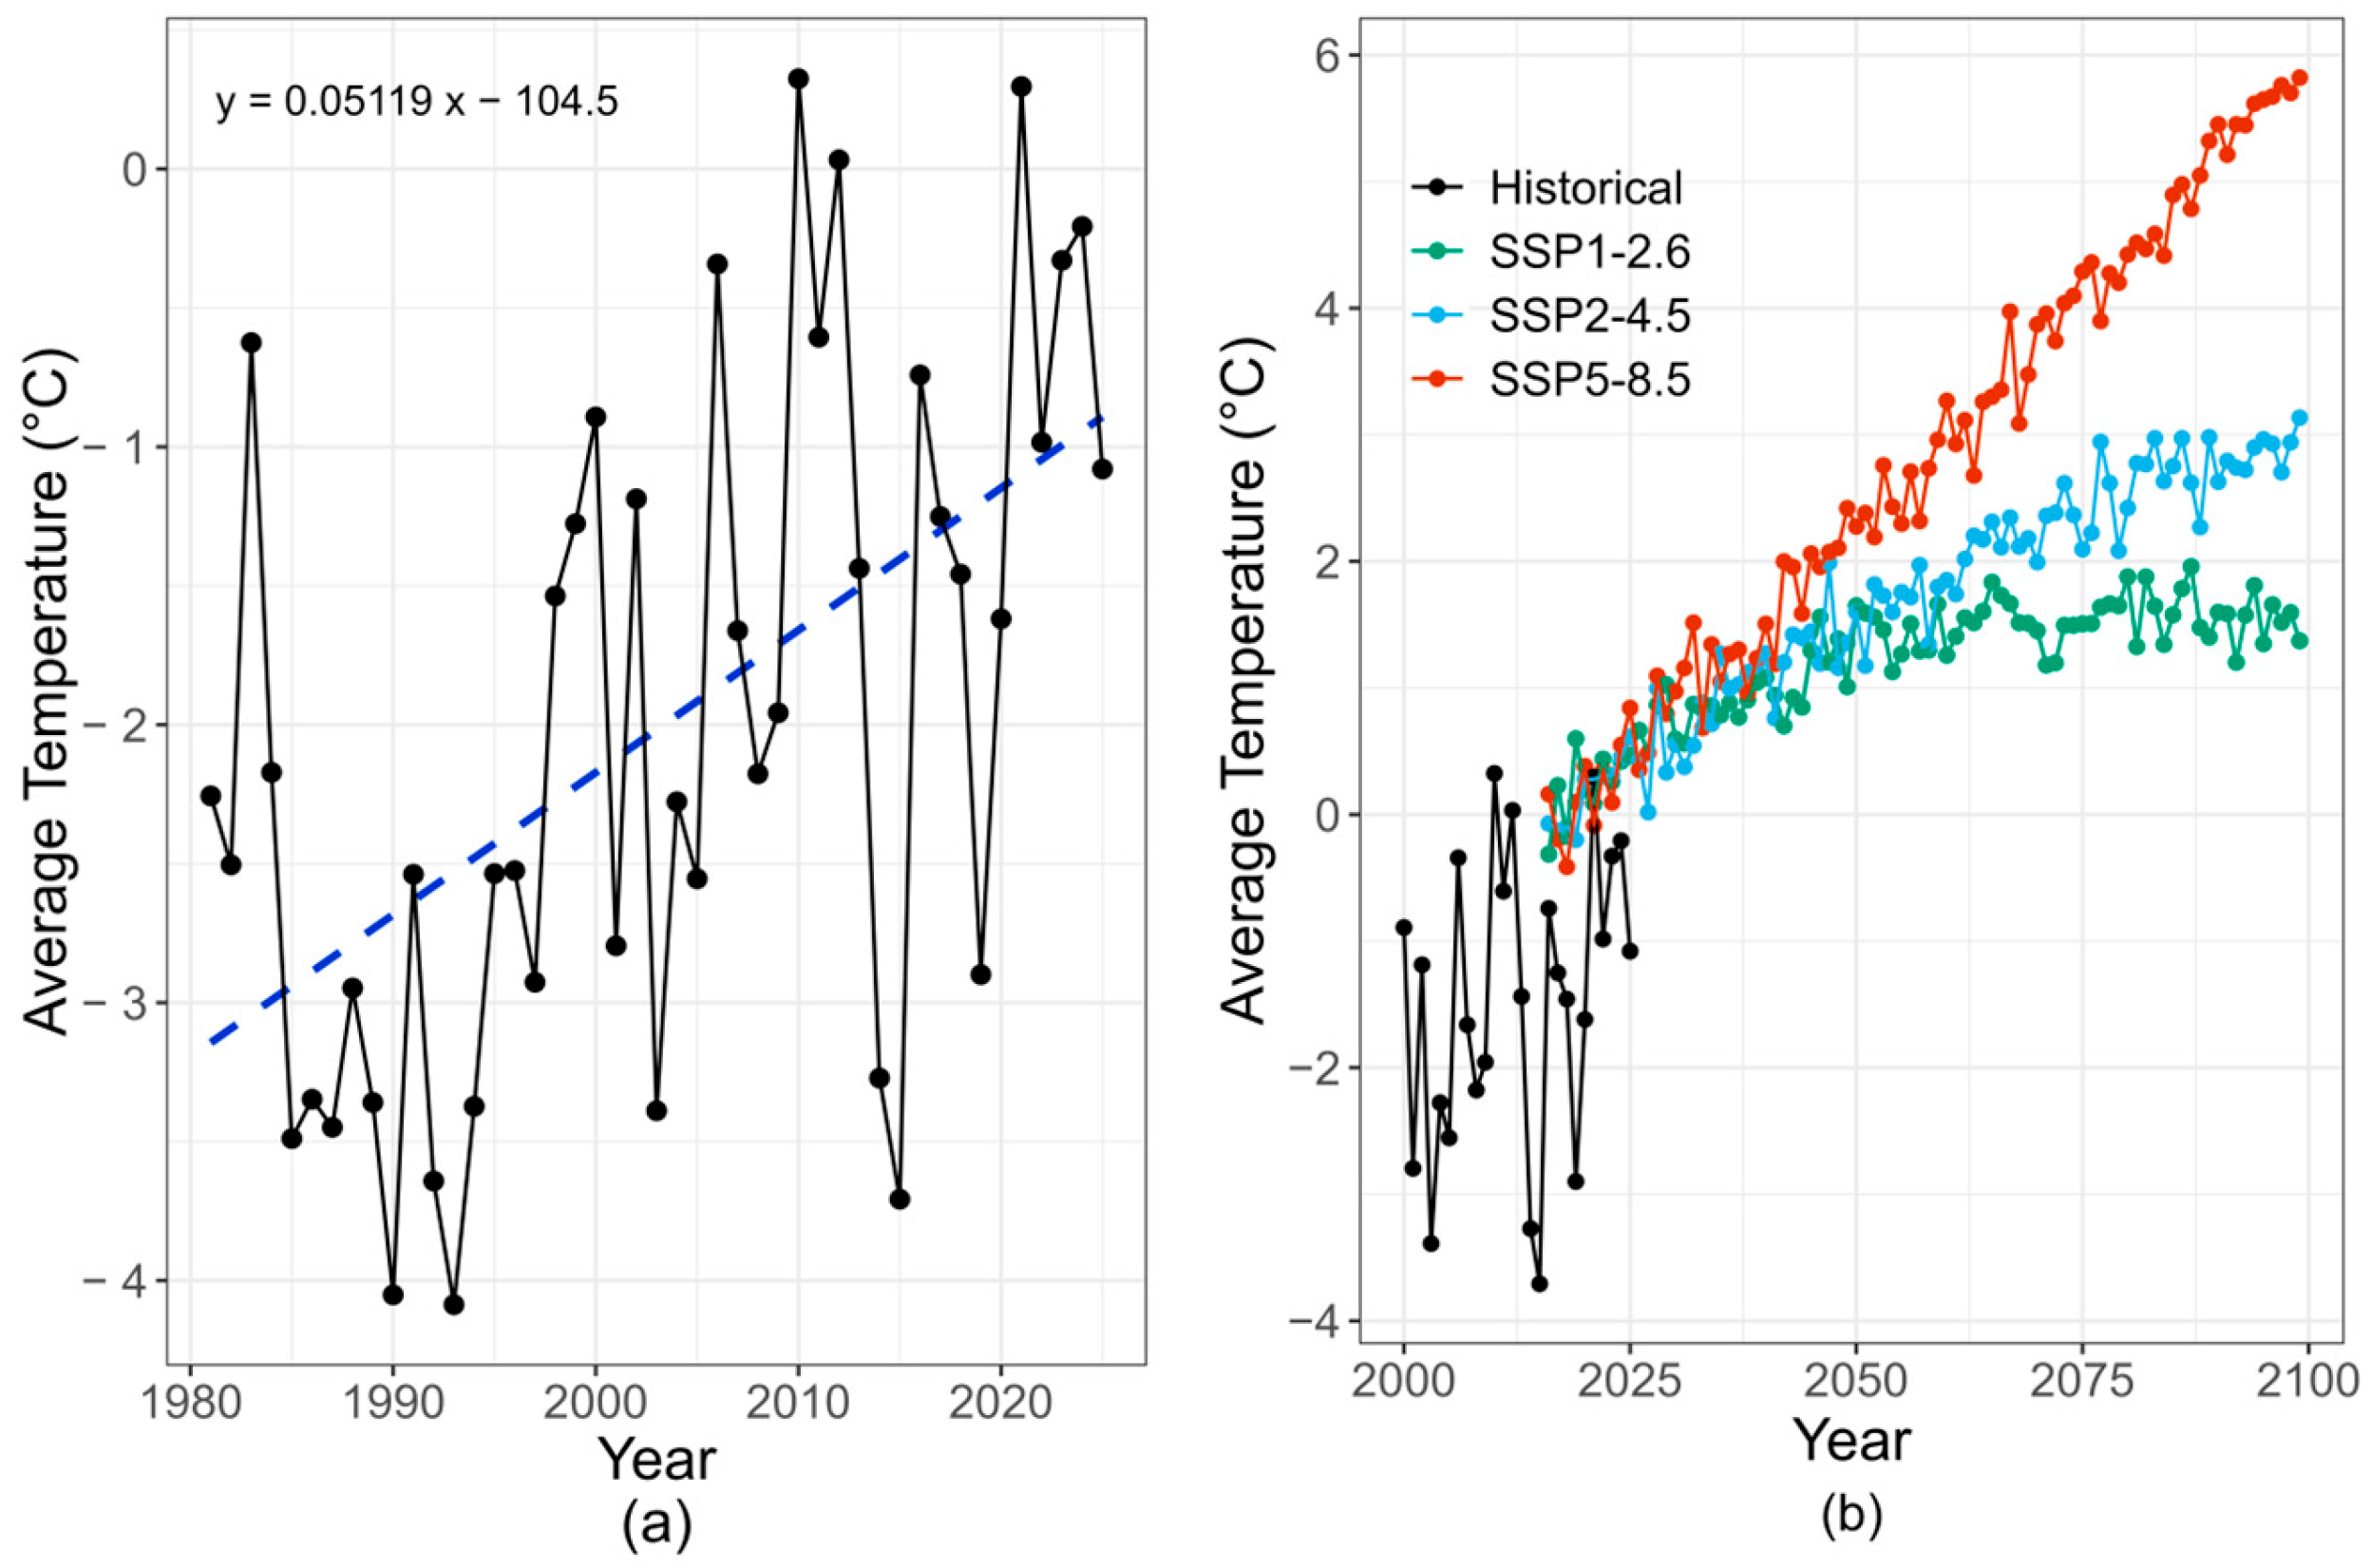
The Charlottetown Airport station shows a substantial increase in temperature over the historical period. Linear regression of average temperatures during the ice season, from November to April, indicates a rate of change of 0.51 °C/decade (Figure 2a), substantially greater than the global average of 0.18 °C/decade and North American average of 0.27 °C/decade [25]. The average seasonal temperature during the baseline period is −2.1 °C.
The model projections for the mean temperature of the study area are depicted in Figure 2b. The SSP1-2.6 model projects a stabilization of local temperature around the middle of the century. The projected average seasonal temperature for SSP1-2.6 in the 2050s is 1.40 °C with a minor increase in the latter half of the century to reach 1.49 °C in the 2090s. The moderate- and high-emission scenarios demonstrate continued warming throughout the century. For the SSP2-4.5 scenario, the temperature is expected to increase at a mean rate of 0.37 °C/decade over the next 75 years. The projected average temperature during the ice season is 2.81 °C for the 2090s under SSP2-4.5. In a zero-mitigation scenario, SSP5-8.5, warming is expected to accelerate to 0.72 °C/decade resulting in average winter temperatures during the 2090s of 5.52 °C. These projections indicate up to 7.5 °C of warming during November to April over the current century. Loss of sea ice is one implication of this warming.
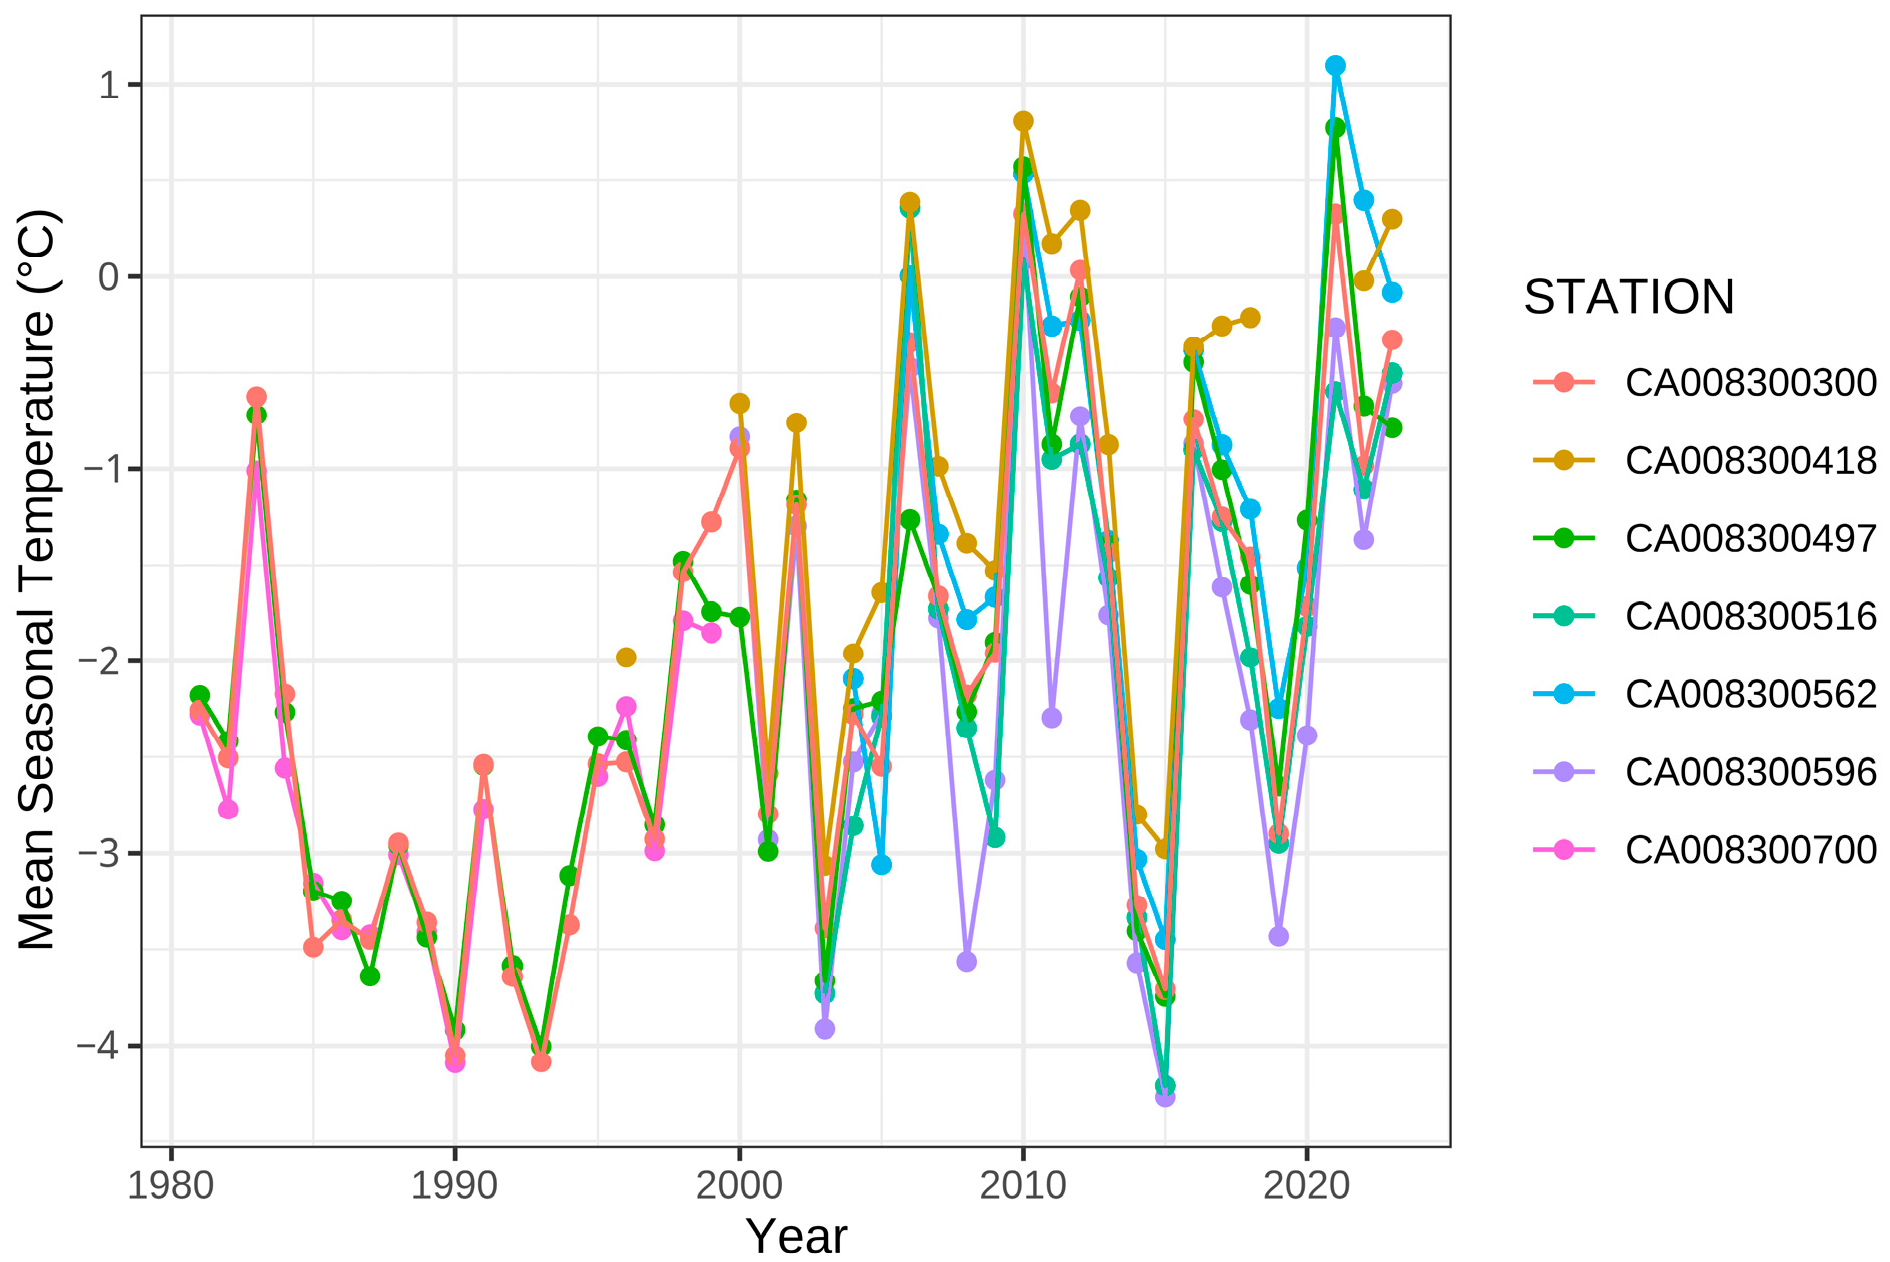
The Charlottetown station is the only one in the province with complete temporal coverage suitable for analysis. However, there are incomplete records for other sites available for comparison. The trend in temperatures across the province closely follows that of the reference station, Charlottetown, as demonstrated in Figure 3 and Table 1. Spatial variability in seasonal temperatures is small compared to fluctuations over time; however, there is a trend of slightly elevated temperatures in the east and colder temperatures in the west.
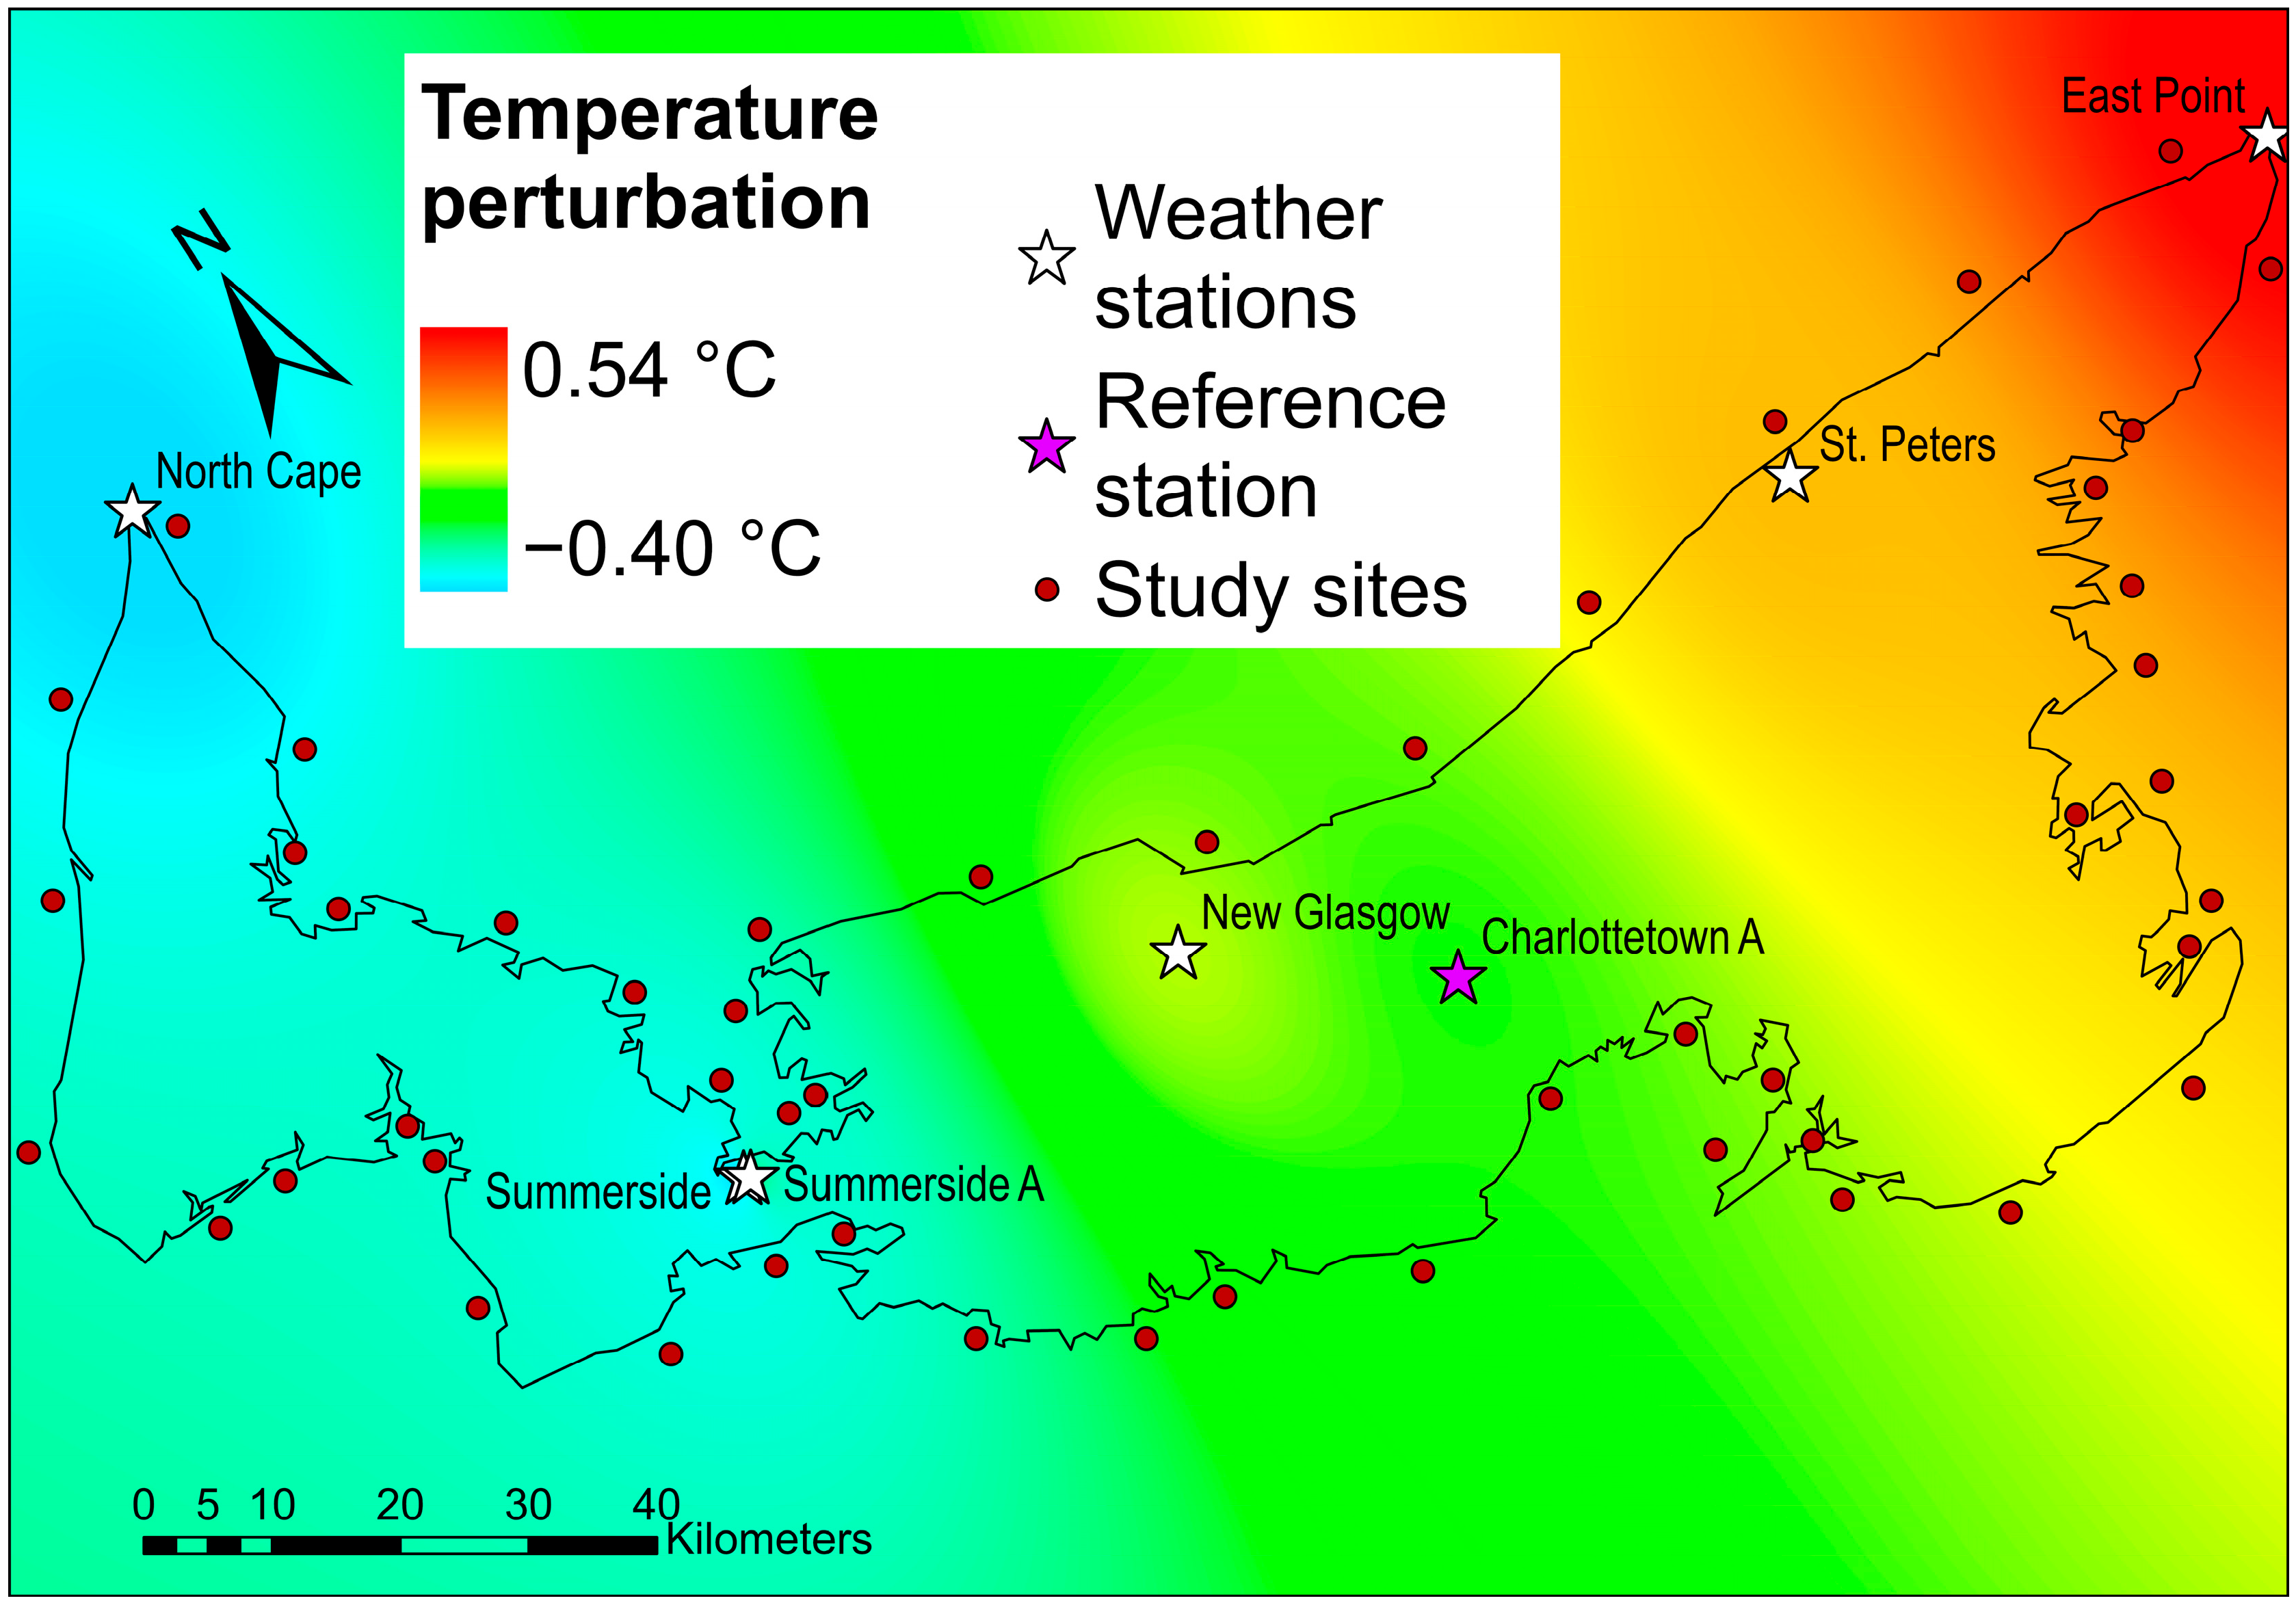
Since temporal coverage for the other stations is incomplete, they cannot be used directly for climate analysis. Inverse distance-weighted interpolation of the temperature anomalies with respect to the reference station is shown in Figure 4. The temperatures vary by less than 1 °C across the province with a clear longitudinal trend. The temperature perturbations are applied at each site for historical analysis and future projections.

3.2. Freezing Degree Days

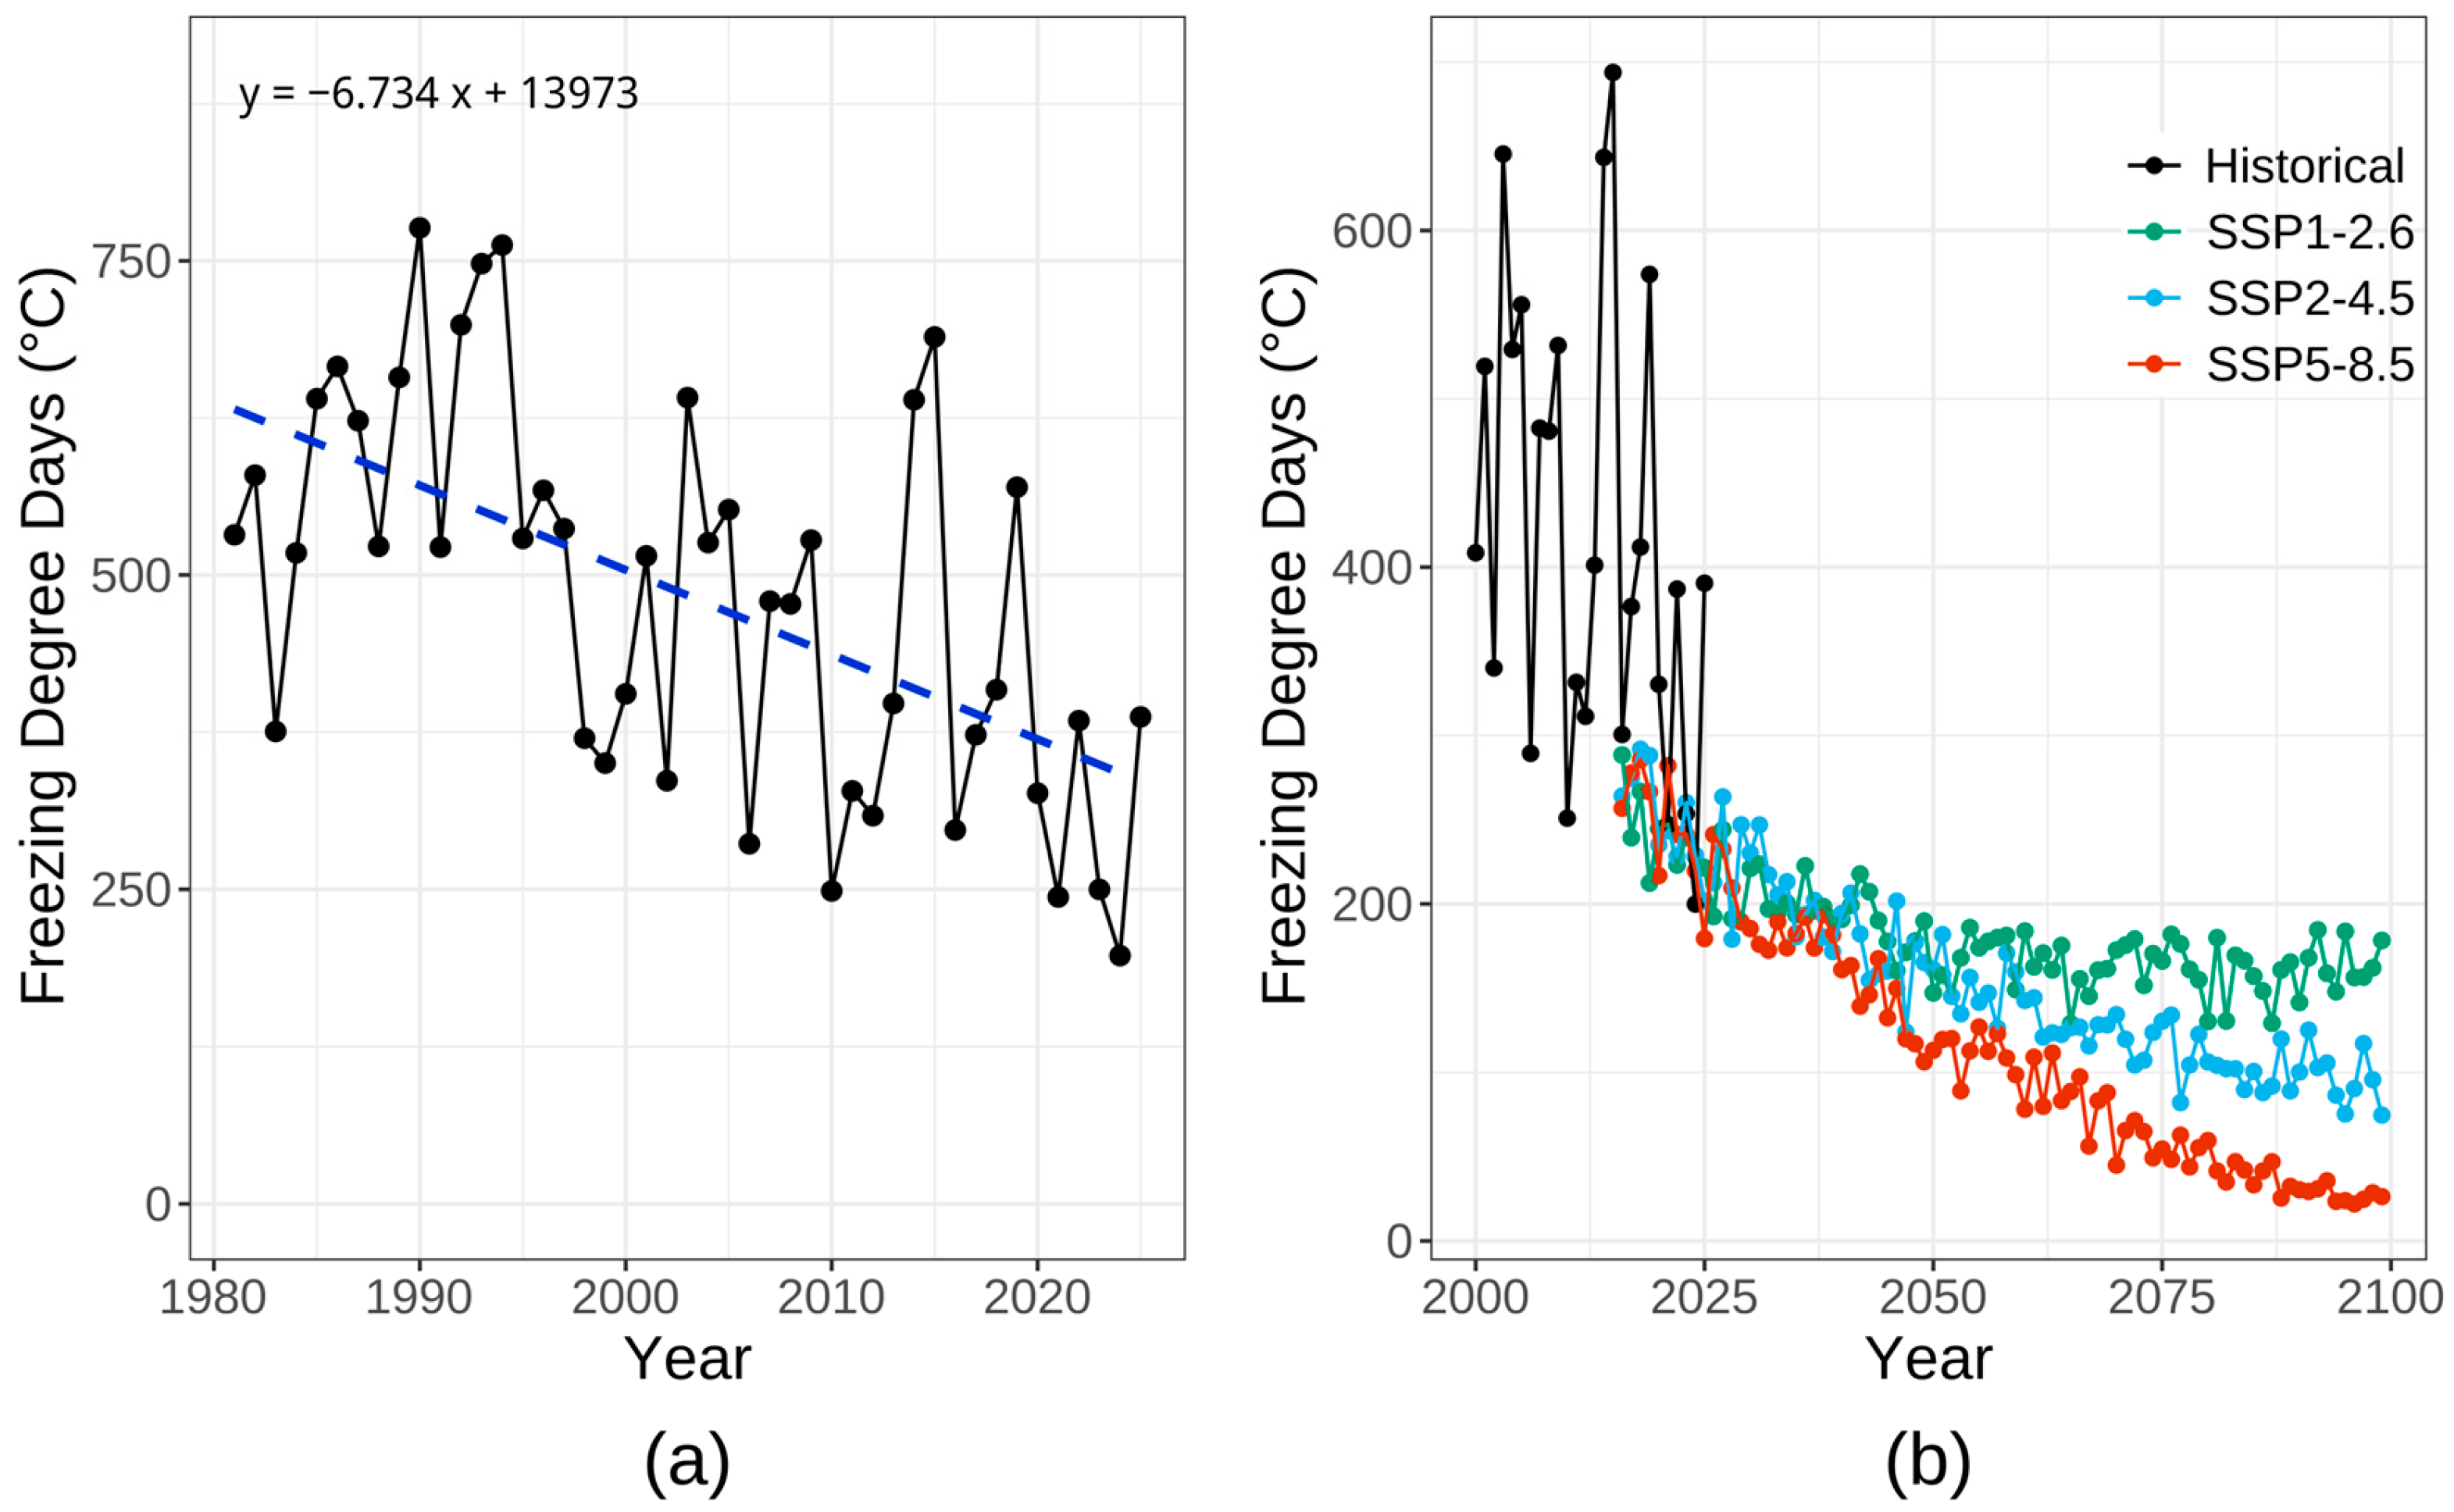
To quantify annual freezing conditions, freezing degree days (FDDs) are calculated at each site for the projected periods. In Charlottetown, the number of seasonal freezing degree days demonstrates a substantial decrease over the historical period, at a mean rate of −6.7 °C/year (Figure 5a). During the baseline period, there was an average of 487 °C per year, and a substantial reduction is projected in all SSP scenarios. For the low-emission case, SSP1-2.6, the mean projected value for the 2090s is 164 °C accumulated through the ice season. Using SSP2-4.5, 96 °C is expected for the same period, and the FDD projection for SSP5-8.5 is merely 27 °C. For reference, the minimum observed FDD value during the baseline period is 200 °C in 2024.
Across the province, there is little variation in FDD calculations. The rate of change in FDD over the historical period ranges from −6.5 °C/year to −6.9 °C/year. Mean FDD values for the historical period fall between 512 °C/year at North Cape and 442 °C/year at North Lake. Projected values are expected to fall in the ranges of 142–176 °C/year for SSP1-2.6, 82–106 °C/year for SSP2-4.5, and 22–31 °C/year for SSP5-8.5 by the end of the century. Even under an ideal climate scenario, Prince Edward Island is expected to lose approximately two-thirds of its annual freezing degree days.

3.3. Ice Concentration

3.3.1. Historical Ice Data

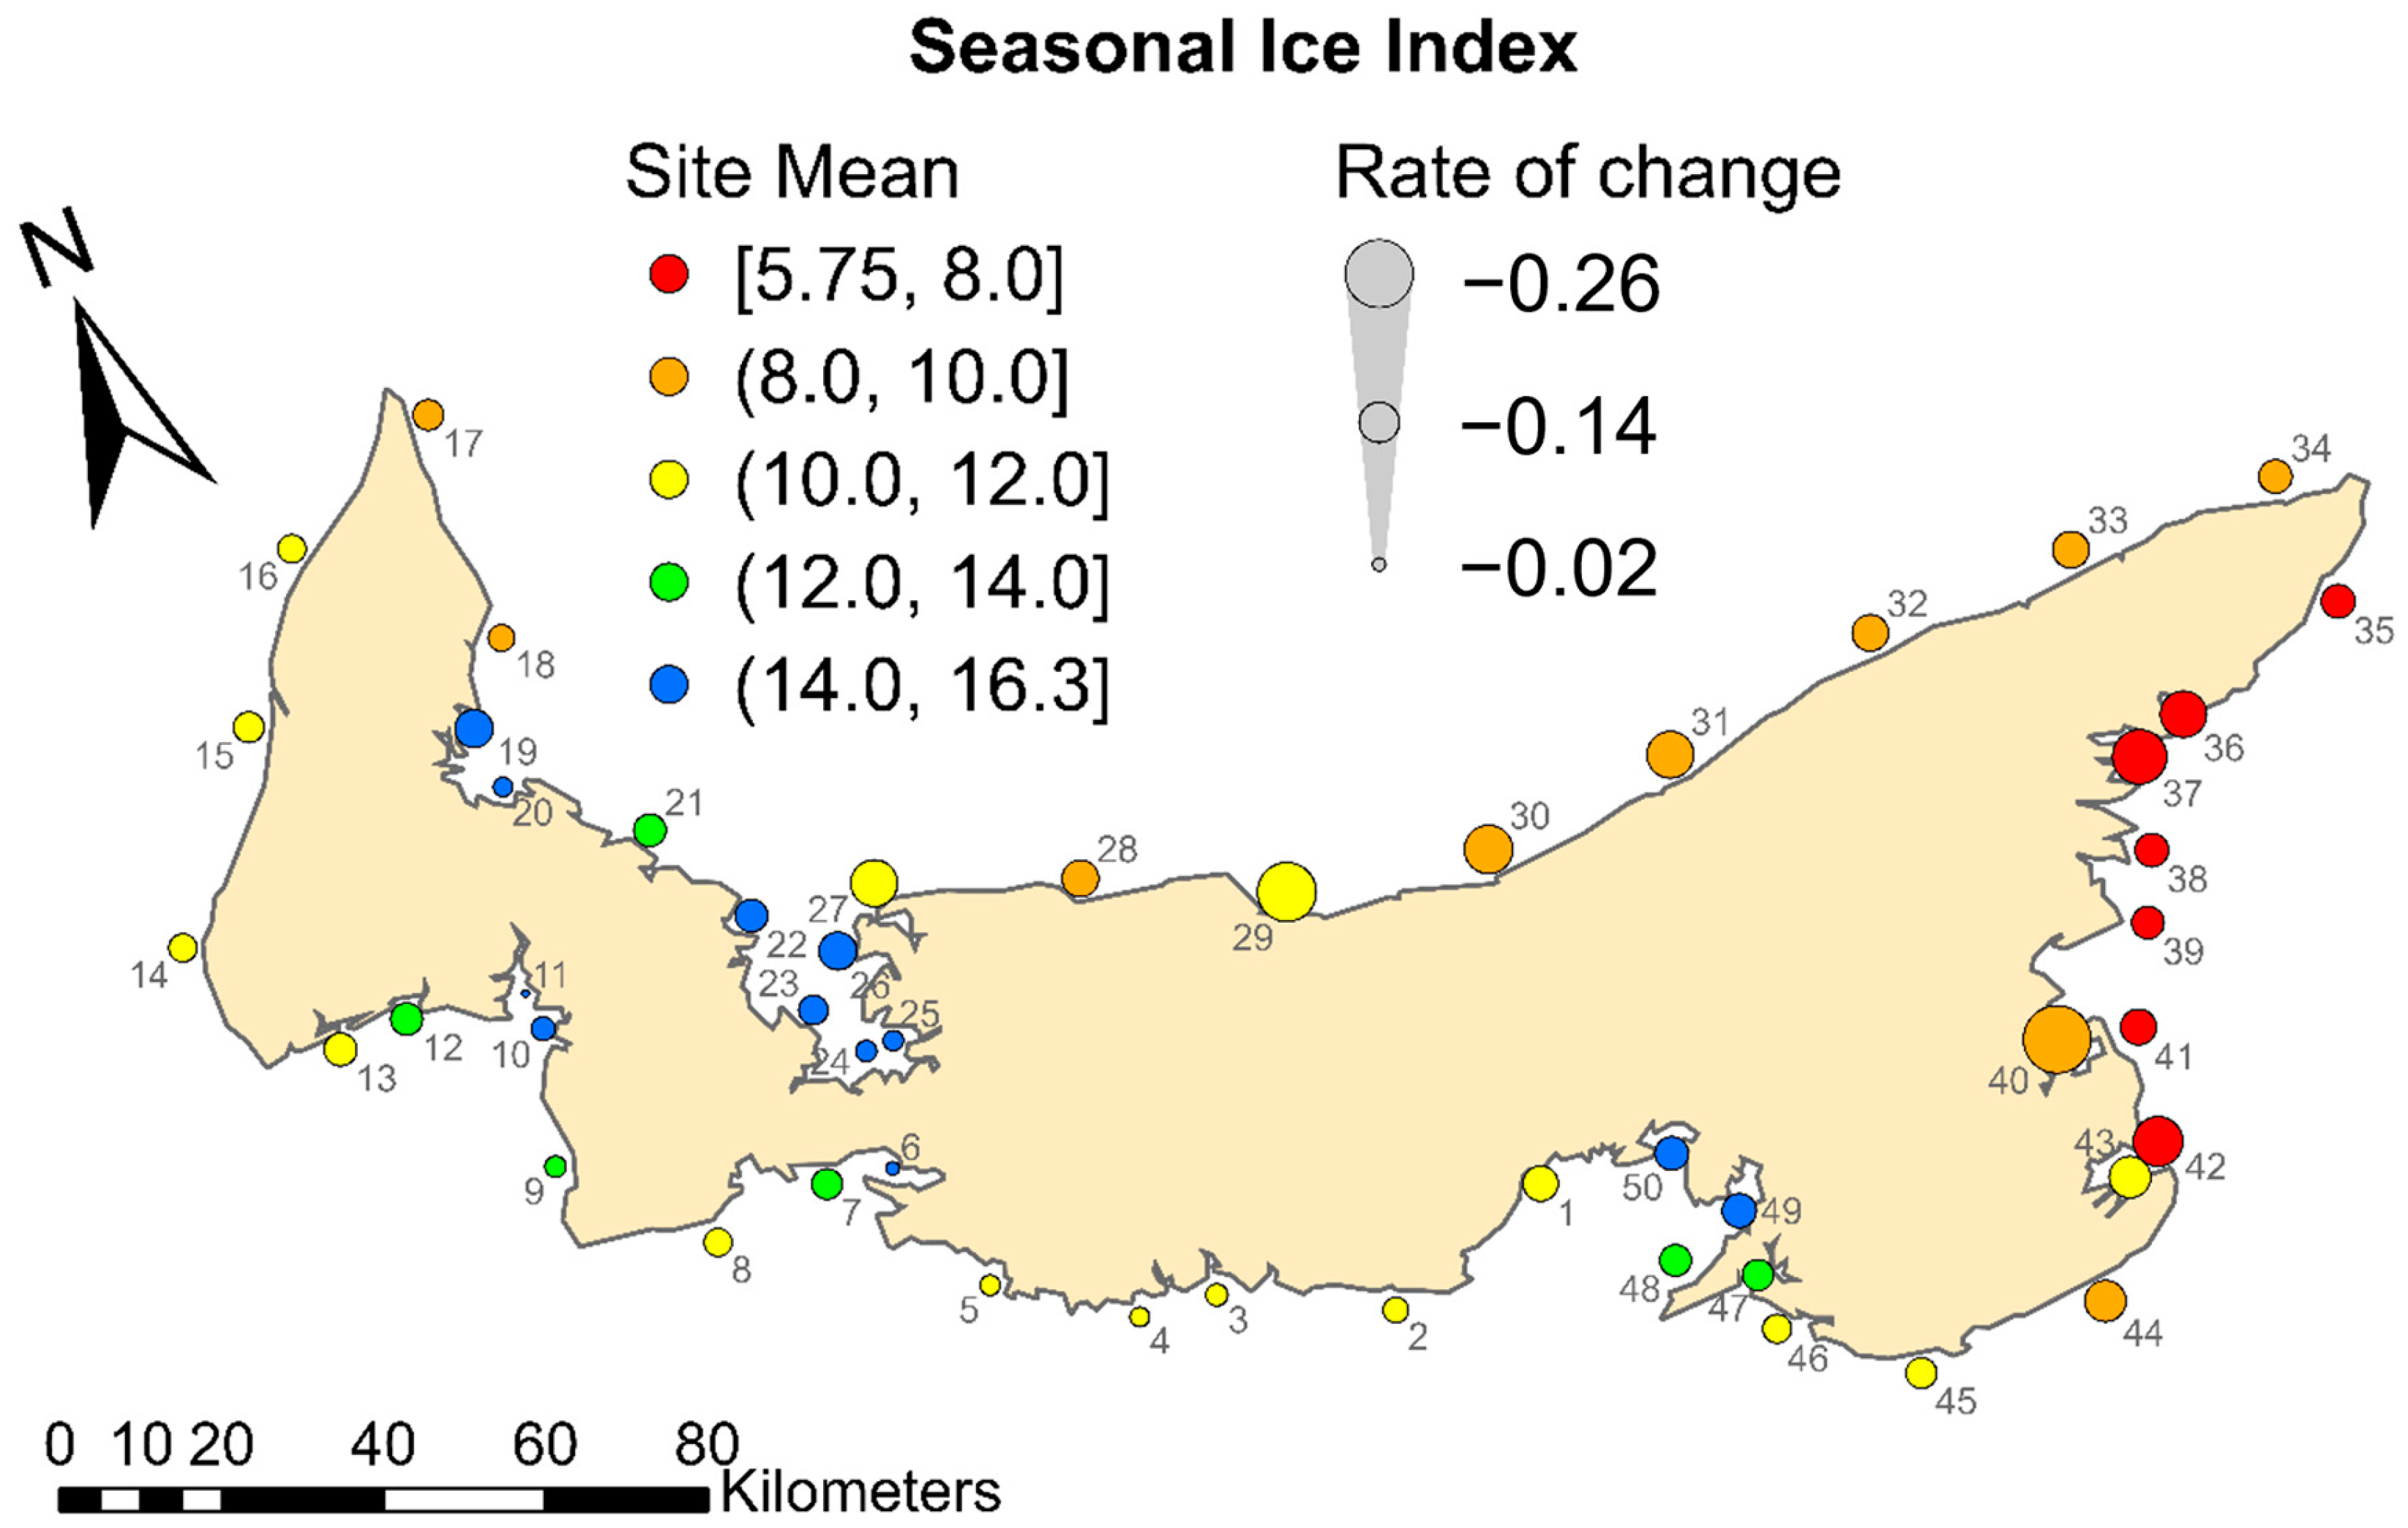
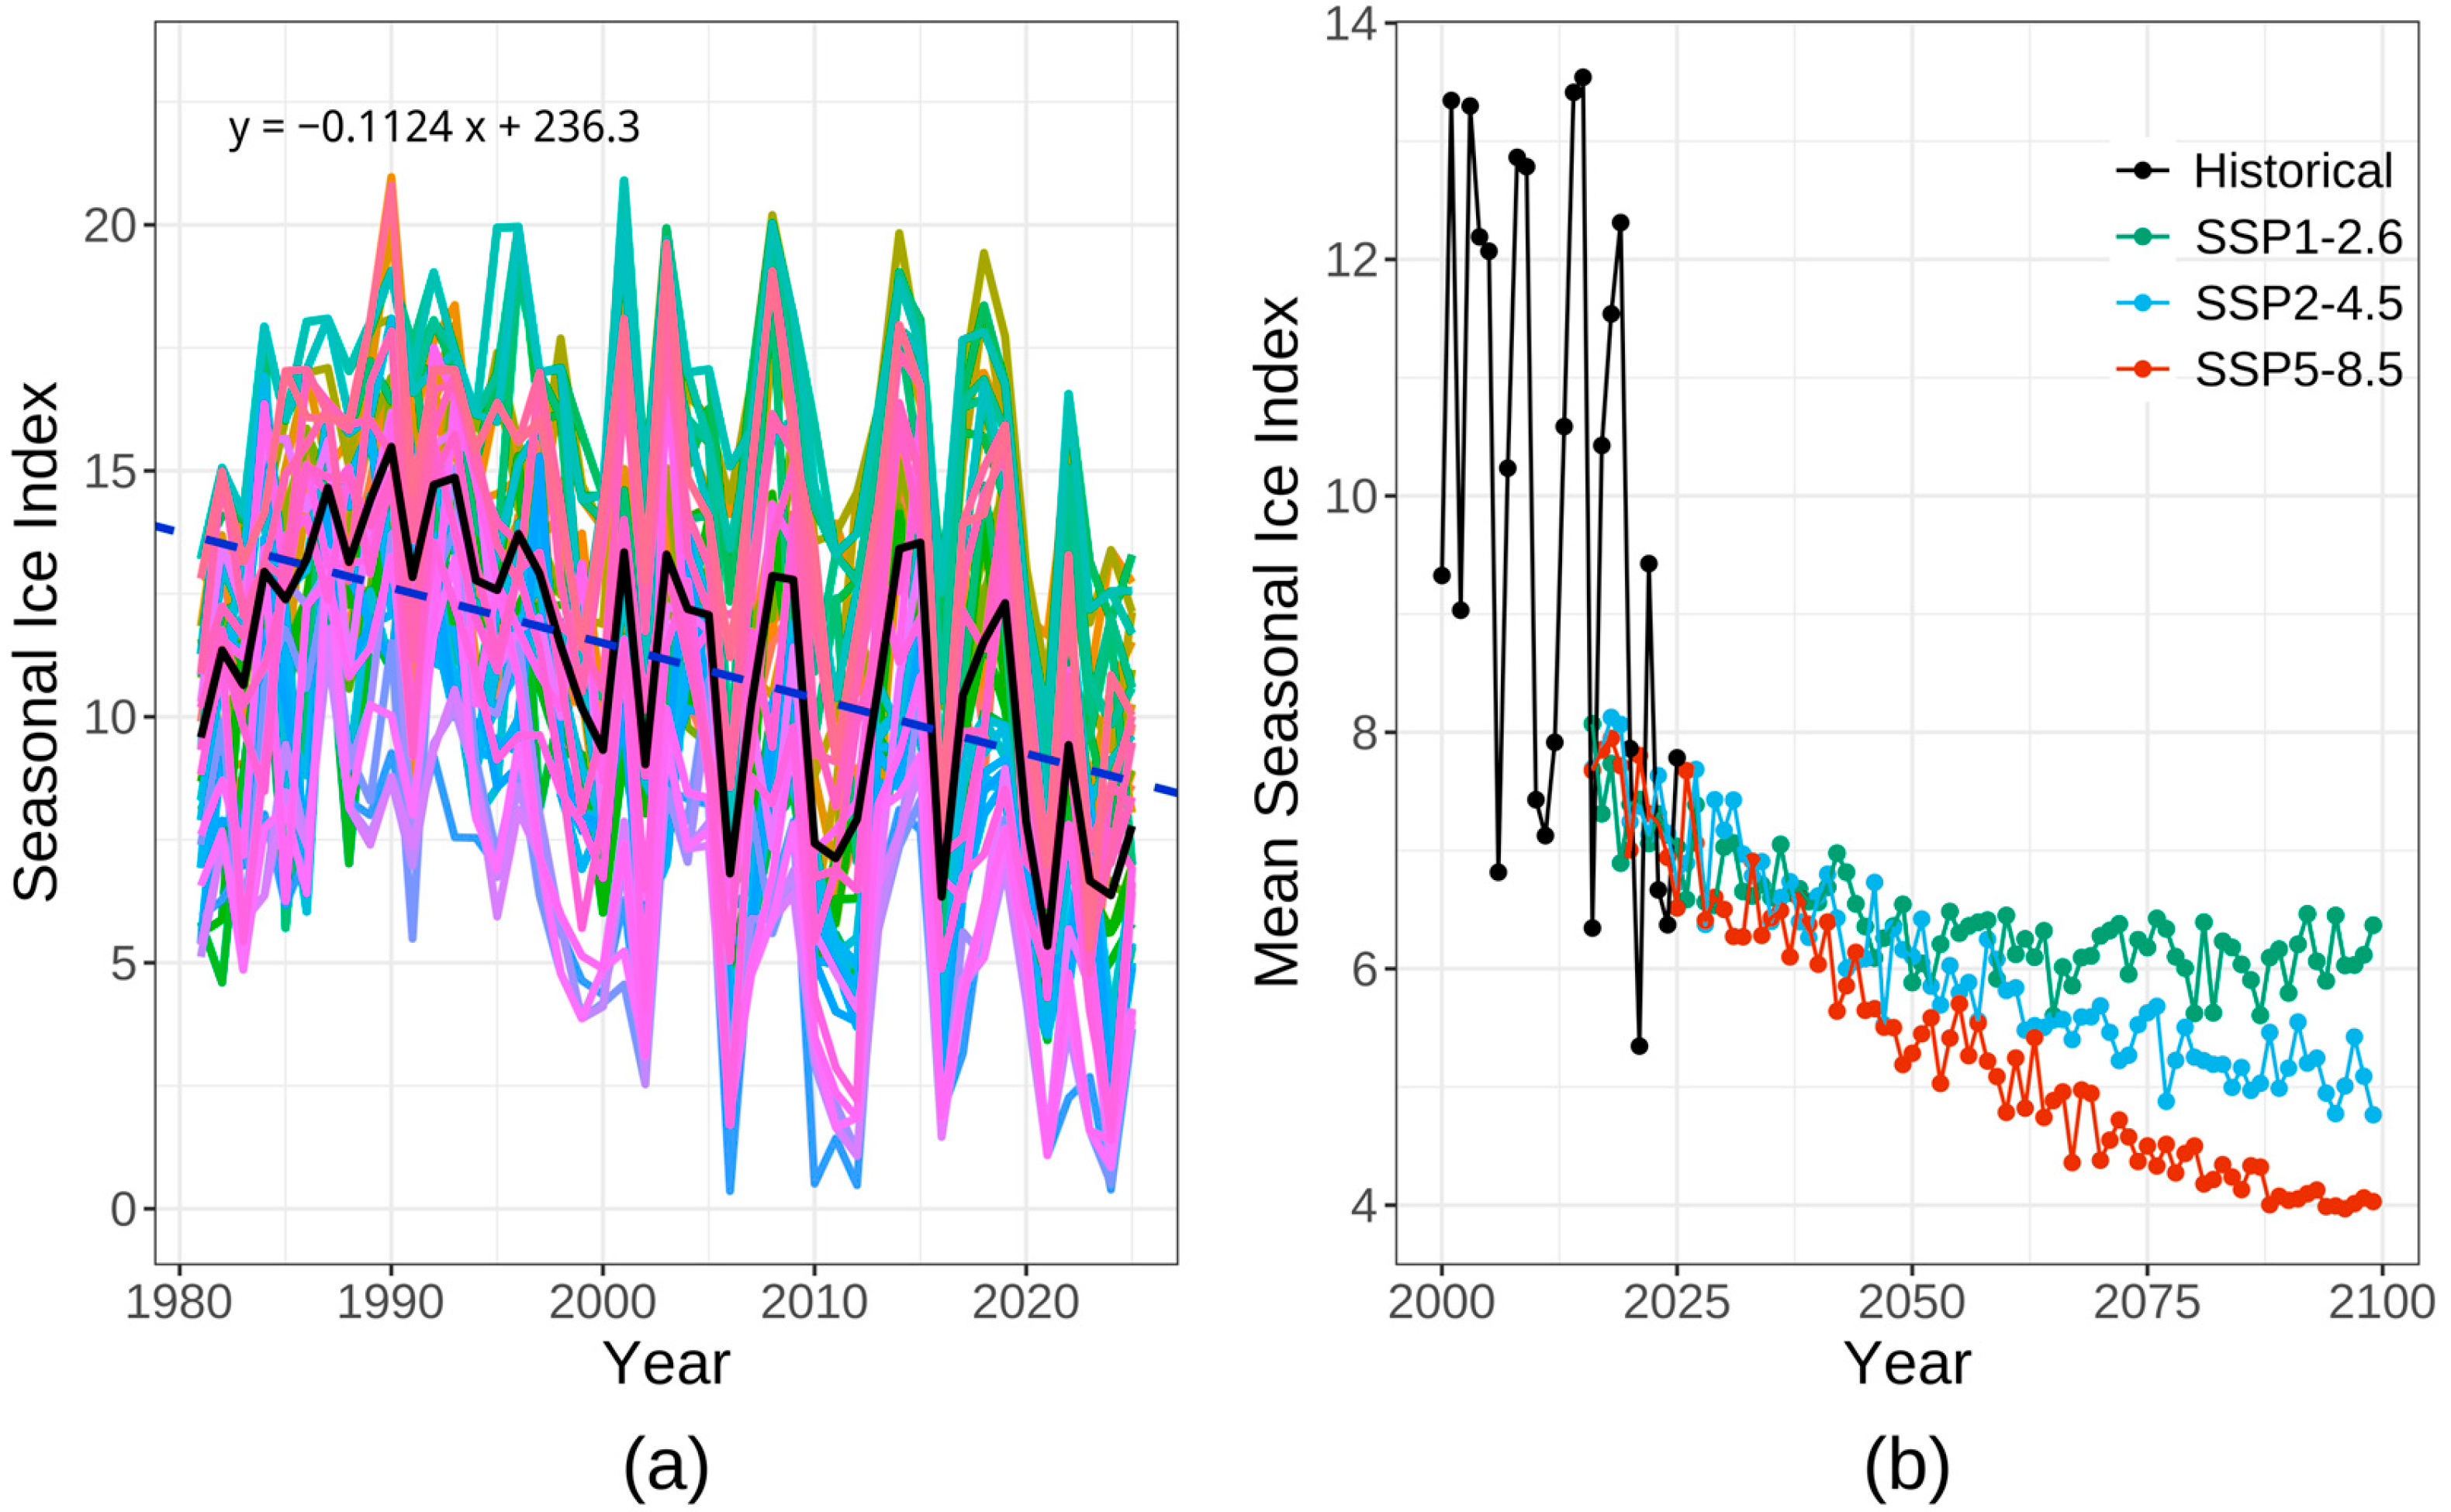
Seasonal ice indices are calculated at each of the study sites over the 1981–2025 period. Figure 6a illustrates the trend in ice coverage across all sites, including the annual mean values in black. The mean SII over the historical period is 11.1, although values vary significantly across the province (σ2 = 8.9). As shown in Figure 7, sites located within sheltered bays often have the most persistent ice seasons; for example, site 25 (Indian River) has an average SII of 16.3. The exposed north shore of the province generally has less ice than the south shore along the Northumberland Strait. The eastern coast contains all locations with the mildest ice seasons. The shortest ice season occurs at Basin Head with 5.8 (site 35).
The average rate of change in SII across all areas is −0.12 for the historical period. The spread of the data is less than the mean SII values, although the range is quite wide; site 40 (Georgetown) has a rate of change of −0.26, while site 11 (Percival Bay) demonstrates a much smaller trend of −0.02. Over 60% of the slope values for observed SII are between −0.08 and −0.16 (σ2 = 0.0019). Generally, the trend in ice loss is greater along the province’s north and eastern shores and lower along the southern shore and in sheltered areas with long ice seasons.

3.3.2. Correlation of Seasonal Ice Index with Freezing Degree Days

Several functions are assessed to correlate ice indices with freezing degree days for the baseline period. Linear regression demonstrated a strong fit to the data with a mean R2 of 0.61 across study sites.
Although the correlation between FDD and SII is strong in the observed data, it is possible that the linear trend does not hold for values far outside of the norm. Similar analyses of snowpack have demonstrated a temperature threshold beyond which the linear correlation between ice and temperature breaks down [26]. The referenced study identified a changepoint, beyond which the relationship between air temperature and snow/ice accumulation was altered [26]. Bayesian changepoint analysis was used to identify significant changes in the linear regressions. The correlation at each site was modelled using a simple linear regression and a piecewise model, which identified a single changepoint between two joined linear slopes. The mcp package in R was used to run 10 chains with 10,000 iterations across three cores for each model.
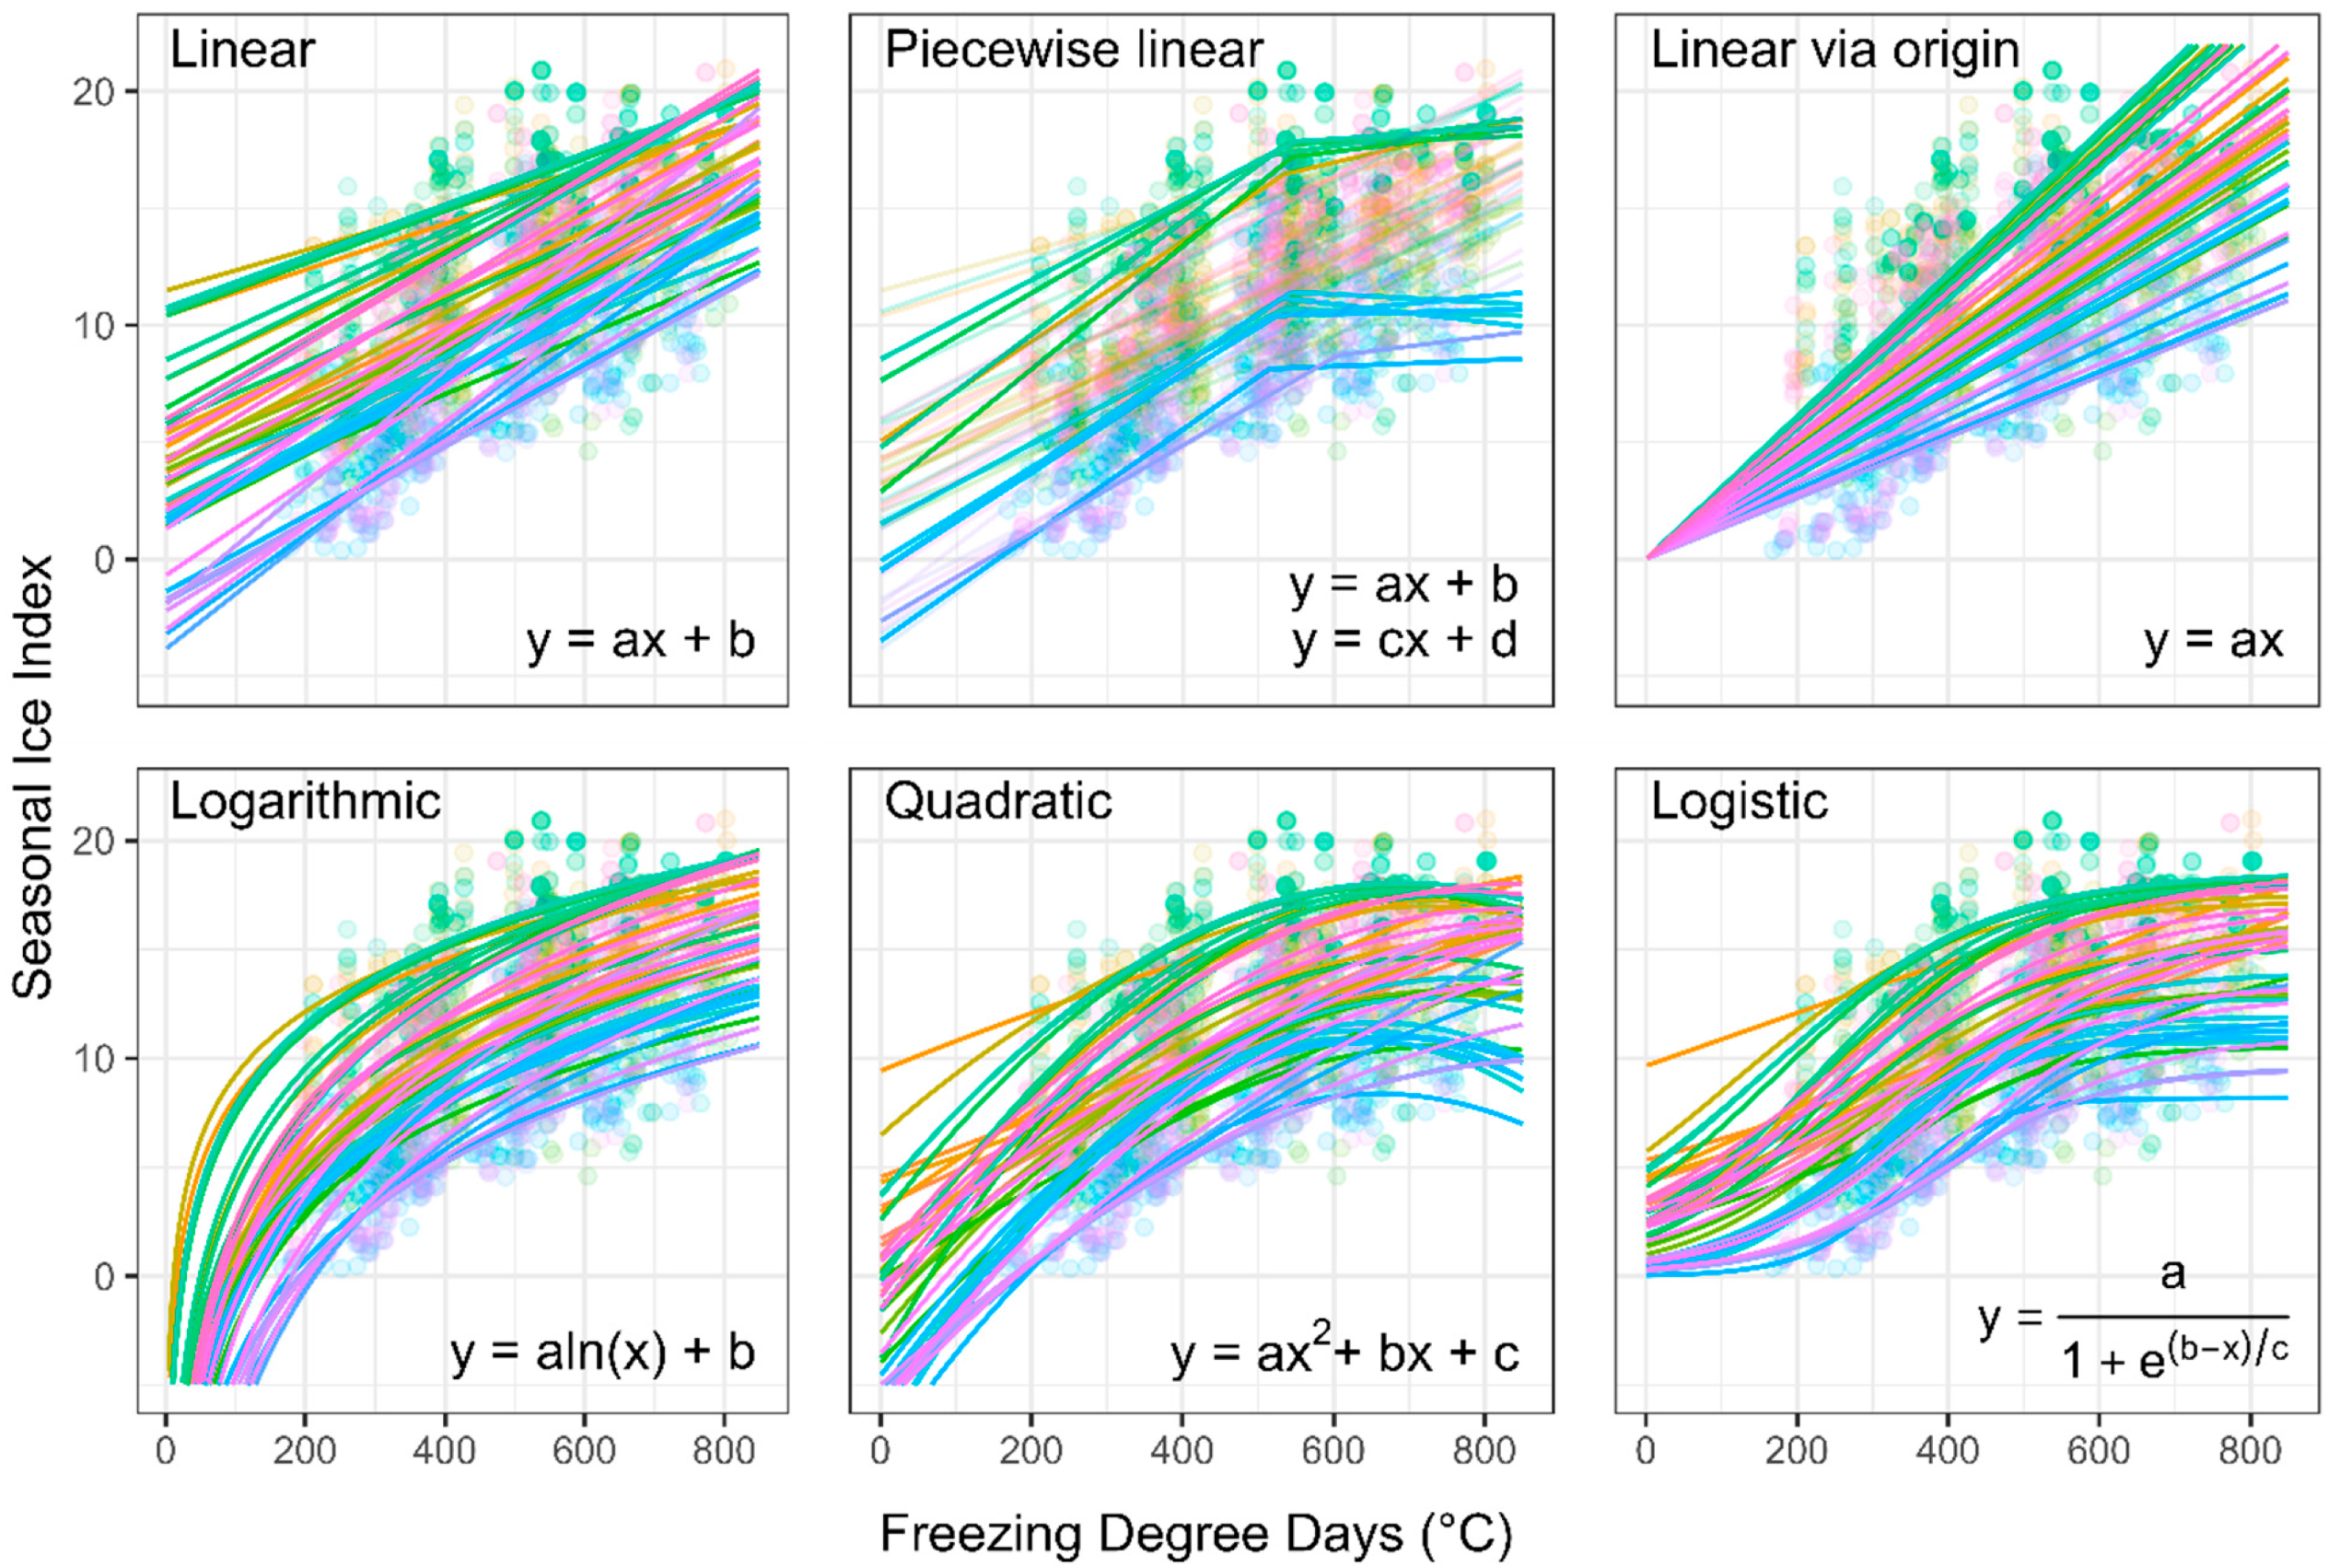
The piecewise models are compared to the simple linear regressions using leave-one-out cross-validation. For 12 of 50 study sites, the expected log pointwise density differences were greater than the standard error 19 times out of 20. The identified changepoints were between FDD values of 514 °C and 605 °C, central to the historical data. The remaining sites had no discernible preference for the variable changepoint model; the simple linear model was similar or more compatible with the data. The model outputs for all sites are shown in Figure 8. Since the piecewise model was unable to identify significant changepoints for the majority of study sites, it does not offer substantial improvement over the simple linear regression.
The linear regressions are forced through the origin to resolve the persistent issue of overestimation of SII for low FDD values. This solution has a poorer fit, demonstrating low R2 values ranging from 0.26 to 0.64. The fits are summarized in Table 2.
Alternative models for correlation, including logarithmic regression, quadratic functions and logistic regressions, are tested for suitability. Very good coefficients of determination were obtained for each of these models, with average R2 values of 0.63, 0.65, and 0.65, respectively. With maximum y-intercepts greater than zero, the quadratic and logistic functions did not resolve the concern over extrapolation. Logarithmic regression was the only correlation that conceivably modelled SII values at low FDD. The fit of the logarithmic regressions is summarized in Figure 9.
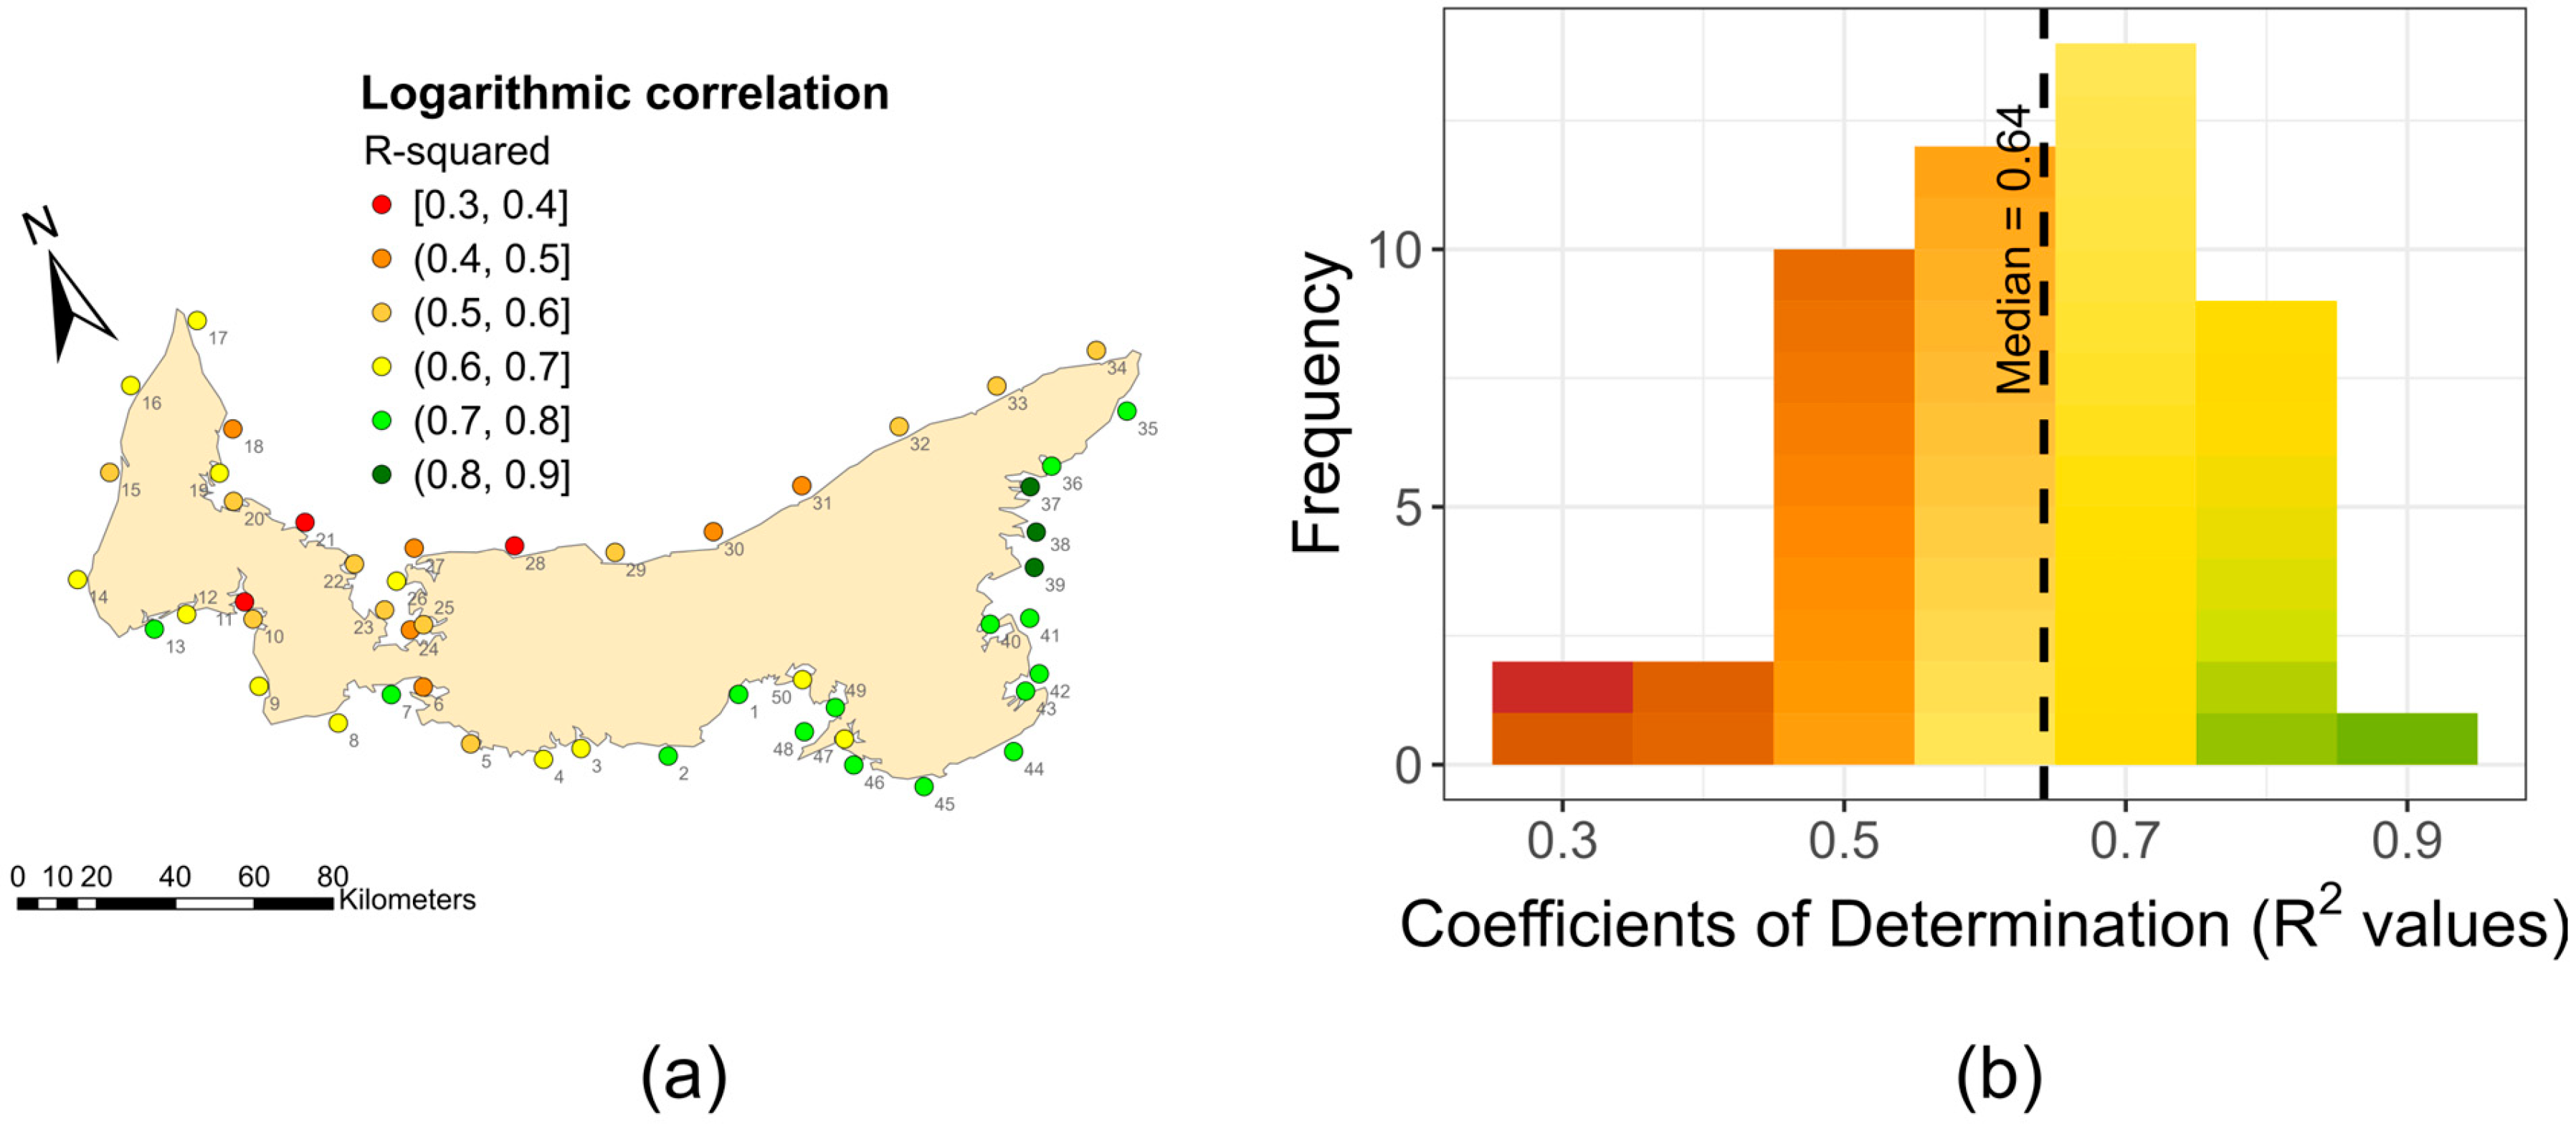
Fitting the data logarithmically, R2 values greater than 0.30 are obtained for all locations. The median coefficient was 0.64. The correlation was strongest for sites along the Northumberland Strait, while areas along the northern shore of the province had R2 values between 0.4 and 0.7 (see Figure 9). The coefficients from the logarithmic regression were used to calculate projected SII values at each site.
A non-parametric Mann–Kendall trend test is also performed for the FDD-ordered datasets to assess monotonic correlation. The test identified a significant positive correlation for all sites (p < 0.05). The mean Kendall rank correlation coefficient was 0.58, and the minimum value was 0.34.

3.3.3. Spatial Autocorrelation

It is apparent that there exists a spatial correlation with the ice concentration data from the baseline period. Sites in the east have lower SII values than in the west, and this is reflected in the linear models used to correlate FDD with SII. Perturbations based on the inverse distance-weighted interpolation of temperature anomalies across the province account for some of this spatial variation; however, the adjusted FDD calculations do not fully resolve the observed autocorrelation. Since most ice monitoring sites are to the west of the weather station, this results in higher mean SII projections, given low FDD values; that is, as the FDD approaches 0, the mean SII approaches 2.8. To remove this serial correlation, the dataset is pre-whitened using the method developed by Yue et al. [27]. This approach estimates and then removes a monotonic trend from the series prior to pre-whitening. The trend is reintroduced after whitening. The pre-whitened data and associated projections are described in the Supplementary Materials. Pre-whitening was able to remove the spatial trend in values; however, since the spatial trend reflects the different environmental conditions influencing the data, the un-whitened values were deemed most appropriate for the accurate correlation of temperature with actual observations. The remainder of this paper discusses the results using untreated data.

3.3.4. Projections of Ice Concentration

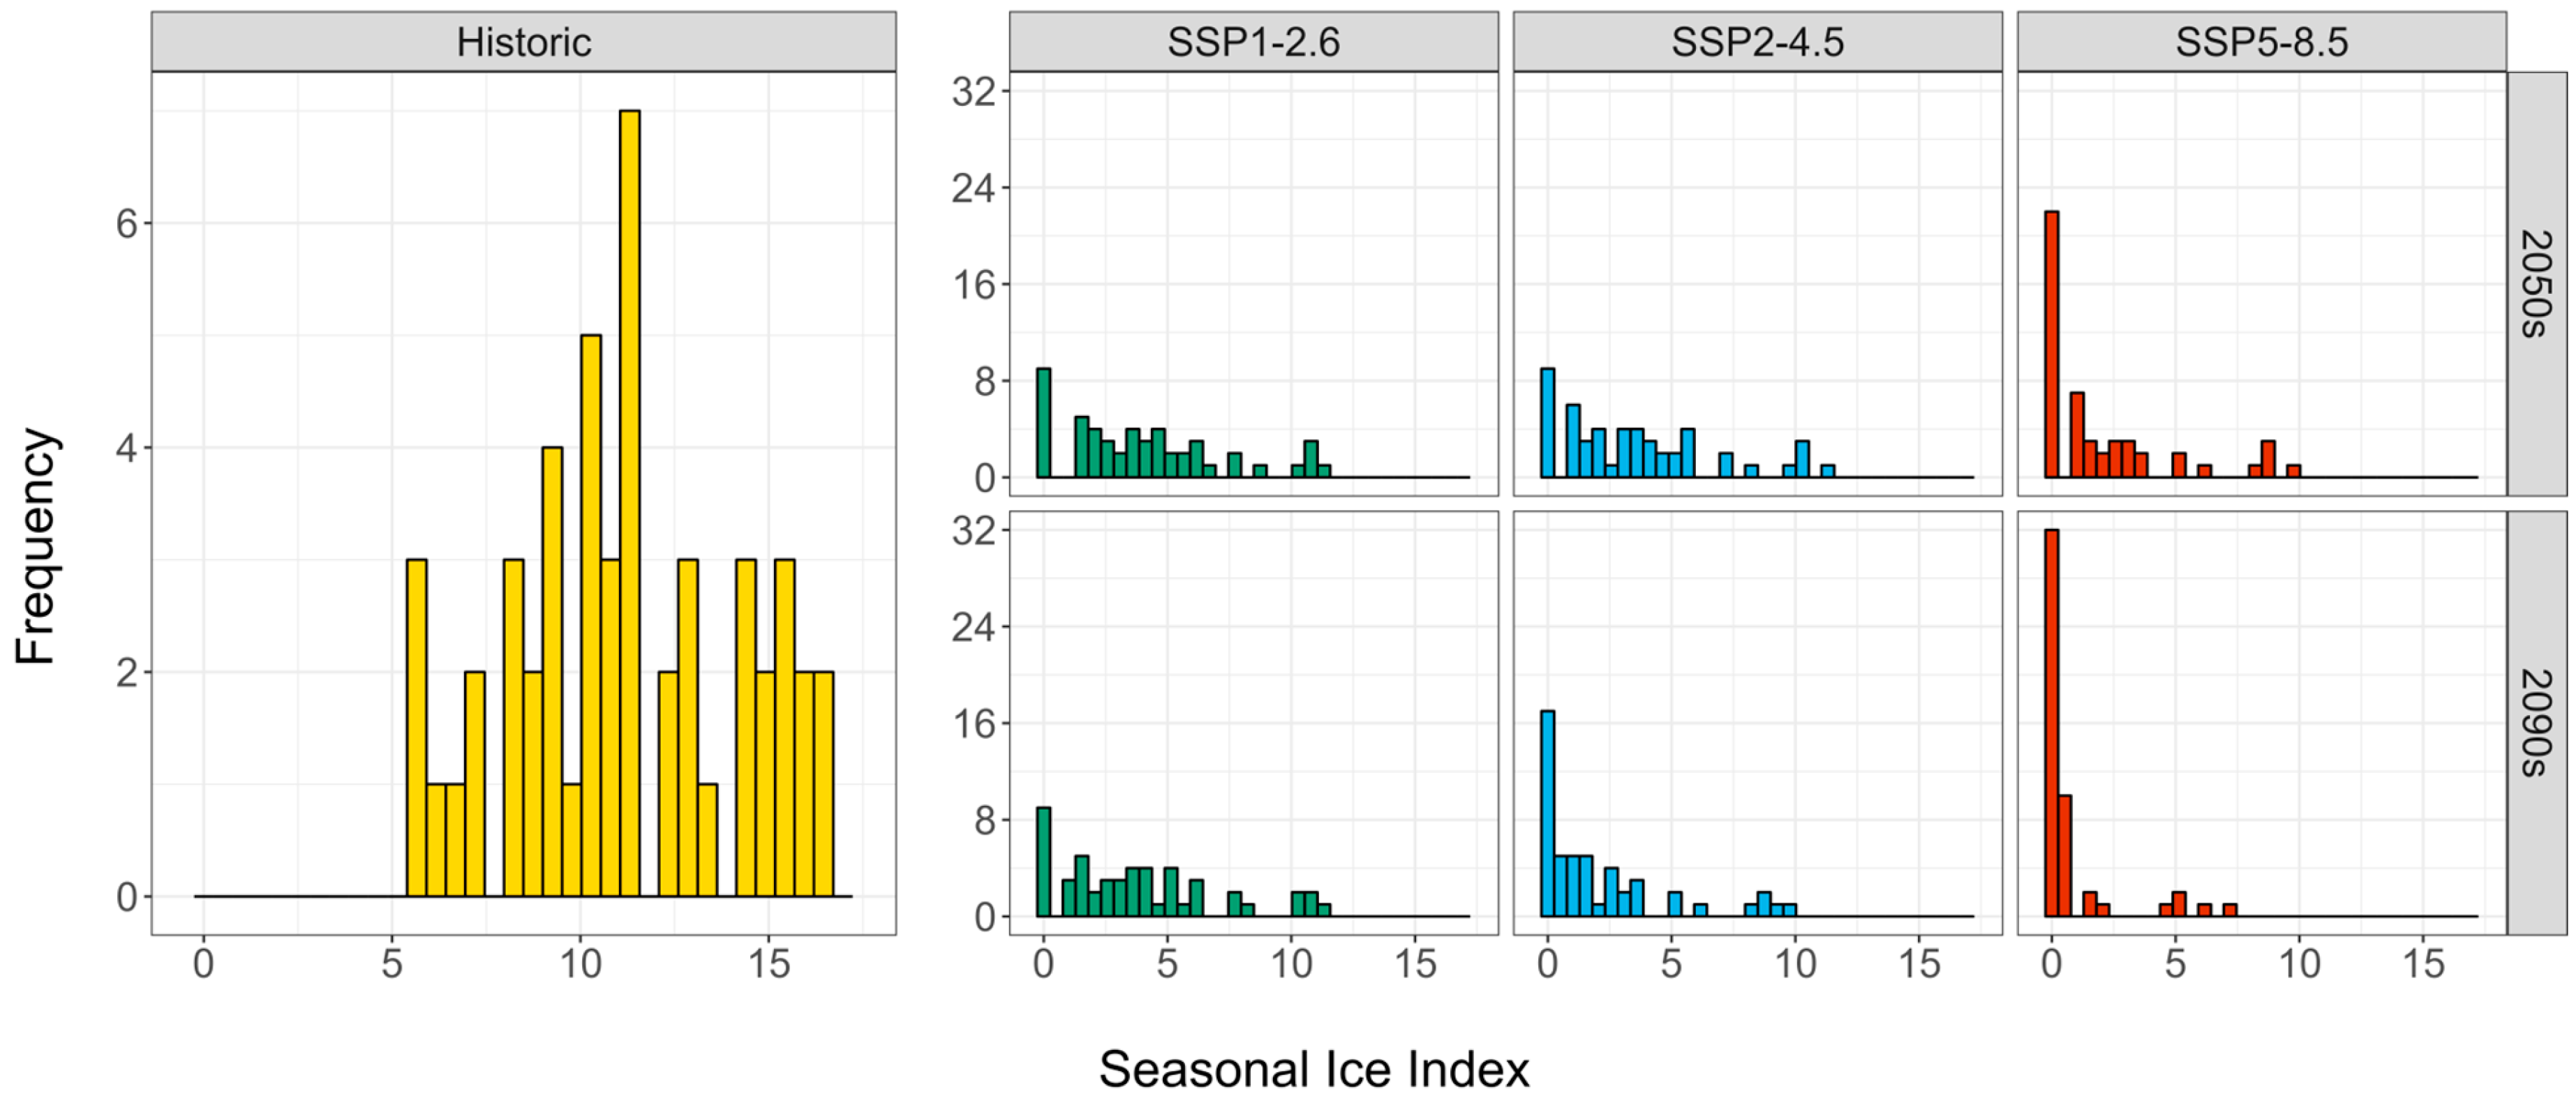
Logarithmic correlations established from the baseline period are used to translate projections of cumulative freezing degree days to seasonal ice indices. The data during the historical period has an average seasonal ice index of 11.1; however, a substantial change in this value is expected by the 2090s, regardless of the emission scenario. The mean projected SII for 2090–2099 is 3.8 for SSP1-2.6, 2.2 for SSP2-4.5, and 0.8 for SSP5-8.5. These projections represent reductions in SII by 66–93% from the baseline.
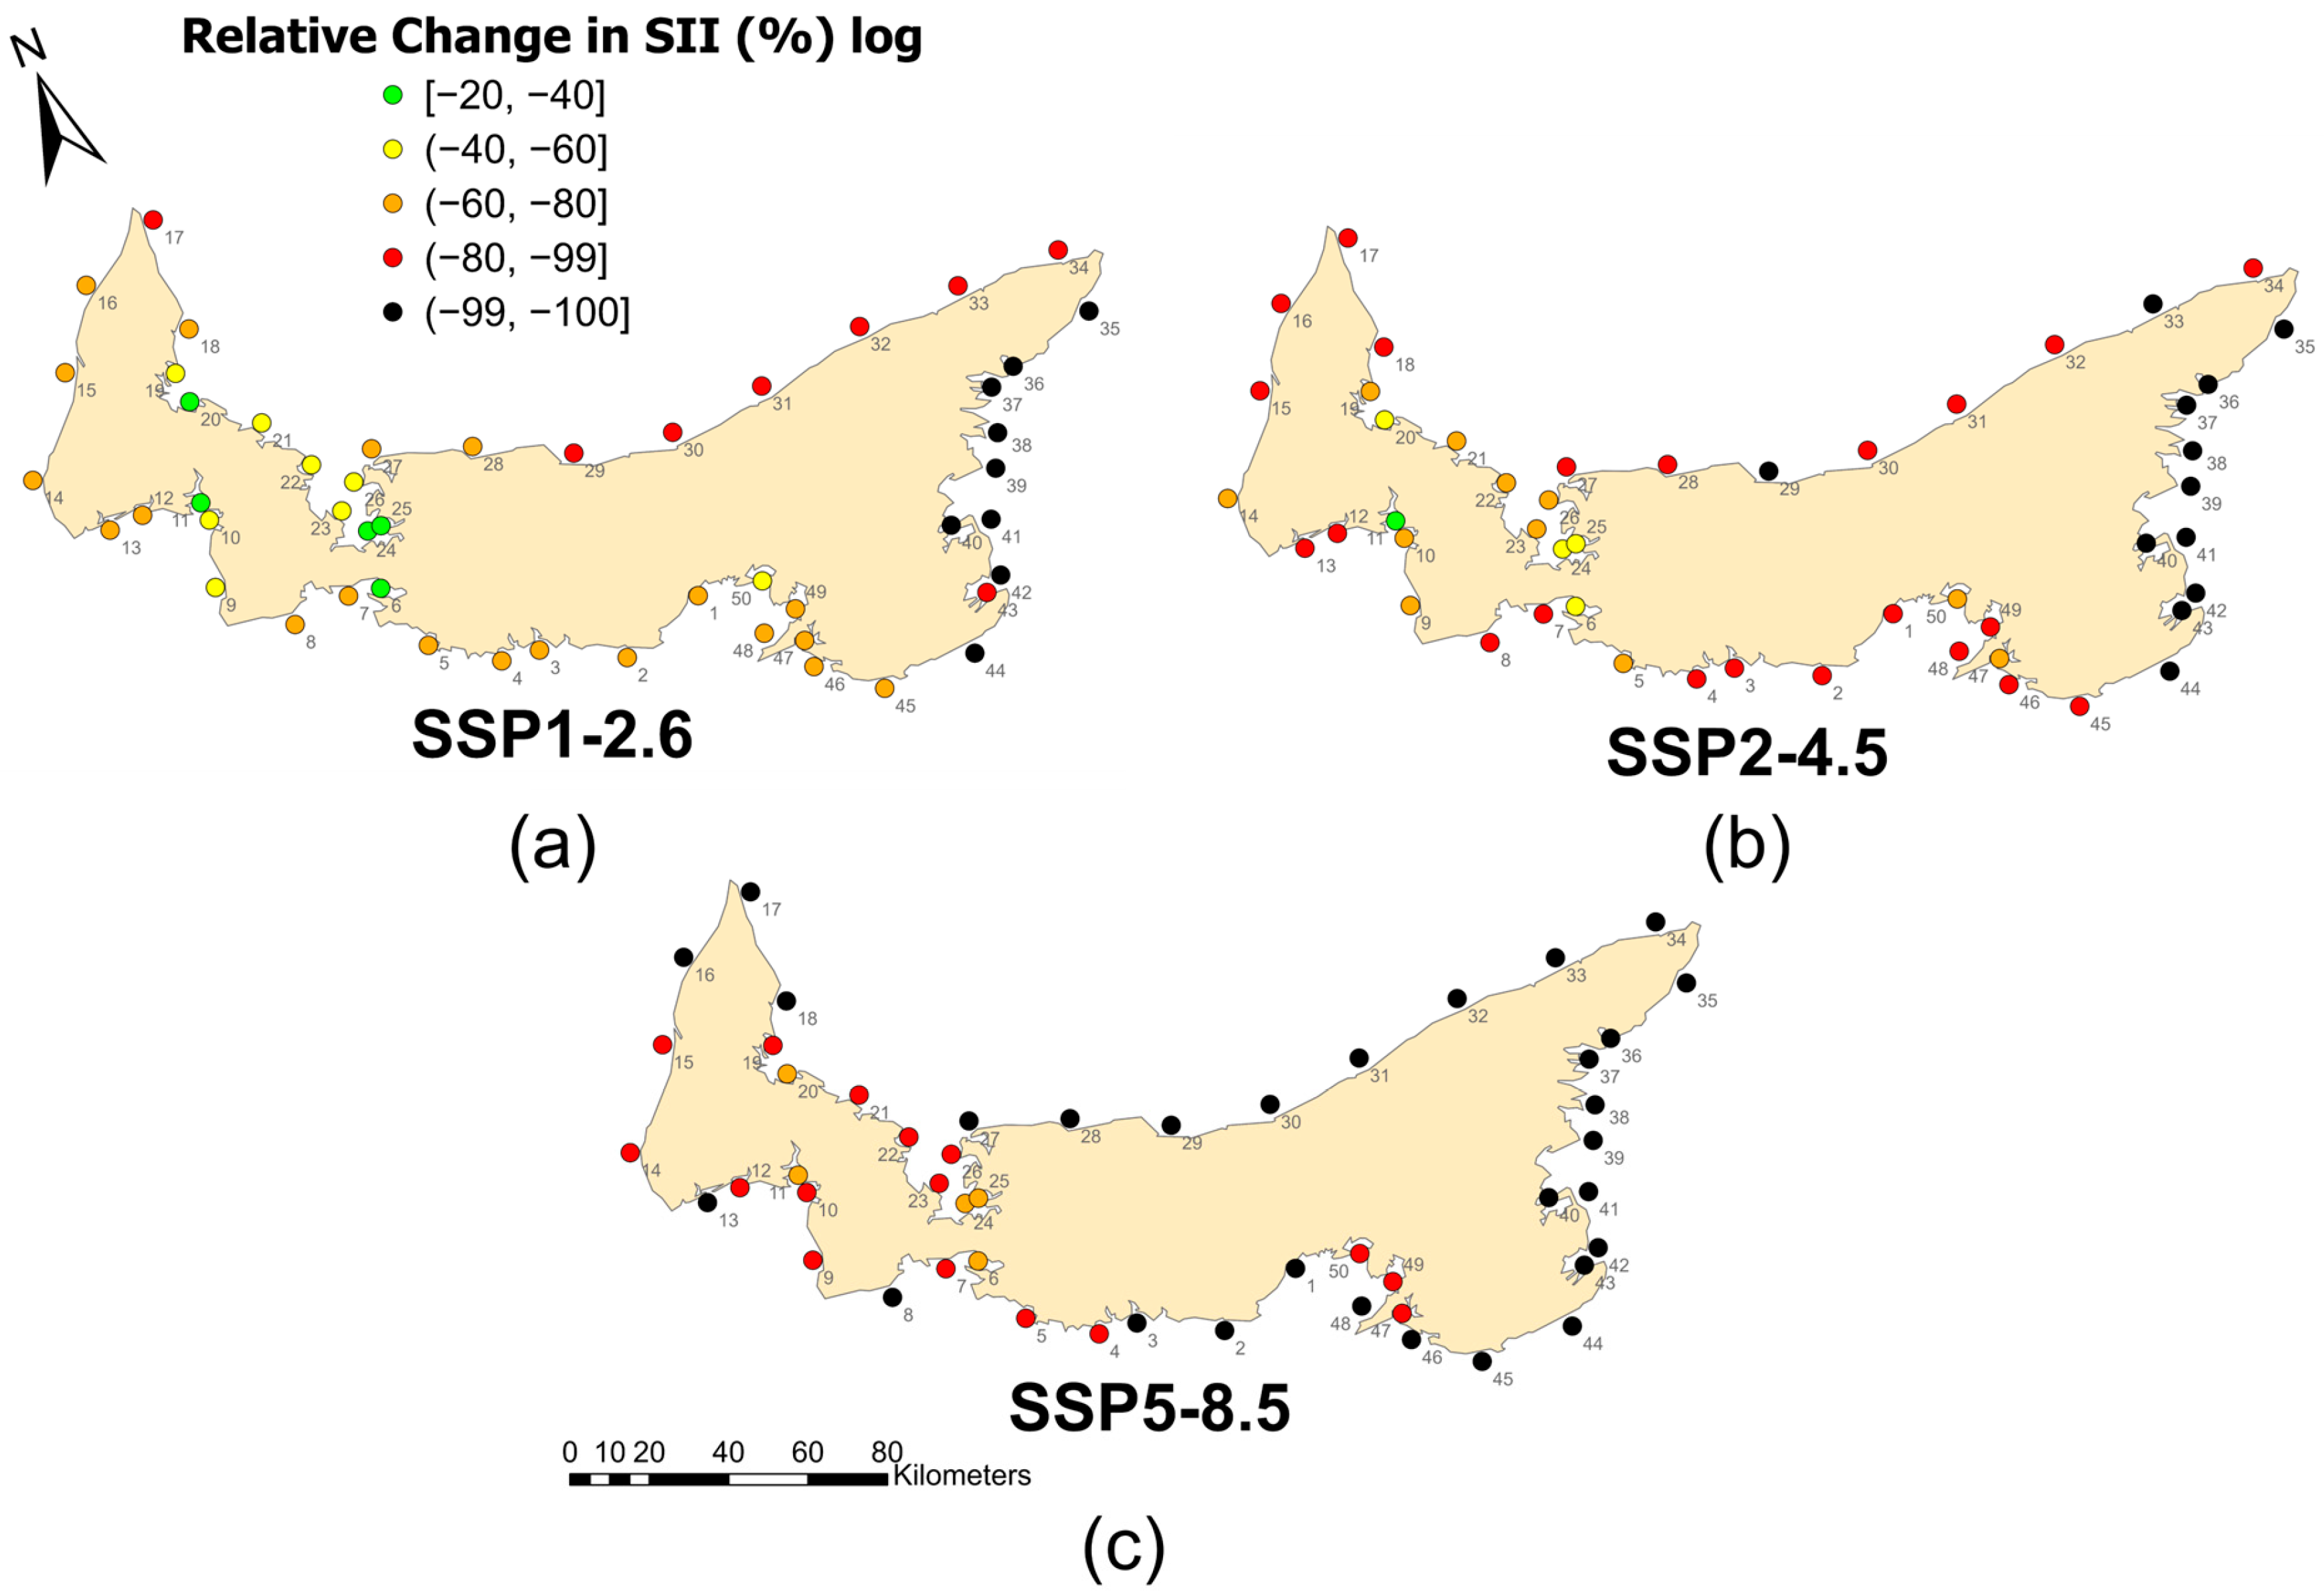
The projected changes in SII for each of the study sites are shown in Figure 10. Sites along the eastern coast of Prince Edward Island show the greatest relative change in SII over the study period, locations which tended to have lower initial values for SII. The low-emission model projects nine areas along the eastern shore to be completely ice-free by the end of the century, that is, to exhibit 100% loss in SII. The projections for SSP2-4.5 indicate that the number of ice-free locations will increase to 12. In the high-emission scenario, 29 of 50 sites are projected to have zero ice formation, with the ice-free area extending westward along the province’s north and south shores.
As with the freezing degree days, much of the projected change in seasonal ice indices is anticipated to occur in the first half of the century (Figure 6b). The distribution of projected SII values is shown in Figure 11. For SSP1-2.6, the SII values show very little change between the 2050s and the 2090s, and the mean value shifts from 4.0 to 3.8 (Table 3). The distribution of SII values for SSP2-4.5 in the 2090s also experiences little change from the mid-century values. Although the high-emission pathway, SSP5-8.5, demonstrates the greatest change in SII over the second half of the century, this reduction in ice cover is dwarfed by the expected loss over the next three decades. Recall that the mean SII across all sites for the historical period of 1981–2025 was 11. 1; the SII projections for the 2050s are 4.0, 3.5, and 2.0 for SSP1-2.6, SSP2-4.5, and SSP5-8.5, respectively.
The decreasing trend in SII is evident in the latter half of the historical data. From 1981 to 1999, the mean SII was 12.8, indicating three months of fast ice in the waters around the island. The first decade of the new century had an average SII of 11.2, which reduced to 10.1 in the 2010s. In the six most recent winters, ice coverage has further decreased to an SII of 7.2. This reflects a shortening of the ice season by 43% over 24 years.

3.4. Ice Season Length

Historical trends are also observed in the length of the ice season and can similarly be used for projecting future values in various scenarios. For these purposes, the onset of the ice season is defined as the first instance of the local ice concentration exceeding 50% coverage. The breakup date is characterized as the final instance of ice concentration exceeding 50% during the ice season. The length of the season is the difference between the breakup and onset dates in days. Typically, the local ice concentration at onset is 70% or greater and remains elevated between the onset and breakup dates. In some instances, however, the ice would break up before fully forming, resulting in prolonged shoulder seasons with ice concentrations at or below 30%. The threshold for ice concentration was set to 50% to exclude these atypical shoulder seasons from the analysis.

3.4.1. Historical Ice Season Length

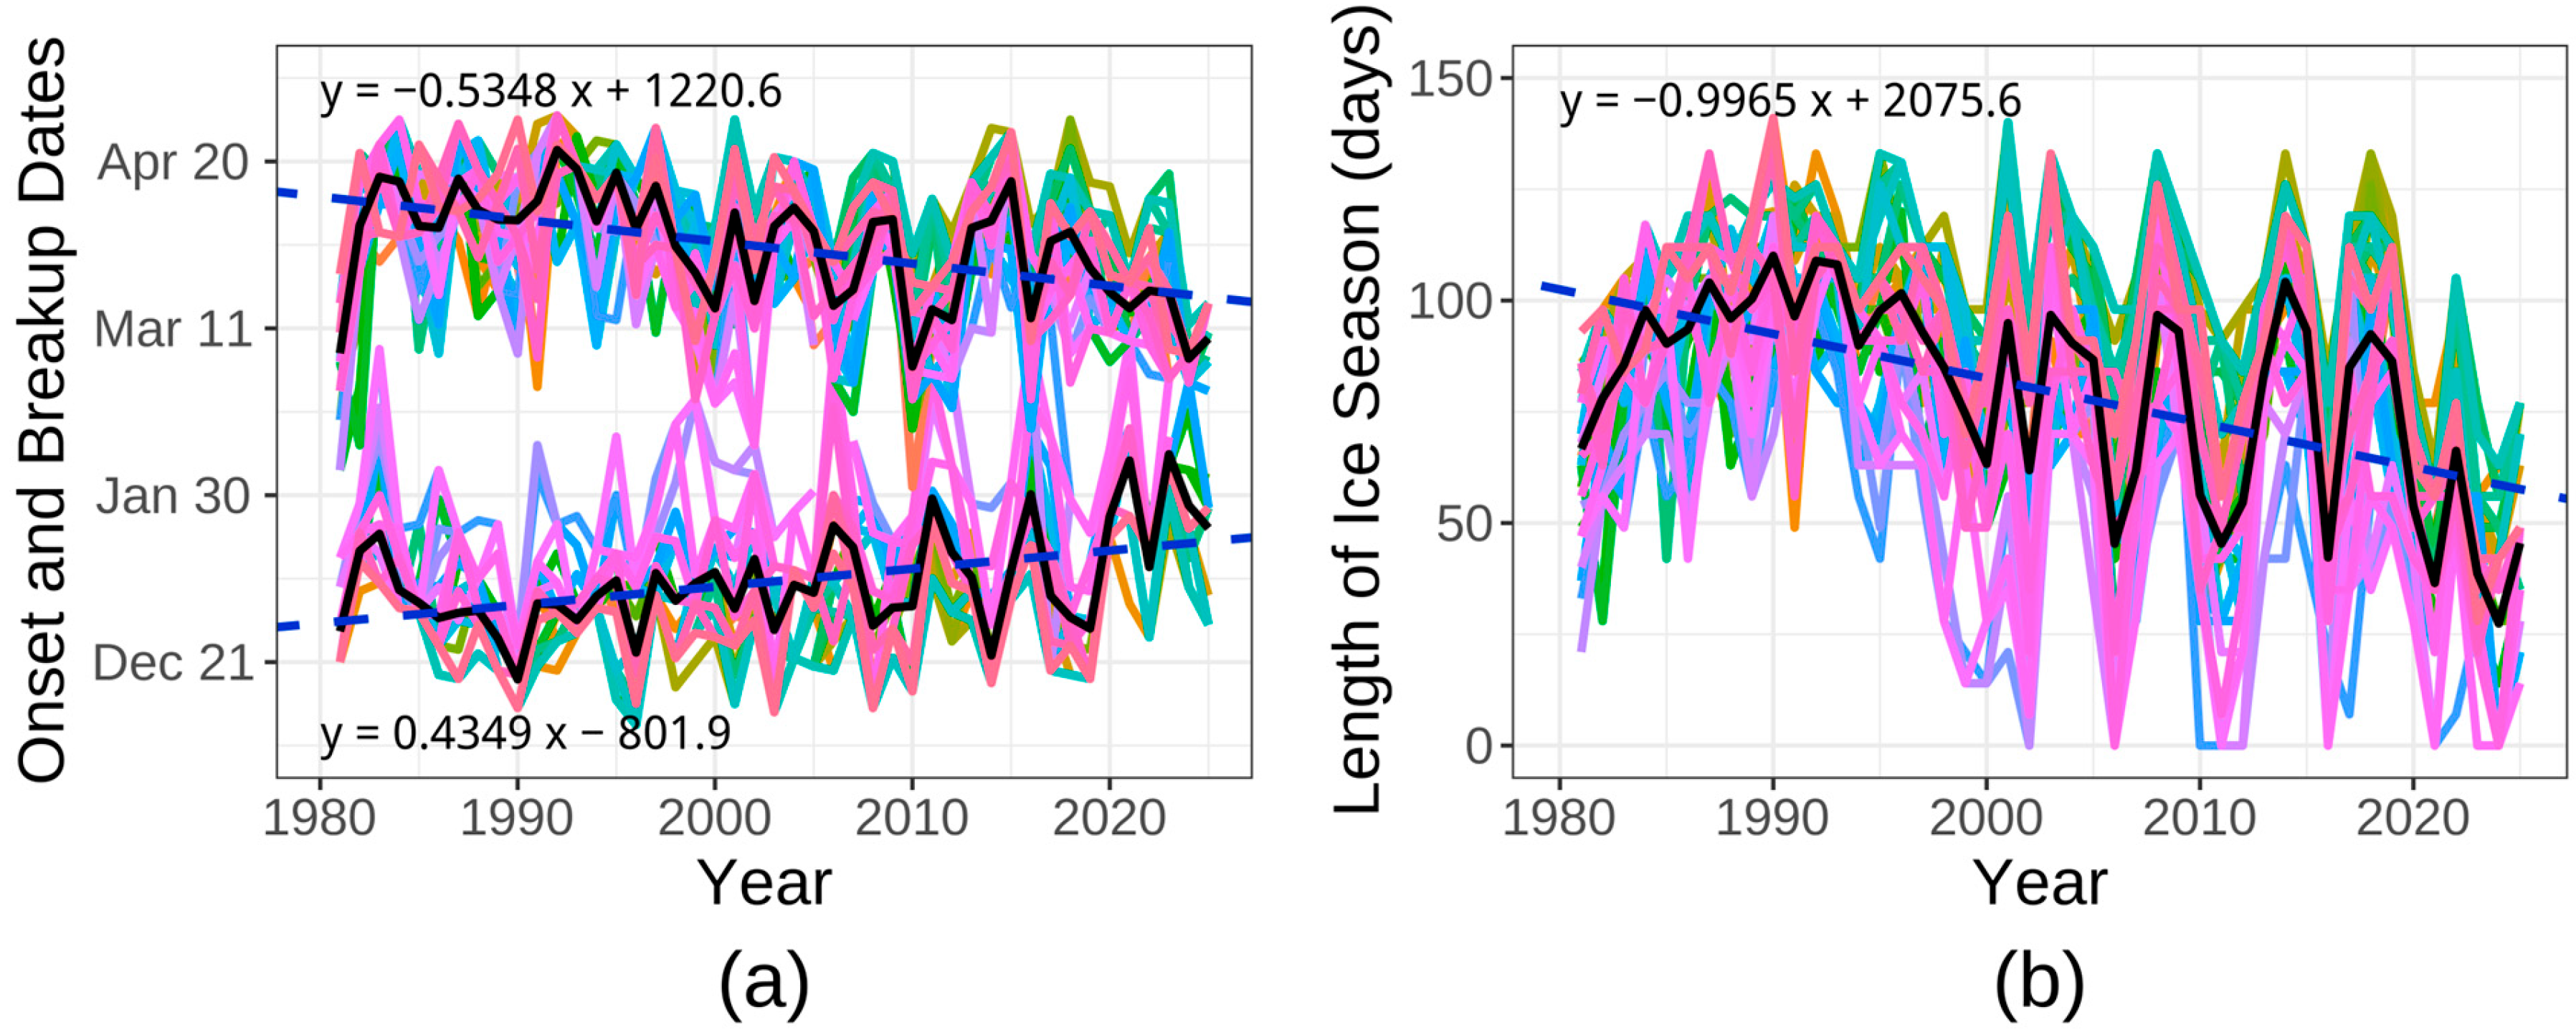
The trends for the historical ice onset and breakup dates at the 50 study sites are depicted in Figure 12a. The onset dates demonstrate a clear increasing trend as the start of the ice season is increasingly delayed over time. The reverse trend is observed in the breakup dates, with the end of the season occurring in mid-March in recent years versus typically occurring in mid-April during the 1980s. The breakup date is changing slightly more quickly than the onset dates, with observed rates of change of 0.53 days/year earlier for breakup and 0.43 days/year later for ice onset.
The ice season length, defined as the number of days between ice onset and breakup, is trending shorter with a rate of change of −1.0 days/year. The linear regression of the average season length estimates an approximate season length of 101 days in 1981, reducing to a mean season length of 58 days in 2025.
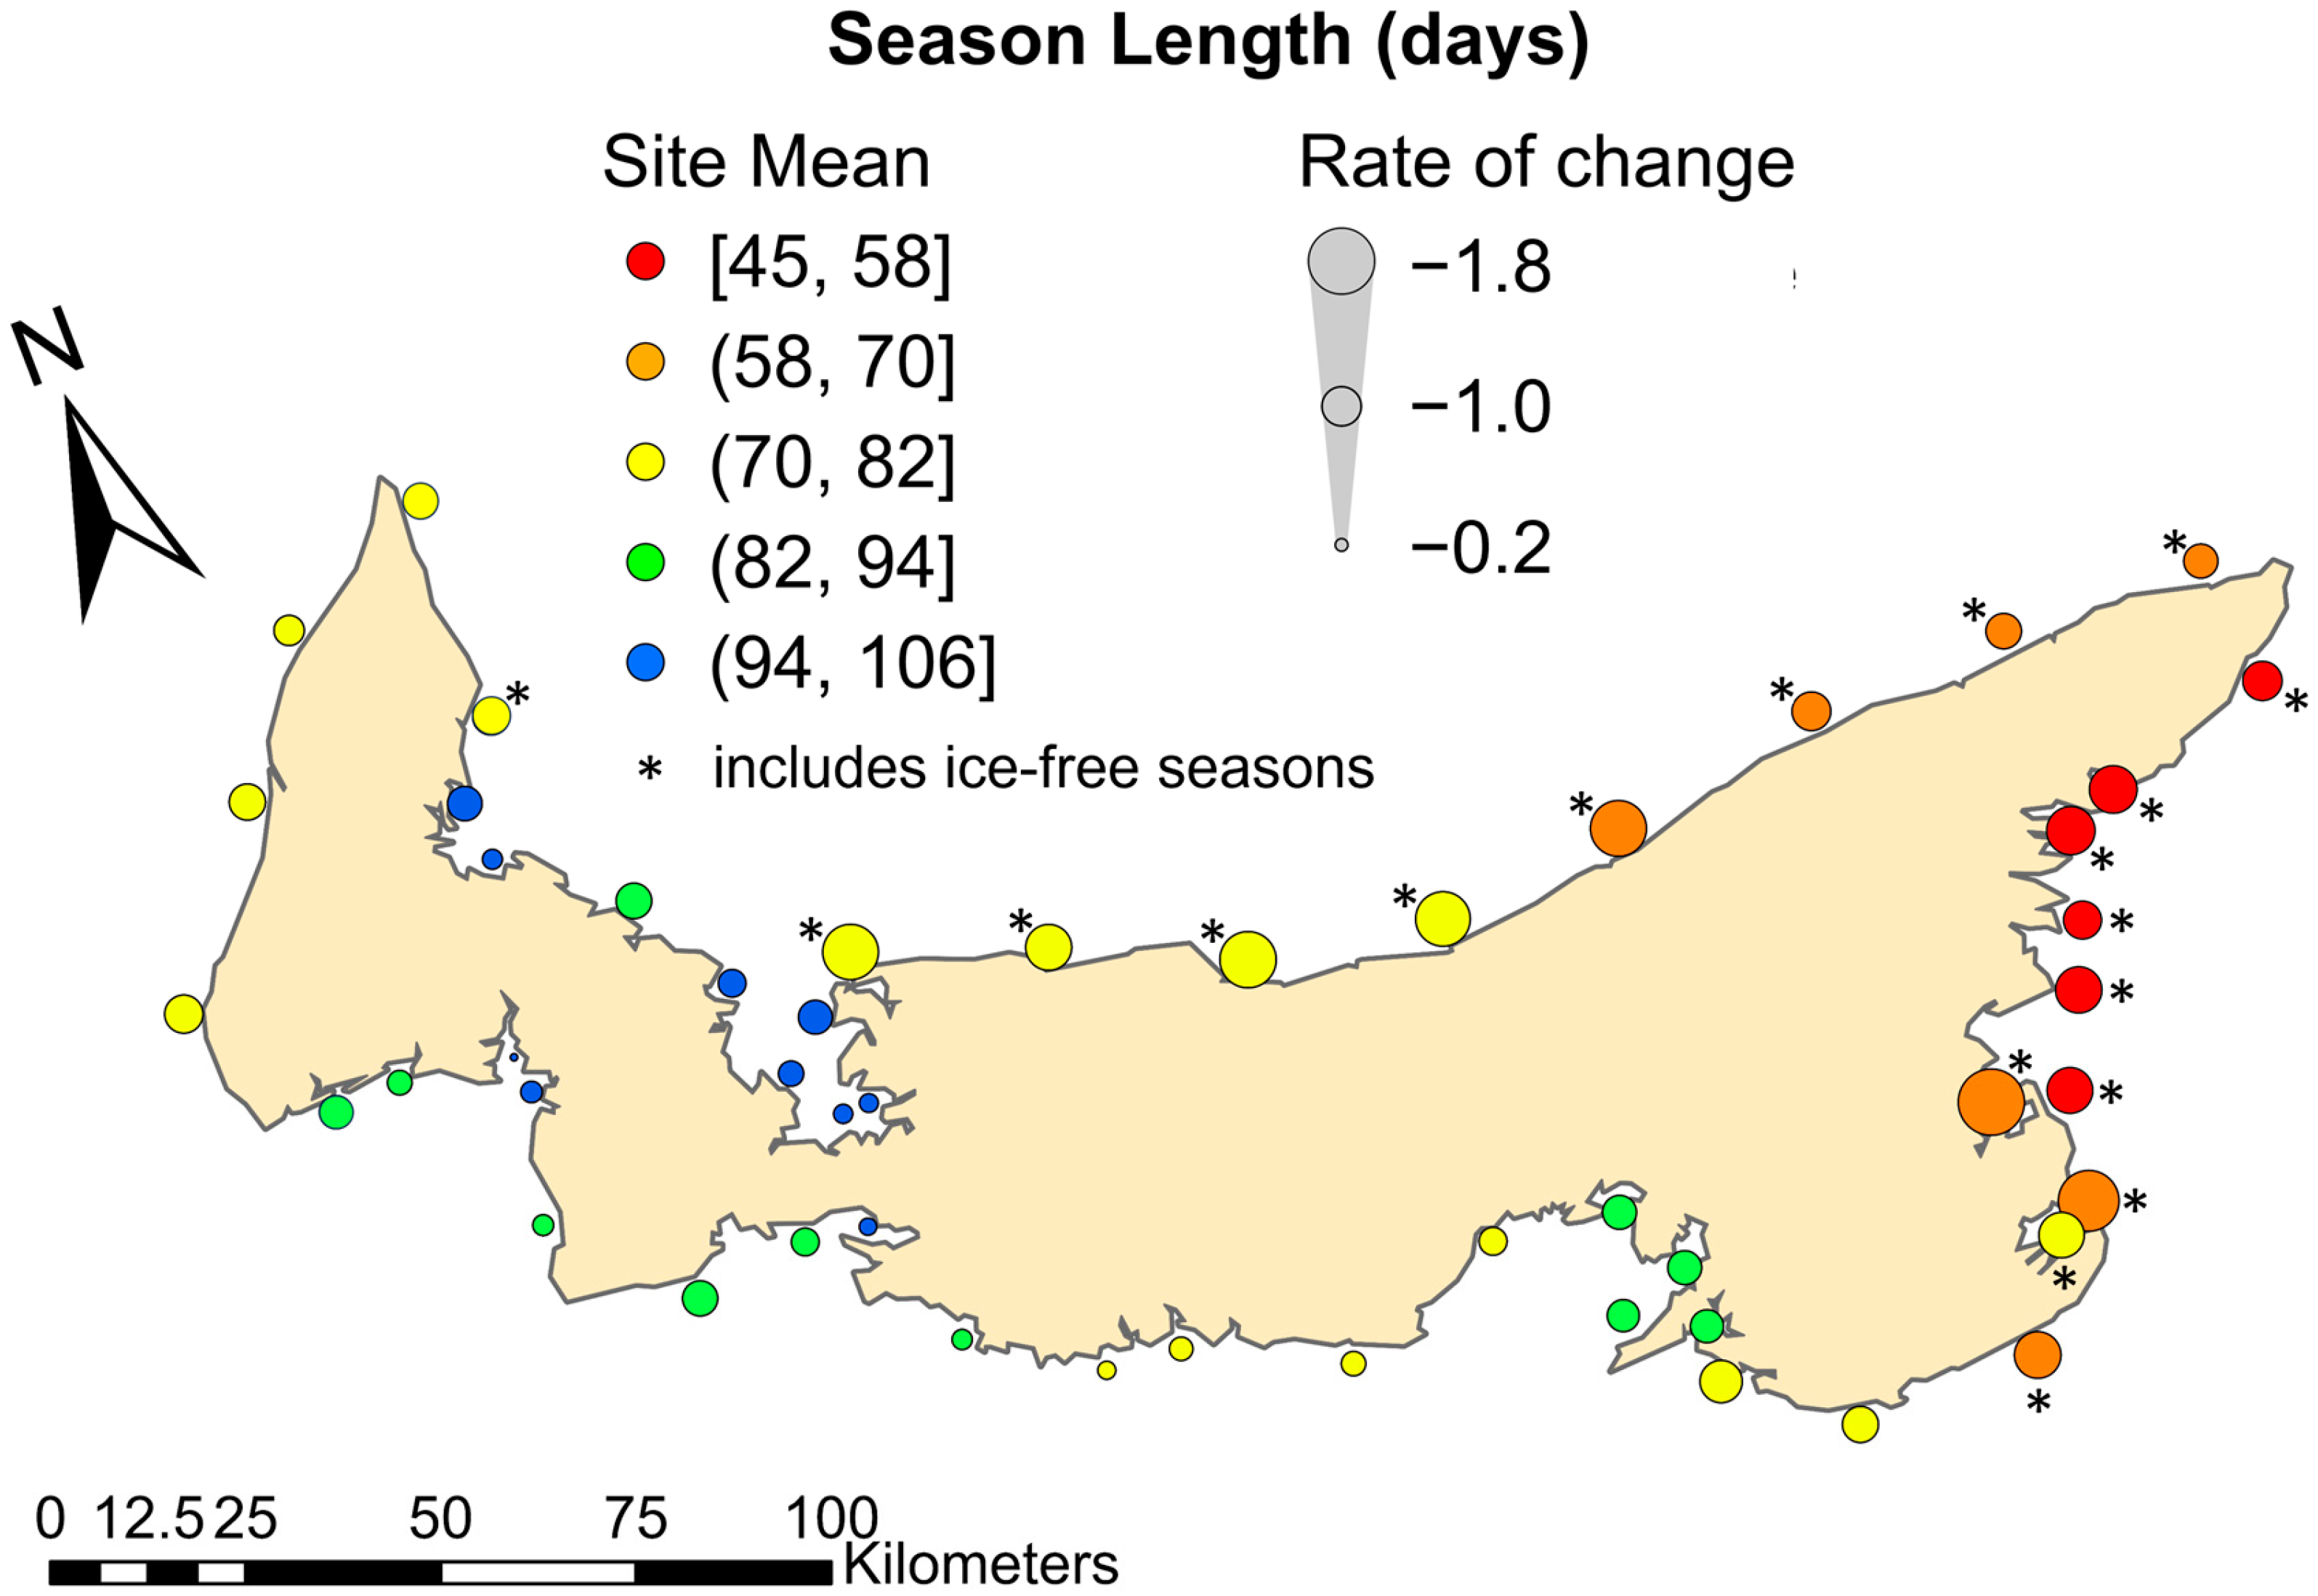
Notably, there is substantial variation in ice season length across the province. As with the seasonal ice indices, less ice coverage is observed along the eastern shore, and the greatest coverage is in sheltered bays in the west. The local mean values for season length across the historical period are indicated by colour in Figure 13. Several sites in Eastern PEI have observed multiple years with zero ice season since 2002, indicating that the local ice concentration never exceeded the 50% threshold used to define the ice season onset; these are denoted with a star in Figure 13.
The observed rate of change for ice season length is greatest along the highly exposed north shore of the province and in the vulnerable areas to the east. As with the SII metric, the sheltered sites in coastal bays and along the Northumberland Strait to the south are more resilient to change.

3.4.2. Correlation of Season Lengths with Freezing Degree Days

Season length correlation with freezing degree days is assessed using linear and logarithmic regression as summarized in Table 4. The logarithmic regression demonstrates a marginally better fit with the historical data compared to the linear correlation, with a mean R2 value of 0.56 versus 0.52. The selection of the logarithmic regression also mitigates the issue of overestimation of season length when extrapolating to low FDD values. The linear regression implies non-zero ice season lengths for 40 of 50 sites, even when there are no freezing degree days.
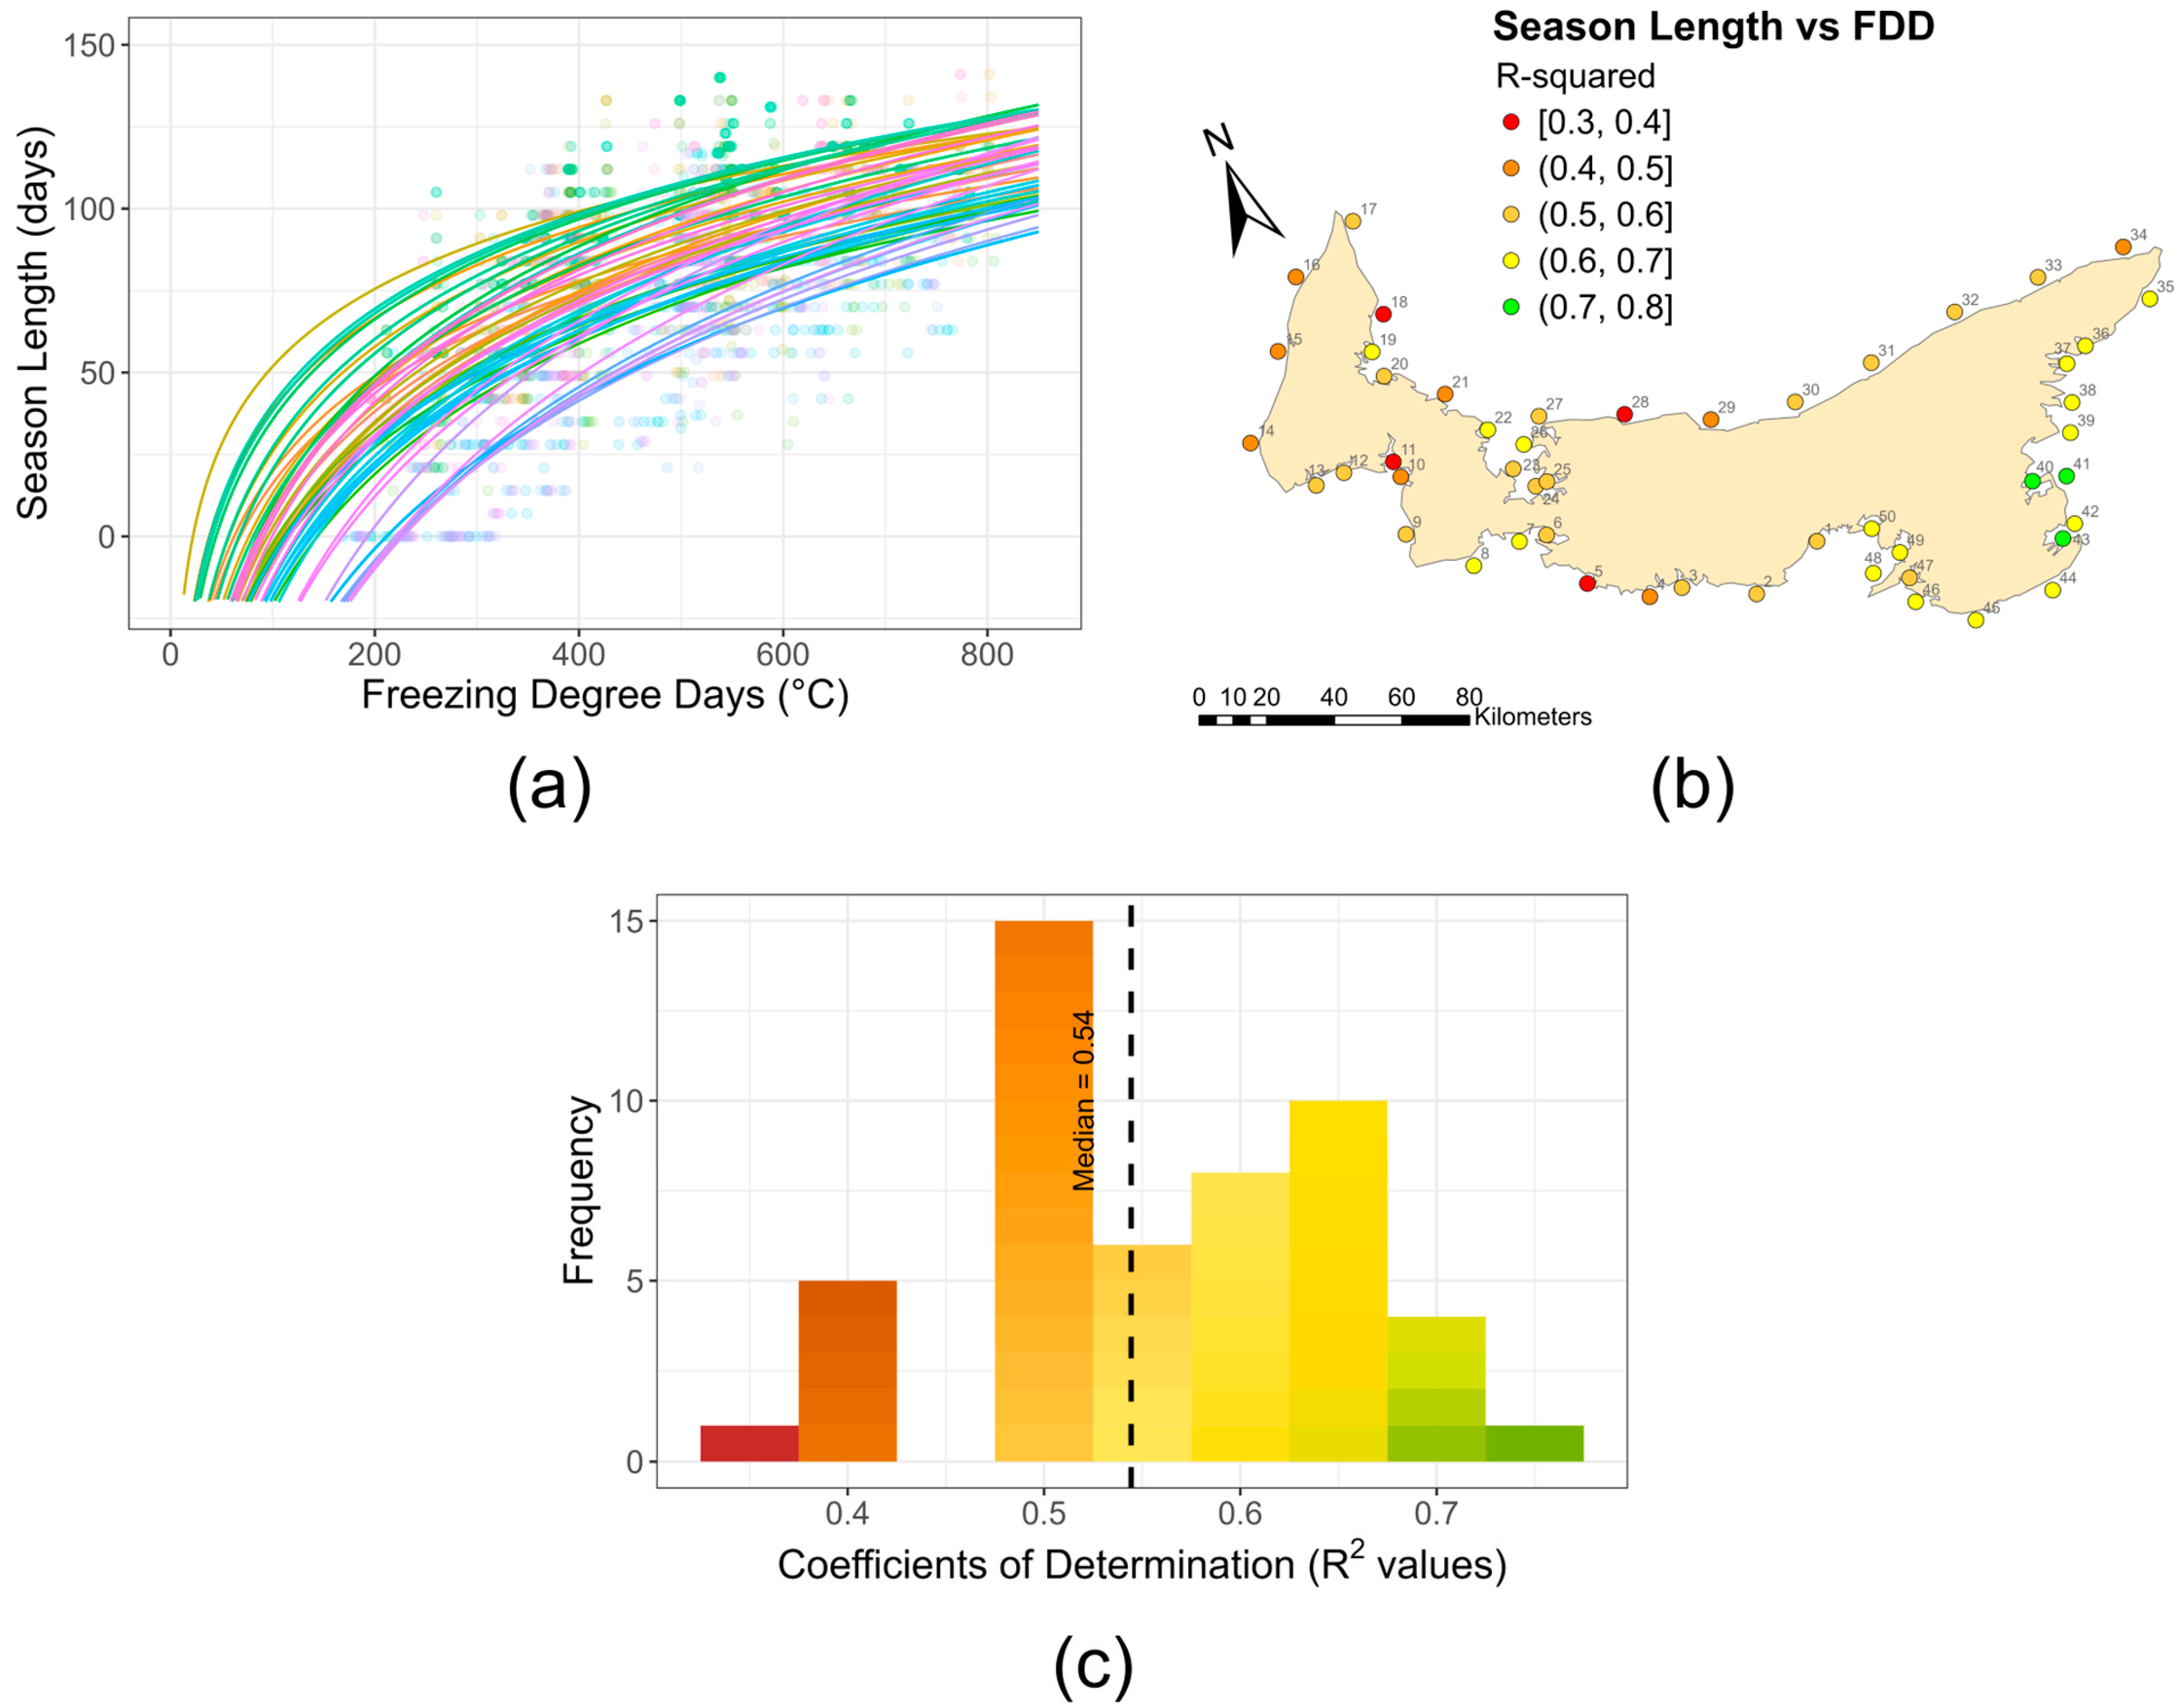
Site-specific logarithmic correlations of FDD with season length are summarized in Figure 14. The spatial distribution of fit quality is less distinct than that of the SII and FDD fit; however, the same pattern is evident. The strongest correlations are observed along the eastern and southern shores, while the bays and the northern coast demonstrate a weaker relationship. The median coefficient of determination is 0.54, indicative of a strong correlation. All sites had adequate R2 values, with a minimum observed value of 0.36.

3.4.3. Projections of Ice Season Length

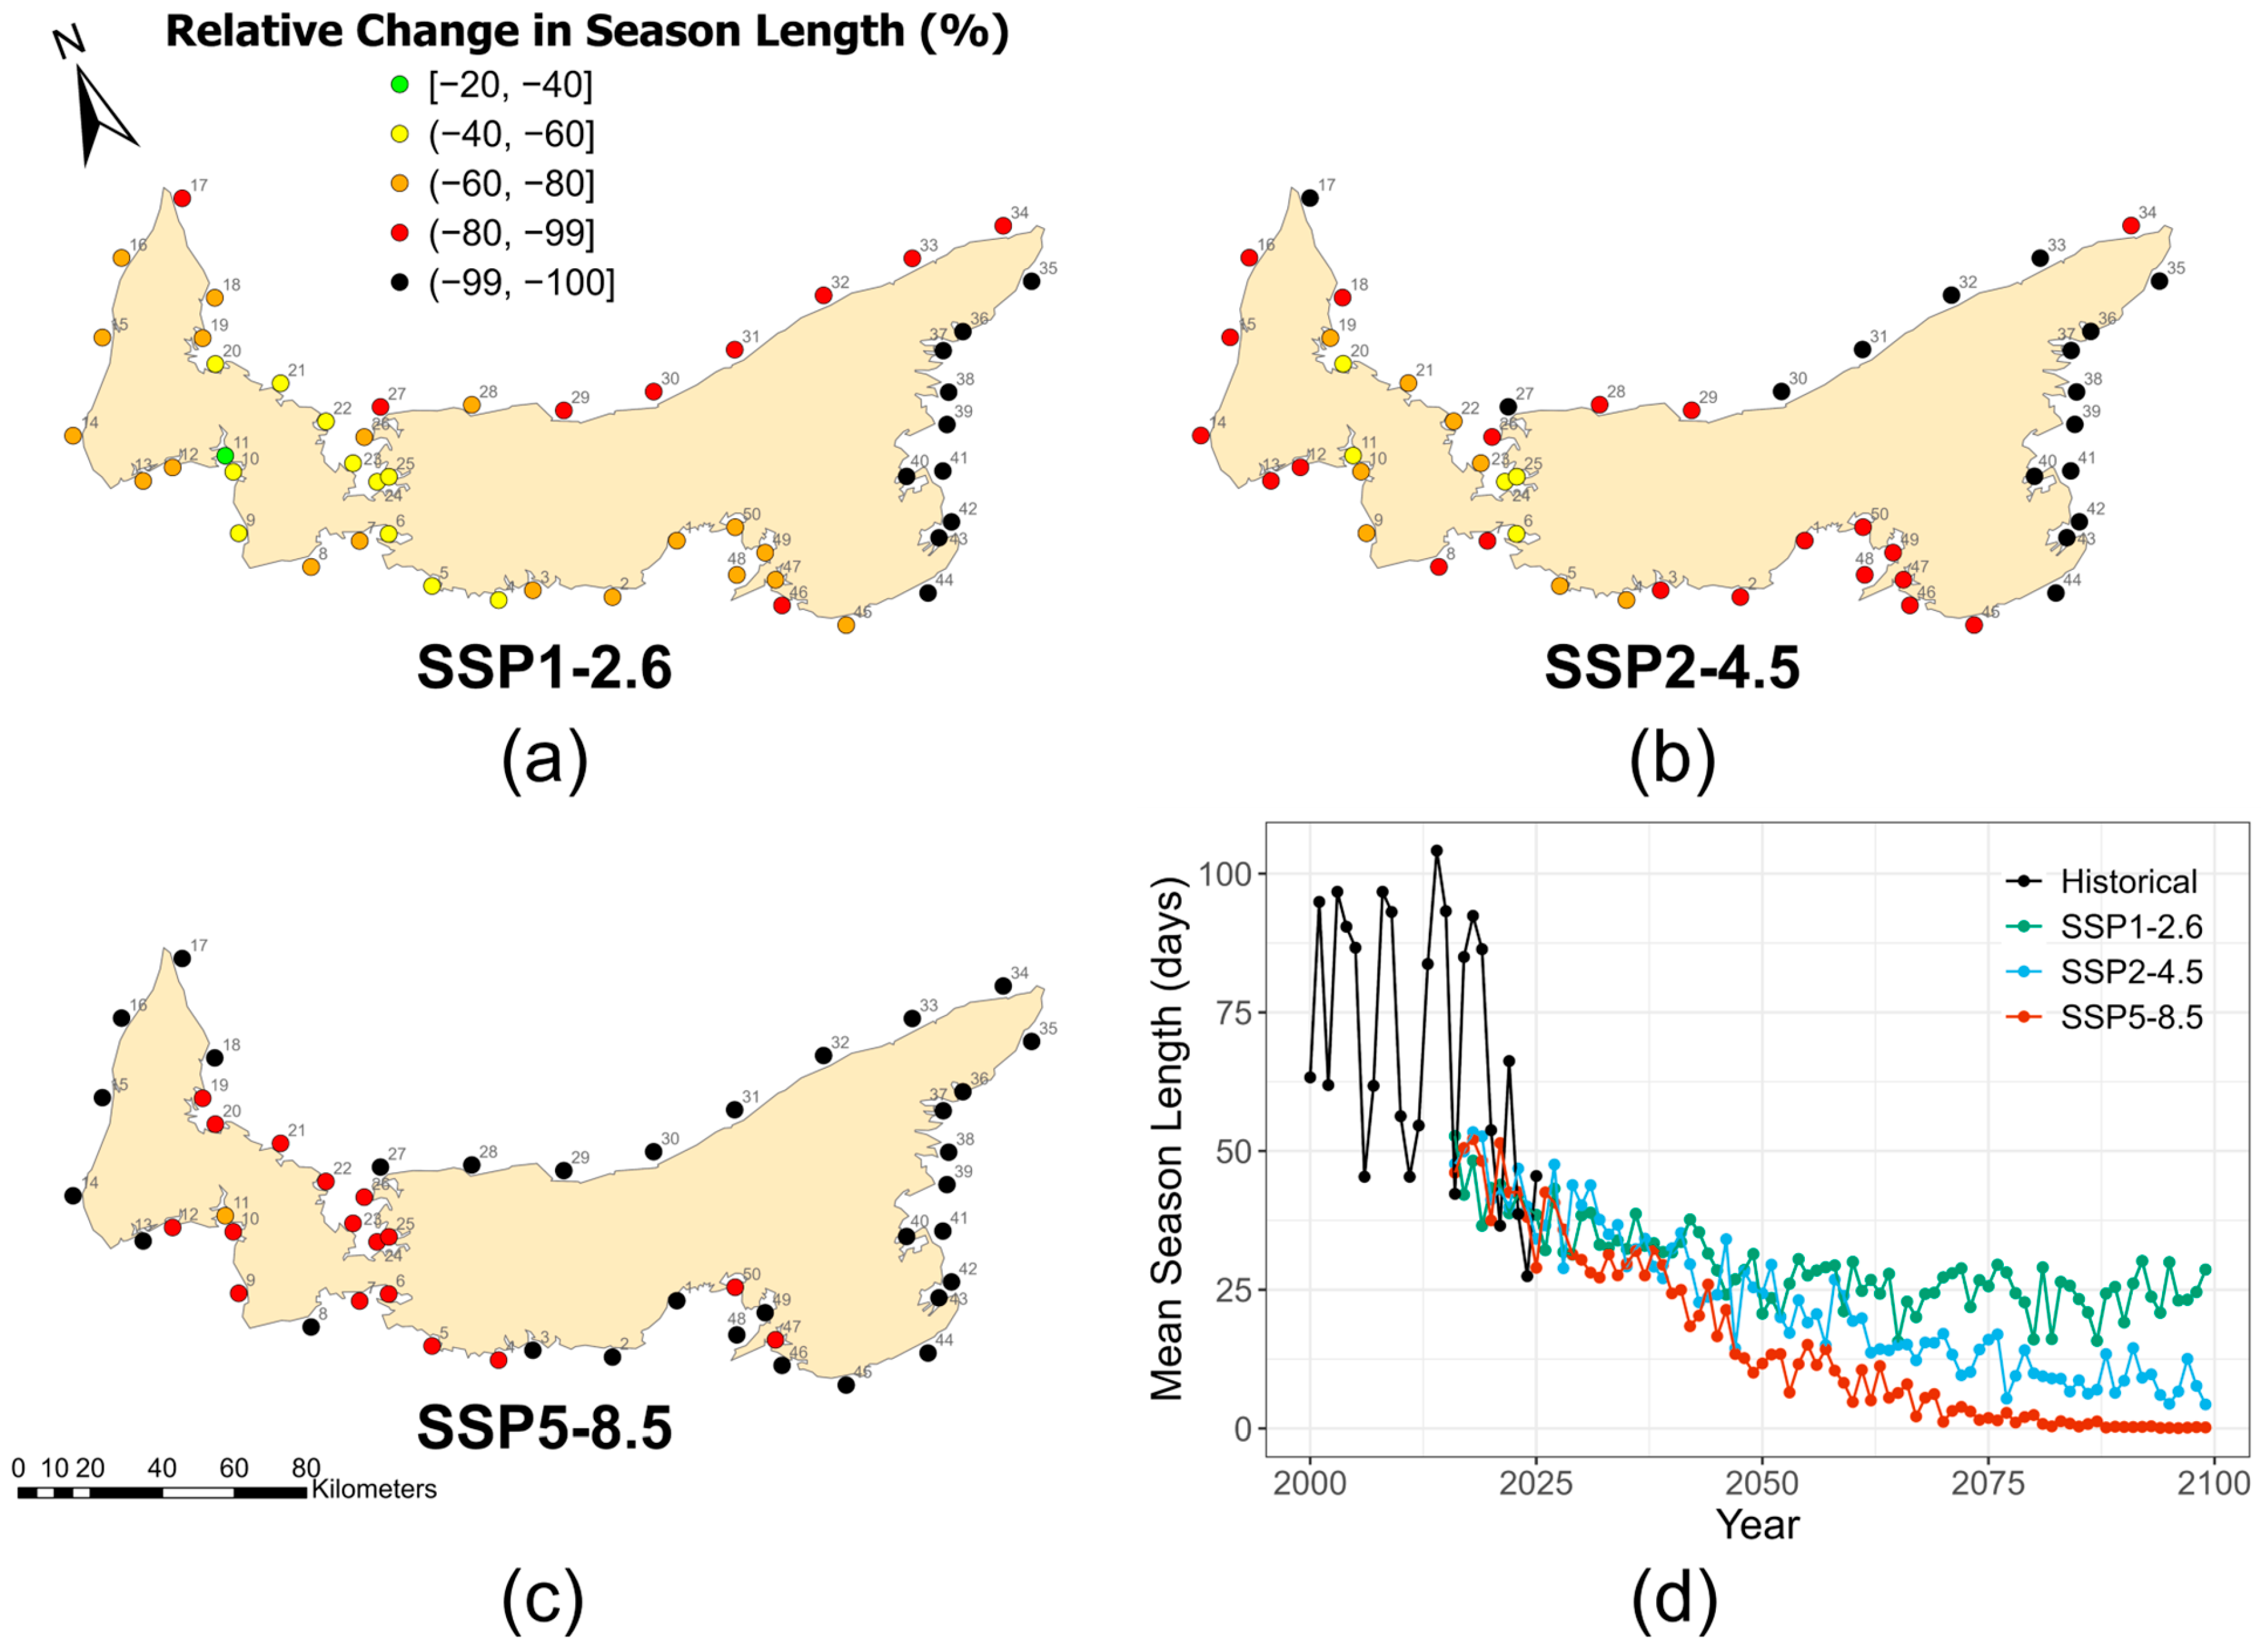
The logarithmic correlations are used alongside the GCM-derived FDD values to generate projections of future ice season lengths under three climate scenarios (see Figure 15a–c). The season length for the low-emission case, SSP1-2.6, is expected to level off around the mid-century (see Figure 15d) with mean projected season lengths in the 2050s and 2090s of 26 days and 24 days, respectively (Table 3). Under SSP2-4.5, long-term season length projections are roughly half the values of the low-emission scenario, with 13 days projected for the 2090s. Near complete loss of the ice season is projected under the high-emission scenario, SSP5-8.5 (see Figure 15c). The mean projected season length for the 2090s is only 3 days, a 96% reduction from the observed mean during the historical period.
Ice loss under the high-emission scenario is widespread across the island, with 45 of 50 sites expecting a greater than 90% reduction in season length, corresponding to season lengths of fewer than 10 days. The sites with the most persistent ice seasons are all located in sheltered bays. Only Percival Bay (site 11) projected a reduction in the ice season by less than 80%.
In the lower-emission scenarios, spatial patterns in ice season length are more prominent, with the observed changes increasing to the east. Using SSP1-2.6, only sites along the eastern coastline experience complete elimination of the ice season. Locations along the northeastern shore are projected to be another vulnerable region. The bays in the western half of the province provide the shelter associated with persistent ice season length, with five locations projecting losses of less than 50% compared to the historical average season length (sites 6, 11, 20, 24, 25).
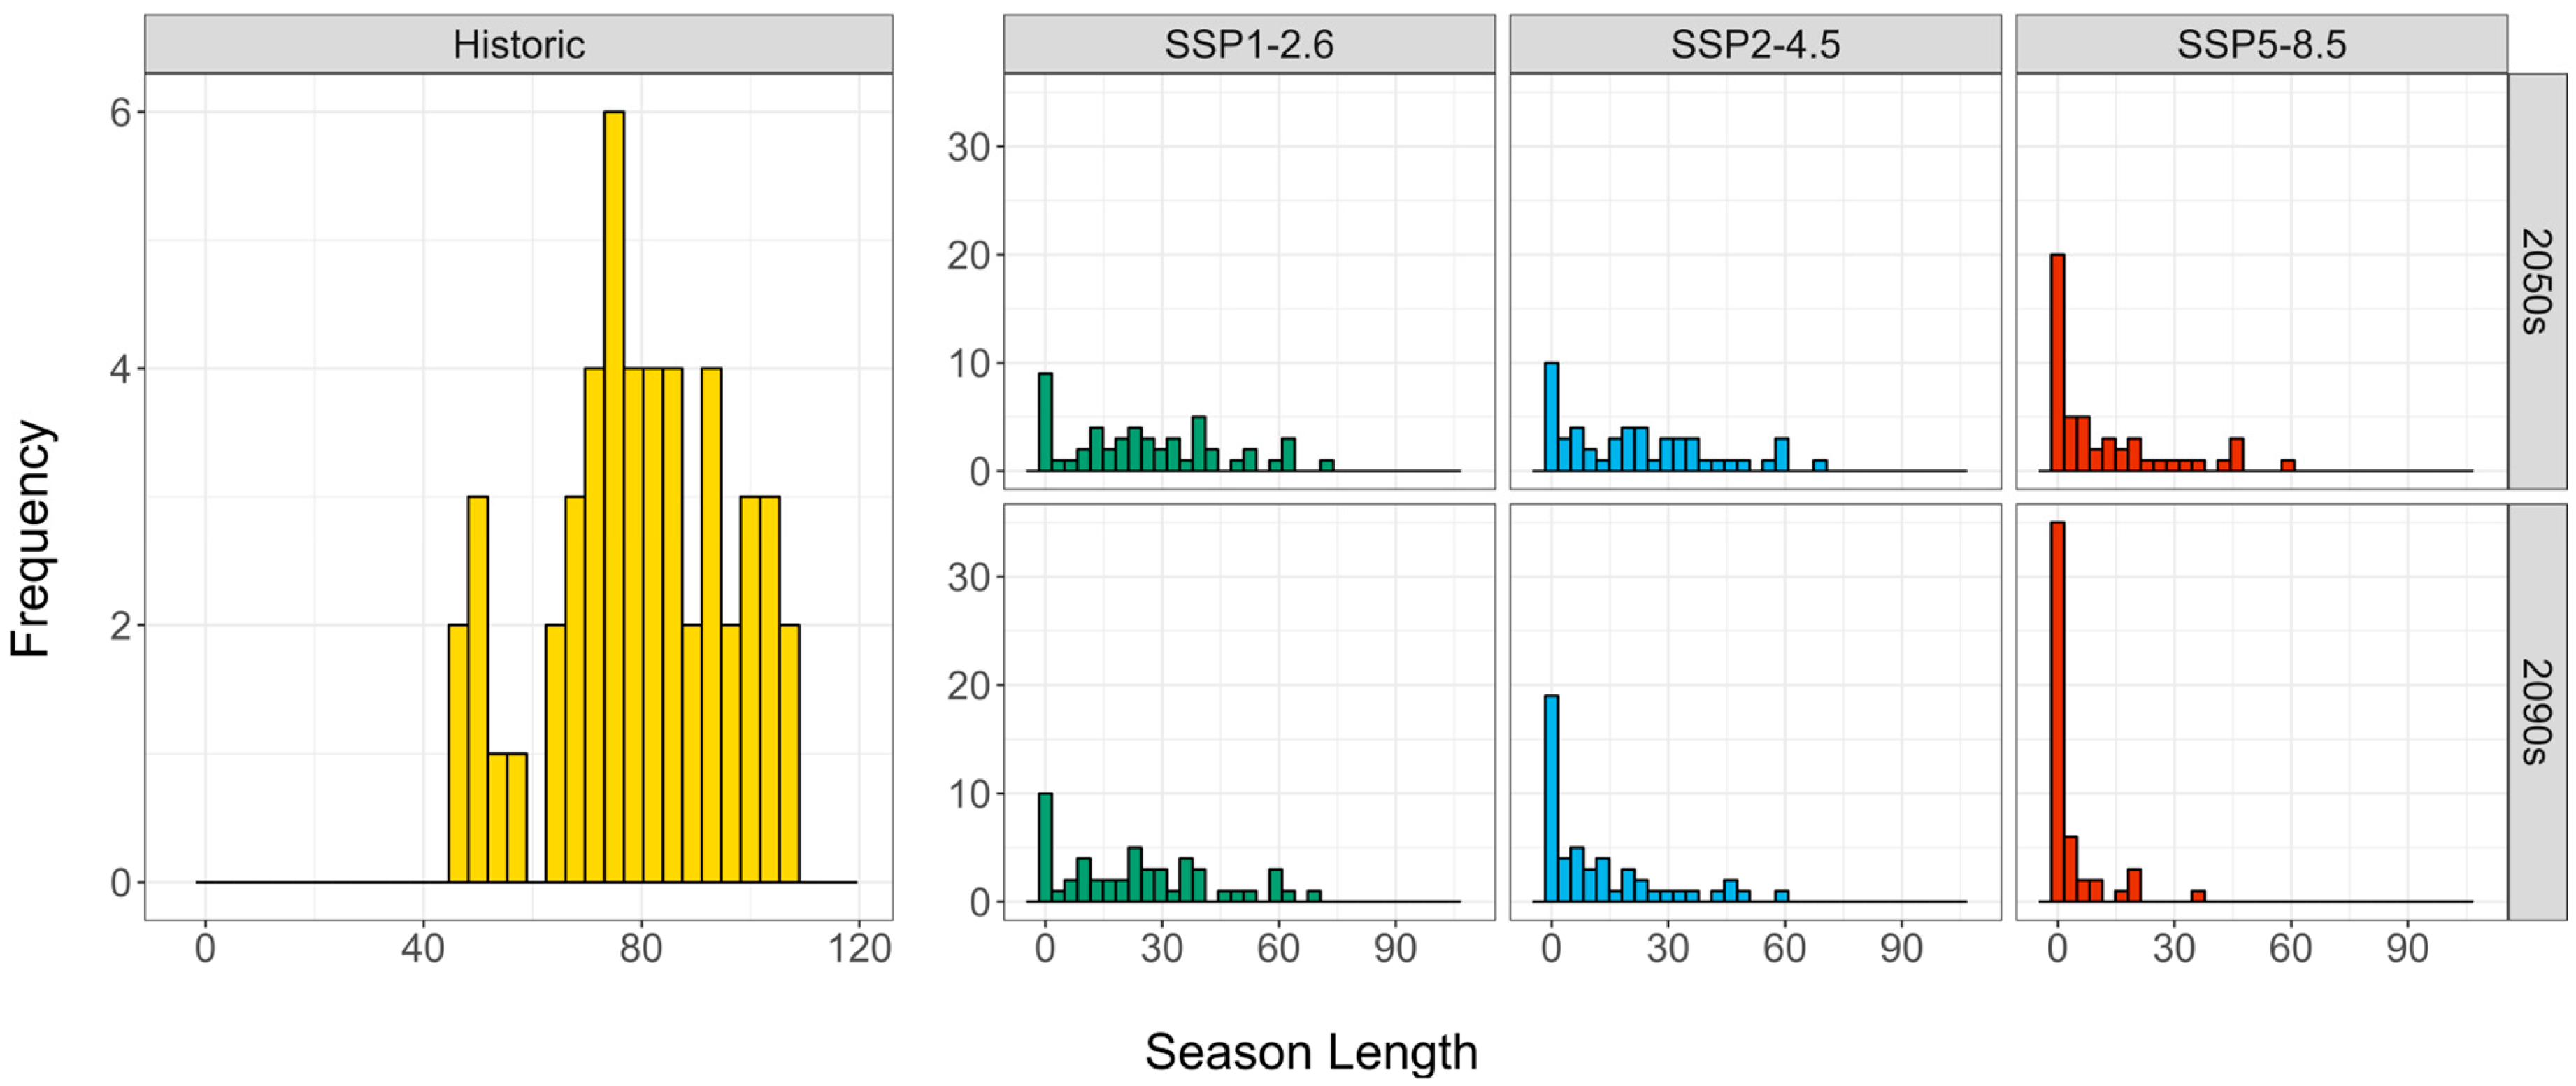
Similarly to the SII projections, most of the change in season length is expected to occur prior to the 2050s (Figure 15d and Figure 16). In the low-emission scenario, the season lengths level off as temperatures stabilize in the mid-century. The average projected season length is 26 days for the 2050s and 24 days for the 2090s. Using SSP2-4.5, little change is observed in the range of site-specific projections; however, the distribution does shift to the left. Average projected values for the 2050s and 2090s are 22 and 13 days, respectively. For SSP5-8.5, 40% of the local ice seasons have disappeared prior to 2050, with many additional sites losing their remaining ice season during the final decades of the century. The mean projected season length for the 2090s under SSP5-8.5 is only 3 days.
As with other metrics, the sharp decline in season length begins during the historical period. The mean season length from 1981 to 1999 was 93.5 days. Season lengths have reduced substantially since the turn of the century, with an average of only 44.7 days in the past 6 years.

4. Conclusions

An impact assessment was performed to determine the effect of climate change on ice coverage in Prince Edward Island. Mean daily temperature data from the Charlottetown airport weather station were used to establish baseline datasets for Tmean and FDD. Ice concentration data for the same historical period (1981–2025) were accessed via the Canadian Ice Service archive and correlated with FDD values using logarithmic regression. Good correlation between FDD and SII was seen for all sites, yet substantial spatial variation in R2 values was observed (Figure 9a). The correlation was strongest in the waters of the Northumberland Strait but was weaker along the north shore. It is likely that factors other than temperature, such as wind or precipitation, have a greater influence on the more exposed northern coastline facing the Gulf [28]. Some highly sheltered locations also demonstrated poorer correlation, perhaps due to the unusually persistent ice in these regions.
Spatial trends were also evident in the historical ice data. The greatest SII and season lengths were observed in the sheltered bays of Western PEI. Ice was least prominent along the eastern shore of the province. This is likely due to the currents of the Gulf, which travel easterly through the shallow waters of the Northumberland Strait, causing a slightly higher sea surface temperature. The rate of change observed in ice coverage is also affected by local exposure, with sites along the eastern and northern shores having the fastest depletion of ice coverage. Although seasonal ice is decreasing across all sites, ice in geographically protected areas appears to be more persistent and is decreasing at a slower rate.
Ensembles of GCMs from CMIP6 were used to assemble datasets for the remainder of the 21st century. Freezing metrics (FDD, seasonal ice index, and season length) showed substantial decreases in future projections (see Table 3). In a low-emission scenario, virtually all this change occurred in the first half of the century, with values leveling off in later years. Major losses in ice are expected even under a low-emission scenario due to committed global warming. The number of freezing degree days is expected to reduce by 64% by the 2050s, and the ice index is expected to decrease by 66%. Some of these changes have already been reflected in historical records since 2000. In the SSP2-4.5 scenario, losses are expected to continue into the latter half of the century, albeit at a reduced rate of change. The high-emission pathway, SSP5-8.5, has the greatest projected changes for FDD, SII, and season length, with projected reductions of 94, 93, and 96% by the 2090s, respectively. Local relative SII loss ranged from 55% to 100% by 2100 and season lengths were projected to decrease by 66–100%. Sheltered locations see smaller changes in SII and season length compared to nearby locations. Site 7, Miscouche, located in the Northumberland Strait just outside of Bedque Bay on the south shore of the island, demonstrates near median changes in ice coverage, with a 61% reduction in SII using SSP1-2.6 and near complete ice loss under SSP5-8.5 at 98%. The neighboring site within the Bay, Summerside (#6), is losing ice at a much slower rate, with a 31% reduction in coverage for SSP1-2.6, and a 61% change for SSP5-8.5. This disparity in projected ice coverage is notable for two locations separated by less than 6 km and indicates the criticality of geomorphology in ice persistence. Thermal and mechanical processes are known to impact the breakup of nearshore ice [29,30]. The results from this experiment highlight the need to understand these interactions. The ratio of thermal versus mechanical drivers is largely dependent on the exposure of the site, as demonstrated by higher ice content at sheltered locations. Ice breakup in the protected bays is dominated by thermal processes [29] and happens much later than in nearby sites.
Interestingly, the correlation model performs best in areas that are somewhat sheltered, along the southern and eastern coastlines in the Northumberland Strait. Poorer correlations are observed in both the thermally driven thawing of the most-protected coastal bays and the exposed northern shore, where mechanical processes contribute relatively more to ice breakup. Although the model input is solely temperature-based, the best fits are obtained for sites that the literature suggests should have an intermediate mixture of thermal and mechanical processes contributing to ice breakup. This may imply an interaction between process types (i.e., that temperature can accelerate mechanical breakup as well). Further work with more complex models, including thermal and mechanical inputs, is needed to elucidate further insights.
Overall, a significant decrease in ice coverage is expected around Prince Edward Island over the coming 75 years. The decreasing SII has been reflected in the shortening of the ice season. However, there could come a time when the concentration of ice is also impacted. Since winter temperatures are typically only a few degrees below freezing, a small amount of warming has a significant impact on the ice climate of the region. Sea ice in the southern Gulf of St Lawrence has historically had an erosion-mitigating effect, as the fast ice in the nearshore region protects the coast by diminishing wave action during winter storms [31,32]. Coastal ice has been known to accentuate erosion in other cases; however, due to friction at the interface of ice and land [4]. Coastal scour is particularly damaging during breakup and in cases where open water interacts with a shallow nearshore ice complex [29,33]. The projections of sea ice cover in PEI indicate a thinning of the ice around the province, leading to more frequent ice breakups. This dynamic and fragile ice environment may result in accelerated coastal erosion in contrast to the ice armouring observed in the past.
Reduced ice coverage could extend seasons for ferry services, fishing, and other recreational activities in the area; however, it is likely to cost hundreds of millions of dollars in erosion mitigation and damage, on top of ecological damage. Residents of the province should be made aware of the risks involved in loss of sea ice, so that appropriate adaptation strategies can be designed and implemented.

Supplementary Materials

The following supporting information can be downloaded at https://www.mdpi.com/article/10.3390/w18070777/s1, Table S1: List of Models; Table S2: Summary of historical modelling similarity to measured values; Figure S1: Seasonal mean temperatures from modelled values and from historical measurements; Figure S2: Modelled freezing degree days from 22 CMIP6 GCMs; Table S3: Geographic locations used in ice analysis; Table S4: Linear correlation of SII with FDD; Table S5: Changepoint detection test results; Table S6: Piecewise linear correlation of SII with FDD for selected sites; Table S7: Linear via origin correlation of SII with FDD; Table S8: Logarithmic correlation of SII with FDD; Table S9: Quadratic correlation of SII with FDD; Table S10: Logistic correlation of SII with FDD; Figure S3: Autocorrelation between site longitude and model; Figure S4: Map of spatial autocorrelation; Table S11: Seasonal ice index projections using logarithmic correlation for 50 sites around Prince Edward Island; Table S12: Linear correlation of season length with FDD; Table S13: Logarithmic correlation of season length with FDD; Table S14: Season length projections using logarithmic correlation for 50 sites around Prince Edward Island.

Author Contributions

Conceptualization, G.K. and X.W.; methodology, G.K.; software, G.K.; formal analysis, G.K.; investigation, G.K.; resources, X.W.; data curation, G.K.; writing—original draft preparation, G.K.; writing—review and editing, X.W.; visualization, G.K.; supervision, X.W.; funding acquisition, X.W. All authors have read and agreed to the published version of the manuscript.

Funding

This research was supported by the Natural Sciences and Engineering Research Council of Canada, Canada Foundation for Innovation, Atlantic Canada Opportunities Agency, and the Government of Prince Edward Island.

Data Availability Statement

The mean daily temperature datasets analyzed during the current study are available in the Environment Canada Historical Data repository, https://climate.weather.gc.ca/index_e.html (accessed on 7 September 2023). The ice chart data are available in the Canadian Ice Service Archive, https://iceweb1.cis.ec.gc.ca/Archive/page1.xhtml?lang=en (accessed on 10 September 2023). CMIP6 climate projection datasets used in this study are available via the Copernicus Climate Data Store, https://cds.climate.copernicus.eu/#!/home (accessed on 26 October 2023).

Conflicts of Interest

The authors declare no conflicts of interest.

Abbreviations

The following abbreviations are used in this manuscript:
PEIPrince Edward Island
SSPShared Socioeconomic Pathway
CMIP6Coupled Model Intercomparison Project Phase 6
GCMGlobal Climate Model
FDDFreezing Degree Days
SIISeasonal Ice Index

References

  1. IPCC. 2021: Climate Change 2021: The Physical Science Basis. In Contribution of Working Group I to the Sixth Assessment Report of the Intergovernmental Panel on Climate Change; Masson-Delmotte, V., Zhai, P., Pirani, A., Connors, S.L., Péan, C., Berger, S., Caud, N., Chen, Y., Goldfarb, L., Gomis, M.I., et al., Eds.; Cambridge University Press: Cambridge, UK; New York, NY, USA, 2021. [Google Scholar] [CrossRef]
  2. Environment and Climate Change Canada—Historical Climate Data. Available online: https://climate.weather.gc.ca/historical_data/search_historic_data_e.html (accessed on 7 September 2023).
  3. Davies, M. Geomorphic Shoreline Classification of Prince Edward Island; Atlantic Climate Adaptation Solutions Association: Charlottetown, PE, Canada, 2011; pp. 1–66. [Google Scholar]
  4. Fang, Z.; Freeman, P.T.; Field, C.B.; Mach, K.J. Reduced sea ice protection period increases storm exposure in Kivalina, Alaska. Arct. Sci. 2018, 4, 525–537. [Google Scholar] [CrossRef]
  5. Hošeková, L.; Eidam, E.; Panteleev, G.; Rainville, L.; Rogers, W.E.; Thomson, J. Landfast Ice and Coastal Wave Exposure in Northern Alaska. Geophys. Res. Lett. 2021, 48, e2021GL095103. [Google Scholar] [CrossRef]
  6. Newbury, T.K. Under Landfast Ice. Arctic 1983, 36, 328–340. [Google Scholar] [CrossRef]
  7. Collins, C.O.; Rogers, W.E.; Marchenko, A.; Babanin, A.V. In situ measurements of an energetic wave event in the Arctic marginal ice zone. Geophys. Res. Lett. 2015, 42, 1863–1870. [Google Scholar] [CrossRef]
  8. Liu, Q.; Rogers, W.E.; Babanin, A.; Li, J.; Guan, C. Spectral Model of Ice-Induced Wave Decay. J. Phys. Oceanogr. 2020, 50, 1583. [Google Scholar] [CrossRef]
  9. Canadian Ice Service. Sea Ice Climatic Atlas. East Coast, 1981–2010; Canadian Ice Service: Ottawa, ON, Canada, 2011; pp. 1–248. [Google Scholar]
  10. Stachowicz, J.J.; Terwin, J.R.; Whitlatch, R.B.; Osman, R.W. Linking climate change and biological invasions: Ocean warming facilitates nonindigenous species invasions. Proc. Natl. Acad. Sci. USA 2002, 99, 15497–15500. [Google Scholar] [CrossRef]
  11. MacMillan, M.R.; Duarte, C.; Quijón, P.A. Sandy beaches in a coastline vulnerable to erosion in Atlantic Canada: Macrobenthic community structure in relation to backshore and physical features. J. Sea Res. 2017, 125, 26–33. [Google Scholar] [CrossRef]
  12. Linse, K.; Peeken, I.; Tandberg, A.H.S. Editorial: Effects of Ice Loss on Marine Biodiversity. Front. Mar. Sci. 2021, 8, 793020. [Google Scholar] [CrossRef]
  13. Ardyna, M.; Babin, M.; Gosselin, M.; Devred, E.; Rainville, L.; Tremblay, J.E. Recent Arctic Ocean Sea Ice Loss Triggers Novel Fall Phytoplankton Blooms. Geophys. Res. Lett. 2014, 41, 6207–6212. [Google Scholar] [CrossRef]
  14. Nöthig, E.M.; Bracher, A.; Engel, A.; Metfies, K.; Niehoff, B.; Peeken, I.; Bauerfeind, E.; Cherkasheva, A.; Gäbler-Schwarz, S.; Hardge, K.; et al. Summertime plankton ecology in Fram Strait—A compilation of long-and short-term observations. Polar Res. 2015, 34, 23349. [Google Scholar] [CrossRef]
  15. Wassmann, P.; Kosobokova, K.N.; Slagstad, D.; Drinkwater, K.F.; Hopcroft, R.R.; Moore, S.E.; Ellingsen, I.; Nelson, R.J.; Carmack, E.; Popova, E.; et al. The contiguous domains of Arctic Ocean advection: Trails of life and death. Prog. Oceanogr. 2015, 139, 42–65. [Google Scholar] [CrossRef]
  16. Ehrlich, J.; Schaafsma, F.L.; Bluhm, B.A.; Peeken, I.; Castellani, G.; Brandt, A.; Flores, H. Sympagic Fauna in and Under Arctic Pack Ice in the Annual Sea-Ice System of the New Arctic. Front. Mar. Sci. 2020, 7, 452. [Google Scholar] [CrossRef]
  17. Laidre, K.L.; Stern, H.; Kovacs, K.M.; Lowry, L.; Moore, S.E.; Regehr, E.V.; Ferguson, S.H.; Wiig, Ø.; Boveng, P.; Angliss, R.P.; et al. Arctic marine mammal population status, sea ice habitat loss, and conservation recommendations for the 21st century. Cons. Biol. 2015, 29, 724–737. [Google Scholar] [CrossRef] [PubMed]
  18. Johnston, D.W.; Friedlaender, A.S.; Torres, L.G.; Lavigne, D.M. Variation in sea ice cover on the east coast of Canada from 1969 to 2002: Climate variability and implications for harp and hooded seals. Clim. Res. 2005, 29, 209–222. [Google Scholar] [CrossRef]
  19. Simard, B.; Isaacs, D.; Langis, G.; Langlois, D.; Weir, L.; Desjardins, L.; Provost, R.; Ouellet, R.; Dubé, D. MANICE: Manual of Standard Procedures for Observing and Reporting Ice Conditions, 9th ed.; Fequet, D., Piche, C., Eds.; Canadian Ice Service: Ottawa, ON, Canada, 2005. [Google Scholar]
  20. Asam, S.; Bhat, C.; Bennett, N.; Hurley, B.; Vargo, A.; Young, C. Prince Edward Island (PEI) Climate Change Risk Assessment; Taylor, E., Brennan, K., Nishimura, P., Parnham, H., Eds.; Department of Environment, Energy and Climate Action: Charlottetown, PE, Canada, 2021. [Google Scholar]
  21. Fenech, A.; MacLellan, J. Rapid assessment of the impacts of climate change (RAICC): Building past and future histories of climate extremes. In Linking Climate Models to Policy and Decision-Making; University of Prince Edward Island: Charlottetown, PE, Canada, 2007; pp. 83–131. [Google Scholar]
  22. Copernicus Climate Change Service—Climate Data Store: CMIP6 Climate Projections. Available online: https://cds.climate.copernicus.eu/datasets/projections-cmip6?tab=overview (accessed on 22 March 2026).
  23. Ice Archive—Chart Extents. Available online: https://iceweb1.cis.ec.gc.ca/Archive/page5.xhtml?lang=en&map=WeeklyRegions.jpg (accessed on 10 September 2023).
  24. Wang, X.; Huang, G.; Liu, J. Observed regional climatic changes over Ontario, Canada, in response to global warming. Meteorol. Appl. 2016, 23, 140–149. [Google Scholar] [CrossRef]
  25. Monthly Global Climate Report for Annual 2022—NOAA National Centers for Environmental Information. Available online: https://www.ncei.noaa.gov/access/monitoring/monthly-report/global/202213 (accessed on 26 November 2023).
  26. Gottlieb, A.R.; Mankin, J.S. Evidence of human influence on Northern Hemisphere snow loss. Nature 2024, 625, 293–300. [Google Scholar] [CrossRef]
  27. Burn, D.H.; Cunderlik, J.M.; Pietroniro, A. Hydrological trends and variability in the Liard River basin. Hydrol. Sci. J. 2004, 49, 53–67. [Google Scholar] [CrossRef]
  28. Galbraith, P.S.; Chassé, J.; Dumas, J.; Shaw, J.L.; Caverhill, C.; Lefaivre, D.; Lafleyr, C. Physical Oceanographic Conditions in the Gulf of St. Lawrence During 2021; Research Document 2022/034; DFO Canadian Science Advisory Secretariat: Ottawa, ON, Canada, 2022; 83p. [Google Scholar]
  29. Theuerkauf, E.J.; Zoet, L.K.; Dodge, S.E.; Tuttle, W.; Rawling, J.E. Nearshore ice complex breakup is controlled by a balance between thermal and mechanical processes. Earth Surf. Process. Landf. 2023, 48, 3315–3329. [Google Scholar] [CrossRef]
  30. Farquharson, L.M.; Mann, D.H.; Swanson, D.K.; Jones, B.M.; Buzard, R.M.; Jordan, J.W. Temporal and spatial variability in coastline response to declining sea-ice in northwest Alaska. Mar. Geol. 2018, 404, 71–83. [Google Scholar] [CrossRef]
  31. Forbes, D.L.; Parkes, G.S.; Manson, G.K.; Ketch, L.A. Storms and shoreline retreat in the southern Gulf of St. Lawrence. Mar. Geol. 2004, 210, 169–204. [Google Scholar] [CrossRef]
  32. Nielsen, D.M.; Dobrynin, M.; Baehr, J.; Razumov, S.; Grigoriev, M. Coastal Erosion Variability at the Southern Laptev Sea Linked to Winter Sea Ice and the Arctic Oscillation. Geophys. Res. Lett. 2020, 47, e2019GL086876. [Google Scholar] [CrossRef]
  33. Forbes, D.L.; Manson, G.K.; Chagnon, R.; Solomon, S.M.; Van Der Sanden, J.J.; Lynds, T.L. Nearshore Ice and Climate Change in the Southern Gulf of St. Lawrence. In Proceedings of the IAHR International Symposium on Ice, Dunedin, New Zealand, 2–6 December 2002. [Google Scholar]
Figure 1. The study area includes 50 points along the Prince Edward Island coastline. The Charlottetown Airport weather station is denoted by the purple star.
Water 18 00777 g001
Figure 2. Average daily temperatures for Charlottetown during the freezing season (Nov–Apr), including (a) measurements during the historical period (1981–2025) with trend line in blue and (b) future projections by emission scenario.
Water 18 00777 g002
Figure 3. Mean seasonal temperatures for the Charlottetown weather station (CA008300300) and other weather stations in the province. Values are calculated as means of daily temperatures from November to April.
Water 18 00777 g003
Figure 4. Temperature variation across the province by inverse distance-weighted interpolation.
Water 18 00777 g004
Figure 5. Annual cumulative FDD trends for Charlottetown (measured Apr 30) for (a) the historical period (1981–2025) with trend line in blue and (b) future projections by emission scenario.
Water 18 00777 g005
Figure 6. Seasonal ice indices for Prince Edward Island for (a) the historical observations (1981–2025) at all sites with mean value and trend overlaid in black and (b) mean projections by scenario.
Water 18 00777 g006
Figure 7. Summary of observed seasonal ice indices during the period of 1981–2025. Color indicates the average SII, and size indicates the rate of change in SII determined by linear regression.
Water 18 00777 g007
Figure 8. Overlays of FDD versus SII plots across all study sites for six correlation models.
Water 18 00777 g008
Figure 9. Distribution of coefficients of determination for correlation between FDD and SII across all study sites. All sites were above the acceptability threshold of R2 ≥ 0.2. (a) Spatial distribution of R2 values and (b) frequency distribution.
Water 18 00777 g009
Figure 10. Projected change in seasonal ice indices from the baseline period until the 2090s at 50 locations around Prince Edward Island: projection calculated using (a) SSP1-2.6, (b) SSP2-4.5, and (c) SSP5-8.5.
Water 18 00777 g010
Figure 11. Distribution of projected decreases in SII. Histograms depict binned mean SII values by site versus frequency. Baseline averages are shown in yellow (1981–2025). Projections of mid-century SII values are represented by average values for 2050–2059. Late-century projections are represented by average values for 2090–2099. Projection scenarios are represented by colour: SSP1-2.6 (green), SSP2-4.5 (blue), and SSP5-8.5 (red).
Water 18 00777 g011
Figure 12. Historical observations (1981–2025) at all sites for (a) ice season onset (lower trend) and breakup (top), where the linear regression is calculated using days since November 1 versus years, and (b) season length with mean value and trend overlaid in black.
Water 18 00777 g012
Figure 13. Summary of observed ice season length during the period of 1981-2025. Color indicates the mean season length in days, size indicates the linear rate of change, and * indicates the occurrence of at least one ice-free season in the observed history.
Water 18 00777 g013
Figure 14. Correlation of freezing degree days with ice season length. (a) Logarithmic correlation plots of FDD with SII by site. (b) Spatial distribution of fit quantified by coefficients of determination. (c) Distribution of R2 values.
Water 18 00777 g014
Figure 15. Projected changes in ice season length. Projections include (a) site-specific using SSP1-2.6, (b) site-specific using SSP2-4.5, (c) site-specific using SSP5-8.5, and (d) mean projections across all sites for each scenario.
Water 18 00777 g015
Figure 16. Distribution of projected decreases in ice season length. Histograms depict binned mean season lengths by site versus frequency. Baseline averages are shown in yellow (1981–2025). Projections of mid-century values are represented by average values for 2050–2059. Late-century projections are represented by average values for 2090–2099. Projection scenarios are represented by colour: including SSP1-2.6 (green), SSP2-4.5 (blue), and SSP5-8.5 (red).
Water 18 00777 g016
Table 1. Difference in seasonal mean temperature measurements taken in Charlottetown versus alternative sites around Prince Edward Island.
StationLocationSummary of Local Deviations from the Seasonal Mean Temperature in Charlottetown (°C) 1
Historical MeanMaximumMinimum
CA008300418East Point0.570.990.21
CA008300497New Glasgow0.020.50−0.88
CA008300516North Cape−0.29−0.02−0.96
CA008300562St. Peters0.190.39−0.51
CA008300596Summerside−0.430.28−1.69
CA008300700Summerside A−0.080.33−0.39
Mean values across locations−0.0030.35−0.60
1 Calculated as the difference in mean seasonal temperature in Charlottetown versus other stations for available years from 1981 to 2023.
Table 2. Summary of fits obtained across all 50 sites for correlation of historical seasonal ice index and freezing degree days using various regression functions.
Coefficients of Determination (R2)Vertical Intercepts
LinearPiecewise 1Linear via originLogarithmicQuadraticLogisticLinearPiecewise 1Linear via originLogarithmic 2QuadraticLogistic
Mean0.610.630.450.630.650.653.42.80−33.3−1.62.2
Maximum0.860.860.640.860.870.8711.511.50−10.29.49.7
Minimum0.280.280.260.300.320.33−3.8−3.80−56.5−8.20.0
Intercepts greater than zero4137001950
1 Values for piecewise regression were calculated across all sites using simple linear correlation values where the piecewise model was not a significant improvement. 2 Intercept values for logarithmic regression represent SII projection when ln(FDD) equals zero.
Table 3. Mean projections for temperature, annual freezing degree days, seasonal ice index, and season length.
Climate
Metric
Baseline (1981–2025) Mid-Century (2050s)Long-Term (2090s)
SSP1-2.6SSP2-4.5SSP5-8.5SSP1-2.6SSP2-4.5SSP5-8.5
Mean daily temperature 1−2.1 °C1.40 °C1.61 °C2.43 °C1.49 °C2.81 °C5.52 °C
Cumulative FDD 1487 °C169 °C159 °C119 °C164 °C97 °C28 °C
(−65%) 2(−67%) 2(−76%) 2(−66%) 2(−80%) 2(−94%) 2
SII 111.14.03.52.03.82.20.8
(−64%) 2(−68%) 2(−82%) 2(−66%) 2(−80%) 2(−93%) 2
Season length 180 days26 days22 days12 days24 days 13 days 3 days
(−68%) 2(−73%) 2(−85%) 2(−70%) 2(−84%) 2(−96%) 2
1 Means calculated across 50 sites for November–April. 2 Relative change from baseline value.
Table 4. Summary of linear and logarithmic correlation between historical ice season length and freezing degree days.
Linear CorrelationLogarithmic Correlation
y = m·x + by = m·ln(x) + b
R2SlopeInterceptR2SlopeIntercept 1
Mean0.520.12220.40.5656.9−268.9
Maximum0.700.190−33.60.7383.2−105.3
Minimum0.310.06771.80.3634.1−449.5
Intercepts greater than zero40 0
1 Intercept values for logarithmic regression representing SII projection when ln(FDD) equals zero.
Disclaimer/Publisher’s Note: The statements, opinions and data contained in all publications are solely those of the individual author(s) and contributor(s) and not of MDPI and/or the editor(s). MDPI and/or the editor(s) disclaim responsibility for any injury to people or property resulting from any ideas, methods, instructions or products referred to in the content.