1. Introduction
According to the definition, a hydrotechnical structure is a structure used for water management, shaping water resources, and water use. The concept of a hydrotechnical structure also includes the technical devices and installations associated with it. A significant number of natural rivers and watercourses are currently obstructed by a variety of technical barriers [
1,
2,
3]. As Belletti et al. [
1] have demonstrated, there are over 1 million barrier in watercourses in Europe, which corresponds to approximately 0.74 barriers per 1 km of watercourse. This phenomenon signifies a substantial fragmentation of watercourses, thereby impeding fish migration and hindering biodiversity development. The impact of barriers on fish populations in rivers is a complex matter, and it is important to note that even very small barriers can have an effect [
4]. It is not always possible to deconstruct them [
5,
6]. Therefore, in order to guarantee fish migration, special technical structures should be used to enable this. Their design must account for hydraulic conditions as well as the swimming abilities and behavioral preferences of target fish species. Fish passes therefore represent not only engineering solutions enabling migration but also essential ecological structures supporting aquatic biodiversity and ecosystem functioning.
One of the important elements accompanying dam structures is fish passes, which enable the safe migration of fish fauna, thereby restoring river continuity in some areas. In this regard, there is extensive literature and design documentation covering, among other things, guidelines for the design and operation of fish passes [
7,
8]. All of them share two common features: fish passes are usually fed by river water, and the discharge from the fish pass cannot be used for other purposes. Its main purpose is to facilitate fish migration. In the natural environment, there are several types of fish passes: semi-natural, technical, and special (locks and fish lifts). Semi-natural fish passes include rapids, bypass channels, cascade rapids, and stone ramps. “Nature-friendly” passages are structures made of materials such as wood, rocks, gravel, and vegetation that occur naturally in a given river. These structures are a developing and increasingly popular alternative to conventional solutions [
9]. Technical fish passes include chamber, slot, Denil, and eel passes. The principle of operation of chamber fish passes is to divide the channel from the upper to the lower station with transverse partitions, creating a series of chambers. But Bunt et al. [
10] highlight the significant variability in attraction and passage efficiency of individual structures, which is contingent on the fish species in consideration.
Hydraulic studies of fish passes play an important role in ecohydrology because they facilitate fish migration across hydraulic obstacles and, due to their effectiveness in maintaining the ecological continuity of rivers, are widely used [
11,
12,
13]. The importance and global significance of fish passes are confirmed by ongoing research, including in China [
14,
15], Canada [
16], Spain [
17], and Portugal [
18]. In addition, various modifications are being made to the design to optimize flow conditions to meet the specific needs of fish. These include slopes [
11,
19], the installation of additional elements [
11], and changes in the shape of weirs/barriers [
19,
20,
21] and the fluctuation of the headwater level at a vertical slot fishway exit [
22].
The design of fish passes depends on two fundamental aspects: the biological and environmental characteristics of fish. Therefore, hydraulic parameters such as velocity, turbulent kinetic energy, and flow must be designed to suit the capabilities of fish without adversely affecting them [
23]. Studies on the effectiveness of fish passes have been conducted in Portugal, among other places, where ref. [
24] found that more than half of the structures studied (51%) were hydraulically unsuitable for the target fish species. The main reasons were inadequate design criteria, including insufficient entrance attractiveness, openings blocked by debris, excessive turbulence, inappropriate basin sizes, and excessive gradients. All these factors can lead to confusion or exclusion of smaller fish. Also Bunt et al. [
10] indicate in their analysis, that the species of fish monitored and structural design of the fishways have strong implications for both attraction and passage performance, and in most cases, existing data are not sufficient to support design recommendations.
Proper fishway design involves, among other things, maintaining flow in the gaps between chambers, which ensures biodiversity in the fish population [
25,
26]. As a result of a lack of control, gaps are blocked, e.g., by plant debris. This is treated as floating pollution, which includes not only natural elements but also those of anthropogenic origin, as well as floating marine litter [
27]. The design, construction, and ultimately the proper operation of semi-natural fishways that function as “ecological corridors” are complex processes requiring interdisciplinary expertise.
In the natural environment, the most common form of floating pollution is biological material called debris. It is formed from flora found in valleys and riverbeds as a result of extreme climatic conditions, such as strong winds (broken branches and boughs) and life stages (shrub branches and tall grasses) [
27,
28,
29,
30]. The transport of woody debris in rivers is a natural phenomenon [
31] and may play a significant role in influencing the structure and dynamics of river channels in river ecosystems [
32,
33,
34].
Kałuża and Radecki [
35] defines a log jam as accumulated woody debris in a channel and divides it into large, medium, and small log jams, as well as single-piece jams.
Wyżga et al. [
36] divided debris into: logs consisting of single trunks or trunk fragments, branches, and roots longer than 1.0 m with a diameter measured at half their length greater than 10 cm. The second form consists of shrubs and trees with preserved crowns, often also with root bundles, which are characterized by a spatial structure. The third form consists of piles, which are diverse mixtures of trunks, branches, root branches, together with mineral material, and finer organic material. Debris, especially plant debris, can vary by location, with mountain debris differing from lowland debris. In mountainous areas, thick, rigid debris, including large tree branches and even whole trees, will dominate. The geometric dimensions determine the number of wooden elements that accumulate in rivers or on hydraulic structures. Lagasse et al. [
37] distinguish three main types of debris accumulations. These include single large tree elements (logs) trapped between bridge piers, multiple logs that interlock to form a debris jam, and large logs that promote sediment deposition, gradually filling the free spaces and forming a compact mass. In the lowlands, however, plant debris is regarded as branches of shrubs, grasses, and reeds (of considerable length), which are characterized by greater flexibility and elasticity.
The factors influencing the likelihood of plant debris becoming trapped on obstacles, including bridge piers, have been identified as the size and volume of incoming wood and the wood transport system. Braudrick et al. [
38] divided it into three separate timber transport systems: without jams, with jams, and with partial jams. During transport without jams, logs move without interacting with each other and usually occupy less than 10 percent of the channel area. During log jamming, logs move together as a single mass and occupy more than 33 percent of the channel area. Transport with partial jams is intermediate between these two transport regimes. Hydraulic parameters of the watercourse, such as channel water depth, Froude number, velocity, and flow conditions, also influence the likelihood of plant debris becoming trapped [
39,
40,
41]. For example, Błotnicki et al. [
42] indicate that the flow field upstream of the pier was significantly influenced by its geometry, which in turn affected the blockage probability. For semi-congested transport mechanisms and Fr = 0.5, the wood blockage probability at the flat pier shape was found to be three times greater than that at the triangular shaped pier.
The shape and position of structural elements of hydraulic structures in the channel affect the likelihood of wood becoming jammed. Bradley et al. [
43] and Schmocker and Hager [
44] noted that the smaller the spacing between the pillars, the higher the likelihood.
In general, riparian vegetation is the most visible element of the environment, reflecting the diversity of a river valley. This zone has been identified as an interface between aquatic and terrestrial ecosystems, with fluvial processes having a significant impact on its composition [
45]. It is a fundamental part of the river ecosystem, and its stage and growth must be monitored and controlled, especially when the river flows through a densely urbanized area. In fact, vegetation hinders flow by reducing the hydraulic cross-sectional area and increasing the roughness of floodplains, thereby increasing the relative risk of flooding [
46].
The key role of riparian vegetation in maintaining rivers’ hydromorphological conditions cannot be overlooked [
47]. In addition, it has purifying properties and performs erosion control, flood control, and protective functions [
48].
Riparian vegetation can extend over a large area of a river valley, and its development is not restricted by hydrotechnical structures blocking the river. Its presence, along with the resulting plant debris, can significantly decrease the capacity of weirs, power plants, and fish passes, among other structures. The absence of monitoring these structures affects their performance and, consequently, increases the risk of flooding in higher areas. For power plants and weirs, removing accumulated plant material at the end of the season is essential to ensure proper operation.
The accumulation of plant debris is especially problematic in fish passes because it reduces hydraulic capacity and blocks the migration of aquatic organisms. Błotnicki [
49] conducted laboratory tests to see if the shapes of fish pass partitions (rectangular and rounded) affect debris retention, considering their geometric dimensions. The results showed that obstacle length had a statistically significant effect on the debris buildup rate. The shape of the tested partitions did not significantly influence the amount of larger plant debris that accumulated. Larger debris remained consistently high, while smaller debris accumulated in smaller quantities. Small logs showed minimal buildup, and there were no significant differences between the shapes of the fish pass partitions.
The primary objective of this study was to quantify the hydraulic effects of partial and total inlet blockage by plant debris in a semi-natural fish pass, based on in situ field measurements conducted at an operating facility. Specifically, the study aimed to assess whether changes in inlet covering significantly alter hydraulic conditions within fish-pass chambers, and to identify which hydraulic parameters are most sensitive to debris accumulation. Particular attention was given to the relative roles of longitudinal position along the fish pass, local chamber geometry, and debris covering in controlling flow velocity and the Froude number.
The study is novel in that it combines direct field observations under realistic operating conditions with statistical and mixed-effects modeling to assess the significance of debris accumulation and inlet covering on key hydraulic parameters, including flow velocity and the Froude number.
Unlike laboratory-scale or numerical studies, the present work evaluates debris effects in a real fish pass subject to natural variability in geometry, flow conditions, and vegetation, thereby providing results with direct applicability to fish pass operation and maintenance. The applied statistical framework allows the influence of debris accumulation to be separated from geometric and longitudinal effects, which represents a methodological advancement over purely descriptive analyses.
3. Measurement Methodology
To determine the impact of plant debris on hydraulic conditions in fish passes, studies consisted of an inventory of fish passes and velocity measurements at various distances from the gap in selected chambers across three measurement series. Flow velocity measurements were performed using a HEGA 2 hydrometric current meter (Biomix, Mościska, Poland) equipped with a propeller of 100 mm diameter. The instrument is designed for point velocity measurements in open-channel flows and is suitable for field applications under variable hydraulic conditions.
The measurement range of the current meter is 0.02–3.0 m s−1. The propeller has a thread pitch of 150 mm, while the body diameter of the instrument is 20 mm. The total weight of the current meter is 533 g, allowing stable positioning during measurements.
Velocity determination is based on the measurement of propeller rotation frequency. The time measurement resolution is 0.01 s, and the impulse counting resolution is one impulse per revolution. The measurement accuracy is specified as ±1.5% of the reading for velocities above 0.15 m s−1, and ±0.004 m s−1 for velocities below 0.15 m s−1.
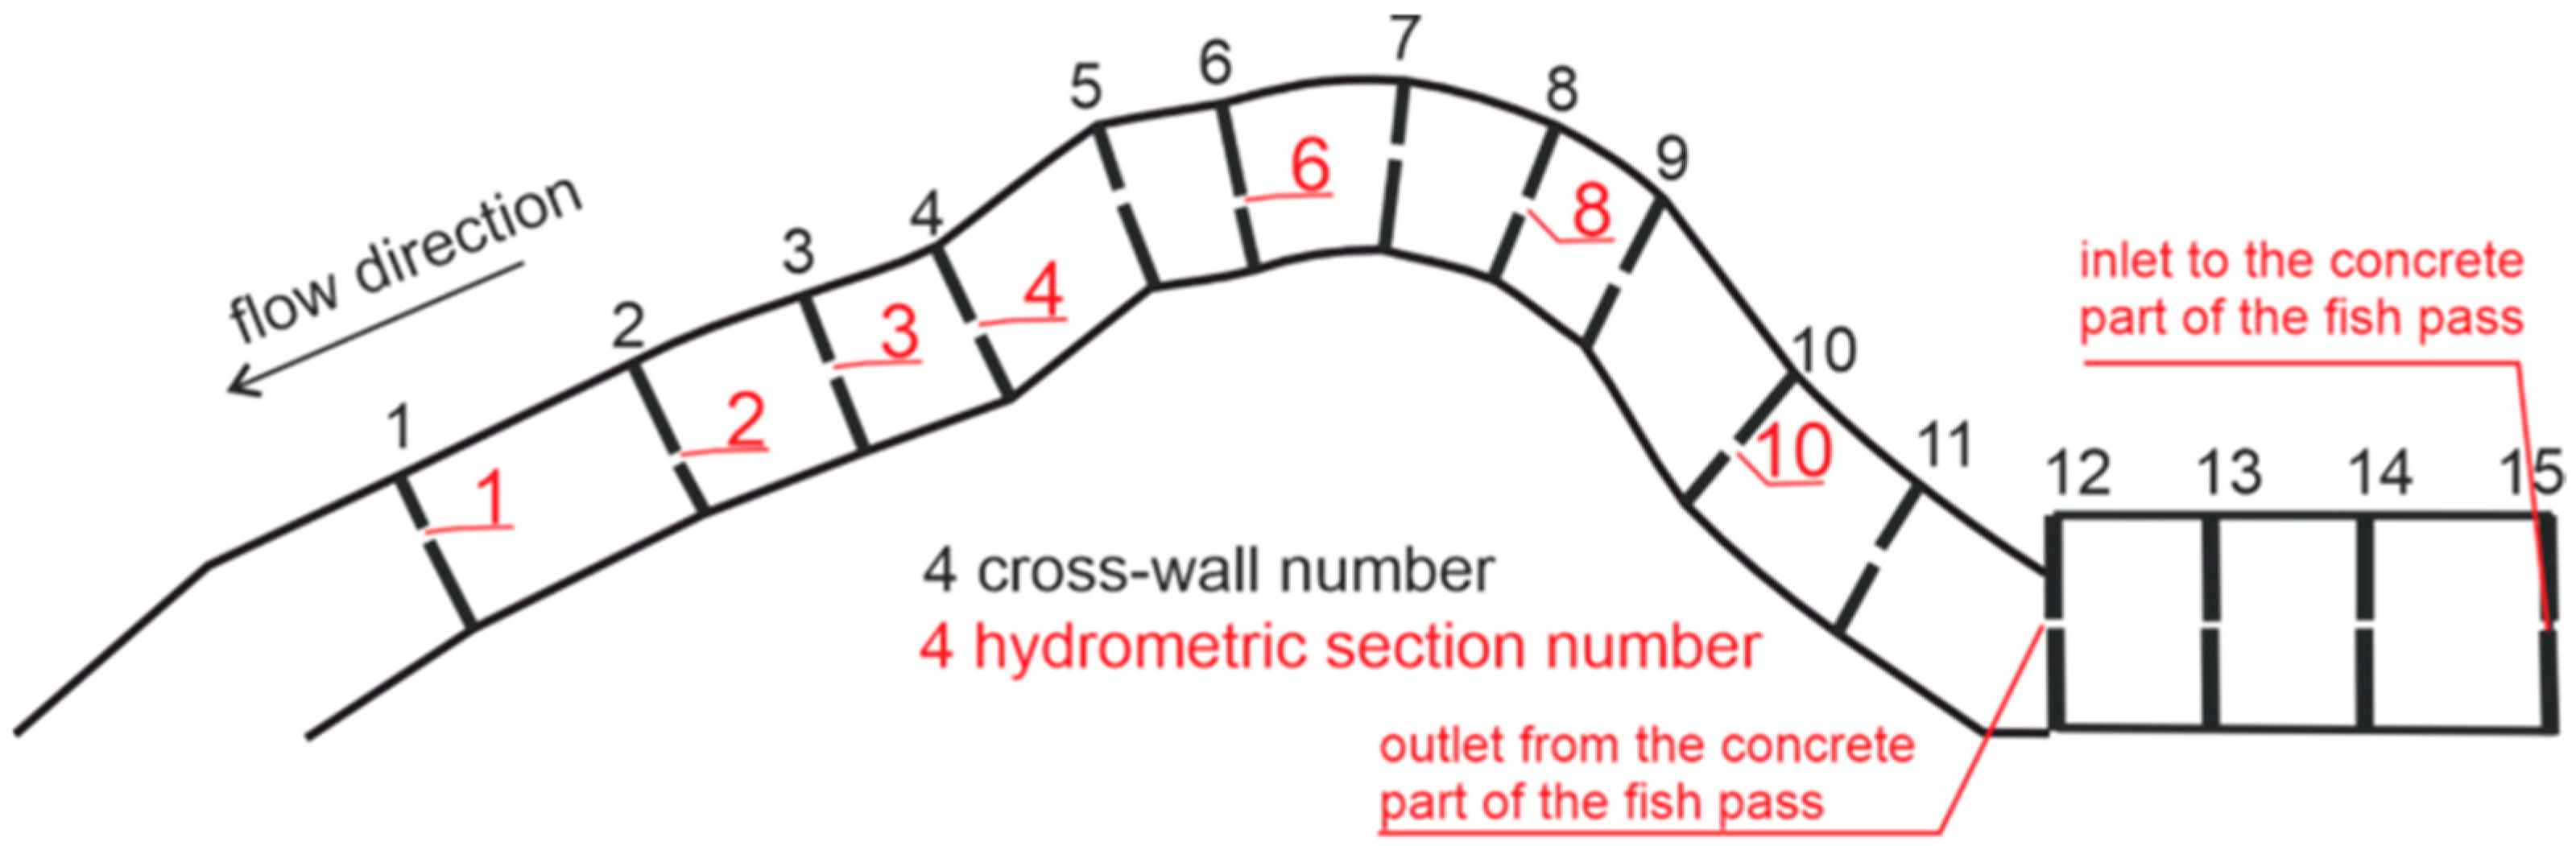
Velocity measurements were conducted in fish pass chambers 5, 6, 8, 9, 12, and 13. In each chamber, measurements were performed along three hydrometric verticals, denoted as k1, k2, and k3. The measurement profiles were located at different distances from the chamber inlet.
Within each vertical, flow velocity was measured at multiple depths, at intervals of approximately 5 cm, and the local water depth in the chamber was recorded at each measurement profile.
The measurements were carried out in two parts (
Figure 3): the inlet (the opening between chambers 12 and 13) and the middle (covering the openings between chambers 9 and 8 and between 5 and 6). Chambers 12 and 13, located in the upper concrete section of the fish pass, were selected due to direct measurement accessibility and their representation of the technical part of the structure. Chambers 5, 6, 8, and 9 are situated within the semi-natural section and were chosen to represent locations immediately before and at geometric transitions, where increased hydraulic variability is expected.
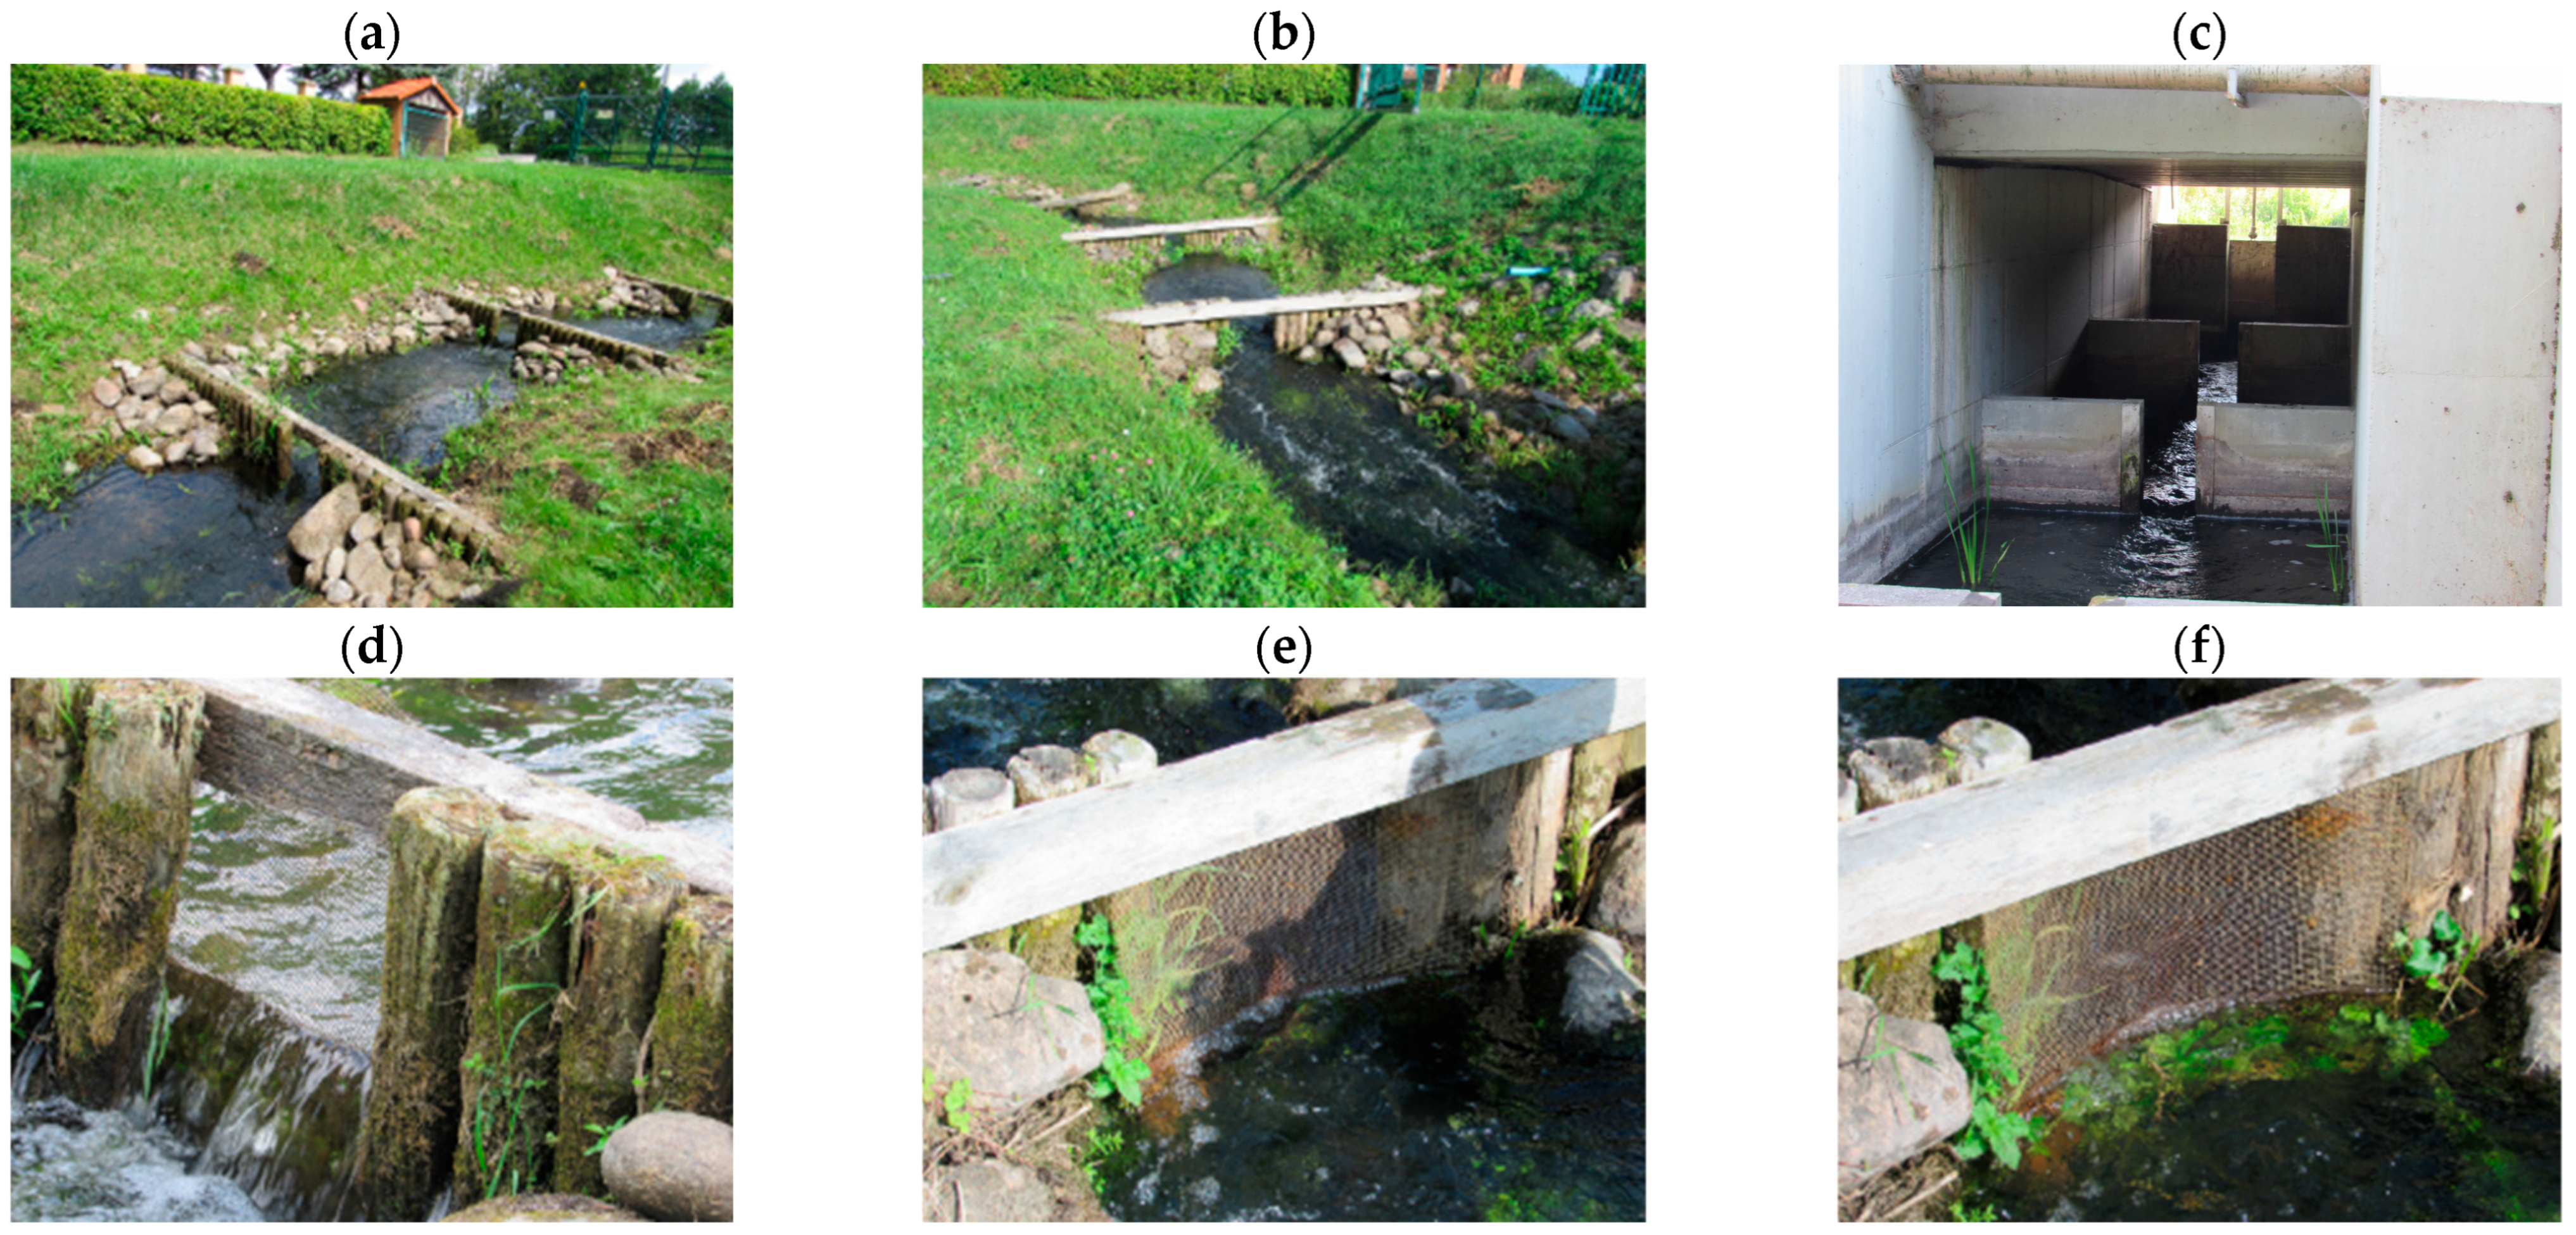
Three inlet covering variants were analyzed. In the first variant, the opening between chambers was fully unobstructed (covering ratio = 0). In the second variant, plant debris partially blocked the opening, reducing the effective opening height by approximately 50% (covering ratio = 0.5). In the third variant, the opening was blocked up to the water surface, representing full blockage (covering ratio = 1). The inlet covering was created using natural plant material with foliage, collected from the immediate surroundings of the fish pass. This material represents debris that may realistically enter the chambers during normal operation as a result of downstream transport by the flow, thereby ensuring field-realistic hydraulic conditions during the experiments. To reduce the clearance of the chamber opening, a coarse mesh screen was placed at the inlet (
Figure 4d,e). Vegetation was then placed on the screen to block the opening.
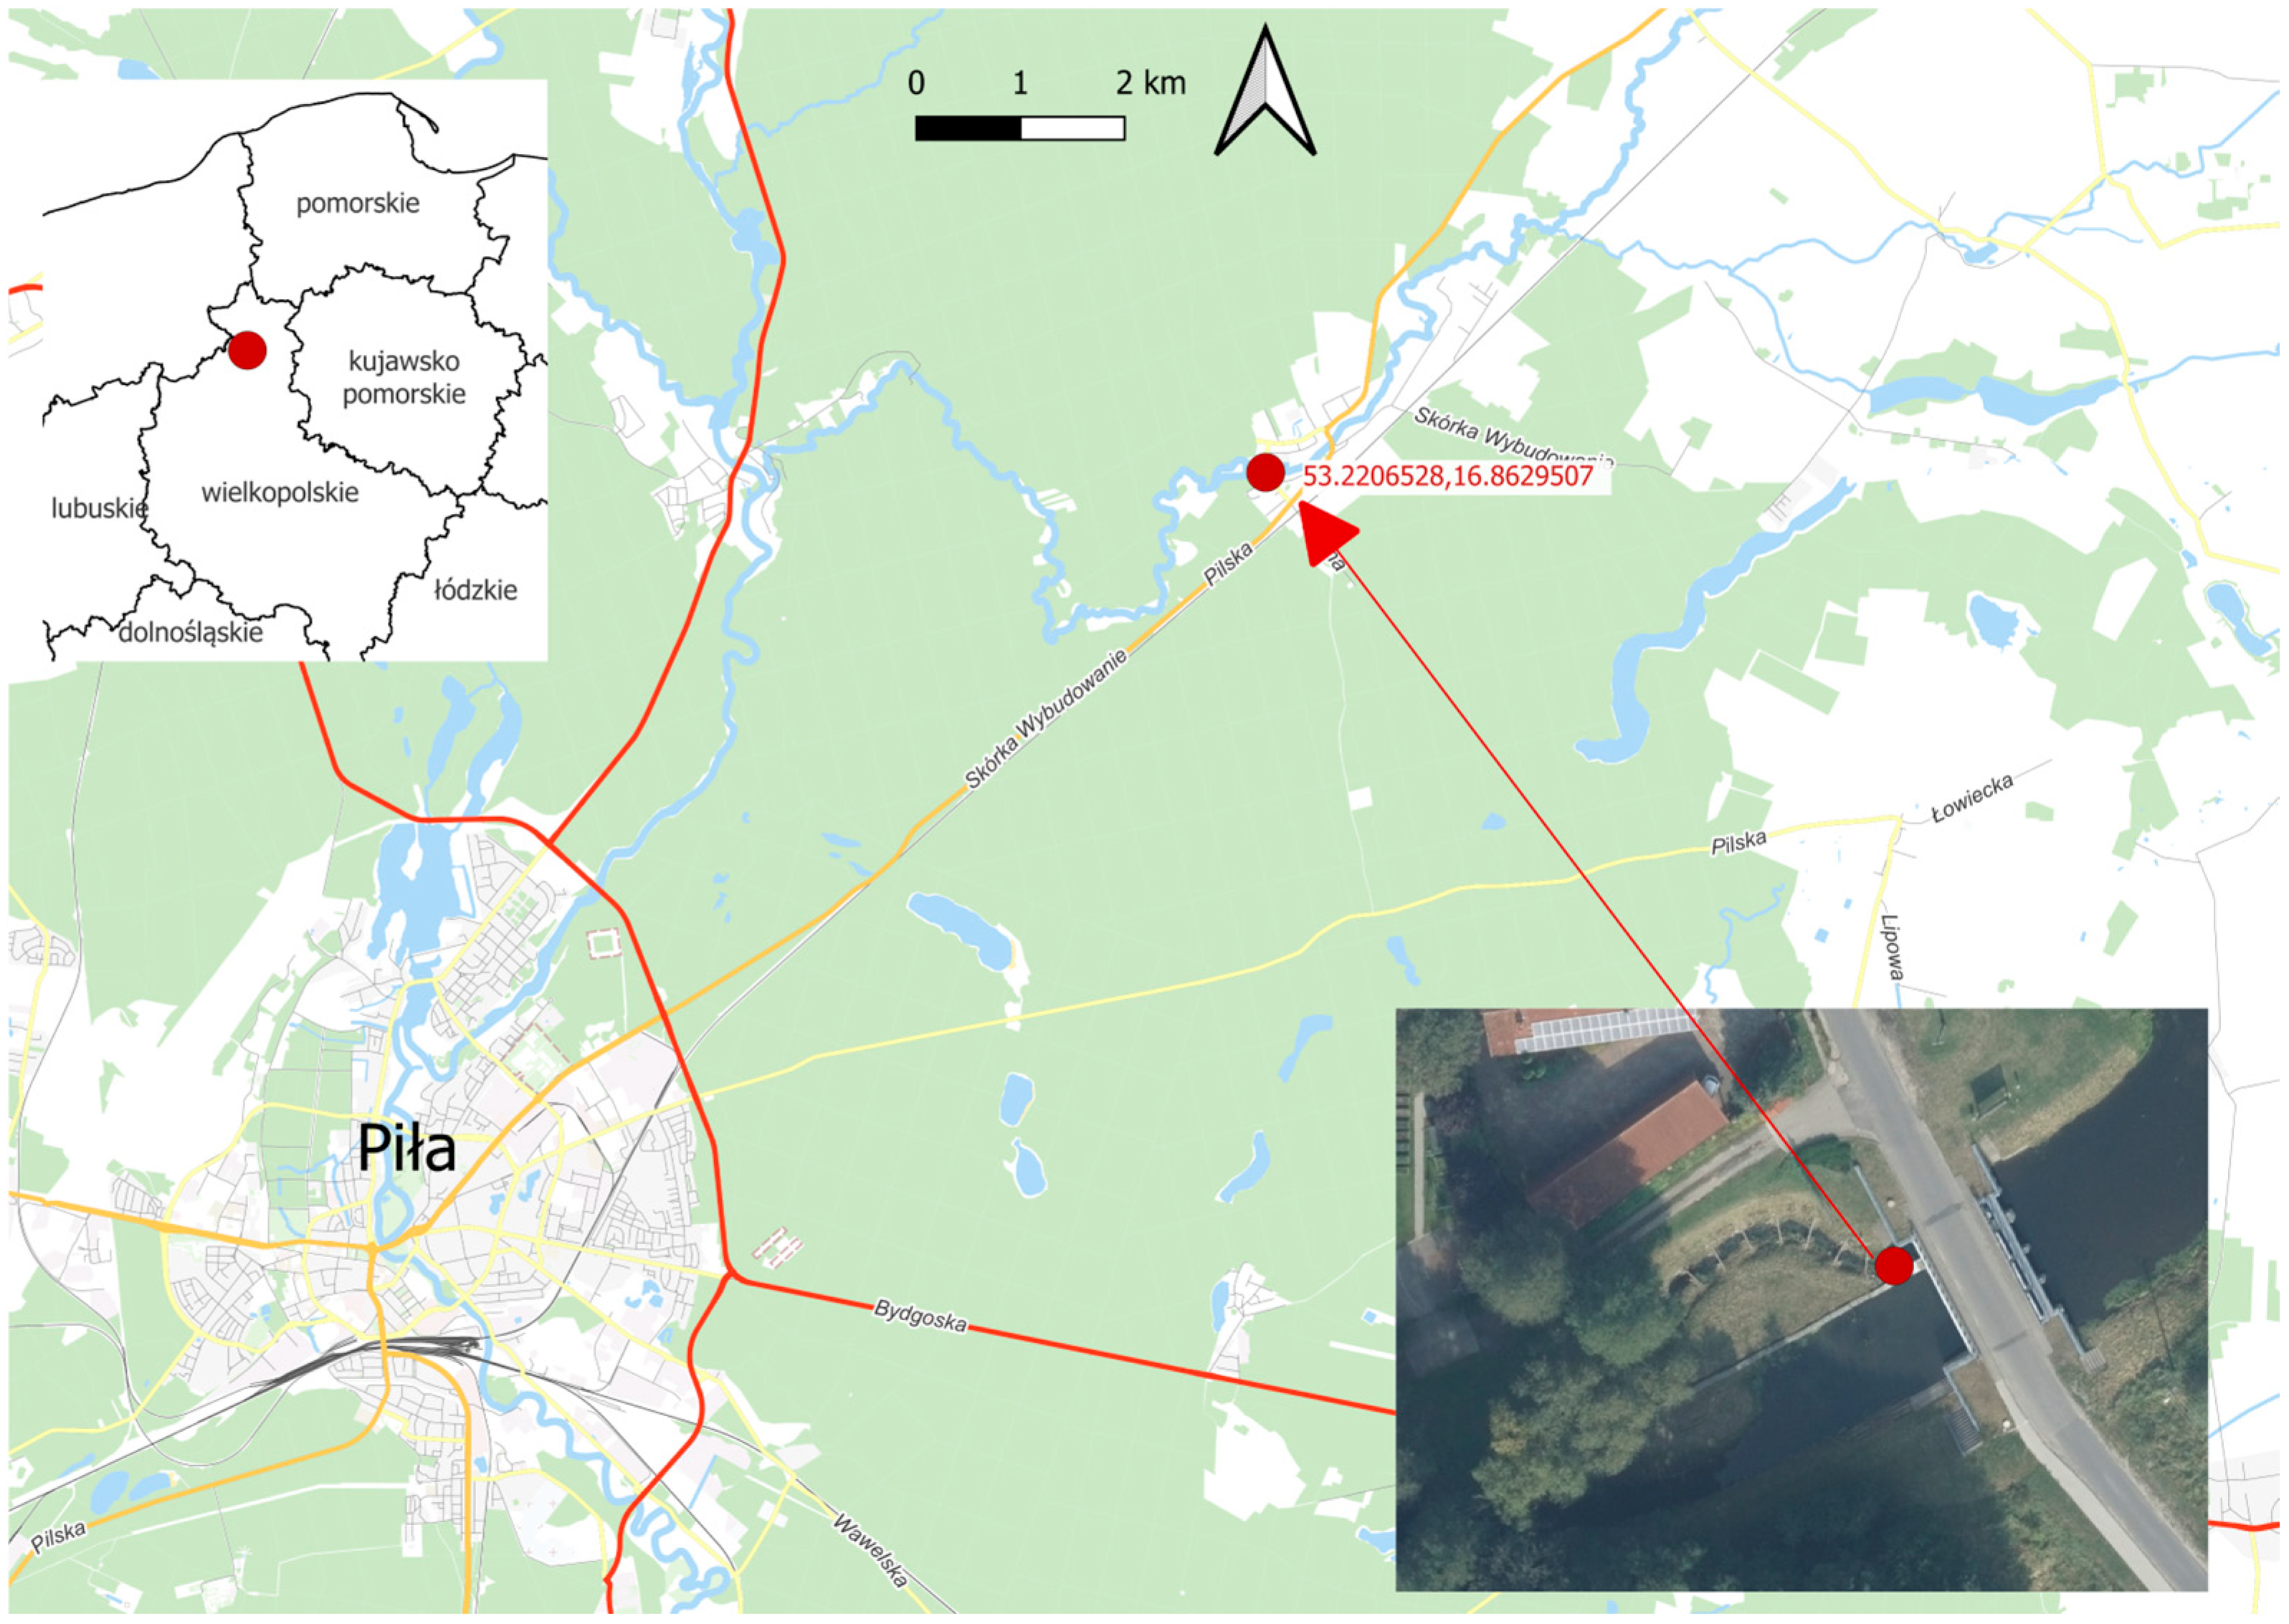
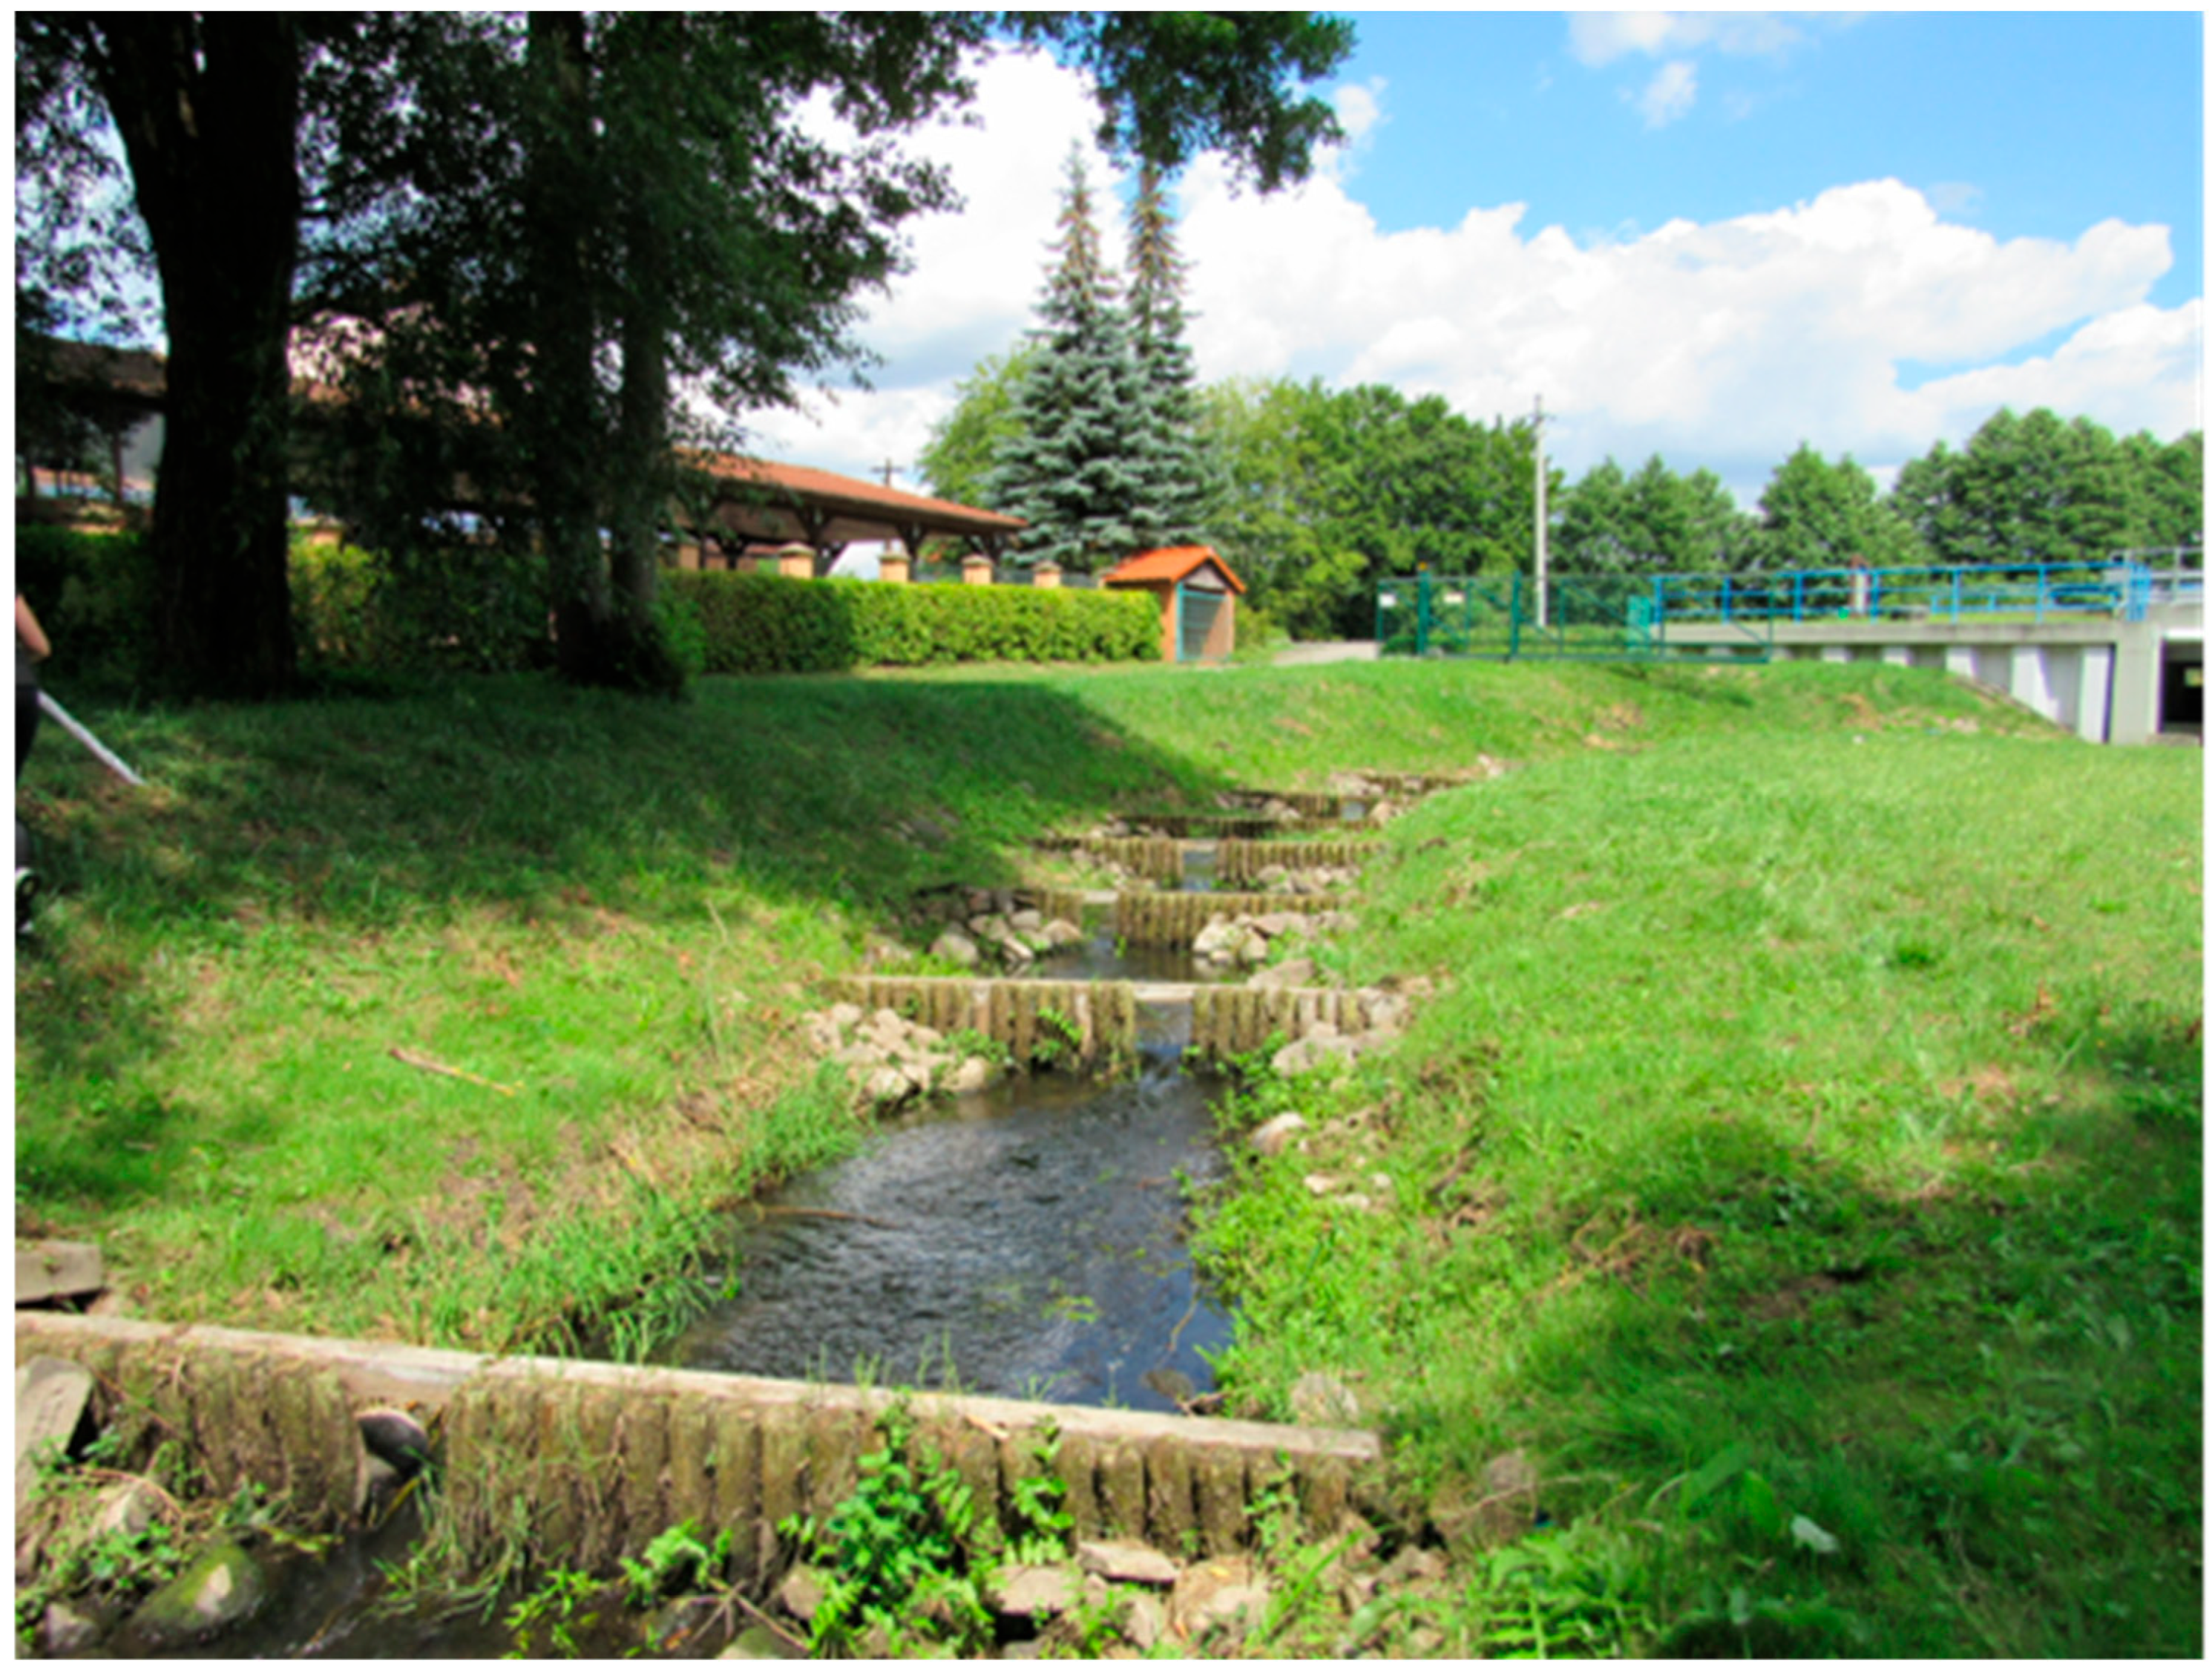
Figure 4 illustrates the study site, showing the semi-natural fish pass, the concrete inlet structure, and representative examples of inlet blockage by plant debris corresponding to different covering ratios.
One of the parameters that characterizes water movement in open channels is the Froude number (Fr). The Froude number is:
where
v is the local flow velocity,
g = 9.81 ms
−2 is the acceleration due to gravity, and
h is the local depth. Equation (1) accounts for the geometric and hydraulic parameters in the chamber. The Froude number was selected as the primary response variable because it integrates both flow velocity and water depth, thereby characterizing the overall hydraulic regime within a fish pass chamber rather than a single kinematic component. In ecohydraulic applications, the Froude number is widely used to distinguish flow types (subcritical, transitional, supercritical) and to assess flow stability, turbulence intensity, and energy dissipation, all of which are directly relevant to fish swimming effort, orientation, and passage efficiency. Among hydraulic descriptors, the Froude number, as a dimensionless parameter, is particularly suitable as an evaluation index for comparisons between different habitats and fish passage structures. Its dimensionless form allows hydraulic conditions to be compared across chambers of varying geometry, water depth, and discharge, which is essential for transferring findings from a single field site to other fishways. The range of recorded Froude numbers varied from 0.08 to 0.62.
3.1. Statistical Approach
Because measurements within a chamber are not independent, and chambers differ hydraulically due to construction geometry, each chamber was treated as a random effect. This prevents pseudoreplication and correctly partitions variance attributable to chamber-specific conditions.
A linear mixed-effects model (LMM) was applied, with distance from the inlet, water depth, and degree of inlet covering specified as fixed effects, while chamber identity was included as a random intercept to account for between-chamber variability.
For each chamber, the Froude number was measured as the response variable. Explanatory variables included the distance of the measurement point from the chamber inlet, the mean water depth at the measurement location, and the degree of inlet covering by debris, classified into three categorical levels (0, 0.5, and 1). Chamber identity was incorporated as a grouping factor to account for structural and geometric variability between chambers.
The model structure was:
where
is the fixed intercept,
–
are fixed-effect regression coefficients,
is the random intercept associated with chamber
,
is the residual error term,
denotes the normal distribution with mean zero and variance
. Interaction terms (distance × covering and depth × covering) were evaluated but not retained, as they did not improve model fit in likelihood ratio tests (
p > 0.4) and would unnecessarily increase model complexity (
Supplementary Table S1).
3.2. Model Fitting
Models were fitted using a linear mixed-effects framework, which allows fixed effects describing general hydraulic relationships to be analyzed jointly with random effects accounting for repeated measurements within individual chambers. Parameter estimation was performed using restricted maximum likelihood (REML), a standard approach for obtaining unbiased estimates of variance components in mixed-effects models.
The statistical significance of fixed effects was evaluated using approximate degrees of freedom calculated according to the Satterthwaite method. This approach provides reliable inference for mixed-effects models by adjusting test statistics to account for unequal sample sizes and hierarchical data structure. To evaluate whether interaction terms improved model performance, additive and interaction-based models were compared using likelihood ratio tests (ML fits). For this purpose, models were refitted using maximum likelihood estimation, which enables direct comparison of nested model structures based on their goodness of fit.
These procedures follow standard recommendations for mixed-effects modeling in ecological and hydraulic studies [
52,
53].
3.3. Model Performance Metrics
To quantify the explained variance, marginal (R
2m) and conditional (R
2c) R
2 coefficients of determination were calculated following the approach proposed by Nakagawa and Schielzeth [
54,
55], who developed a general method for estimating explained variance in mixed effects models. The calculations were performed using the MuMIn package in R version R-4.5.1. The marginal coefficient of determination R
2m represents the proportion of variance explained by fixed effects, whereas the conditional coefficient of determination R
2c represents the proportion of variance explained jointly by fixed and random effects.
3.4. Diagnostics
Assumptions of normality and homoscedasticity were assessed using the Shapiro–Wilk test, inspection of residuals versus fitted values, and Q–Q plots of standardized residuals. The Q–Q plots were used to visually assess departures from normality.
All analyses were conducted using the statistical programming environment R [
56]. The following packages were used: lme4 [
57], lmerTest [
58], shapiro.test [
59], anova [
60], and MuMIn [
61].
4. Results and Discussion
Measurements were taken in three hydrometric vertical profiles (k
1, k
2, and k
3) located at different distances from the opening. The placement of the measuring verticals considers the zones of direct impact: near the opening (k
1), the middle of the chamber (k
2), and the end (k
3). This location helped identify the area where flow blockage most significantly affects the measured flow velocities.
Table 2 lists the distances from the inlet opening to the chamber of individual measuring columns in chambers 5, 6, 9, 8, 12, and 13.
In addition, the selection of the openings analyzed considered the location and material from which the chambers were constructed (
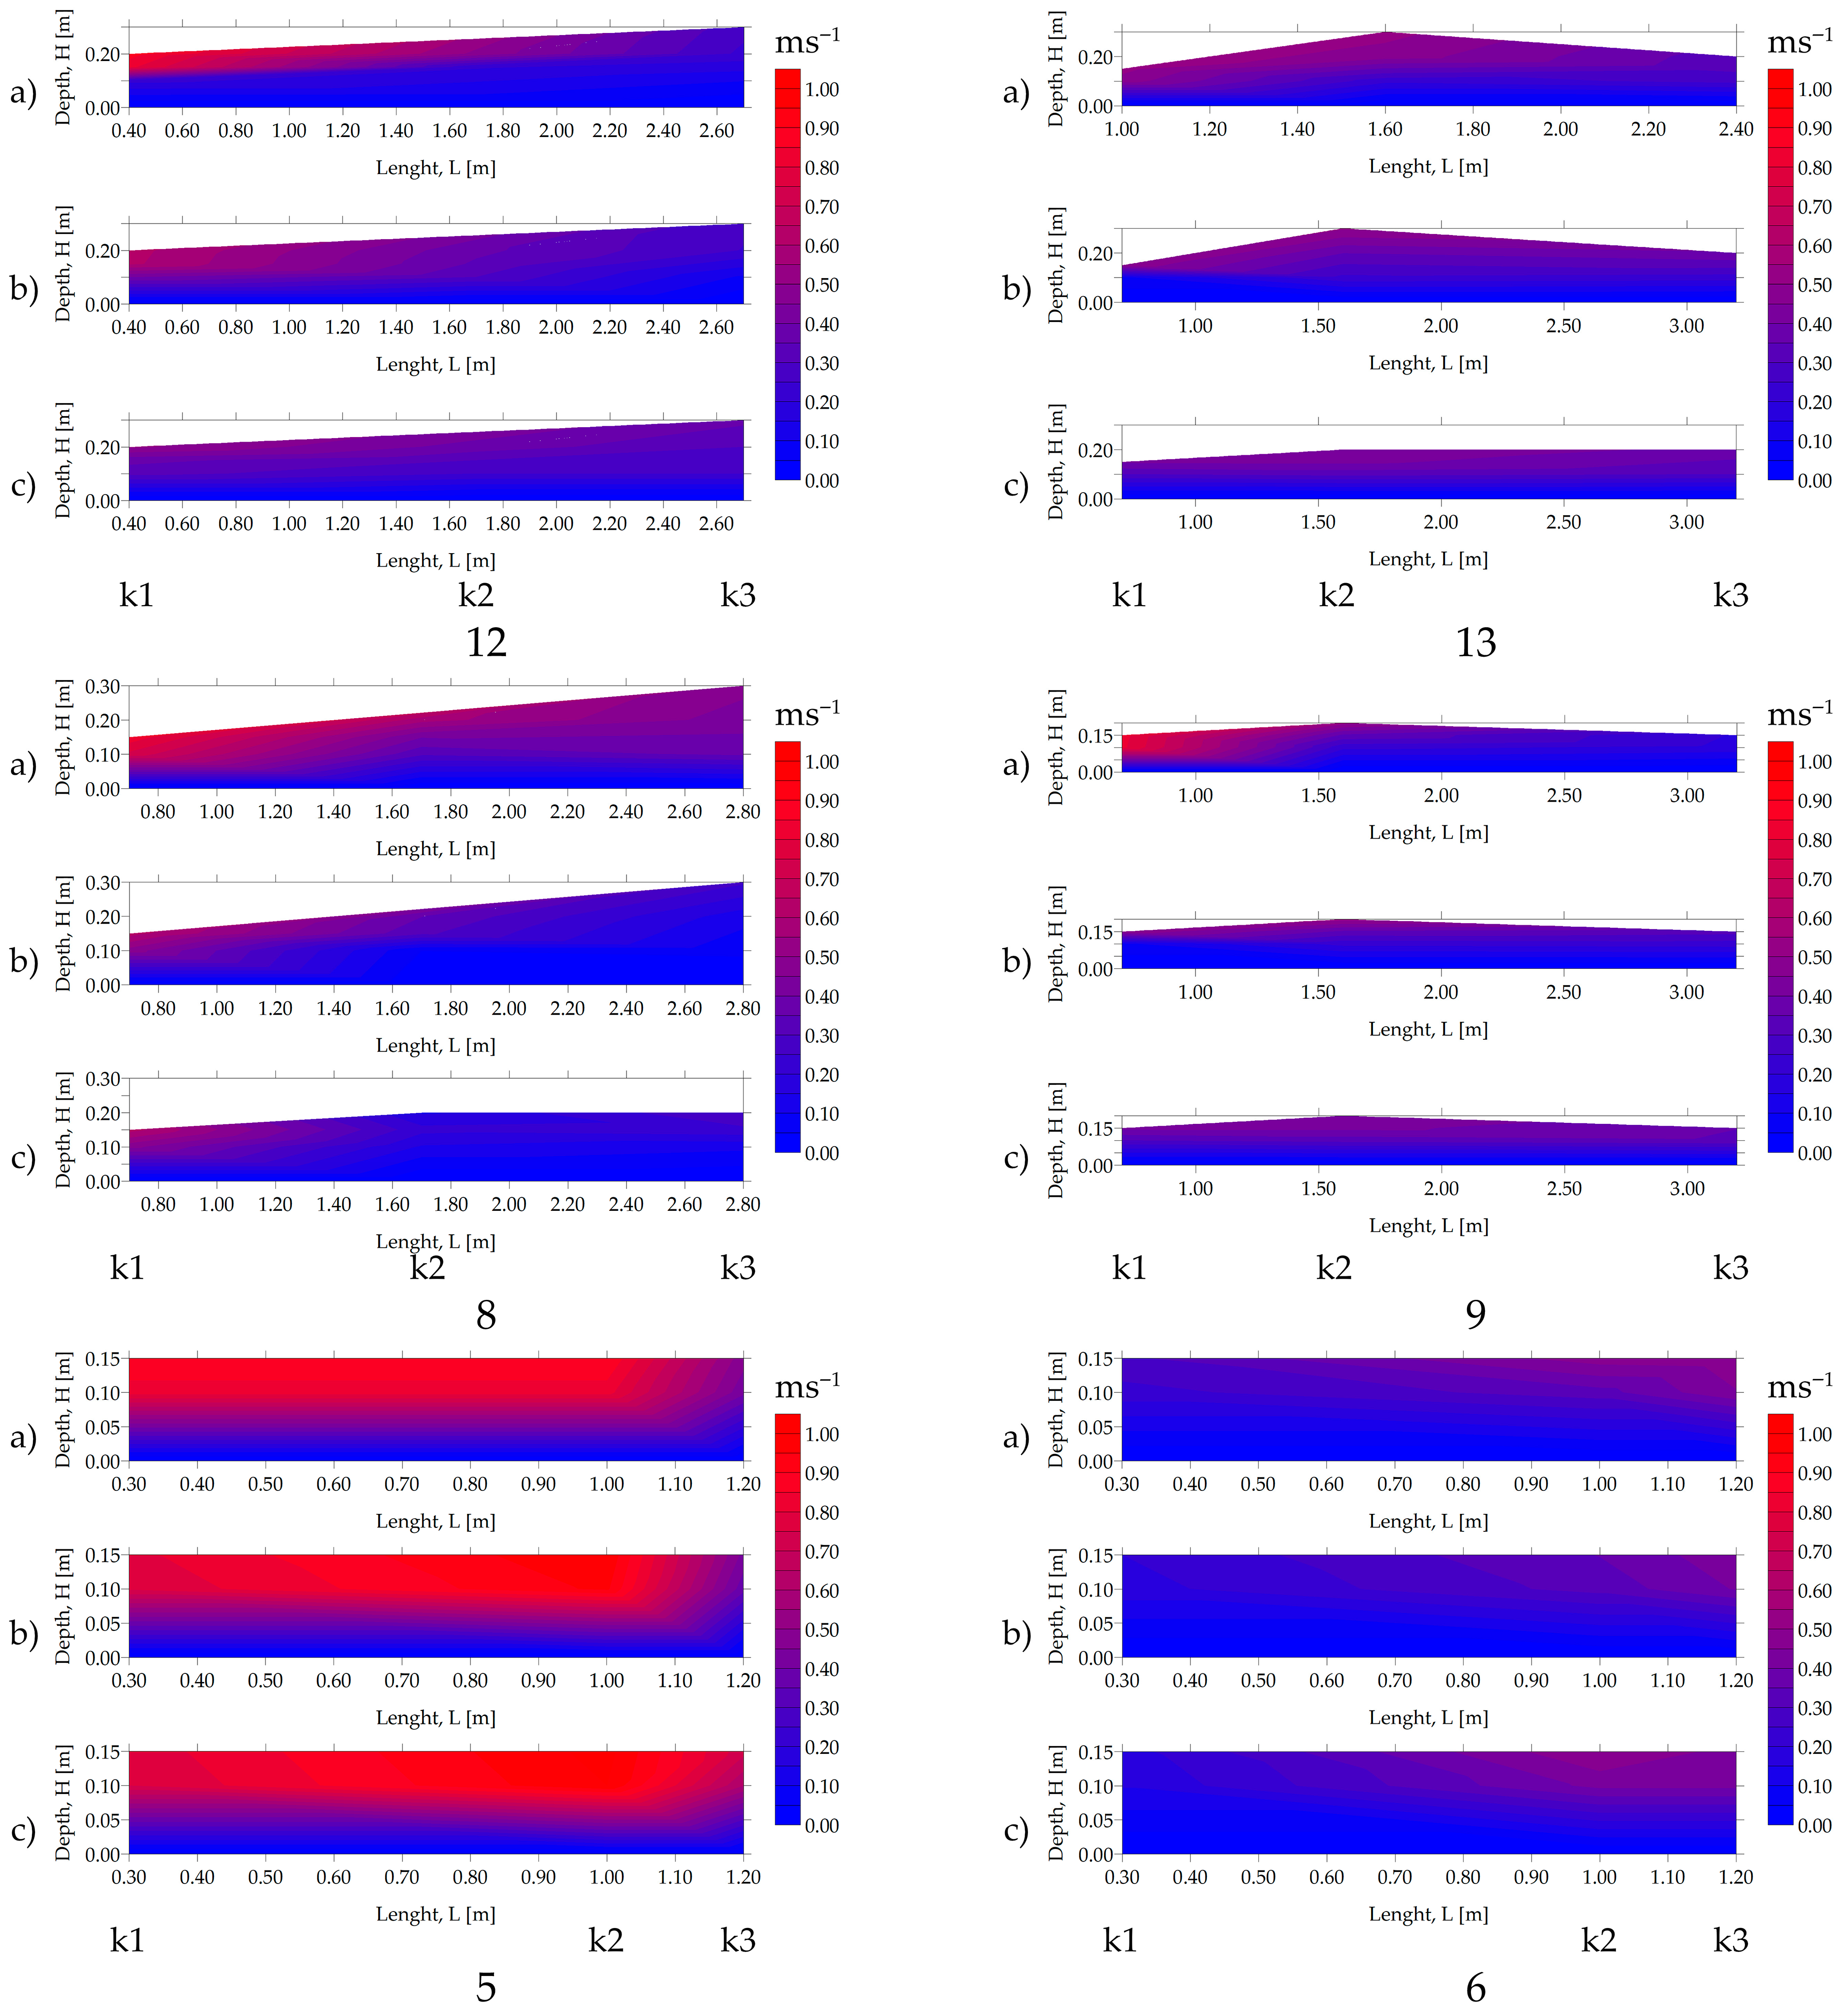
Figure 4a,b). The first velocity measurements were performed for chambers 12 and 13. These chambers are located at the upper station of the step and are constructed of concrete elements in this section. The highest velocities in profiles were recorded at the surface, near the opening, and decreased with increasing distance from the opening (
Figure 5). Similar values were observed in chamber 8. Although in both chambers (8 and 9), where the water level in the chamber rises over a distance of 1.5 m, lower velocities occur there.
Table 3 summarizes velocity statistics for all analyzed chambers and highlights substantial differences in both mean flow velocity and its variability along the fish pass. The highest mean velocity was observed in chamber 5, which is the smallest and shallowest chamber, with an average velocity of 0.75 ms
−1. Despite the high velocity, this chamber exhibited the lowest coefficient of variation (CV = 28.1%), indicating relatively stable hydraulic conditions regardless of the inlet obscuration factor (
Figure 5). Such characteristics suggest that chamber 5 functions primarily as a high-energy transit section rather than a resting area for migrating fish.
In contrast, chambers 6 and 13 showed considerably lower mean velocities, equal to 0.35 and 0.36 ms−1, respectively, combined with low velocity variability (CV = 33.4% and 30.6%). These chambers, therefore, provide hydraulically stable zones that may facilitate short-term resting and recovery during upstream migration, particularly for weaker swimming species or individuals experiencing fatigue.
Chambers 8, 9, and 12 exhibited intermediate mean velocities, ranging from 0.35 to 0.38 m s−1, but were characterized by markedly higher variability, with coefficients of variation exceeding 49%. In these chambers, a wide range of minimum and maximum velocities was observed, reflecting heterogeneous flow patterns associated with chamber length and local geometric complexity. Such variability may increase hydraulic selectivity within the fish pass, offering both higher-velocity pathways for stronger swimmers and lower-velocity microhabitats for resting or maneuvering.
The influence of inlet covering by debris is evident in the velocity statistics across all chambers (
Figure 5). The average velocity decreased systematically with increasing inlet blockage, by approximately 17% under partial covering (0.5) and by about 36% under full covering. At the same time, both standard deviation and coefficient of variation changed depending on the degree of blockage, indicating that debris modifies not only mean flow conditions but also the spatial and temporal structure of velocity fields. This damping effect is particularly pronounced in the longer chambers, namely chambers 12, 13, 8, and 9, where debris accumulation reduces flow energy and smooths velocity gradients along the chamber length (
Figure 5). This interpretation is supported by normalized velocity ratios of
and 0.64 for 50% and full inlet blockage, respectively (where
denotes the mean velocity under unobstructed conditions). Assuming that kinetic energy per unit mass is proportional to the square of velocity, the relative kinetic energy was estimated as
. This corresponds to an approximate reduction in kinetic energy of 31% at 50% inlet covering and 59% under full blockage. The highest variability in hydraulic conditions was observed in chambers associated with changes in flow direction and local geometry.
An additional characteristic feature revealed by
Figure 5 is the absence of significant depth variation along the length of chambers 5 and 6. Regardless of the inlet covering conditions, water depth remains nearly constant, indicating hydraulically stable flow regimes controlled primarily by chamber geometry rather than by local backwater effects. In chamber 5, this stability coexists with the highest velocities observed in the fish pass, suggesting a high-energy but uniform flow field. The results indicate that short, geometrically regular chambers can function as hydraulically stable transition sections within semi-natural fish passes, maintaining constant water depth while regulating flow energy primarily through velocity, which supports predictable passage conditions for migrating fish. The observed hydraulic behavior of chambers 5 and 6 is consistent with earlier findings reported by Larinier [
62] and Katopodis and Williams [
63], who emphasized that fish pass performance is strongly governed by local geometry and longitudinal energy dissipation rather than by uniform hydraulic conditions along the entire structure. Similarly to the present study, these authors highlighted that chambers with stable depth and limited flow variability can reduce hydraulic discontinuities and improve passage efficiency, particularly when embedded between sections of more complex geometry.
From an ecological perspective, the observed hydraulic patterns suggest that debris accumulation does not uniformly degrade fish pass functionality. While excessive blockage may restrict physical passage, partial covering can locally reduce velocities and enhance hydraulic heterogeneity, potentially improving passability for species with limited swimming capacity. However, the balance between hydraulic damping and physical obstruction remains critical, underscoring the importance of regular maintenance to preserve both hydraulic efficiency and biological connectivity.
The results obtained are consistent with those of Błotnicki [
49], who demonstrated that changing the partition shape from rectangular to rounded significantly reduces plant debris retention. In particular, differences in accumulation were strongly dependent on debris size and the position of the transverse wall. Wiering, V., & Heneka, P. [
64] reached similar conclusions about the impact of plant debris size. Based on laboratory tests, they found, among other things, that the velocities of the main flow are crucial for the deflection of driftwood in fish passes. Studies assessing different degrees of opening obstruction using different shapes of blocking material were also conducted by Chowdhury et al. [
65]. Based on laboratory tests, they observed that, under subcritical flow conditions, the shape of obstacles and the size of debris can influence the formation of blockages. This is particularly true for higher flow velocities and smaller debris elements, which tend to accumulate less than larger wooden elements.
Debris modifies velocity far more strongly than the dimensionless flow regime.
Based on the measurements, the Froude number was calculated for the average velocity and depth in each chamber for each measurement vertical profile.
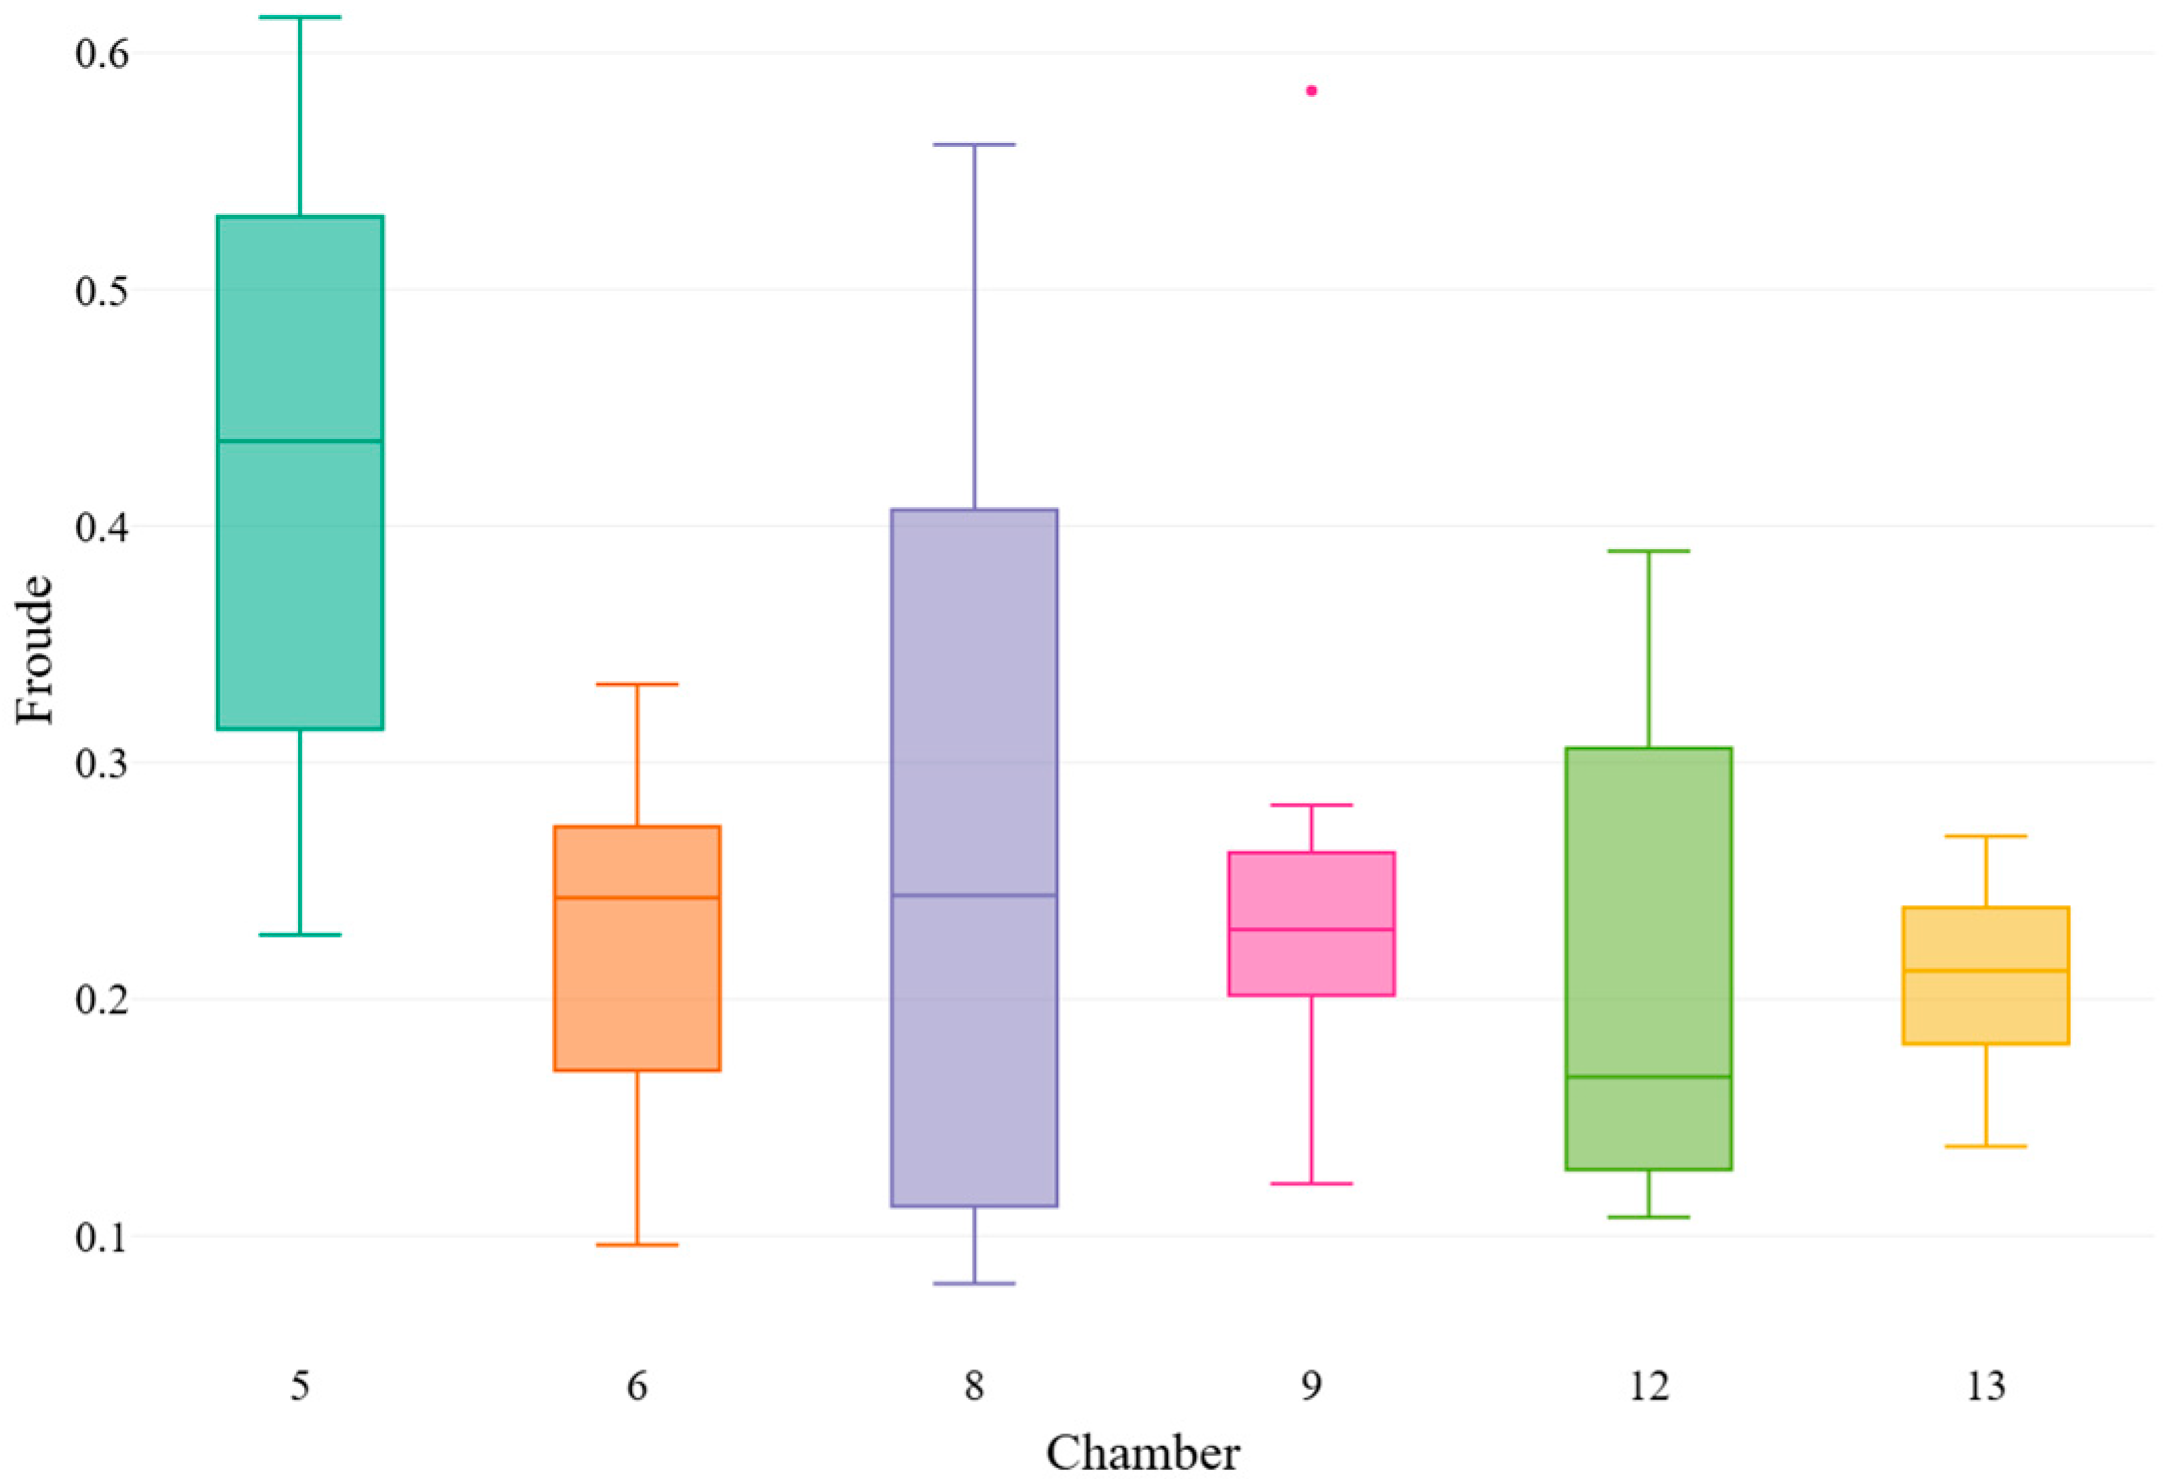
Figure 6 illustrates the distribution of Froude numbers across individual chambers. The boxplots represent a single data distribution, with boxes and whiskers describing the central tendency and variability in the measurements, while points outside the whiskers indicate extreme but valid observations. Outliers were identified using Tukey’s [
66] classical definition, that is, values lying outside the range
to
.
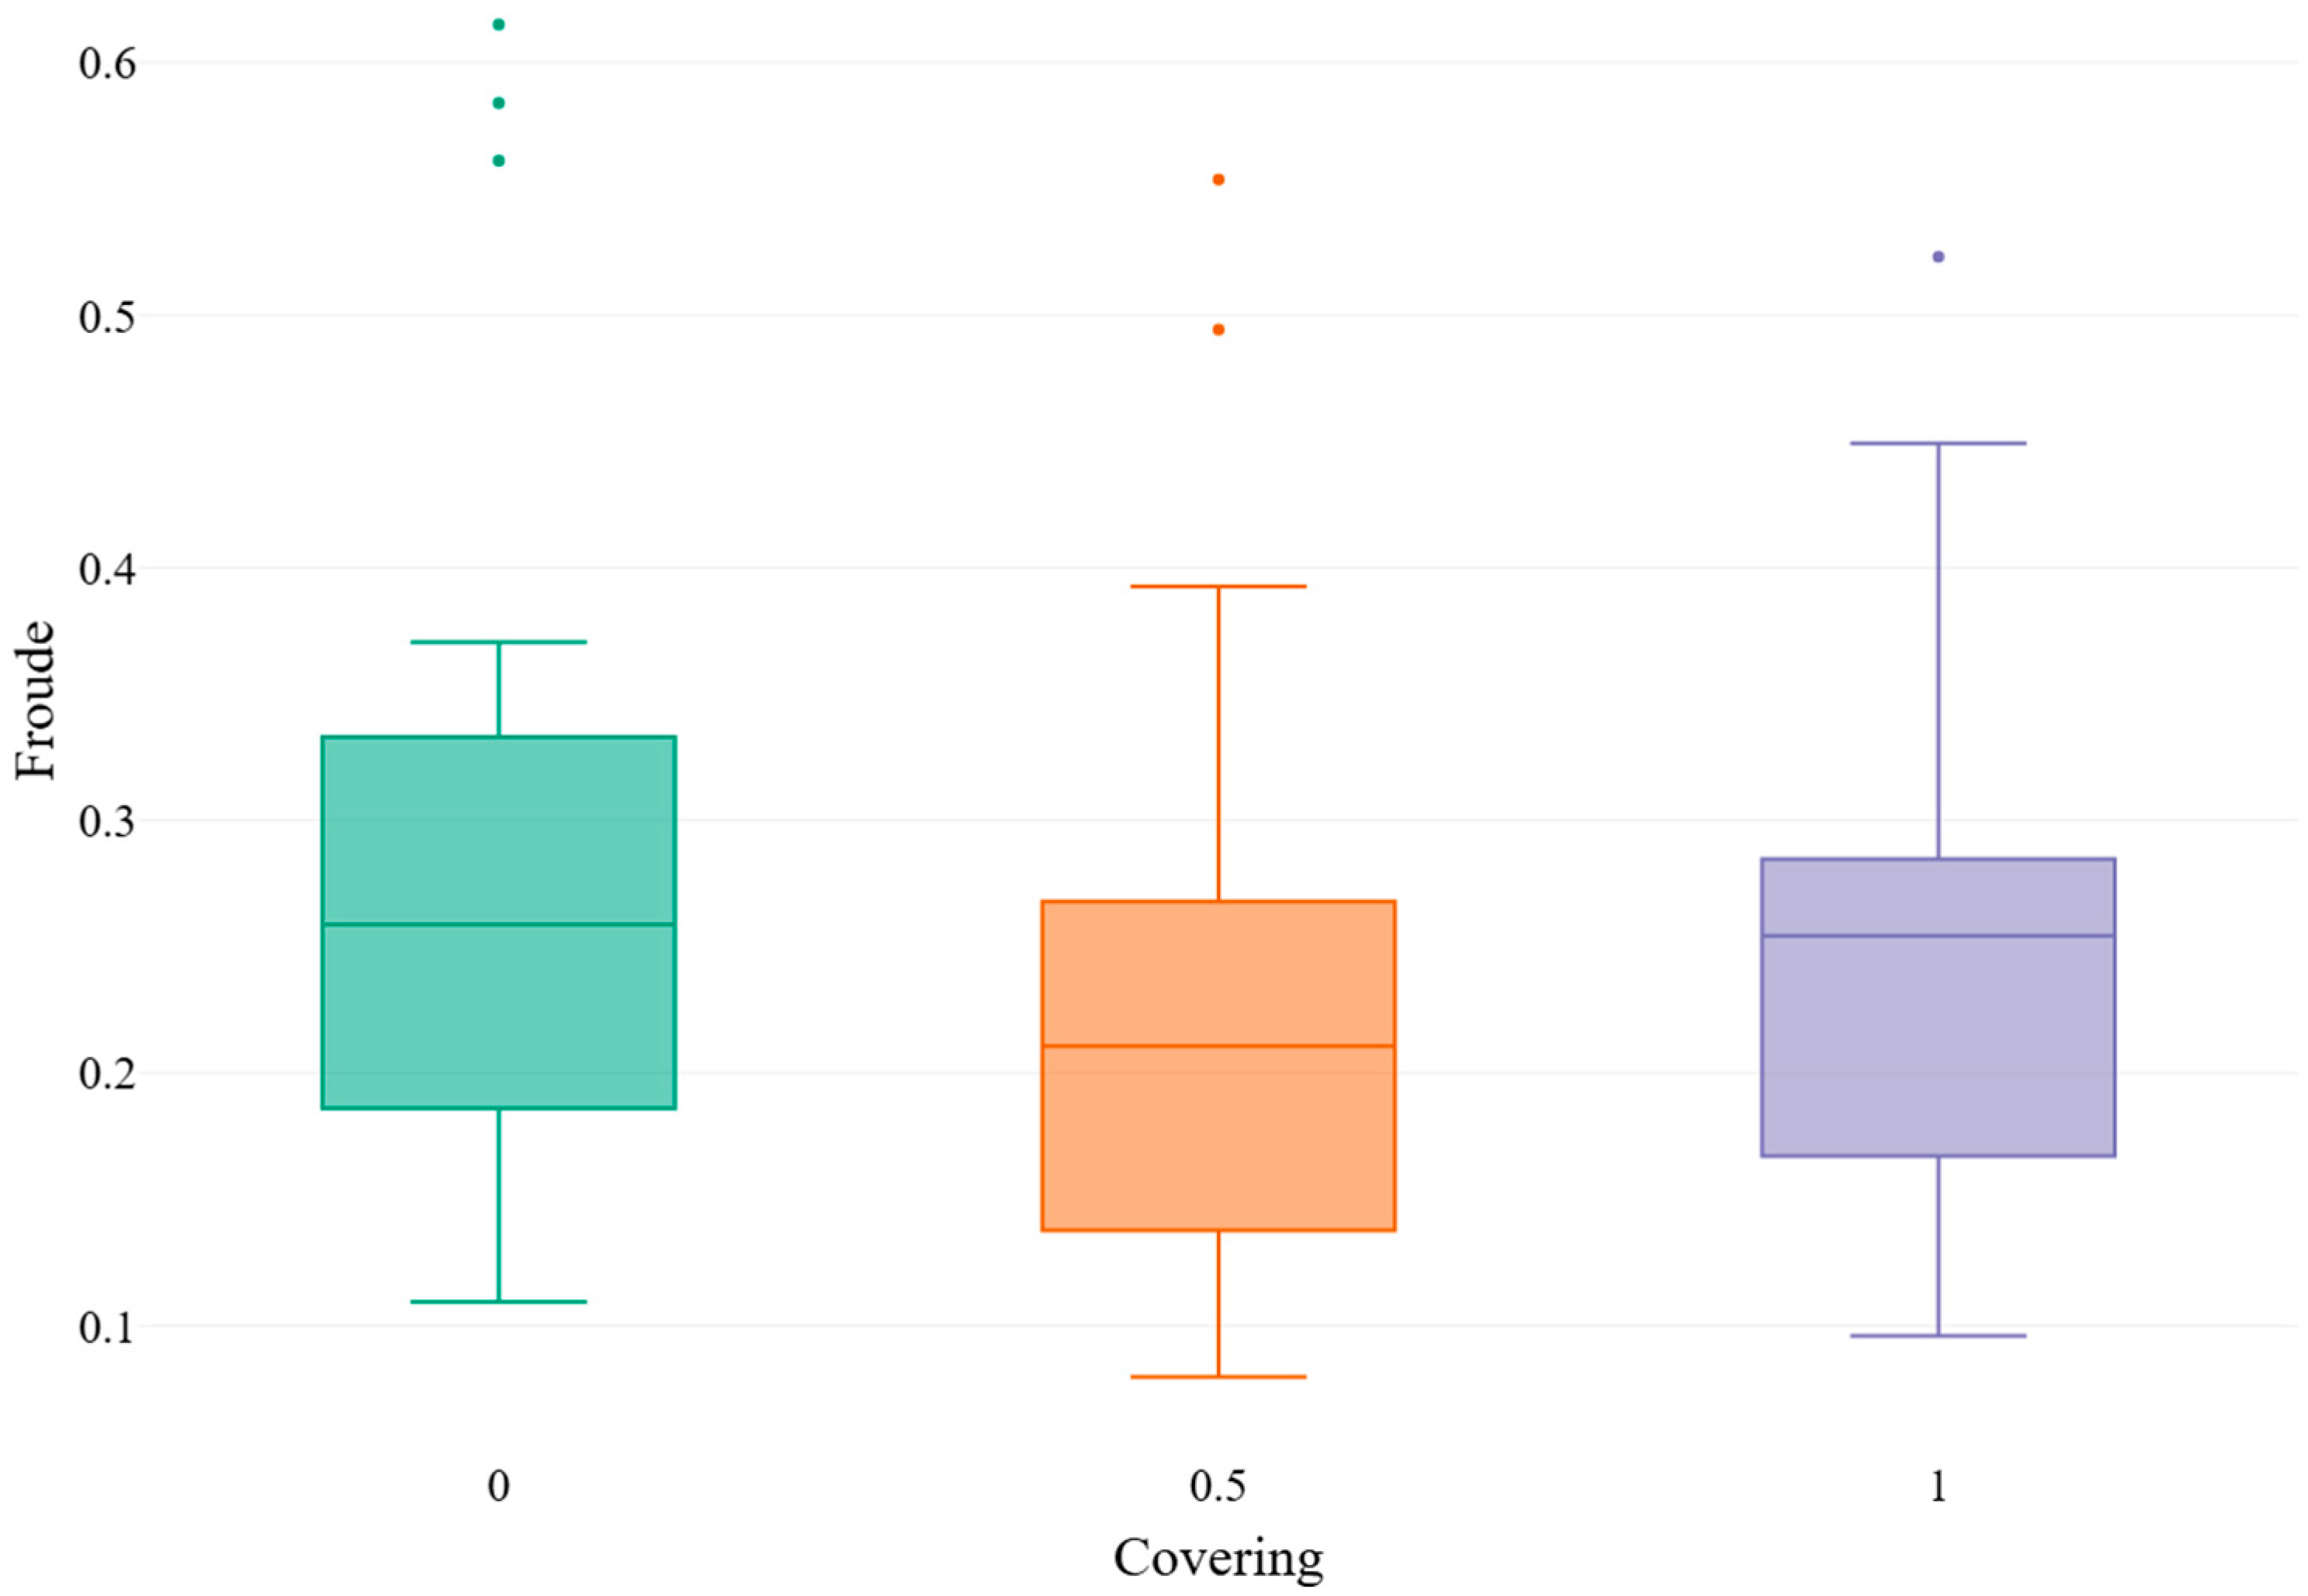
Figure 7 presents the variability in the Froude number as a function of the inlet covering ratio, highlighting differences in flow conditions associated with varying degrees of obstruction.
In chamber 5 (
Figure 6), the Froude number median was above 0.4 across all analyzed cases with blocked openings. Median close to 0.24 occurs in most of the variants studied, except chambers 5 and 12. In chamber 8, the highest Froude number variability was recorded, with a coefficient of variation (CV) of 66.7%. The next highest Froude number was recorded in chamber 12 (CV = 51.5%). However, it should be noted that these are the chambers in which the most significant change in direction of movement occurs, located on the curve of the fish pass. The lowest recorded variability in Froude number, CV = 19.5%, was observed in chamber 13, i.e., the chamber with a practically linear bottom geometry, constructed from reinforced concrete, located under the bridge structure. Despite a clear reduction in mean flow velocities due to debris coverage, no consistent trend was seen in the Froude number distribution (
Figure 7). This suggests that the proportional relationship between flow velocity and hydraulic depth stayed mostly the same, even as inlet blockage increased. Practically, debris mainly served as an energy dissipator, lowering absolute velocities without fundamentally changing the hydraulic regime in subcritical or transitional flows.
For reference, Reynolds numbers calculated using depth-averaged velocities ranged from approximately to , indicating fully turbulent flow conditions throughout the investigated chambers. Consequently, although turbulence intensity was not directly measured, the flow conditions correspond to those typically encountered in turbulent fishway flows reported in the literature.
The validity of conducting tests with varying degrees of openness is confirmed by the research of De Cicco et al. [
67]. They found that under conditions of intense debris transport, logs move as a single independent compact mass, especially at high Froude numbers (Fr = 0.5).
Similar conclusions were reached by Dysarz et al. [
68], who determined the limit values of the Froude number for safe water flow through a hydrotechnical structure. They assumed that a Froude number less than 0.50 indicates rather safe flow conditions, a value between 0.50 and 0.75 indicates medium risk, and a value greater than 0.75 indicates rather dangerous flow conditions. A completely unacceptable situation occurs when the Froude number is close to or greater than 1.0.
Chowdhury et al. [
65] reported that, under subcritical flow conditions and with increasing Froude number, the effectiveness of wood retention decreases. In contrast, De Cicco et al. [
67] found an inverse relationship: as the Fr value increases, the probability that wood blocks the bridge piers increases. Even small differences in the Froude values obtained can significantly affect flow blockage. They found that at low Froud values (0.3), the velocity is more uniform, which promotes uninterrupted debris transport. However, an increase of 0.2 already increased the likelihood of logs interacting with obstacles.
Another parameter affecting the likelihood of blockage is the flow velocity and the shape of the openings. Such studies were conducted by De Cicco et al. [
67] and found that at low flow rates, the probability of wood blockage with a flat pillar shape was three times higher than with a triangular pillar. The openings of the analyzed fish pass, which can be treated as bridge pillars, have rounded shapes resulting from the material used to construct the barrier (
Figure 5). Rounded barriers, unlike rectangular ones, seem to promote smoother flow transitions and reduce areas where debris can accumulate. However, during operation, deterioration of these elements (loss of their original shape) and the formation of sharper corners with a larger front surface area can be expected, thereby increasing the likelihood of blockages.
In different scientific and engineering disciplines, similar processes of material accumulation of varying geometric sizes are observed, which contribute to a gradual loss of river flow capacity [
69].
The ecological relevance of the observed hydraulic conditions can be assessed by relating the measured velocity and Froude number ranges to the swimming abilities and passage requirements of fish species inhabiting the study river. In general, effective fish passage requires that local flow velocities remain within the sustained or prolonged swimming capacities of migrating fish, while short sections of higher velocity may be tolerated over limited distances.
According to commonly adopted design guidelines, the velocity of the attracting current at the fishway entrance should typically range between approximately 0.8 and 2.0 ms
−1, whereas velocities within fishway slots or constrictions should not exceed about 2.0 ms
−1 [
8]. At the same time, mean velocities along the fishway are recommended to be substantially lower to allow upstream movement with limited energetic cost, particularly for weaker swimmers. For lowland rivers, recommended maximum velocities are generally on the order of 1.0 ms
−1, while values up to approximately 1.5 ms
−1 may be acceptable in mountain rivers [
70]. In modern fish pass designs, the following permissible water flow velocities have been adopted for individual fish species: salmonids 2.0 ms
−1, cyprinids 1.5 ms
−1, and other species 1.0 ms
−1 [
71].
Mean flow velocities measured in the investigated chambers ranged approximately from 0.30 to 0.75 m s
−1 (
Table 3), while local velocities within vertical profiles (
Figure 5) were generally lower. These values are well below the sustained swimming capacities reported for common lowland species such as roach (
Rutilus rutilus), minnow (
Phoxinus phoxinus), gudgeon (
Gobio gobio), and brown trout (
Salmo trutta), indicating hydraulically passable conditions for upstream migration under the observed flow regimes. The reduction in velocity associated with debris accumulation, by approximately 17% at 50% blockage and 36% under full blockage, therefore does not appear to compromise hydraulic passability from a purely kinematic perspective.
The corresponding Froude numbers remained within a subcritical regime, indicating stable flow conditions with limited risk of hydraulic instability or excessive turbulence intensity. Such conditions are generally considered favorable for fish passage, as they reduce abrupt accelerations and allow fish to exploit boundary layers and low-velocity zones during movement.
Nevertheless, it should be emphasized that hydraulic suitability does not automatically imply ecological functionality. Although the observed velocity and Froude ranges are consistent with published swimming performance limits, physical continuity of the passage cross-section remains essential. Partial blockage by debris may locally reduce velocities but can simultaneously constrain available passage space, potentially affecting larger individuals or species with limited maneuverability. Consequently, maintenance strategies should consider both hydraulic indicators and species-specific biological requirements.
4.1. Model Overview
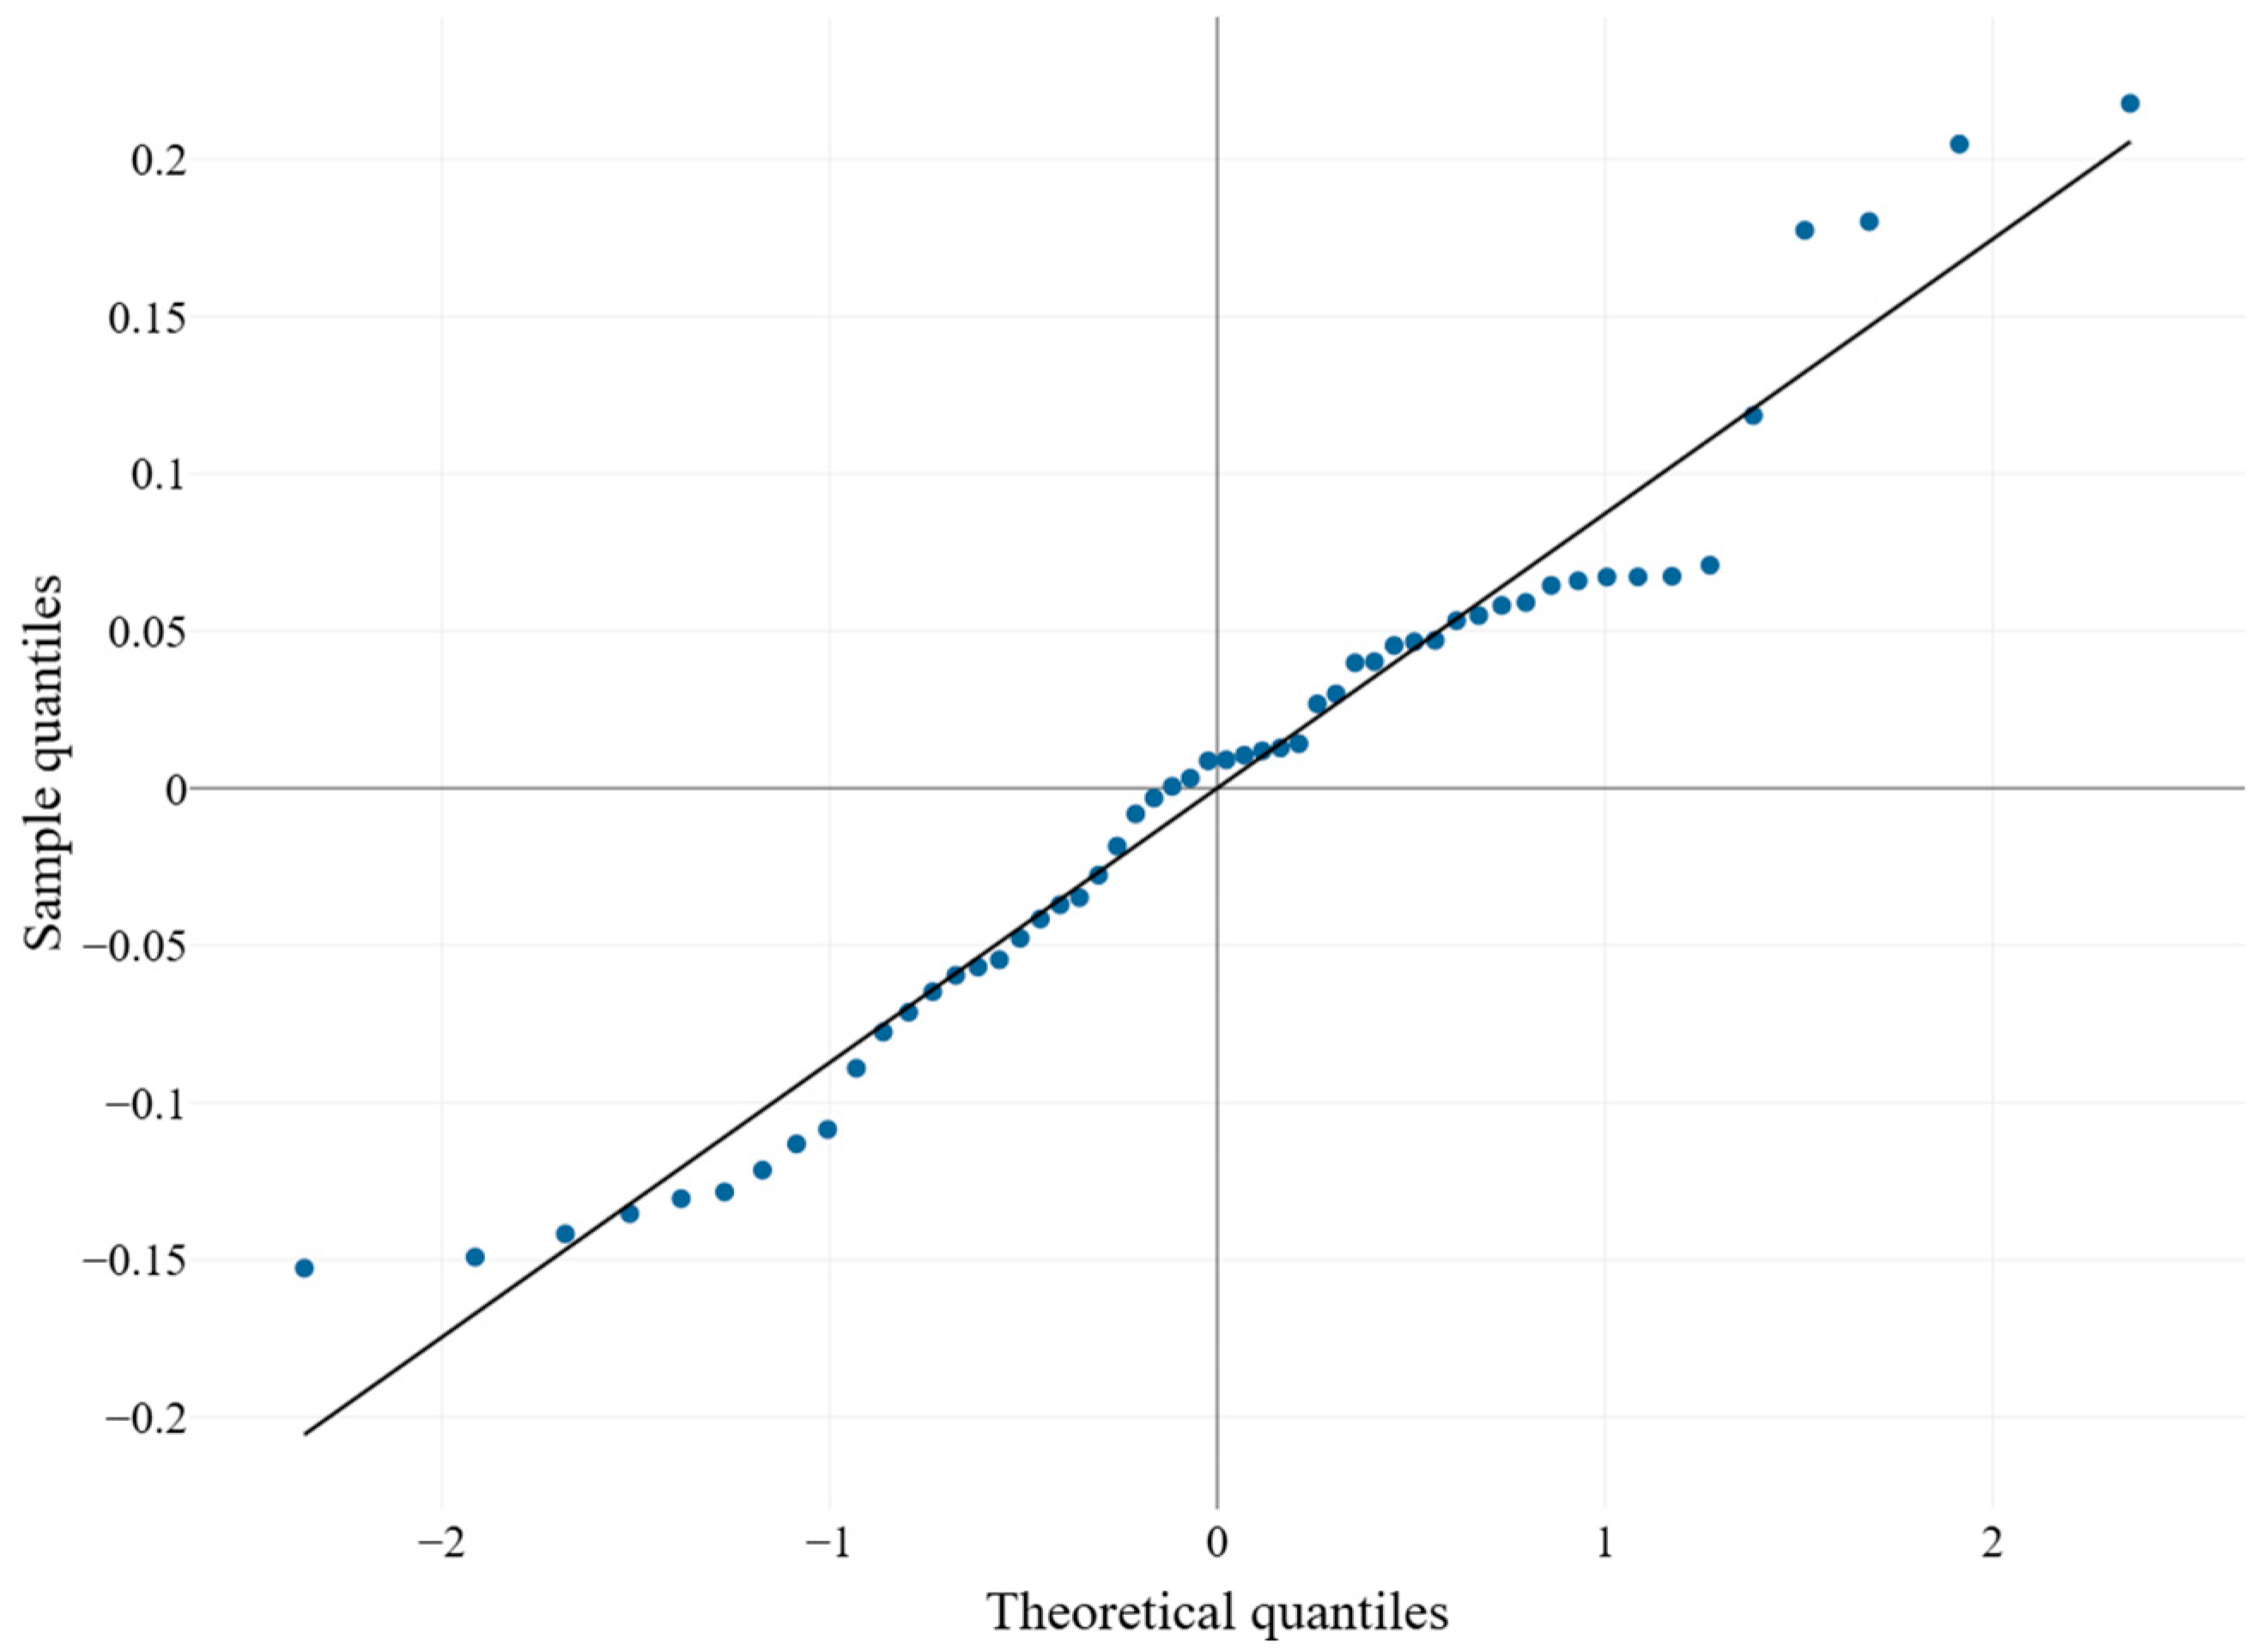
Normality of model residuals was evaluated using the Shapiro–Wilk test. The analysis indicated no significant deviation from normality (
W = 0.961,
p = 0.074), suggesting that the residual distribution was consistent with the assumptions of linear mixed-effects modeling. Visual inspection of the Q–Q (
Figure 8) plot further confirmed that residuals closely followed the theoretical normal distribution, with no evidence of heavy tails or systematic departures from linearity. Therefore, the assumption of normally distributed residuals was considered to be satisfactorily met.
Values of the Froude number varied substantially between measurement points, ranging from 0.08 to 0.62. The highest values were observed near the chambers’ inlets, while lower values occurred further downstream, especially in partially or fully covered inlets.
The mixed-effects model demonstrated adequate overall fit, with conditional R2 indicating that 53% of the variability in the Froude number was explained by the combined effects of fixed and random factors (R2c = 0.527). The analysis revealed that fixed effects alone accounted for 30% of the observed variance (R2m = 0.300). Thus, chamber-to-chamber differences accounted for approximately 23% of additional variance, demonstrating the necessity of using a mixed-effects framework.
A substantial random intercept for chamber (SD = 0.066) indicated significant hydraulic variations among chambers.
4.2. Effects of Distance, Depth, and Covering
The mixed-effects linear model revealed that distance from the inlet was the strongest predictor of the Froude number. A statistically significant negative relationship was observed (
Table 4), indicating that Froude decreased with increasing distance from the chamber entrance:
The reduction in Froude with increasing distance was consistent across chambers.
Water depth exhibited a weaker, marginally significant trend:
The degree of inlet covering (0, 0.5, 1) had no significant effect on the Froude number
p = 0.36 (
Table 5). Differences between covering levels were small and exhibited considerable overlap (
Figure 7,
Table 5). The Type III ANOVA confirmed that distance significantly affected the Froude number (F = 10.99,
p = 0.0017), whereas depth and covering ratio were not statistically significant (
p > 0.05).
The present study demonstrated that the most influential factor shaping the Froude number within individual fishway chambers was the distance from the chamber inlet. The observed decline in Froude with increasing distance is consistent with findings from hydraulic studies showing progressive dissipation of kinetic energy and turbulence intensity along the chamber length [
62,
72]. In vertical-slot fishways, flow decelerates as energy is redistributed between main flow structures and secondary circulation cells, leading to lower local velocities and Froude numbers downstream of the slot [
73]. Our results align with this expected pattern, indicating a stable reduction in hydraulic intensity across chambers of different geometries.
The marginal influence of water depth observed in the model corresponds with previous research suggesting that small variations in water depth often have a limited effect on Froude magnitude, provided that operational depth remains within design recommendations for the fishway type [
62,
74]. Although a weak negative trend was detected, the effect was not statistically decisive, possibly due to relatively narrow depth variability under the tested conditions.
In contrast, inlet covering did not significantly influence the Froude number. This result is noteworthy because partial obstruction of the inlet by debris is frequently assumed to alter hydraulic conditions in fishways [
75]. The absence of a measurable impact in our data suggests that the hydraulic system may compensate for moderate obstructions, maintaining similar energy distribution downstream of the inlet. Comparable resilience of vertical-slot hydraulics to structural or operational disturbances has been noted in controlled studies [
76,
77]. Nevertheless, the visual patterns indicated that fully open inlets tended to support slightly higher Froude values near the entrance; however, these differences diminished after accounting for chamber-level variability.
A blockage ratio of 0.5 resulted in an approximately 17% reduction in mean flow velocity and an estimated 31% reduction in kinetic energy, which may already be considered a strong indication for initiating maintenance actions in a fish pass.
However, given the limited number of blockage scenarios analyzed and the absence of biological passage experiments assessing species-specific passability under these conditions, these values should not be treated as absolute maintenance thresholds. Instead, they should be interpreted as qualitative reference levels supporting adaptive, site-specific management decisions.
It is therefore important to distinguish hydraulic performance from ecological functionality. Although the hydraulic effects of partial blockage appear limited, physical continuity of the passage remains essential for fish migration. Consequently, debris removal strategies in semi-natural fish passes should be based on a combination of hydraulic indicators, visual inspection of physical continuity, and the ecological requirements of target species, rather than on fixed blockage ratios alone.
The results presented in this study are based on field measurements conducted during the vegetation season under mean flow conditions, which represent typical operational states of the investigated fish pass. Seasonal variability and extreme hydrological events were not included in the measurement campaign. Under higher discharges, such as during flood events, increased flow velocities and water depths within the chambers can be expected, potentially modifying both debris accumulation patterns and hydraulic responses.
In addition, the physical properties of plant debris are likely to vary seasonally. During the vegetation period, debris is generally leafy and flexible, whereas post-vegetation debris tends to be stiffer and less deformable, which may influence blockage geometry and hydraulic interaction. Although these effects were not quantified in the present study, they may lead to different local flow modifications under non-studied conditions.
The present study was conducted in a lowland, semi-natural fish pass, and therefore the generalizability of the results beyond this type of structure should be considered with caution. Semi-natural fish passes are characterized by irregular geometry, rough boundaries, and spatially variable hydraulic conditions, which differ fundamentally from those in fully technical fishways constructed from concrete elements with more uniform flow patterns. Consequently, the direct transfer of quantitative results obtained in this study to steep, high-energy, or entirely technical fishways is not appropriate.
Nevertheless, the qualitative hydraulic response to inlet blockage is expected to be similar across fishway types. Partial obstruction of chamber inlets is likely to reduce local flow velocities and dissipate kinetic energy regardless of structural typology. Therefore, while the numerical values reported here should be interpreted as site-specific, the general implications for operation and maintenance—particularly the need to monitor debris accumulation and its hydraulic effects—remain relevant for other semi-natural fish passes and hybrid technical–natural solutions.
A key methodological outcome is the importance of treating chamber identity as a random factor. The random-effects structure accounted for 23% of additional variance in the model, demonstrating substantial chamber-to-chamber differences. Such variability is well documented in fishway hydraulics and often attributed to small differences in geometry, surface roughness, construction material, or local structural imperfections [
63,
78]. Ignoring these differences may lead to inflated Type I errors or incorrect inference [
79]. Mixed-effects modeling, therefore, provided a more reliable representation of the hydraulic system.
No significant interactions were detected between distance, depth, and inlet covering. This suggests that the primary hydraulic gradient along the chamber is robust and not modulated by the tested structural factors. Similar independence of longitudinal hydraulic gradients from local obstructions has been reported for nature-like fishways and some technical designs [
26,
80].
Overall, the findings confirm that distance-related hydraulic decay is the primary pattern governing Froude dynamics in technical fishway chambers. The lack of influence of inlet covering may indicate hydraulic resilience, but further studies under higher debris loads or with 3D turbulence analyses (e.g., ADV, PIV, CFD) could provide additional insight. Understanding these patterns is essential for maintaining optimal hydraulic conditions in operational fish passes, especially in systems prone to sediment or debris accumulation.
The utilization of vegetation in the construction of fish passes has been demonstrated to be a successful strategy. In their analyses, Tymiński and Kałuża [
9] propose that a more efficacious approach in the case of weirs is to construct a semi-natural fish pass using vegetation and stones. This configuration facilitates enhanced control over the flow velocity. The velocity fields displayed for all three biotechnical configurations evidently demonstrate that the incorporation of natural vegetation in the fish pass enables the designer to regulate the water flow. The creation of “calm zones” in the fish pass, where fish can rest during the crossing, is enabled by competent vegetation. Furthermore, the presence of stones or rocks within the fish pass serves to amplify its hydraulic effect. In all the cases that were examined, the levels of turbulence were found to be at their lowest point immediately behind the obstacles. The highest local velocities were observed in the transition areas (narrowings) between the chambers. A thorough examination of these distributions revealed that such elevated levels of turbulence did not impede or hinder the migratory behavior of fish. Some plant growth may do no harm [
81], and may even enhance pass operation by diversifying the wetted routes through the pass, but if left it can quickly choke the pass blocking the carefully designed interstices within the climbing substrate.
Finally, the application of mixed-effects modeling in this study demonstrates a robust analytical framework for evaluating fishway hydraulics under semi-controlled field conditions. Treating chambers as random effects allows site-specific variability to be separated from general hydraulic trends, thereby improving the ecological and engineering relevance of statistical inference. This approach can be readily transferred to future studies on fish passages with heterogeneous geometry, supporting comparative analysis across multiple facilities.