Article

Comparative Analysis of Internal Complex Flow and Energy Loss in a Tubular Pump Under Two Rotational Speed Conditions

1
College of Water Resources and Civil Engineering, China Agricultural University, Beijing 100083, China
2
Jiangsu Water Source Company Ltd. of the Eastern Route of the South-to-North Water Diversion Project, Nanjing 210019, China
3
Beijing Engineering Research Center of Safety and Energy Saving Technology for Water Supply Network System, China Agricultural University, Beijing 100083, China
*
Author to whom correspondence should be addressed.
Water 2026, 18(2), 188; https://doi.org/10.3390/w18020188
Submission received: 10 December 2025 / Revised: 29 December 2025 / Accepted: 8 January 2026 / Published: 10 January 2026
(This article belongs to the Section Hydraulics and Hydrodynamics)

Abstract

This study focuses on a bulb tubular pump to clarify the flow characteristics and energy loss laws of low-lift tubular pumps under variable speed regulation and addresses deviations from optimal operating conditions in complex scenarios. For two typical rotational speeds, a full-flow passage model was established; the SST k-ω turbulence model was used to solve 3D incompressible viscous flow, energy loss was analyzed via entropy production theory, and simulations were experimentally validated. The results showed the following: pump efficiency exhibited a “first rise then fall” trend, head decreased monotonically with flow rate, and the optimal operating point shifted to lower flow rates at slower speeds. Meanwhile, local entropy production rate effectively characterized loss location and intensity, with aggravated off-design loss concentrated near the hub and rim along the spanwise direction and within 30 mm of the near-wall region. This study clarifies core energy loss mechanisms, providing a quantitative basis for operation optimization and structural improvement to support the safe, economical operation of low-lift pump stations.

1. Introduction

In low-head water conveyance systems, such as large-scale inter-basin water transfer, plain river network irrigation, and urban flood control and drainage, the tubular pump—benefiting from its linear flow passage with axial inflow and straight outflow—achieves nearly minimal hydraulic loss. It can stably deliver a high hydraulic efficiency and excellent cavitation performance within the low-head range, thus being designated as the preferred model in more than ten national key projects, including the Eastern Route of the South-to-North Water Diversion Project and the comprehensive management of the Taihu Lake Basin. The tubular pump device has an excellent hydraulic performance, which is suitable for pumping stations with a large flow and low head, which is exactly consistent with the characteristics of the East Route Project of South-to-North Water Diversion [1]. In the first phase of the eastern route of the South-to-North Water Diversion Project, Linjiaba Station, Huaiyin Third Station, Jinhu Station, Hanzhuang Station, Sihong Station, Secondary Dam Station, and Pizhou Station all adopted the tubular pump device [2]. Its “large flow–low energy consumption” characteristics provide irreplaceable technical support for reducing the operating cost of the whole life cycle and achieving the “double carbon” goal. However, the low-lift pumping station system faces a prominent technical challenge, and a small fluctuation in the unit head can easily lead to a large deviation in the operating conditions. Due to the change in the tidal level of the Yangtze River, the pumping station along the river often meets the ultra-low-lift condition, which can easily cause abnormal water pressure pulsation, resulting in the strong vibration of the unit, which seriously threatens the safety of the pumping station [3]. This high sensitivity causes the unit to frequently deviate from the high-efficiency operating zone, which not only increases the energy consumption of a single unit but is also likely to induce potential safety hazards such as intensified unit vibration and cavitation damage. Therefore, ensuring that the tubular pump is always close to the optimal working condition under low-head conditions has become one of the core challenges for the safe and economic operation of water transfer projects.
For the complex flow structure inside the tubular pump, existing research is mainly carried out by means of experimental measurements and CFD numerical simulations. Many scholars have already carried out professional research on these aspects. Jin et al. [4,5,6,7] obtained the internal flow parameters of different types of bulb tubular pump devices and the detailed flow structure in each flow component through research many years ago. The method of combining numerical simulation and model tests was used to test the flow field in the pump through three-dimensional LDV. The experimental data of the flow field in the impeller outlet and the guide vane of the tubular pump were obtained, and the components in the device were optimized. Li et al. [8] clarified the energy-saving advantages of the tubular pump device at ultra-low head through a physical model test system and quantified the contribution weight of each flow component to the efficiency of the device. Shi [9] used the realizable k-ε model to compare the axial flow pump and the tubular pump, and pointed out that the latter was more challenging for controlling the inlet horseshoe vortex and the outlet circulation of the guide vane. Lu et al. [10,11,12,13] also explored the internal flow and hydraulic loss of the front-end bulb tubular pump device by means of numerical simulation and model tests many years ago. These findings indicate that experimental validation and CFD prediction complement each other, having long served as the standard paradigm for revealing the unsteady flow and energy dissipation mechanisms inside tubular pumps. The performance and efficiency of tubular pumps are highly dependent on the matching between the impeller blade setting angle and the guide vane angle, and their coupling directly determines the rationality of the internal flow field and the magnitude of energy loss in the pump. Among them, severe flow separation and vortex shedding can cause strong pressure pulsation, which may lead to vibration and noise problems, and may also induce or aggravate cavitation in low-pressure areas. Therefore, finding the optimal combination in real time under different operating requirements has become an important issue in the intelligent control of tubular pumps. Compared with mechanical angle adjustment, variable frequency and variable speed realize head–flow stepless adjustment by continuously changing the speed, which can prevent the mechanical wear caused by frequent angle adjustment. However, the application of variable speed in tubular pumps still faces potential risks such as intensified secondary flow in the guide vane zone and gap leakage flow–mainstream coupling amplification.
The quantitative analysis of energy losses inside turbomachinery requires establishing a causal relationship between flow structures and dissipation mechanisms [14]. To intuitively identify the quality of flow patterns, relatively mature paradigms have been developed for both experimental measurements and CFD post-processing. Based on numerical simulation results of the internal flow field of hydraulic machinery, the entropy production analysis method can be used to intuitively understand the position and degree of mechanical energy dissipation in a flow field. Researchers [15,16,17] have found that the largest loss component in the pump is the impeller, followed by the guide vane, and the entropy production will increase sharply under unsteady conditions. Zhang et al. [18] studied the flow loss characteristics of the shaft tubular pump under different flow conditions and quantitatively analyzed it using the entropy production theory. The results show that the energy loss of the impeller section is mainly due to turbulent dissipation and the entropy production ratio is up to 92%. Pan et al. [19] studied the relationship between local entropy production, energy loss, and unstable flow in each component of a large bulb tubular pump under different working conditions. The results show that the positive incidence angle of small flow leads to more energy loss. The energy loss of the bulb is concentrated in the tail shrinking section under the condition of small flow rate, and in the wake area of the tail of the bulb under the condition of large flow rate. Zhou et al. [20] summarized the application of entropy production theory in pump flow research and reviewed the research progress from the aspects of energy loss analysis, design optimization, cavitation analysis, and fault diagnosis. These studies have shown that the entropy production analysis method is an effective energy dissipation evaluation method for hydraulic machinery and has the advantages of being intuitive and quantitative. The entropy production theory is used as a unified measure for energy loss comparisons of the tubular pump at two speeds, which not only has sufficient theoretical basis but also experimental and numerical empirical support.
In this paper, based on the tubular pump, a CFD model of the whole flow channel covering the inlet flow channel, impeller, guide vane, outlet flow channel, and bulb body is established. Then, focusing on the two typical operating conditions of rated speed of 115.4 r/min and 80% rated speed of 92.32 r/min, the differences in internal complex flow structure and the source and proportion of energy loss of each component are compared and analyzed. Furthermore, the internal flow characteristics are directly related to the performance curve of the whole machine, revealing the energy loss composition and performance evolution law of the low-lift tubular pump under variable speed regulation and finally providing a reference for the optimal operation of the project. For future research, the intelligent prediction of internal pump losses based on entropy production data can be developed, drawing on the “theory-guided neural network + weak-form analysis” method [21], which is expected to realize the “real-time monitoring and adaptive optimization of pumping station operation.”

2. Research Methods

2.1. Research Object

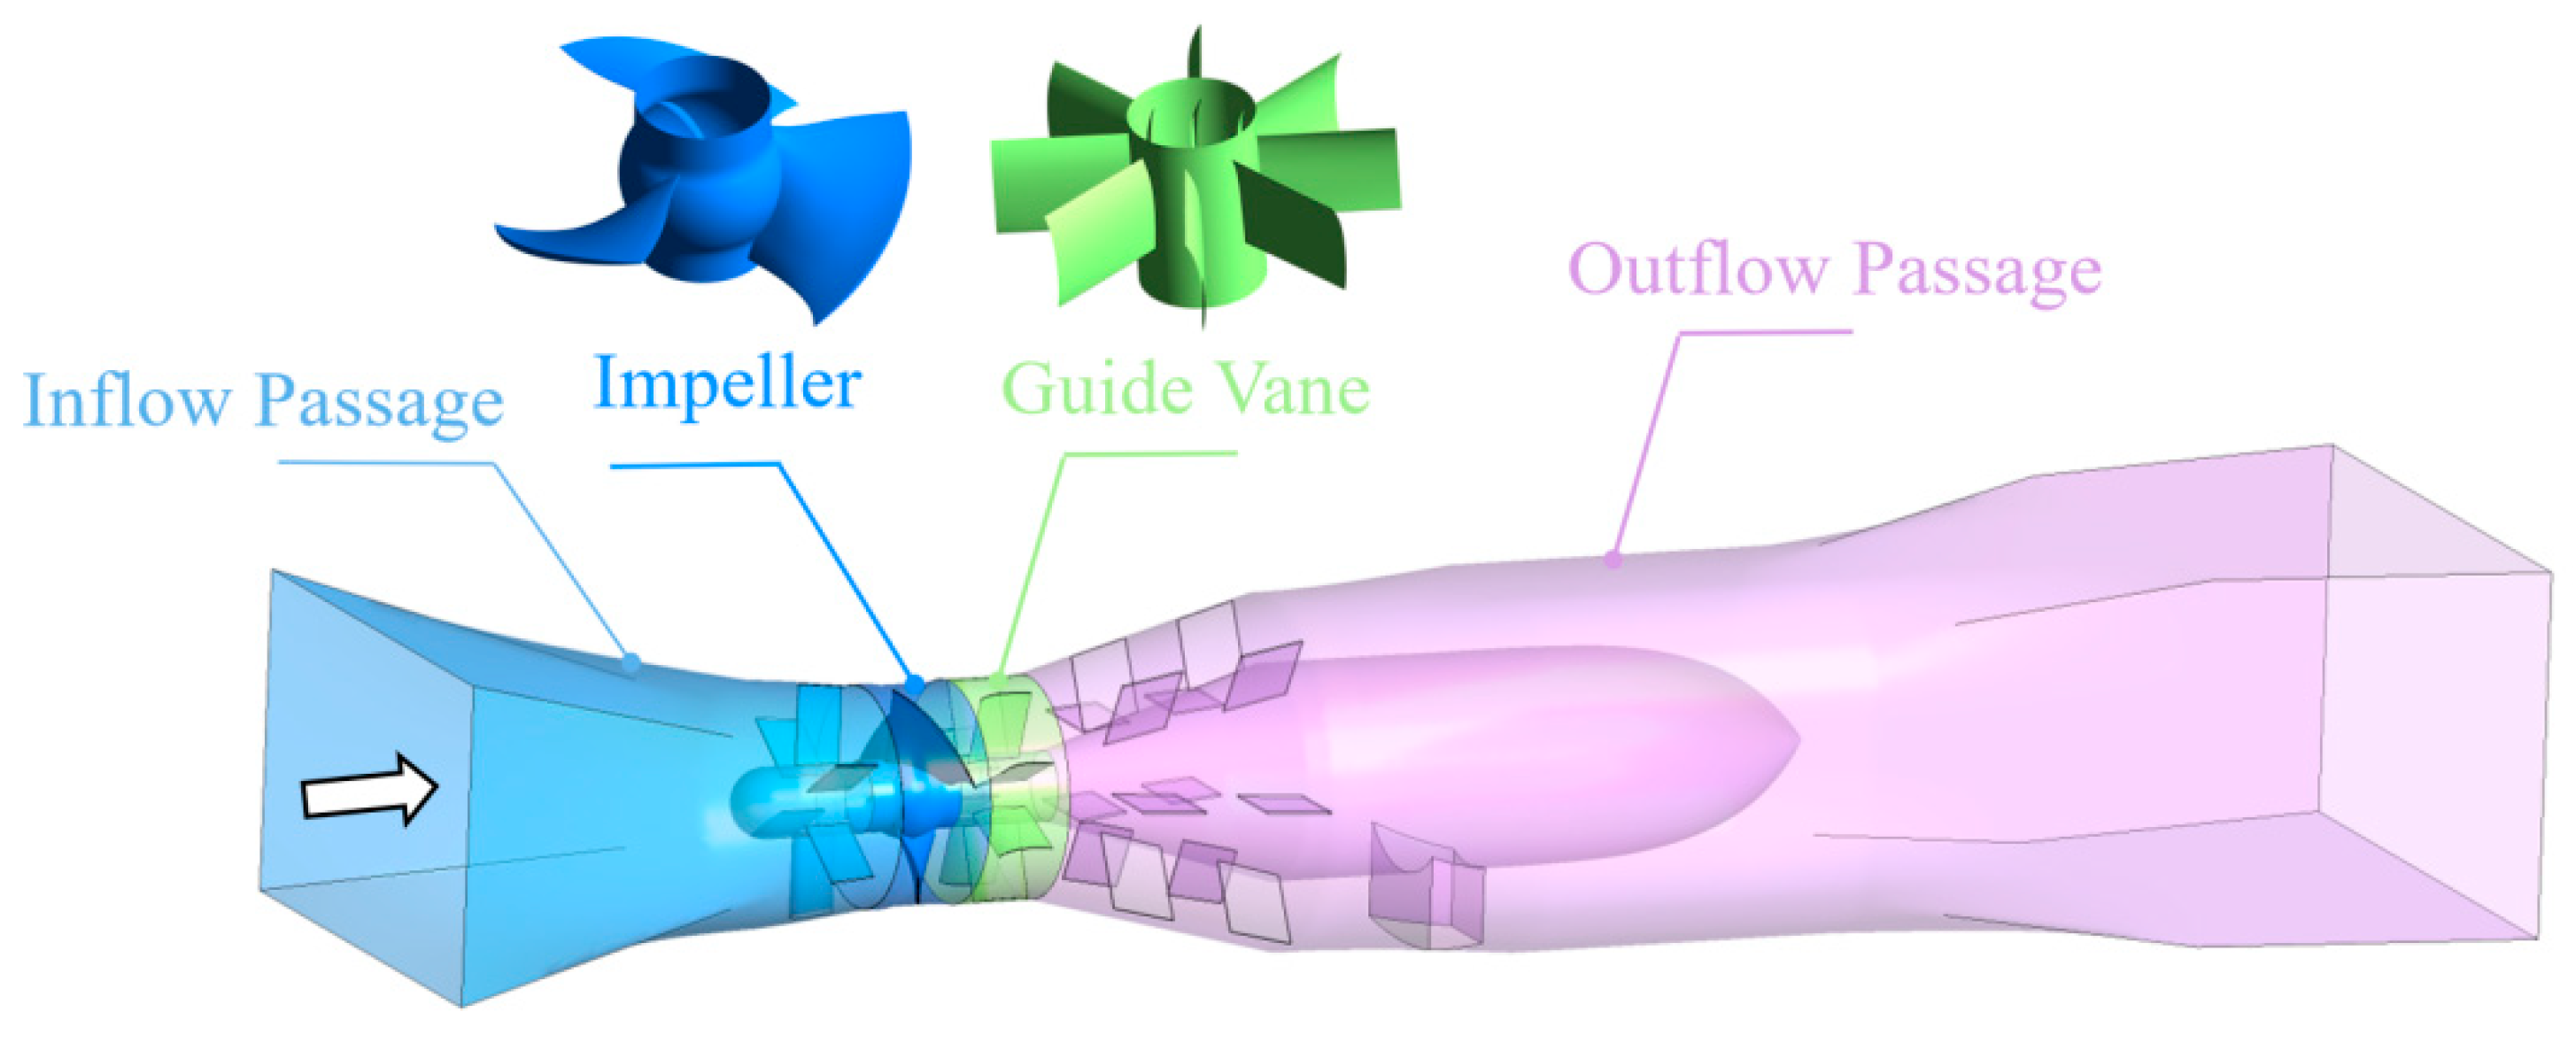
The research object of this paper is a bulb tubular pump unit. As shown in Figure 1, the main flow components include an inlet passage, impeller, guide vane, bulb body, and outlet passage. The impeller diameter is 3.35 m, the number of impeller blades is 3, the number of guide vane blades is 8, the design head is 2.45 m, the design flow is 37.5 m3/s, the field operation flow range is 26.25 m3/s to 52.5 m3/s, and the rated speed is 115.4 r/min. During the change in working conditions, the speed is often adjusted to 92.32 r/min by frequency conversion equipment. In order to compare the internal flow characteristics and performance changes at two speeds, three operating points were selected for analysis—the research conditions are shown in Table 1.

2.2. Governing Equations and Turbulence Model

In the numerical simulation of the internal flow of the pump, three-dimensional incompressible viscous flow is considered. The Navier–Stokes (N-S) equation is used to solve the internal flow. The N-S equation is expressed as follows:
u i x i = 0
t ρ u i + x j ρ u i u j = ρ F i p x i + x j μ u i x j
where ρ is the density, t is the time, u is the velocity, p is the pressure, and μ is the dynamic viscosity.
The Reynolds-averaged method is commonly adopted for the engineering solution of the N-S equations, whereby turbulent quantities are decomposed into the sum of time-averaged components and fluctuating components, as shown in the following equation:
u i = u i ¯ + u i
p = p ¯ + p
where u i ¯ and p ¯ are the time-averaged components, and u i and p are the fluctuating components.
Substituting Equations (3) and (4) into Equations (1) and (2), the Reynolds-averaged Navier–Stokes (RANS) equations can be derived, as expressed by the following equations:
u i ¯ x i = 0
ρ u i ¯ t + ρ u j ¯ u i ¯ x j = ρ F i ¯ p ¯ x i + x j μ u j x j ρ u i u j ¯
where ρ u i u j ¯ is the Reynolds stress term.
In this study, the shear stress transport (SST) k-ω turbulence model is adopted to formulate the Reynolds stress term in the Reynolds-averaged Navier–Stokes (RANS) equations [22]. This turbulence model employs the k-ω model in the boundary layer region and the k-ε model in the mainstream region. The mathematical expression of the SST k-ω turbulence model was first proposed by Menter, and its specific form is given as follows:
( ρ k ) t + ( ρ u i k ) x i = P ρ k 3 2 l k ω + x i ( μ + σ k μ t ) k x i
( ρ ω ) t + ( ρ u i ω ) x i = C ω P β ρ ω 2 + x i ( μ i + σ ω μ t ) ω x i + 2 ( 1 F 1 ) ρ σ ω 2 ω k x i ω x i
ν t = α k max ( α ω , Ω F 2 )
where μ is the dynamic viscosity, μt is the turbulent viscosity coefficient, σ is the model constant, F1 is the weighting faction, F2is the blending equation, lk-ω is the turbulent length scale, σω is interpolated via the blending function F1 (the value in the near-wall region (σω1) is 0.5, while that in the far-field region (σω2) is 0.856), σk is divided into the near-wall region and the far-field region, interpolated via the blending function F1 (the value in the near-wall region (where F1 = 1) is σk1 = 0.85, while that in the far-field region (where F1 = 0) is σk2 = 1.0), v is the kinematic viscosity, vt is the eddy viscosity coefficient, and Cω is the turbulent dissipation coefficient, which takes the value of 0.075 in the near-wall region and 0.0828 in the far-field region, and is often highly correlated with the β coefficient.

2.3. Entropy Production Theory

Entropy production is a concrete manifestation of the second law of thermodynamics in practical processes. It describes the entropy increase within a system caused by irreversible processes, and the energy dissipation of a fluid system will lead to an increase in internal energy. The entropy production rate is an effective method for the quantitative analysis of flow energy loss [23,24], which can intuitively indicate the position and intensity of energy loss generated by the vortex band. Kock and Herwig [25] proposed a model of local entropy production rate caused by computing speed fluctuations.
Entropy production is divided into two categories: the dissipation effect (SPD) and the heat transfer effect (SPC). Both SPD and SPC can be divided into two items: viscous dissipation (mean term) and turbulent dissipation (fluctuating term). S P D ¯ and SPD are the viscous dissipation term (mean term) and turbulent dissipation term (fluctuating term) of the dissipation effect, respectively, which can be expressed as follows:
S P D ¯ = μ T ¯ 2 u ¯ x 2 + v ¯ y 2 + w ¯ z 2 + u ¯ y + v ¯ x 2 + u ¯ z + w ¯ x 2 + v ¯ z + w ¯ y 2
S P D = μ T 2 u x 2 ¯ + v y 2 ¯ + w z 2 ¯ + u y + v x 2 ¯ + u z + w x 2 ¯ + v z + w y 2 ¯
S P C ¯ and S P C are the viscous dissipation term (mean term) and turbulent dissipation term (fluctuating term) of the heat transfer effect, respectively, which can be expressed as follows:
S P C ¯ = λ t T 2 T ¯ x 2 + T ¯ y 2 + T ¯ z 2
S P C = λ t T 2 T x 2 ¯ + T y 2 ¯ + T z 2 ¯
SP represents the total entropy production rate, i.e., the sum of the dissipation effect and the heat transfer effect, which can be expressed as follows:
S P = S P D ¯ + S P D + S P C ¯ + S P C
SP can determine the high energy dissipation regions induced by entropy production in an intuitive manner and be used to quantitatively describe the entropy production of the entire system or individual components.
Numerical simulation results based on the RANS method can only provide information on the time-averaged velocity field, while the information on the fluctuating velocity field components cannot be obtained. Therefore, the fluctuating entropy production cannot be directly calculated from the velocity field solved by the RANS method. In CFD simulations, based on the SST-DES method, visualization and analysis of the local entropy production rate (Ep) induced by velocity fluctuations are conducted as follows:
E p = β ρ ω k T
where k is the turbulent kinetic energy (m2/s2), T is the temperature (K), ρ represents the density of the working medium (kg/m3), β is the closure constant in the SST model (usually taken as 0.09), and ω stands for the turbulent specific dissipation rate (s−1).

2.4. Meshing Scheme

The computational domain consists of four main components, namely the inlet passage, impeller body, guide vane body, bulb body, and outlet passage. To facilitate the numerical solution, the computational domain needs to be spatially discretized, thus requiring the production of a reasonable mesh. In this study, opensource 3D modeling software is adopted for the full-flow-passage geometric modeling of the bulb tubular pump, and the computational domain of the pump’s full flow passage is illustrated in Figure 1.
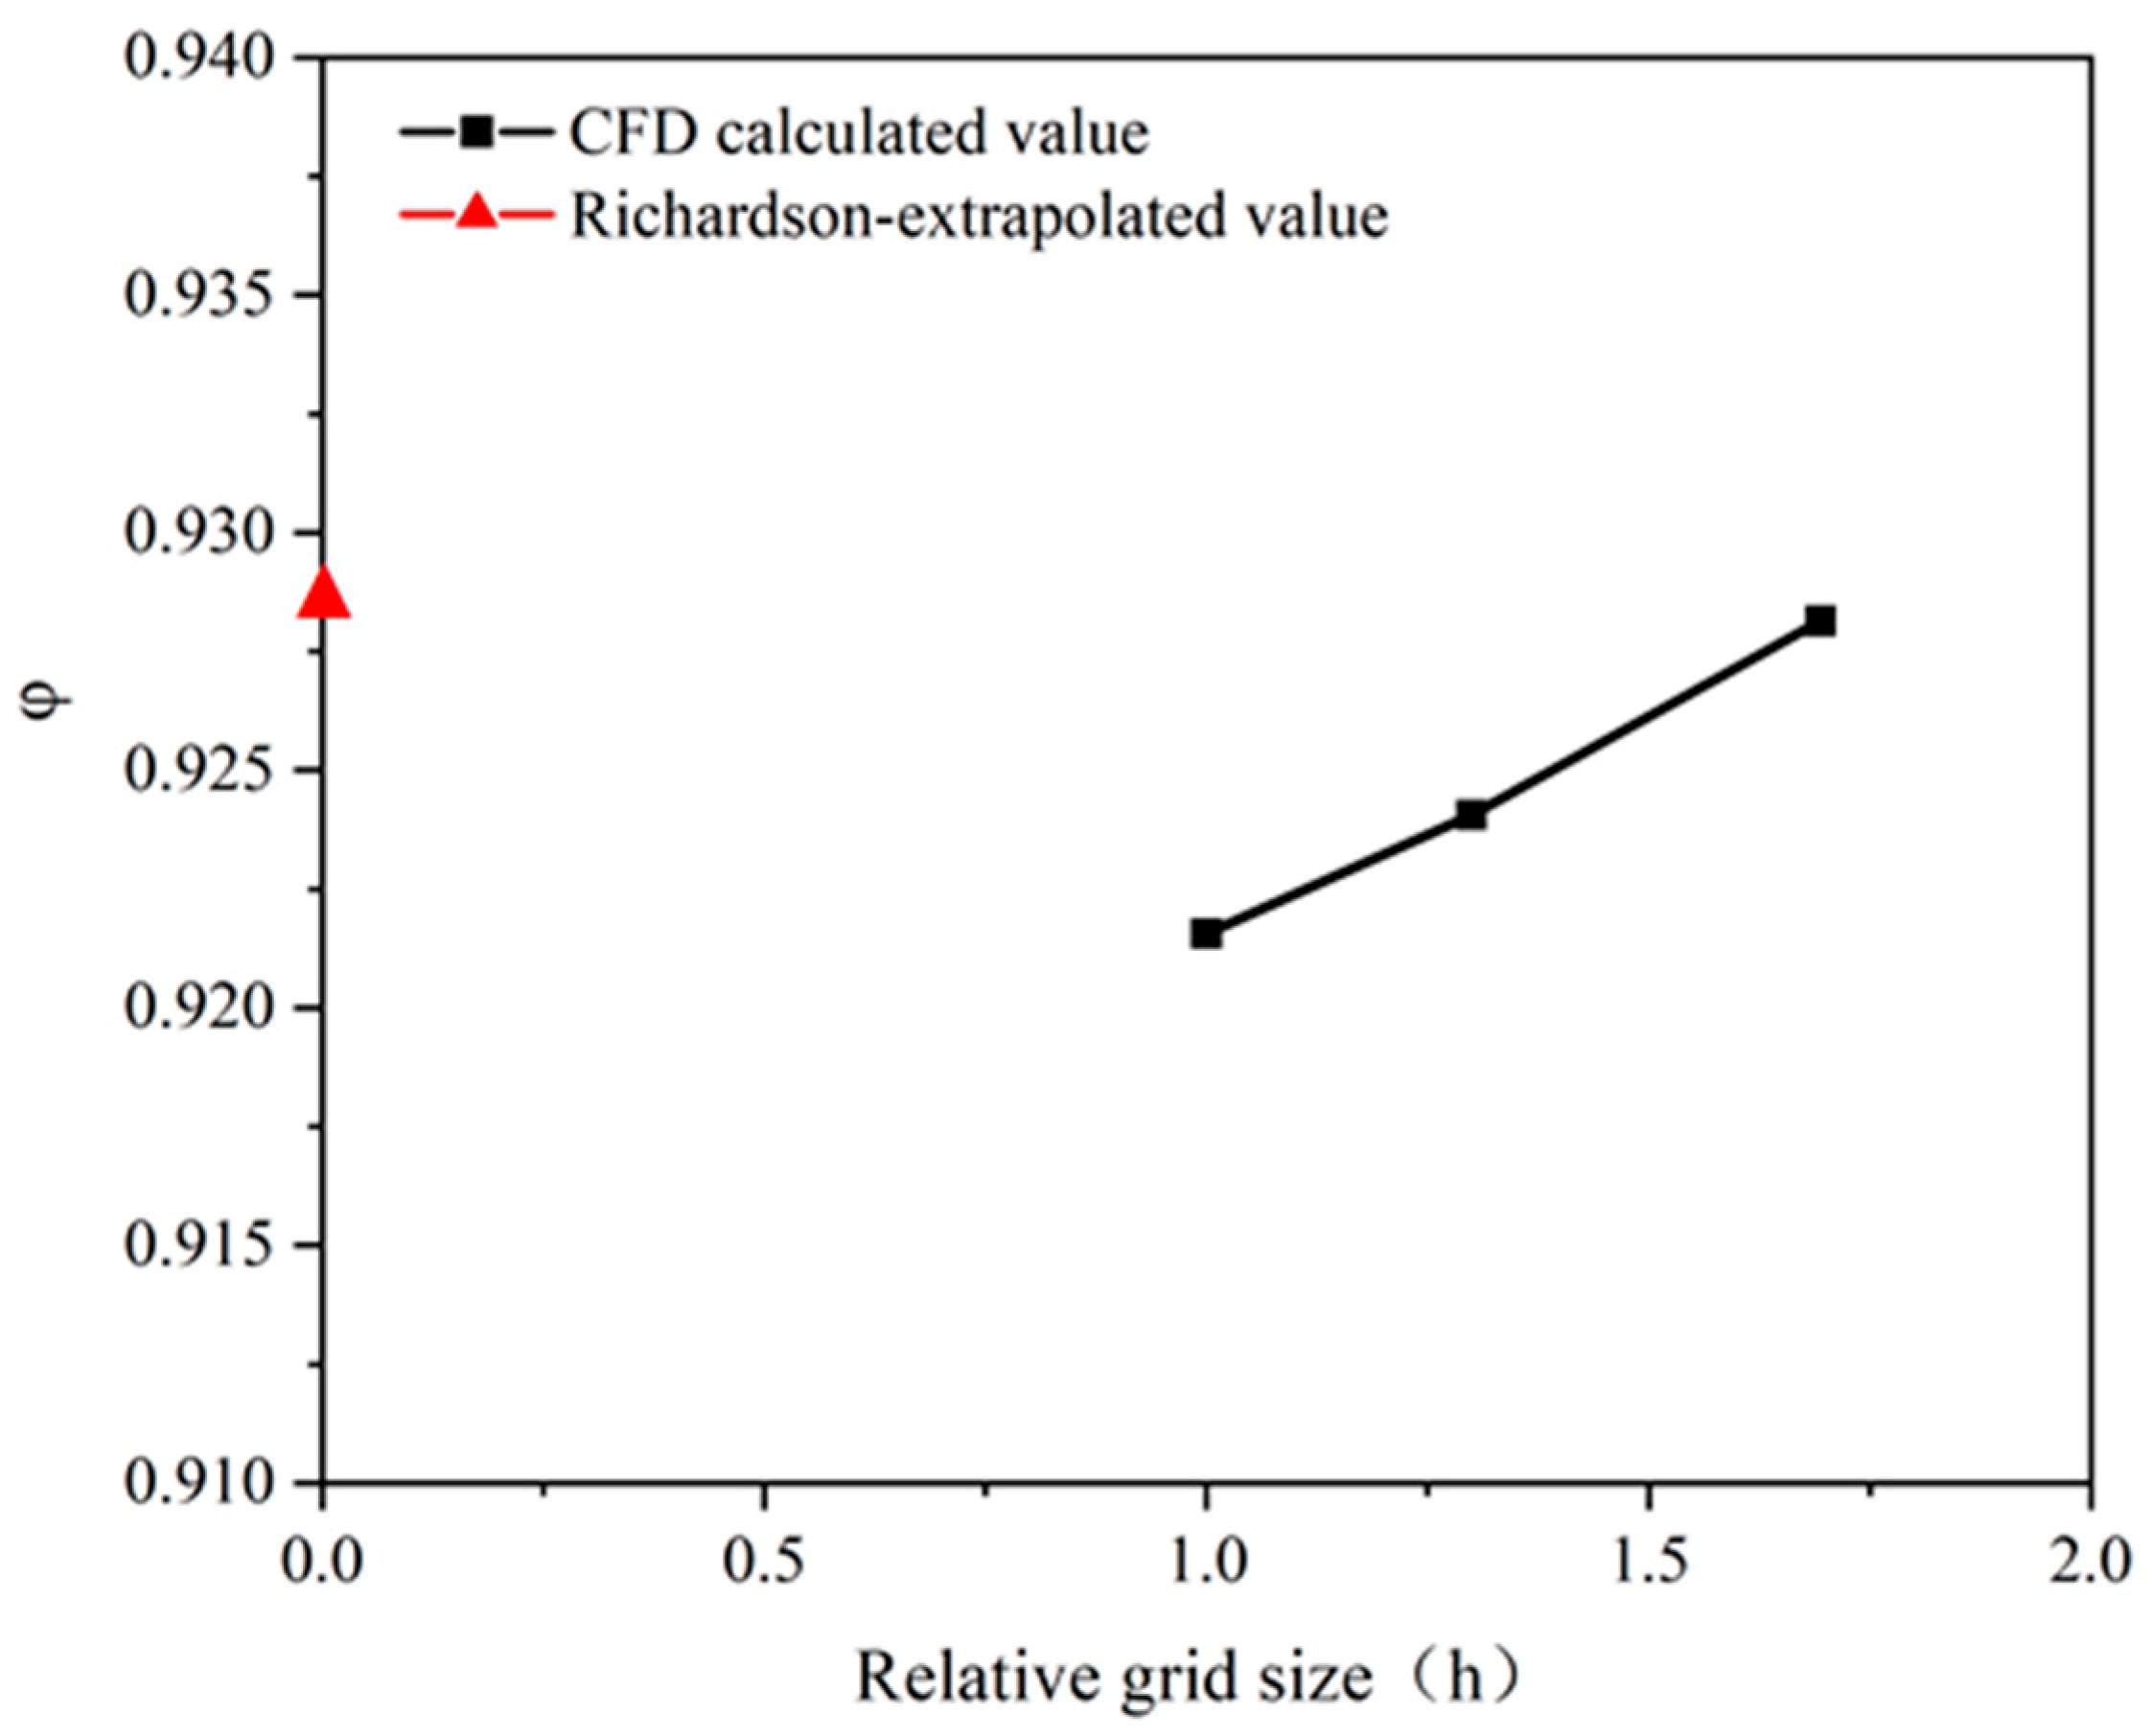
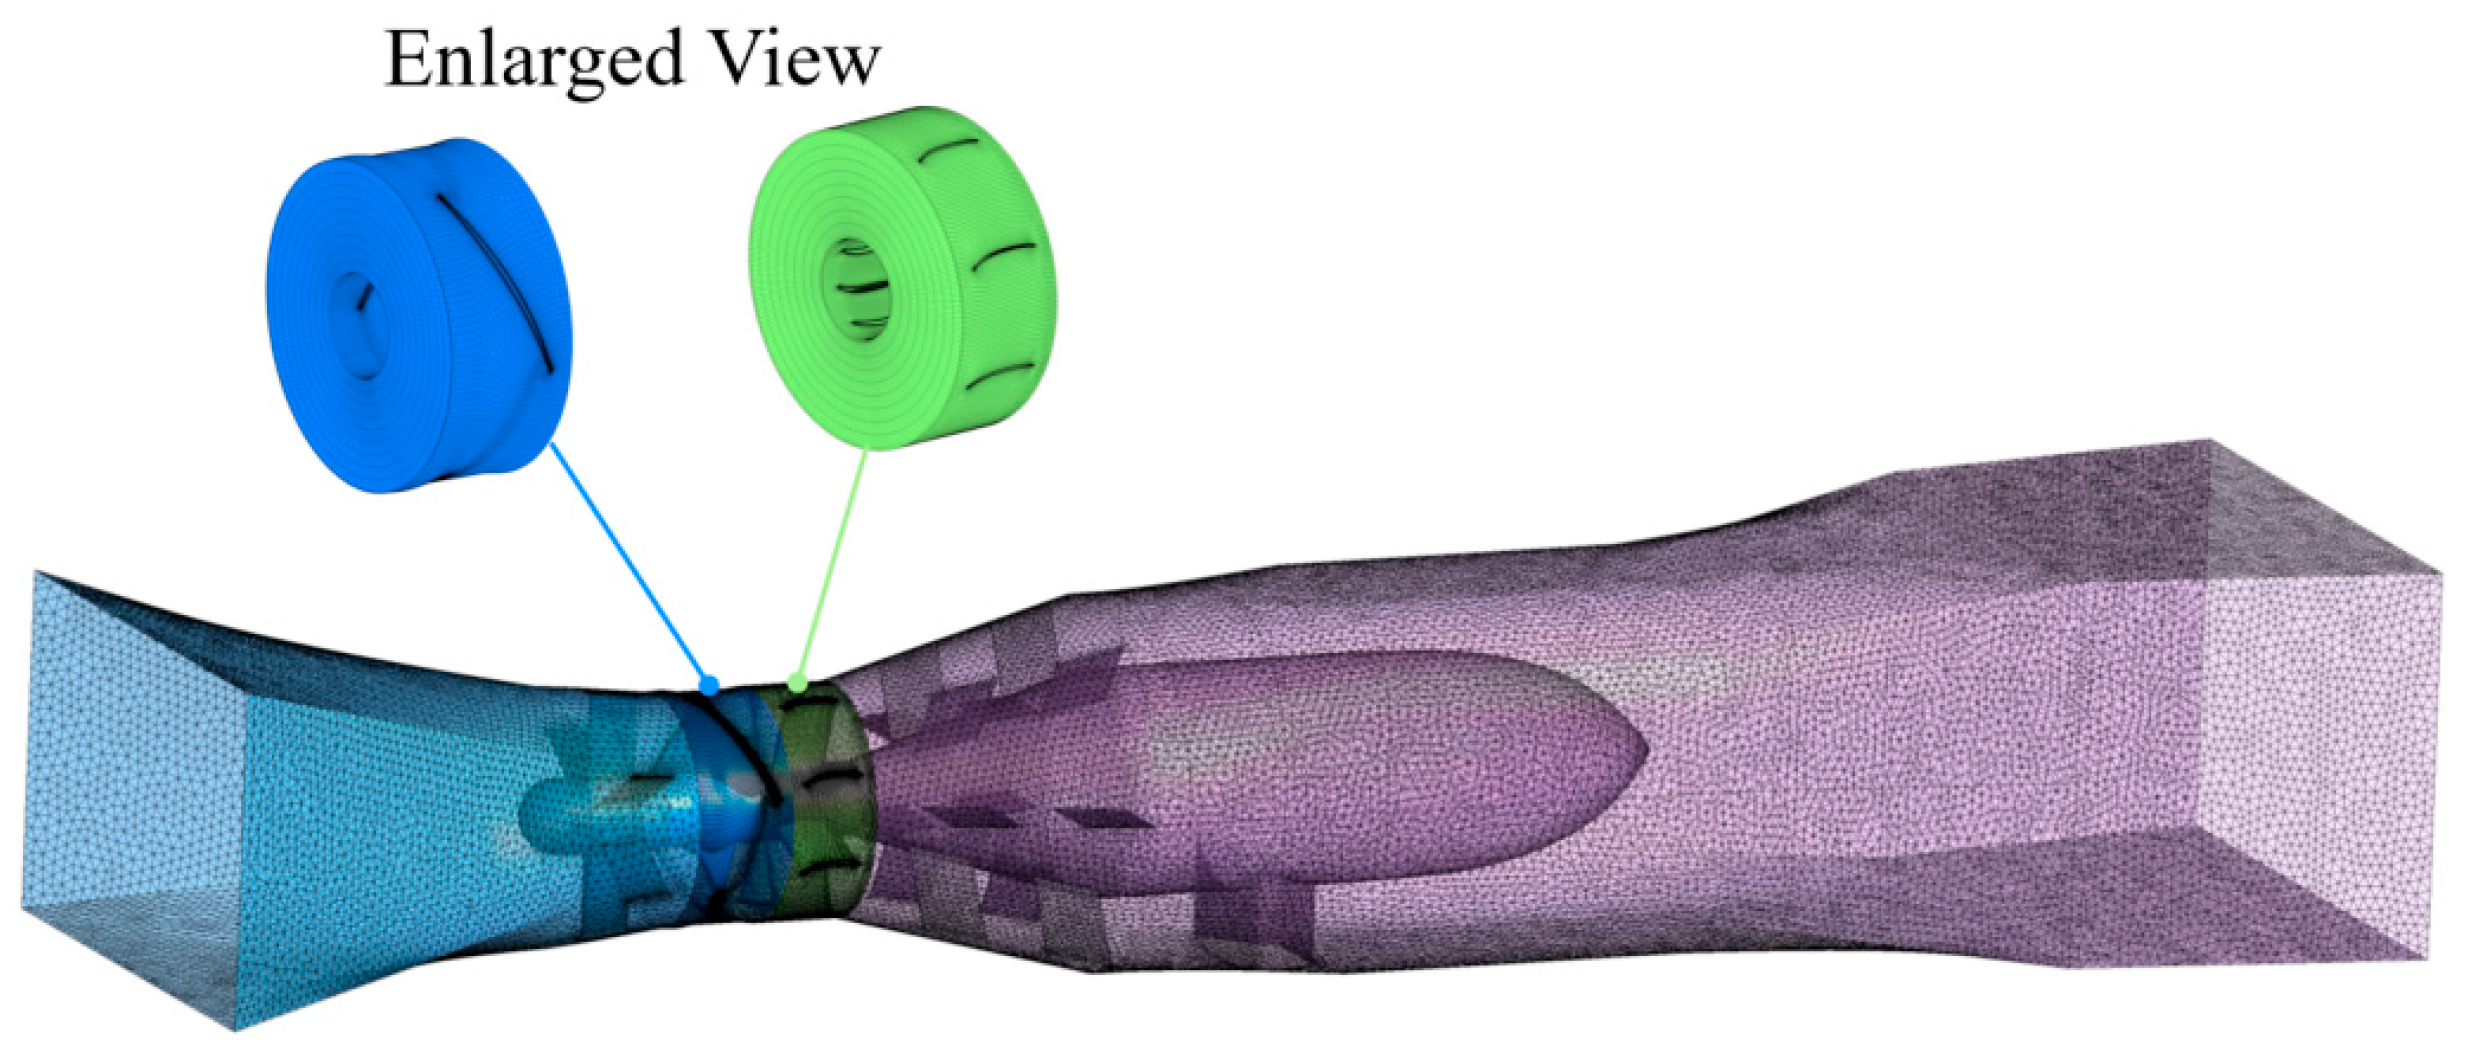
ICEM CFD is used for grid division. In order to balance the accuracy and computational consumption, it is necessary to analyze the error of the grid. In this paper, the grid convergence index (GCI) criterion based on the Richardson extrapolation method is used to divide the refined grid N1, medium grid N2, and coarse grid N3 schemes. In Table 2, N1, N2, and N3 represent the number of grids in three different computational grids, and φ1, φ2, and φ3 are the impeller efficiency simulated under three different grids. Considering the computational resources and time cost, when the grid scheme is N2 = 3,115,311, the error meets the general requirements, so it is selected as the final scheme, as shown in Table 3. Figure 2 shows the grid independence check, that is, the change in parameters in the process of increasing the number of grids. Figure 3 presents the grid scheme selected as the final version for numerical simulations.

2.5. Solver Control

The flow field was analyzed using the multiple reference frame (MRF) model, where the impeller was assigned to the rotating reference frame while the remaining computational domains were defined as stationary. The inlet of the suction pipe was specified as a flow rate inlet boundary, with the specific flow rate value determined by the operating condition. The outlet was set as a pressure outlet boundary with a relative pressure of 0 Pa. All other solid walls were treated as no-slip wall boundaries. The interfaces between different computational domains were connected to enable data transfer across domains.
The internal flow within the tubular pump is incompressible turbulent flow, which can be described by the N-S equations and the continuity equation. In this study, the commercial CFD software ANSYS CFX 12.0 was used to numerically solve the full flow field of the tubular pump device. The frozen rotor method was adopted for steady-state calculations, with a maximum of 1000 iterations set. The convergence criterion was that the root mean square (RMS) residuals of the momentum equations and continuity equation were less than 1 × 10⁻⁵. Based on the steady-state simulation results, unsteady calculations were performed to support the analysis based on the steady-state calculations. The interface adopted the transient rotor–stator type. Building on the steady-state results, 10 impeller rotation cycles were calculated, with the convergence of each iteration set to RMS 1 × 10⁻⁵. The number of iterations per step ranged from a minimum of 3 to a maximum of 10.

3. Model Test

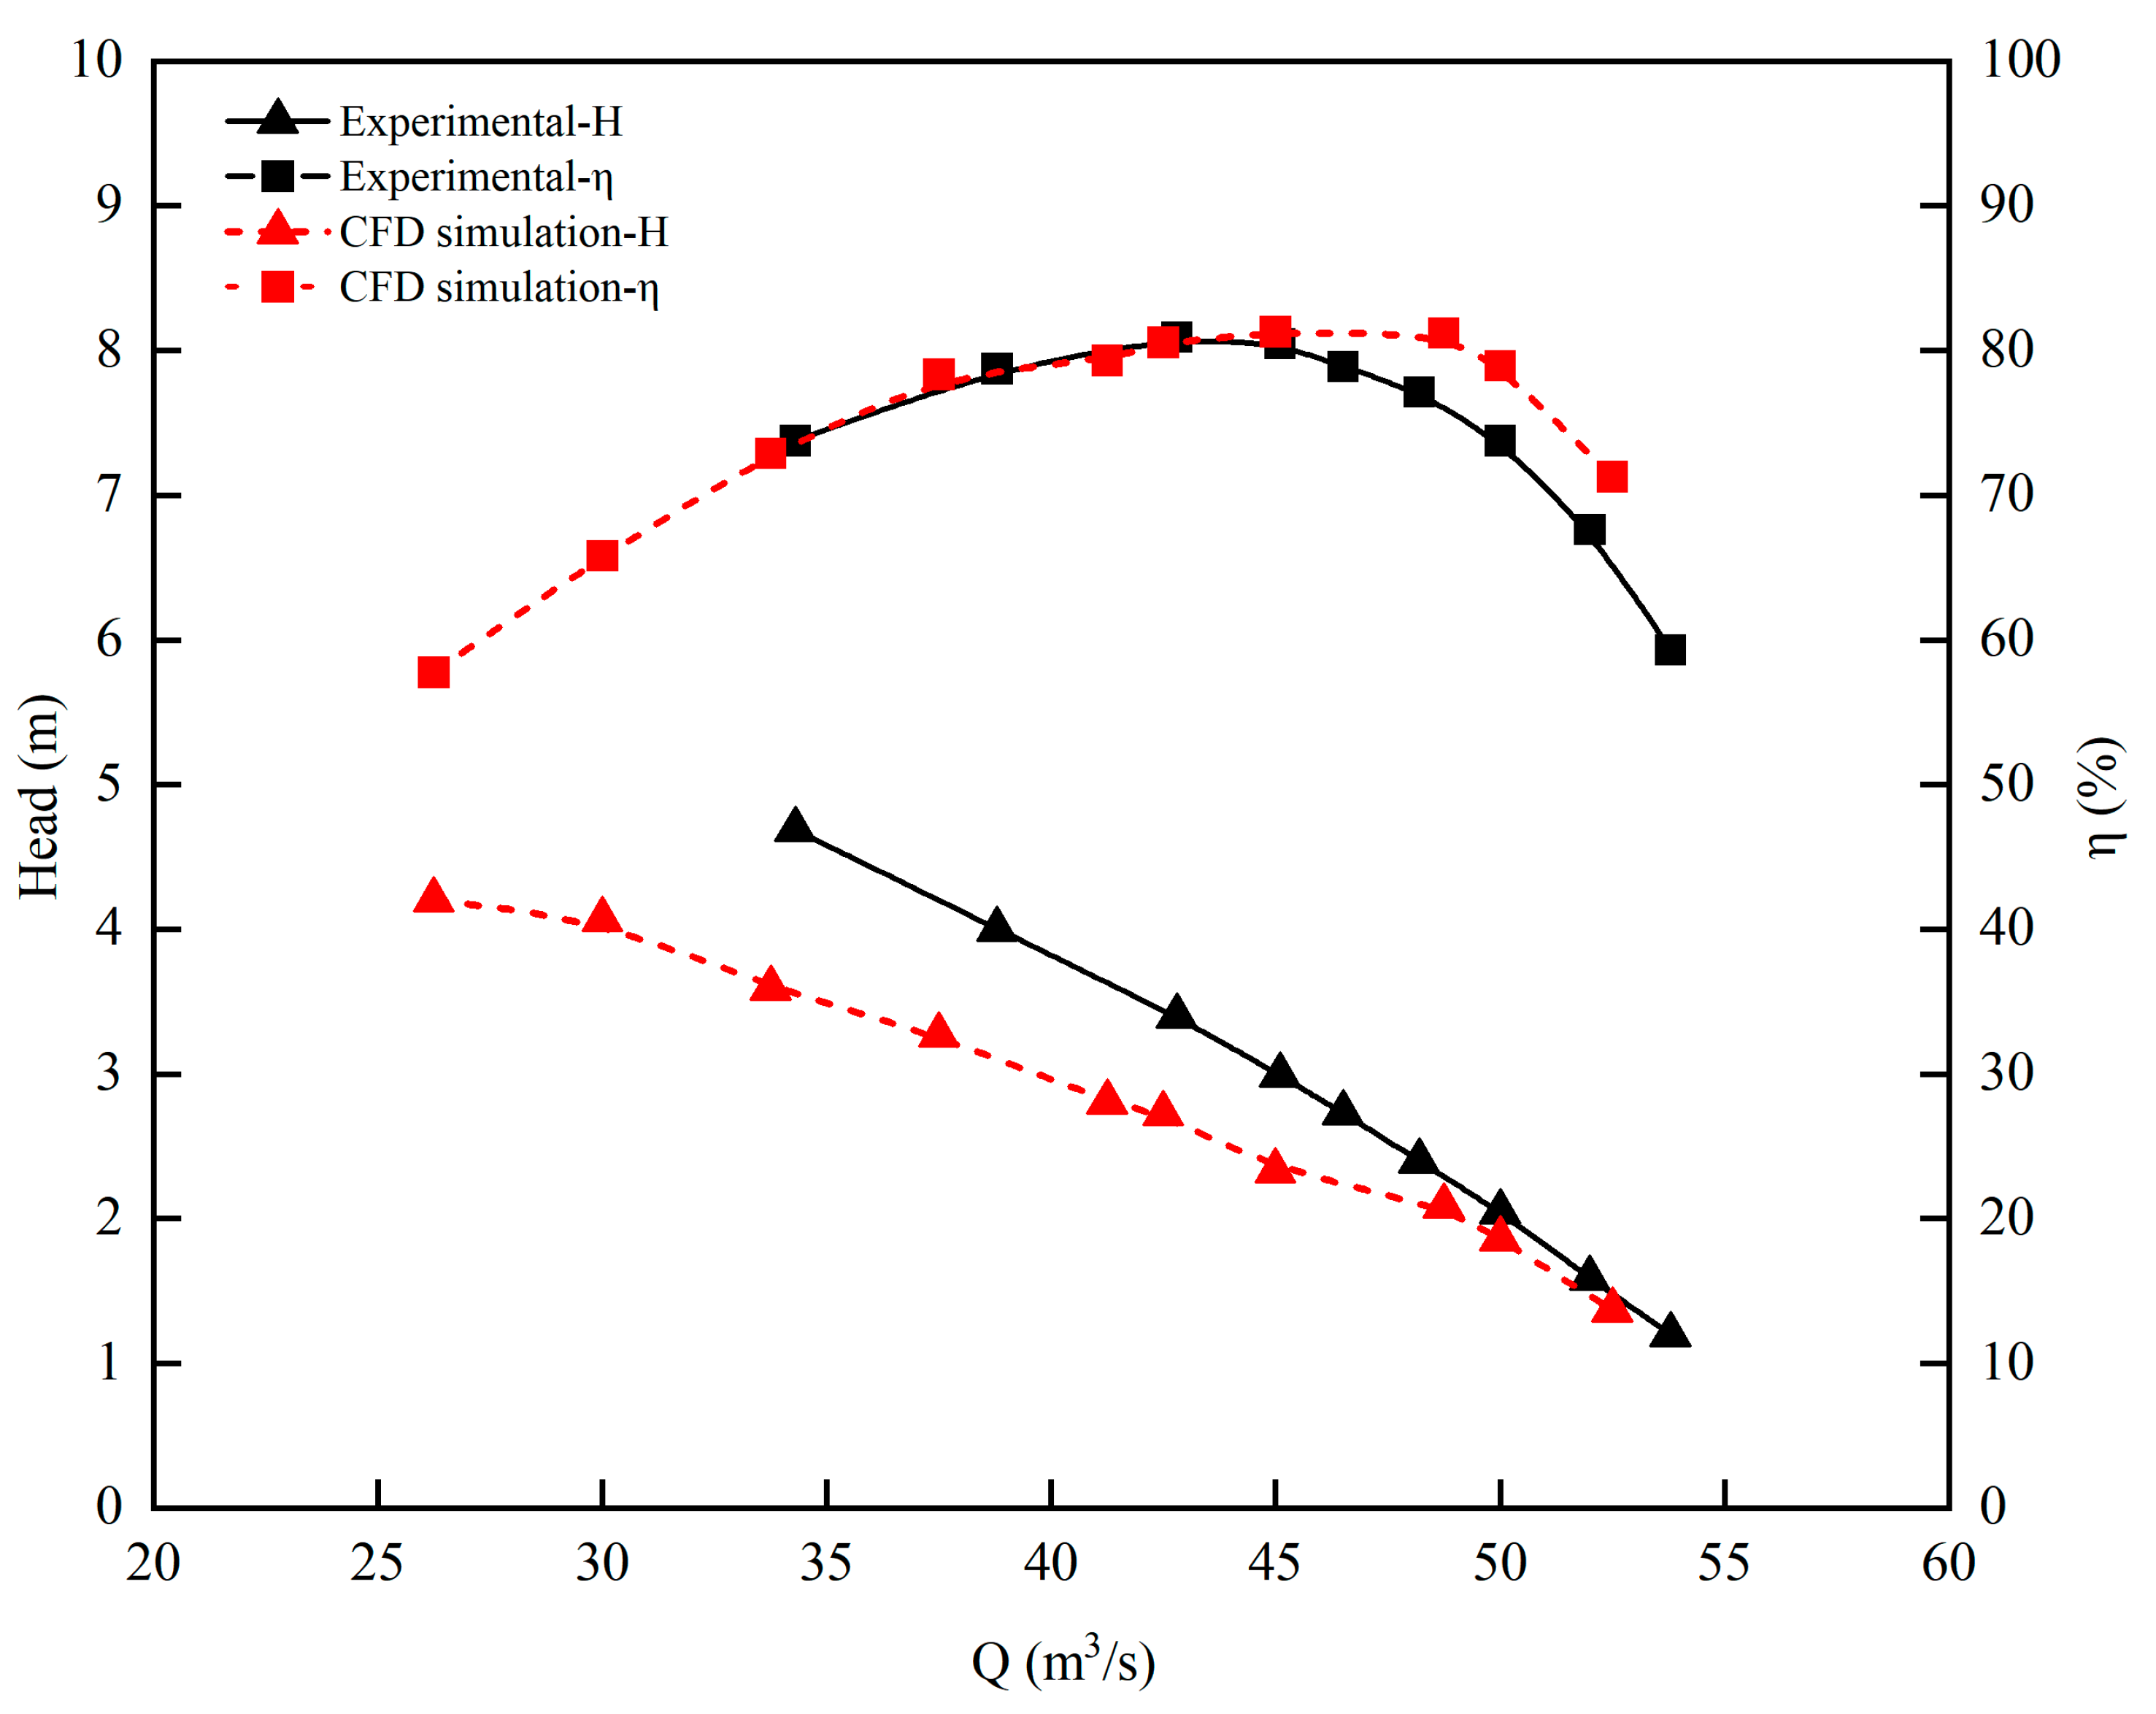
Figure 4 shows the comparison curves between the simulation results and the experimental results. It can be seen from the analysis that the head and efficiency data obtained by simulation are basically consistent with the experimental data. The maximum error is within 5%, indicating that the simulation results of the bulb tubular pump are effective and reliable.
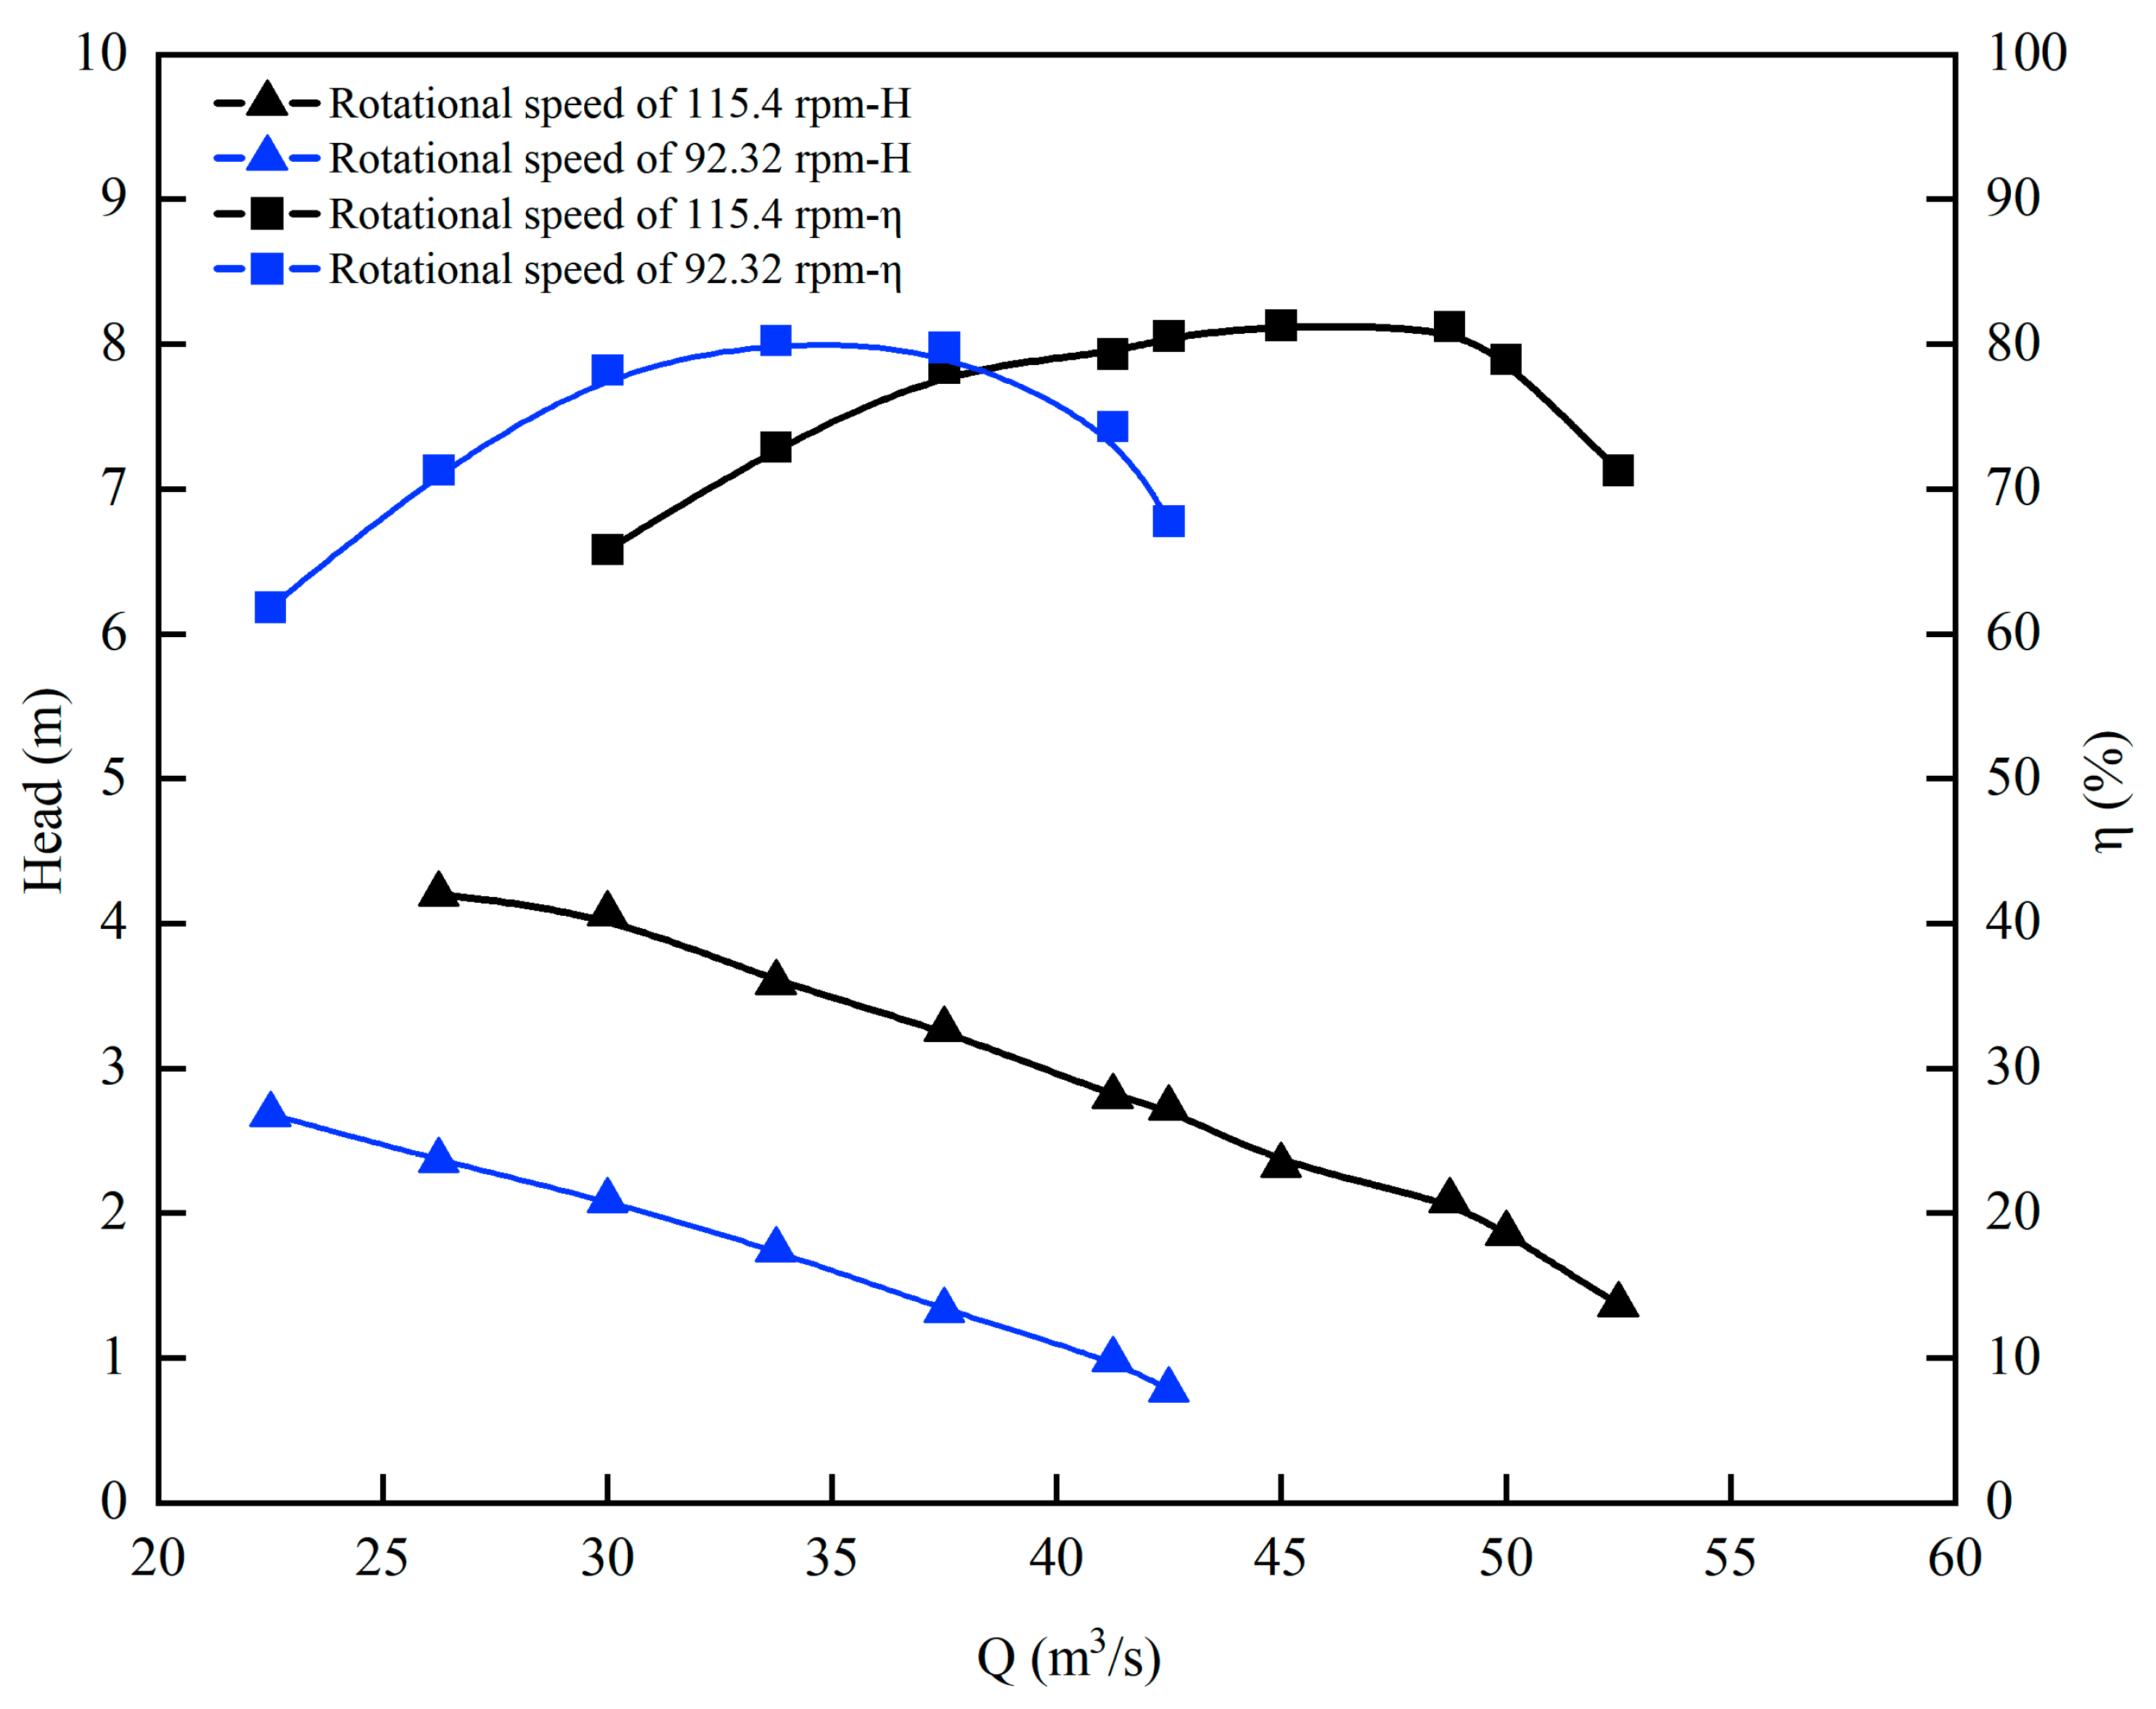
As shown in Figure 5, both the head and efficiency curves of the pump under the two rotational speeds exhibit typical variation characteristics: the efficiency first increases and then decreases with the rise in flow rate. At a rotational speed of 115.4 r/min, the efficiency within the monitored range reaches its peak at a flow rate of 45 m3/s; at 92.32 r/min, the optimal efficiency occurs at a flow rate of 33.75 m3/s. With a further increase in flow rate, the efficiency under both operating conditions shows a significant decreasing trend. It can thus be concluded that the optimal operating point shifts toward the low-flow range as the rotational speed decreases.
In terms of the variation law of head, the head under both rotational speeds shows a monotonically decreasing trend with increasing flow rate, and the overall head within the monitored range is lower under the low rotational speed condition. This phenomenon indicates that the system energy loss is smaller, which is consistent with the change in flow resistance characteristics caused by the reduction in rotational speed.

4. Results and Discussion

In order to explore the spatial distribution and flow characteristics of entropy production in the impeller and guide vane of the tubular pump, this paper selects the local entropy production rate and velocity distribution for the cross-section of 10%, 30%, 50%, 70%, and 90% of the blade height in the impeller and guide vane along the wingspan direction under the working conditions of OP1–OP6.

4.1. Distribution Characteristics of Local Entropy Production Rate Under Different Flow Rates

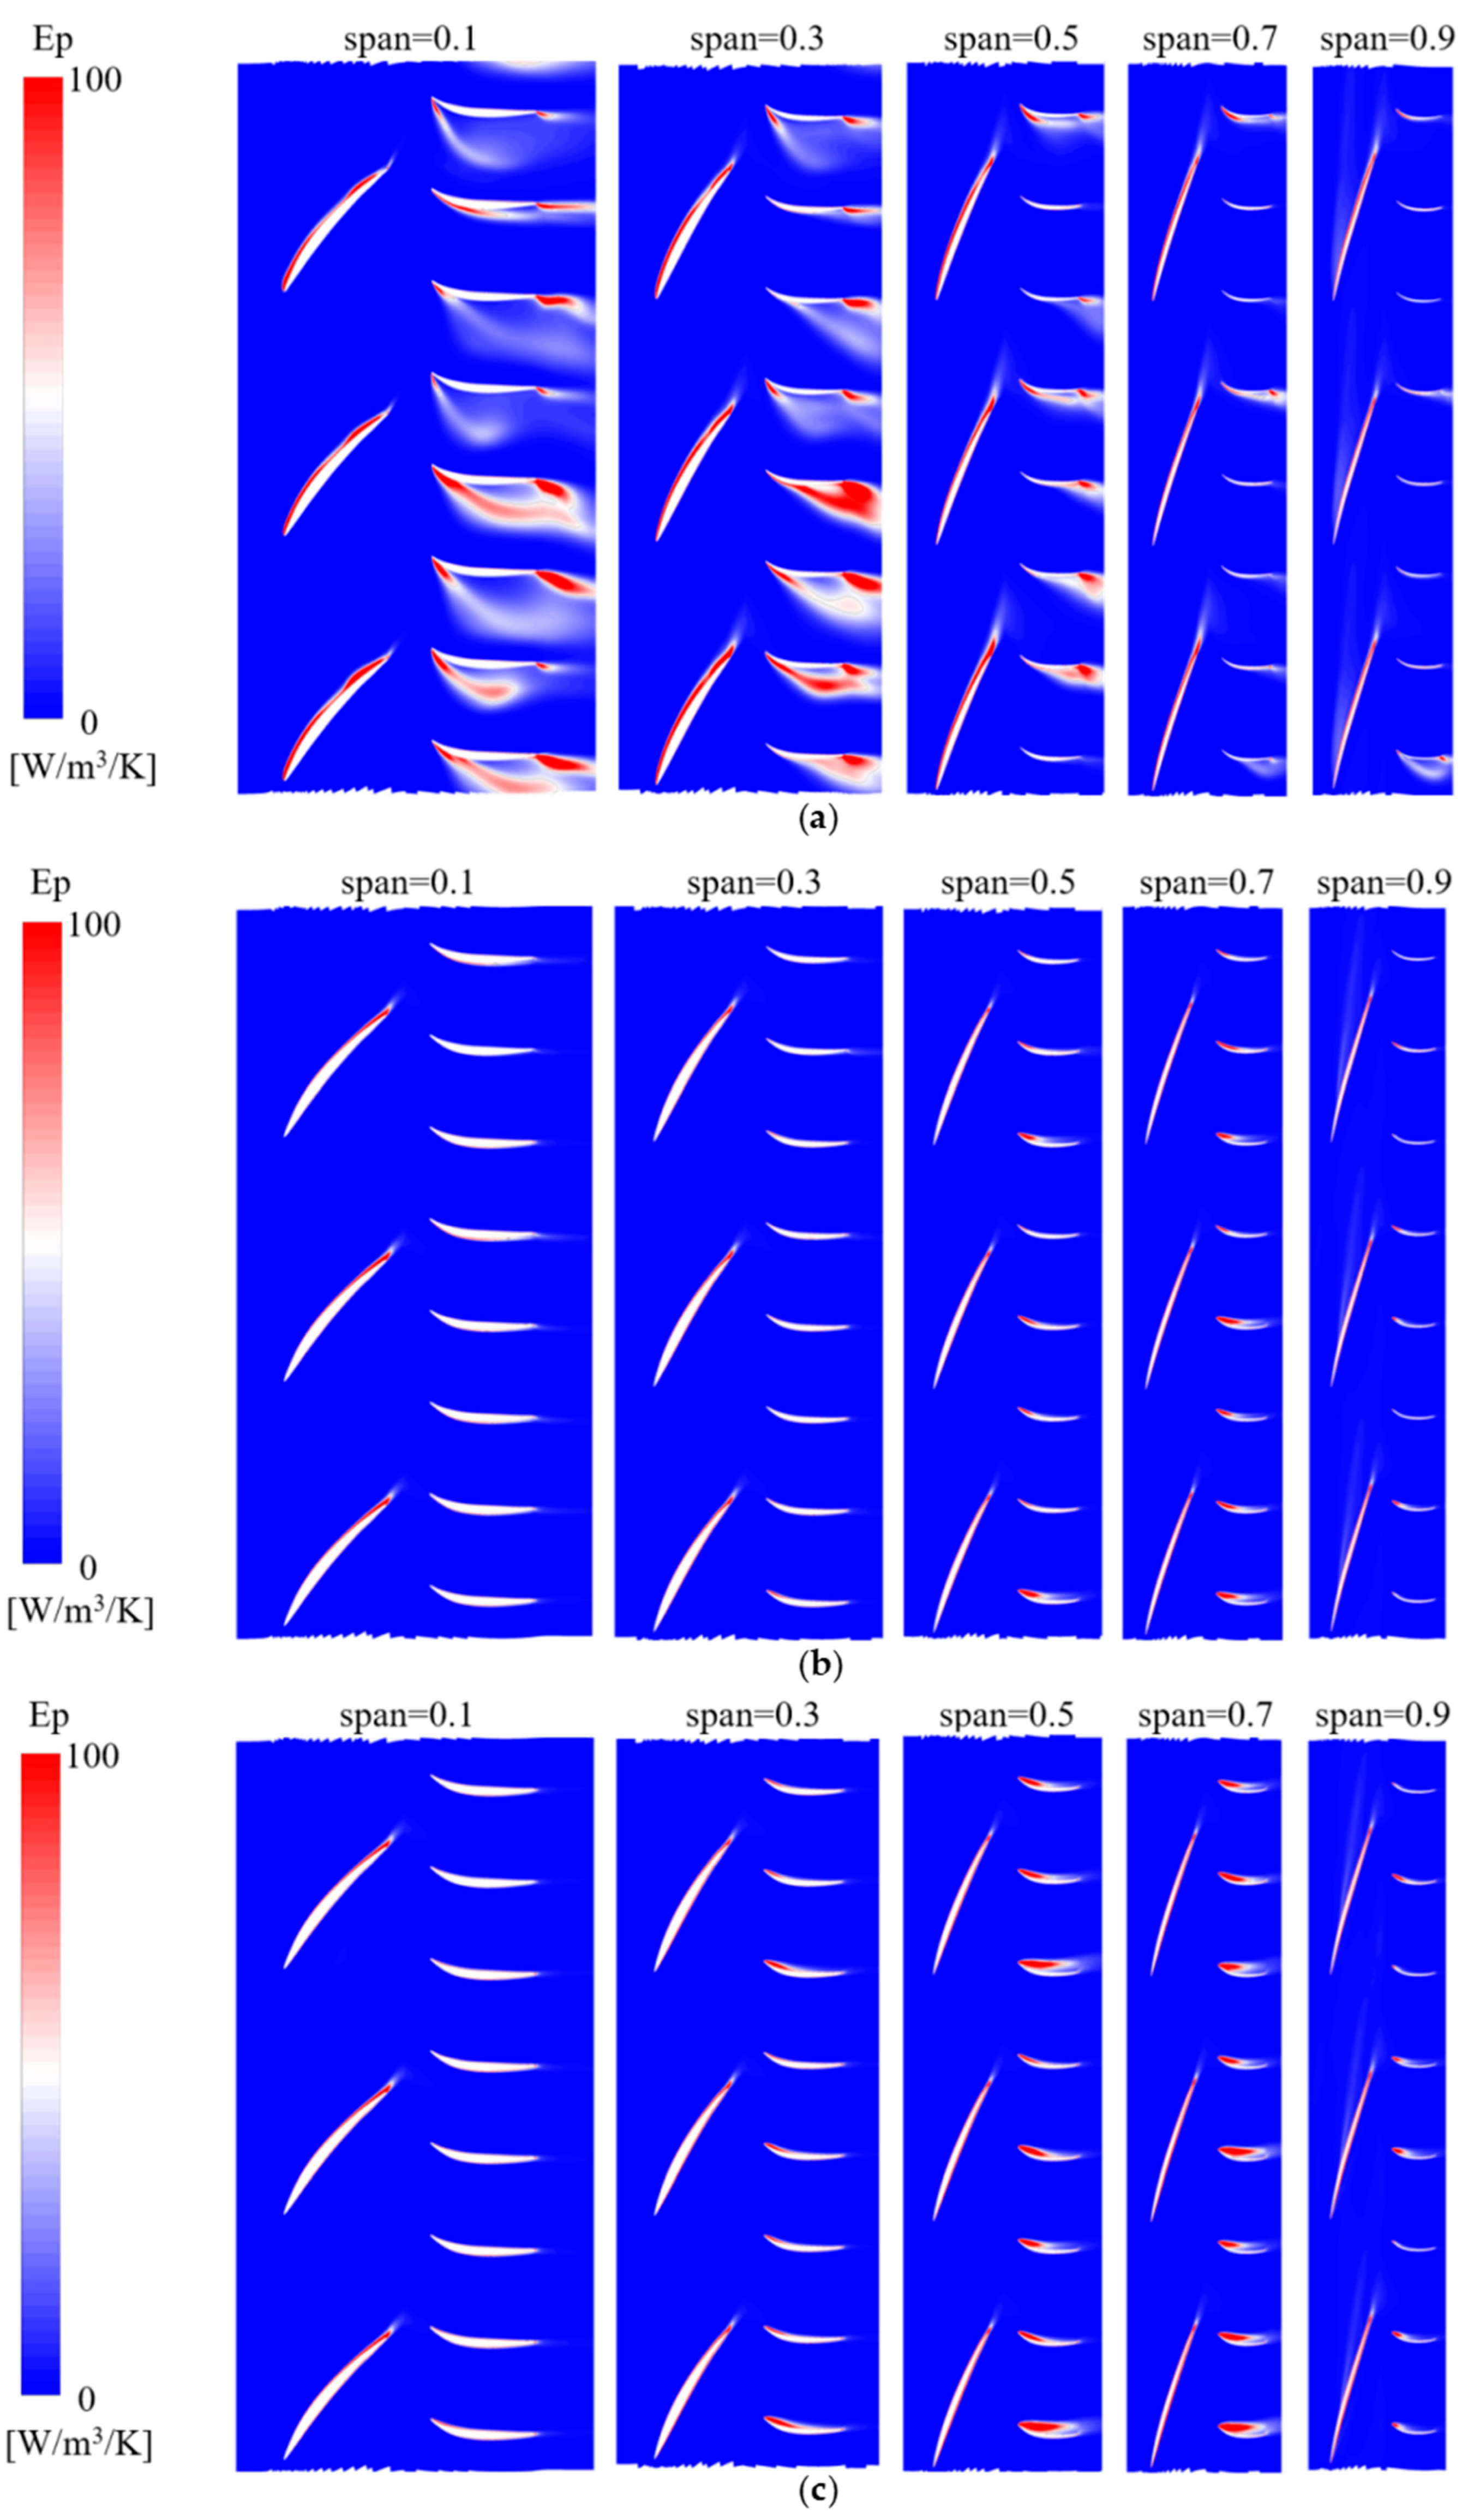
The local entropy production rate distribution of different blade height sections in the impeller and guide vane area under OP1–OP3 conditions is shown in Figure 6 and Figure 7.
Through the analysis of the figure, it is concluded that when the rotation speed is 115.4 r/min, the local entropy yield decreases first and then increases with the increase in the flow rate, and reaches the lowest value at OP2. The results of CFD steady-state analysis also show that the impeller and guide vane efficiency are the highest under this condition, and OP2 can be determined as the optimal working condition at this speed. Compared with OP1 and OP3 conditions, the hydraulic loss of the impeller and guide vane with OP2 conditions is significantly reduced, indicating that the flow rate of the off-design condition has a great influence on entropy production.
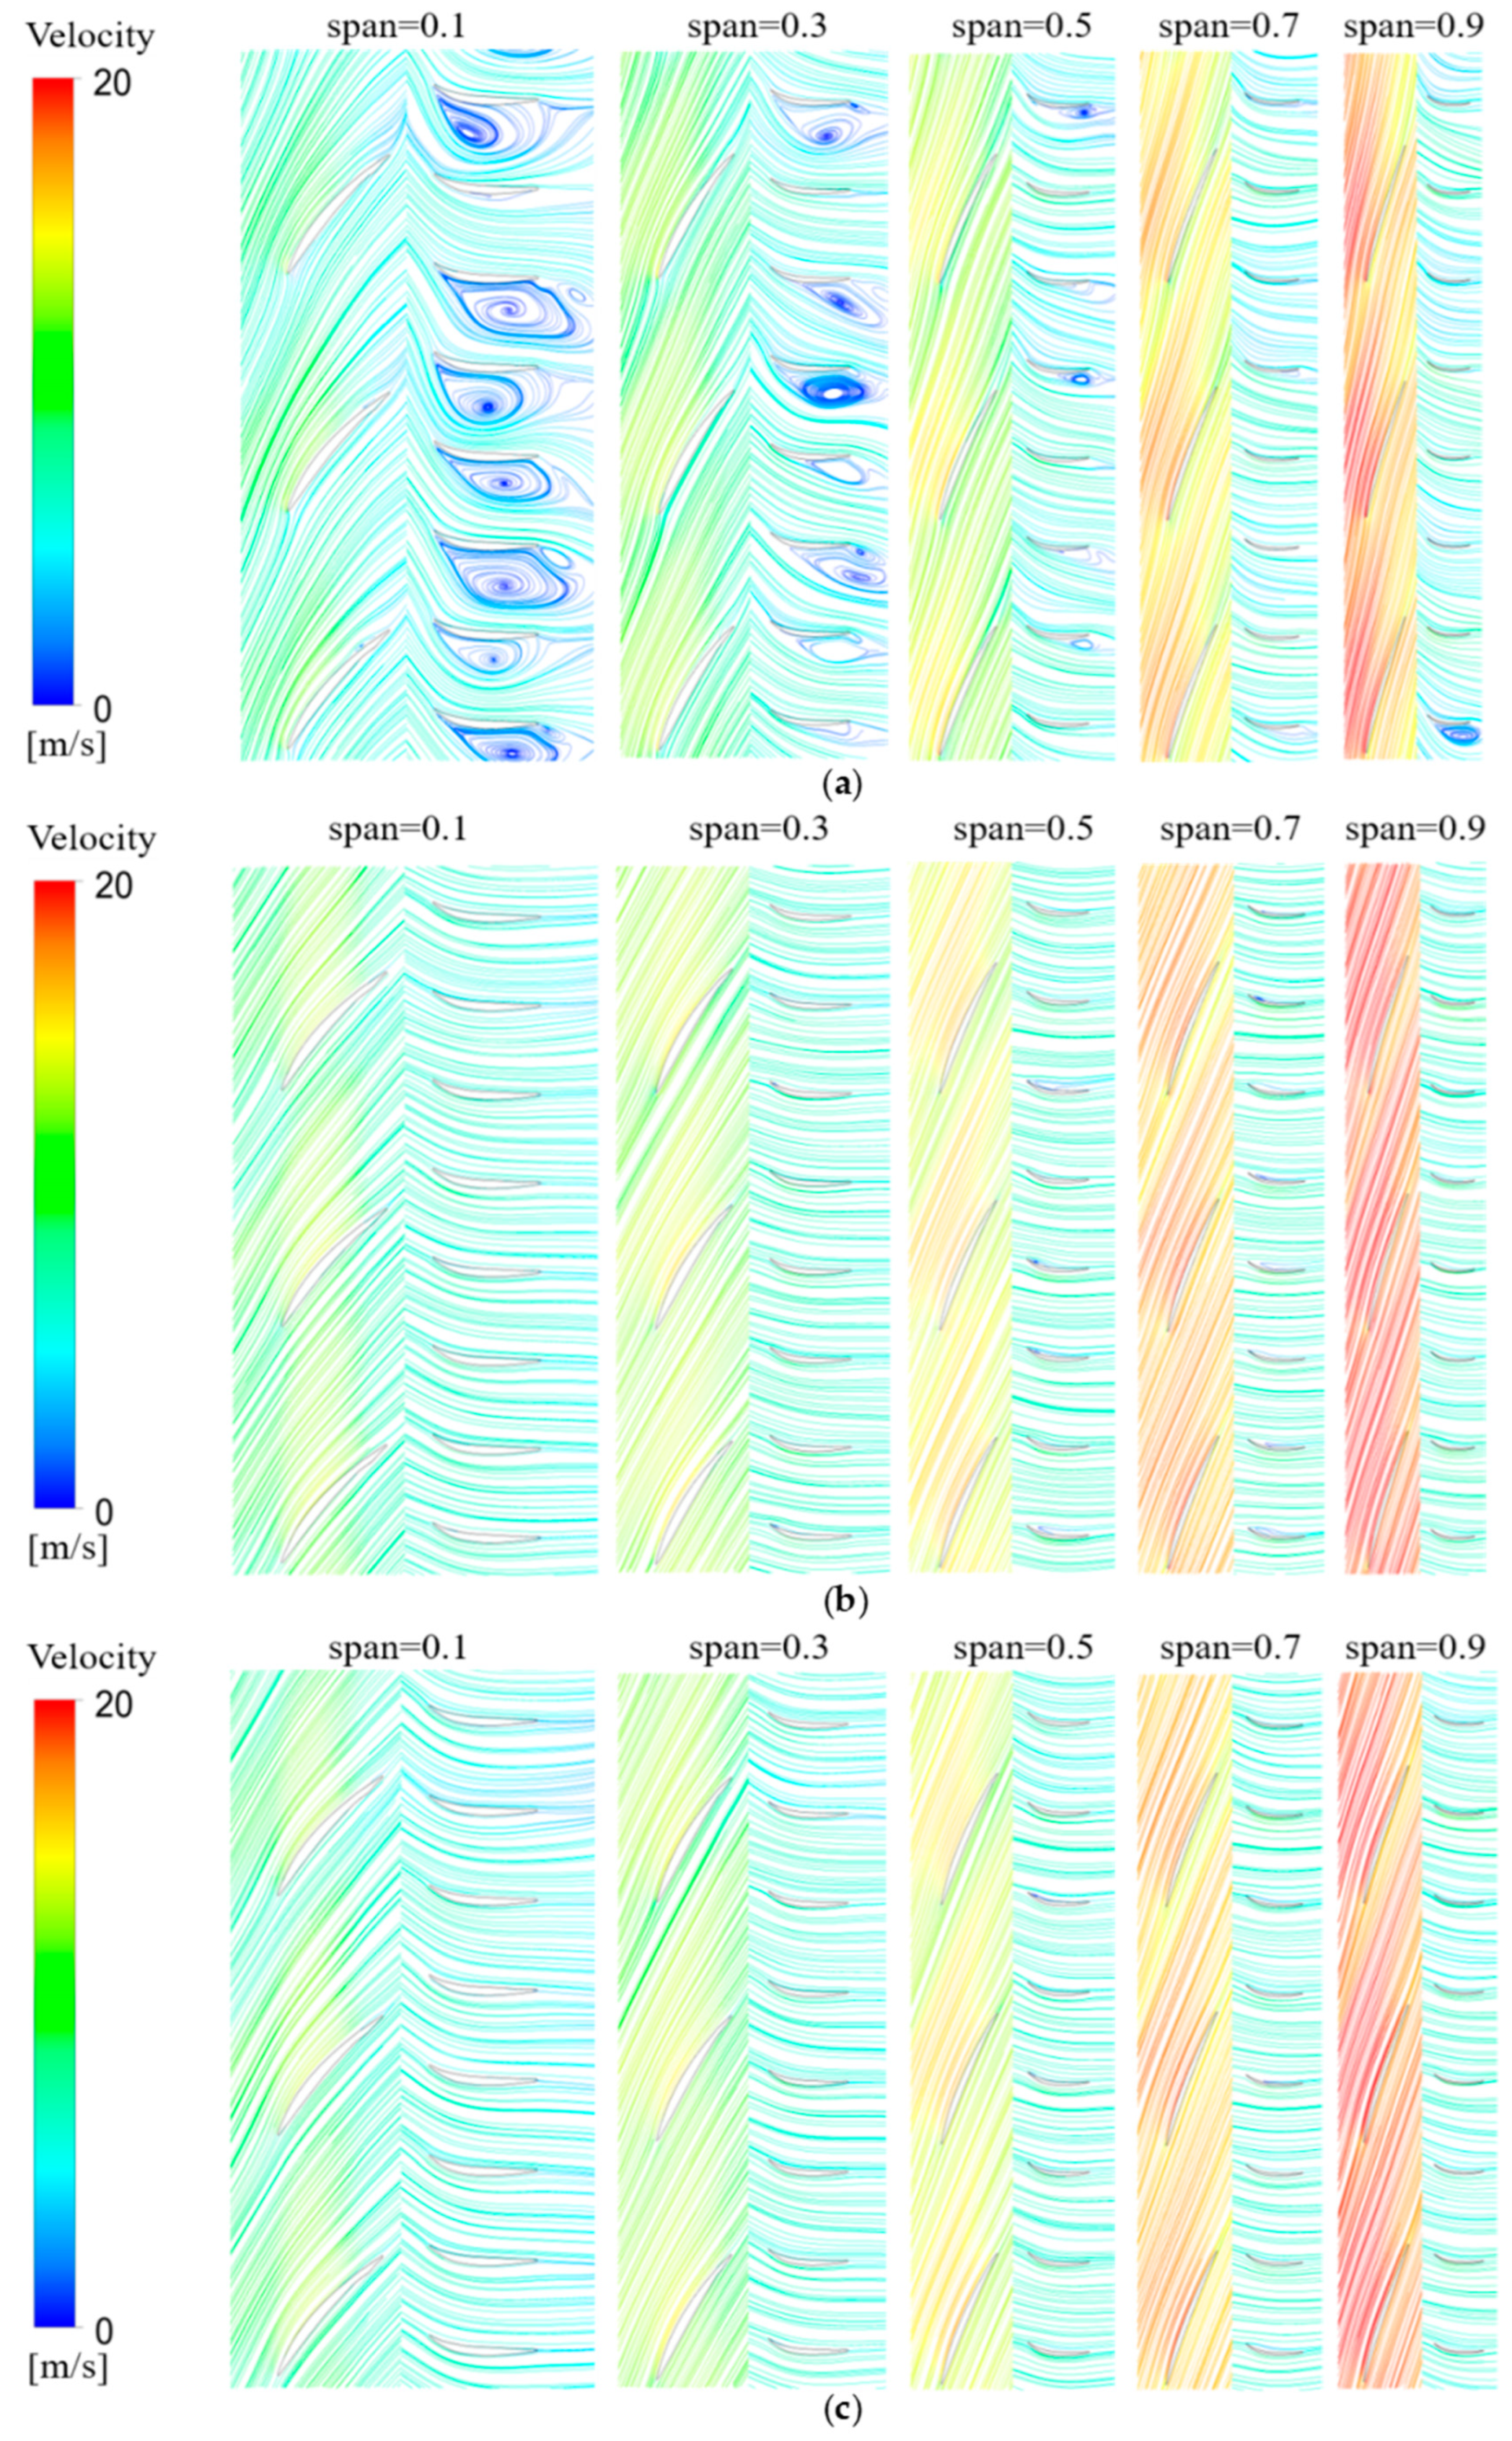
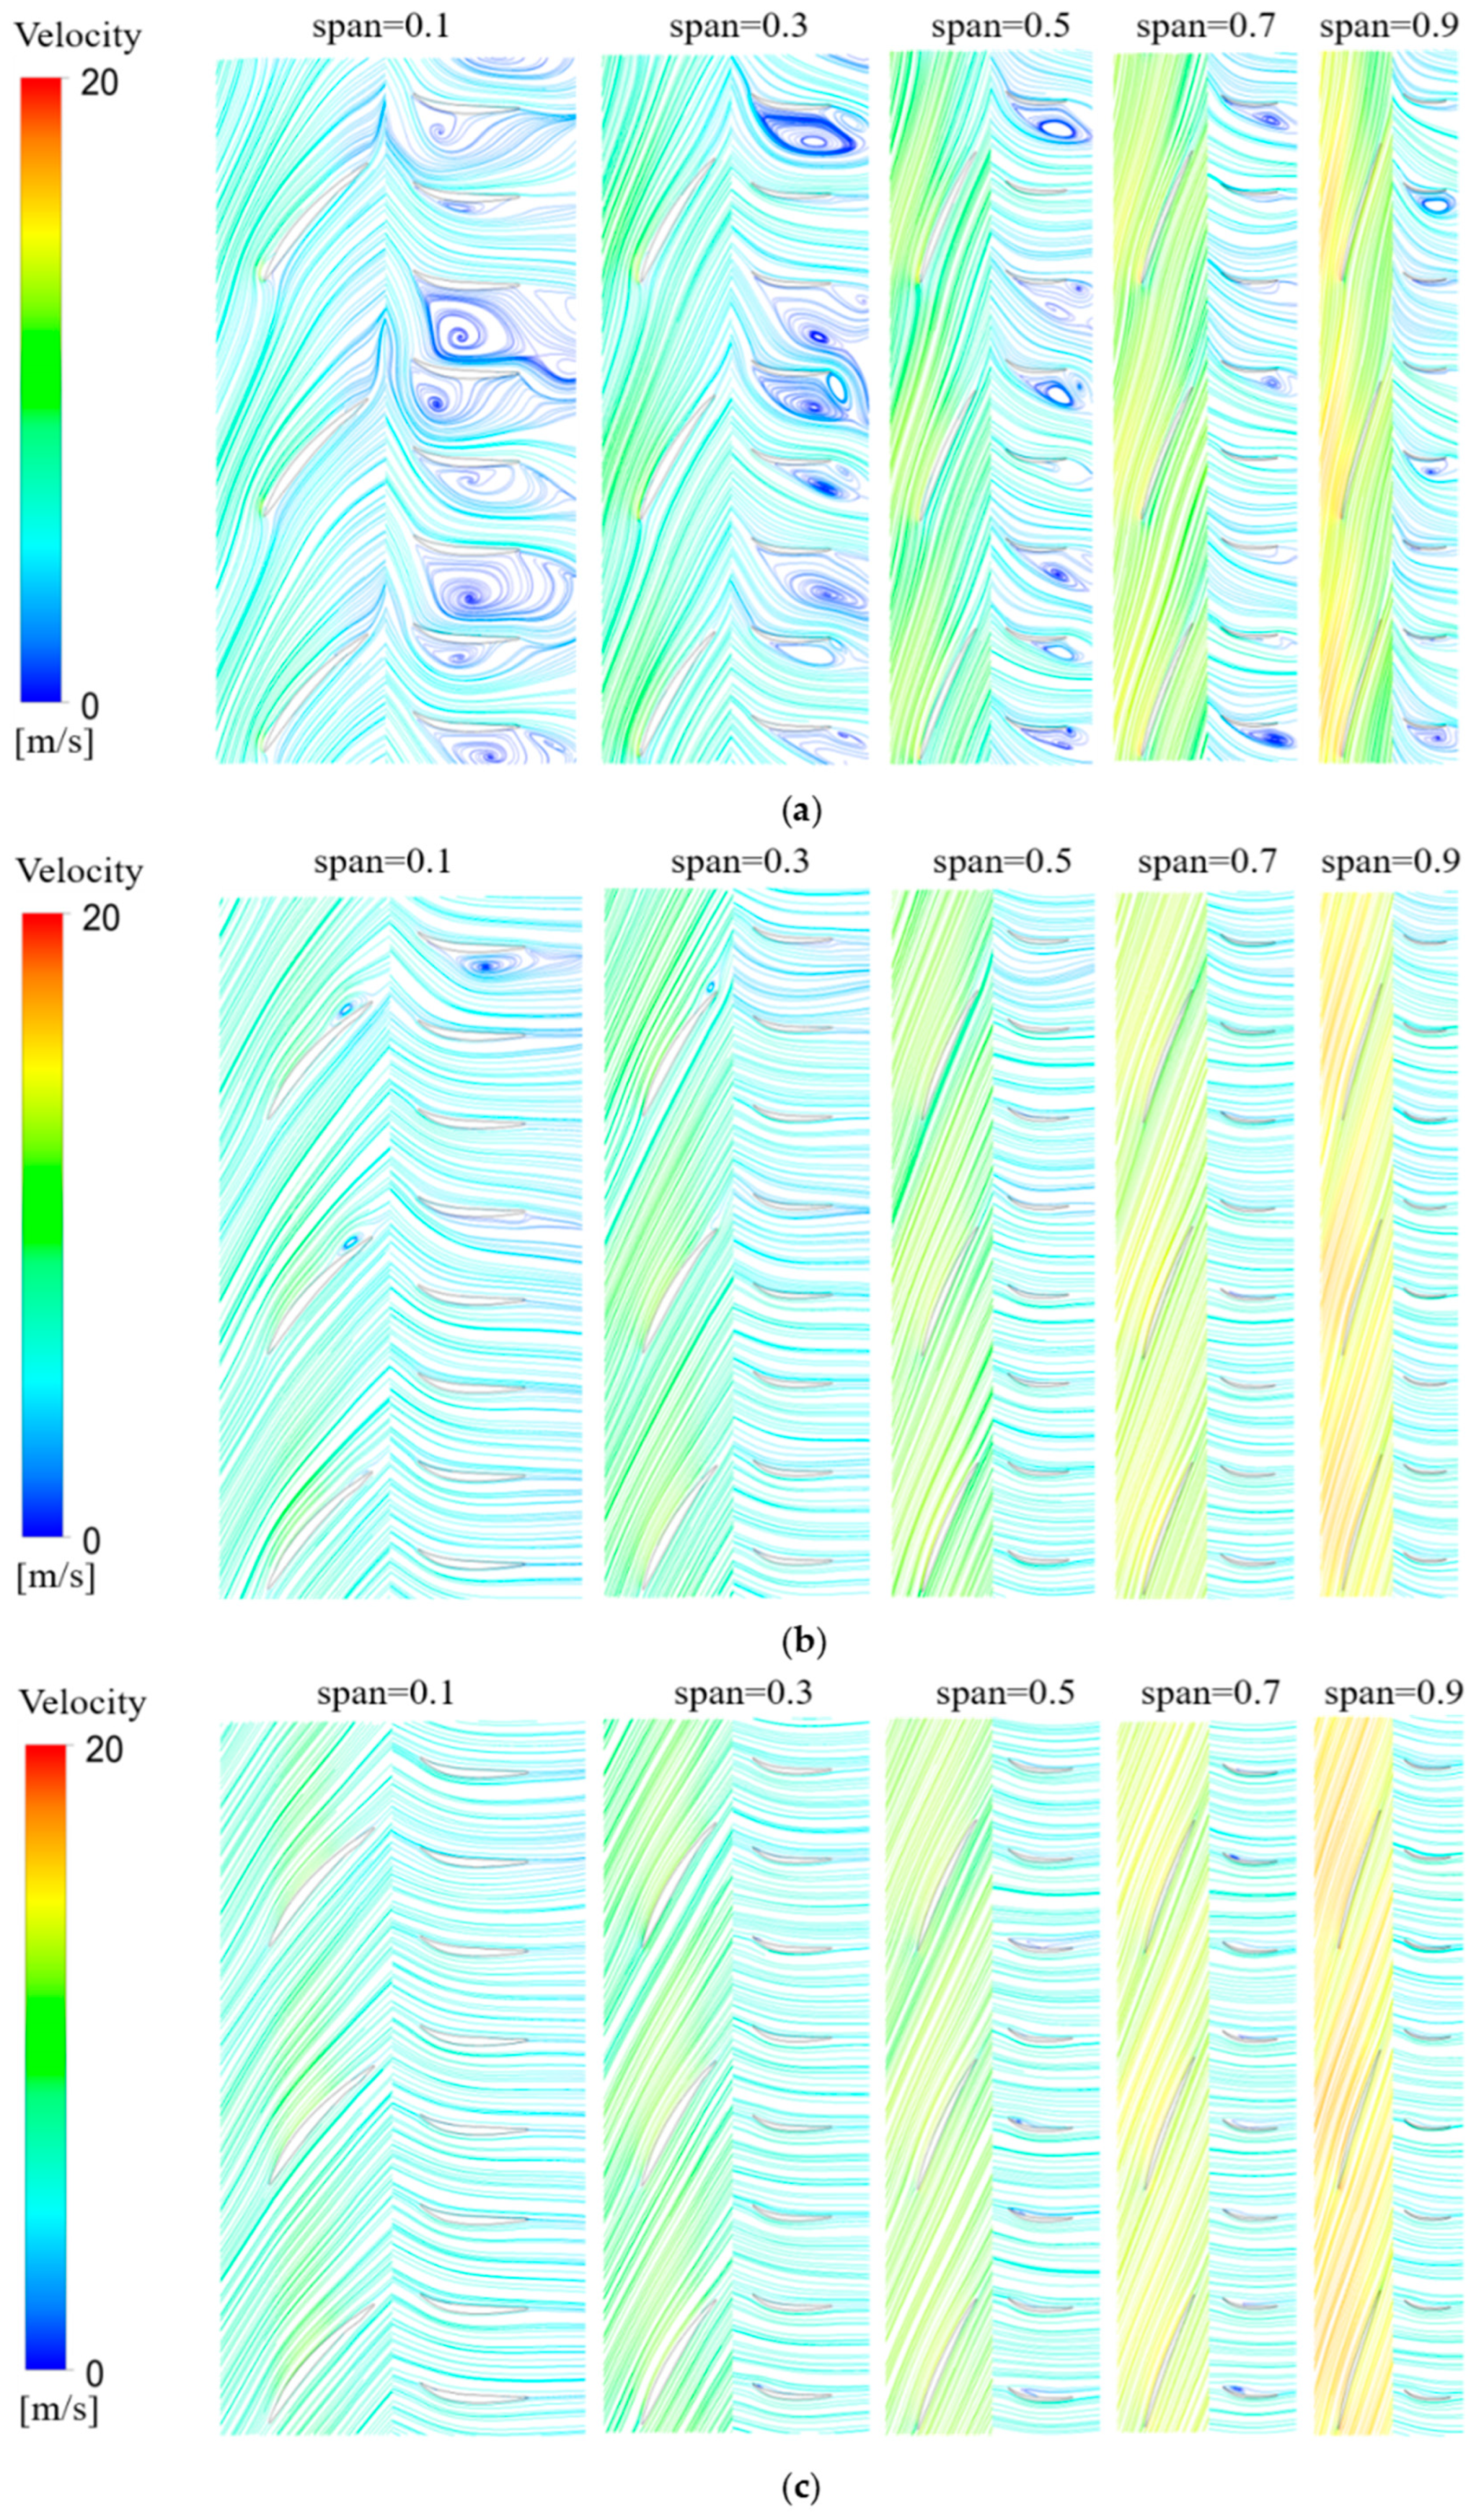
The entropy output value of the OP1 blade wake is high. It is preliminarily speculated that there is a vortex structure at this position. The cause may be due to the combined action of fluid shear and wall friction. In order to identify the location of the vortex, the corresponding flow field distribution map is given as follows: compared with the flow field distribution map, it can be clearly identified that the vortex structure falls in the high-entropy-production area, which confirms that the loss is mainly caused by vortex motion.

4.2. Comparative Distribution of Local Entropy Production Rate at Different Rotational Speeds

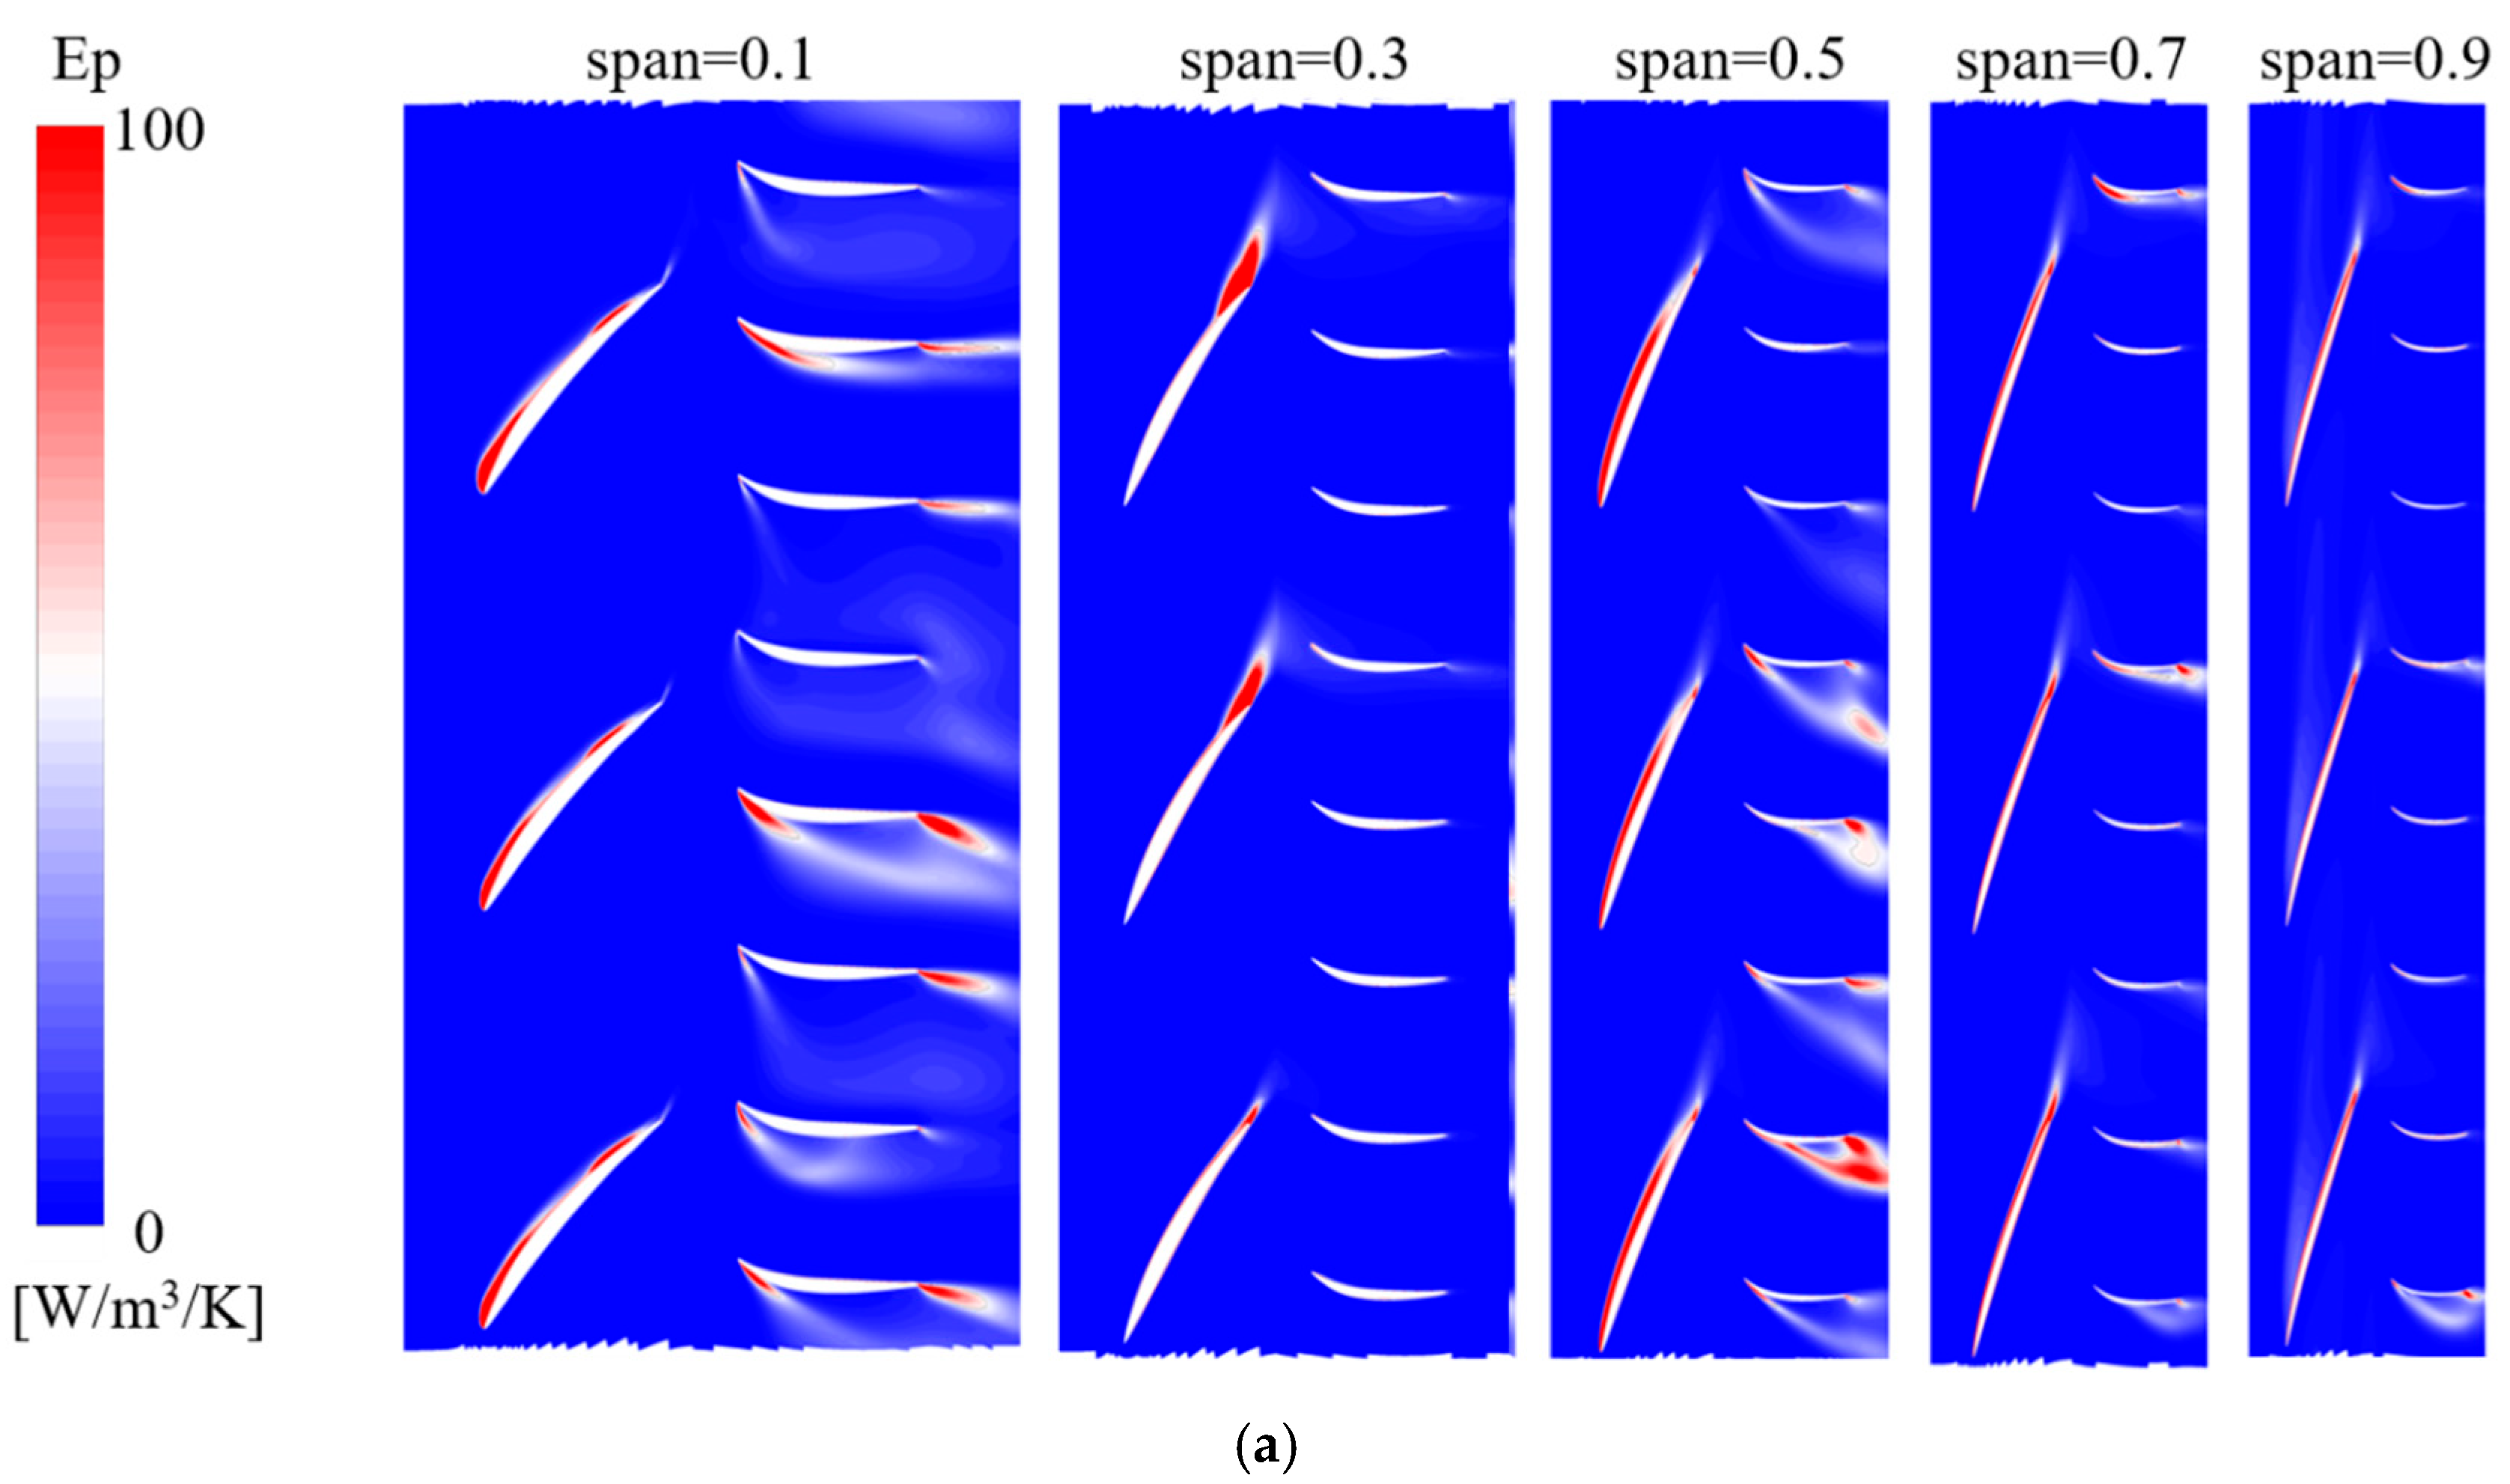
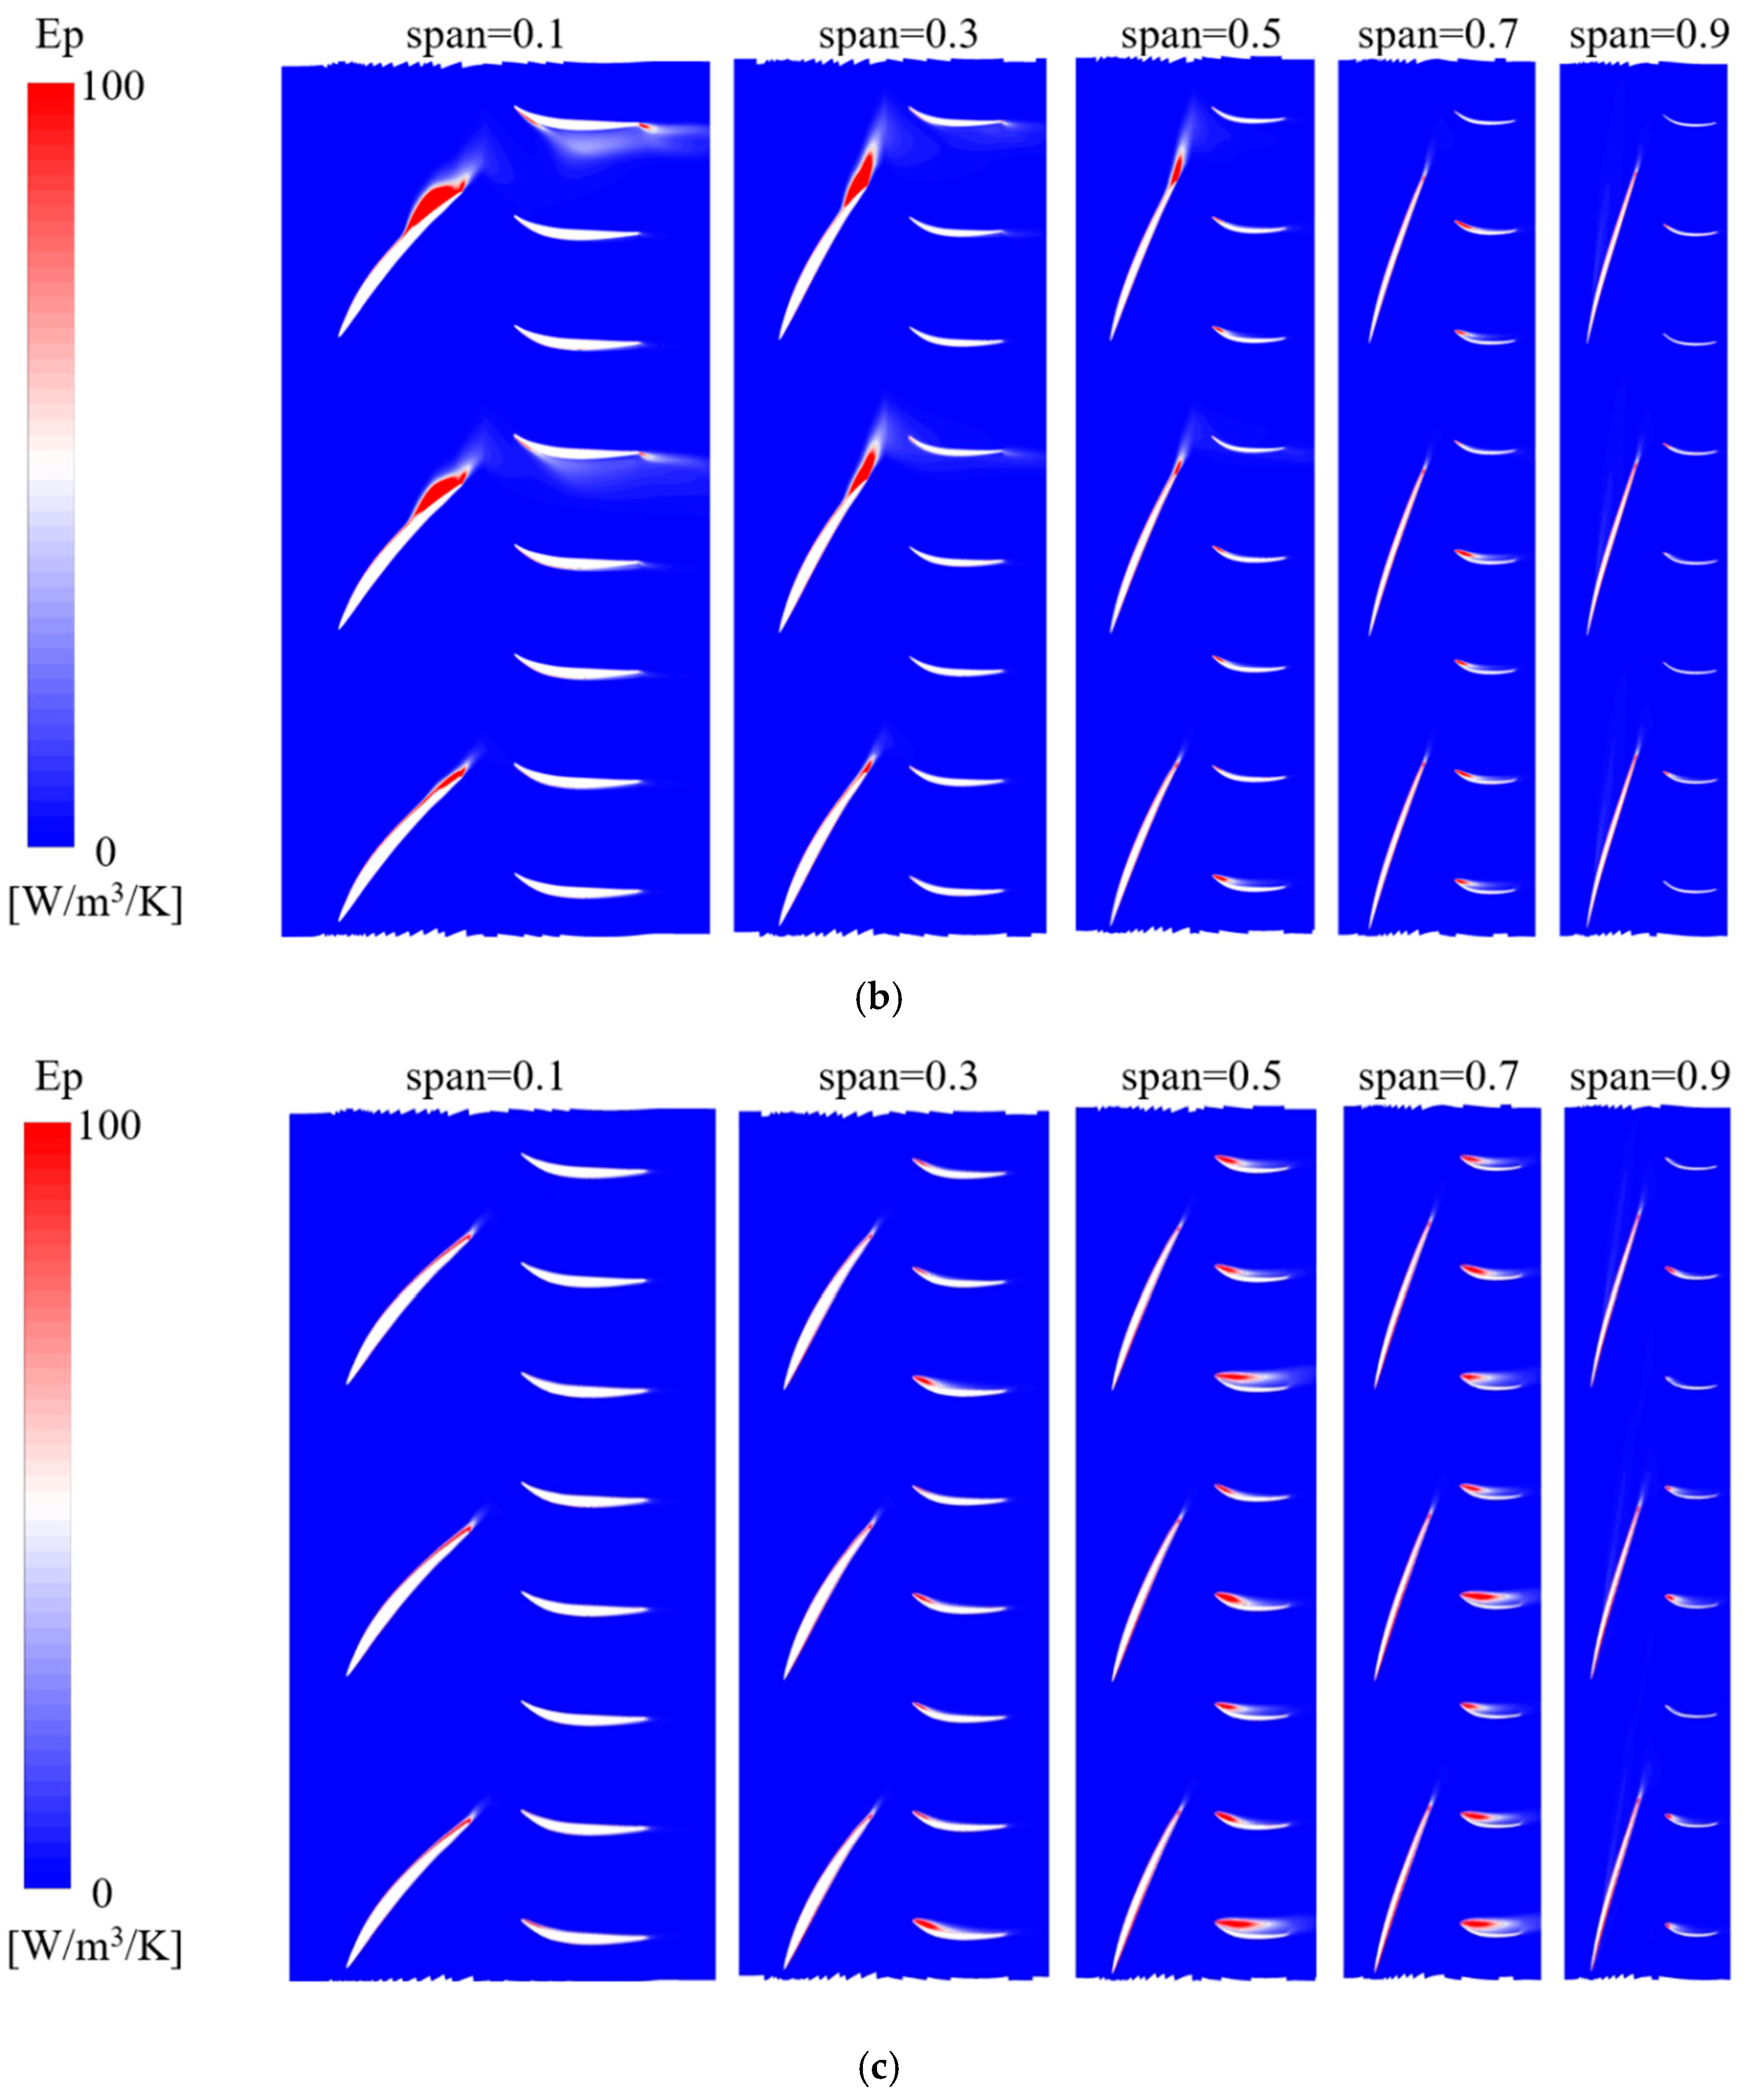
The local entropy production distributions and flow field distributions of different blade height sections in the impeller and guide vane regions under OP4–OP6 operating conditions at a rotational speed of 92.32 r/min are illustrated in Figure 8 and Figure 9. In these figures, vortex structures clearly coincide exactly with high-entropy-production regions, confirming that the losses here are mainly induced by vortex motion.
By comparing various operating conditions under different rotational speeds, it is found that losses are more significant under OP1 and OP4 (i.e., low-flow-rate conditions), primarily due to the flow instability and energy losses caused by the positive attack angle.
Under OP1 and OP4 operating conditions, the location with the maximum losses mainly occurs at the span = 0.1 section (i.e., near the hub); vortices are also generated at the span = 0.9 section (i.e., near the tip), resulting in a certain degree of energy loss.
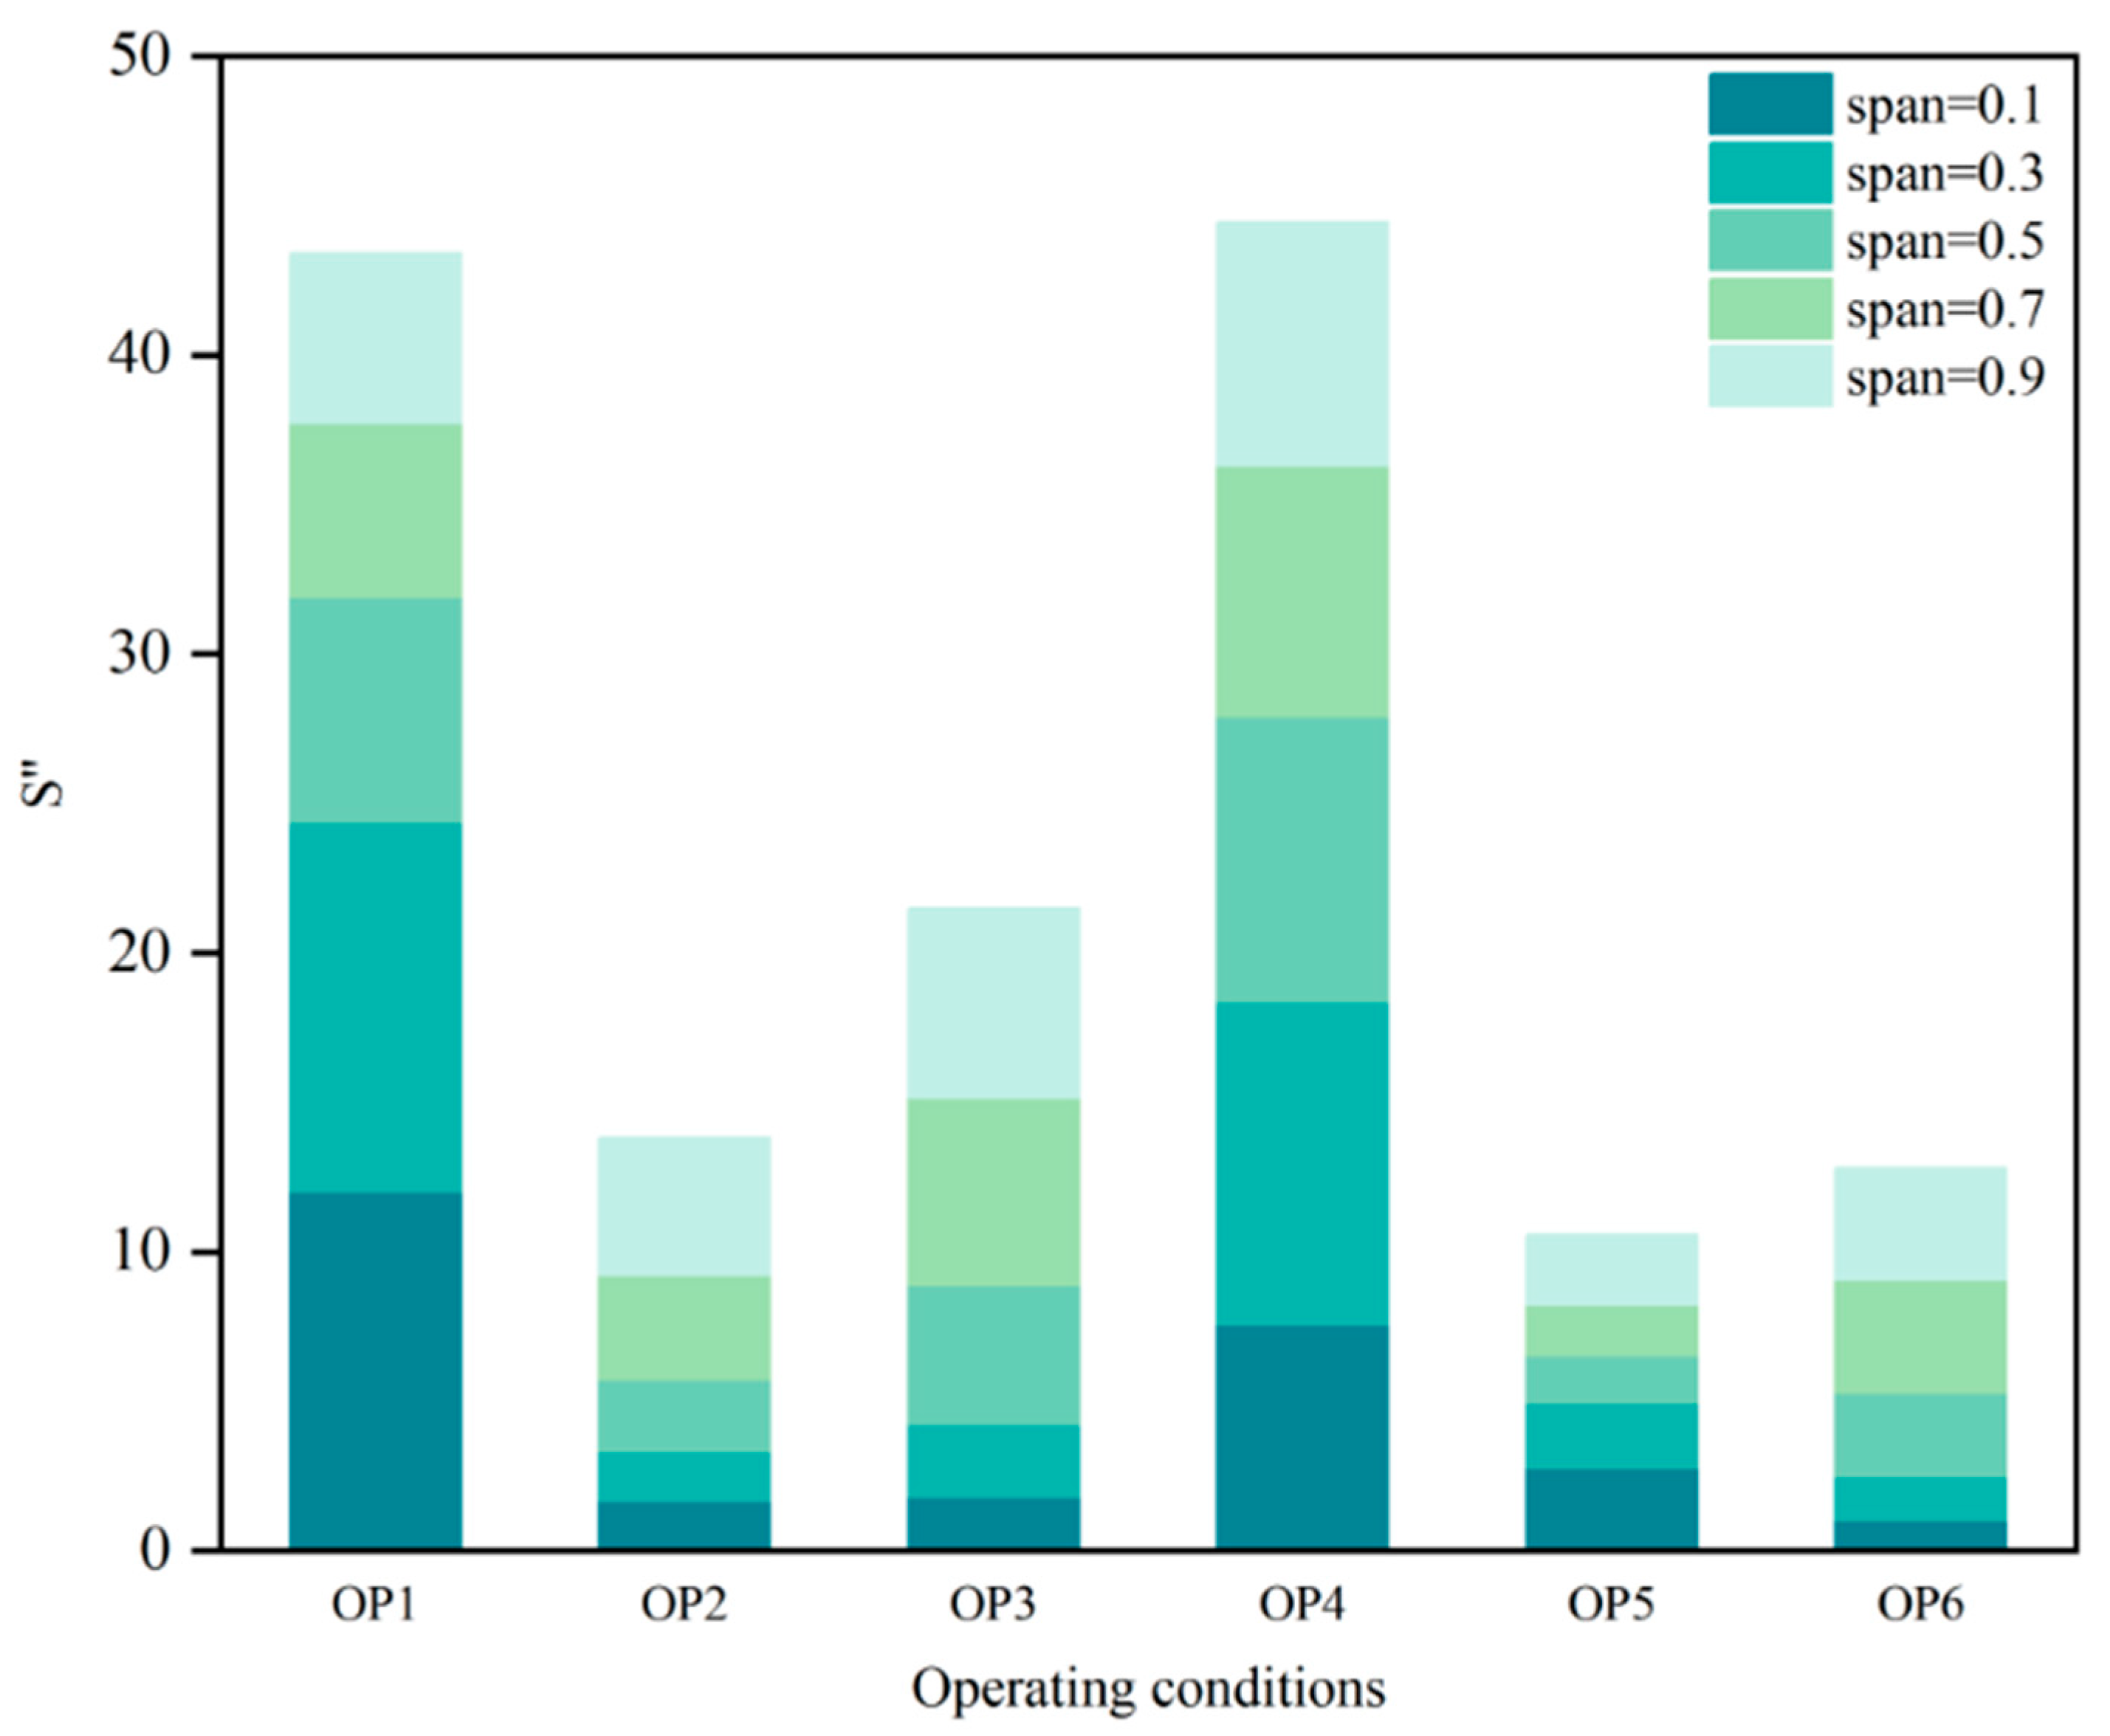
In order to quantify the energy loss of the impeller and guide vane domain, the local entropy yield per unit area of span = 0.1, span = 0.3, span = 0.5, span = 0.7, and span = 0.9 is divided, and the results in Figure 10 are obtained. It can be clearly seen that the loss is the largest under the OP1 and OP4 conditions, and the OP2 and OP5 conditions yield the highest efficiency points under the corresponding flow rate, that is, at the optimal operating point, the loss is the smallest, which is consistent with the previous conclusion.
In addition, under the working conditions of OP2, OP3, and OP6, the entropy output value at the rim accounts for a large proportion, indicating that under this working condition, the loss mainly occurs at the rim position; the loss is the smallest under the OP5 condition, which mainly occurs in the hub position.

4.3. Ratio of Entropy Production Between Near-Wall and Far-Wall Regions

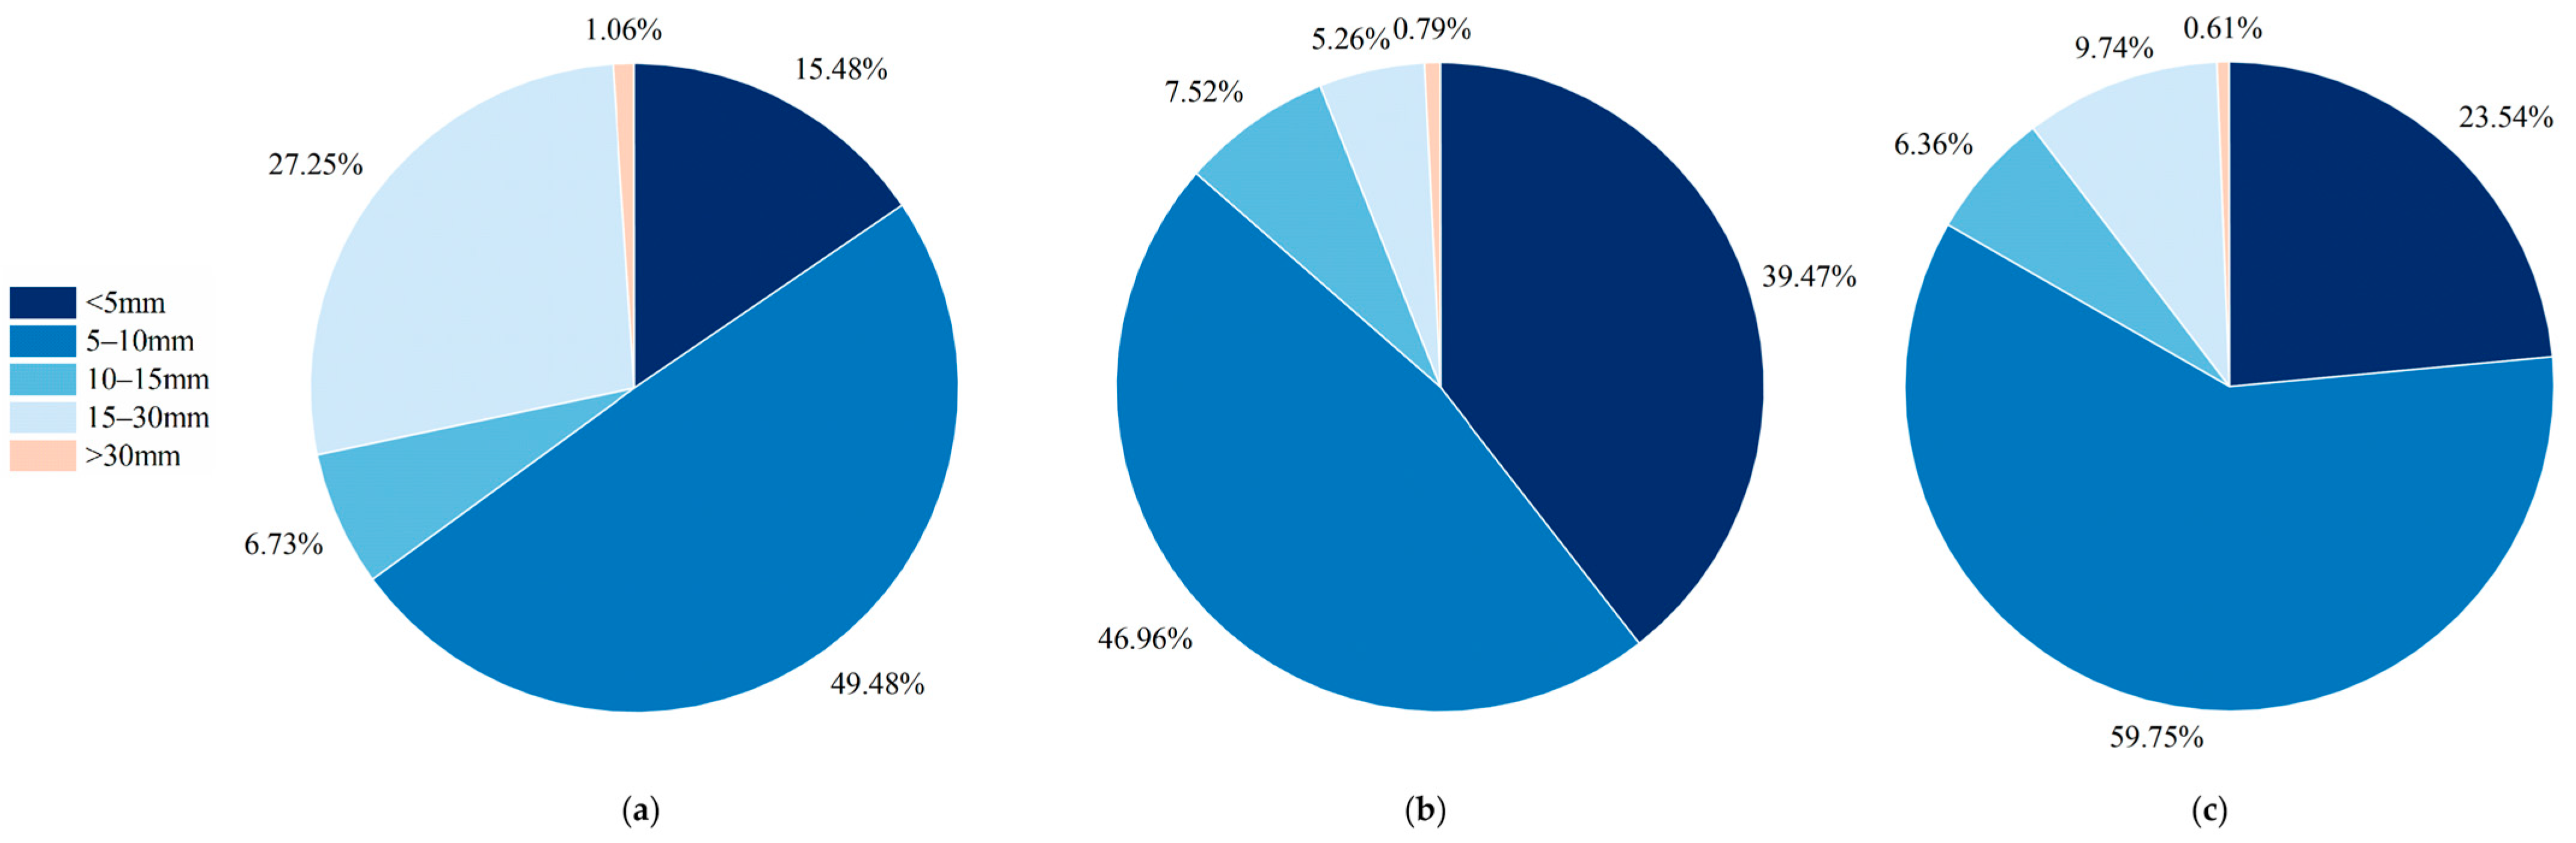
To evaluate the proportion of entropy production energy loss within the impeller and guide vane regions, volume integration was performed on the numerical model in this study. The analysis was carried out for five specific regions, which are listed as follows:
  • Within 5 mm from the wall surface.
  • Between 5 and 10 mm from the wall surface.
  • Between 10 and 15 mm from the wall surface.
  • Between 15 and 30 mm from the wall surface.
  • More than 30 mm from the wall surface.
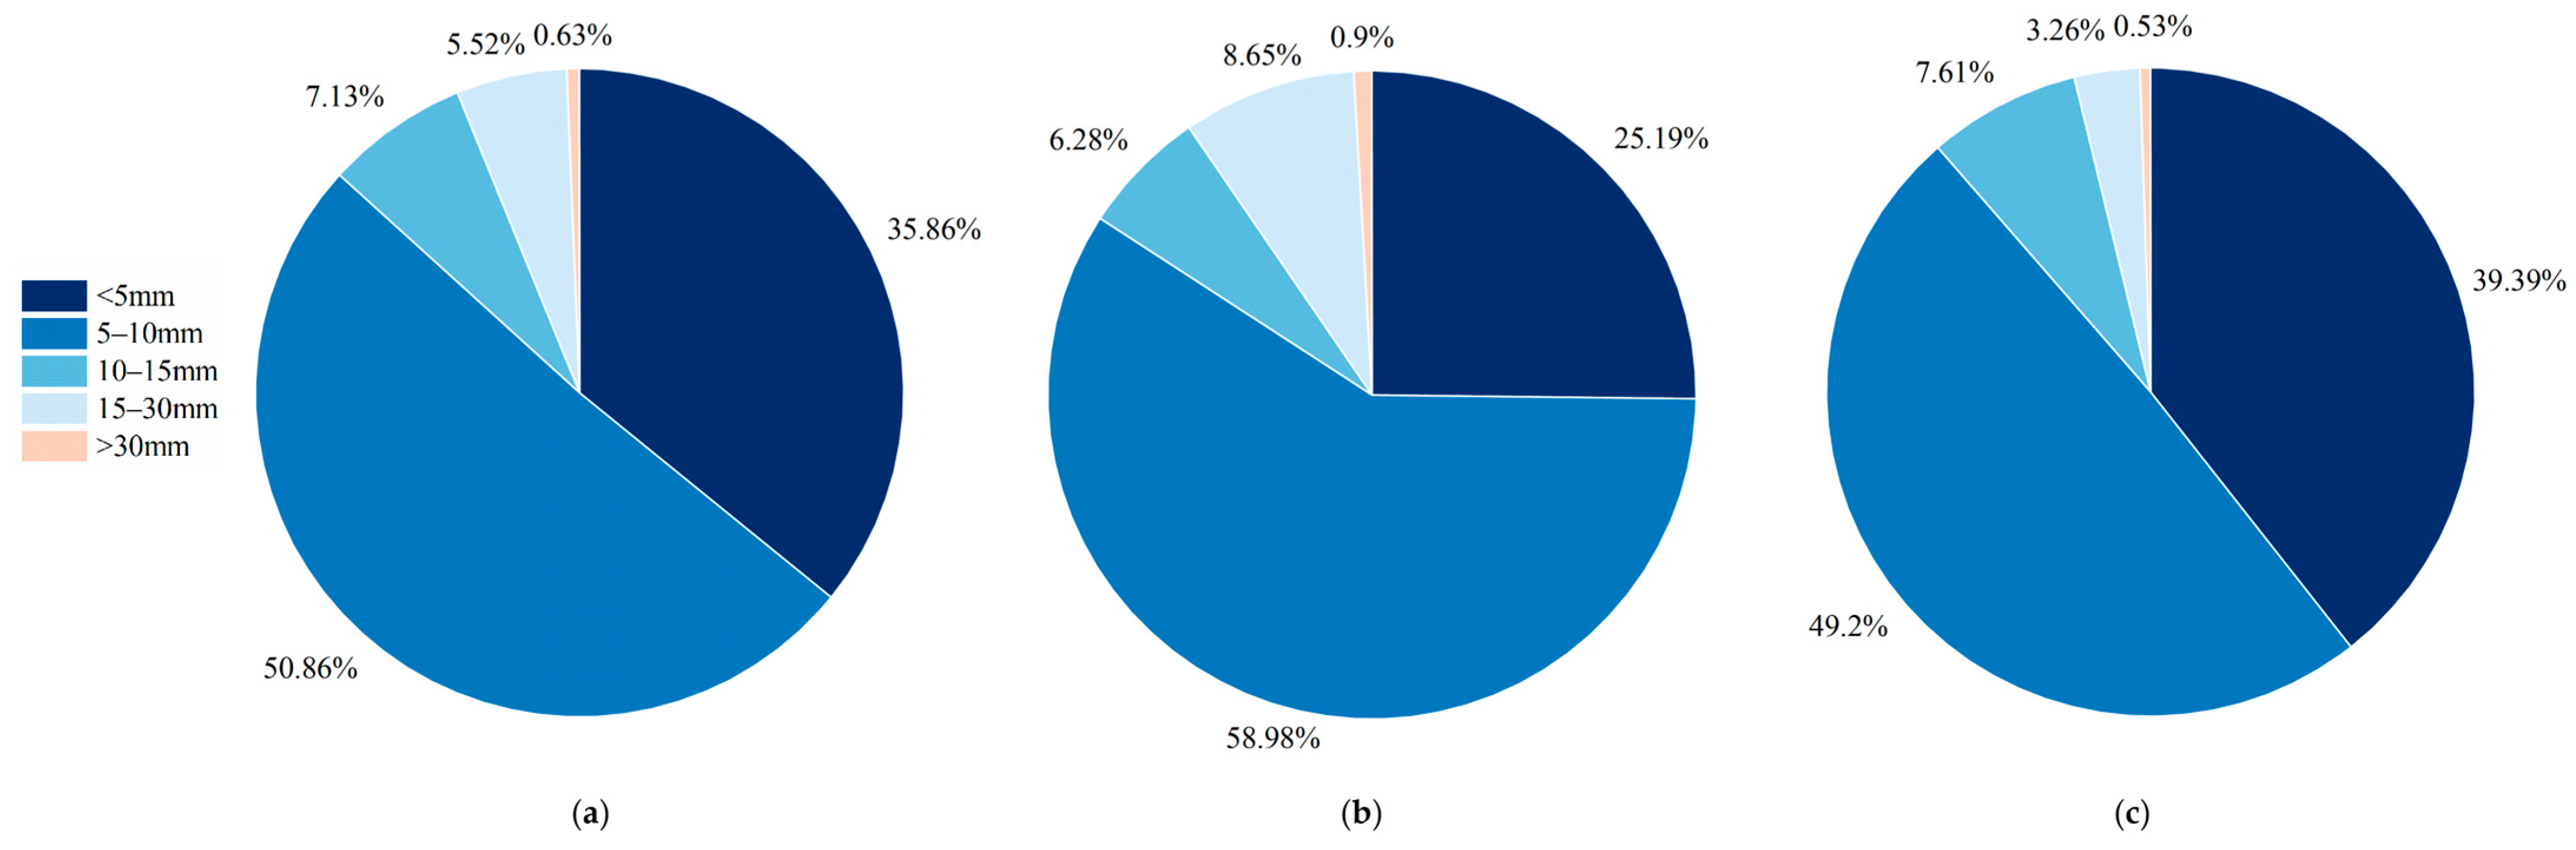
A comprehensive analysis of entropy production energy loss in the near-wall and far-wall regions was conducted for the impeller and guide vane components. As illustrated in Figure 11 and Figure 12, the entropy production energy loss within the impeller and guide vanes is mainly concentrated in the near-wall regions. At a rotational speed of 115.4 r/min, the loss is particularly significant in the regions within 5 mm from the wall surface and 5–10 mm from the wall surface. The entropy production energy loss within the range of 30 mm from the wall surface accounts for 99.37%, 99.1%, and 99.47% of the total entropy production energy loss in the impeller and guide vane regions. At a rotational speed of 92.32 r/min, the loss remains particularly significant in the regions within 5 mm from the wall surface and 5–10 mm from the wall surface. However, under the OP4 and OP6 operating conditions, the proportion of loss in the region 15–30 mm from the wall surface also increases, reaching 27.25% and 9.74%, respectively. The entropy production energy loss within the range of 30 mm from the wall surface accounts for 98.94%, 99.21%, and 99.31% of the total entropy production energy loss in the impeller and guide vane regions. Overall, the proportion of entropy production energy loss in the region beyond 30 mm from the wall surface is negligible, indicating that the energy loss of the impeller and guide vane components mainly occurs within 30 mm of the near-wall region. This quantitative conclusion is consistent with the mature CFD data-driven analysis approach in the field of fluid machinery—the systematic mining of CFD datasets enables the accurate localization of key regions with concentrated hydraulic losses. This aligns closely with the analytical logic of this study, which quantifies entropy production through data from the CFD computational domain, further validating the reliability of the entropy production analysis results herein [26].
Based on the above analysis, we draw the following conclusions and implications. At a specific flow rate, the design width of the flow passage is conducive to matching this flow rate, thereby keeping both flow loss and wall loss at a relatively low level. When the flow rate increases, excessive fluid volume leads to an increase in wall loss; when the flow rate decreases, flow separation is no longer constrained, easily generating secondary flow structures such as recirculating flow and vortices, which significantly increase the loss between flows. In the design of impeller profiles, the conclusions from the above research should also be fully considered, but comprehensive analysis based on the Euler equations is still required. Nevertheless, the results of this study can provide a reference for the flow passage design of other fixed components, helping to determine the optimal width or area according to the design flow rate requirements, which holds important engineering guiding significance.

5. Conclusions

Based on the entropy production theory, we conducted research on the internal flow characteristics and energy loss mechanisms in impeller and guide vane domains under the rated rotational speed of 115.4 r/min and an 80% rated rotational speed of 92.32 r/min, adopting a combined method of CFD numerical simulation and experimental validation. The following conclusions are drawn:
  • Under both rotational speeds, the efficiency curves of the tubular pump exhibit a typical “first increase and then decrease” characteristic, and the head shows a monotonically decreasing trend with the increase in flow rate. When the rotational speed decreases from 115.4 r/min to 92.32 r/min, the optimal operating point shifts to the small flow rate range. Additionally, the head within the monitored range is generally lower under the low rotational speed condition, indicating lower system energy loss, which is consistent with the changes in flow resistance characteristics caused by the decrease in rotational speed.
  • The local entropy production rate can effectively characterize the location and intensity of energy loss. Under the optimal operating conditions of the impeller and guide vane domains, the local entropy production rate is the lowest, with minimal hydraulic loss. Under off-design conditions, the entropy production rate increases significantly, and energy loss intensifies. In fact, the energy loss within the pump is mainly divided into two regions: first, between the flow and the wall, and second, between the flow and the flow. When there are no vortices in the local flow, the flow synchronization is good, the interaction is weak, and the energy loss is generally not large. When vortices occur, it means that the interaction between the vortices and other surrounding flow structures is relatively enhanced, and the energy loss also increases accordingly. In general, the energy loss at the edge of the vortex will increase, which is a qualitative description of the above phenomenon. Moreover, the high-entropy-production regions coincide with the distribution of vortex structures, further confirming that the energy loss under such conditions is mainly induced by vortex motion.
  • The spatial distribution law of energy loss is as follows: along the spanwise direction, under low flow rate conditions, energy loss is mainly concentrated near the hub (span = 0.1) and tip (span = 0.9). For some operating conditions (OP2, OP3, and OP6), the proportion of entropy production at the tip is larger, while OP5 exhibits the smallest loss, which is mainly concentrated in the hub region. Along the distance from the wall surface, the energy loss of the impeller and guide vanes is highly concentrated within 30 mm of the near-wall region. In future research, streamlined profile correction can be conducted: the blade profiles in the hub (span = 0.1) and rim (span = 0.9) regions can be smoothed, and a combined “forward sweep + backward bend” design can be adopted to suppress boundary layer separation [27].

Author Contributions

Y.Z.: formal analysis; investigation; data curation; writing—original draft preparation; validation; visualization; Y.S.: investigation; writing—original draft preparation; X.H.: formal analysis; investigation; data curation; writing—original draft preparation; R.T.: conceptualization; methodology; software; writing—review and editing; R.X.: methodology; supervision. All authors have read and agreed to the published version of the manuscript.

Funding

The authors declare that this study received funding from two sources: (1) the Technology Program of State Grid Fujian Electric Power Co., Ltd., Program Title: Research on reliability technology of key components of large capacity Kaplan turbine, Grant Number: 52130424000A; (2) the South-to-North Water Diversion Project Technological Research Project, Grant Number: 202301. The funders had the following involvement with the study: the former provided technical guidance and supplementary support for high-performance computing equipment, while the latter offered technical guidance and experimental guidance.

Data Availability Statement

The original contributions presented in this study are included in the article. Further inquiries can be directed to the corresponding author.

Acknowledgments

The authors are grateful for the research collaboration.

Conflicts of Interest

Author Yi Sun was employed by the company Jiangsu Water Source Company Ltd. of the Eastern Route of the South-to-North Water Diversion Project. The remaining authors declare that the research was conducted in the absence of any commercial or financial relationships that could be construed as a potential conflict of interest.

References

  1. Zhang, R.T.; Shan, H.C.; Bu, G.; Zhou, W.; Zhu, H.G.; Yao, L.B. Structural Characteristics of Bulb Tubular Pumps in the First Phase of the Eastern Route of the South-to-North Water Diversion Project. J. Drain. Irrig. Mach. Eng. 2016, 34, 774–782, 789. [Google Scholar]
  2. Ji, D.T. Study on Hydraulic Characteristics of a New Type of Rear-Mounted Bulb Tubular Pump Device. Master’s Thesis, Yangzhou University, Yangzhou, China, 2024. [Google Scholar] [CrossRef]
  3. Jiang, H.Y.; Li, S.H.; Gu, W.; Jiao, W.; Cheng, L. Numerical Simulation Analysis of Flow Characteristics of Jiuquhe Pumping Station. Jiangsu Water Resour. 2018, 3, 1–5. [Google Scholar] [CrossRef]
  4. Jin, Y.; Liu, C.; Tang, F.P.; Zhou, J. Influence of Bulb Support on Hydraulic Performance of Tubular Pumps. Trans. Chin. Soc. Agric. Mach. 2009, 40, 78–82. [Google Scholar]
  5. Jin, Y.; Liu, C.; Tang, F.P. Numerical Simulation of Internal Flow in Bulb Tubular Pump Device. J. Drain. Irrig. Mach. Eng. 2010, 28, 155–159. [Google Scholar]
  6. Jin, Y.; Liu, C.; Tang, F.P. Three-Dimensional Turbulent Flow Calculation of Rear-Mounted Bulb Tubular Pump. J. Mech. Eng. 2010, 46, 167–174. [Google Scholar] [CrossRef] [Scilit]
  7. Jin, Y. Study on Numerical Simulation and Three-Dimensional LDV Measurement of Internal Flow in Tubular Pumps. Master’s Thesis, Yangzhou University, Yangzhou, China, 2010. [Google Scholar]
  8. Li, C.; Yuan, Y.; Shan, L.D.; Yang, F.; Xu, X. Experimental Analysis on Energy Characteristics of Tubular Pump Model Device. Jiangsu Water Resour. 2020, 8, 42–45. [Google Scholar] [CrossRef]
  9. Shi, L.J.; Liu, X.Q.; Tang, F.P.; Yao, Y.L.; Xie, R.S.; Zhang, W.P. Optimal Design and Experiment of Bidirectional Shaft Tubular Pump Device. Trans. Chin. Soc. Agric. Mach. 2016, 47, 85–91. [Google Scholar] [CrossRef]
  10. Lu, L.G.; Wu, C.X.; Ji, J.Z.; Leng, Y.; Wu, K.P.; Wang, J. Test of Hydraulic Loss in Bulb Tubular Pump Flow Channel Model. South-to-North Water Transf. Water Sci. Technol. 2007, 1, 82–84. [Google Scholar] [CrossRef]
  11. Lu, L.G.; Huang, J.J.; Chen, J.; Chen, A.P.; Wang, X.M.; Zou, J.M. Numerical Simulation of Three-Dimensional Flow in Bulb Tubular Pump Device. J. Drain. Irrig. Mach. 2007, 3, 15–20. [Google Scholar]
  12. Lu, L.G.; Chen, J.; Liang, J.D.; Leng, Y. Optimal Hydraulic Design of Bulb Tubular Pump Device. J. Hydraul. Eng. 2008, 3, 355–360. [Google Scholar] [CrossRef]
  13. Lu, L.G.; Chen, J.; Chen, A.P.; Huang, J.J.; Wang, X.M.; Zou, J.M. Analysis of Basic Flow Regime in Bulb Tubular Pump Device. South-to-North Water Transf. Water Sci. Technol. 2007, 3, 30–32. [Google Scholar]
  14. Fan, W.R.; Sun, L.G.; Guo, P.C. Investigation on Unstable Flow Characteristics and Energy Dissipation in Pelton Turbine. Eng. Appl. Comput. Fluid Mech. 2024, 18, 2304643. [Google Scholar] [CrossRef] [Scilit]
  15. Hou, H.; Zhang, Y.; Li, Z.; Jiang, T.; Zhang, J.; Xu, C. Numerical Analysis of Entropy Production on a LNG Cryogenic Submerged Pump. J. Nat. Gas Sci. Eng. 2016, 36, 87–96. [Google Scholar] [CrossRef] [Scilit]
  16. Yang, F.; Li, Z.; Hu, W.; Liu, C.; Jiang, D.; Liu, D.; Nasr, A. Analysis of Flow Loss Characteristics of Slanted Axial Flow Pump Device Based on Entropy Production Theory. R. Soc. Open Sci. 2022, 9, 211208. [Google Scholar] [CrossRef] [Scilit]
  17. Shi, L.J.; Chen, Y.Y.; Yu, X.L.; Han, Y.; Chai, Y.; Xue, M.Z. Energy Loss Mechanism of a Full Tubular Pump Under Reverse Power Generation Conditions Using Entropy Production Theory. Proc. Inst. Mech. Eng. Part A J. Power Energy 2024, 238, 868–886. [Google Scholar] [CrossRef] [Scilit]
  18. Zhang, R.; Tan, S.Y.; Ding, X.J.; Xu, H.; Feng, J.G.; Mou, T.; Fei, Z.D. Flow Loss Characteristics of Shaft Tubular Pump Based on Entropy Production Theory. Adv. Sci. Technol. Water Resour. 2022, 42, 6–12. [Google Scholar]
  19. Pan, Q.; Sun, L.Y.; Ding, W.; Zhang, D.S.; Shi, W.D. Study on Local Entropy Production and Energy Loss Characteristics of Bulb Tubular Pump. J. Xi’an Jiaotong Univ. 2023, 57, 131–140. [Google Scholar]
  20. Zhou, L.; Hang, J.; Bai, L.; Krzemianowski, Z.; El-Emam, M.A.; Yasser, E.; Agarwal, R. Application of Entropy Production Theory for Energy Losses and Other Investigation in Pumps and Turbines: A Review. Appl. Energy 2022, 318, 119211. [Google Scholar] [CrossRef] [Scilit]
  21. Di, D.; Bai, Y.; Fang, H.Y.; Sun, B.; Wang, N.N.; Li, B. Intelligent Siltation Diagnosis for Drainage Pipelines Using Weak-Form Analysis and Theory-Guided Neural Networks in Geo-Infrastructure. Autom. Constr. 2025, 176, 106246. [Google Scholar] [CrossRef] [Scilit]
  22. Menter, F.R.; Kuntz, M.; Langtry, R. Ten Years of Industrial Experience with the SST Turbulence Model. Turbul. Heat Mass Trans. 2003, 4, 625–632. [Google Scholar]
  23. Herwig, H.; Kock, F. Local Entropy Production in Turbulent Shear Flows: A Tool for Evaluating Heat Transfer Performance. J. Therm. Sci. 2006, 15, 159–167. [Google Scholar] [CrossRef] [Scilit]
  24. Herwig, H.; Kock, F. Direct and Indirect Methods of Calculating Entropy Generation Rates in Turbulent Convective Heat Transfer Problems. Heat Mass Transf. 2007, 43, 207–215. [Google Scholar] [CrossRef] [Scilit]
  25. Kock, F.; Herwig, H. Local Entropy Production in Turbulent Shear Flows: A High-Reynolds Number Model with Wall Functions. Int. J. Heat Mass Transf. 2004, 47, 2205–2215. [Google Scholar] [CrossRef] [Scilit]
  26. Zhang, H.H.; Li, K.; Liu, T.; Liu, Y.C.; Hu, J.X.; Zuo, Q.S.; Jiang, L.X. Analysis the Composition of Hydraulic Radial Force on Centrifugal Pump Impeller: A Data-Centric Approach Based on CFD Datasets. Appl. Sci. 2025, 15, 7597. [Google Scholar] [CrossRef] [Scilit]
  27. Jia, Y.H.; Liu, Y.B.; He, X.; Meng, Z.W.; Zhao, S. Arrangement Guideline of Film Holes Along Conjugate Temperature Difference in Turbine Guide Vanes. Chin. J. Aeronaut. 2025, 38, 103400. [Google Scholar] [CrossRef] [Scilit]
Figure 1. Schematic diagram of bulb tubular pump unit.
Water 18 00188 g001
Figure 2. Grid independence check.
Water 18 00188 g002
Figure 3. Grid final scheme.
Water 18 00188 g003
Figure 4. Comparison curves of simulation and experimental results.
Water 18 00188 g004
Figure 5. Comparison curves at 115.4 r/min and 92.32 r/min.
Water 18 00188 g005
Figure 6. Impeller–guide vane entropy output value distribution: (a) OP1; (b) OP2; (c) OP3.
Water 18 00188 g006
Figure 7. Impeller–guide vane streamline distribution: (a) OP1; (b) OP2; (c) OP3.
Water 18 00188 g007
Figure 8. Impeller–guide vane entropy output value distribution: (a) OP4; (b) OP5; (c) OP6.
Water 18 00188 g008aWater 18 00188 g008b
Figure 9. Impeller–guide vane streamline distribution: (a) OP4; (b) OP5; (c) OP6.
Water 18 00188 g009
Figure 10. Cumulative bar chart of spanwise entropy production.
Water 18 00188 g010
Figure 11. Proportion of wall surface entropy production: (a) OP1; (b) OP2; (c) OP3.
Water 18 00188 g011
Figure 12. Proportion of wall surface entropy production: (a) OP4; (b) OP5; (c) OP6.
Water 18 00188 g012
Table 1. Comparative study of working conditions.
Operation PointFlow [m/s3]Rotating Speed [r/min]Efficiency
OP137.5115.486.51%
OP248.75115.490.35%
OP352.5115.484.90%
OP426.2592.3281.76%
OP537.592.3288.70%
OP642.592.3282.79%
Table 2. Grid independence check.
N1N2N3φ1φ2φ3GCI32GCI21
6,839,2833,115,3111,405,5420.928140.924060.921560.27%0.45%
Table 3. Grid number of each component.
ComponentElementsNodes
Inflow Passage336,896376,800
Impeller265,983295,695
Guide Vane1,993,697355,436
Outflow Passage518,73595,890
Total3,115,3111,123,821
Disclaimer/Publisher’s Note: The statements, opinions and data contained in all publications are solely those of the individual author(s) and contributor(s) and not of MDPI and/or the editor(s). MDPI and/or the editor(s) disclaim responsibility for any injury to people or property resulting from any ideas, methods, instructions or products referred to in the content.