Article

Hydrodynamic Characterization of the Perrot Spring (Aosta Valley, Italy) Combining Spring and Meteorological Data


1
Earth Sciences Department, University of Turin, 10125 Torino, Italy
2
Parco Naturale Mont Avic, 11020 Champdepraz, Italy
*
Authors to whom correspondence should be addressed.
Water 2026, 18(17), 2100; https://doi.org/10.3390/w18172100
Submission received: 27 July 2026 / Revised: 23 August 2026 / Accepted: 24 August 2026 / Published: 26 August 2026
(This article belongs to the Section Hydrogeology)

Abstract

This study characterizes the Perrot Spring (Aosta Valley, Italy), aiming to analyze meteorological data in order to define its hydrodynamic behavior in a context of climate variability. A time-series analysis of Spring discharge, water temperature, electrical conductivity, and stable isotopes was carried out by comparing them with meteorological variables, including precipitation, snow height, and air temperature, over the period 2022–2026. Decadal trends in meteorological variables were also assessed for the period 2002–2026, and the Maillet recession coefficients of the Spring were determined. The analysis revealed significant meteorological variability, with decadal trends showing increasing annual mean air temperatures and decreasing snow height. The absence of temporal variability in the isotopic composition of the Spring, despite the relevant discharge fluctuations, suggests the existence of a groundwater circulation system that promotes effective mixing of infiltrating precipitation within the aquifer. The Spring response to infiltration inputs exhibits a dual behavior. First, the Spring reacts rapidly, with discharge doubling within a few hours. Second, Spring discharge is proportional to precipitation occurring during the previous 100 days, reacting more slowly. Spring water temperature and electrical conductivity do not appear to be significantly affected by meteorological variability. In conclusion, the comparison between Spring and meteorological data suggests that the Spring exhibits a good short-term resilience to seasonal dry periods, but the observed decadal meteorological trends could still pose a future threat.

1. Introduction

Groundwater in mountainous environments acts as a strategic natural reservoir, sustaining local ecosystems, feeding the dense network of surface watercourses and supporting downstream lowland areas during drought periods [1,2]. Many mountain springs are exploited for drinking water supply through conduit systems, serving both local communities and populations located in areas lacking adequate water resources [2,3]. Furthermore, in Italy, numerous springs are captured for bottling and commercial distribution, thereby representing an important economic and social asset [4].
Mountain springs exhibit unique characteristics that depend on the geological, geomorphological, and hydrogeological settings of their recharge areas and are influenced by meteorological and climatic conditions, which affect both their quantitative and qualitative parameters [2,5,6].
Depending on recharge inputs derived from precipitation, various responses have been documented in the literature, ranging from immediate variations in spring discharge to delayed responses occurring from several days to weeks after the recharge event [7]. From a qualitative perspective, infiltrating recharge inputs may also induce increases or decreases in ionic concentrations [8]. Conversely, some aquifer systems exhibit negligible or no significant variations in spring water parameters. Similar to infiltration inputs, prolonged dry periods may produce the same effects described above, occasionally resulting in a complete reduction in discharge and the consequent disappearance of the spring [9].
Long-term climatic trends may also influence spring behavior, representing a potential threat to their persistence and sustainability [10,11]. From a quantitative perspective, situations have been documented in which increasing air temperatures have led to reduced snow cover and, consequently, to decreases in spring discharge [12]. Conversely, other springs have exhibited increased discharge associated with permafrost degradation and variation in groundwater temperatures [13,14]. Groundwater quality is also affected by climatic variability, with documented increases in the concentrations of heavy metals and major ions related to glacier retreat and permafrost melting [15].
Although meteorological and climatic variability influence changes in spring parameters, their combined analysis provides valuable information on the characteristics of groundwater flow systems [16]. For example, it is possible to define the extent of recharge areas [17,18], estimate aquifer storage volumes [19] and identify interactions with surface water bodies [20]. For these reasons, and because each spring may exhibit site-specific behavior [21], the investigation of the hydrodynamic behavior of mountain springs is essential for their protection and sustainable management.
Several methods are available for spring characterization and may be applied individually or in combination. Classical and widely adopted approaches include continuous monitoring of quantitative and qualitative spring parameters [22,23], the use of environmental tracers to investigate interactions with surface watercourses, stable isotopes to delineate recharge areas, and the characterization of spring recession curves for the estimation of hydrodynamic coefficients [24,25,26,27,28,29]. Therefore, climate variable trend analyses combined with spring discharge time series can help to understand the potential effects of climate variability on groundwater recharge mechanisms [21,30].
Understanding how springs respond to meteorological inputs is therefore essential for identifying groundwater circulation processes, characterizing aquifer response times, and assessing the resilience of groundwater resources to periods of reduced recharge. Such an integrated characterization is relevant beyond individual springs, as the identification of response times and buffering processes can contribute to a better understanding of the behavior and vulnerability of mountain groundwater systems under changing climatic conditions.
The Perrot Spring, located within the Mont Avic Natural Park (Aosta Valley, Italy), represents an important drinking water resource for the local community. Several studies have been conducted to improve the understanding of the Spring characteristics, as explained in the study area section. The aim of this study is to improve the understanding of the Perrot Spring through a hydrodynamic characterization based on the integration of recent meteorological and Spring datasets, addressing three main scientific questions: (i) how does the mountain spring respond to precipitation and infiltration inputs at different time, (ii) what do the temporal variations in discharge, electrical conductivity, water temperature and stable isotopes reveal about groundwater circulation within the aquifer and (iii) how does the spring respond to both short-term meteorological variability and decadal meteorological trends, and what can this reveal about its resilience to changing recharge conditions. For these reasons, several approaches were applied, including the monitoring and characterization of the Spring’s quantitative, qualitative, and isotopic parameters, the determination of Maillet recession coefficients, and the assessment of decadal meteorological trends. This study represents a significant example that may contribute to improving the protection and management of water resources in mountain environments through the application of multiple approaches for spring characterization.

2. Study Area

2.1. Geological and Hydrogeological Setting

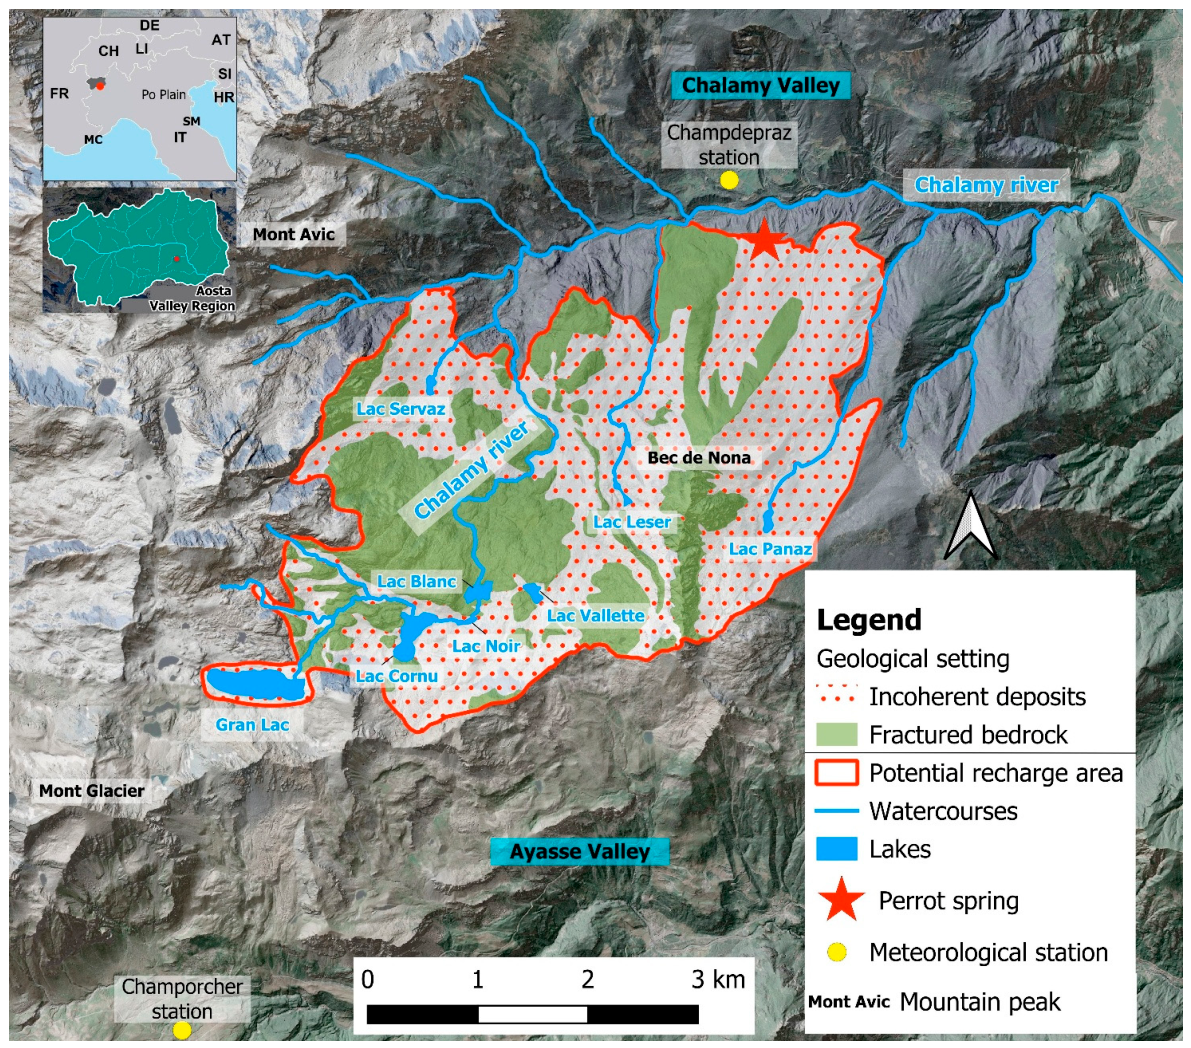
The Perrot Spring is located in northwestern Italy, in the Aosta Valley, within the municipality of Champdepraz, on the right side of the Chalamy Valley, at an elevation of 1300 m a.s.l. The Chalamy River catchment reaches its highest elevations at Mont Glacier and Mont Avic, which rise to 3185 m and 3006 m a.s.l., respectively. Several lakes are distributed within the catchment and in the sector upstream of the Spring, including Gran Lac, Lac Cornu, Lac Blanc, Lac Noir and Lac Vallette, all located between approximately 2000 and 2500 m a.s.l. (Figure 1).
The Spring emerges at the base of a coarse-grained landslide accumulation, a few meters above its contact with fine-grained glaciolacustrine sediments. Groundwater discharges within a detachment niche, carved into the succession of Quaternary deposits. Within the Chalamy catchment, the geological setting is characterized by a metamorphic bedrock composed predominantly of serpentinite and extensively covered by Quaternary deposits. The bedrock, which represents one of the ophiolitic massifs of the Western Alps, consists mainly of serpentinite, with subordinate bodies of amphibolite, prasinite, talc schist and prasinitic gneiss [31,32]. The metamorphic basement is extensively covered by unconsolidated Quaternary sediments comprising superimposed subglacial, ice-marginal, glaciolacustrine and landslide deposits.
Based on their geological and hydrogeological characteristics, the metamorphic bedrocks generally behave as an aquitard, although locally developed fracture systems may confer a certain degree of secondary permeability. The area surrounding the Spring has been the subject of detailed geological investigations [33]. In particular, the glacial succession exposed in the Chalamy Valley, deposited during the third phase of the Last Glacial Maximum (LGM) and subsequently abandoned by the retreating glaciers [34], reaches thicknesses of up to 240 m and is extensively exposed due to the widespread development of badlands. The succession consists of:
-
Lower subglacial deposits, with an exposed thickness of approximately 30 m, characterized by an abundant sandy-silty matrix containing subordinate clasts. Due to their transport beneath a thick ice mass, these deposits are strongly overconsolidated and therefore exhibit generally low permeability.
-
Overlying ice-marginal deposits, approximately 100–150 m thick, composed predominantly of clasts of highly variable size embedded within a subordinate matrix. Their permeability is heterogeneous and largely controlled by the degree of carbonate cementation.
-
Glaciolacustrine deposits, which constitute the uppermost unit of the glacial sequence and attain thicknesses of up to approximately 100 m. These deposits consist of alternating fine- and coarse-grained sediments and are characterized by low permeability.
-
Overlying landslide deposits, composed mainly of coarse clastic material of variable grain size within a subordinate sandy-silty matrix. These deposits originated from the Bec de Nona detachment niche at an elevation of approximately 2200 m a.s.l. and form a convex fan that partially covers the glaciolacustrine terrace characterized by very high permeability.
The Quaternary succession exerts a control on the genesis of the Perrot Spring. The overlapping of highly permeable landslide deposits over poorly permeable glaciolacustrine sediments, which form an extensive terrace, creates a marked permeability contrast. This hydrogeological boundary promotes groundwater emergence and therefore controls the location of the Spring [33].
In the upper sector, the landslide deposits directly overlie the serpentinite bedrock, whose structural characteristics may also influence the recharge and feeding of the Perrot Spring. In particular, the pervasive fracturing affecting the bedrock may facilitate groundwater infiltration from the detachment niche towards the base of the landslide accumulation and associated debris deposits. Consequently, the hydrogeological behavior of the Spring is also controlled by the large catchment basin in which it is located [33].
Regarding the Spring data, a correlation between the seasonal discharge volume and precipitation was identified for the period 2012–2019. The Spring was found to be predominantly recharged by liquid precipitation, while an overall decrease in precipitation amounts was also observed. During the same period, a slight increasing trend in Spring discharge was detected, suggesting a delayed response of the recharge system to climate change impacts [21,35].
Complementary isotopic investigations have enabled the delineation of the recharge area of the Perrot Spring, which extends over an elevation range between approximately 1710 and 2490 m a.s.l. (Figure 1). This area hosts several large lakes that may enhance groundwater recharge through the fractured bedrock system [36] (lakes: δ18O (min/max) −11.5/−9.8‰; δ2H (min/max) −79.7/−58.5‰). Regarding water quality, the Spring is characterized by relatively low ion concentrations that remain nearly constant over time and are mainly controlled by meteoric inputs and limited water–rock interaction processes [36].

2.2. Climatic Setting

The climate of the Aosta Valley is characterized by pronounced spatial variability, mainly controlled by elevation and valley orientation.
Mean annual precipitation is lower in the valley bottom sectors of the region. In the Aosta area, the average annual precipitation is approximately 550 mm/year, whereas it increases toward the mountainous sectors, reaching values of about 900–1000 mm/year. The seasonal distribution of precipitation generally exhibits two maxima, occurring in spring and autumn, while winter and summer are typically the driest seasons. Decadal regional records also reveal marked interannual variability, including particularly severe drought years such as 2003 and 2022, which were characterized by significant precipitation deficits. No statistically significant trend has been identified in annual precipitation totals in the last thirty years; however, an increase in both seasonal and regional precipitation contrasts has been observed [37].
The pronounced spatial variability of the mountainous environment of the Aosta Valley results in air temperature patterns that are strongly controlled by elevation. On average, air temperature decreases by approximately 0.6 °C for every 100 m increase in altitude. At valley-bottom meteorological stations (approximately 500 m a.s.l.), the mean annual air temperature recorded in recent years generally ranges between 11 and 12 °C. At higher elevations (approximately 2000 m a.s.l.), cooling becomes much more pronounced, with mean annual temperatures ranging between 4 and 5 °C. Regional climatic series indicate an increase in mean air temperatures and a decrease in the frequency of cold days, consistent with the warming trends observed across the Alps during the XX and XXI centuries [37,38]. Compared with the 1974–1995 reference period, the regional mean temperature has increased by approximately +1.7 °C. The warming rate has been particularly pronounced during spring (+0.81 °C per decade) and summer (+0.72 °C per decade), whereas the mean annual warming trend is approximately +0.58 °C per decade. Since the pre-industrial period, the Alps have experienced a warming of about +2 °C, more than twice the global average temperature increase [37].
Snow conditions also exhibit strong altitudinal variability. Interannual variability in snow cover is high, and studies conducted across the Alps have documented a reduction in both snow-cover duration and snow height, particularly at low and intermediate elevations, over the last century, mainly as a consequence of rising temperatures. Snow-monitoring stations with the longest observational records, covering approximately the last century, indicate that since 1960 the maximum snow depth has decreased by about 12% per decade [37,39].

3. Materials and Methods

3.1. Spring Data

The Perrot Spring is monitored using a multiparameter probe (OTT CTD—Groundwater Datalogger) for the automatic and continuous measurement of water level, temperature, and electrical conductivity. The technical specifications of the instrument are as follows: water level (range: 0–4 m; resolution: 0.001 m; accuracy: ±0.05% FS (full scale)), temperature (Range: −25–70 °C; resolution: 0.01 °C; accuracy: ±0.1 °C), electrical conductivity (Range: 0.001–2000 mS/cm; resolution: 0.001 mS/cm; accuracy: ±0.5% of the measured value (min ± 0.001 mS/cm)). The probe was installed within the stilling basin of the Spring intake structure. Water level measurements were subsequently converted into discharge values (L/s) through the calibration of the sharp-crested weir installed at the outlet.
Water level and temperature have been monitored at 15 min intervals since 25 November 2022. Electrical conductivity measurements have been acquired since February 2024 at the same temporal resolution. The dataset analyzed in this study extends until 9 April 2026, covering 40 months of water level and temperature observations and 26 months of electrical conductivity records.
During the monitoring period, short interruptions in data acquisition occurred but did not significantly affect the reliability of the analyses. Overall, 100,161 water level measurements, 103,526 temperature measurements and 63,602 electrical conductivity measurements were collected, corresponding to data completeness of 88.2%, 91.1% and 83.4%, respectively. The missing observations are randomly distributed. The Spring datasets were processed by aggregating the measurements at hourly, daily, and monthly time scales.

Stable Isotopes

Twelve water samples were collected from the Perrot Spring between March 2023 and May 2024, at an approximately monthly frequency, for δ18O and δ2H analyses. Sampling could not be performed during the winter months because access to the Spring was hindered by snow accumulation and associated logistical constraints. During field activities, samples were collected in each campaign using 250–500 mL polyethylene bottles.
The isotopic analyses were performed at the ISO4 laboratory in the Earth Sciences Department, University of Turin. The isotopic composition of the water molecule was determined through Wavelength-Scanned Cavity Ring-Down Spectroscopy (WS-CRDS) technology, using a Picarro INC laser spectrometer (model L2120-I, Picarro Inc., Santa Clara, CA, USA). No pretreatment of the water samples was required. Laboratory internal standards were calibrated against the international reference standards V-SMOW2, SLAP, and GISP. Analytical precision and accuracy, based on replicate analyses of standards, were better than ±0.2‰ and ±1‰ for δ18O and δ2H, respectively.
Isotopic data were plotted on δ18O-δ2H diagram and compared with the Local Meteoric Water Line (LMWL) of northern Italy [40], distinguishing the samples according to the Spring discharge.

3.2. Meteorological Data

For the analysis of decadal meteorological conditions, data from two meteorological stations operated by the Functional Centre of the Aosta Valley Region (Centro Funzionale RAVDA) were selected [41]. The selected stations are Champdepraz–Chevrère, located at 1260 m a.s.l., and Champorcher–Rifugio Dondena, located at 2181 m a.s.l. (Figure 1).
For the Champdepraz station, air temperature and liquid precipitation data were considered, whereas for the Champorcher station, snow height measurements were also included. The two stations were selected according to their spatial relationship with the study area. The Champdepraz station, besides being the closest to the investigated Spring, is located within the same valley (Chalamy Valley) and at an elevation comparable to that of the Perrot Spring. The Champorcher station is situated in the Ayasse Valley; however, it represents the closest monitoring site to the potential recharge area of the Spring and is located at a similar elevation. Meteorological data were processed by aggregating the observations at daily, monthly, and annual time scales.
At the Champdepraz station, air temperature and liquid precipitation have been monitored since 30 November 2002, resulting in a total of 8533 monitored days. At the Champorcher station, air temperature monitoring began on 7 February 2002, whereas liquid precipitation and snow height measurements have been available since 1 May 2002. Overall, the datasets comprise 8829 days of air temperature observations and 8746 days of liquid precipitation and snow depth measurements. For the analyses presented in this study, all meteorological data were considered up to 30 April 2026. The monthly analyses included data up to April 2026, whereas the annual analyses included data up to December 2025.

3.3. Statistical Analyses

A basic statistical analysis was performed for all available time series, including both meteorological and Spring datasets, to determine the mean, minimum, and maximum values of the investigated variables. Subsequently, to better characterize decadal trends in the meteorological parameters, the non-parametric Mann–Kendall test [42,43] was applied to monthly and annual data over the 2002–2026 period.
To identify possible decadal temporal trends, an additional analysis was carried out on the evolution of monthly cumulative precipitation and mean monthly snow height. Trend analyses were performed separately for each calendar month (i.e., all January values, all February values, etc.) to evaluate the presence of systematic changes over time on a monthly basis.
The presence of statistically significant monotonic trends, either positive or negative, in the time series was evaluated using the non-parametric Mann–Kendall test. The Mann–Kendall test statistic (S) was computed as indicated below:
S   =   Σ k = 1 n 1 Σ j = k + 1 n   sgn   ( Xj Xk )
sgn   ( X ) = 1   if   X > 0 0   if   X = 0   and   X = X j X k 1   if   X < 1
Positive values of S indicate an upward trend, whereas negative values denote a downward trend. A trend was considered statistically significant when the null hypothesis (H0) was rejected at a significance level of 0.05 [44]. Regarding the applicability of the Mann–Kendall test, approximately 40 observations are generally recommended to ensure robust statistical inference; nevertheless, a preliminary or approximate assessment can be performed with a minimum of 10 observations [44]. The Theil–Sen estimator [45,46] was applied to quantify the magnitude. The Theil–Sen method estimates the median slope of the trend, which is less sensitive to outliers than parametric approaches. This method makes it possible to quantify the total change in the parameter analyzed, providing a reliable estimate of the trend. Before applying the Mann–Kendall test, the presence of serial autocorrelation in the meteorological time series was assessed using the Ljung–Box test [47], with a significance level of p = 0.05.

3.4. Comparison Between Spring and Meteorological Data

The measurements acquired at the Perrot Spring were compared with the meteorological data recorded at the two selected meteorological stations. The analyses were performed at hourly, daily, and monthly temporal scales.
The temporal relationships between infiltration inputs derived from precipitation and the quantitative response of the Spring were investigated through correlation analyses between the two variables. Correlation analyses between the considered variables were performed using the coefficient of determination (R2), which quantifies the proportion of variance in the dependent variable explained by the independent variable and thus provides an objective measure of the strength of linear relationships. These analyses were carried out using Excel.
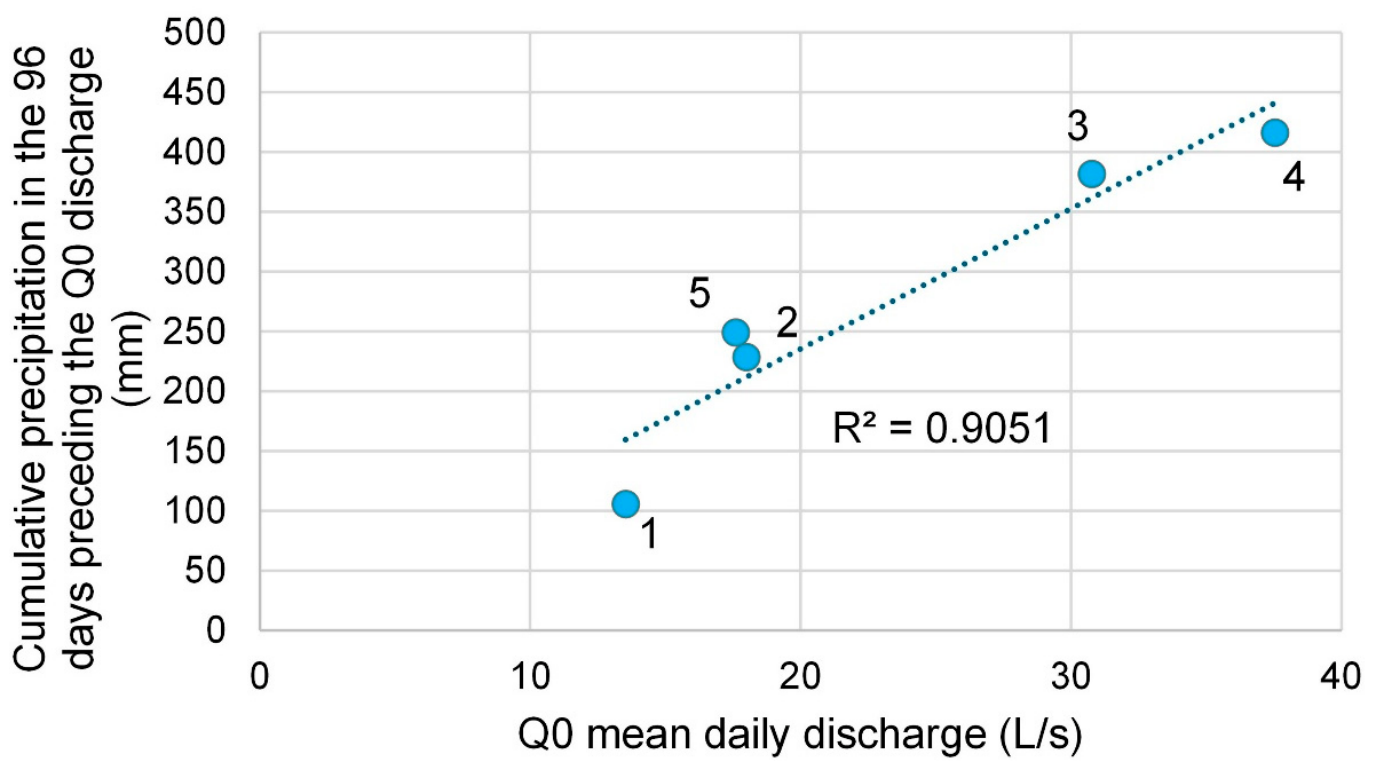
As a first step, the mean daily discharge of the Spring was correlated with the cumulative precipitation recorded on the same day. Subsequently, the precipitation accumulation period was progressively extended by one day at a time, up to a maximum antecedent period of 130 days preceding the discharge measurement. For example, the daily discharge volume measured on 20 January 2025 was initially correlated with the cumulative precipitation of the previous two days (19–20 January). The accumulation period was then progressively expanded backward in time by adding one additional day at each step (18–20 January, 17–20 January, 16–20 January, and so forth). For this elaboration, five mean daily discharges derived from the Maillet recession analysis (Q0) were used. The statistical significance of the correlation between antecedent cumulative precipitation and daily discharge volume was assessed using a two-tailed Pearson correlation test, with a significance level of p < 0.05. The corresponding correlation coefficient and p-value were calculated for the identified precipitation response window.
This procedure allows identification of the temporal window over which precipitation influences Spring discharge. A longer response interval indicates a greater capacity of the Spring system to buffer periods of reduced recharge and, consequently, a higher resilience to drought events.

Derived Recession Parameters

Spring recession curves, corresponding to periods unaffected by precipitation and characterized by a progressive decrease in discharge following a recharge event, were analyzed to derive the Maillet recession coefficients and quantify the aquifer depletion rate [25]. The parameters describing the Spring behavior were determined using the exponential recession model proposed by Maillet:
Qt   =   Q 0 e ( α t )
where Qt is the Spring discharge at time (t) during the depletion of the aquifer storage, Q0 is the Spring discharge at the initial time t0, e is the base of the natural logarithm (e ≈ 2.71828), and α represents the recession coefficient.
Starting from the Maillet equation, several parameters characterizing the Spring were calculated [25,26]. The recession coefficient (α) was determined according to:
α = (log Q0 − log Qt)/(0.43429⋅t)
where α is the recession coefficient, and 0.43429 is the value of log10(e), used to convert natural logarithms to base-10 logarithms. Logarithms are expressed in base 10 throughout this study. Furthermore, it is inversely related to the effective porosity, the length and thickness of the saturated zone, and the dynamic groundwater volume stored within the aquifer. The coefficient of determination R2 was calculated to assess the goodness of fit of the recession analysis.
The storage volume of the Spring (W0), corresponding to the theoretical dynamic storage associated with the fitted recession segment, i.e., at the beginning of the recession period, was calculated as:
W0 = (86,400⋅Q0)/α
The depletion capacity (ΔWi) represents the dynamic groundwater resource discharged in the absence of infiltration between the onset of recession and the end of the depletion period. This parameter allows estimation of the volume of regulating groundwater reserves released annually and of the potentially exploitable water volume through a Spring-capture system:
ΔWi = 86,400⋅(Q0/α)⋅(1 − e(−αt))
The renewal time (tmr) represents the time required for the complete regeneration of the groundwater reserve. This parameter is expressed in years because it refers to an interannual average and is calculated as:
tmr = W0/ΔWi
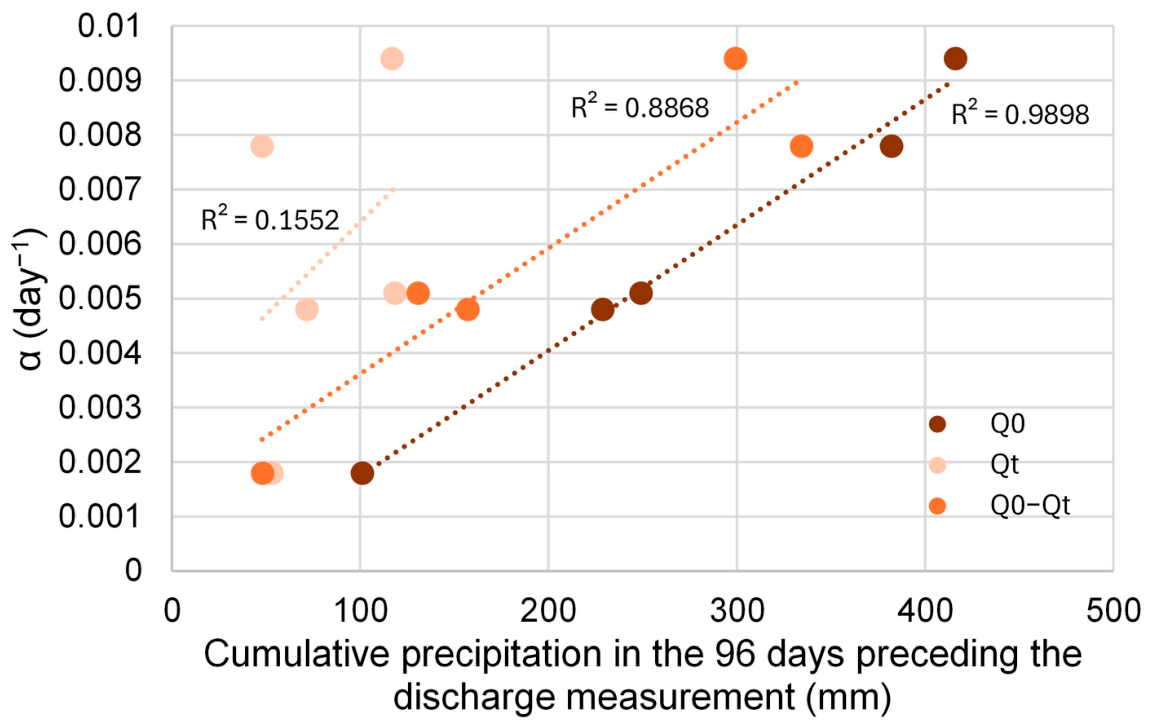
Subsequently, in order to confirm the influence of cumulative precipitation on the defined hydrogeological parameters, α was correlated with the cumulative precipitation values measured at the Champdepraz station during the days preceding the Q0 and Qt dates, as well as with the difference in cumulative precipitation between Q0 and Qt. The time interval considered for cumulative precipitation was defined based on the previous correlation analysis.

4. Results

4.1. Spring Data

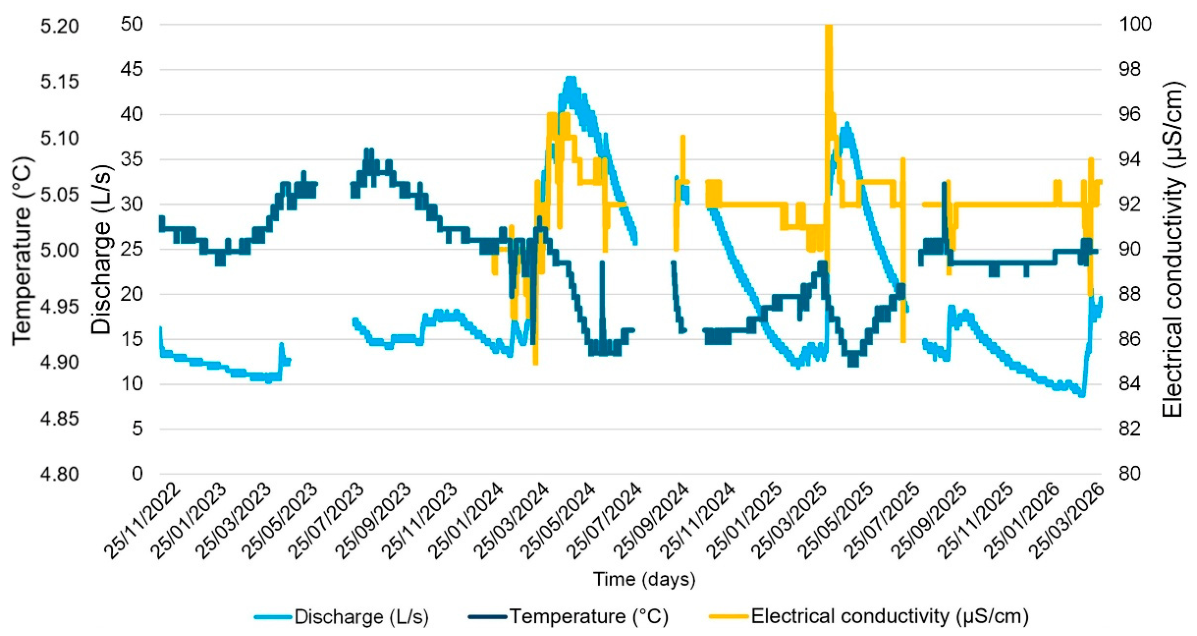
The water temperature of the Perrot Spring (Figure 2) exhibits a mean value of 5.0 °C and a remarkably stable thermal regime, with a total variation range of less than 0.2 °C (minimum: 4.90 °C; maximum: 5.09 °C). The minimum temperature was recorded at the end of May 2025, whereas the maximum occurred at the end of August 2023.
When aggregated at the monthly scale, the data generally show a maximum during summer and a minimum during winter, although this seasonal pattern is not entirely regular. Spring discharge exhibits a mean value of 19.4 L/s over the monitoring period and is characterized by temporal variability. The minimum discharge, equal to 8.7 L/s, was recorded in early March 2026, whereas the maximum discharge of 44.1 L/s occurred in May 2024. From the beginning of the monitoring period until March 2024, discharge remained within a relatively narrow range between 10 and 18 L/s, followed by a marked increase and an approximately twofold rise between April and May 2024. During both 2024 and 2025, two distinct seasonal discharge peaks can be identified: the first occurring in April–May and the second between late September and October. The Spring discharge peaks reached 44.1 and 39.0 L/s during spring 2024 and 2025, respectively, whereas the autumn peaks reached 33.0 and 18.6 L/s in 2024 and 2025, respectively. Considering monthly averages, the highest mean discharge was observed in May 2024 (41.7 L/s), whereas the lowest occurred in February 2026 (9.8 L/s).
A visual comparison between water temperature and discharge indicates that variations in discharge exert only a limited influence on Spring temperature. However, a more detailed examination of the temperature time series reveals seasonal oscillations, with lower values occurring during the late winter–spring period. In particular, these temperature fluctuations generally show an inverse relationship with discharge variations, as clearly observed during February–May 2024 and April–May 2025. Conversely, during periods characterized by lower discharge and limited discharge variability, such as before February 2024, the temporal evolution of the two parameters often appears concordant.
Electrical conductivity exhibits a mean value of 92 µS/cm and a relatively narrow temporal variability, ranging between 85 and 103 µS/cm. The visual comparison between electrical conductivity and water temperature shows no clear relationship between these variables. In contrast, electrical conductivity and Spring discharge appear to exhibit a generally direct relationship. These observations indicate that, despite the limited temporal variability of water temperature and electrical conductivity, the magnitude of Spring discharge significantly influences their behavior.

Stable Isotopes

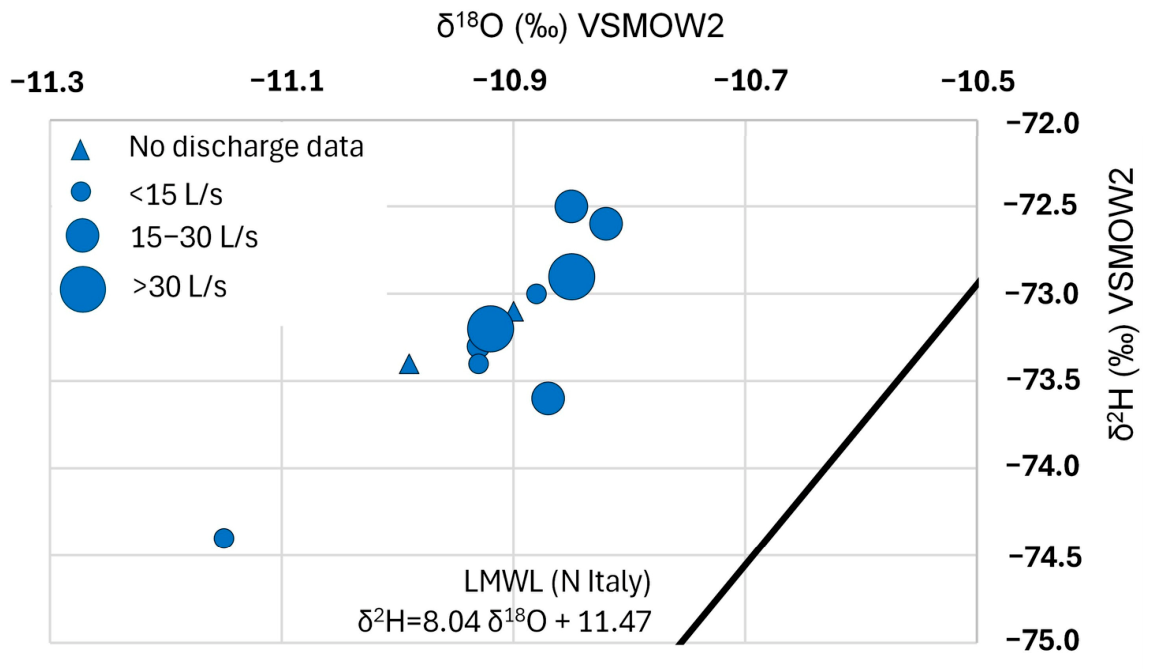
The isotopic data collected at the Perrot Spring between March 2023 and May 2024 show limited variability despite the samples having been collected during different seasons [δ18O (min/max) −11.15/−10.82‰; δ2H (min/max) −74.4/−72.5‰] (Table 1).
Furthermore, comparison with previous isotopic investigations conducted within the potential recharge area [36] indicates that the Spring has an intermediate isotopic composition and lower variability than both surface waters [δ18O (min/max) −13.4/−9.8‰; δ2H (min/max) −96.0/−58.5‰] and precipitation [δ18O (min/max) −15.5/−4.6‰; δ2H (min/max) −92.8/−26.4‰].
The comparison between isotopic composition and Spring discharge does not reveal any consistent relationship between these variables (Figure 3). A similar heterogeneous behavior is also observed when isotopic data are compared with Spring water temperature and electrical conductivity.

4.2. Meteorological Data

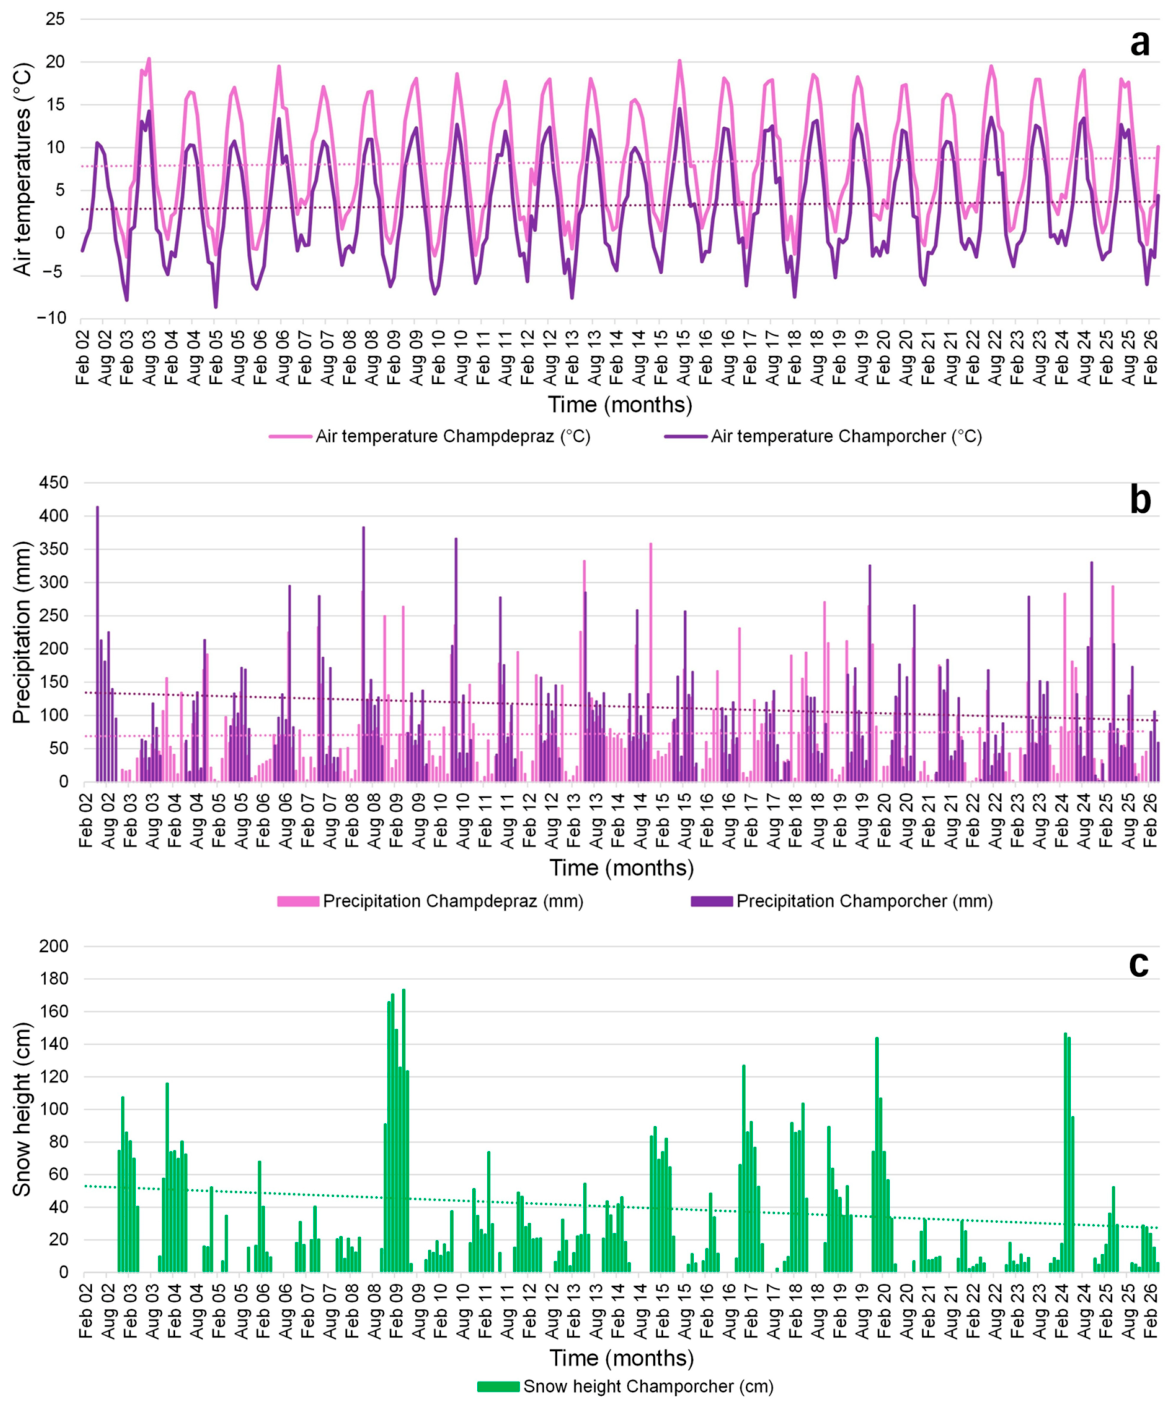
For the period 2002–2026, the mean daily air temperature at the Champdepraz station, located at approximately the same elevation as the Spring and only a few hundred meters away, was 8.4 °C, with values ranging between −11.6 and 25.2 °C. The minimum and maximum daily mean temperatures were recorded in February 2012 and June 2019, respectively. At the Champorcher station, located close to the potential recharge area of the Spring, the mean daily air temperature was 3.3 °C, with values ranging between −18.1 and 22.1 °C. The minimum and maximum temperatures were recorded in February 2018 and June 2019, respectively. As expected, the higher-elevation Champorcher station recorded lower temperatures than the Champdepraz station.
Considering monthly mean temperatures, the minimum and maximum values at the Champdepraz station were recorded in February 2003 (−2.8 °C) and August 2003 (20.4 °C), respectively. At the Champorcher station, the minimum monthly mean temperature occurred in February 2005 (−8.6 °C), whereas the maximum was recorded in July 2015 (14.6 °C) (Figure 4a).
Regarding precipitation, the wettest day at the Champdepraz station occurred on 16 April 2025, with a cumulative rainfall of 137.2 mm. At the Champorcher station, the highest daily precipitation was recorded on 2 October 2020, with a cumulative rainfall of 130.8 mm. At the monthly scale, the wettest months were November 2014 at Champdepraz, with a cumulative precipitation of 358.8 mm, and May 2002 at Champorcher, with 414.0 mm. Over the entire study period, days without liquid precipitation accounted for 5992 out of 8533 days at Champdepraz (70.2%) and 6812 out of 8746 days at Champorcher (77.9%). The wettest periods therefore correspond to the spring months (March–May), followed by the late summer and early autumn period (September–November) (Figure 4b).
The maximum daily snow height at the Champorcher station was recorded on 17 December 2008 and reached 292.4 cm. Considering monthly averages over the entire observation period, the highest value occurred in April 2009, with a mean snow height of 173.5 cm (Figure 4c). The period characterized by the greatest snow accumulation generally extends from January to April, with an average snow height of 45.8 cm, whereas during the autumn and early winter months (September–December) the mean monthly snow height is 34.9 cm. Over the entire study period, snow cover was present on 3687 of the 8746 monitored days, corresponding to 42.2%.
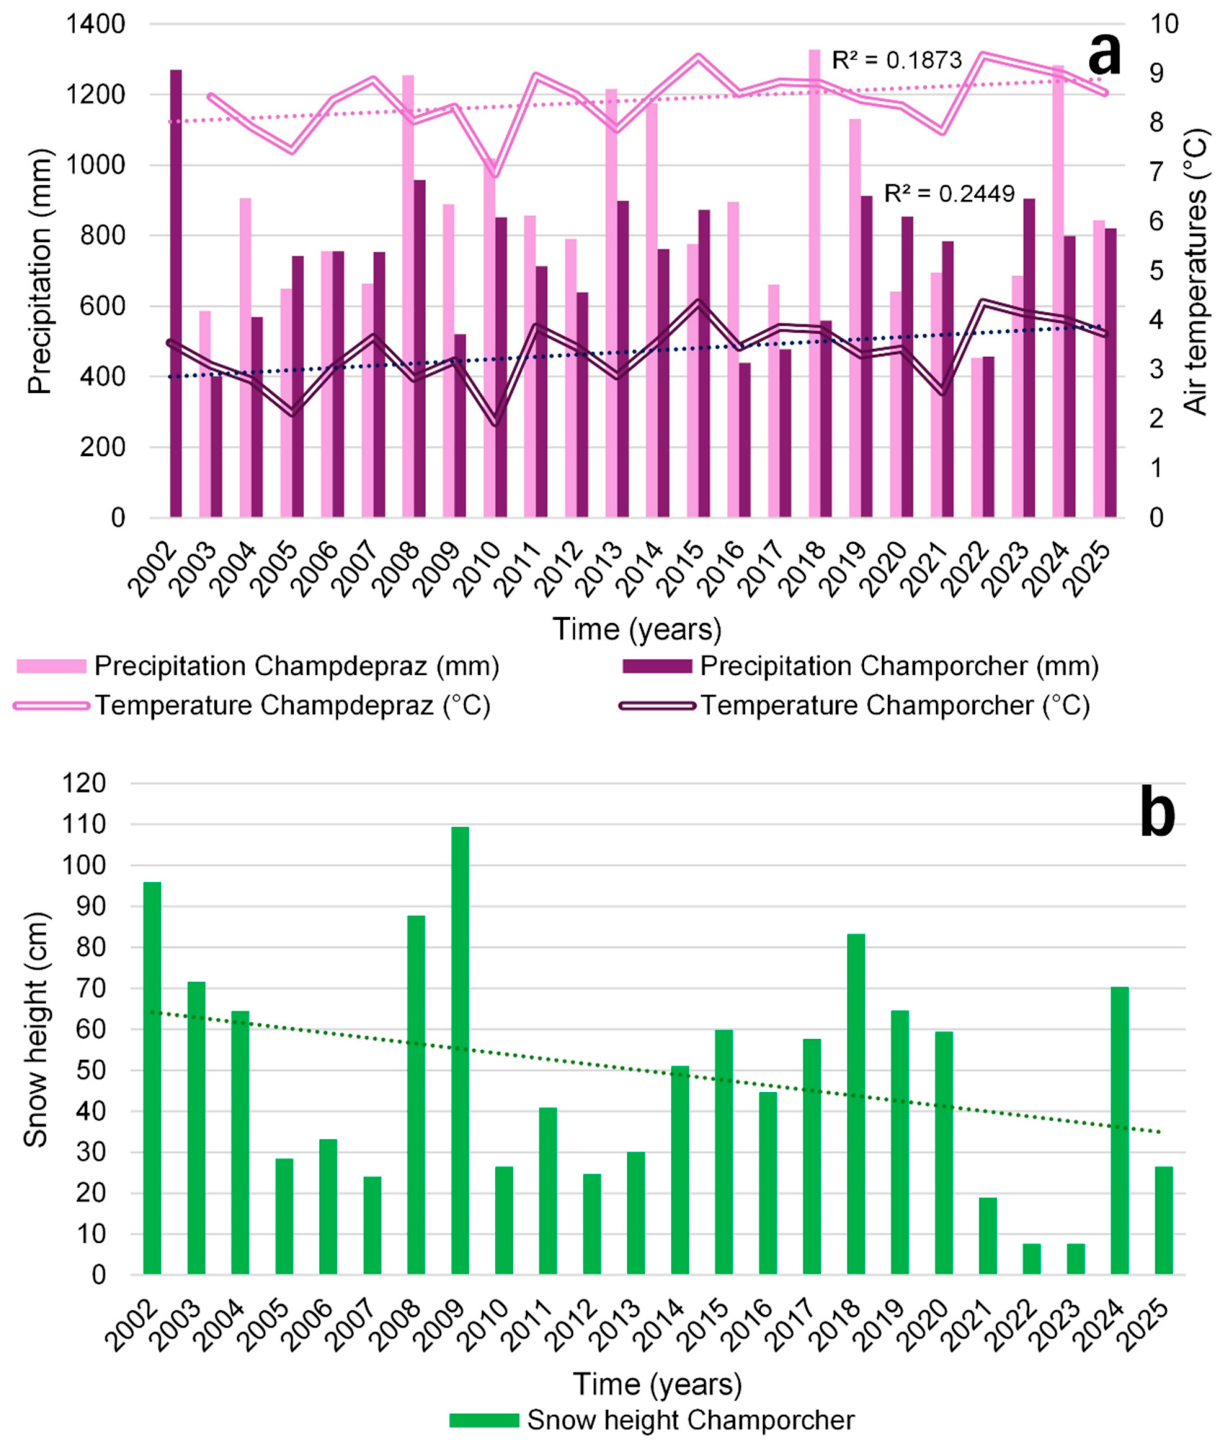
Regarding the analysis of annual averages, the mean of the annual mean air temperatures is 8.5 °C at Champdepraz and 3.4 °C at Champorcher. The coldest year was 2010, with annual mean temperatures of 6.9 °C and 1.9 °C at Champdepraz and Champorcher, respectively. Conversely, the warmest year was 2022, with annual mean temperatures of 9.4 °C and 4.4 °C, respectively (Figure 5a).
The mean annual cumulative precipitation amounts to 876 mm at Champdepraz and 738 mm at Champorcher. The driest years were 2022 at Champdepraz, with an annual precipitation of 454 mm, and 2003 at Champorcher, with 401 mm. Conversely, the wettest years were 2018 at Champdepraz, with 1327 mm, and 2008 at Champorcher, with 958 mm (Figure 5a).
The mean annual snow height at the Champorcher station is 49 cm. The lowest annual mean value was recorded in 2022, averaging 7 cm, whereas the highest occurred in 2009, with an average snow height of 109 cm (Figure 5b).
From a statistical perspective, the absence of significant serial autocorrelation in the meteorological time series was observed. The results of the decadal monthly trend analysis performed using the Mann–Kendall test do not reveal statistically significant trends in air temperature at either station. Regarding precipitation, no robust trend is evident at the Champdepraz station, whereas the precipitation data from the Champorcher station exhibit a statistically significant decreasing trend. Snow height also shows a statistically significant negative trend (Table 2).
The analysis of decadal annual trends indicates that annual mean air temperatures increased significantly over the 2002–2025 period at both stations. In contrast, annual cumulative precipitation does not show any significant temporal trend and therefore remains substantially stable over the period. Snow height, however, exhibits a statistically significant decreasing trend (Table 2).
To further investigate decadal changes, an additional analysis was conducted on the evolution of monthly cumulative precipitation and mean monthly snow height (Table 3).
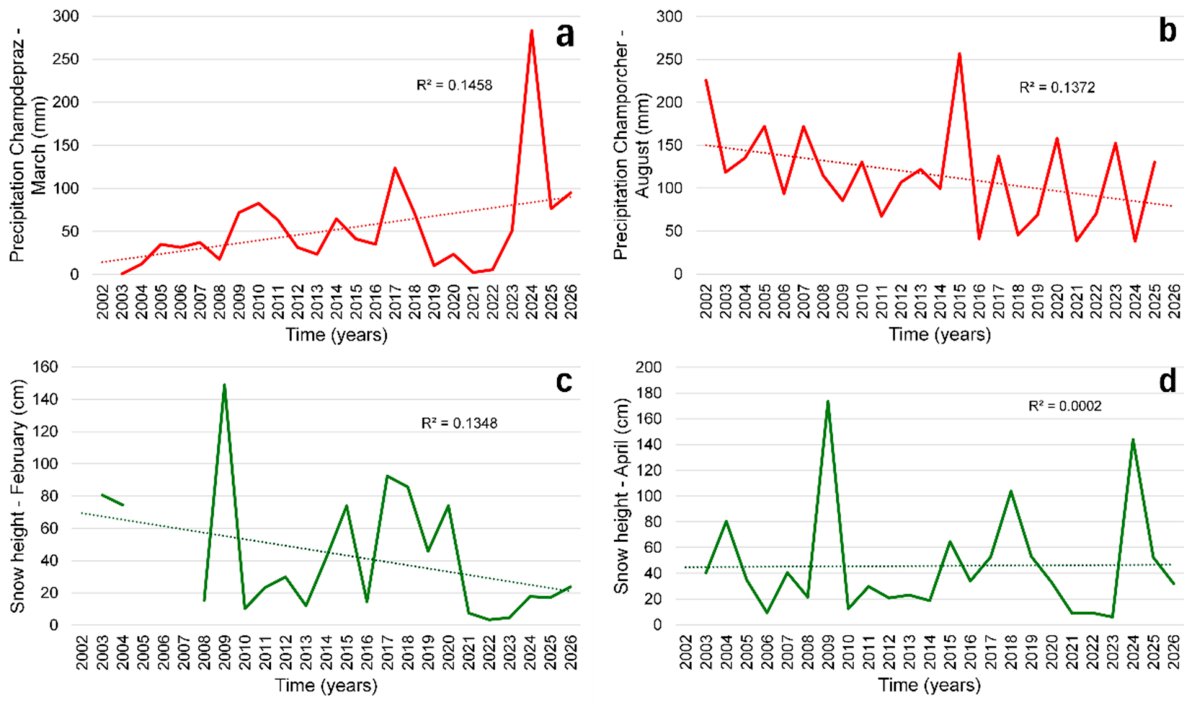
For monthly cumulative precipitation at Champdepraz, statistically significant increasing trends are observed in March, April, June and October, whereas statistically significant decreasing trends occur in July, August, September, November and December. No significant trends are detected in January, February and May (Figure 6a).
For monthly cumulative precipitation at Champorcher, a statistically significant increasing trend is observed only in October, whereas statistically significant decreasing trends occur in May, June, July, August and September. Months without significant trends were not identified because the remaining winter months did not receive sufficient liquid precipitation to allow application of the test (Figure 6b).
Regarding mean monthly snow height at Champorcher, statistically significant decreasing trends occur in January, February, May, October, November and December. No significant trends are detected in March and April, whereas the data available for the remaining summer months are insufficient for the application of the test (Figure 6c,d).

4.3. Comparison Between Spring and Meteorological Data

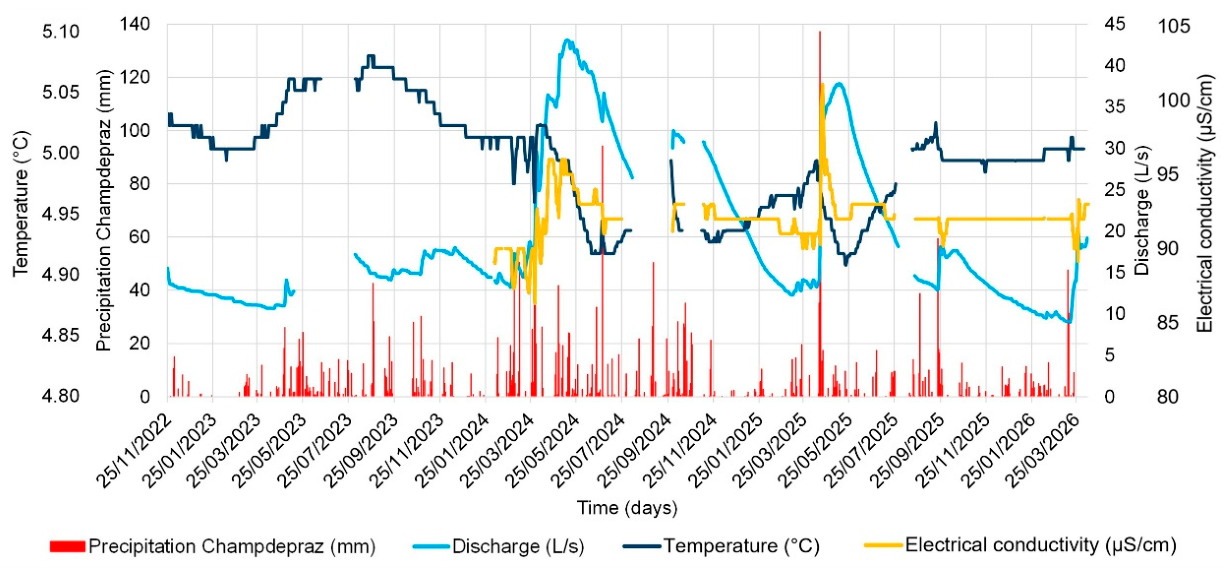
The comparison between meteorological data and the hydrological parameters of the Perrot Spring shows that the seasonal pattern of Spring water temperature, despite its limited temporal variability, closely follows the seasonal evolution of air temperature recorded at both meteorological stations. Liquid precipitation recorded at the Champdepraz station does not appear to exert a significant influence on Spring water temperature (Figure 7).
Increases in Spring discharge appear to be associated both with isolated heavy rainfall events and with periods characterized by several consecutive days of more moderate precipitation (Figure 7). In particular, the intense rainfall event that occurred on 16–17 April 2025 (two-day cumulative precipitation of 216 mm) resulted in an immediate doubling of Spring discharge, increasing from 14 to 32 L/s within 72 h.
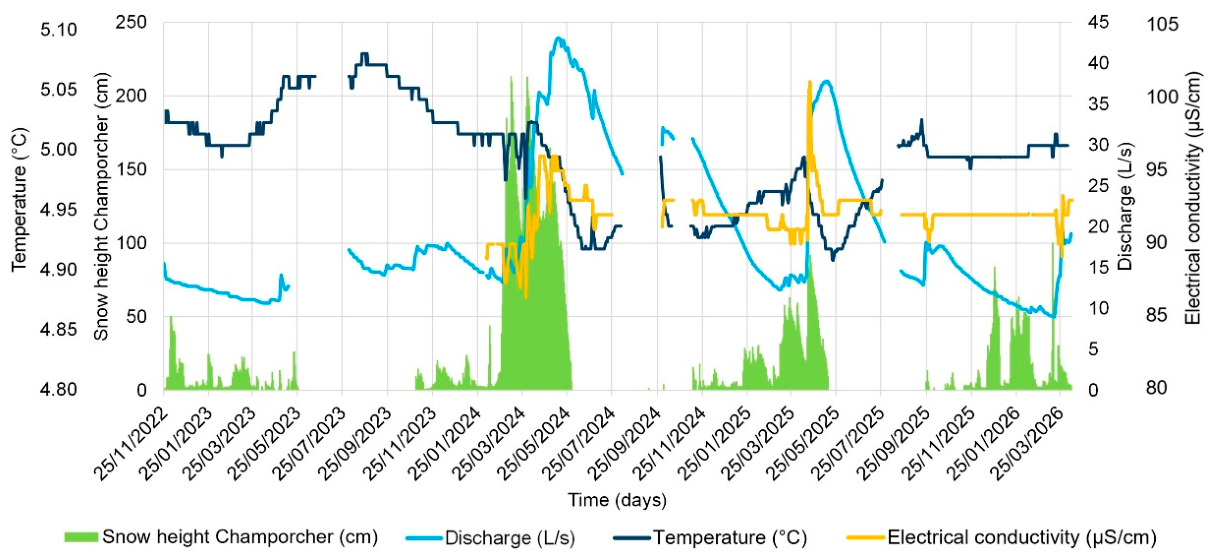
Snow height measured at the Champorcher station clearly influences Spring water temperature. In particular, temperatures below 5.0 °C are mainly recorded following snowmelt and the infiltration of colder meltwater, as clearly observed during the Spring seasons of 2024 and 2025 (Figure 8).
Spring discharge is also strongly affected by snow cover conditions, with discharge values exceeding 20 L/s occurring exclusively during periods characterized by abundant snow accumulation at higher elevations (Figure 8). Furthermore, the mean Spring discharge approximately doubles during the snowmelt period. In particular, considering the substantial snow accumulation observed in March 2024 and March 2025, a marked increase in Spring discharge can be observed as snow depth progressively decreases. Variations in electrical conductivity also appear to be directly related to precipitation and snowmelt processes (Figure 7 and Figure 8).
The temporal relationship between infiltration inputs derived from precipitation and the quantitative response of the Spring was investigated through correlation analyses between the two variables. The analysis produced a curve characterized by a progressive increase in the coefficient of determination (R2) up to an antecedent period of 96 days. Extending the accumulation period beyond this threshold resulted in a decrease in the R2 value. Therefore, considering the precipitation accumulated over the 96 days preceding the discharge data, the maximum R2 value of 0.905 is reached. The corresponding correlation is statistically significant (r = 0.916, p < 0.001)
This result indicates that precipitation occurring during approximately the 100 days preceding a discharge measurement significantly influences the quantitative state of the Spring. The strong correlation identified through this analysis is also illustrated by the binary plot shown in Figure 9.

Hydrogeological Parameters

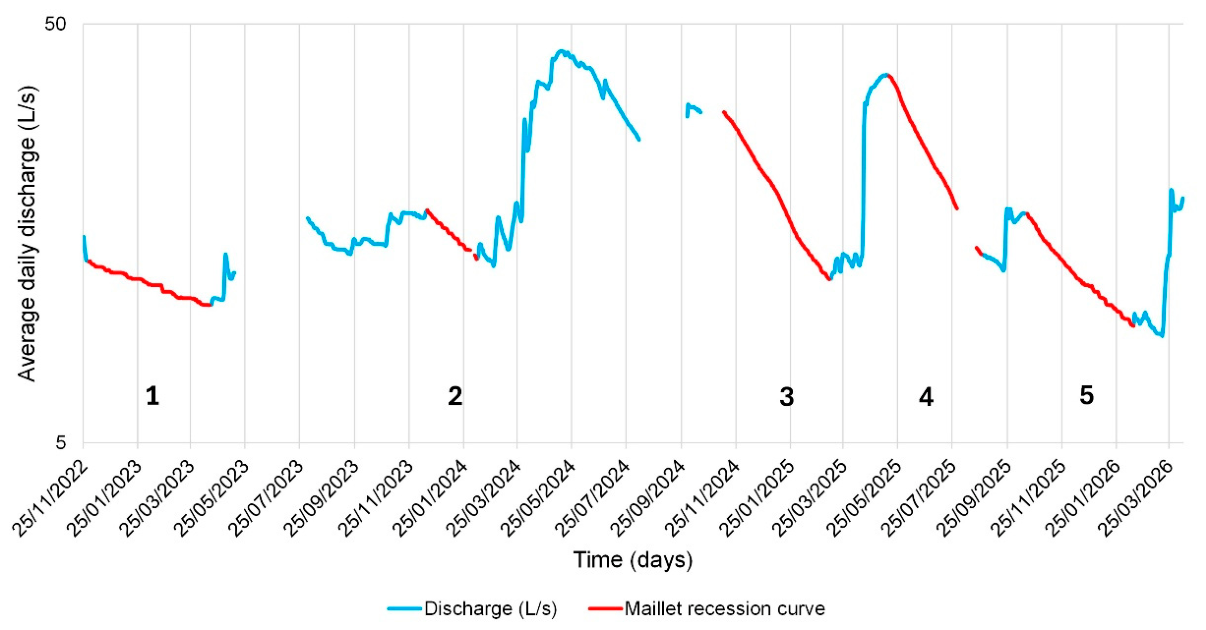
Five recession periods were selected to calculate the hydrogeological parameters described above, including four during the late autumn–winter periods (2022–2023, 2023–2024, 2024–2025, and 2025–2026) and one during the spring–summer period of 2025 (Figure 10). The results obtained for the characteristic parameters of the Perrot Spring are reported in Table 4.
Overall, the calculated parameters exhibit considerable variability, reflecting the temporal fluctuations in Spring discharge. The recession coefficients range from 0.0018 to 0.0094 day−1 and are therefore relatively low. The theoretical dynamic groundwater storage volume at the beginning of the recession period W0 indicates relevant amounts of stored water, ranging from 295,829 to 666,837 m3. The depletion capacity ΔWi varies between 64,979 and 192,208 m3. Finally, the renewal time tmr, representing the time required for the complete regeneration of groundwater storage, ranges from 1.79 to 5.55 years.
The correlation between α and the cumulative precipitation over the 96 days preceding Q0 and Qt, and the difference between the cumulative precipitation values at Q0 and Qt, highlights important relationships. The correlation considering the antecedent precipitation at Q0 was very strong (R2 = 0.99), whereas an absence of relationship was obtained using antecedent precipitation at Qt (R2 = 0.16). A strong correlation was also observed between α and the difference in cumulative precipitation between Q0 and Qt (R2 = 0.89) (Figure 11).

5. Discussion

The analyzed meteorological data identify a setting characterized by relevant meteorological variability within the investigated mountain environment. The three considered variables exhibit regular intra-annual variability associated with seasonal fluctuations. Focusing on decadal trends, annual mean air temperatures show marked increases of approximately 1 °C over the last 24 years at both monitoring stations, consistent with the climate warming observed at the global scale.
In contrast, annual cumulative liquid precipitation exhibits greater decadal stability. However, analyses performed at the monthly scale reveal important trends. In particular, at the Champorcher station, monthly precipitation totals during the late spring and summer months (May–September) display a decreasing trend, resulting in a reduced contribution of precipitation to groundwater recharge within the Chalamy River catchment. At the Champdepraz station, precipitation generally shows increasing trends or stable conditions during the first half of the year, whereas a predominantly decreasing trend is observed during the second half of the year. The increase in precipitation during the late winter and spring months (February–June) may represent a response to rising air temperatures, suggesting a gradual shift from snowfall to rainfall.
Regarding snow heights, predominantly decreasing trends are observed during the autumn, winter, and spring seasons. This behavior is likely related to the increase in air temperature. However, particular attention should be paid to the months of March and April, when snowmelt is at its maximum and streamflow and Spring discharge typically increase. During these months, snow height does not exhibit significant temporal changes. This behavior may contribute to the persistence of the characteristic Spring discharge peak of the Perrot Spring, which occurs precisely during this period.
The reduction in both rainfall and snowfall during the summer and autumn months may lead to future water-stress conditions, as the summer season is typically characterized by the highest water demand and by reduced discharges in both streams and water supply springs.
With regard to the Spring parameters, the temperature of groundwater discharge in Alpine environments is strongly influenced by the extent and mean elevation of the recharge area. Springs generally exhibit seasonal temperature fluctuations of several degrees Celsius, induced by precipitation and snowmelt processes. In some cases, the influence of meteorological variables on Spring characteristics is delayed, with response times ranging from a few hours to several weeks.
The nearly constant temperature of the Perrot Spring suggests the presence of a deep groundwater circulation component able to homogenize the temperature of newly infiltrated waters and buffer the aquifer against seasonal air-temperature fluctuations. The mean Spring-water temperature is relatively low compared with other Alpine springs located at similar elevations. The existence of deep groundwater circulation may explain these low temperatures, suggesting that the Spring is recharged from high-altitude areas. An additional factor contributing to the low water temperature may be the north-facing exposure of both the slope and the potential recharge area, resulting in reduced solar radiation.
Electrical conductivity also exhibits extremely limited temporal variability, whereas Spring discharge is characterized by marked fluctuations.
The limited discharge variability observed prior to March 2024 can be attributed, at least in part, to the exceptional meteorological conditions that affected the entire western Alpine region during 2022 and 2023 [48], particularly the occurrence of exceptionally dry winters. In the following years, with the end of the drought period, the typical seasonal discharge peaks reappeared. The pronounced increases in discharge during these two seasonal peaks reflect the hydrological response to winter–spring and autumn precipitation.
The temporal behavior of these three parameters therefore suggests the predominance of dispersive groundwater circulation processes, leading to a homogenization of the physicochemical response (i.e., an absence of marked variations), as indicated by the limited changes in temperature and electrical conductivity despite relevant discharge fluctuations. More specifically, the system exhibits homogenization processes that are only weakly influenced by other mechanisms, namely piston flow for electrical conductivity (a response concordant with discharge variations) and replacement processes for temperature (a response opposite to discharge variations). Groundwater systems characterized by dispersive circulation are generally associated with medium and low permeability and an extensive saturated zone [49]. The analysis of monthly mean trends in Spring parameters did not reveal any statistically significant trends. This behavior suggests a good degree of resilience of the groundwater system to seasonal dry periods.
The response of the Spring to infiltration inputs, namely liquid precipitation and snowmelt, exhibits a dual behavior. First, the Spring responds rapidly to recharge inputs, with discharge doubling within a few hours, a behavior potentially related to the propagation of hydraulic pressure signals. On the other hand, precipitation occurring during approximately 100 days preceding discharge measurements significantly influences the quantitative state of the Spring. These results suggest the existence of a slow groundwater circulation component.
This interpretation is further supported by isotopic evidence. The almost complete absence of temporal variability in the isotopic composition of the Spring, despite the relevant discharge fluctuations, suggests the existence of a groundwater circulation system that promotes effective mixing of infiltrating precipitation within the aquifer, also linked to a large volume of releasable stored groundwater.
This conceptual model is also consistent with the results obtained from the Maillet recession analysis. The recession curve analysis, through the determination of the Maillet coefficient and related parameters, suggests the presence of a large aquifer characterized by important recharge and relatively slow depletion.
The markedly stronger relationship between α and antecedent cumulative precipitation at Q0 than at Qt indicates that the differences in recession coefficients among the five periods are closely associated with the meteorological conditions preceding the start of the recession. The strong correlation obtained for the difference in cumulative precipitation between Q0 and Qt further suggests that differences in the antecedent recharge conditions between the beginning and the end of the recession are reflected in the observed variability of α. Similarly, the variability of the other hydrogeological parameters is also influenced by cumulative precipitation. Overall, these relationships indicate that the recession behavior of the spring varies according to the meteorological conditions preceding and accompanying each recession period.
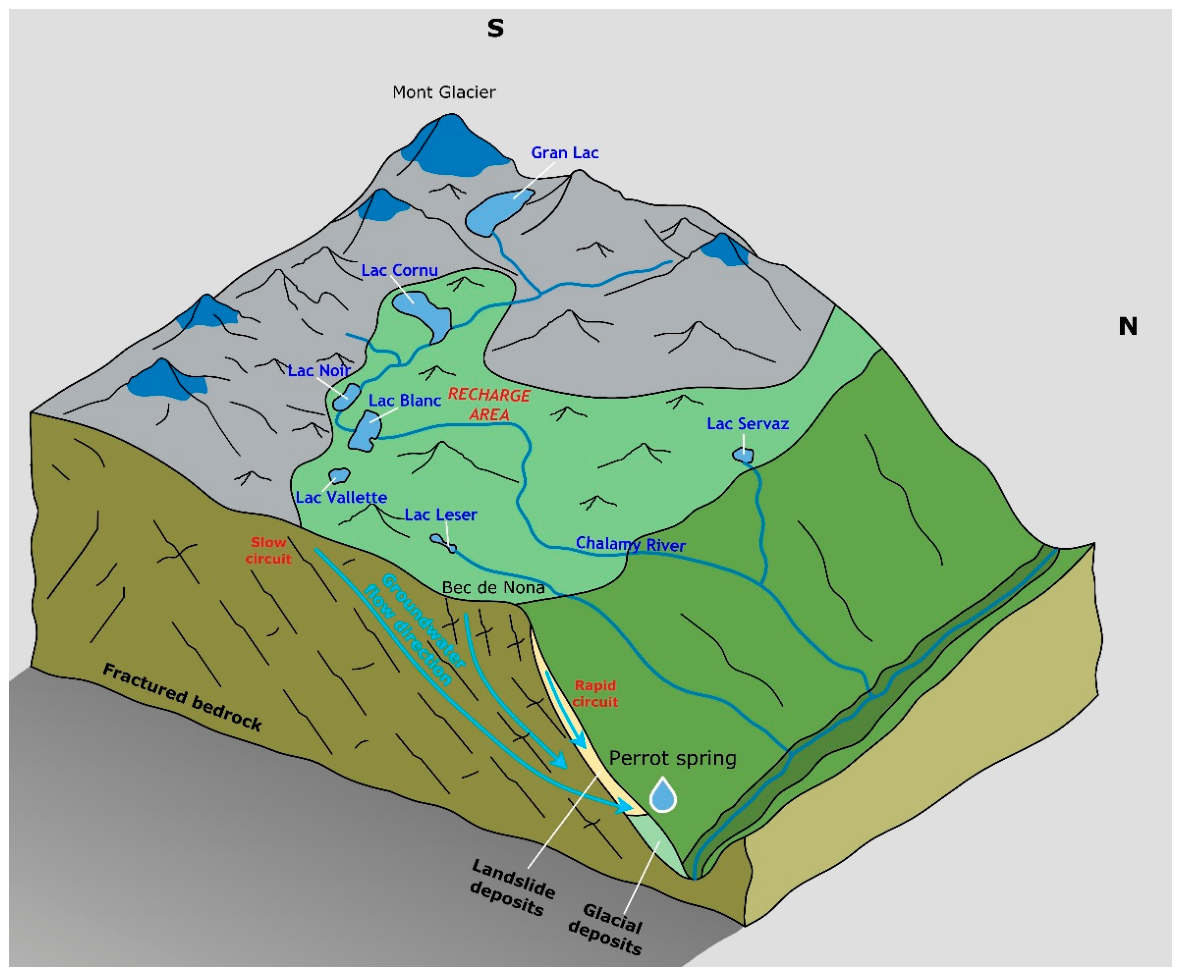
Considering all the available evidence, a conceptual model involving at least two response components is supported: (i) a rapid component, probably related to the infiltration of precipitation in areas proximal to the Spring, and (ii) a slower component potentially associated with a large recharge area extending to high elevations (Figure 12). In the context of the local geological setting, the rapid infiltration of precipitation is considered plausible within the highly permeable deposits in the area adjacent to the Spring, identified in a previous study [33]. As concerns the slower component, it may potentially be favored by the lacustrine bodies located in the recharge area, which may induce a more constant infiltration, and by the fracture systems, identified in a previous study [50], which may converge groundwater flow towards the Spring.
In addition, the predominance of dispersive groundwater circulation induces a homogenization of the physicochemical response, resulting in limited temporal variability.
The direct relationship between discharge and electrical conductivity, the latter with limited variations and mainly observed only during important discharge increase, could be influenced to the simultaneous rapid infiltration of precipitation in the area close to the Spring.
Rapid increases in spring discharge following rainfall inputs have been observed in hydrogeological settings characterized by rapid infiltration and groundwater flow processes [51,52]. Similarly, cases in which seasonal discharge fluctuations are associated with stable water temperature and physicochemical parameters have been documented in settings where deep recharge and substantial mixing within the aquifer reservoir occur [53,54]. A comparable two-component flow system has been documented elsewhere, comprising a relatively deep fissure–pore groundwater circulation characterized by a delayed response to precipitation events and a shallower, fissure-controlled flow component that reacts rapidly to rainfall and is superimposed on the slower system [55].
Despite the variations in groundwater temperature and chemistry induced by climate change and observed in the nearby Piedmont plain aquifers defined in previous studies [56,57,58], the absence of significant temporal variability in the Perrot Spring, together with the decadal meteorological analyses presented in this study, indicates a good short-term resilience to seasonal dry periods, but the observed decadal meteorological trends could still pose a future threat.
Despite the insights provided by the integrated analysis, some limitations should be recognized. First, although the approximately four-year monitoring period of the Perrot Spring is sufficient to identify seasonal variability and the short-term response to precipitation inputs, it is relatively short for assessing longer-term changes in groundwater system behavior and for directly evaluating the effects of the decadal meteorological trends identified from the meteorological records. Second, the absence of direct monitoring of river and lake water levels within the potential recharge area prevents a more detailed evaluation of the contribution of surface-water bodies and snowmelt processes to groundwater recharge. Consequently, the proposed rapid and slower response components represent a conceptual interpretation supported by the combined hydrogeological, physicochemical and isotopic evidence, rather than a direct reconstruction of groundwater flow paths. Despite these limitations, the results can therefore be considered reliable to better understand the hydrodynamic behavior of the mountain Spring.
From a practical management perspective, the results support the adoption of measures aimed at protecting the recharge areas and adapting water-resource management to the seasonal and decadal variability identified in the study. In particular, this highlights the importance of protecting the recharge area from activities that could affect groundwater quality. The observed seasonal variability in precipitation, snow dynamics and spring discharge also suggests that water abstraction should account for periods of reduced recharge and discharge, particularly during summer and autumn, when both precipitation and snow accumulation are reduced, and water demand is typically higher.
Continuous monitoring of spring discharge, together with meteorological and physicochemical parameters, should therefore be maintained to identify changes in groundwater availability and to support timely adjustments in water-use planning. Finally, the decadal meteorological trends identified in this study indicate that management strategies should be considered due to the potential progressive reduction in recharge inputs, thereby supporting the long-term protection and sustainable management of mountain drinking-water sources.
Mountain groundwater systems are particularly important in regulating water availability because they converge recharge occurring over different elevations, seasons, and timescales. The coexistence of a rapid response component and a slower groundwater circulation component, together with the mixing of infiltrating precipitation within the aquifer, indicates that different groundwater processes operate at different temporal scales and contribute to the observed response of the Spring to precipitation inputs.
Consequently, changes in precipitation and snow dynamics may affect discharge without producing immediately detectable changes in water temperature, electrical conductivity, or isotopic composition. This highlights the importance of considering groundwater response times and aquifer buffering when assessing the sensitivity of mountain groundwater systems to climatic variability. More broadly, the integration of discharge, meteorological, physicochemical, and isotopic data provides a transferable approach for identifying different groundwater response times and constraining the processes controlling spring behavior. Such an approach can be applied to other mountain springs where rapid infiltration pathways coexist with slower groundwater circulation and storage, providing a basis for assessing both the resilience of groundwater systems to short-term variability and their potential long-term vulnerability under changing recharge conditions. The results therefore highlight the value of integrated monitoring not only for site-specific spring characterization but also for improving the understanding and sustainable management of mountain groundwater resources.

6. Conclusions

This study revealed a complex hydrodynamic behavior of the Perrot Spring. The findings support a conceptual model involving at least two response components: (i) a rapid component, probably associated with the infiltration of precipitation in areas proximal to the Spring, and (ii) a slower component potentially related to an extensive recharge area extending to high elevations. The Spring exhibits a rapid response to precipitation inputs, with discharge doubling within a few hours, together with a slower response related to precipitation accumulated over approximately 100 days. Despite the marked seasonal fluctuations in Spring discharge, these components promote homogenization processes, resulting in little or no temporal variability in the physicochemical parameters, stable isotope compositions, and water temperature of the Spring.
These behaviors were observed through an integrated analysis of 24 years of meteorological observations and Spring monitoring conducted in the 2022–2026 period. The approach combined several complementary methods, including continuous monitoring of quantitative, physicochemical, and isotopic Spring parameters, determination of the Maillet recession coefficients, and the assessment of decadal meteorological trends.
Overall, the investigated aquifer system appears to exhibit low sensitivity to seasonal dry periods. Nevertheless, the observed increase in air temperature, decrease in annual snowfall, the reduction in liquid precipitation during the summer months, and the increase in spring precipitation indicate ongoing meteorological changes that could negatively affect the groundwater system in the future. The recession analysis further indicates that the recession behavior of the Spring varies according to the meteorological conditions preceding and accompanying each recession period.
This study therefore clarifies the response of the mountain Spring to precipitation inputs, revealing how temporal variations in discharge, electrical conductivity, water temperature, and stable isotopes are influenced by groundwater circulation. Furthermore, the dual behavior of the Spring in response to meteorological variability was highlighted.
This methodology offers a transferable approach for spring characterization in hydrogeological settings characterized by geological complexity, which gives rise to multiple recharge components and large discharge variability coexisting with stable physicochemical parameters over time.
From a practical perspective, continued long-term monitoring of Spring discharge, meteorological conditions, and physicochemical parameters is recommended to detect possible changes in groundwater-system behavior. Protection of the recharge area and water abstraction planning should account for periods of reduced recharge and discharge, particularly during summer and autumn. Further characterization, including minor and trace elements, could provide additional information on recharge processes and groundwater flow paths. Finally, the assessment of groundwater hydrodynamics provides essential information for the development of effective management strategies for this important drinking water resource and supports its long-term sustainability under conditions of increasing meteorological variability.

Author Contributions

Conceptualization, D.C., M.L. and D.A.D.L.; methodology, D.C.; validation, M.L. and D.A.D.L.; data curation, E.E.; writing—original draft preparation, D.C.; writing—review and editing, M.L. and D.A.D.L.; visualization, D.C., M.L., D.B. and D.A.D.L. All authors have read and agreed to the published version of the manuscript.

Funding

This research received no external funding.

Data Availability Statement

The original data presented in the study relating to meteorological variables are openly available at https://presidi2.regione.vda.it/str_dataview_download (accessed on 16 May 2026). Spring data are available at the Mont Avic Natural Park.

Acknowledgments

The authors thank the Mont Avic Natural Park Authority for the data made available and cooperation during the investigation.

Conflicts of Interest

The authors declare no conflicts of interest.

References

  1. Hayashi, M. Alpine Hydrogeology: The Critical Role of Groundwater in Sourcing the Headwaters of the World. Groundwater 2020, 58, 498–510. [Google Scholar] [CrossRef] [Scilit]
  2. Somers, L.D.; McKenzie, J.M. A review of groundwater in high mountain environments. WIREs Water 2020, 7, e1475. [Google Scholar] [CrossRef] [Scilit]
  3. Bonacci, O.; Pipan, T.; Culver, D.C. A framework for karst ecohydrology. Environ. Geol. 2009, 56, 891–900. [Google Scholar] [CrossRef] [Scilit]
  4. Ciotoli, G.; Guerra, M. Distribution and physico-chemical data of Italian bottled natural mineral waters. J. Maps 2016, 12, 917–935. [Google Scholar] [CrossRef] [Scilit]
  5. Taylor, R.G.; Scanlon, B.; Doll, P.; Rodell, M.; van Beek, R.; Wada, Y.; Longuevergne, L.; Leblanc, M.; Famiglietti, J.S.; Edmunds, M.; et al. Groundwater and climate change. Nat. Clim. Change 2013, 3, 322–329. [Google Scholar] [CrossRef] [Scilit]
  6. De Luca, D.A.; Cerino Abdin, E.; Forno, M.G.; Gattiglio, M.; Gianotti, F.; Lasagna, M. The Montellina Spring as an Example of Water Circulation in an Alpine DSGSD Context (NW Italy). Water 2019, 11, 700. [Google Scholar] [CrossRef] [Scilit]
  7. Jukic, D.; Denic-Jukic, V. Investigating relationships between rainfall and karst-spring discharge by higher-order partial correlation functions. J. Hydrol. 2015, 530, 24–36. [Google Scholar] [CrossRef] [Scilit]
  8. Caetano Bicalho, C.; Batiot Guilhe, C.; Seidel, J.L.; Van Exter, S.; Jourde, H. Geochemical evidence of water source characterization and hydrodynamic responses in a karst aquifer. J. Hydrol. 2012, 450–451, 206–218. [Google Scholar] [CrossRef] [Scilit]
  9. Gullacher, A.; Allen, D.M.; Goetz, J.D. Early warning indicators of groundwater drought in mountainous regions. Water Resour. Res. 2023, 59, e2022WR033399. [Google Scholar] [CrossRef] [Scilit]
  10. Cuthbert, M.O.; Gleeson, T.; Moosdorf, N.; Befus, K.M.; Schneider, A.; Hartmann, J.; Lehner, B. Global patterns and dynamics of climate–groundwater interactions. Nat. Clim. Change 2019, 9, 137–141. [Google Scholar] [CrossRef] [Scilit]
  11. Leone, G.; Pagnozzi, M.; Catani, V.; Ventafridda, G.; Esposito, L.; Fiorillo, F. A Hundred Years of Caposele Spring Discharge Measurements: Trends and Statistics for Understanding Water Resource Availability under Climate Change. Stoch. Environ. Res. Risk Assess. 2020, 35, 345–370. [Google Scholar] [CrossRef] [Scilit]
  12. Vremec, M.; Seelig, M.; Seelig, S.; Collenteur, R.; Haslinger, K.; Wagner, T.; Eybl, J.; Winkler, G. Trend analysis of Alpine spring discharge: Interplay between climate and discharge characteristics. Sci. Total Environ. 2025, 993, 179875. [Google Scholar] [CrossRef] [Scilit]
  13. Bastiancich, L.; Lasagna, M.; Mancini, S.; Falco, M.; De Luca, D.A. Temperature and discharge variations in natural mineral water springs due to climate variability: A case study in the Piedmont Alps (NW Italy). Environ. Geochem. Health 2022, 44, 1971–1994. [Google Scholar] [CrossRef] [Scilit]
  14. Diak, M.; Böttcher, M.E.; Ehlert von Ahn, C.M.; Hong, W.L.; Kędra, M.; Kotwicki, L.; Koziorowska-Makuch, K.; Kuliński, K.; Lepland, A.; Makuch, P.; et al. Permafrost and groundwater interaction: Current state and future perspective. Front. Earth Sci. 2023, 11, 1254309. [Google Scholar] [CrossRef] [Scilit]
  15. Moradi, H.; Furrer, G.; Margreth, M.; Mair, D.; Wanner, C. Massive mobilization of toxic elements from an intact rock glacier in the central Eastern Alps. Cryosphere 2024, 18, 5153–5171. [Google Scholar] [CrossRef] [Scilit]
  16. Giese, M.; Caballero, Y.; Hartmann, A.; Charlier, J.B. Trends in long-term hydrological data from European karst areas: Insights for groundwater recharge evaluation. Hydrol. Earth Syst. Sci. 2025, 29, 3037–3054. [Google Scholar] [CrossRef] [Scilit]
  17. Matheswaran, K.; Khadka, A.; Dhaubanjar, S.; Bharati, L.; Kumar, S.; Shrestha, S. Delineation of spring recharge zones using environmental isotopes to support climate-resilient interventions in two mountainous catchments in Far-Western Nepal. Hydrogeol. J. 2019, 27, 2181–2197. [Google Scholar] [CrossRef] [Scilit]
  18. Machida, I.; Ono, M.; Kamitani, T.; Muranaka, Y. Applicability of d-excess and 17O-excess as groundwater tracers for determination of recharge area. Hydrogeol. J. 2022, 30, 2027–2041. [Google Scholar] [CrossRef] [Scilit]
  19. Ma, B.; Jin, M.; Liang, X.; Li, J. Application of environmental tracers for investigation of groundwater mean residence time and aquifer recharge in fault-influenced hydraulic drop alluvium aquifers. Hydrol. Earth Syst. Sci. 2019, 23, 427–446. [Google Scholar] [CrossRef] [Scilit]
  20. Keegan-Treloar, R.; Irvine, D.J.; Werner, A.D.; Banks, E.W. Identifying groundwater recharge and discharge zones using geostatistical simulation of hydraulic head and its derivatives. J. Hydrol. 2023, 617, 128993–129617. [Google Scholar] [CrossRef] [Scilit]
  21. Gizzi, M.; Mondani, M.; Taddia, G.; Suozzi, E.; Lo Russo, S. Aosta Valley Mountain Springs: A Preliminary Analysis for Understanding Variations in Water Resource Availability under Climate Change. Water 2022, 14, 1004. [Google Scholar] [CrossRef] [Scilit]
  22. Cantonati, M.; Lichtenwöhrer, K.; Leonhardt, G.; Seifert, L.; Mustoni, A.; Hotzy, R.; Schubert, E.; Blattner, L.; Bilous, O.; Lotz, A.; et al. Using Springs as Sentinels of Climate Change in Nature Parks North and South of the Alps: A Critical Evaluation of Methodological Aspects and Recommendations for Long-Term Monitoring. Water 2022, 14, 2843. [Google Scholar] [CrossRef] [Scilit]
  23. Gizzi, M.; Bianco, F.; Suozzi, E.; Fiorucci, A.; Taddia, G. Revealing spring discharge variability through Long-Term Hydrogeological Monitoring: Insights from case studies in the Aosta Valley. Acque Sotter.-Ital. J. Groundw. 2026, 15, 41–49. [Google Scholar] [CrossRef] [Scilit]
  24. Boussinesq, J. Recherches théoriques sur l’écoulement des nappes d’eau infiltrées dans le sol et sur le débit des sources. J. Math. Pure Appl. 1904, 10, 5–78. [Google Scholar]
  25. Maillet, E. Essais d’hydraulique Souterraine et Fluviale; Herman et Cie: Paris, France, 1905; Volume 1, p. 218. [Google Scholar]
  26. Cerino Abdin, E.; Taddia, G.; Gizzi, M.; Lo Russo, S. Reliability of spring recession curve analysis as a function of the temporal resolution of the monitoring dataset. Environ. Earth Sci. 2021, 80, 249. [Google Scholar] [CrossRef] [Scilit]
  27. Grappein, B.; Lasagna, M.; Capodaglio, P.; Caselle, C.; De Luca, D.A. Hydrochemical and Isotopic Applications in the Western Aosta Valley (Italy) for Sustainable Groundwater Management. Sustainability 2021, 13, 487. [Google Scholar] [CrossRef] [Scilit]
  28. Lo Russo, S.; Suozzi, E.; Gizzi, M.; Taddia, G. SOURCE: A semi-automatic tool for spring-monitoring data analysis and aquifer characterisation. Environ. Earth Sci. 2021, 80, 710. [Google Scholar] [CrossRef] [Scilit]
  29. Santillán-Quiroga, L.M.; Cocca, D.; De Luca, D.A.; Marchina, C.; Egidio, E.; Franco, F.E.; Núnez Moreno, M.S.; Chariguamán Maurisaca, N.E.; Lasagna, M. Isotopic insights into the recharge dynamics of aquifers in the Chimborazo Volcanic Region (Riobamba, Ecuador). J. S. Am. Earth Sci. 2026, 106243, 183. [Google Scholar] [CrossRef]
  30. Al Atawneh, D.; Cartwright, N.; Bertone, E. Climate change and its impact on the projected values of groundwater recharge: A review. J. Hydrol. 2021, 126602, 601. [Google Scholar] [CrossRef] [Scilit]
  31. Fontana, E.; Panseri, M.; Tartarotti, P. Oceanic Relict Textures in the Mount Avic Serpentinites, Western Alps. Ofioliti 2008, 33, 105–118. [Google Scholar]
  32. Zanoni, D.; Rebay, G.; Bernardoni, J.; Spalla, M.I. Using Multiscale Structural Analysis to Infer High-/Ultra high-Pressure Assemblages in Subducted Rodingites of the Zermatt-Saas Zone at Valtournanche, Italy. J. Virtual Explor. 2012, 41, 290. [Google Scholar] [CrossRef] [Scilit]
  33. Forno, M.G.; Gattiglio, M.; Ghignone, S.; De Luca, D.A.; Santillan Quiroga, L.M. Geological Significance of the Perrot Spring in Mont Avic Natural Park (NW Alps). Water 2023, 15, 3042. [Google Scholar] [CrossRef] [Scilit]
  34. Dal Piaz, G.V.; Gianotti, F.; Monopoli, B.; Pennacchioni, G.; Tartarotti, P.; Schiavo, A. Note Illustrative Della Carta Geologica d’Italia Alla Scala 1:50.Foglio 091 “Chatillon”; ISPRA: Rome, Italy, 2010; 152p. [Google Scholar]
  35. Gizzi, M.; Narcisi, R.; Mondani, M.; Taddia, G. Comprehending mountain springs’ hydrogeological perspectives under climate change in Aosta Valley (Northwestern Italy): New automated tools and simplified approaches. Ital. J. Eng. Geol. Environ. 2023, 73–80. [Google Scholar] [CrossRef]
  36. Santillán-Quiroga, L.M.; Cocca, D.; Lasagna, M.; Marchina, C.; Destefanis, E.; Forno, M.G.; Gattiglio, M.; Vescovo, G.; De Luca, D.A. Analysis of the Recharge Area of the Perrot Spring (Aosta Valley) Using a Hydrochemical and Isotopic Approach. Water 2023, 15, 3756. [Google Scholar] [CrossRef] [Scilit]
  37. Cremonese, E.; Avanzi, F.; Ratto, S.M.; Pogliotti, P.; Filippa, G.; Stevenin, H.; Mammoliti Mochet, A.; Ercolani, G.; Gabellani, S.; Fosson, J.P. Impatti dei Cambiamenti Climatici sul Regime Idrologico Della Valle d’Aosta. Regione Autonoma Valle d’Aosta, ARPA Valle d’Aosta, 2021, Fondazione CIMA, Fondazione Montagna Sicura. Available online: https://cf.regione.vda.it/media/clima/cambiamenti-climatici/cambiamenti-climatici-VDA.pdf (accessed on 27 June 2026).
  38. Gobiet, A.; Kotlarski, S.; Beniston, M.; Heinrich, G.; Rajczak, J.; Stoffel, M. 21st century climate change in the European Alps-A review. Sci. Total Environ. 2014, 493, 1138–1151. [Google Scholar] [CrossRef] [Scilit]
  39. Matiu, M.; Crespi, A.; Bertoldi, G.; Carmagnola, C.M.; Marty, C.; Morin, S.; Schöner, W.; Cat Berro, D.; Chiogna, G.; De Gregorio, L.; et al. Observed snow depth trends in the European Alps: 1971 to 2019. Cryosphere 2021, 15, 1343–1382. [Google Scholar] [CrossRef] [Scilit]
  40. Giustini, F.; Brilli, M.; Patera, A. Mapping oxygen stable isotopes of precipitation in Italy. J. Hydrol. Reg. Stud. 2016, 8, 162–181. [Google Scholar] [CrossRef] [Scilit]
  41. Centro Funzionale Regione Autonoma Valle d’Aosta. Available online: https://presidi2.regione.vda.it/str_dataview_download (accessed on 18 May 2026).
  42. Mann, H.B. Nonparametric test against trend. Econometrica 1945, 13, 245–259. [Google Scholar] [CrossRef] [Scilit]
  43. Kendall, M. Multivariate Analysis; Charles Griffin Co., Ltd.: London, UK, 1975; p. 210. [Google Scholar]
  44. ISPRA. Linee Guida per la Valutazione Delle Tendenze Ascendenti e D’inversione Degli Inquinanti Nelle Acque Sotterranee (DM 6 Luglio 2016) (Guidelines for the Assessment of Upward and Downward Trends of Pollutants in Groundwater (Ministerial Decree 6 July 2016)). ISPRA, Manuali e Linee Guida 161/2017 ISBN 978-88-448-0844-0. Available online: https://www.isprambiente.gov.it/it/pubblicazioni/manuali-e-linee-guida/linee-guida-per-la-valutazione-delle-tendenze-ascendenti-e-dinversione-degli-inquinanti-nelle-acque-sotterranee-dm-6-luglio-2016 (accessed on 21 June 2026).
  45. Sen, P.K. Estimates of the Regression Coefficient Based on Kendall’s Tau. J. Am. Stat. Assoc. 1968, 39, 1379–1389. [Google Scholar] [CrossRef]
  46. Theil, H. A Rank-Invariant Method of Linear and Polynomial Regression Analysis. In Henri Theil’s Contributions to Economics and Econometrics; Raj, B., Koerts, J., Eds.; Advanced Studies in Theoretical and Applied Econometrics; Springer: Dordrecht, The Netherlands, 1992; Volume 23, pp. 345–381. ISBN 978-94-010-5124-8. [Google Scholar]
  47. Ljung, G.M.; Box, G.E.P. On a measure of lack of fit in time series models. Biometrika 1978, 65, 297–303. [Google Scholar] [CrossRef]
  48. ARPA Piemonte. Rapporto Sulla Situazione Idrica in Piemonte Nel 2023. Arpa Piemonte, 2023. Available online: https://www.arpa.piemonte.it/sites/default/files/media/2024-05/RapportosituazioneidricainPiemonte_2023.pdf (accessed on 29 June 2026).
  49. Vigna, B.; D’Angeli, I.M.; Fiorucci, A.; De Waele, J. Hydrogeological flow in gypsum karst areas: Some examples from northern Italy and main circulation models. Int. J. Speleol. 2017, 46, 205–217. [Google Scholar] [CrossRef] [Scilit]
  50. Fontana, E.; Tartarotti, P.; Panseri, M.; Buscemi, S. Geological map of the Mount Avic massif (Western Alps Ophiolites). J. Maps 2015, 11, 126–135. [Google Scholar] [CrossRef] [Scilit]
  51. Li, G.; Goldscheider, N.; Field, M.S. Modeling karst spring hydrograph recession based on head drop at sinkholes. J. Hydrol. 2016, 542, 820–827. [Google Scholar] [CrossRef] [Scilit]
  52. Chang, W.; Wan, J.; Tan, J.; Wang, Z.; Jiang, C.; Huang, K. Responses of Spring Discharge to Different Rainfall Events for Single-Conduit Karst Aquifers in Western Hunan Province, China. Int. J. Environ. Res. Public Health 2021, 18, 5775. [Google Scholar] [CrossRef] [Scilit]
  53. Fiorillo, F.; Leone, G.; Pagnozzi, M.; Catani, V.; Testa, G.; Esposito, L. The Upwelling Groundwater Flow in the Karst Area of Grassano-Telese Springs (Southern Italy). Water 2019, 11, 872. [Google Scholar] [CrossRef] [Scilit]
  54. Torresan, F.; Fabbri, P.; Piccinini, L.; Dalla Libera, N.; Pola, M.; Zampieri, D. Defining the hydrogeological behavior of karst springs through an integrated analysis: A case study in the Berici Mountains area (Vicenza, NE Italy). Hydrogeol. J. 2020, 28, 1229–1247. [Google Scholar] [CrossRef] [Scilit]
  55. Mostowik, K.; Krzyczman, D.; Płaczkowska, E.; Rzonca, B.; Siwek, J.; Waclawczyk, P. Spring recharge and groundwater flow patterns in flysch aquifer in the Polonina Wetlińska Massif in the Carpathian Mountains. J. Mt. Sci. 2021, 18, 819–833. [Google Scholar] [CrossRef] [Scilit]
  56. Egidio, E.; Mancini, S.; De Luca, D.A.; Lasagna, M. The Impact of Climate Change on Groundwater Temperature of the Piedmont Po Plain (NW Italy). Water 2022, 14, 2797. [Google Scholar] [CrossRef] [Scilit]
  57. Cocca, D.; Lasagna, M.; De Luca, D.A. Groundwater Chemical Trends Analyses in the Piedmont Po Plain (NW Italy): Comparison with Groundwater Level Variations (2000–2020). Water 2024, 16, 1240. [Google Scholar] [CrossRef] [Scilit]
  58. Zaniboni, L.; De Luca, D.A.; Egidio, E.; Cocca, D.; Filipello, A.; Lasagna, M. Understanding groundwater behaviour in urban environments: Thermal and piezometric analysis in the Turin city area (NW Italy). Groundw. Sustain. Dev. 2025, 30, 101472. [Google Scholar] [CrossRef] [Scilit]
Figure 1. Geological map of the study area with the location of the Perrot Spring and meteorological stations.
Water 18 02100 g001
Figure 2. Temperature, discharge and electrical conductivity of the Perrot Spring in the 2022–2026 period (measurements every 15 min).
Water 18 02100 g002
Figure 3. δ18O vs. δ2H diagram of the Perrot Spring in the 2023–2024 period with discharge values.
Water 18 02100 g003
Figure 4. (a) Monthly average air temperatures at the Champdepraz and Champorcher stations. (b) Monthly precipitation cumulatives at the Champdepraz and Champorcher stations. (c) Monthly average snow heights at the Champorcher station. For the 2002–2026 period.
Water 18 02100 g004
Figure 5. (a) Annual average air temperatures and annual precipitation cumulatives at the Champdepraz and Champorcher stations and (b) annual averages of snow heights at the Champorcher station (2002–2025 period).
Water 18 02100 g005
Figure 6. Example of cumulative precipitation trends for the months of March at the Champdepraz station (a) and August at the Champorcher station (b) over the period 2002–2026. Snow height trends for the months of February and April at the Champorcher station (c,d) over the period 2002–2026.
Water 18 02100 g006
Figure 7. Cumulative daily liquid precipitation recorded at the Champdepraz meteorological station (1260 m a.s.l.) vs. daily mean Perrot Spring data (temperature, discharge, electrical conductivity).
Water 18 02100 g007
Figure 8. Snow recorded at the Champorcher meteorological station (2181 m a.s.l.) vs. Perrot Spring data (temperature, discharge, electrical conductivity). Daily averages.
Water 18 02100 g008
Figure 9. Correlation between mean daily discharge and cumulative precipitation in the 96 days preceding the discharge measurement (numbers correspond to the selected period reported in Table 4).
Water 18 02100 g009
Figure 10. Maillet recession curves selected (numbers correspond to the selected period reported in Table 4).
Water 18 02100 g010
Figure 11. Correlation between α and the cumulative precipitation over the 96 days preceding Q0 and Qt, and with the difference between the cumulative precipitation values at Q0 and Qt.
Water 18 02100 g011
Figure 12. Conceptual model of the two groundwater recharge components for the Perrot Spring in the Chalamy Valley.
Water 18 02100 g012
Table 1. δ18O and δ2H values of the Perrot Spring in the 2023–2024 period.
Dateδ18Oδ2H
24 March 2023−11.15−74.40
28 June 2023−10.99−73.40
13 July 2023−10.90−73.10
25 August 2023−10.93−73.30
22 September 2023−10.88−73.00
25 October 2023−10.93−73.40
27 November 2023−10.82−72.60
13 December 2023−10.85−72.50
26 February 2024−10.91−73.20
28 March 2024−10.87−73.60
24 April 2024−10.92−73.20
3 May 2024−10.85−72.90
Table 2. Mann–Kendall test results for decadal trends in the 2002–2026 period for monthly and annual data and Theil–Sen trend line slope (+: increasing trend, -: decreasing trend, No: absence of trend).
ParameterTrendp-ValueTheil–Sen
Trend Line
Slope
Monthly dataAir temperatures
Champdepraz
No0.1620.051
Air temperatures
Champorcher
No0.164−1.384
Precipitation ChampdeprazNo0.4630.044
Precipitation Champorcher-0.033−0.037
Snow height Champorcher-0.001−0.705
Annual dataAir temperatures
Champdepraz
+0.0292.067
Air temperatures
Champorcher
+0.0122.904
Precipitation ChampdeprazNo0.4160.034
Precipitation ChamporcherNo0.2840.045
Snow height Champorcher-0.009−1.057
Table 3. Mann–Kendall test results for decadal trends in individual months for the 2002–2026 period and Theil–Sen trend line slope (+: increasing trend, -: decreasing trend, No: absence of trend, /: no test).
ParameterJanFebMarAprMayJunJulAugSepOctNovDec
Precipitation ChampdeprazTrendNoNo++No+---+--
p-Value0.2070.3460.0120.0310.2460.0190.0290.0110.0480.0080.0180.024
Theil–Sen
Trend Line
Slope
−0.3640.0061.9880.3621.8671.556−0.727−1.400−0.0752.300−2.320−0.850
Precipitation ChamporcherTrend////NoNo--No-//
p-Value////0.3710.4800.0140.0310.3370.011//
Theil–Sen
Trend Line
Slope
////0.7831.062−1.084−2.537−1.2452.756//
Snow height ChamporcherTrend--NoNo-////---
p-Value0.0130.0070.3270.3760.007////0.0040.0040.008
Theil–Sen
Trend Line
Slope
−1.331−1.3920.594−0.132−1.534////−0.507−1.286−0.964
Table 4. Hydrogeological parameters of the Perrot Spring for the five recession curves.
ParameterPeriod 1Period 2Period 3Period 4Period 5Unit
Q00.0135 (1 December 2022)0.0180 (15 December 2023)0.0308 (11 November 2024)0.0375 (15 May 2025)0.0176 (17 October 2025)m3/s
Qt0.0107 (15 April 2023)0.0137 (8 February 2024)0.0123 (9 March 2025)0.0141 (26 August 2025)0.0095 (13 February 2026)m3/s
t13656118104120Days
α0.00180.00480.00780.00940.0051Day−1
R20.98960.99270.98500.97110.9659-
Mean Absolute Error0.0000940.0001260.0003550.0017420.000493m3/s
W0666,837321,234341,816344,220295,829m3
ΔWi120,24764,979182,830192,208119,028m3
tmr5.554.941.871.792.49years
Disclaimer/Publisher’s Note: The statements, opinions and data contained in all publications are solely those of the individual author(s) and contributor(s) and not of MDPI and/or the editor(s). MDPI and/or the editor(s) disclaim responsibility for any injury to people or property resulting from any ideas, methods, instructions or products referred to in the content.