Article

Multidimensional Assessment of Hydroclimatic Changes in Northern Cyprus

by
Hasan Zaifoglu
Civil Engineering Program, Middle East Technical University, Northern Cyprus Campus, Guzelyurt via Mersin 10, 99738 Kalkanli, Türkiye
Water 2026, 18(16), 2050; https://doi.org/10.3390/w18162050
Submission received: 8 June 2026 / Revised: 30 July 2026 / Accepted: 12 August 2026 / Published: 21 August 2026
(This article belongs to the Section Hydrology)

Abstract

Climate change is driving hydroclimatic changes that are not fully captured by conventional trend analyses. This study presents a multidimensional assessment of hydroclimatic changes in Northern Cyprus using observational records from 27 precipitation stations and 12 temperature stations, with precipitation records spanning 35–46 years and temperature records spanning 21–30 years. Modified Mann–Kendall (MMK), Pettitt (PT), Innovative Trend Analysis (ITA), and Structural Trend and Variability Identification (STVI) methods were integrated to examine monotonic trends, abrupt shifts, distribution-dependent changes, and mean–variability interactions at annual and seasonal scales. Results revealed pronounced spatial heterogeneity and seasonal asymmetry in precipitation totals and their temporal evolution. Increasing tendencies were mainly concentrated in the Kyrenia mountainous region and parts of the western coast, whereas several eastern coastal stations showed drying tendencies, particularly in spring. Winter exhibited the most coherent wetting signal, while spring was more fragmented and drying-dominated. Monthly mean of daily maximum temperature (Tmax) and monthly mean of daily minimum temperature (Tmin) generally showed widespread warming, although Tmin responses were more localized and season-dependent. ITA indicated asymmetric precipitation behavior, with medium and high precipitation values generally increasing, while low values often decreased or showed mixed responses. STVI further revealed that precipitation changes involved substantial restructuring of both mean and variability components, whereas temperature changes were mainly mean-driven. The findings provide a more comprehensive understanding of evolving hydroclimatic conditions, which can support climate adaptation and water resources management in semi-arid Mediterranean regions.

1. Introduction

Climate change has emerged as one of the most critical drivers of hydroclimatic variability, fundamentally altering the magnitude, timing, and variability structure of precipitation and temperature regimes worldwide. In recent decades, increasing temperatures, shifting precipitation characteristics, and enhanced climate variability have imposed substantial pressure on water resources, ecosystems, agriculture, and urban infrastructure [1,2,3]. These changes are particularly significant in the Mediterranean Basin, which is widely recognized as a climate change hotspot due to its high sensitivity to warming, decreasing precipitation amounts, and increasing hydroclimatic variability [4,5,6]. In such regions, even relatively small shifts in climate conditions may lead to disproportionately large impacts on hydrological systems and water availability.
The island of Cyprus, situated in the Eastern Mediterranean region, is considered especially vulnerable to hydroclimatic changes due to its semi-arid climate, limited freshwater resources, and increasing environmental pressures [6,7,8,9]. Previous studies conducted in Cyprus have consistently reported increasing temperature trends, changes in precipitation characteristics, and intensification of hydroclimatic variability under changing climate conditions [10,11,12,13]. Particularly in Northern Cyprus, several studies have identified significant warming trends and complex precipitation behavior, including pronounced spatial variability and contrasting regional responses [14,15,16,17]. These spatially contrasting responses are likely associated with the combined influence of orographic controls, land–sea interactions, and transitional Mediterranean atmospheric dynamics, which collectively produce highly heterogeneous local hydroclimatic regimes. These findings suggest that hydroclimatic changes in the region exhibit strong spatial and temporal heterogeneity, which cannot be adequately explained by approaches focusing solely on changes in mean conditions.
Most previous studies investigating hydroclimatic changes have primarily relied on conventional monotonic trend analysis methods, such as the Mann–Kendall test and Sen’s slope (SS) estimator, to detect long-term changes in precipitation and temperature series [18,19,20,21]. While these methods provide robust and widely accepted measures of trend direction and magnitude, they are inherently limited in capturing the full structure of hydroclimatic variability. In particular, hydroclimatic changes may happen through hidden trends, abrupt shifts, non-monotonic behavior, and variability transitions, which cannot be fully characterized using a single statistical approach [22,23,24]. Moreover, conventional trend analyses mainly emphasize changes in mean conditions, whereas changes in variability and distributional characteristics may play a dominant role in shaping hydroclimatic behavior, especially in semi-arid environments where extremes and fluctuations are critical [25]. As a result, analyses based solely on classical trend methods may oversimplify hydroclimatic evolution and potentially overlook important structural changes occurring within different segments of the climatic distribution.
Recent methodological developments have introduced alternative approaches to address these limitations. Innovative Trend Analysis (ITA) enables the identification of hidden and non-monotonic trends without requiring strict assumptions, such as normality or independence, and provides insights into different segments of the data distribution [22,26,27,28,29]. Most recently, the Structural Trend and Variability Identification (STVI) framework allows simultaneous evaluation of changes in both mean conditions and variability characteristics, offering a more comprehensive perspective on hydroclimatic dynamics [30]. Unlike conventional trend frameworks that primarily quantify average directional change, ITA and STVI capture distinct dimensions of hydroclimatic nonstationarity. ITA reveals whether change is concentrated in the low, medium, or high portions of the ordered distribution, whereas STVI separates structural change into mean and variability components and, when implemented through overlapping windows, evaluates their temporal persistence and reversal. Their integration links distribution-dependent signals to the underlying mean and variability dynamics. Thus, it distinguishes the hydroclimatic changes that may exhibit similar record-wide trends but arise from different statistical structures.
Despite these advances, integrated studies that simultaneously evaluate monotonic trends, distributional behavior, abrupt changes, and variability transitions within a unified analytical framework remain limited. Existing studies often adopt a single methodological perspective, which may lead to incomplete or potentially misleading interpretations of hydroclimatic change. This limitation is particularly important in semi-arid Mediterranean environments, where hydroclimatic evolution is frequently characterized by strong seasonal asymmetry, high interannual variability, and nonuniform responses across different intensity classes. In addition, the spatial consistency of hydroclimatic trends across different climatic regions of Northern Cyprus has not been comprehensively assessed using quality-controlled and station-based observational datasets, which are essential for capturing local-scale variability.
Therefore, this study aims to provide a multidimensional assessment of hydroclimatic changes in Northern Cyprus by integrating complementary statistical approaches. The observational datasets of precipitation totals, maximum temperature, and minimum temperature are analyzed at annual and seasonal scales to evaluate multiple dimensions of hydroclimatic variability. The specific objectives of this study are to: (i) detect statistically significant trends and their magnitudes; (ii) identify abrupt change points; (iii) assess spatial consistency across different regions; (iv) examine distributional characteristics of trends; and (v) distinguish whether observed changes are primarily driven by shifts in mean conditions or variability. The main methodological novelty of this study lies in advancing from trend detection to an integrated diagnosis of the statistical structure underlying significant trends. The proposed framework jointly assesses whether these trends reflect changes in specific value classes, shifts in the mean state, changes in variability, or combinations of these processes, and whether the resulting patterns remain stable or evolve over time. Its application to a climatically sensitive eastern Mediterranean island further reveals how these underlying statistical structures vary across seasons and among coastal, inland, and mountainous environments.

2. Materials and Methods

2.1. Study Area

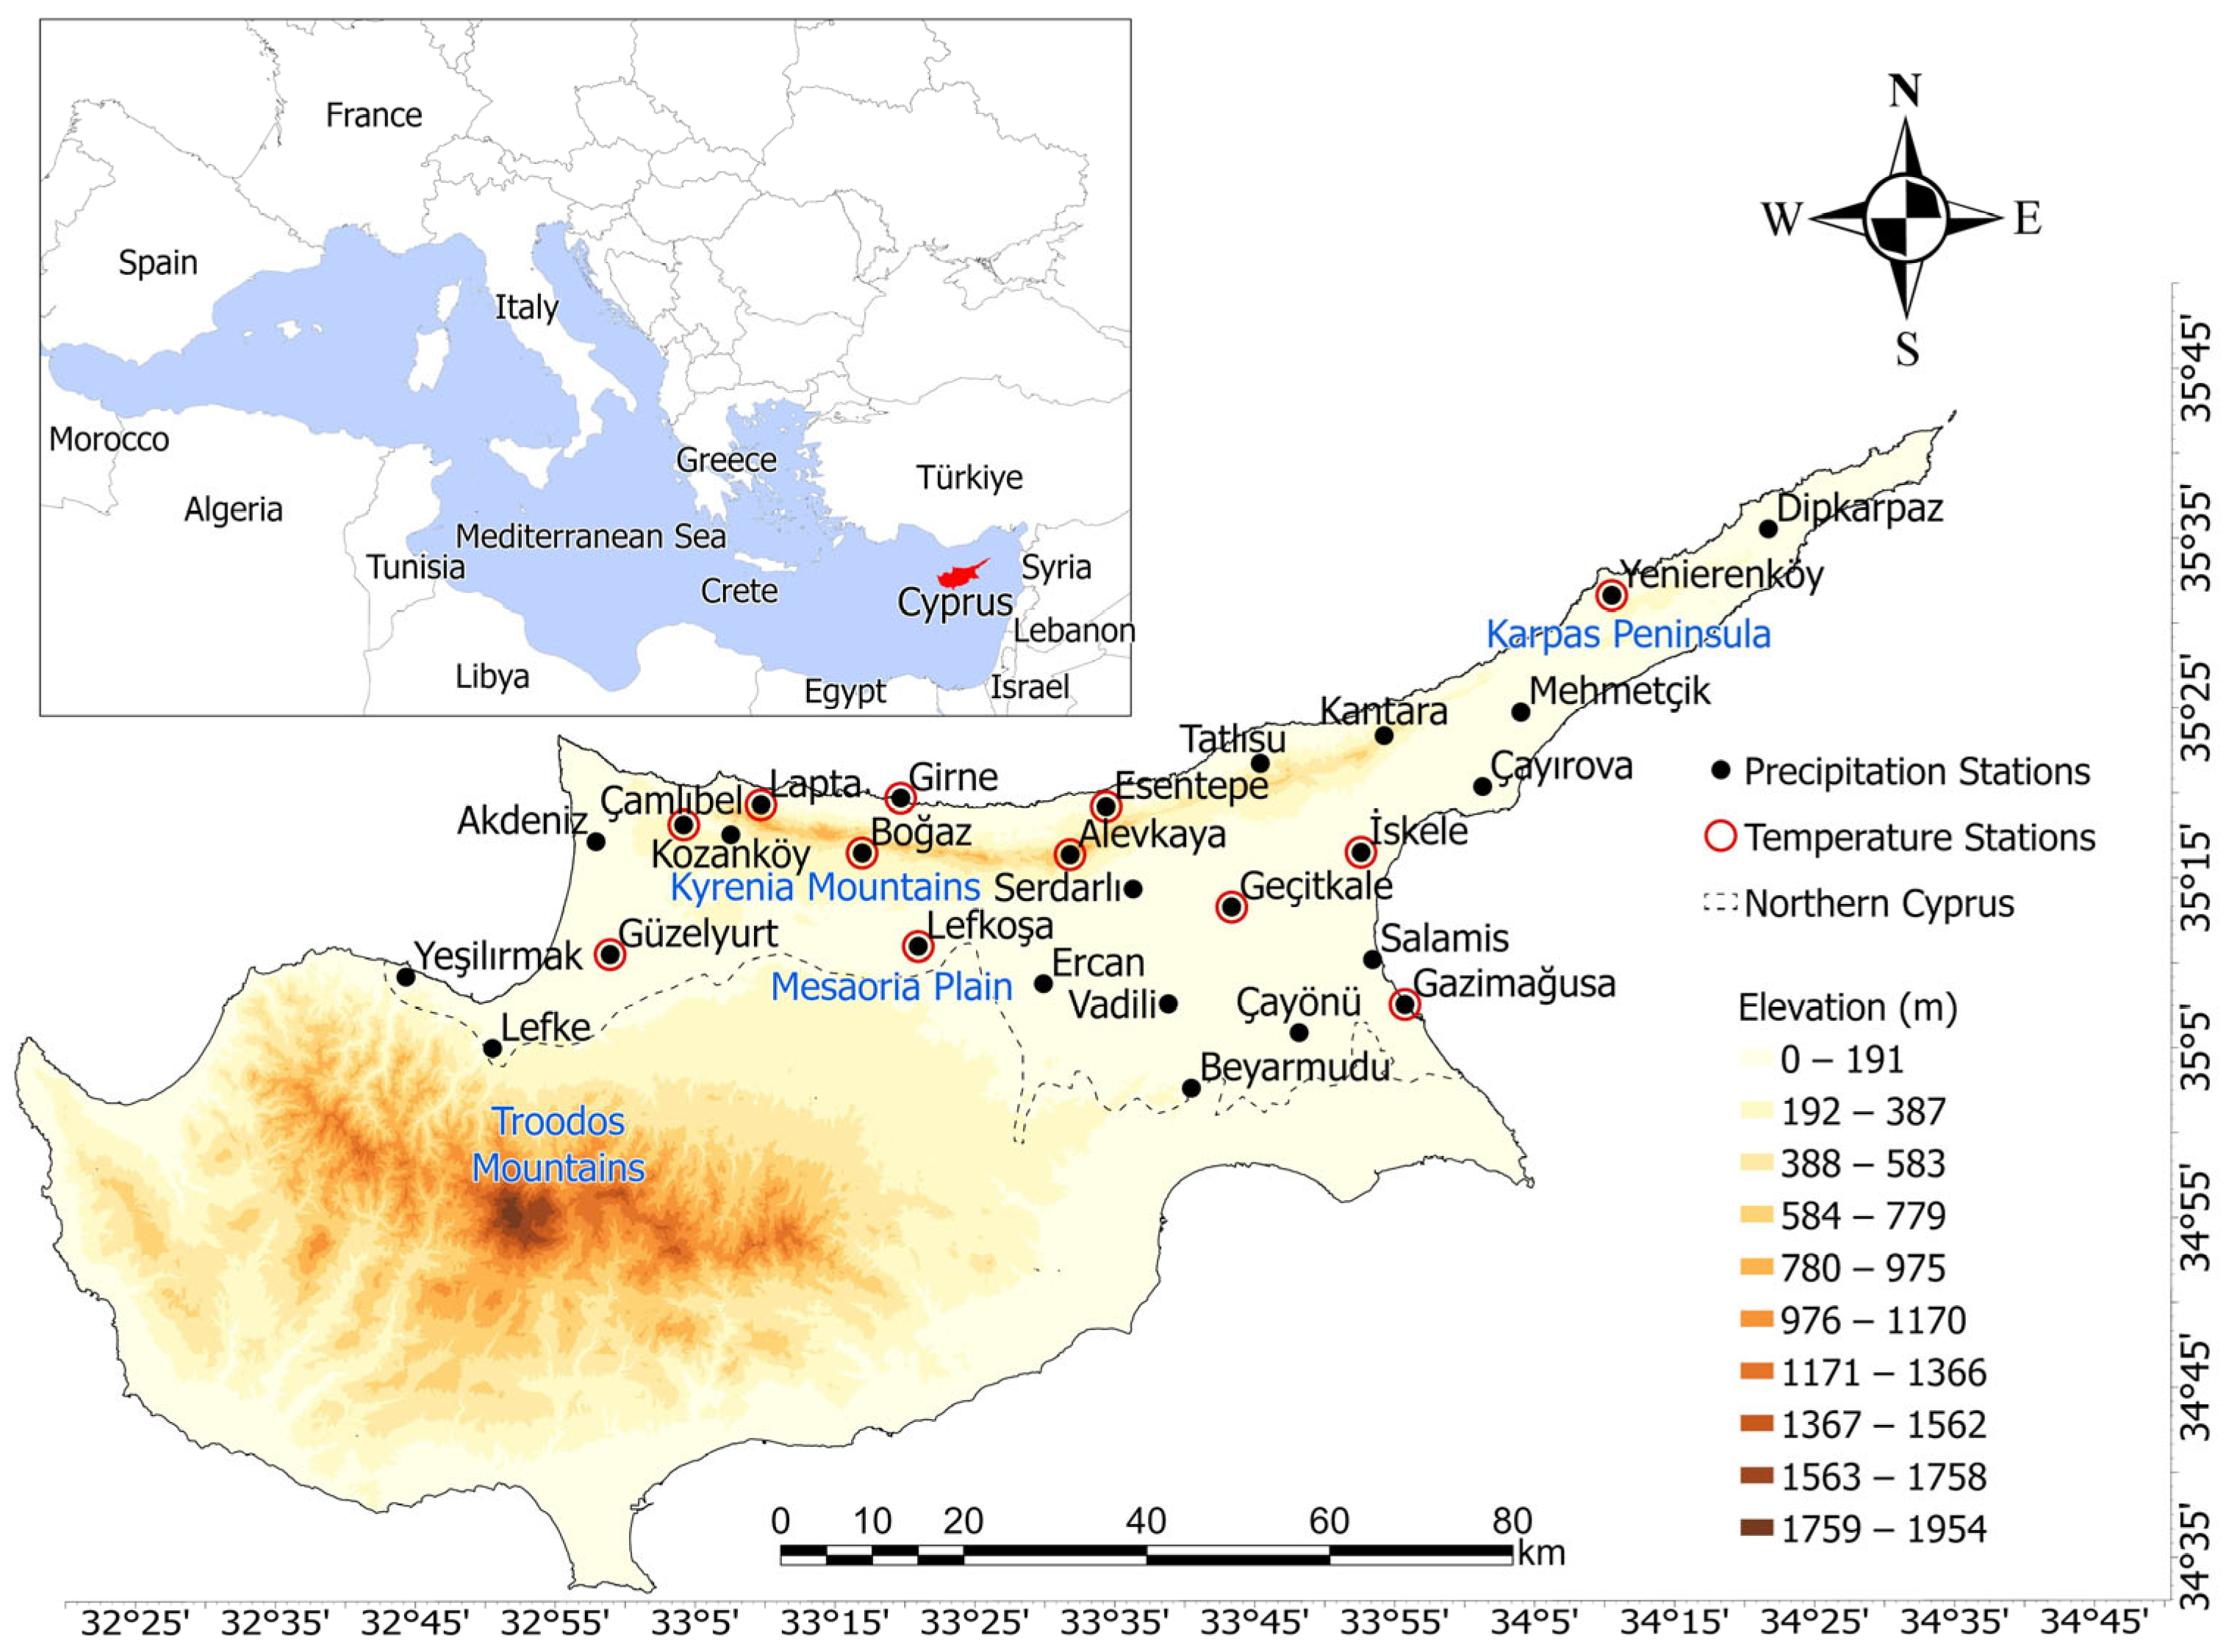
The island of Cyprus is located in the Eastern Mediterranean, between approximately 32–35° E longitude and 34–36° N latitude. The northern part of the island, which constitutes the study area and covers about 3355 km2, represents a transitional hydroclimatic zone influenced by both mid-latitude and subtropical atmospheric systems [30]. As seen in Figure 1, the topography is defined by two major mountain systems and an intervening lowland. The Troodos Mountains in the south reach elevations of up to 1952 m, while the Kyrenia (Beşparmak) mountain range extends parallel to the northern coastline and forms the dominant topographic control in the study area. Between these ranges lies the Mesaoria Plain, a low-elevation inland region, while the Karpas Peninsula extends northeastward into the Mediterranean Sea.
These physiographic features exert strong control on hydroclimatic conditions through orographic effects and land–sea interactions, resulting in pronounced spatial variability. Mean annual precipitation is approximately 500 mm, decreasing to about 300 mm in inland areas and increasing to nearly 1000 mm in mountainous regions. Precipitation is highly seasonal, occurring predominantly between October and March, leading to a hydrological regime characterized by short wet periods and prolonged dry conditions. The climate is semi-arid Mediterranean, with hot, dry summers and mild, wet winters. Winter temperatures typically range between 12 °C and 15 °C, while summer maximum temperatures average around 32 °C in coastal areas and may approach 40 °C inland [10].

2.2. Data Sets

This study analyzes observational meteorological records derived from a spatially distributed station network across Northern Cyprus (Figure 1), including monthly total precipitation (Pr), monthly mean of daily maximum temperature (Tmax), and monthly mean of daily minimum temperature (Tmin). The dataset comprises 27 precipitation stations and 12 temperature stations representing coastal, inland, and mountainous regions. Record lengths vary among stations, with precipitation generally extending back to the late 1970s and temperature records primarily beginning in the early 1990s. The properties of the meteorological stations are summarized in Table 1.
The preprocessing of raw data, including quality control procedures, missing data assessment, and homogeneity testing, was initially conducted by Zaifoğlu et al. [17] for the period of up to 2015. For the extended period, the same procedures were consistently applied to ensure data reliability. Stations with more than 10% missing observations were excluded from the analysis. No infilling was performed in order to avoid introducing artificial bias and all analyses were conducted using the maximum available observations for each station.
Monthly data were aggregated to annual and seasonal scales. Seasonal classification follows standard climatological grouping, where winter corresponds to December, January, and February; spring includes March, April, and May; summer covers June, July, and August; and autumn consists of September, October, and November. Precipitation values were aggregated as cumulative totals, whereas temperature variables were averaged over the corresponding periods. Both annual and seasonal series were organized according to an October–September hydrological year, with each seasonal aggregate assigned to the corresponding hydrological-year cycle. Accordingly, winter combined December of the initial calendar year with January and February of the following calendar year within the same hydrological year.

2.3. Methods

A multi-dimensional analytical framework was employed to assess hydroclimatic changes in Northern Cyprus by integrating complementary statistical approaches that capture monotonic trends, change-points, variability structure, and trends in low, medium, and high data ranges. Non-parametric methods were used to quantify trend direction and magnitude and to detect abrupt changes, while innovative trend detection was applied to identify hidden and non-monotonic patterns within different classes of the data. Variability and structural changes were further examined to distinguish between shifts in mean conditions and variability components. Finally, spatial patterns of hydroclimatic trends were evaluated by comparing results across stations representing different geographical settings in Northern Cyprus. Stations were classified into coastal, inland, and mountainous groups to account for the influence of topography and land–sea interactions. Trend direction, magnitude, and consistency across methods were jointly considered to identify spatially coherent patterns and regional contrasts.

2.3.1. Monotonic Trend and Change-Point Analysis

Monotonic trends in precipitation and temperature series were evaluated using the modified Mann–Kendall (MMK) test [31], which is one of the most widely used non-parametric approaches for detecting long-term trends in hydroclimatic time series. Compared to the classical Mann–Kendall test, the modified version accounts for the influence of serial correlation, which is commonly observed in climatic and hydrological records and may affect trend significance. The modified approach was implemented following the trend-free pre-whitening procedure, in which the linear trend component is first removed, pre-whitening is then applied based on the lag-1 autocorrelation coefficient, and the Mann–Kendall test is subsequently performed on the adjusted series. This procedure provides a more reliable assessment of trend significance compared to the classical Mann–Kendall test. Trend significance was assessed using p-values at the 0.05 level, while trend magnitudes were estimated using Sen’s slope estimator [20].
The SS is calculated as the median of all pairwise slopes between observations in the time series:
S S = m e d i a n x j x i j i
where x i and x j are the observations at times i and j , respectively, and n is the length of the time series, 1 i < j n . Positive SS values indicate increasing tendencies, whereas negative values indicate decreasing tendencies.
In addition, abrupt changes in the time series were identified using the Pettitt test (PT) [32], which detects a single change-point corresponding to a statistically significant shift in the median of the series, equivalent to the mean under a Gaussian distribution.

2.3.2. Innovative Trend Analysis

Innovative Trend Analysis (ITA), originally proposed by Şen [22], was also applied to investigate trends in precipitation and temperature series. Compared to classical methods, ITA provides a clear distinction between monotonic and non-monotonic behaviors and enables the identification of multiple trend patterns, including no trend, monotonic increasing or decreasing trends, and non-monotonic variations. The method involves dividing each time series into two equal sub-periods representing earlier and later conditions. The data within each subperiod are arranged in ascending order and plotted against each other on a scatter diagram, where the first half is placed on the x-axis and the second half on the y-axis. The resulting plot is interpreted with respect to the 1:1 (45°) reference line: points aligned along this line indicate no trend, while systematic deviations above or below the line indicate increasing or decreasing trends, respectively.
The trend strength can also be quantified using the ITA statistics S and its confidence limits. For a time series of total length n , divided into two equal sorted subseries with mean values x ¯ and y ¯ , S is computed as [33]:
S = 2 y ¯ x ¯ n
The confidence limits of S can be expressed as:
C L 1 α = 0 ± s c r i σ s
where
σ s = 2 2 n n σ 1 ρ y , x
Here, s c r i is the critical value of the Gaussian distribution function corresponding to the selected significance level α , σ s is the standard deviation of the full series, and ρ y , x is the correlation coefficient between the first and second subseries. If the ITA slope statistic lies outside the confidence limits, the trend can be interpreted as statistically significant within the ITA framework.
A key advantage of ITA is its ability to reveal trends within different segments of the data. In this study, the ordered data were further classified into low-, medium-, and high-value groups using the 25th and 75th percentile thresholds. Accordingly, values below the 25th percentile were classified as low, values between the 25th and 75th percentiles as medium, and values above the 75th percentile as high. This classification enables the identification of changes across different intensity levels that may not be captured by conventional monotonic trend tests.

2.3.3. Variability and Structural Change Analysis

Variability and structural changes in hydroclimatic time series were analyzed using the Structural Trend and Variability Identification (STVI) method [29], which enables the simultaneous assessment of trends in both mean and variability components. Unlike conventional approaches focusing only on monotonic trends, STVI provides insight into changes in variability, allowing a more comprehensive evaluation of hydroclimatic behavior and nonstationary structural changes.
The method is conceptually based on the division of a given time series into consecutive subseries, following the logic of ITA. For a time series of length n , the series can be divided into m consecutive subseries X 1 ,   X 2 ,   ,   X m , each with L = n / m . The mean and standard deviation of the k-th subseries are denoted by M ( X k ) and σ X k , respectively. The structural trend in the mean component between two consecutive subseries is calculated as:
S T m k = M X k + 1 M ( X k ) L
and similarly, the structural variability trend (SVm) between two consecutive subseries is computed as:
S V m k = σ X k + 1 σ ( X k ) L
where k = 1 ,   2 ,   ,   m 1 . Positive S T m k and S V m k values indicate increasing mean conditions and variability, whereas negative values indicate decreasing tendencies. This formulation allows the independent quantification of changes in central tendency and variability. In this study, the whole-record STVI analysis was implemented using m = 2 , corresponding to the comparison between the first and second halves of each series.
To capture the temporal evolution of these changes, STVI was applied using 10-year overlapping moving windows. This approach enables the identification of short-term structural variations and transient behaviors, which are consistent with the original formulation of the method that emphasizes the analysis of partial trends over shorter periods in addition to whole-record behavior. By jointly analyzing mean and variability trend components across different temporal scales, the STVI approach provides a more comprehensive characterization of hydroclimatic change. This allows distinguishing whether observed changes are dominated by shifts in average conditions or by alterations in variability, which can offer additional insight beyond monotonic and innovative trend analyses.

3. Results

3.1. Monotonic Trends and Change-Point Analysis of Hydroclimatic Variables

3.1.1. Annual Hydroclimatic Trends

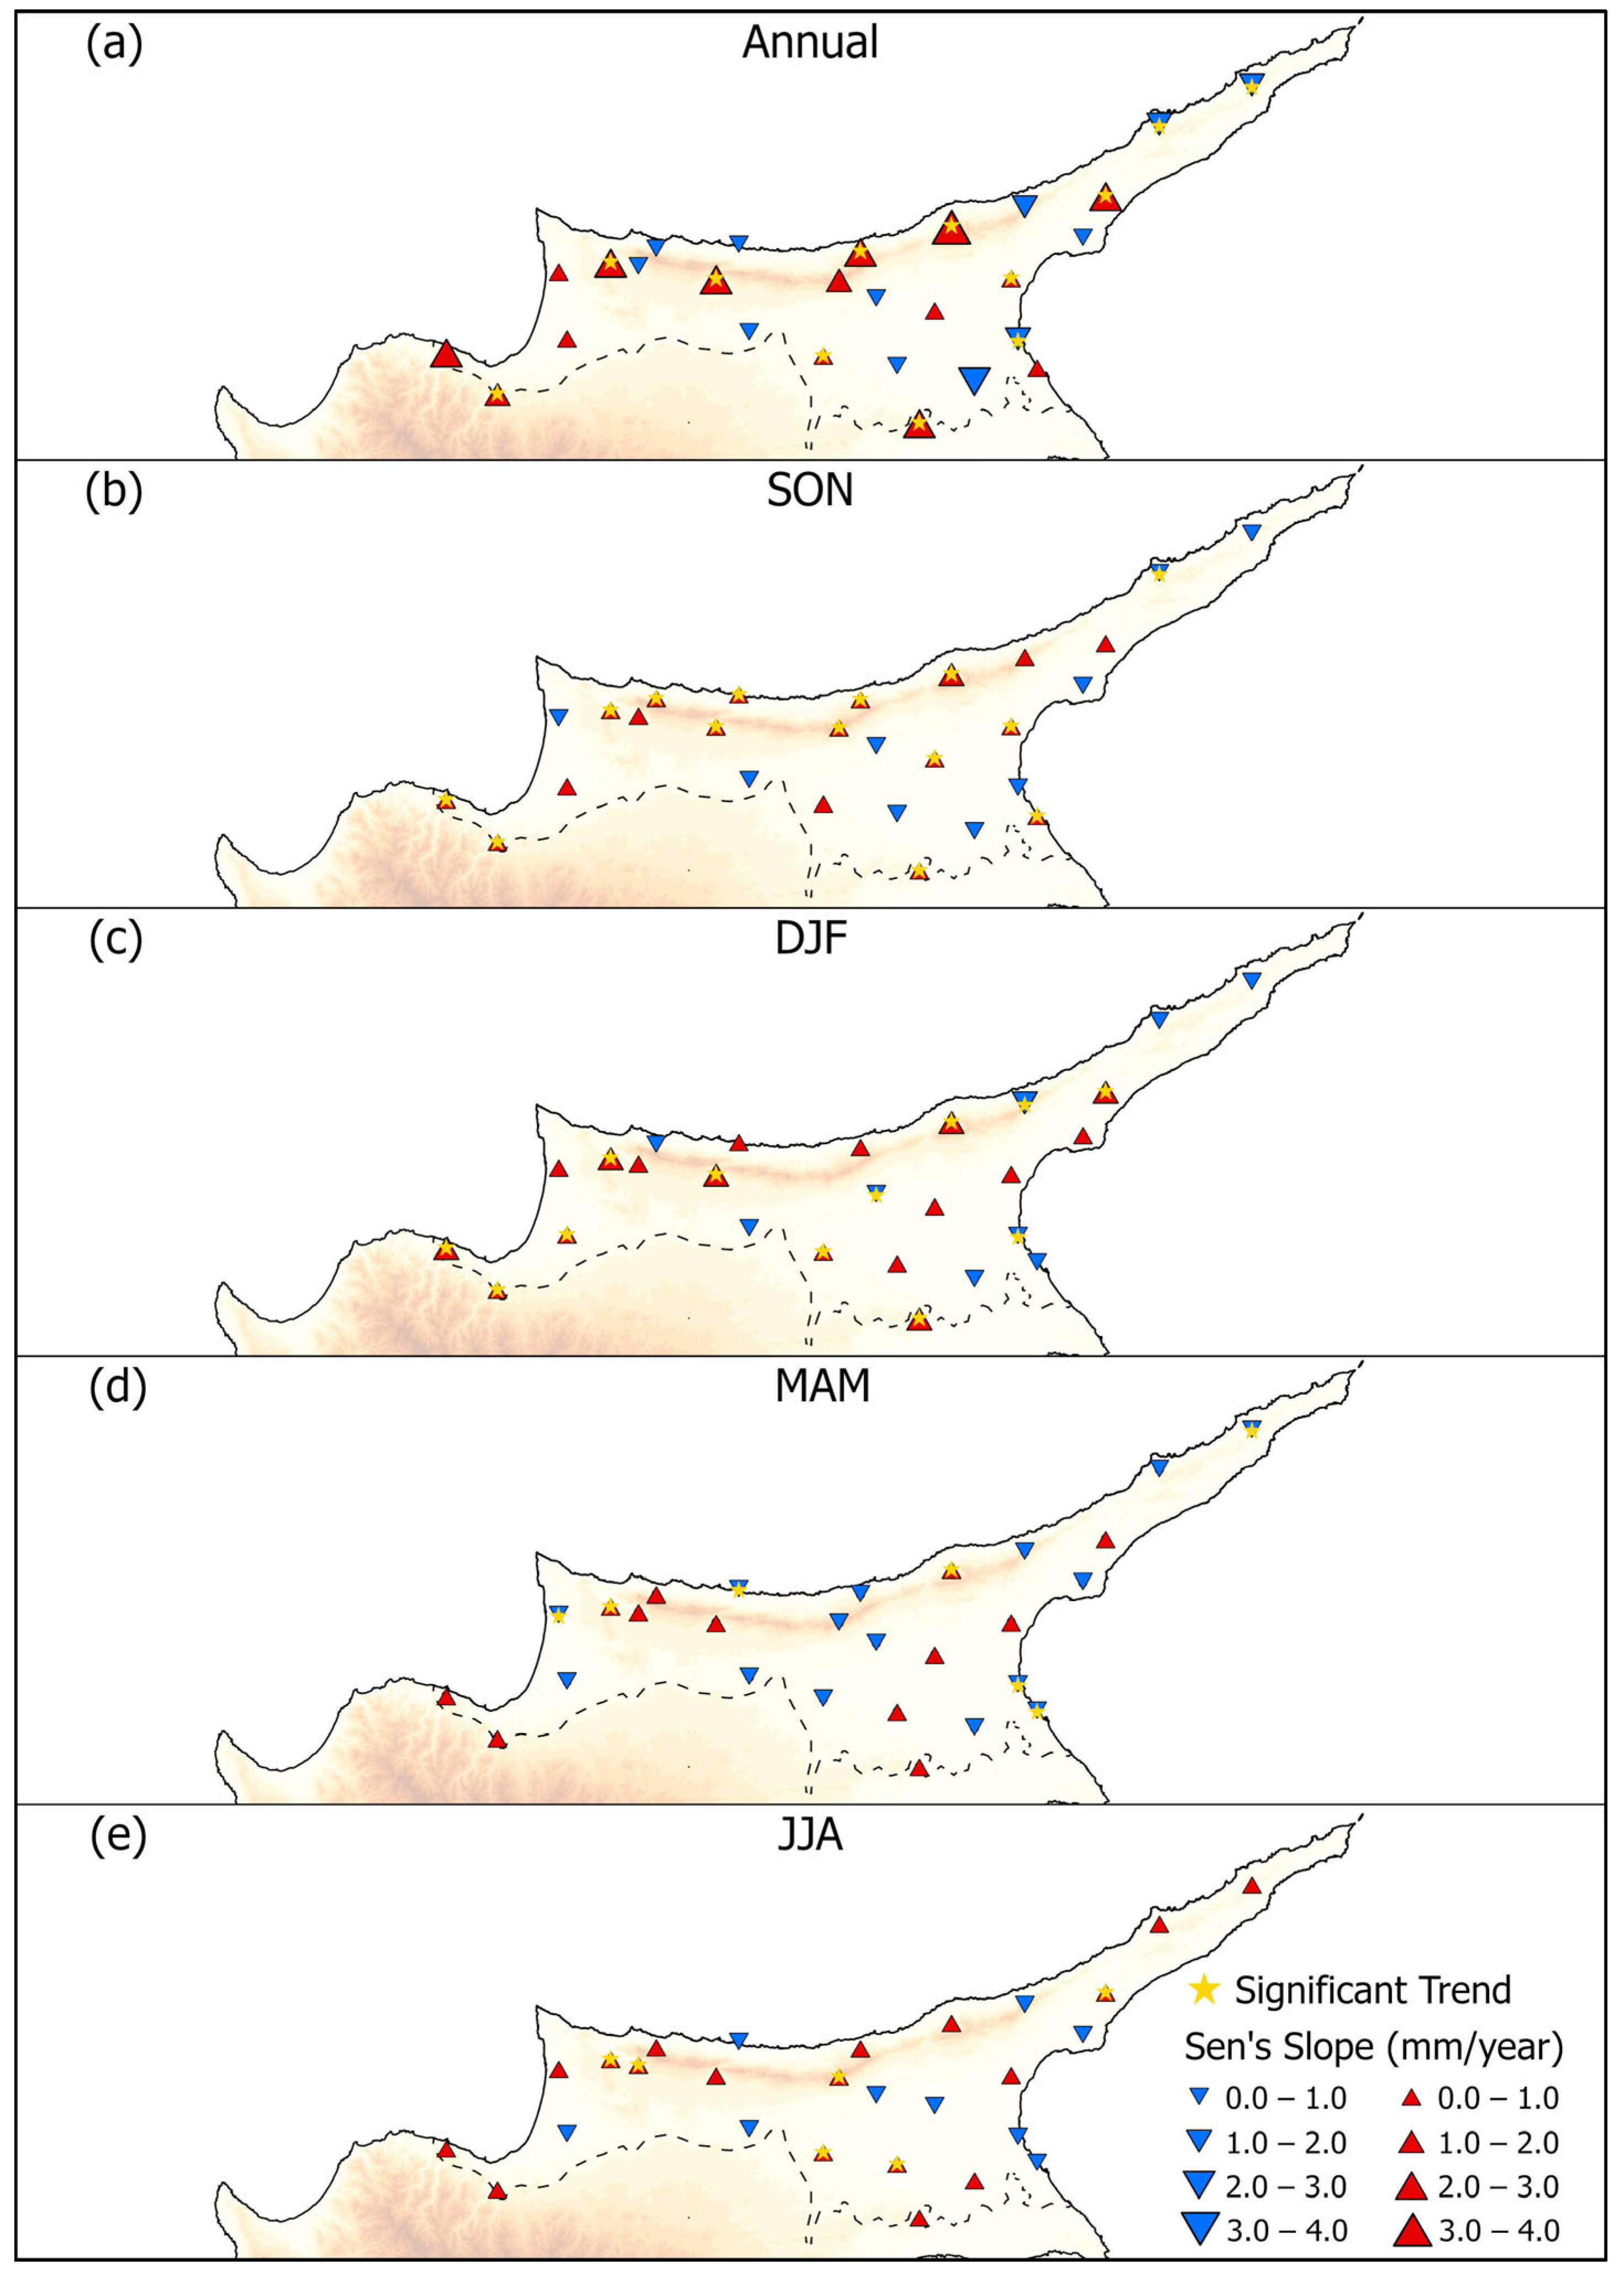
The annual hydroclimatic analyses, based on the October–September hydrological year, revealed substantially different behaviors between precipitation and temperature variables across Northern Cyprus. Annual precipitation trends exhibited clear spatial heterogeneity, with both increasing and decreasing tendencies identified among the stations. The detailed station-level results for annual and seasonal precipitation, Tmax, and Tmin are presented in Appendix A (Table A1, Table A2 and Table A3). These tables include the complete MMK, SS, and PT results for each station and provide a comprehensive statistical overview. These findings indicated the absence of a spatially coherent island-wide precipitation signal (Figure 2). Significant increasing precipitation trends were primarily concentrated within the Kyrenia Subbasin and several eastern locations. Among the stations with significant positive trends, Çamlıbel, Boğaz, Esentepe, Tatlısu, Beyarmudu, Mehmetçik, İskele, and Lefke exhibited increasing annual precipitation tendencies, with Tatlısu, Çamlıbel, Mehmetçik, and Beyarmudu showing some of the highest positive Sen’s slope magnitudes. The northern hilly and mountainous stations along the Kyrenia range displayed relatively coherent wetting tendencies, suggesting that topographic and orographic influences may contribute substantially to precipitation variability across this region.
In contrast, statistically significant decreasing annual precipitation trends were detected at Salamis, Dipkarpaz, and Yenierenköy, indicating localized drying tendencies, particularly in the Karpas coastal areas. The simultaneous presence of both significant wetting and drying trends within eastern coastal regions demonstrates considerable localized hydroclimatic variability rather than a uniform regional precipitation response. Inland Mesaoria stations generally exhibited mixed or weak precipitation tendencies without a dominant drying or wetting signal. While stations such as Çayönü and Serdarlı showed decreasing tendencies, these trends were statistically nonsignificant. Similarly, Lefkoşa and Vadili remained nearly trendless throughout the analysis period, whereas Ercan exhibited a weak but statistically significant increasing trend. Western coastal stations within the Morphou Subbasin also displayed mixed behavior, with significant increases detected at Lefke, nearly stable conditions at Güzelyurt, and marginally nonsignificant increasing tendencies at Yeşilırmak. Overall, the annual precipitation results indicate that precipitation changes across Northern Cyprus are spatially differentiated and governed mainly by localized hydroclimatic controls rather than by a spatially coherent trend.
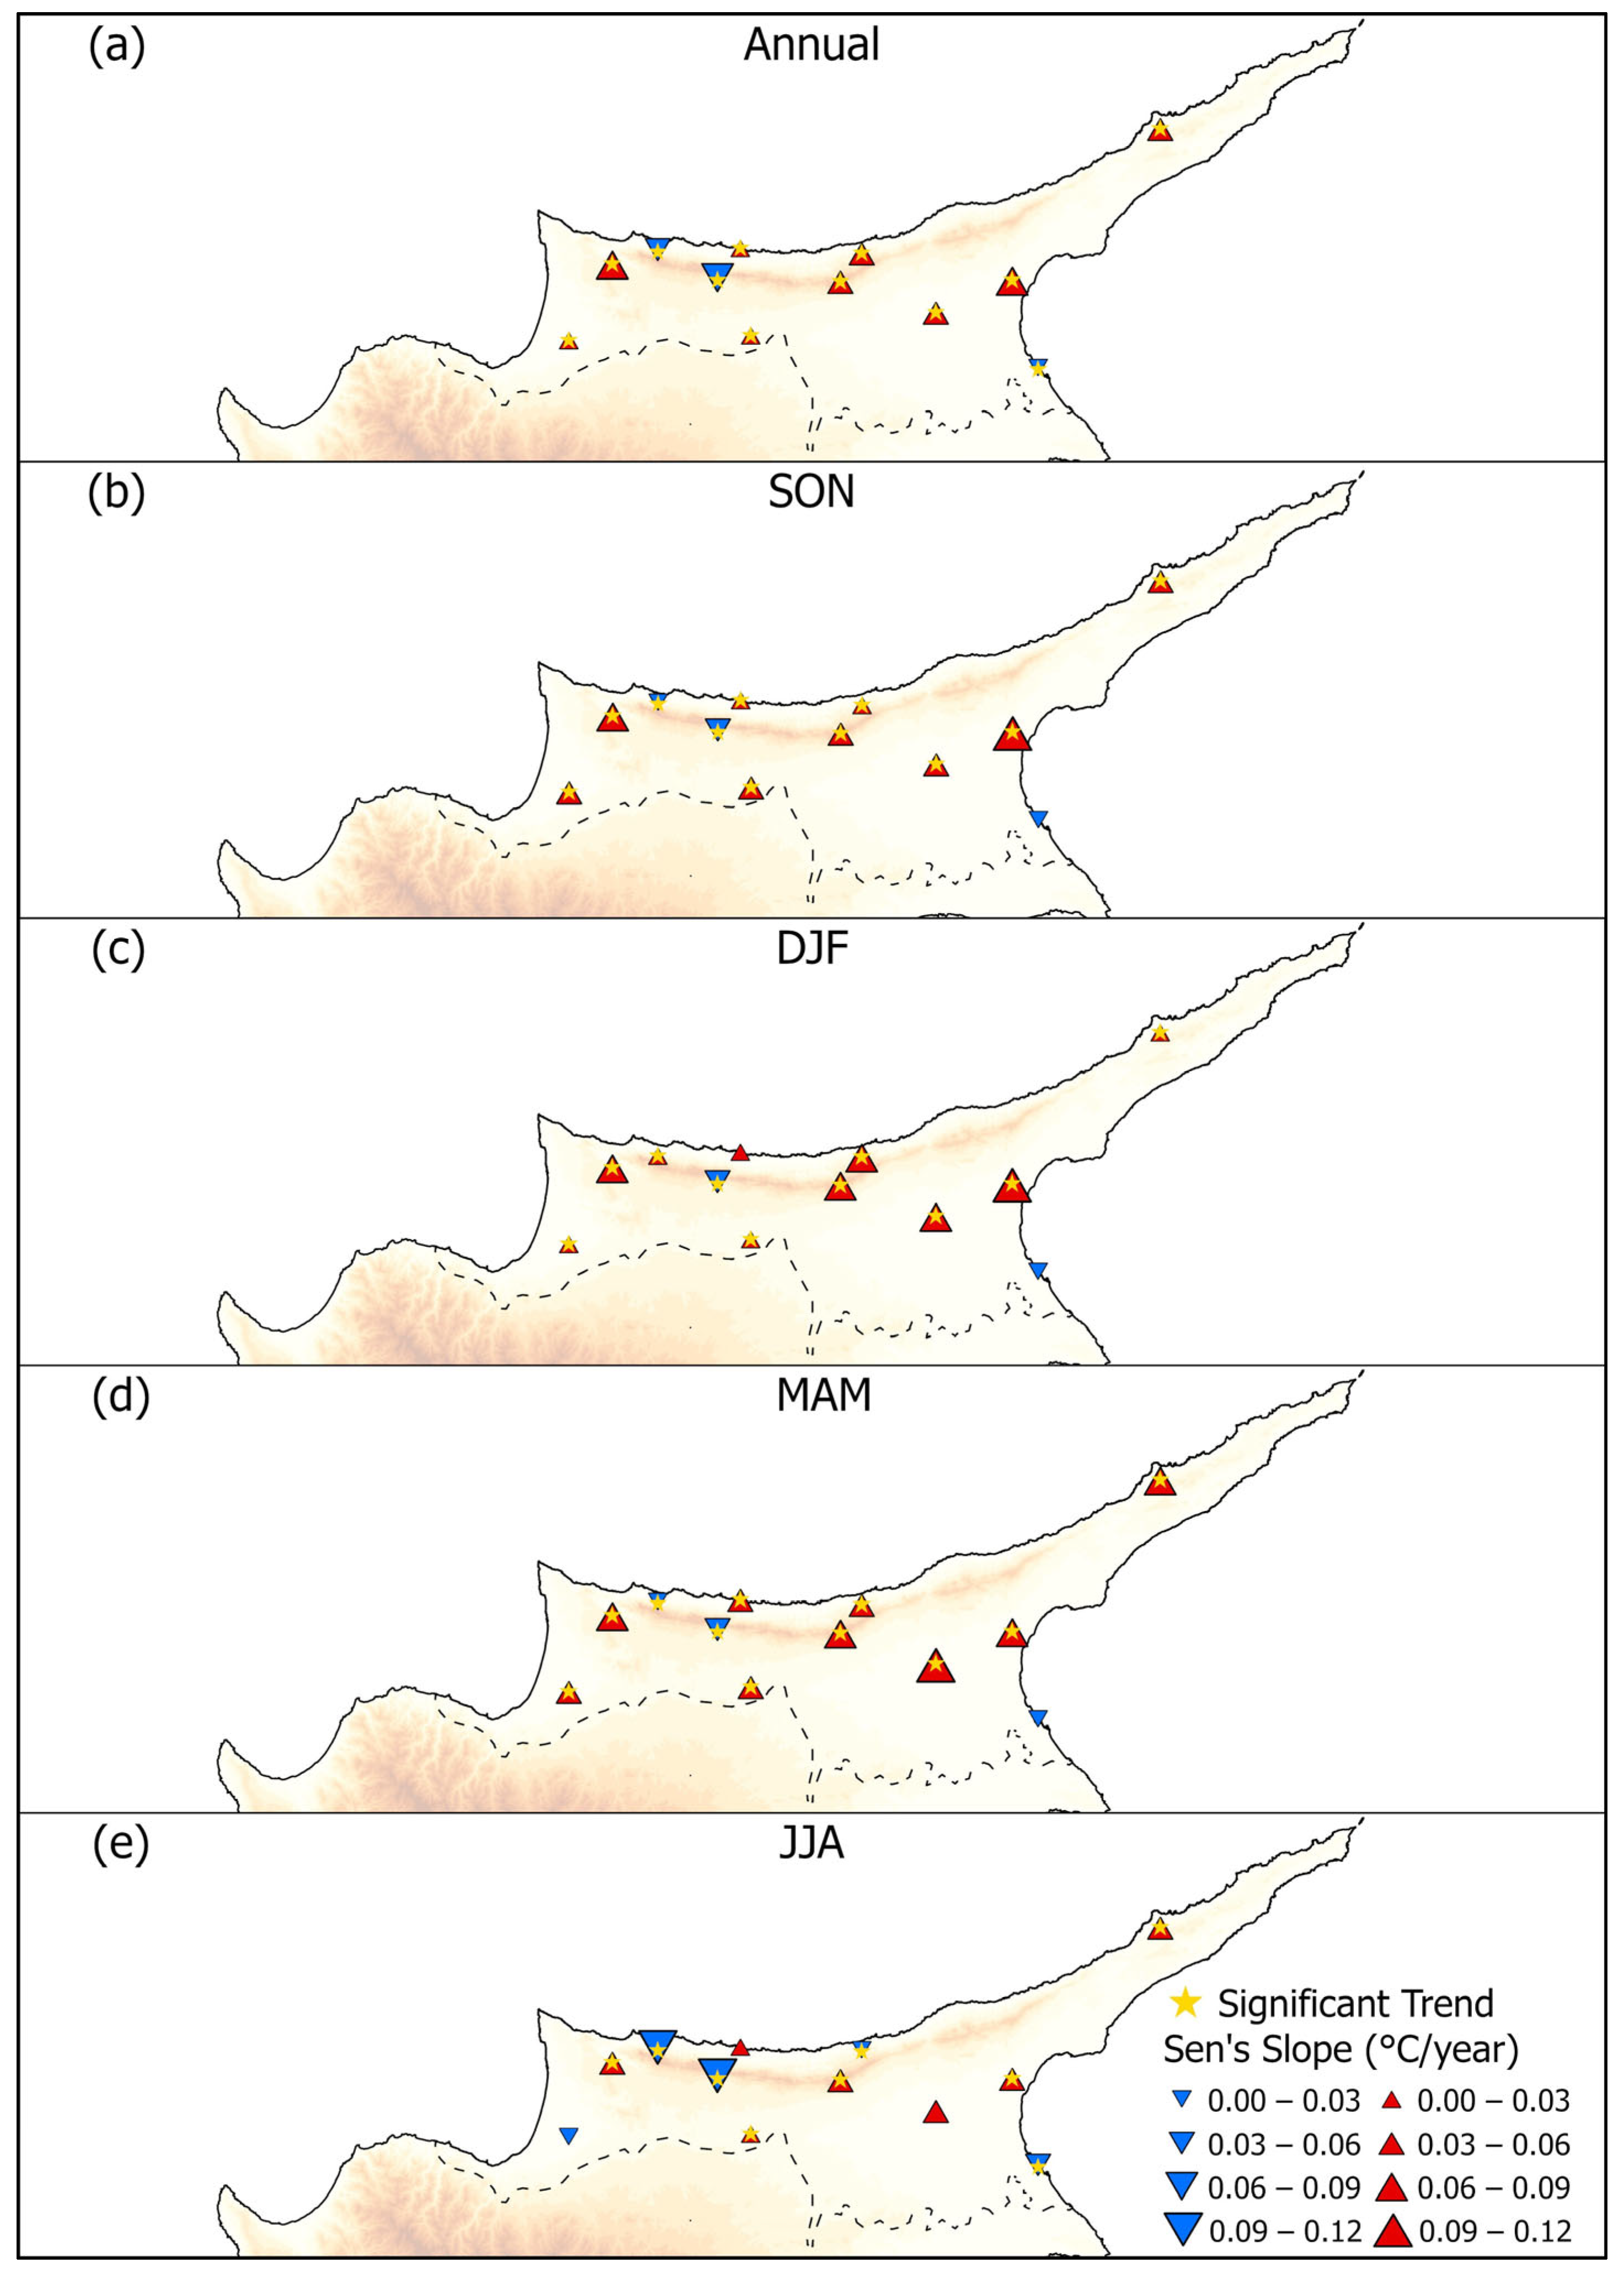
Compared to precipitation, annual temperature series demonstrated considerably stronger spatial coherence. Annual Tmax trends generally exhibited statistically significant warming across most stations, indicating a widespread daytime warming signal throughout Northern Cyprus (Figure 3). Significant Tmax increases were particularly evident at inland and northern mountainous stations, including Geçitkale, Lefkoşa, Esentepe, Alevkaya, and Çamlıbel, while strong warming tendencies were also observed at eastern coastal stations, such as Yenierenköy and İskele. Among these stations, Alevkaya and Çamlıbel exhibited some of the highest warming magnitudes, highlighting significant warming conditions within the mountainous northern sector. In contrast, several localized stations displayed statistically significant decreasing Tmax trends. Notably, Gazimağusa, Lapta, and Boğaz exhibited significant cooling tendencies, with Boğaz showing the strongest negative Sen’s slope magnitude. These localized cooling responses indicate that daytime warming across Northern Cyprus is not entirely spatially uniform and may be partially moderated by local climatic and maritime influences at selected coastal and transitional stations.
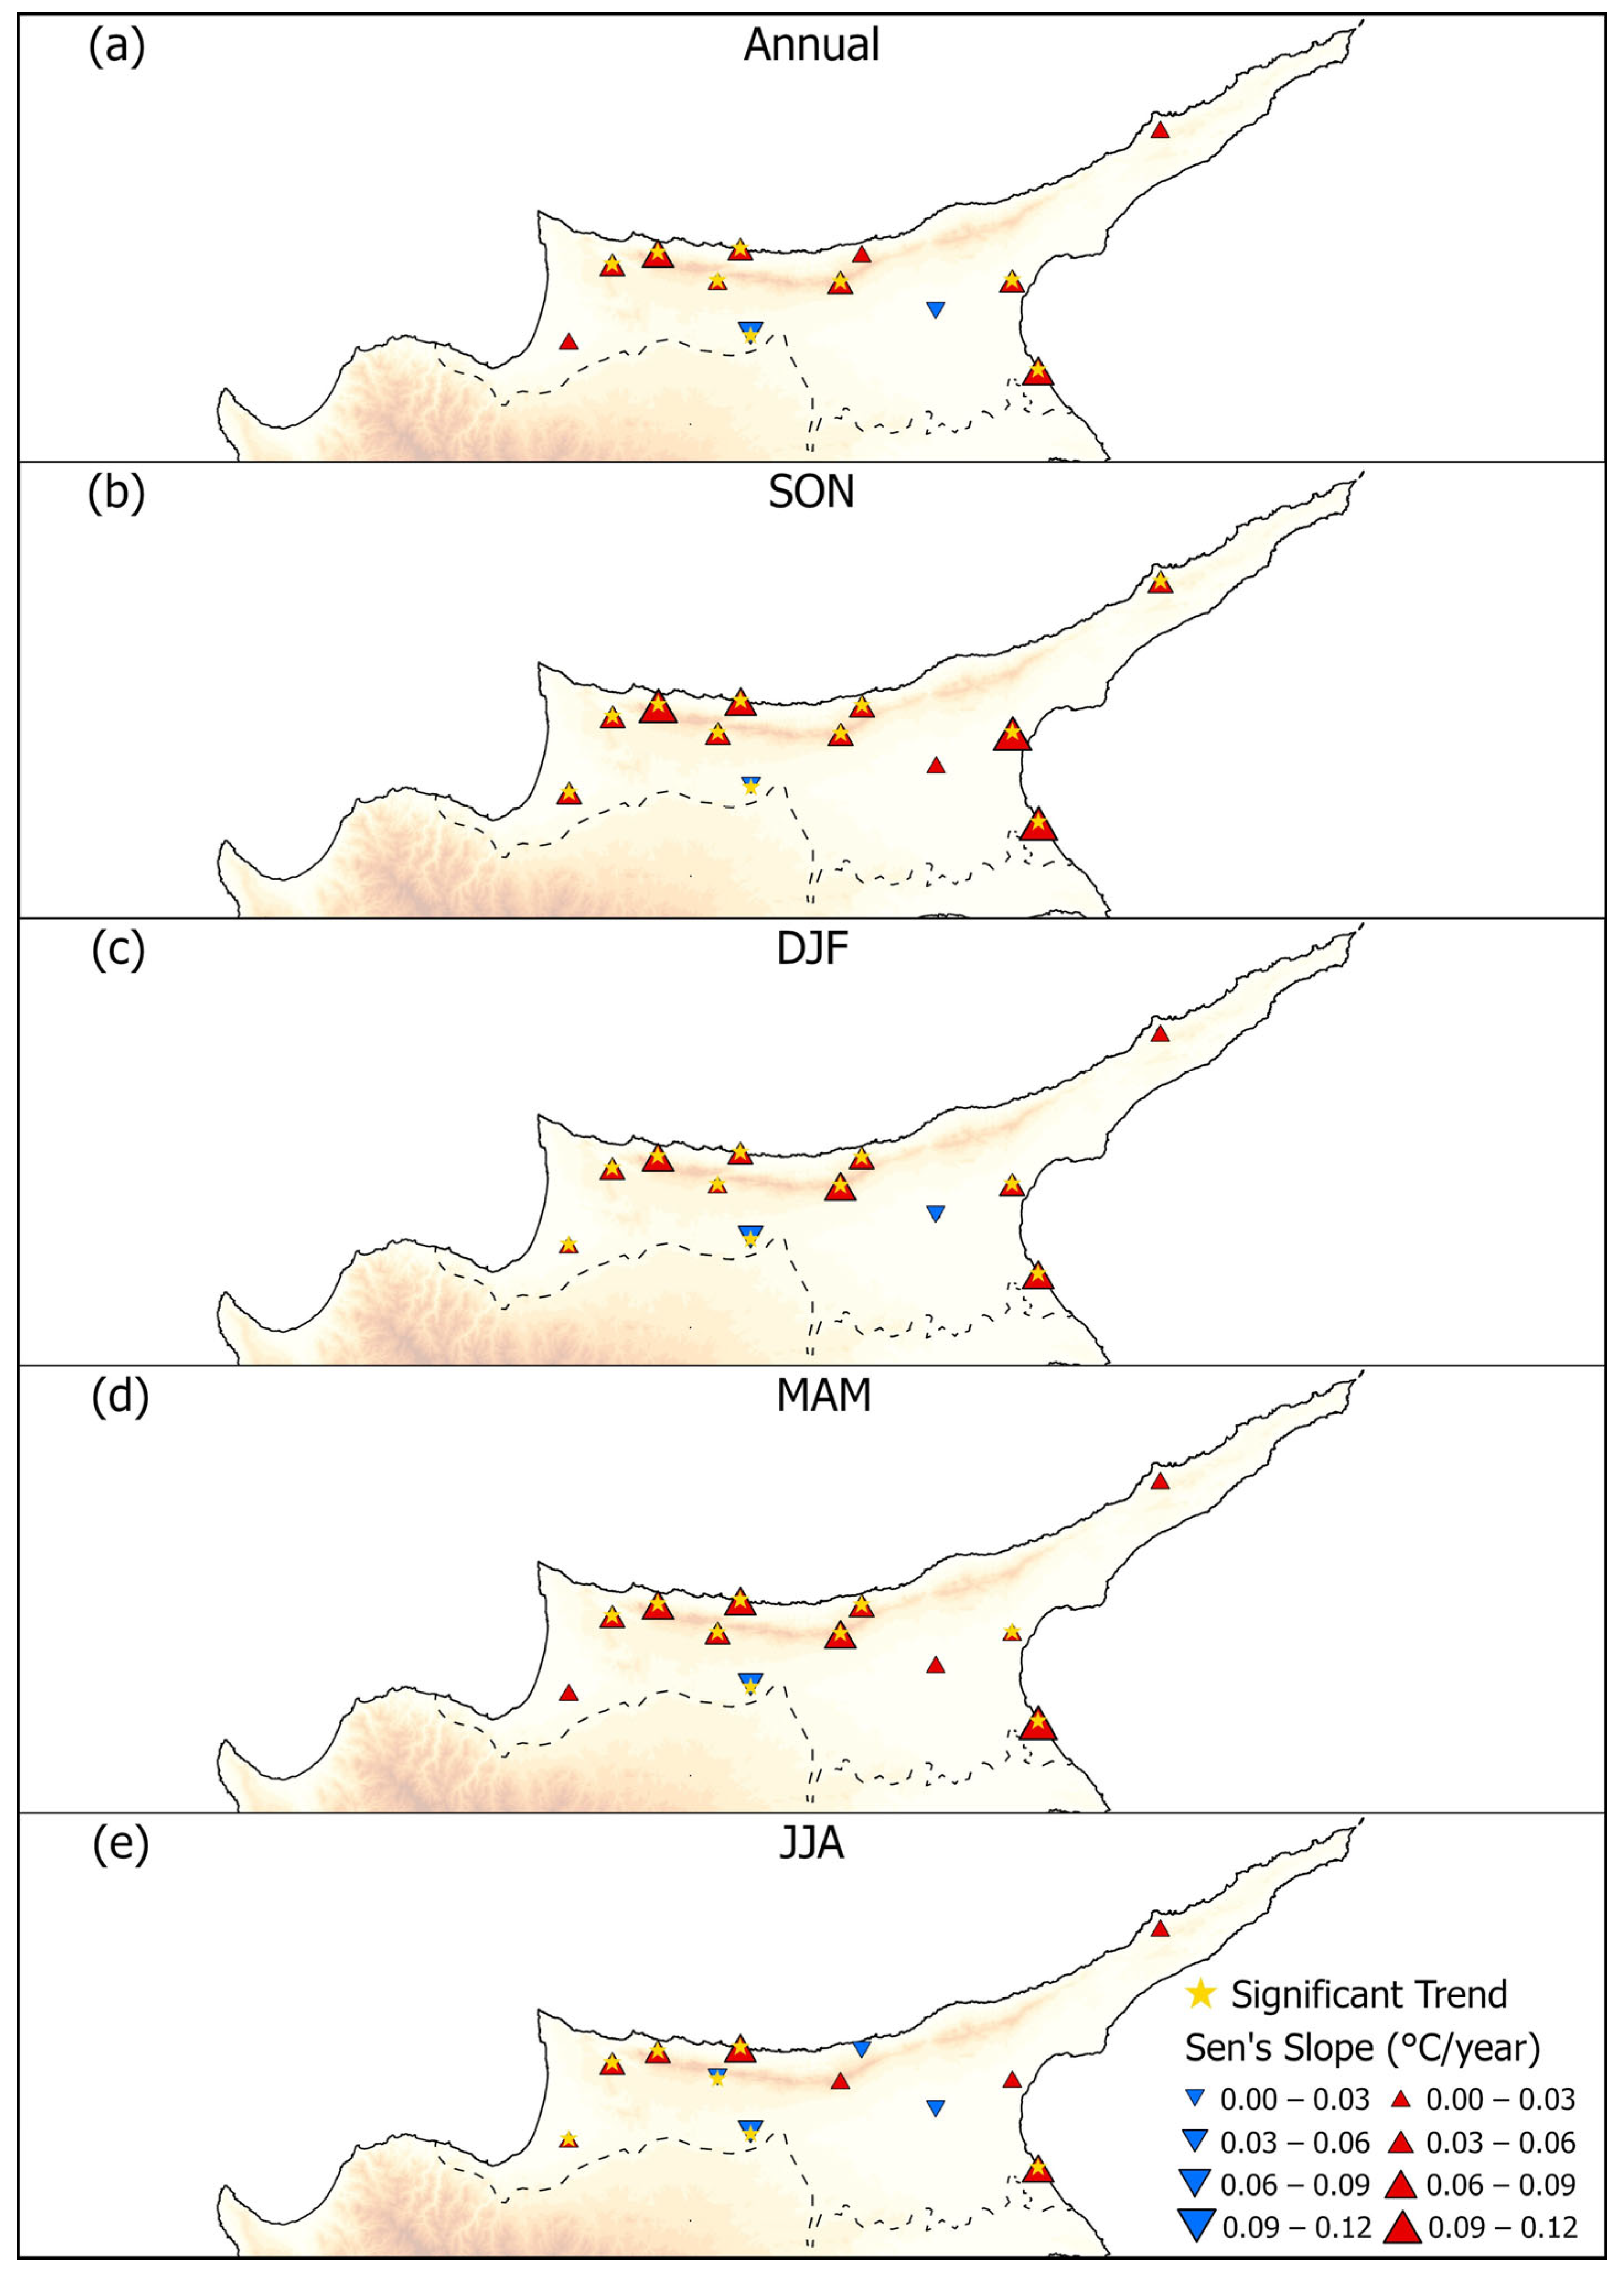
As shown in Figure 4, annual Tmin trends exhibited a more spatially heterogeneous structure compared to Tmax, although significant nighttime warming remained dominant across several coastal and northern stations. Significant Tmin increases were observed at Gazimağusa, Girne, İskele, Lapta, Alevkaya, Boğaz, and Çamlıbel, indicating widespread nighttime warming across many coastal and mountainous sites. Particularly strong Tmin increases were detected at Gazimağusa, Lapta, Girne, and Alevkaya, suggesting that both maritime and mountainous environments experienced substantial nighttime warming during the study period. A notable exception was identified at Lefkoşa, where Tmin exhibited a statistically significant decreasing trend despite the presence of significant Tmax warming at the same station. This contrasting thermal behavior suggests that daytime and nighttime temperature evolution within the inland Mesaoria region may be governed by different local atmospheric and surface processes.
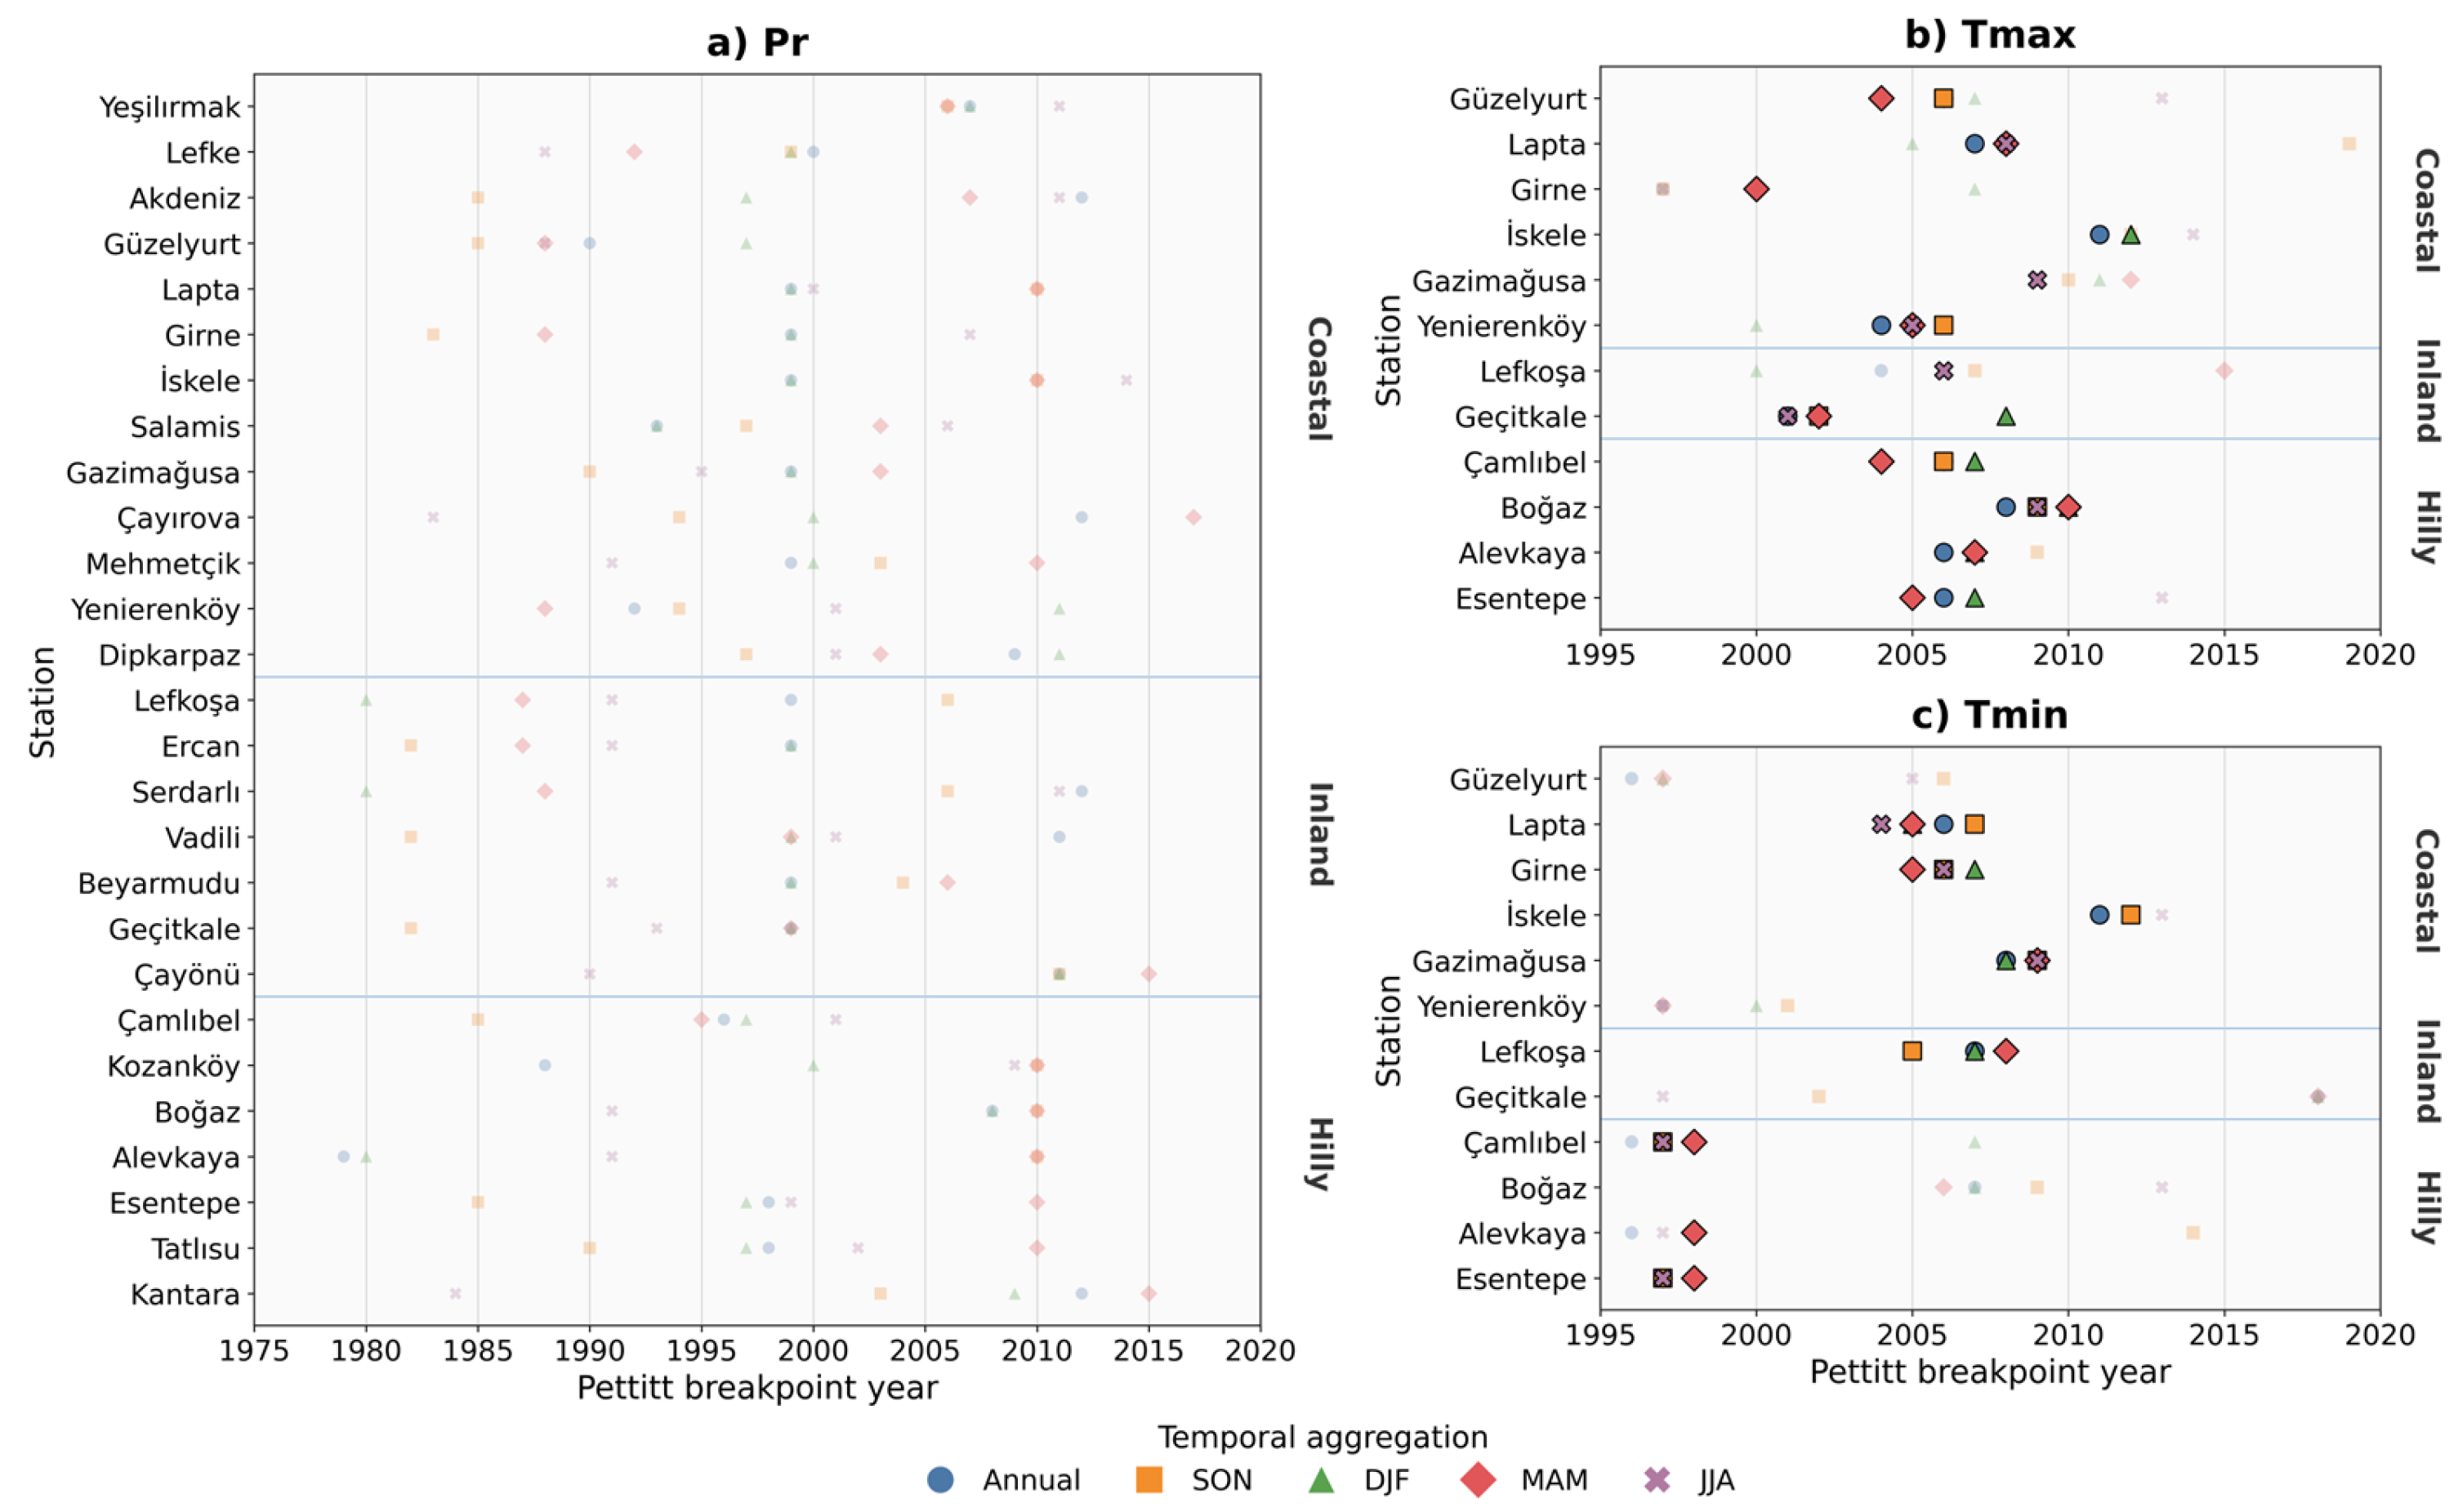
The Pettitt test results further highlighted contrasting temporal characteristics between precipitation and temperature variables (Figure 5). The precipitation series exhibited statistically nonsignificant breakpoints despite the presence of monotonic trends identified by the MMK test, suggesting that annual precipitation changes evolved gradually rather than through abrupt hydroclimatic regime shifts. Nevertheless, many precipitation breakpoint years clustered between the late 1990s and early 2010s, indicating a period of progressive hydroclimatic transition across several stations. In contrast, annual Tmax and Tmin series exhibited more spatially coherent and statistically significant change points, with most statistically significant breakpoints clustered mainly between 2004 and 2008. This temporal clustering suggests the emergence of a more distinct warming phase across Northern Cyprus during this period. Overall, the annual analyses demonstrate that while precipitation changes remain spatially heterogeneous and gradually evolving, temperature changes are characterized by stronger spatial coherence and more evident warming transitions throughout the study area.

3.1.2. Seasonal Hydroclimatic Trends

Seasonal hydroclimatic analyses revealed substantial temporal and spatial variability in the behavior of precipitation and temperature variables across Northern Cyprus. Compared to the annual analyses, seasonal results provided a clearer representation of the regional hydroclimatic contrasts and demonstrated that the magnitude and direction of trends strongly depended on seasonality. As seen in Figure 2, Figure 3 and Figure 4, precipitation trends exhibited the strongest positive tendencies during autumn and winter, whereas spring displayed more widespread drying signals. In contrast, Tmax and Tmin generally exhibited widespread warming tendencies throughout most seasons, although the magnitude and spatial coherence of warming varied considerably between seasons and regions.
Autumn precipitation trends were dominated by increasing tendencies, particularly across the northern mountainous and western coastal regions. Significant positive autumn precipitation trends were detected at several stations located along the Kyrenia mountain range and adjacent coastal areas, including Çamlıbel, Lapta, Girne, Boğaz, Tatlısu, Esentepe, and Alevkaya. Strong increasing tendencies were also observed at western coastal stations, such as Lefke and Yeşilırmak, as well as at eastern stations of İskele and Beyarmudu. Among these stations, Tatlısu, Yeşilırmak, Lapta, Esentepe, and Çamlıbel exhibited some of the highest Sen’s slope magnitudes, indicating pronounced autumn precipitation intensification across northern and western sectors of the island. In contrast, significant autumn drying was mainly concentrated at Yenierenköy, while several eastern coastal stations, such as Dipkarpaz and Çayırova, exhibited weak negative tendencies. Inland Mesaoria stations displayed mixed responses without a coherent regional precipitation signal. Overall, autumn precipitation trends suggest that precipitation intensification during the transitional wet season is primarily concentrated within northern mountainous and western coastal regions, whereas eastern coastal and inland areas exhibit more fragmented hydroclimatic responses.
Winter precipitation trends displayed a similar but more spatially organized structure compared to autumn. Significant winter precipitation increases were primarily concentrated within northern mountainous and western coastal stations, including Çamlıbel, Boğaz, Tatlısu, Lefke, Güzelyurt, and Yeşilırmak. Among these stations, Çamlıbel and Boğaz exhibited particularly strong positive Sen’s slope magnitudes, highlighting intensified winter precipitation within the Kyrenia mountainous sector. Positive winter precipitation trends were also observed at Beyarmudu, Ercan, and Mehmetçik. In contrast, significant decreasing trends were identified at Serdarlı, Salamis, and Kantara, while several inland and eastern coastal stations displayed weak or nonsignificant negative tendencies. These findings indicate that winter precipitation intensification is most significant within northern mountainous and western coastal sectors, whereas inland Mesaoria and eastern coastal regions exhibit substantially more heterogeneous responses.
Compared to autumn and winter, spring precipitation trends exhibited considerably weaker spatial organization and more widespread drying tendencies. Significant spring precipitation decreases were identified at several coastal stations, including Akdeniz, Girne, Gazimağusa, Salamis, and Dipkarpaz, indicating the emergence of drying conditions across northern and eastern coastal sectors during the late wet season. In contrast, only a limited number of stations, particularly Çamlıbel and Tatlısu, exhibited statistically significant positive spring precipitation trends. Many inland and mountainous stations displayed weak or statistically nonsignificant tendencies, suggesting the absence of a coherent spring precipitation signal across most parts of Northern Cyprus. These results indicate that the wetting structures observed during autumn and winter weaken substantially during spring, while coastal drying tendencies become increasingly dominant.
Summer precipitation trends generally exhibited weak, spatially inconsistent, and hydroclimatically limited behavior. Since summer precipitation in Northern Cyprus is climatologically negligible and mainly associated with isolated convective events, many statistically significant trends were characterized by extremely small Sen’s slope magnitudes close to zero. Although several stations, including Ercan, Çamlıbel, Alevkaya, Kozanköy, and Mehmetçik, exhibited statistically significant positive trends, these changes likely reflect the highly intermittent nature of summer precipitation rather than substantial hydroclimatic shifts. Overall, summer precipitation trends did not exhibit a coherent spatial structure and should therefore be interpreted cautiously within the semi-arid Mediterranean climatic context of the study area.
Seasonal Tmax analyses revealed widespread warming tendencies throughout most seasons, although the spatial coherence and magnitude of warming varied seasonally. Autumn Tmax exhibited strong and spatially coherent warming across inland, eastern coastal, and northern mountainous regions. Significant warming trends were observed at Lefkoşa, Geçitkale, Yenierenköy, Alevkaya, Çamlıbel, Esentepe, Girne, Güzelyurt, and İskele, while localized cooling tendencies were identified at Boğaz and Lapta. Similar warming structures persisted during winter, with strong positive Tmax trends observed particularly at Alevkaya, Çamlıbel, Geçitkale, Esentepe, İskele, Güzelyurt, Lapta, Lefkoşa, and Yenierenköy. Winter Tmax warming displayed relatively high spatial coherence across the island, although Boğaz again exhibited a significant cooling trend, representing a persistent localized anomaly throughout multiple seasons.
Spring Tmax trends exhibited some of the strongest and most spatially coherent warming signals identified in the study. Significant warming tendencies were observed at Geçitkale, Lefkoşa, Güzelyurt, Yenierenköy, Alevkaya, Çamlıbel, Esentepe, Girne, and İskele, indicating widespread daytime warming across inland, mountainous, and coastal regions. In contrast, Boğaz and Lapta again displayed significant cooling tendencies, highlighting the persistence of localized thermal contrasts within the northern coastal and transitional zones. Summer Tmax exhibited a more heterogeneous structure compared to the other seasons. While significant warming persisted at inland and eastern coastal stations such as Lefkoşa, Yenierenköy, İskele, Alevkaya, and Çamlıbel, several coastal and northern stations, including Lapta, Boğaz, Gazimağusa, and Esentepe, displayed significant cooling tendencies. These results suggest that maritime influence and localized coastal climatic conditions may partially moderate summer daytime warming in selected regions.
Seasonal Tmin trends generally demonstrated widespread nighttime warming, particularly during autumn and winter. Autumn Tmin exhibited highly coherent warming across many coastal and northern stations, including Güzelyurt, Gazimağusa, Girne, Lapta, İskele, Boğaz, Esentepe, Çamlıbel, Yenierenköy, and Alevkaya. Similar warming structures persisted during winter, when strong Tmin increases were observed particularly at coastal stations such as Girne, Gazimağusa, Lapta, and İskele, as well as at northern mountainous stations including Alevkaya, Çamlıbel, Esentepe, and Boğaz. These findings indicate notable nocturnal warming across maritime and northern elevated regions during the main wet seasons.
Spring Tmin warming remained evident but became more spatially selective compared to autumn and winter. Significant warming trends persisted at Gazimağusa, Girne, Lapta, Alevkaya, Çamlıbel, Boğaz, İskele, and Esentepe, while other stations displayed weak or nonsignificant responses. During summer, Tmin warming was mainly concentrated at coastal stations, particularly Gazimağusa, Girne, Lapta, and Güzelyurt, whereas northern mountainous warming weakened considerably. A persistent exception throughout all seasons was observed at Lefkoşa, where Tmin exhibited statistically significant decreasing trends during autumn, winter, spring, and summer despite widespread Tmax warming across many regions. This contrasting behavior suggests that nocturnal temperature variability within the inland Mesaoria region may differ substantially from the broader warming patterns observed elsewhere across Northern Cyprus.
The Pettitt test results demonstrated substantial seasonal differences between precipitation and temperature variables (Figure 5). Seasonal precipitation series generally exhibited statistically nonsignificant and spatially inconsistent breakpoint structures, indicating that most precipitation changes evolved gradually rather than through abrupt hydroclimatic transitions. In contrast, the Tmax and Tmin series exhibited distinct but spatially coherent breakpoint patterns across the coastal, inland, and hilly station groups. Tmax breakpoints were concentrated predominantly between 2000 and 2010 across all geographic classes. For Tmin, hilly stations displayed an earlier cluster during the late 1990s, whereas most coastal and inland breakpoints occurred between 2005 and 2010. These patterns indicate geographically differentiated but temporally organized thermal shifts across Northern Cyprus.

3.2. Insights from Innovative Trend Analysis

3.2.1. Class-Based Characteristics of Precipitation Trends

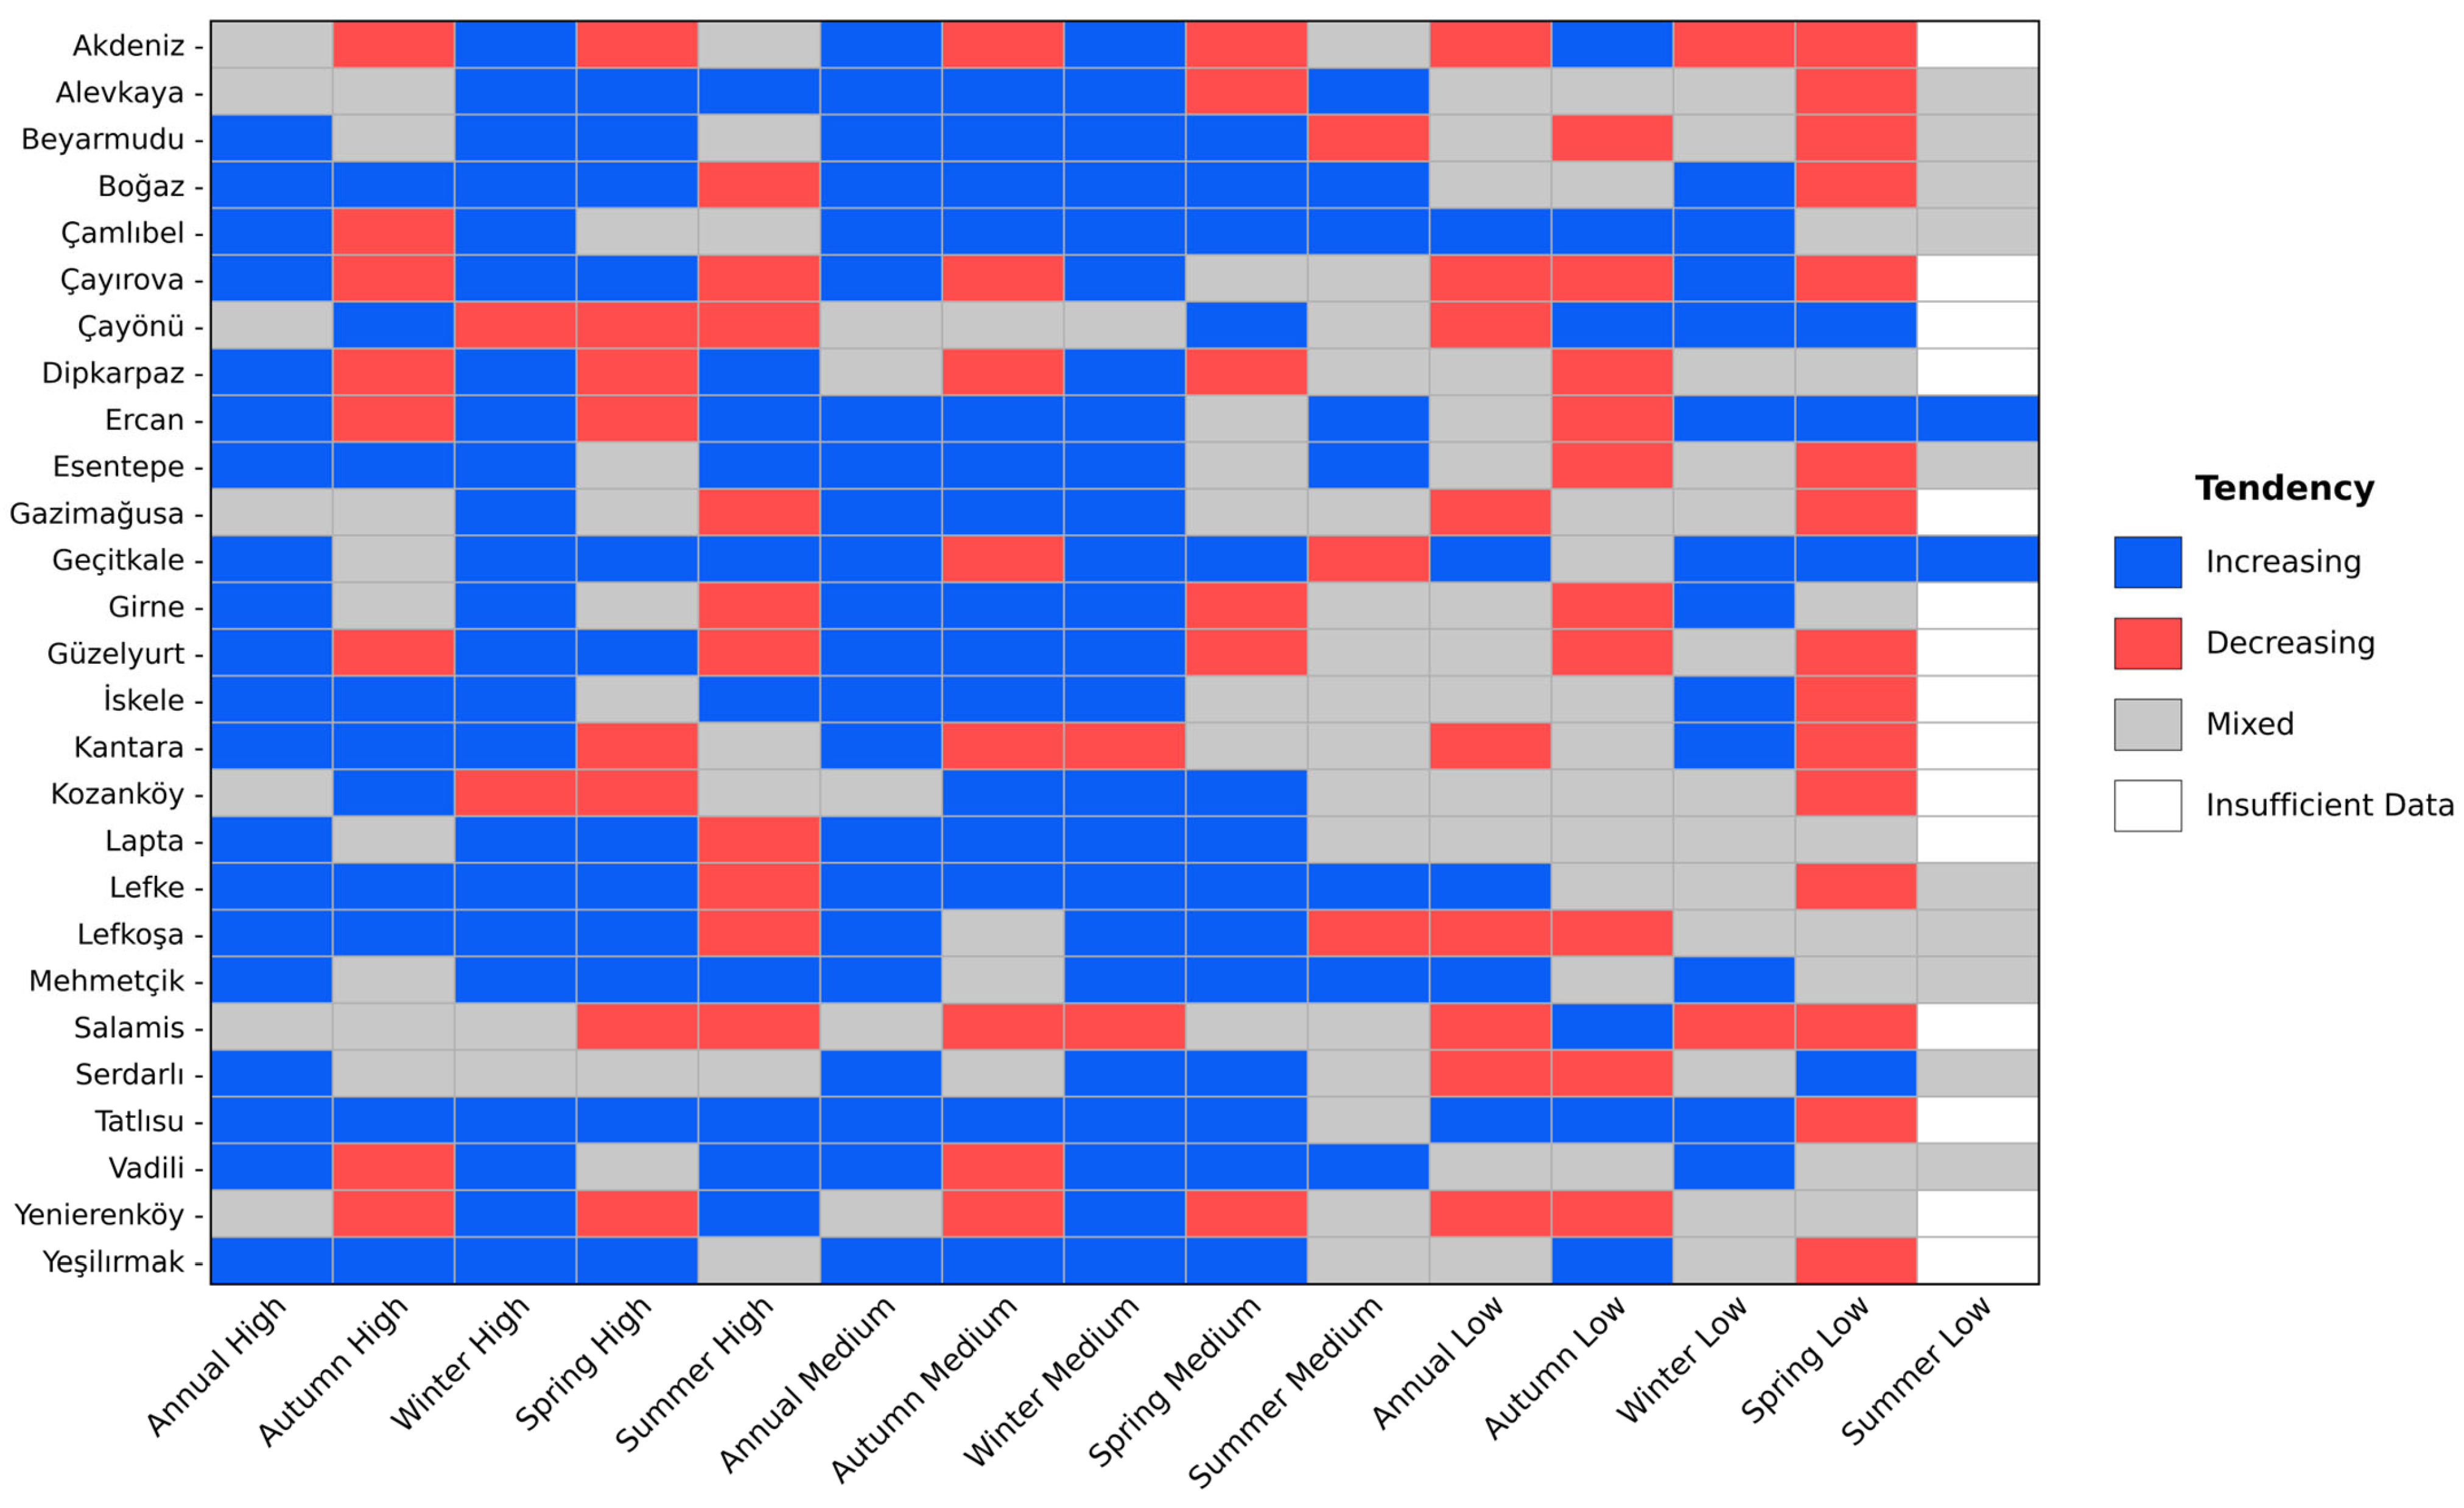
The ITA revealed that precipitation changes in Northern Cyprus are strongly dependent on precipitation magnitude and season, with low-, medium-, and high-value precipitation classes frequently exhibiting contrasting behaviors. Compared to the MMK analysis, the ITA results highlighted substantial asymmetry and spatial heterogeneity across the island. At the annual scale, high and medium precipitation values were predominantly characterized by increasing tendencies across many stations, particularly within the Kyrenia mountainous and several coastal stations (Figure 6). Similar increasing behavior was also observed at Karpas stations, such as Çayırova, Dipkarpaz, and Mehmetçik. In contrast, annual low precipitation values frequently exhibited decreasing or mixed behavior, especially at coastal and inland stations including Akdeniz, Çayırova, Çayönü, Kantara, Lefkoşa, Salamis, and Yenierenköy. This divergence between high and low precipitation classes suggests increasing precipitation irregularity and nonuniform restructuring of annual precipitation regimes across Northern Cyprus.
Winter precipitation exhibited the most spatially coherent increasing structure among all seasons. Both high and medium winter precipitation classes showed widespread increasing tendencies across stations representing the Kyrenia, Mesaoria, and Morphou subbasins, whereas low winter precipitation values were generally dominated by mixed behavior. These findings indicate that winter precipitation intensification is mainly associated with moderate and high precipitation conditions and is spatially widespread across the island. Autumn and spring precipitation displayed considerably more heterogeneous ITA behavior. Decreasing high autumn precipitation tendencies were particularly evident across several eastern coastal and inland stations, including Çayırova, Dipkarpaz, Ercan, Vadili, and Yenierenköy, whereas medium autumn precipitation values generally exhibited increasing behavior. Similarly, spring precipitation showed clear asymmetry, with decreasing high precipitation tendencies observed particularly at eastern coastal and hilly stations, such as Dipkarpaz, Kantara, Kozanköy, Salamis, and Yenierenköy, while medium precipitation values more frequently displayed increasing tendencies. These contrasting responses indicate increasing transitional-season precipitation variability and nonuniform hydroclimatic restructuring across climatically sensitive coastal and mountainous regions. Summer precipitation differed markedly from the other seasons due to the inherently dry Mediterranean climate of Cyprus during summer. Since precipitation amounts are generally very limited during this season, many stations exhibited mixed or insufficient-data behavior, particularly within the low and medium precipitation classes. Overall, the ITA results demonstrate that precipitation changes in Northern Cyprus cannot be fully characterized using monotonic trend analyses alone. The contrasting responses of low-, medium-, and high-value precipitation classes revealed substantial nonmonotonic and spatially heterogeneous behavior across many stations and seasons, indicating complex restructuring of precipitation regimes rather than spatially uniform changes.

3.2.2. Class-Based Characteristics of Temperature Trends

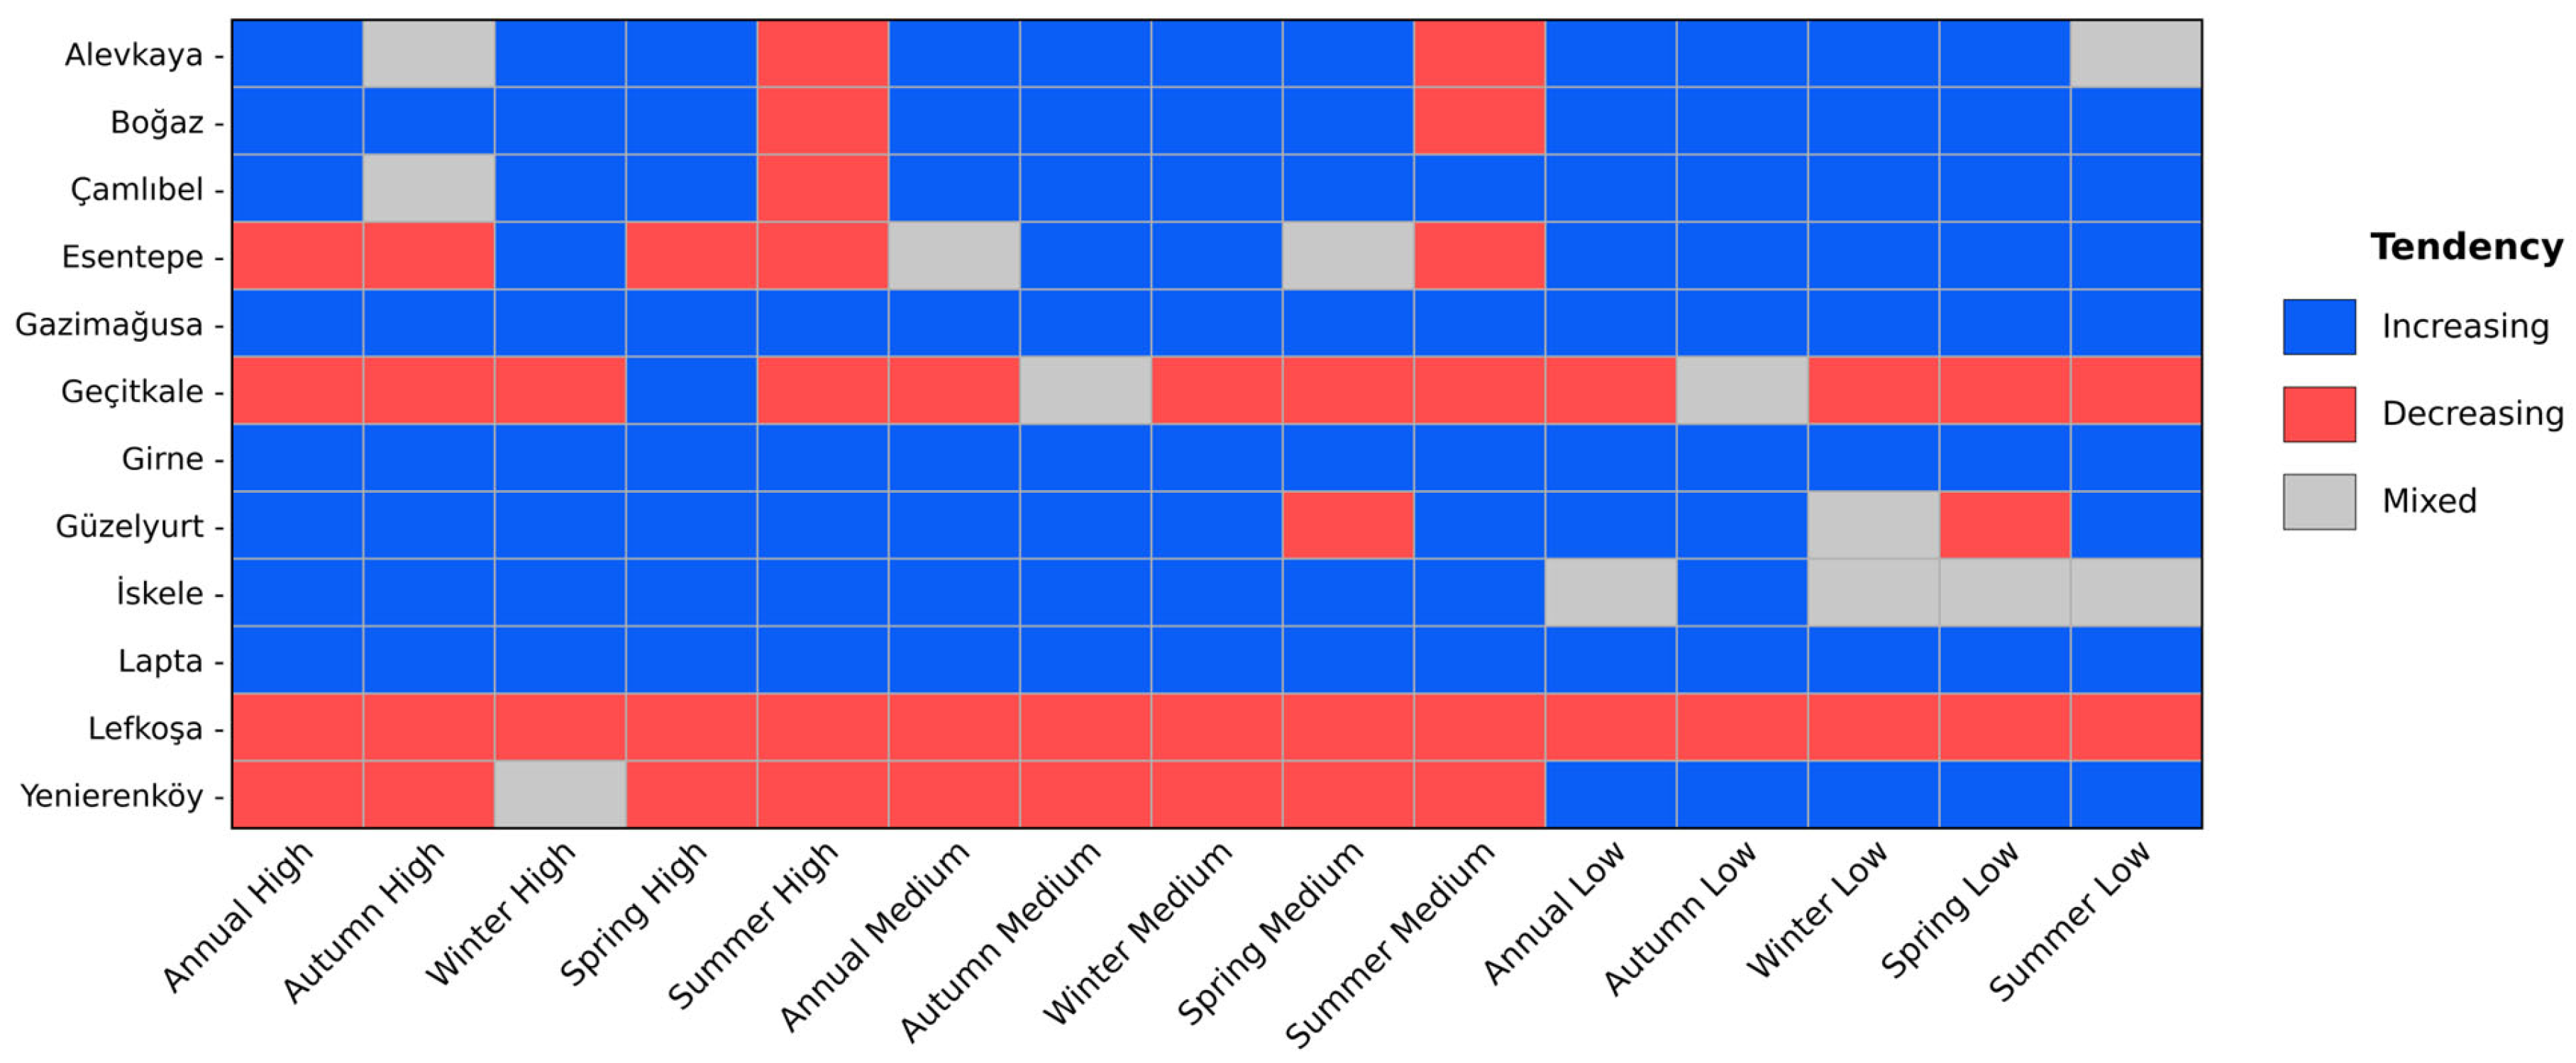
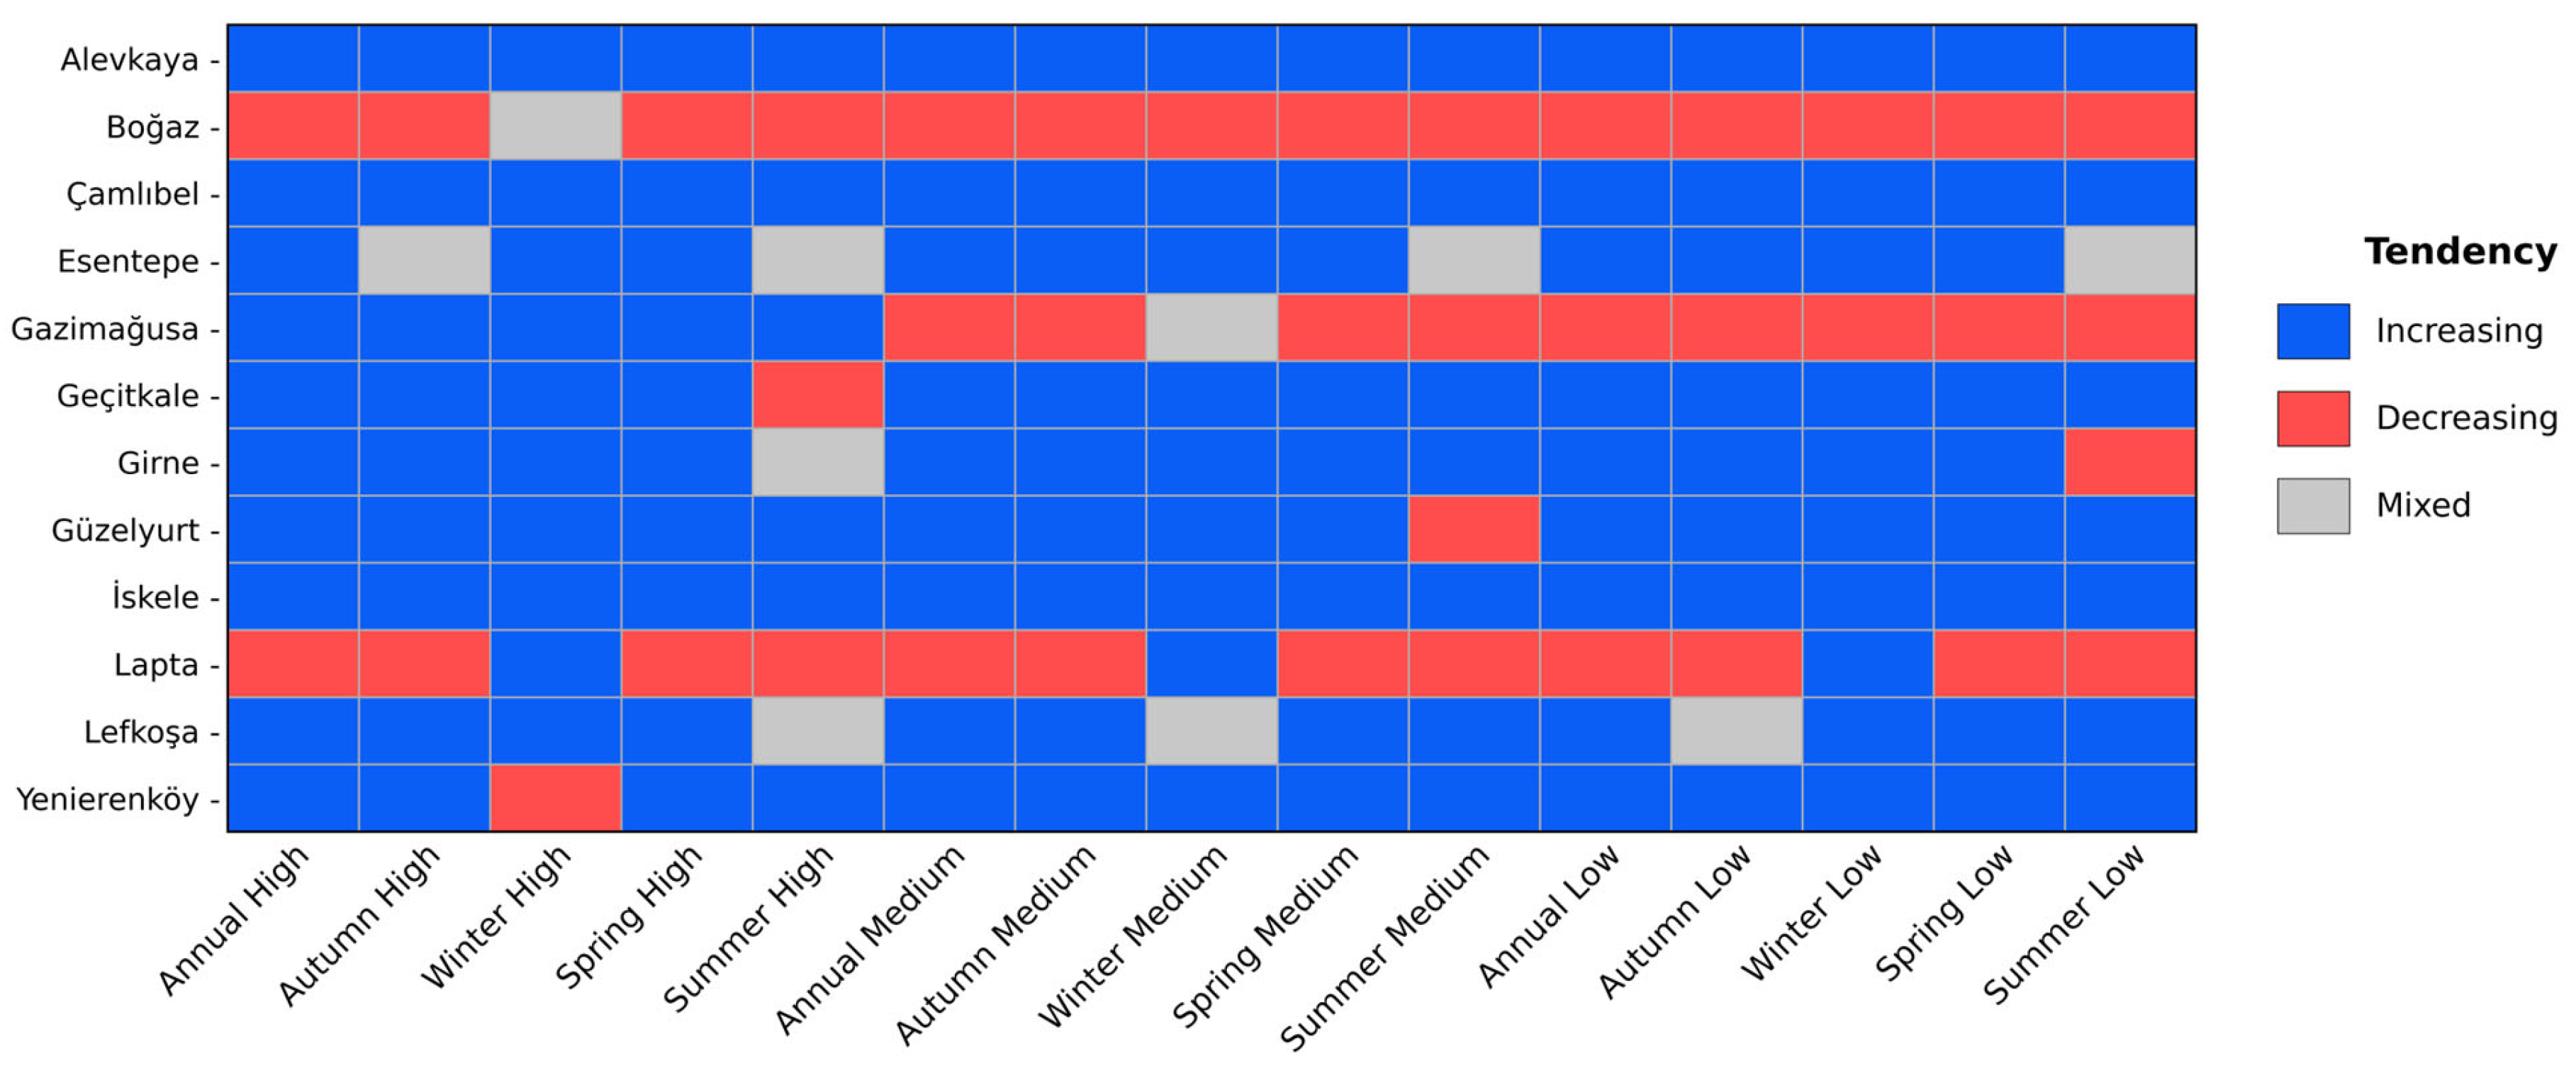
Compared to precipitation, both Tmax and Tmin exhibited considerably more spatially coherent ITA behavior, with temperature trends generally dominated by monotonic warming signals across most stations, seasons, and temperature classes. Nevertheless, important differences emerged between Tmax and Tmin responses, particularly regarding the spatial consistency and distributional structure of warming. As given in Figure 7, Tmax trends were predominantly characterized by increasing tendencies across high-, medium-, and low-temperature classes at many stations. Winter Tmax exhibited especially coherent increasing behavior across nearly all stations and temperature classes. Similar widespread increases were also observed in annual and spring Tmax, indicating relatively uniform daytime warming across Northern Cyprus. However, some stations displayed contrasting behavior. Boğaz and Lapta showed widespread decreasing Tmax tendencies across most annual and seasonal temperature classes, while Gazimağusa exhibited decreasing behavior mainly in medium- and low-temperature classes. These localized differences suggest that coastal influences and local climatic conditions may modulate daytime temperature evolution at specific locations.
Tmin trends also displayed strong spatial coherence, although the class-based behavior differed substantially from Tmax at several stations (Figure 8). Increasing Tmin tendencies were particularly dominant across coastal stations within the Kyrenia and Mesaoria subbasins, including Gazimağusa, Girne, and Lapta, where increasing behavior was evident across most low-, medium-, and high-temperature classes. This pattern indicates persistent nighttime warming throughout much of the temperature distribution in maritime-influenced regions. In contrast, inland and eastern stations, such as Lefkoşa, Geçitkale, and Yenierenköy exhibited more widespread decreasing Tmin tendencies across several annual and seasonal temperature classes, suggesting stronger local variability in nighttime thermal conditions across inland and eastern parts of Northern Cyprus. Figure 8 further revealed stronger station-dependent asymmetry than Tmax, particularly within annual and seasonal high-temperature classes. For example, the mountainous Kyrenia stations Alevkaya and Boğaz showed increasing tendencies in several high-temperature classes while simultaneously exhibiting decreasing behavior in summer high and medium Tmin values. This contrasting behavior suggests that elevation and local topographic conditions may influence nocturnal temperature evolution differently across seasons.
Seasonally, winter Tmax and Tmin exhibited the most spatially coherent increasing behavior, consistent with the MMK results indicating widespread winter warming across Northern Cyprus. In contrast, summer temperature behavior displayed greater spatial heterogeneity, particularly for Tmin, where several coastal and inland stations showed decreasing tendencies in medium- and high-temperature classes. Transitional seasons, especially autumn and spring, frequently exhibited mixed class responses, indicating that temperature changes are not always spatially uniform across the full temperature distribution. Overall, the ITA results indicate that temperature changes in Northern Cyprus are considerably more monotonic and spatially coherent than precipitation changes. However, the contrasting responses between Tmax and Tmin, together with the differing behavior of low-, medium-, and high-temperature classes across coastal, inland, and mountainous regions, reveal that thermal regimes across the island are undergoing class-dependent restructuring rather than uniform warming across all stations and seasons.

3.3. Variability and Structural Changes in Hydroclimatic Series

3.3.1. Whole-Record Structural Changes
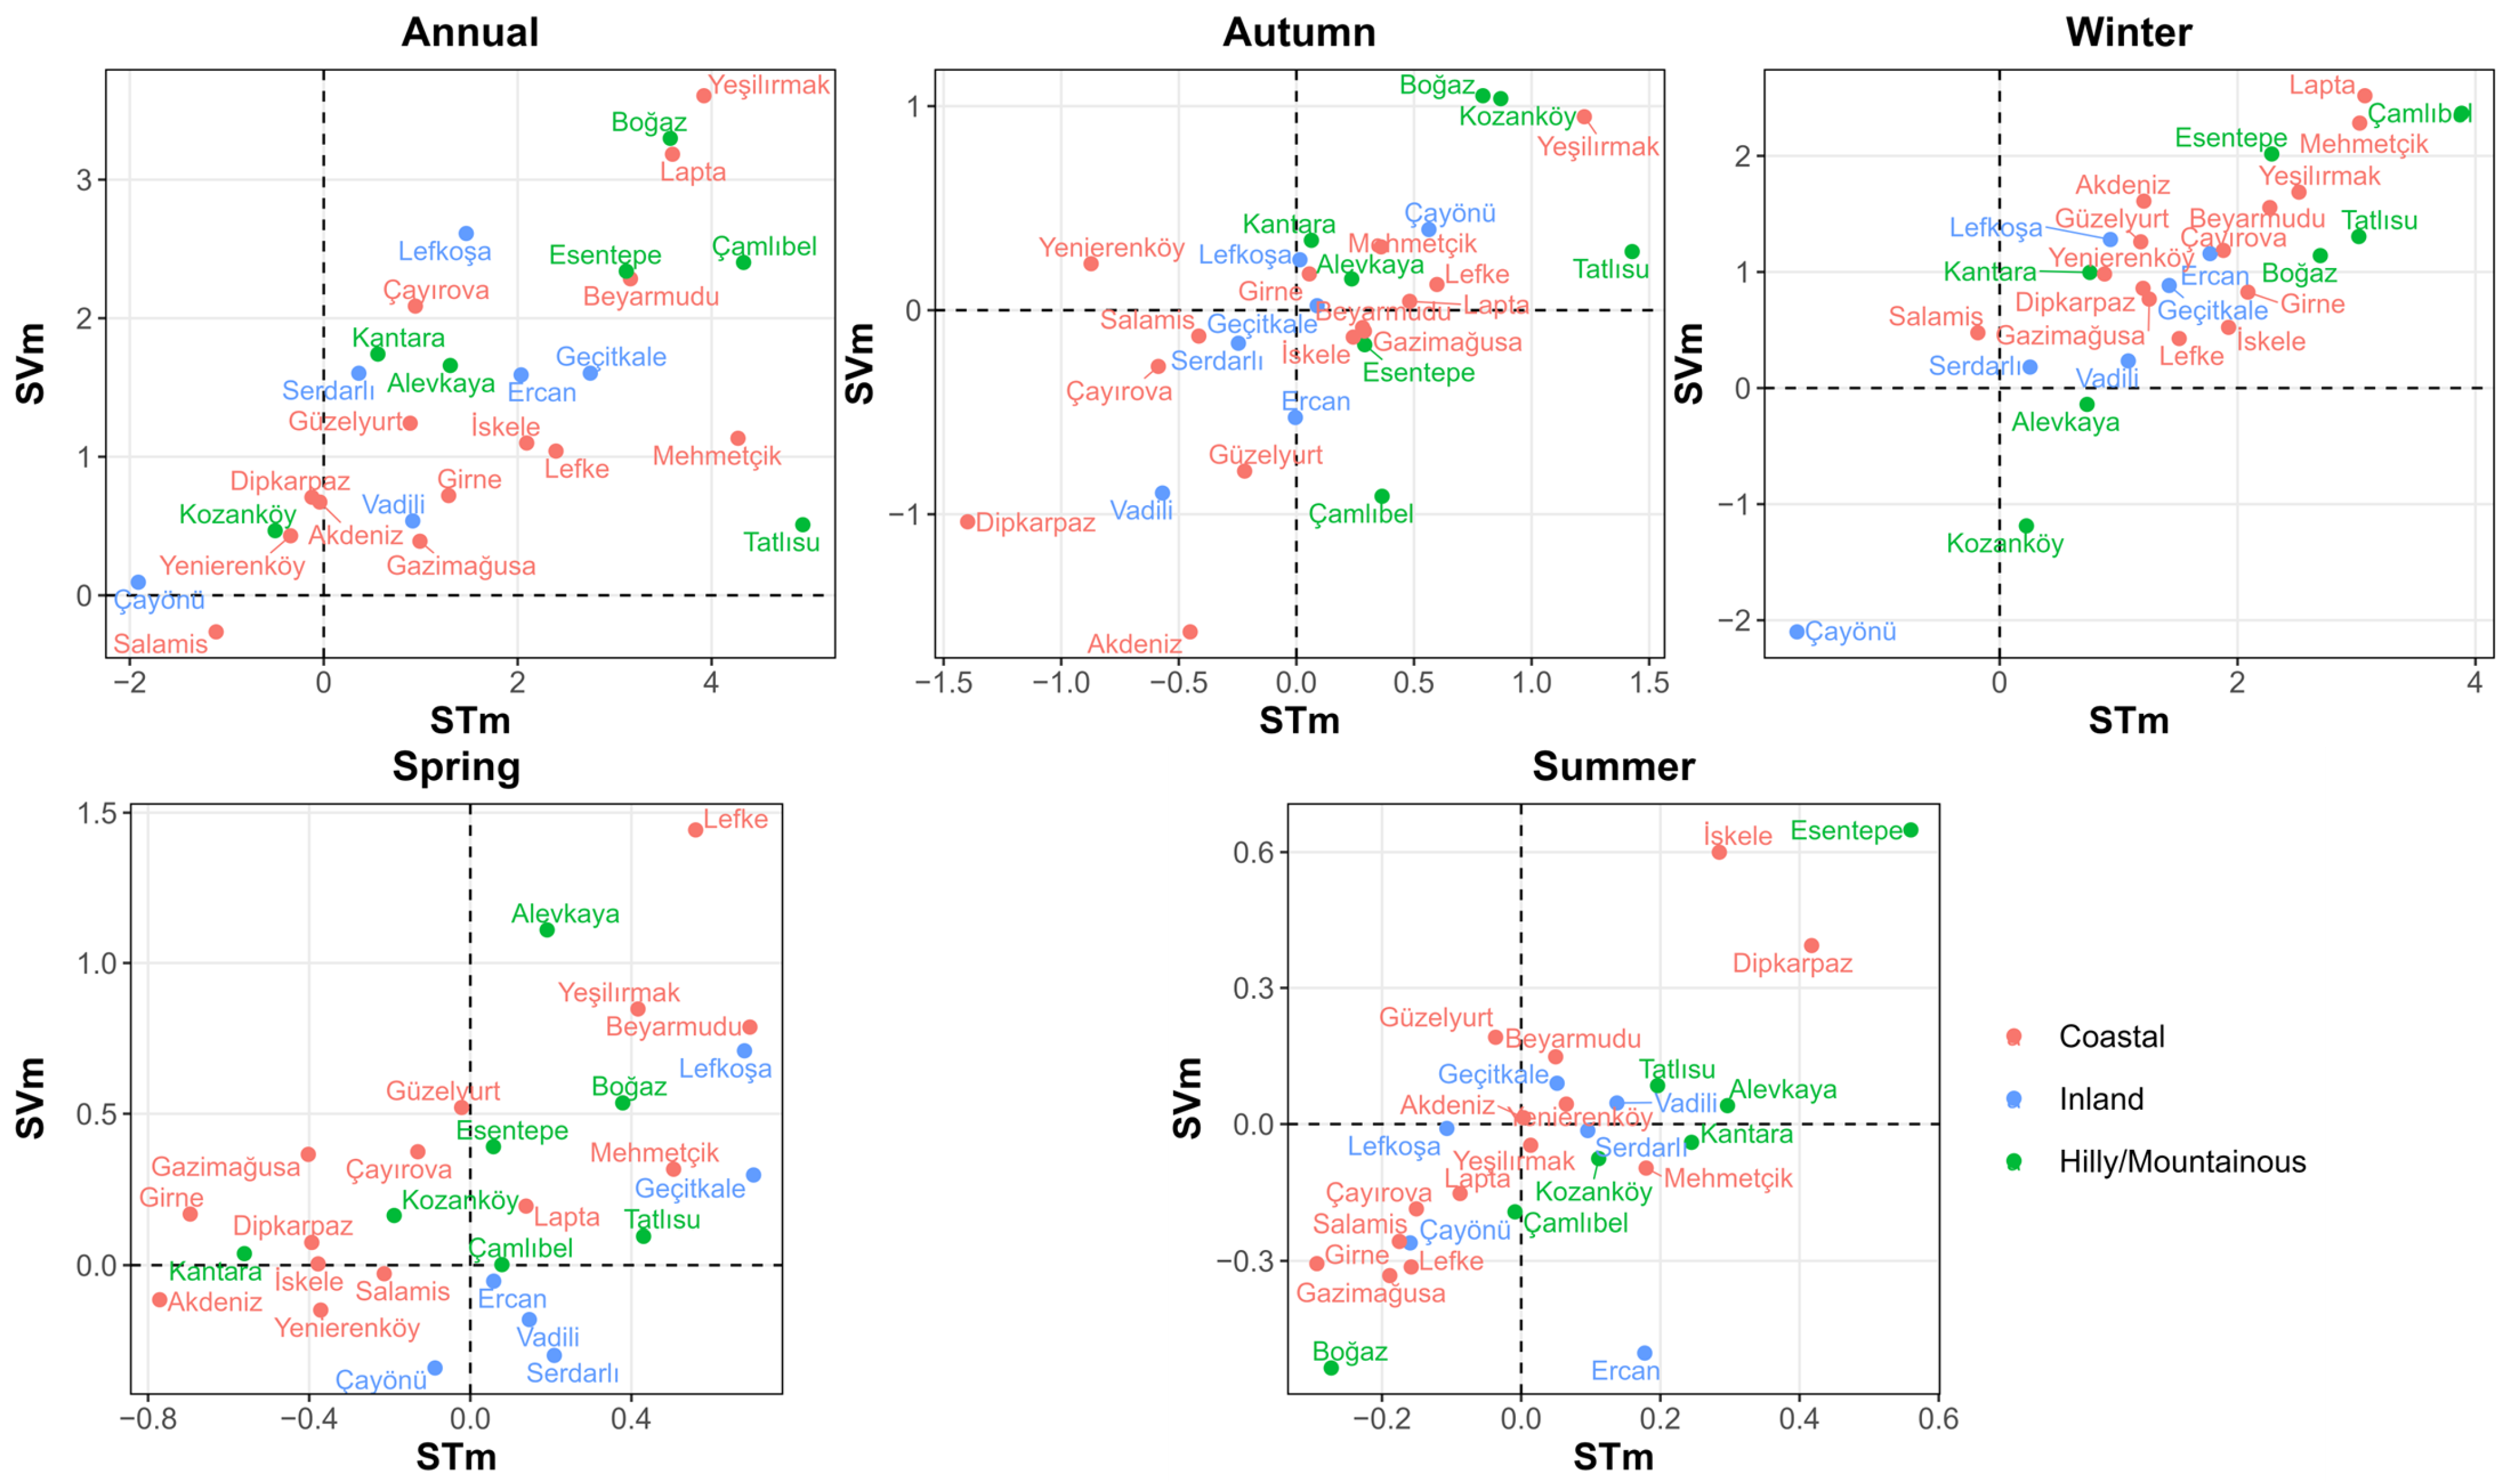
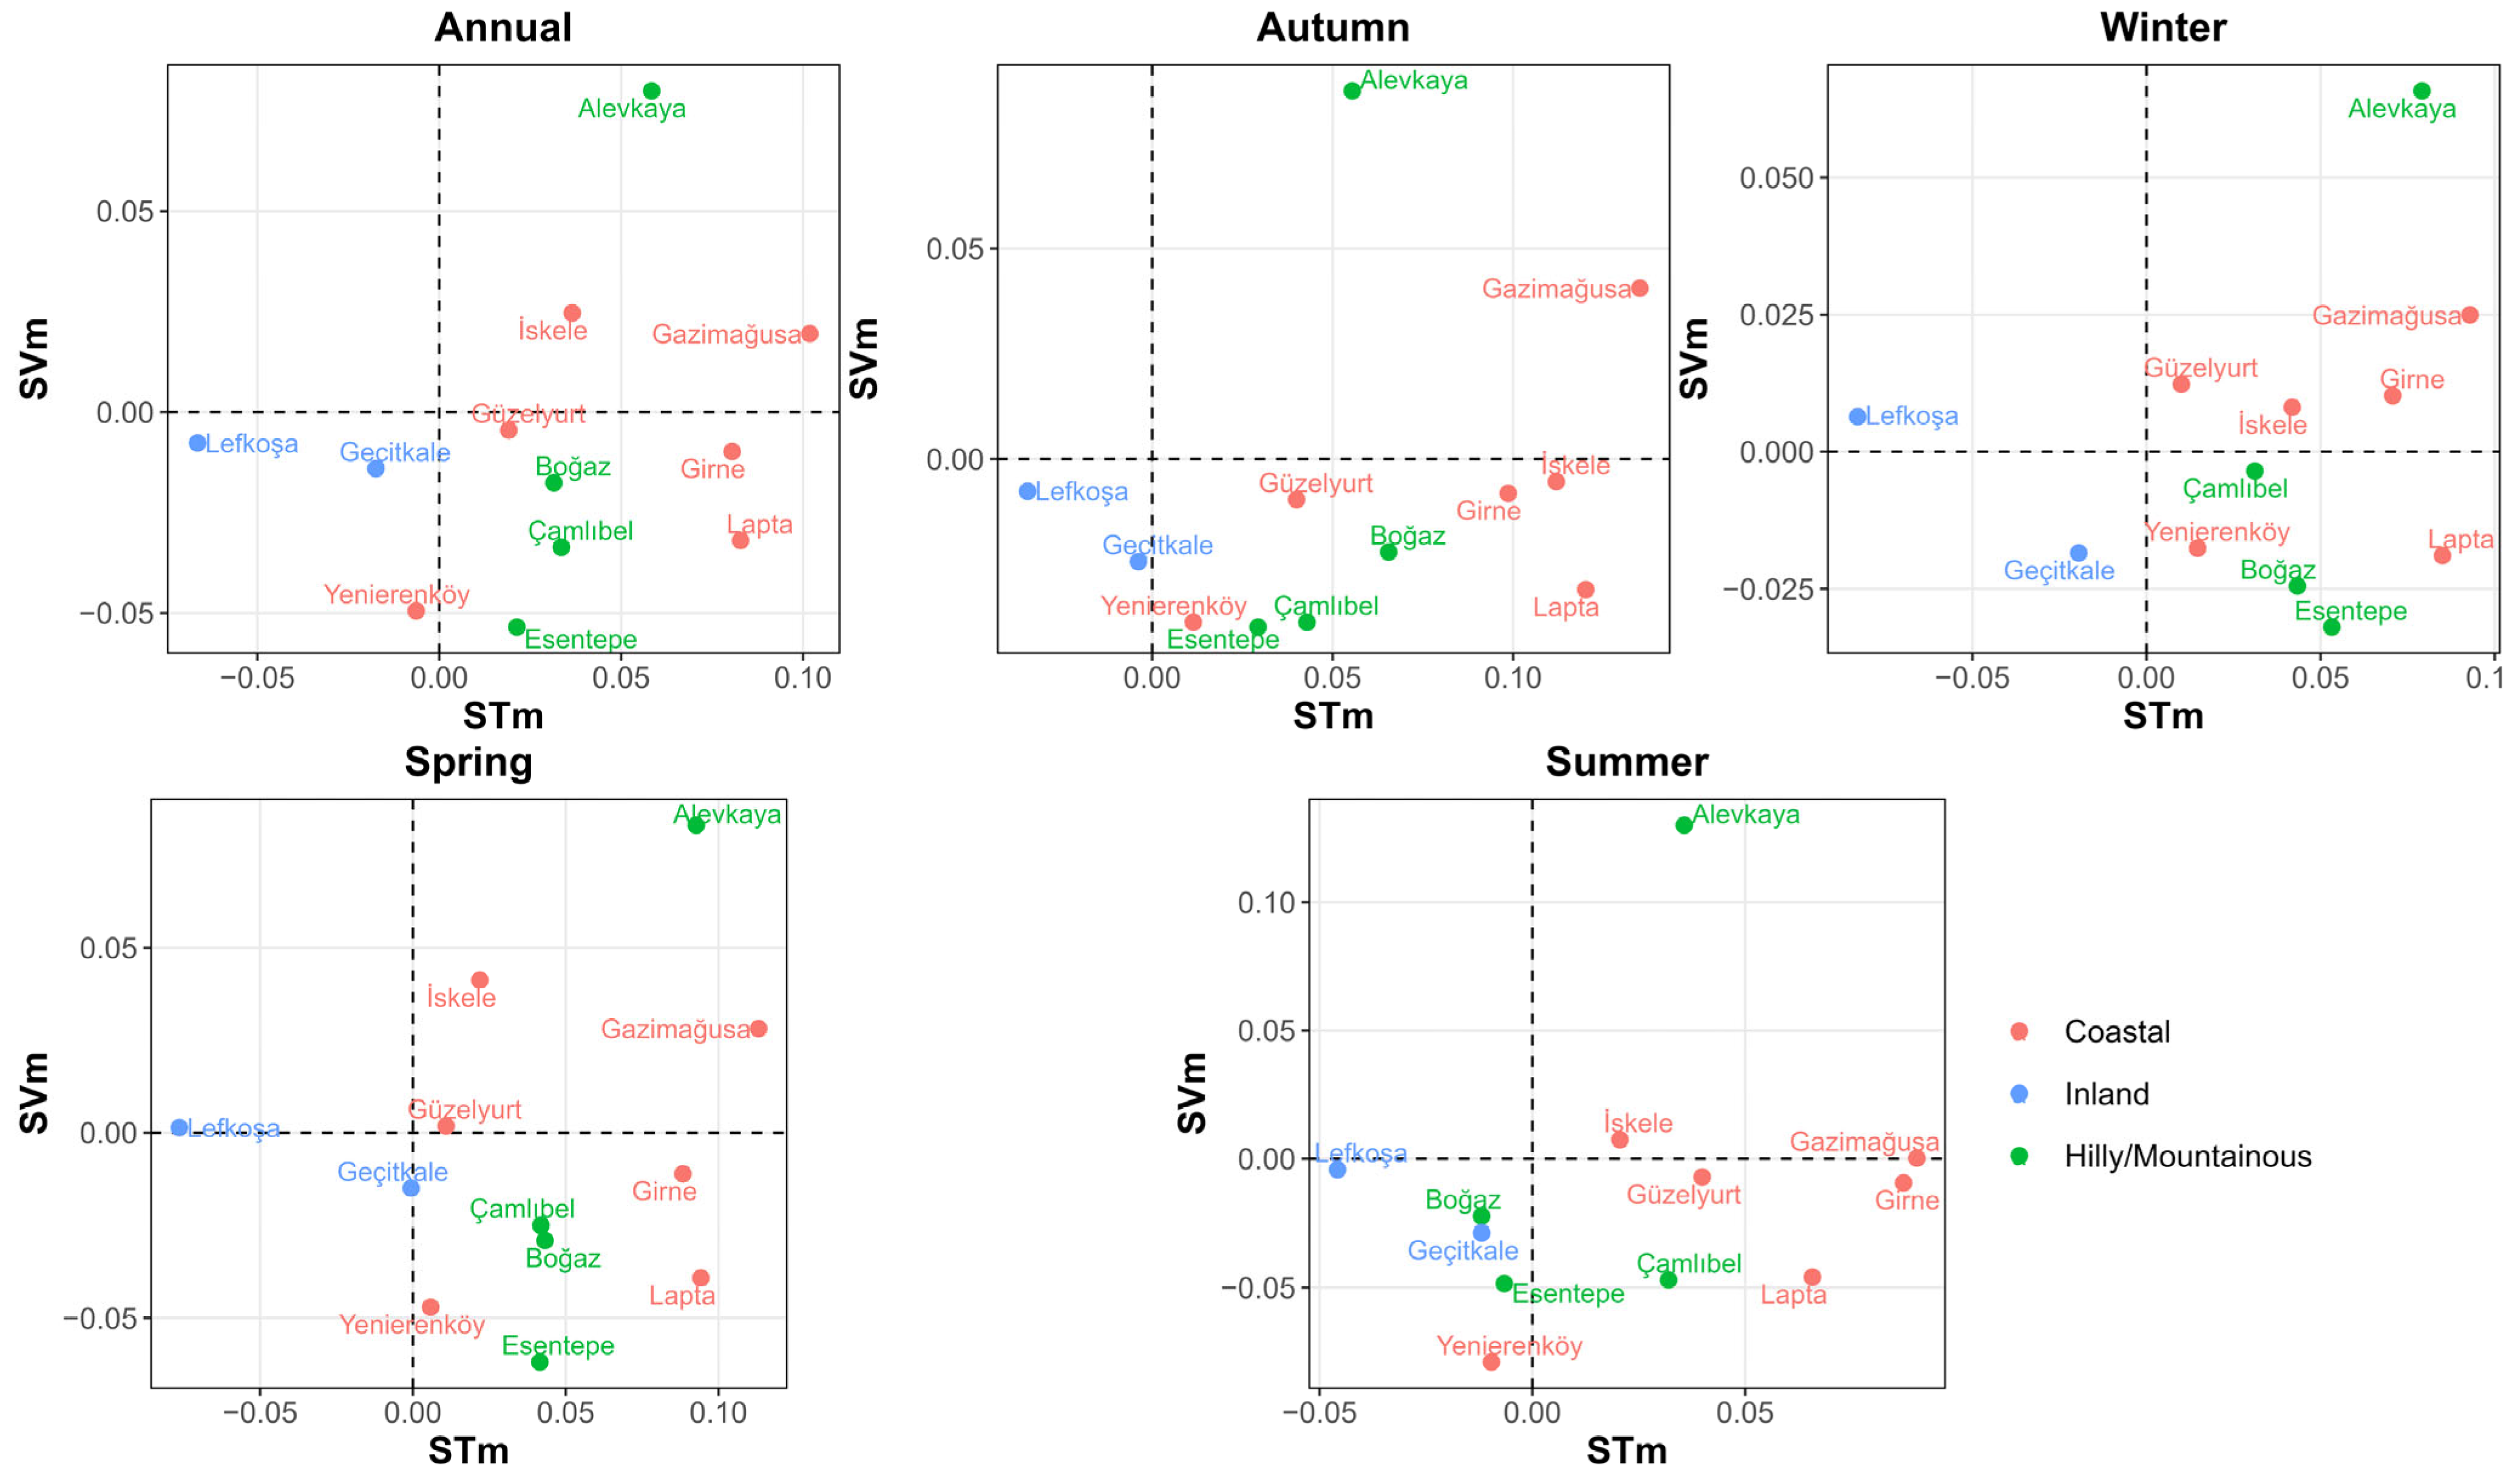
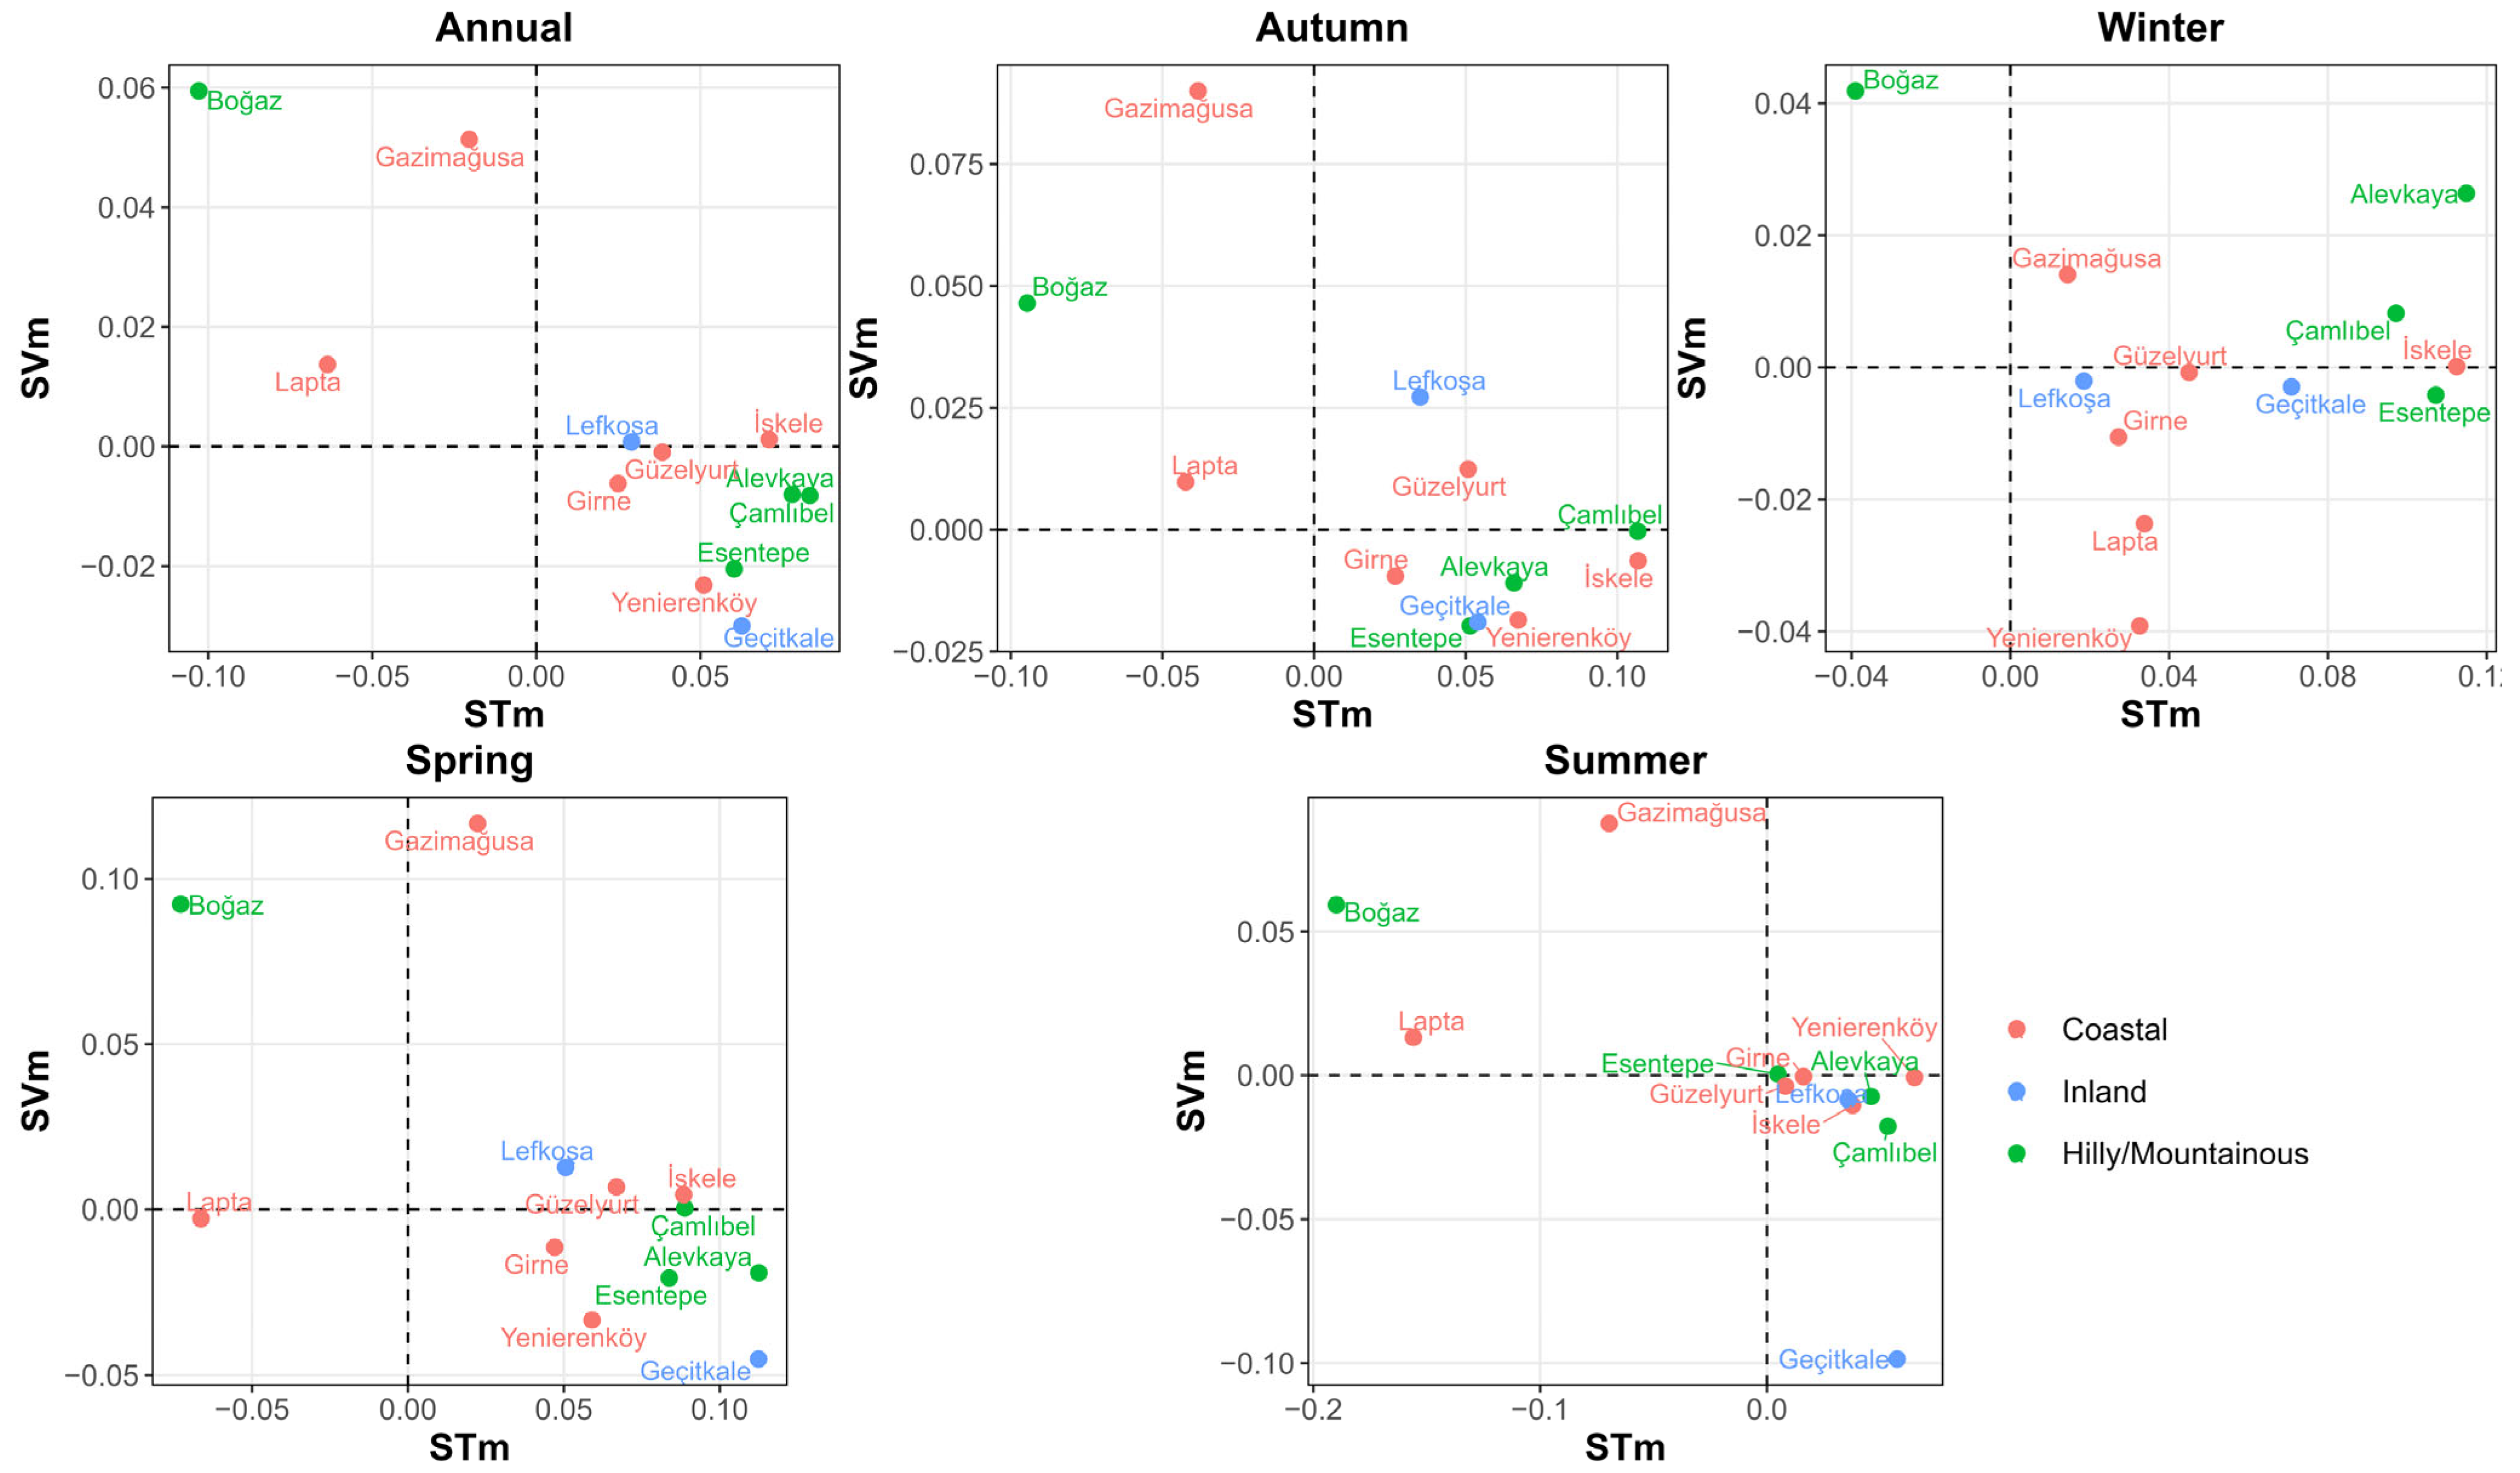
Figure 9, Figure 10 and Figure 11 present the whole-record structural trend characteristics of Pr, Tmax, and Tmin series based on the STVI framework. In these figures, the horizontal axis (STm) represents structural changes in the mean state of the hydroclimatic series, whereas the vertical axis (SVm) represents structural changes in variability. Accordingly, the STm–SVm space can be interpreted in terms of four distinct structural hydroclimatic regimes. The upper-right quadrant (+STm, +SVm) represents simultaneous increases in both mean conditions and variability, indicating intensification accompanied by enhanced interannual instability. The lower-right quadrant (+STm, −SVm) indicates increasing mean conditions with decreasing variability, reflecting strengthening but comparatively more stable regimes. In contrast, the upper-left quadrant (−STm, +SVm) represents decreasing mean conditions accompanied by increasing variability, implying structurally destabilized regimes characterized by enhanced irregularity despite overall reductions in the mean state. Finally, the lower-left quadrant (−STm, −SVm) reflects simultaneous decreases in both mean conditions and variability, corresponding to weakening and comparatively stabilized hydroclimatic regimes.
The annual precipitation series were predominantly concentrated within the upper-right quadrant, indicating simultaneous increases in both precipitation mean and variability across much of Northern Cyprus (Figure 9). This pattern was particularly evident in several coastal and mountainous stations within the Kyrenia and Morphou subbasins, including Boğaz, Esentepe, Çamlıbel, Tatlısu, and Yeşilırmak, which exhibited some of the strongest positive STm and SVm values. Similarly, winter precipitation displayed the clearest and most spatially coherent signal, with nearly all stations occupying the upper-right quadrant, reflecting widespread intensification of winter precipitation regimes accompanied by increasing variability. Strong positive changes were especially pronounced at Lapta, Çamlıbel, Mehmetçik, Yeşilırmak, and Esentepe. In contrast, autumn precipitation exhibited considerably weaker and more heterogeneous organization, with stations distributed across multiple quadrants and clustered closer to the origin, suggesting transitional and spatially inconsistent precipitation responses. During spring, most stations clustered around relatively low STm and SVm values, indicating comparatively modest changes in both mean precipitation and variability. Summer precipitation exhibited the weakest signals overall, with most stations concentrated near the origin due to the highly limited and intermittent nature of Mediterranean summer rainfall.
Figure 9. Precipitation trends of STm–SVm: annual and seasonal structure.
Water 18 02050 g009
Figure 10 shows that Tmax series exhibited substantially different structural behavior compared to precipitation, with generally weaker SVm magnitudes and a stronger dominance of positive STm values across most seasons. At the annual scale, most stations clustered near the horizontal axis with positive STm values but weak variability changes, suggesting that Tmax evolution was primarily governed by shifts in the mean thermal state rather than strong variability amplification. Several stations exhibited positive STm values accompanied by slightly negative SVm values, indicating warming under comparatively stabilized variability conditions. In contrast, Boğaz, Gazimağusa, and Lapta showed negative STm values together with positive SVm values, reflecting localized increases in Tmax variability despite weaker mean warming tendencies.
Figure 10. Tmax STm–SVm annual and seasonal structure.
Water 18 02050 g010
Autumn and spring Tmax exhibited comparatively similar structure, characterized by widespread positive STm values but relatively weak and spatially heterogeneous SVm responses. Several inland and coastal stations, including Lefkoşa and Güzelyurt, displayed positive STm and SVm values, whereas stations such as Esentepe, Geçitkale, Alevkaya, and Yenierenköy showed positive STm values accompanied by negative SVm values, indicating warming under comparatively stabilized variability conditions. In both seasons, most stations remained clustered close to the horizontal axis, suggesting that Tmax variability changes were generally secondary to mean warming tendencies.
Winter Tmax displayed the clearest seasonal warming signal, with nearly all stations concentrated on the positive STm side. Several stations, including Alevkaya, Çamlıbel, Esentepe, and İskele, showed positive STm values with near-zero or weakly positive SVm values, indicating coherent warming with limited variability changes. However, Boğaz remained distinct by exhibiting negative STm but strongly positive SVm values, suggesting enhanced winter Tmax variability despite comparatively weaker mean warming behavior. Summer Tmax exhibited the strongest clustering near the horizontal axis, suggesting that dry-season Tmax evolution was largely controlled by mean warming rather than substantial variability reorganization. Nevertheless, localized departures from this dominant pattern were observed at Geçitkale, Gazimağusa, and Boğaz. Notably, stations were almost entirely absent from the lower-left quadrant (−STm, −SVm), indicating a lack of simultaneous cooling and variability reduction across Northern Cyprus. This further highlights the dominant influence of warming-related structural changes in Tmax series.
Figure 11 demonstrates that positive STm values dominated the Tmin series across all seasons, revealing a consistent nighttime warming tendency throughout Northern Cyprus. Similar to Tmax, most stations clustered near the horizontal axis with comparatively weak SVm magnitudes, suggesting that Tmin evolution was primarily governed by changes in the mean thermal state rather than substantial variability amplification. Several stations in Kyrenia subbasin exhibited positive STm values accompanied by negative SVm values, indicating warming under comparatively stabilized variability conditions. In contrast, Alevkaya consistently displayed strongly positive STm and SVm values across nearly all seasons, reflecting intensified Tmin variability in mountainous conditions.
Autumn Tmin exhibited a relatively coherent lower-right quadrant structure, with most stations characterized by positive STm and negative SVm values. Except for Alevkaya and Gazimağusa, all stations exhibited negative SVm values, whereas STm values were generally positive, with the exception of Lefkoşa and Geçitkale. These results indicate that nighttime temperatures increased across most of Northern Cyprus, while Tmin variability simultaneously declined over a large portion of the region. Winter Tmin displayed highly similar findings with more variability in coastal stations. Also, Spring Tmin showed a structure broadly similar to autumn and winter, with dominant positive STm and generally negative SVm values across many stations. The eastern coastal stations showed localized positive SVm values. In contrast, summer Tmin exhibited a comparatively weaker warming structure, with several stations shifting toward near-zero or negative STm values while variability changes remained generally negative and weak. Nevertheless, Alevkaya remained structurally distinct throughout all seasons due to its persistently strong positive SVm values.
Figure 11. Tmin STm–SVm annual and seasonal structure.
Water 18 02050 g011

3.3.2. Temporal Evolution of Short-Term Structural Trends

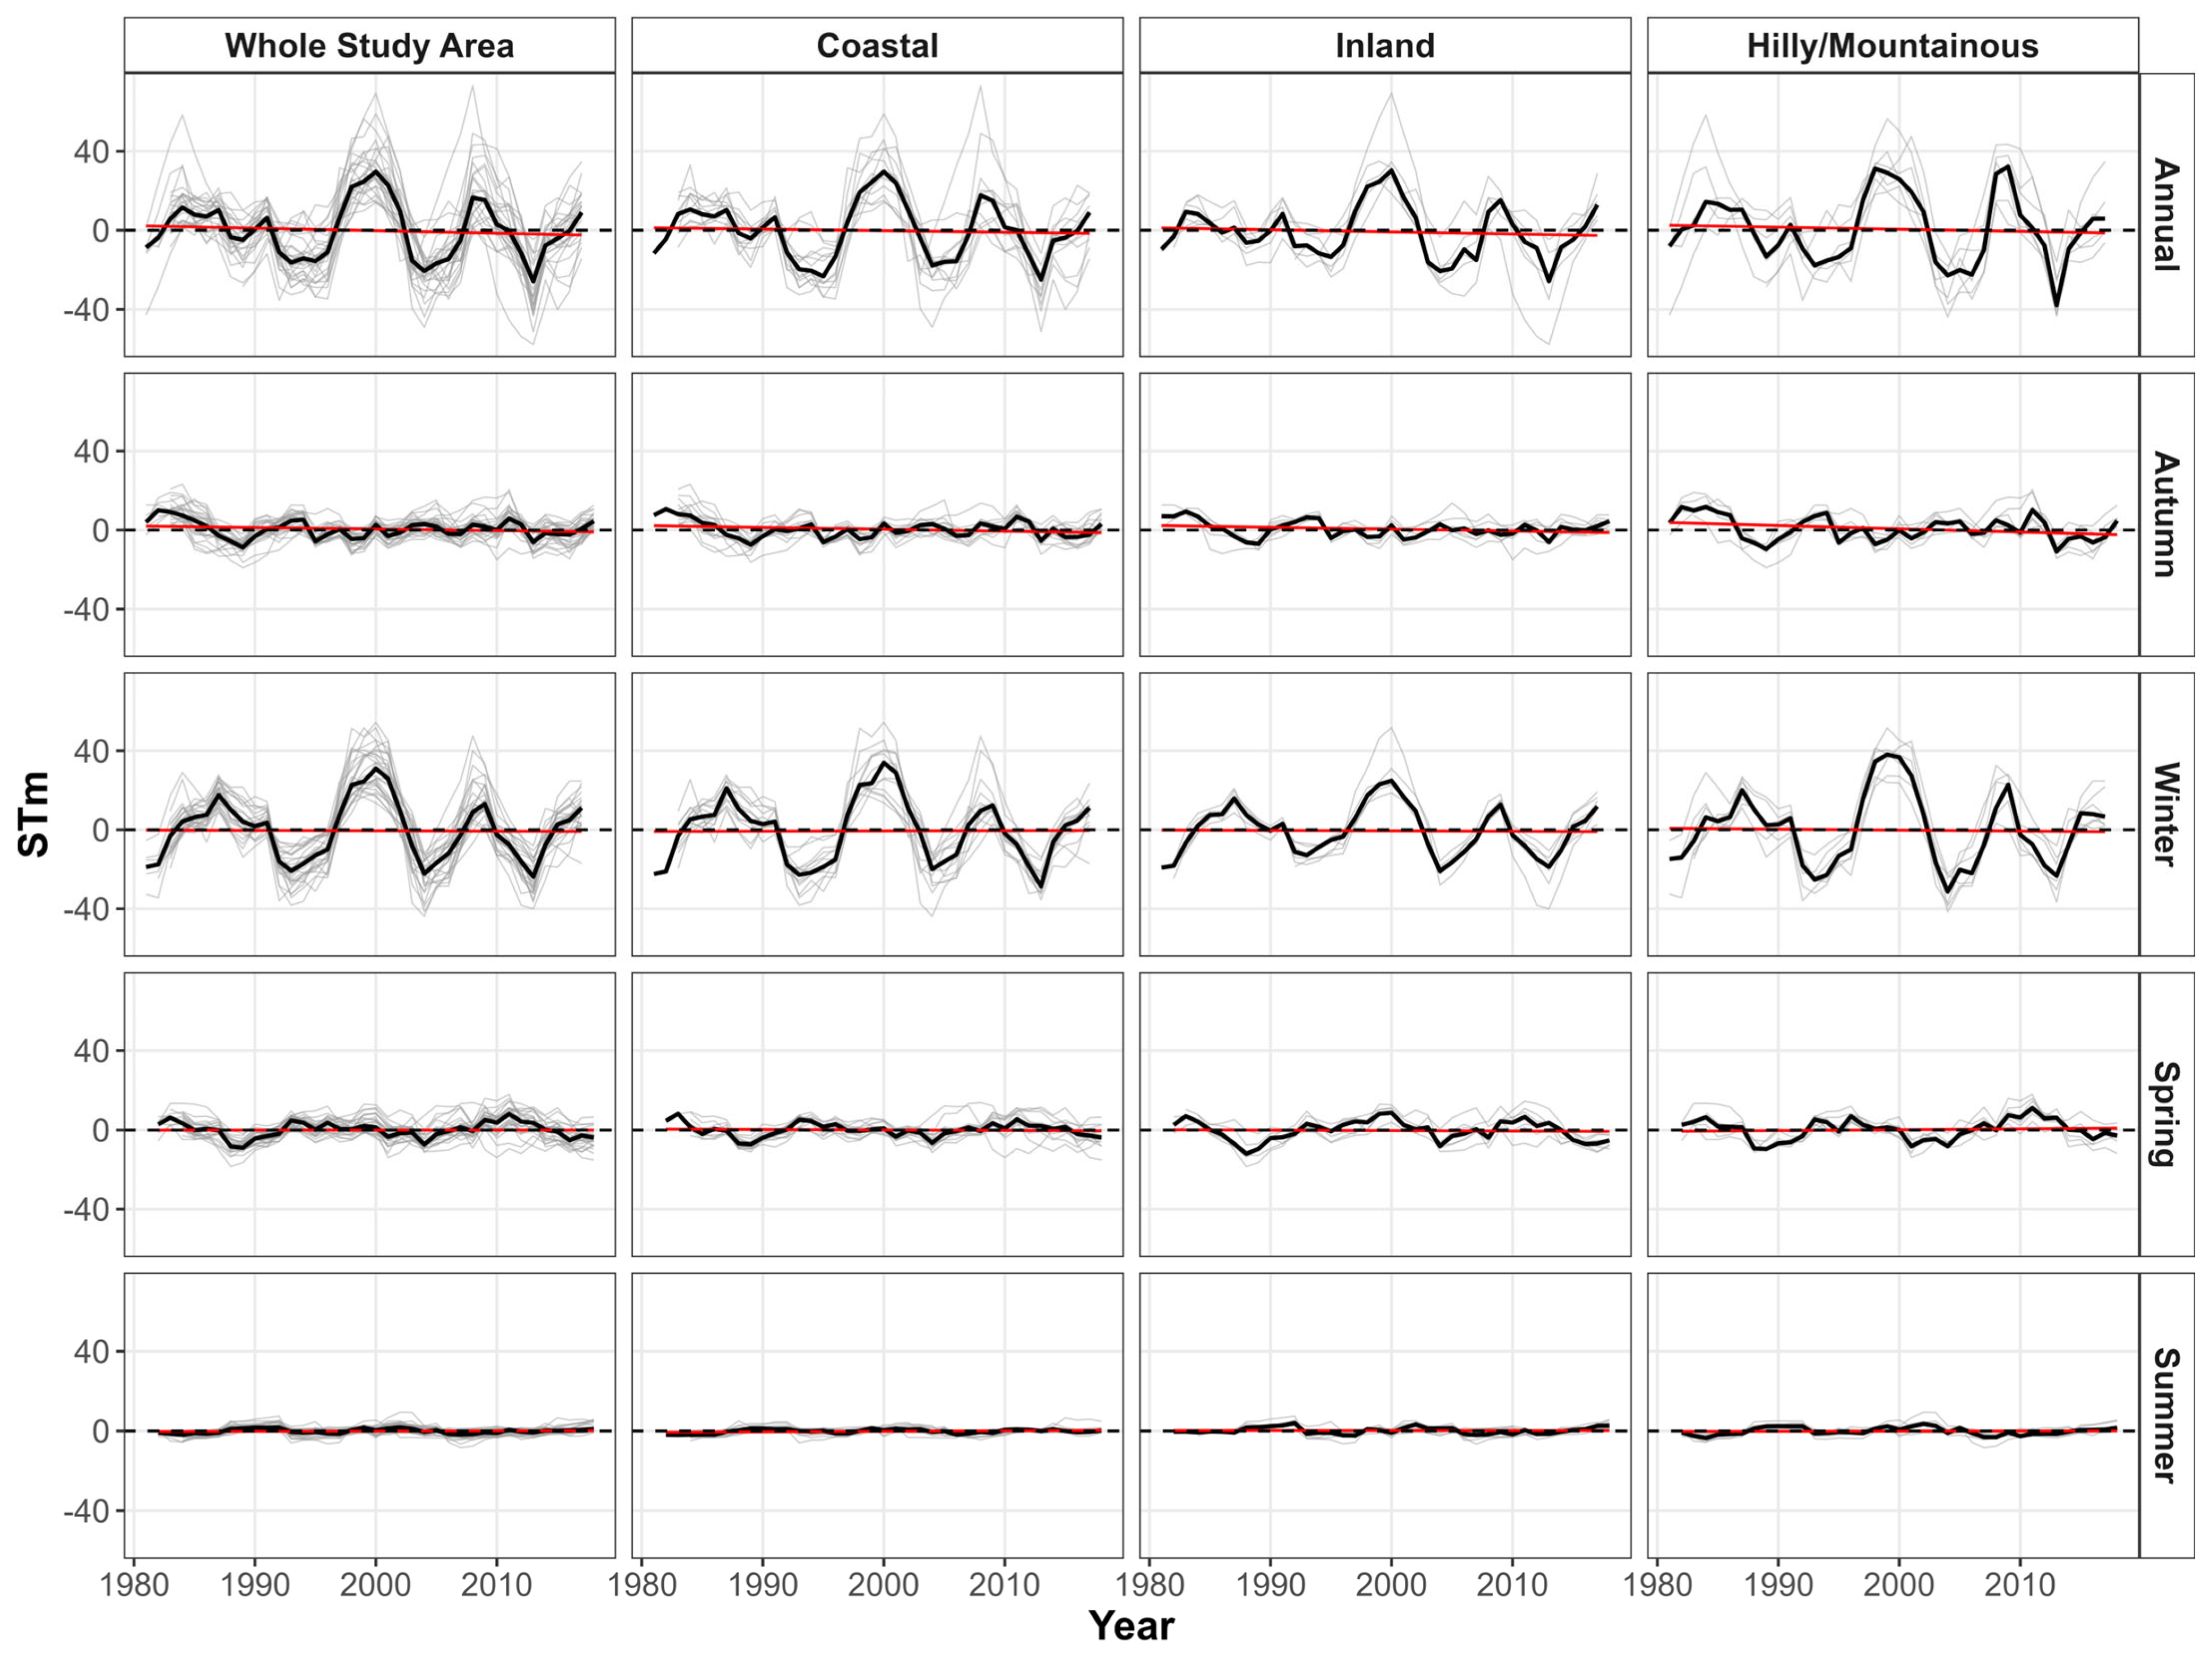
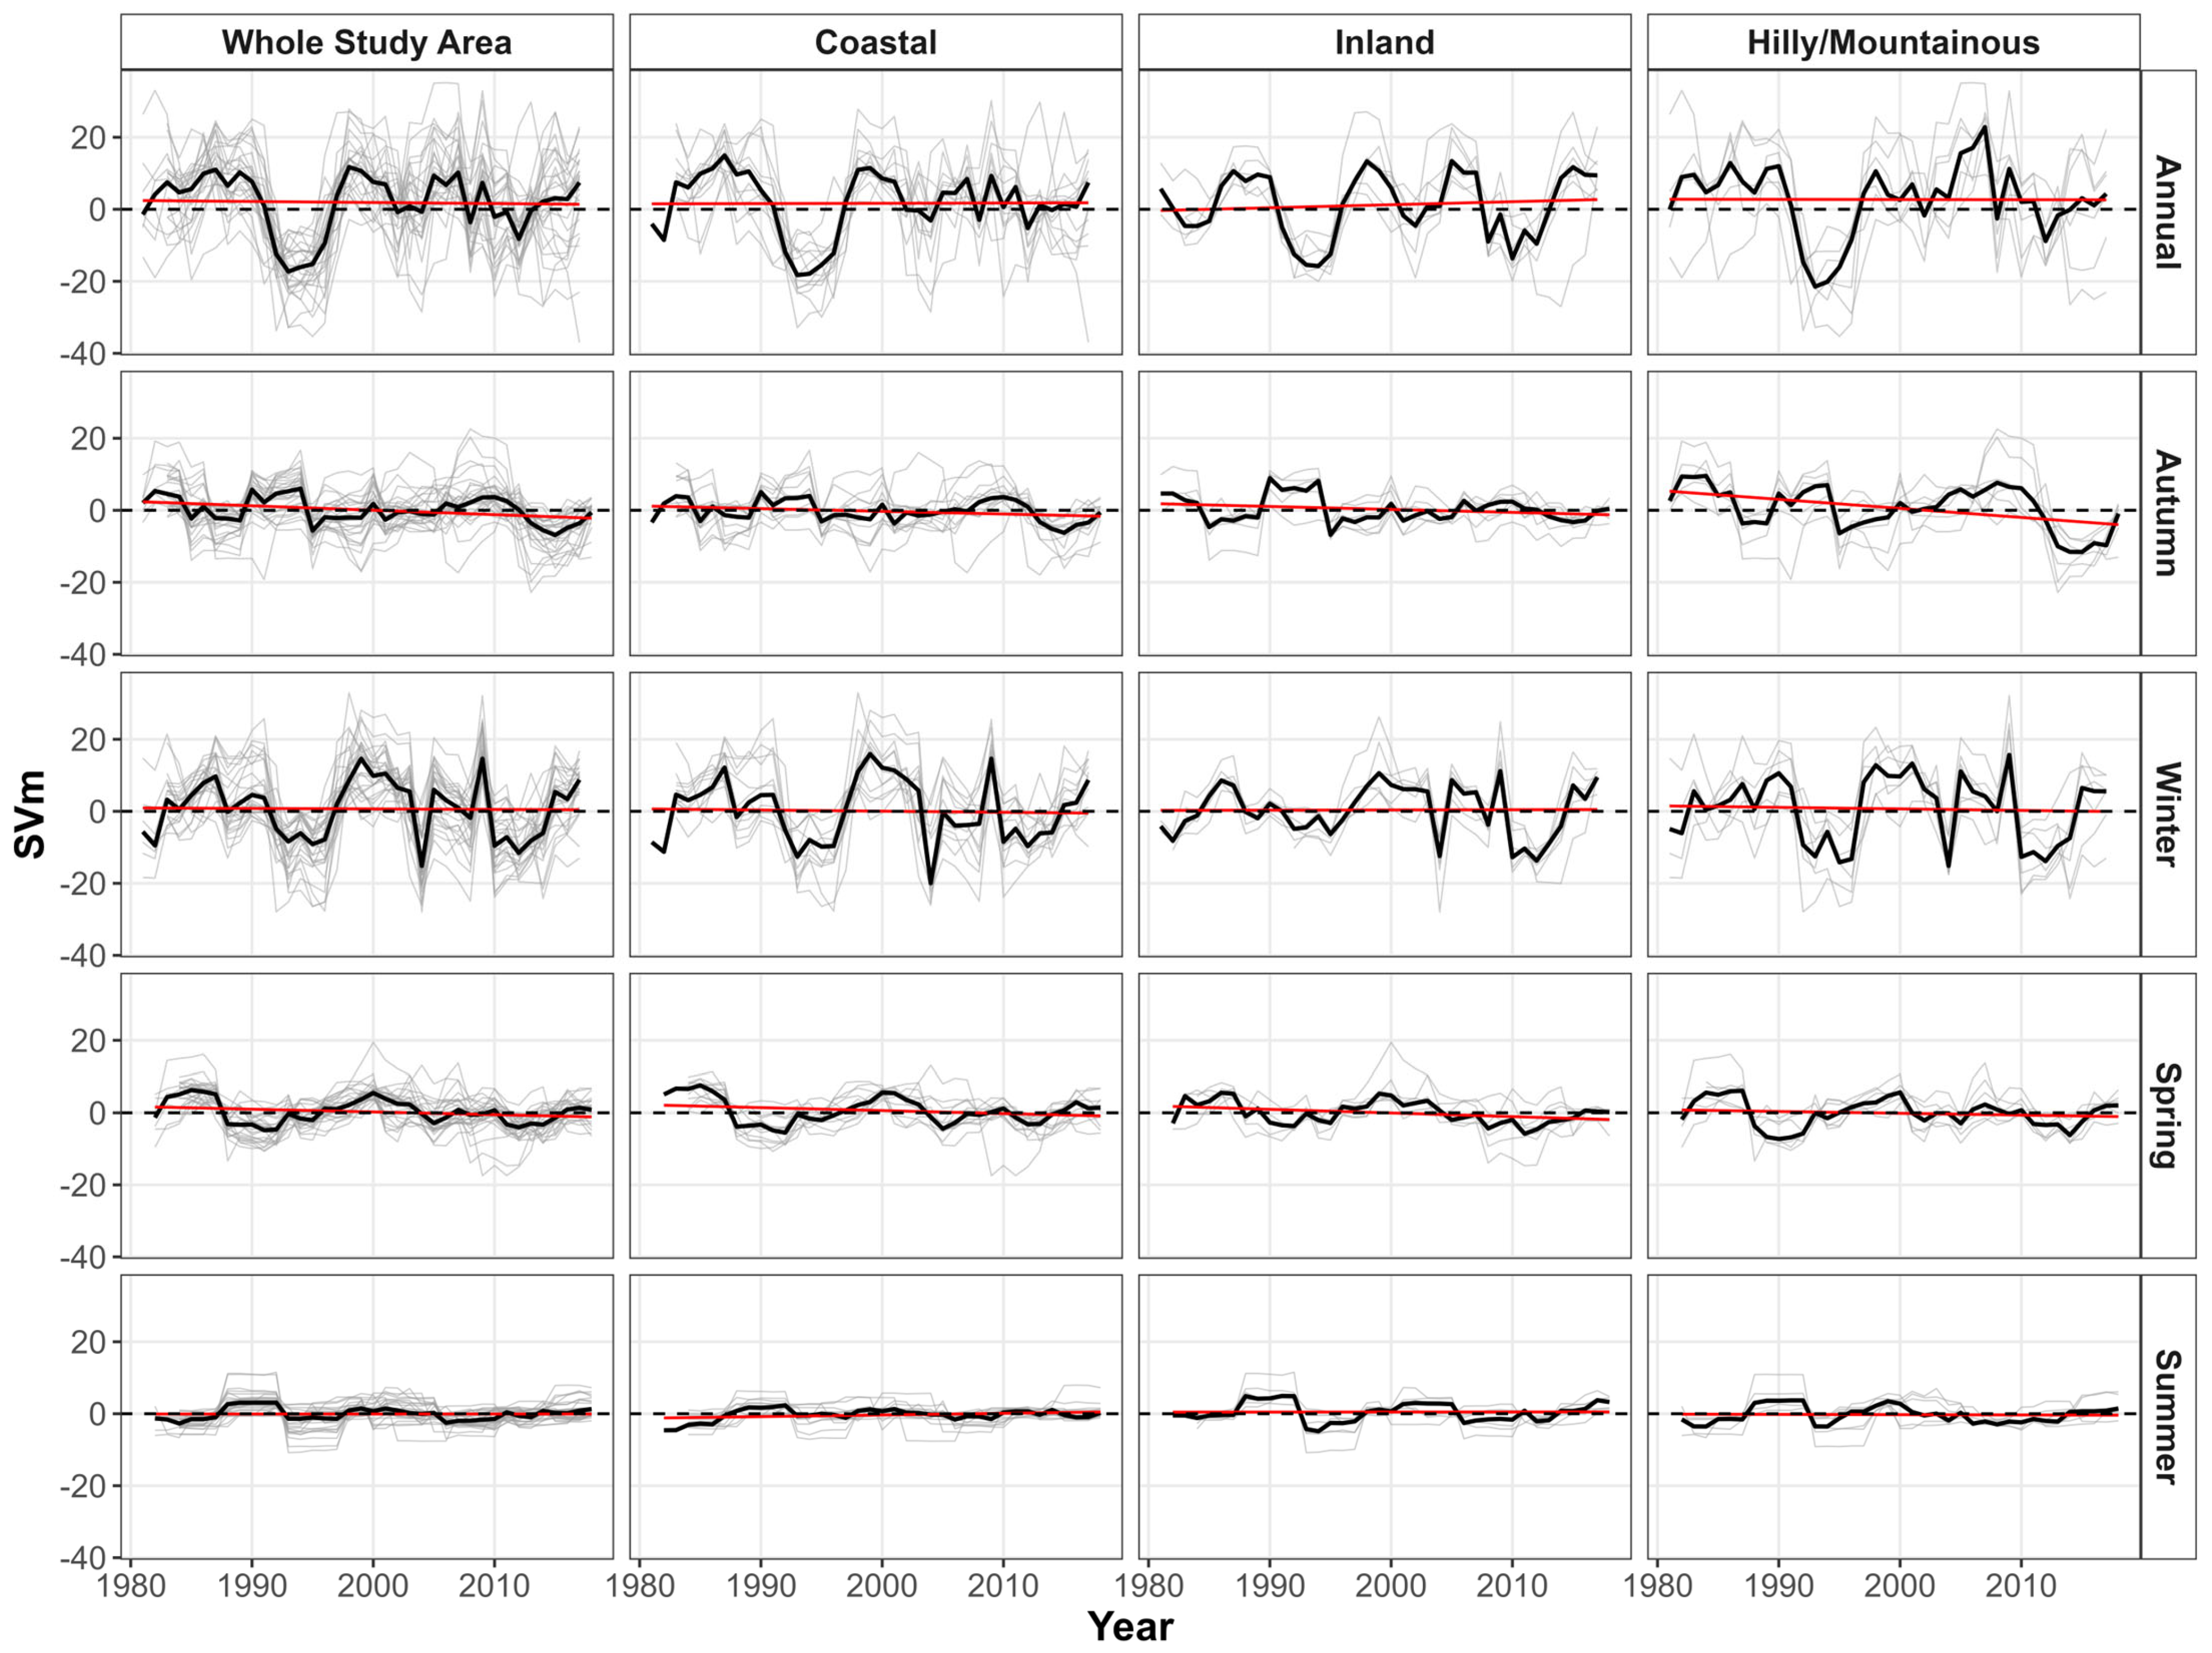
The 10-year overlapping STm analysis revealed that precipitation evolution across Northern Cyprus was highly dynamic and nonstationary through time, characterized by alternating positive and negative structural phases rather than persistent monotonic behavior (Figure 12). Annual and winter precipitation exhibited the largest STm magnitudes and strongest temporal oscillations, with remarkably coherent behavior across all geographical classes. Positive STm phases became particularly evident during the late 1990s and early 2000s, followed by substantial negative transitions during the mid-2000s to early 2010s. These oscillations were strongest within hilly/mountainous regions, indicating greater structural sensitivity of orographic precipitation regimes to hydroclimatic fluctuations. Despite these significant temporal variations, the linear tendencies remained relatively weak, suggesting that precipitation evolution was dominated more by multi-decadal structural fluctuations than by persistent monotonic changes. In contrast, autumn and spring precipitation exhibited comparatively weaker and less organized temporal evolution, with STm values fluctuating close to zero for most of the study period. Spring displayed slightly stronger positive phases during the late 2000s and early 2010s, particularly within hilly/mountainous regions. Summer precipitation exhibited the most stable structure among all seasons, with STm values remaining consistently near zero across all geographical classes and the whole study area.
Precipitation variability in Northern Cyprus showed substantial temporal fluctuations, especially during annual and winter periods, with all geographical classes exhibiting alternating phases of increasing and decreasing variability throughout the study period (Figure 13). Annual and winter precipitation exhibited the largest SVm magnitudes and strongest temporal oscillations, reflecting substantial temporal restructuring of precipitation variability throughout the island. Positive SVm phases became particularly evident during the late 1990s and early 2000s, indicating periods of enhanced precipitation variability and increasing interannual instability, whereas negative SVm phases during the mid-2000s and early 2010s reflected comparatively stabilized variability conditions.
In contrast, autumn and spring precipitation exhibited comparatively weaker and less coherent SVm evolution, with regional median variability trends fluctuating close to zero throughout most of the study period. Nevertheless, autumn precipitation across the study area displayed a clearer tendency toward negative SVm values during the latter part of the record, indicating gradually decreasing variability conditions particularly in hilly/mountainous regions. Summer precipitation exhibited the most stable variability structure among all seasons, with SVm values remaining consistently close to zero. Although variability fluctuations were broadly synchronized across the island, hilly/mountainous regions occasionally exhibited sharper SVm transitions during annual and winter periods, indicating comparatively stronger short-term restructuring within orographically influenced precipitation regimes.
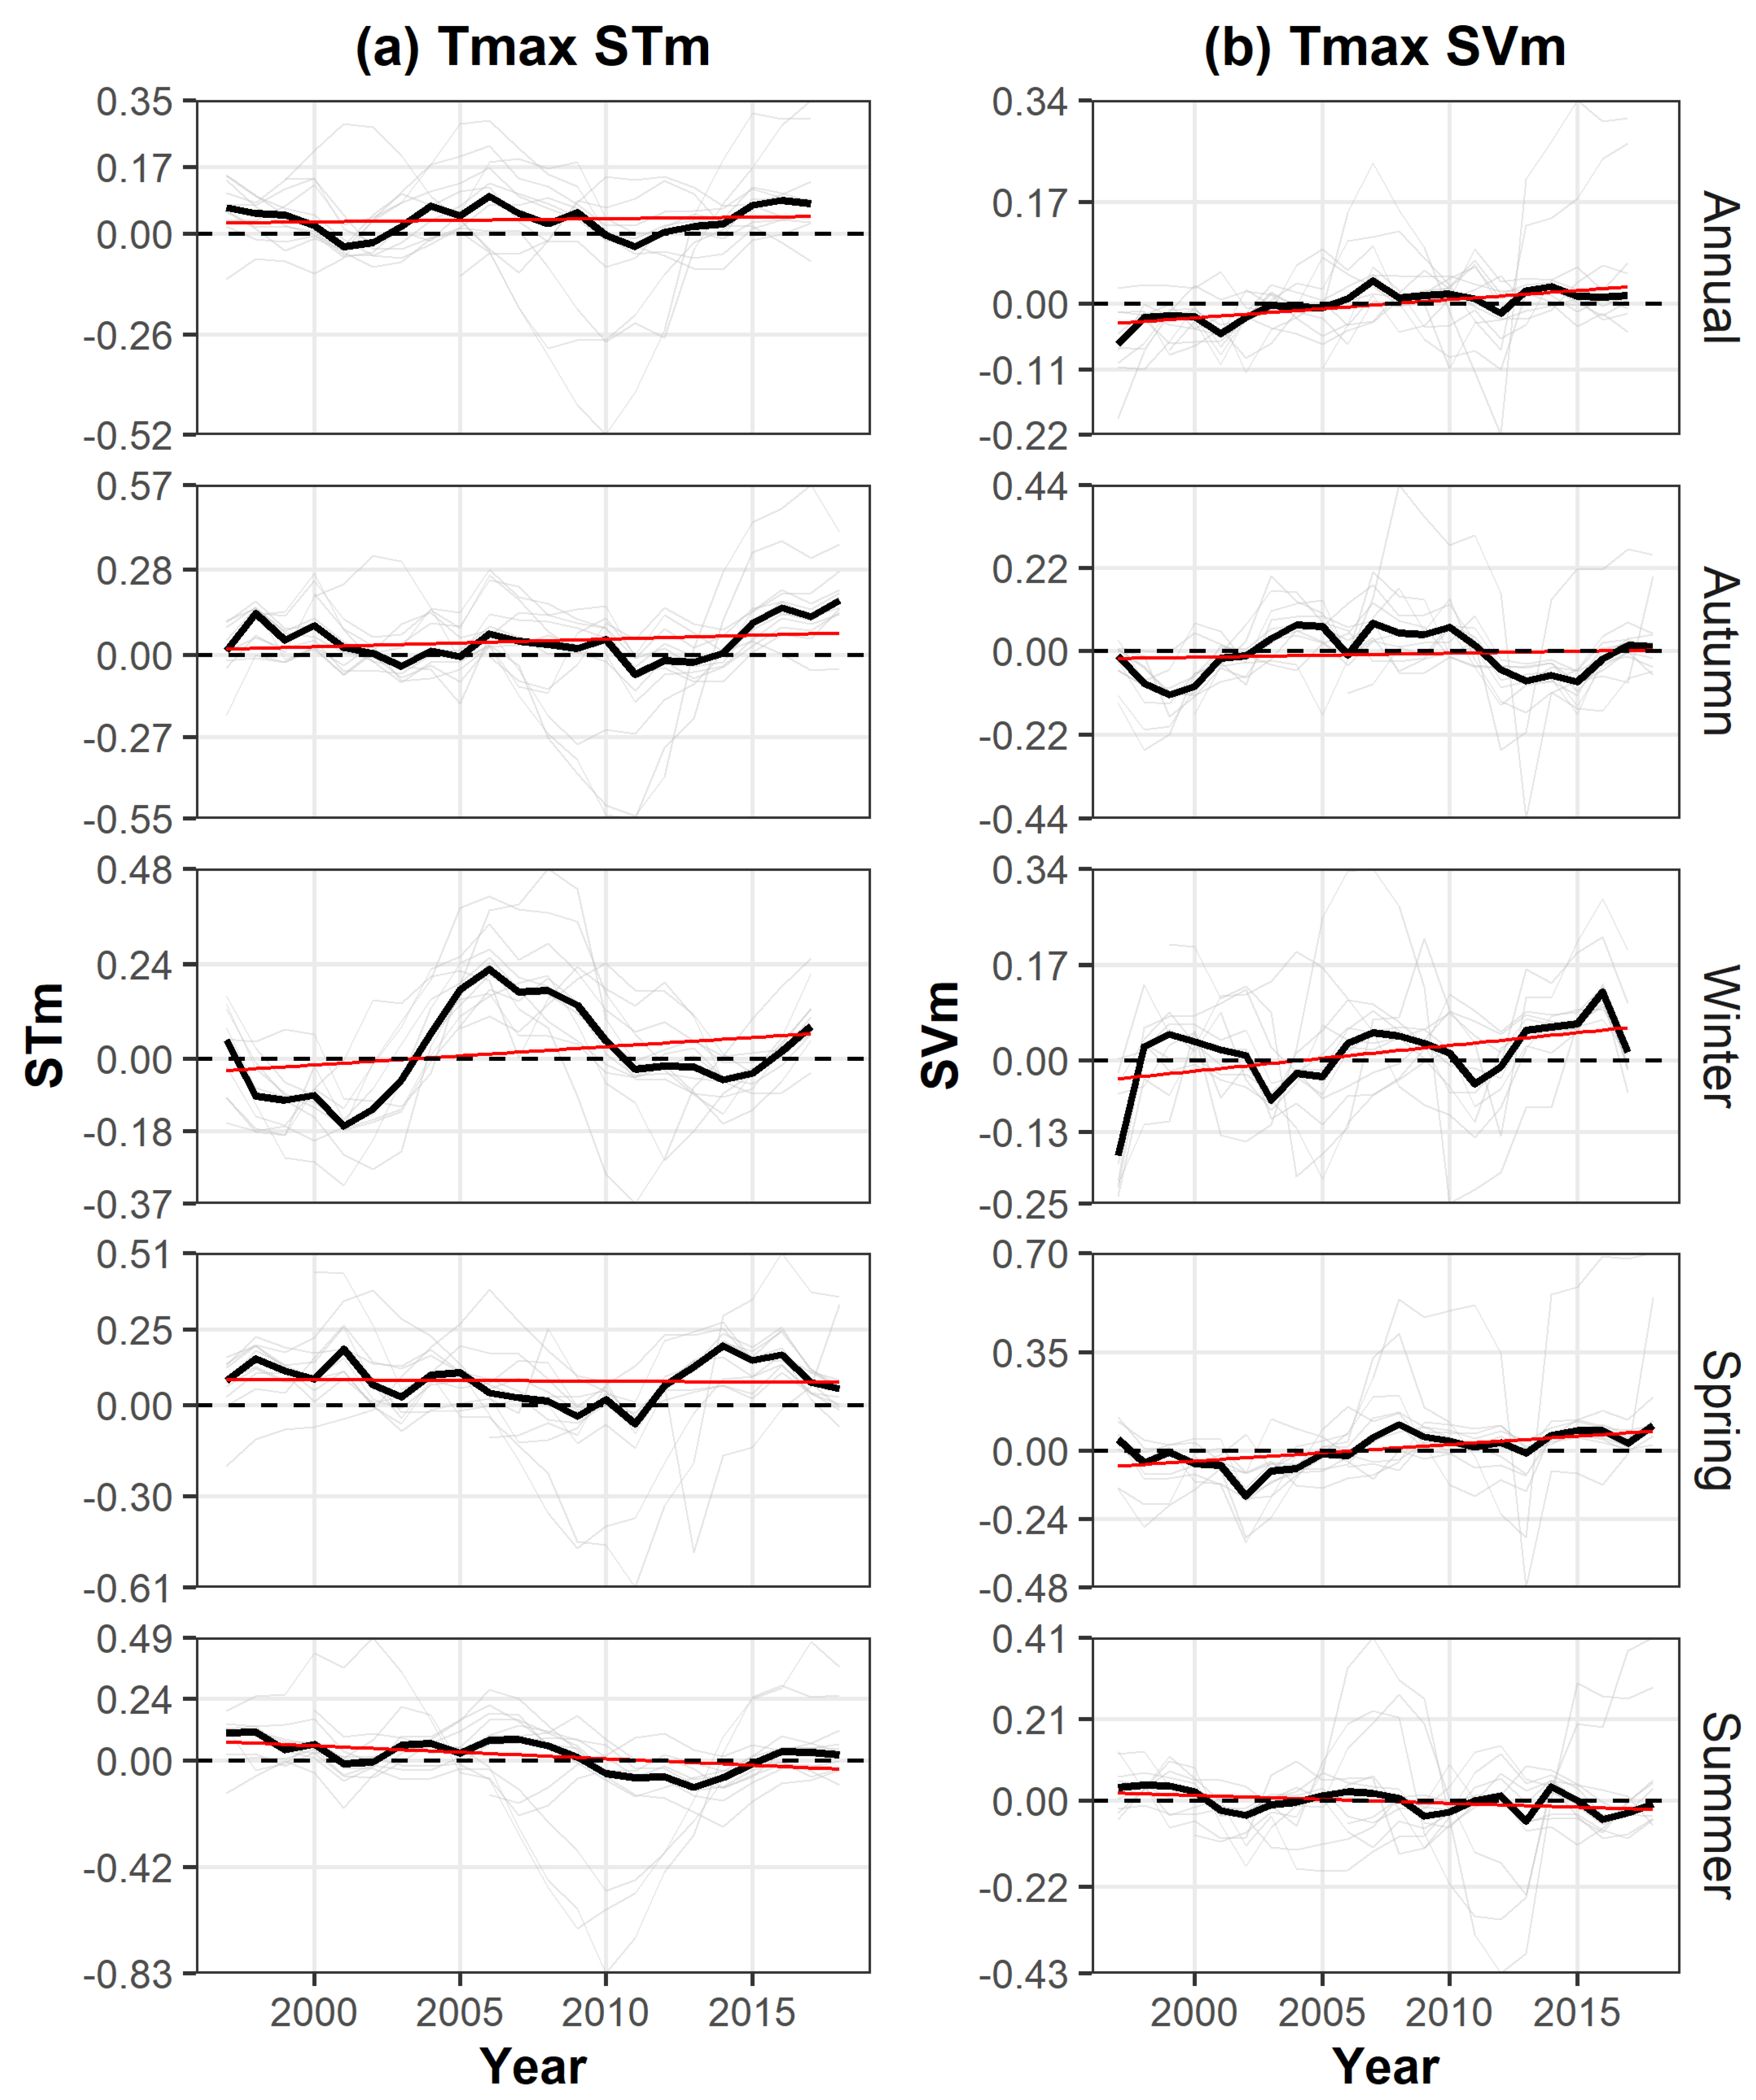
The overlapping STVI analysis for Tmax showed that structural changes in the mean thermal state were generally more pronounced and persistent than variability changes (Figure 14). Annual Tmax STm values remained predominantly positive throughout most of the record, indicating sustained warming tendencies despite short-term oscillations around the zero line. Similar behavior was observed during autumn and spring. In contrast, summer Tmax exhibited the weakest warming structure, with STm values fluctuating close to zero and showing a slight negative tendency during the latter part of the record. Winter Tmax displayed the strongest temporal restructuring among all seasons. Following predominantly negative STm conditions during the late 1990s and early 2000s, winter Tmax shifted into an apparent positive phase during the mid-2000s, before weakening again around the early 2010s and returning to positive conditions toward the end of the record. The general trend was upward. Compared to STm, Tmax SVm values generally remained close to zero across all seasons, indicating comparatively limited restructuring in variability. Nevertheless, annual, winter, and spring SVm series exhibited positive tendencies during the latter part of the record, suggesting modest increases in Tmax variability. Autumn SVm displayed comparatively larger short-term oscillations, whereas summer SVm remained consistently near zero, indicating relatively stable warm-season Tmax variability conditions.
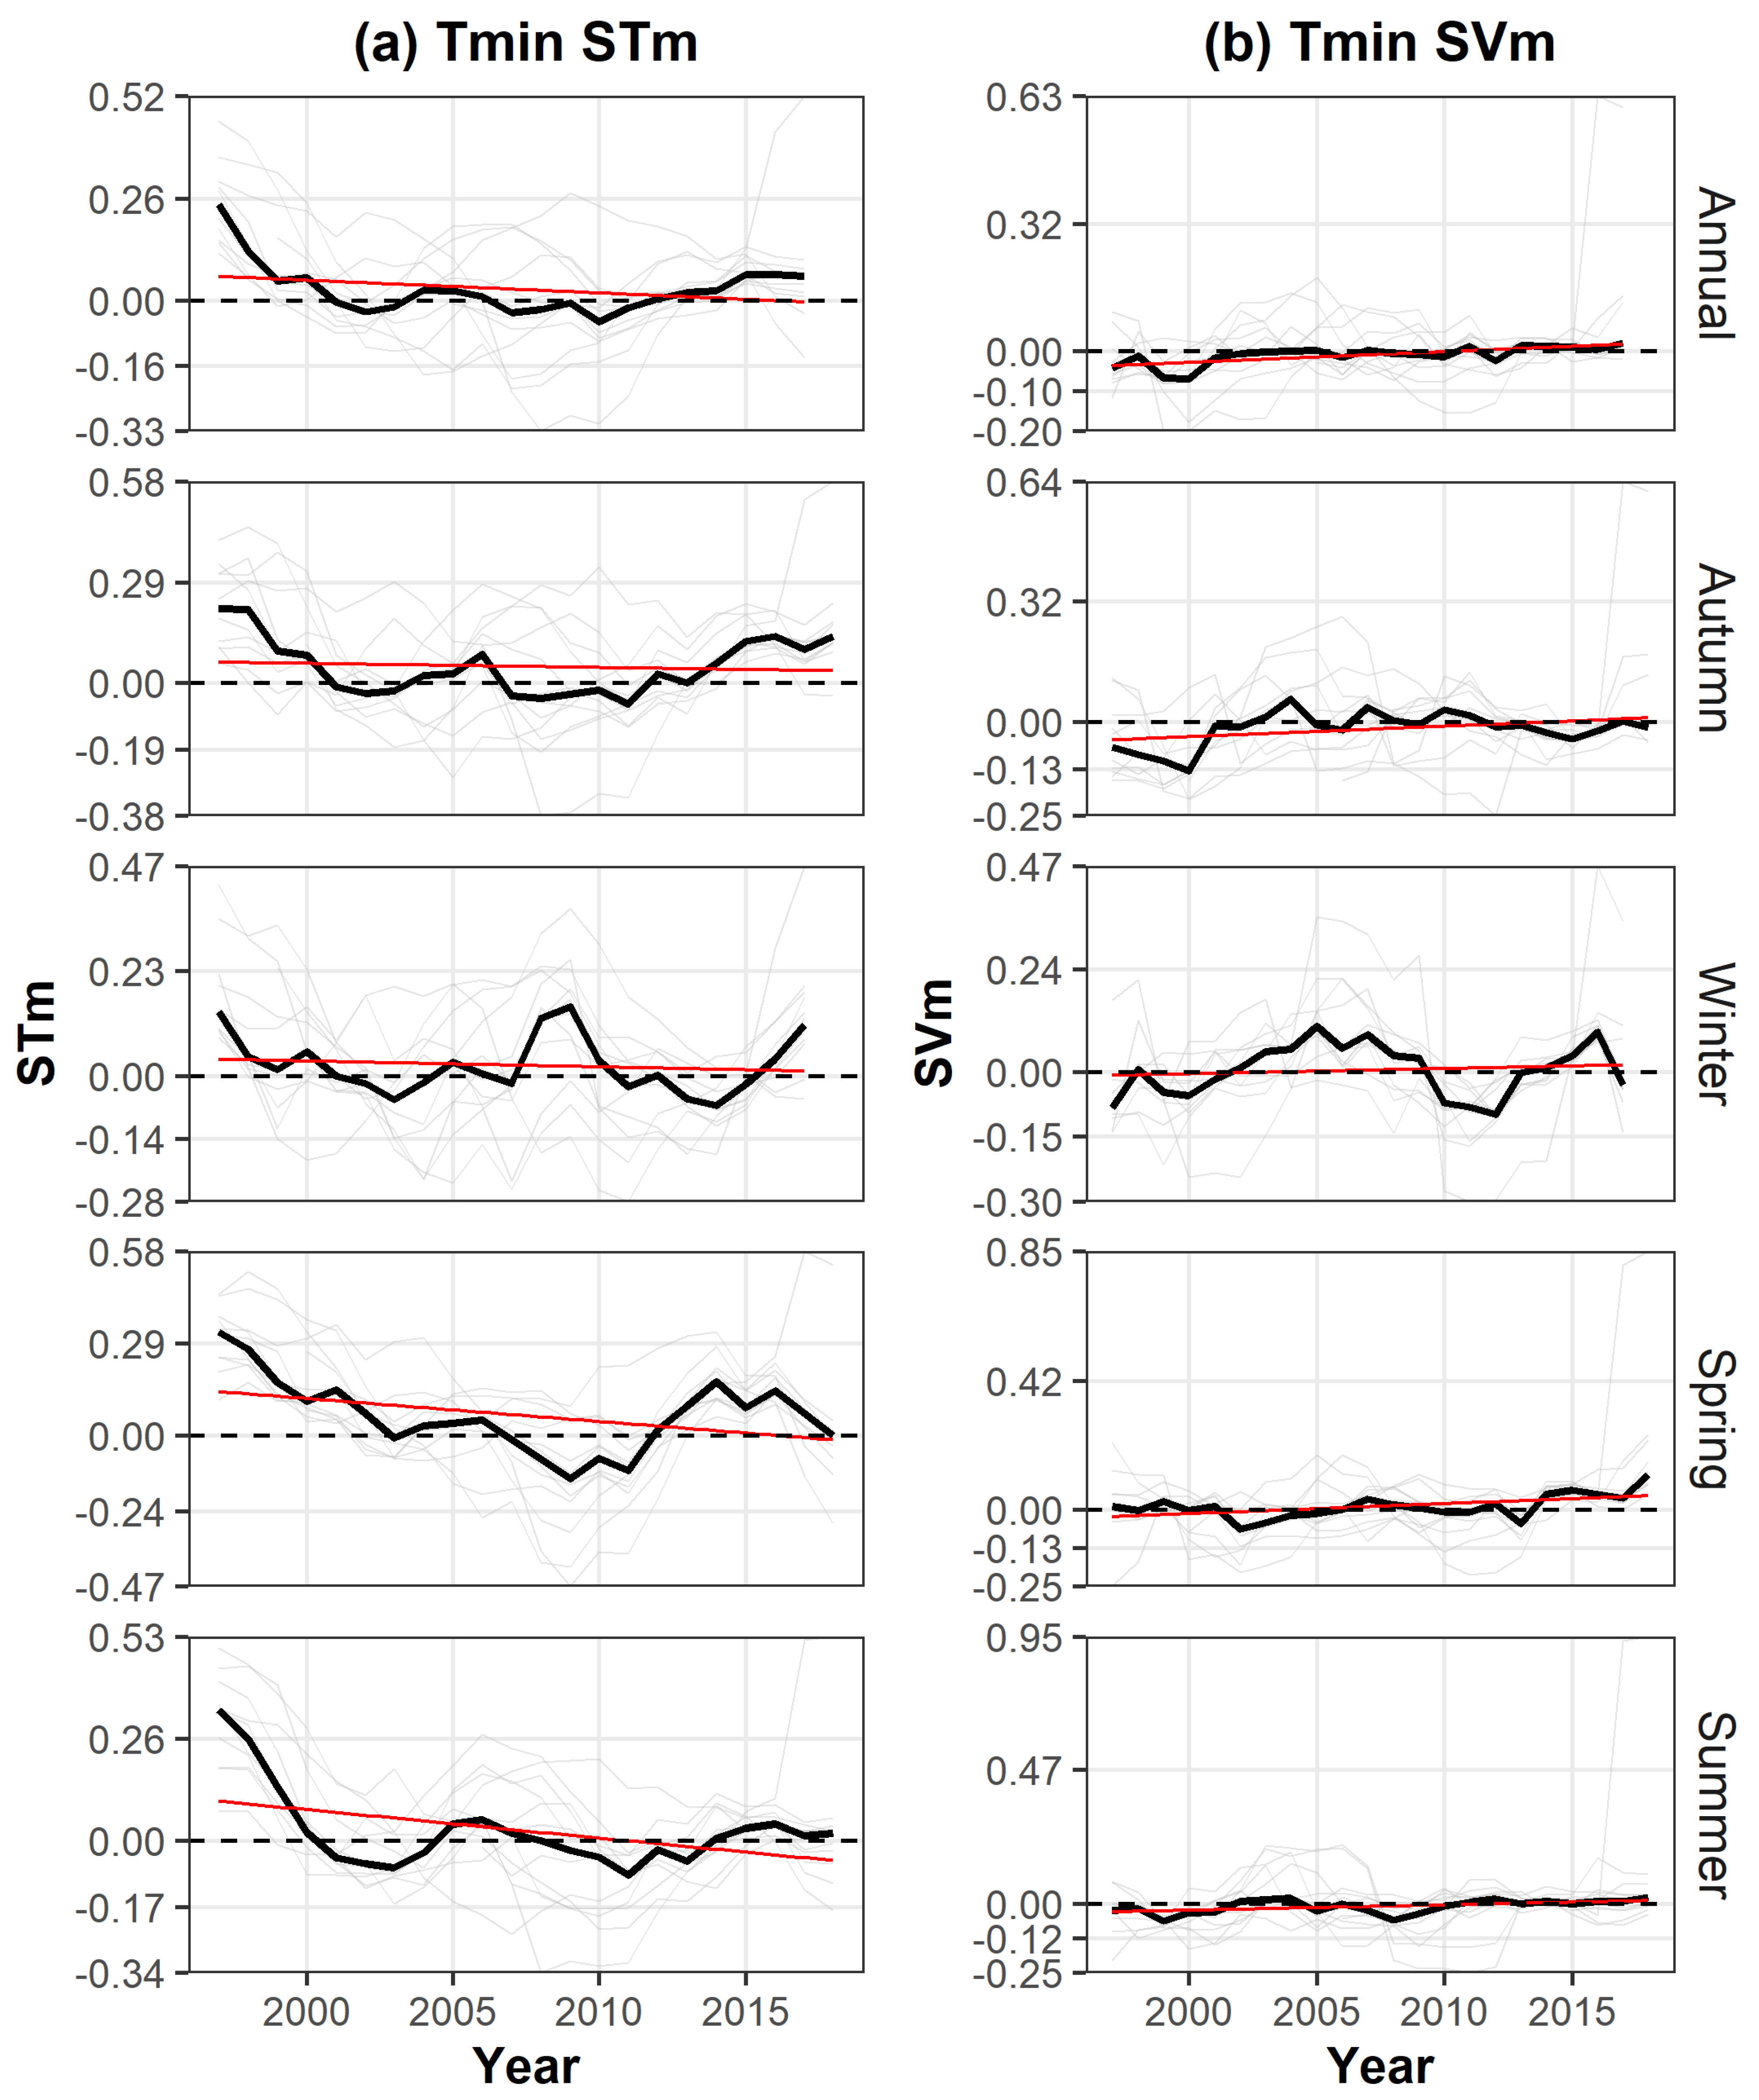
Figure 15 indicates that Tmin structural evolution was characterized mainly by persistent fluctuations in the mean rather than strong variability restructuring. In the STm series, annual, autumn, spring, and summer Tmin displayed relatively strong positive values during the late 1990s, followed by gradual weakening toward near-zero or slightly negative conditions during the late 2000s and early 2010s. This weakening phase was especially evident in spring and summer, which also exhibited the clearest negative among all seasons. After the early 2010s, most Tmin STm series shifted back toward weakly positive conditions. Winter Tmin showed a more oscillatory structure, with alternating positive and negative STm phases and comparatively limited directional change.
The SVm series generally remained clustered close to zero across all seasons, indicating that nighttime temperature variability experienced only weak structural reorganization throughout the study period. Among all seasons, winter Tmin exhibited the most noticeable variability fluctuations, with enhanced SVm conditions during the mid-2000s followed by negative phases around the early 2010s and again increases toward the end of the record. Autumn and spring SVm series remained comparatively stable with only weak positive tendencies, whereas summer Tmin variability remained consistently close to zero, reflecting highly stable warm-season nighttime thermal conditions. Overall, the Tmin overlapping results suggest that nighttime temperature evolution across Northern Cyprus was controlled primarily by gradual changes in the mean thermal state, while variability remained comparatively weak and seasonally limited.

3.4. Multidimensional Analysis of Selected Cases

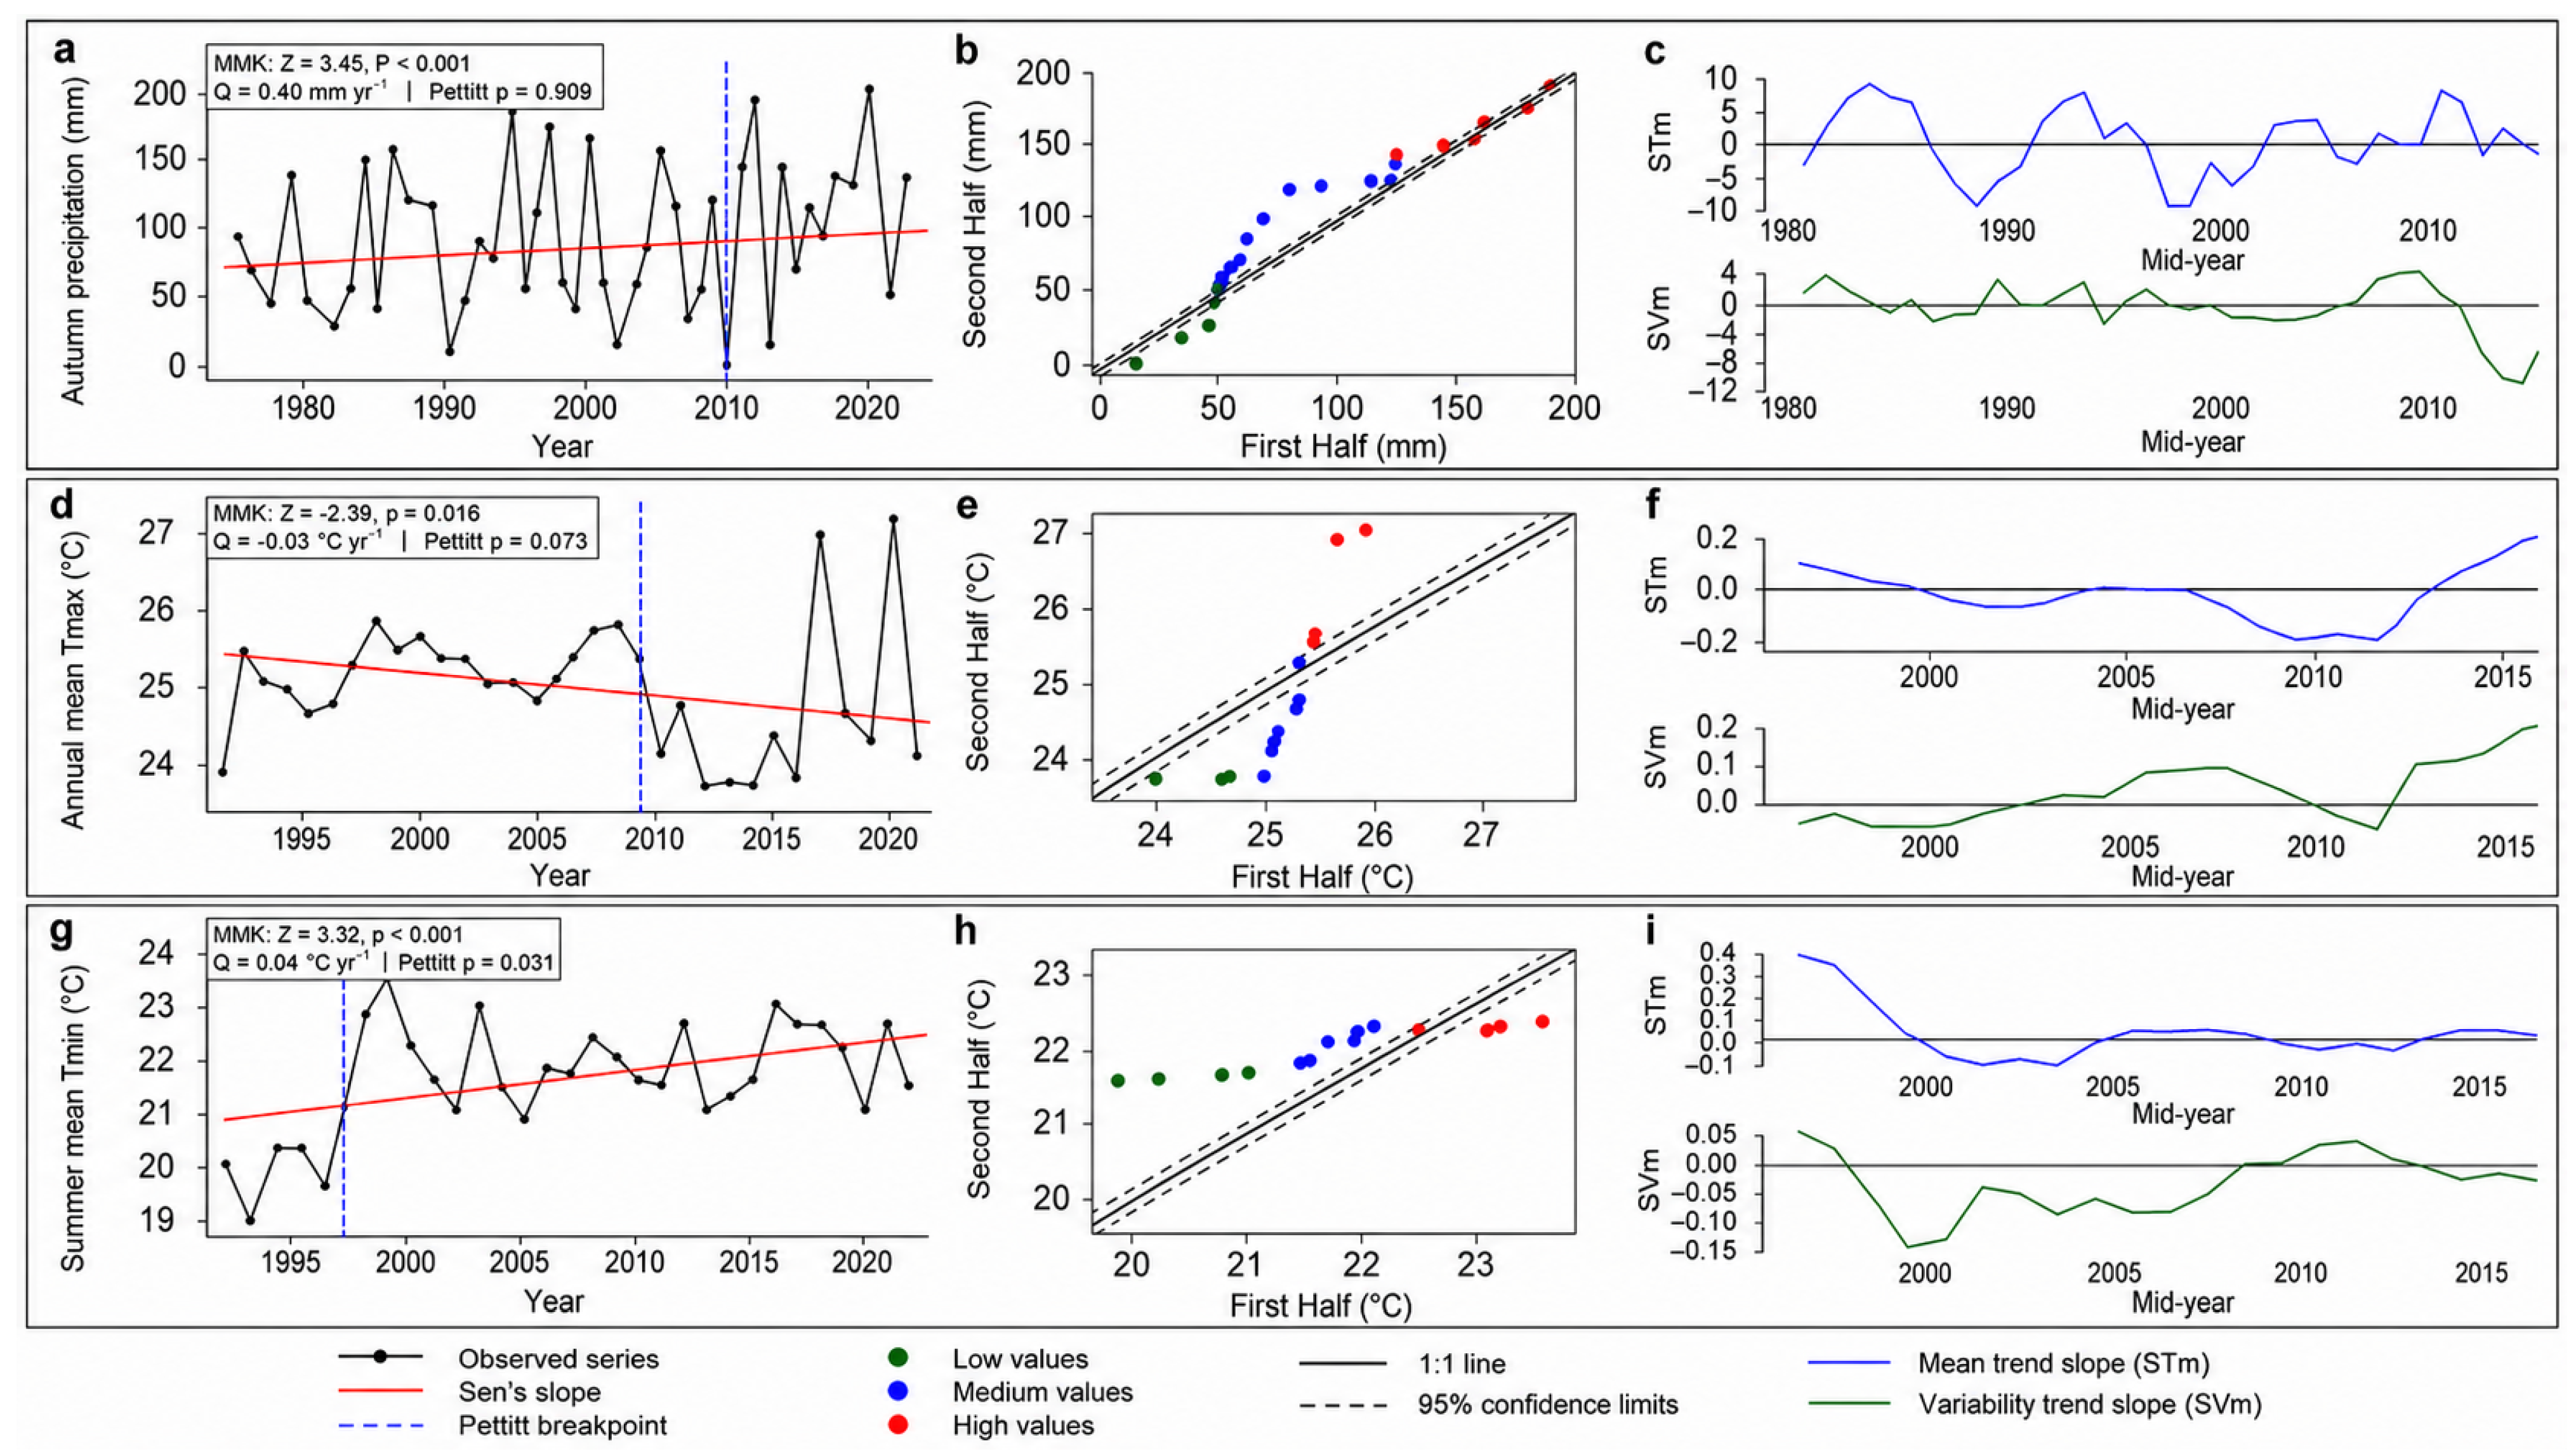
Figure 16 illustrates how the proposed framework moves beyond detecting the direction and magnitude of a record-wide trend by identifying its statistical origin. MMK, Sen’s slope, and Pettitt determine whether the series contains a significant monotonic tendency or a dominant change point, but they cannot establish whether that tendency is driven by changes in low, medium, or high observations, or by an evolving mean state, variability, or both. For autumn precipitation at Alevkaya station, the significant positive classical trend is not produced by a uniform increase across the entire precipitation distribution. ITA indicates that the upward tendency is driven predominantly by increasing medium precipitation values, whereas high and low values exhibit weaker increases or locally decreasing behavior, respectively. Therefore, the overall positive Sen’s slope primarily represents an intensification of moderate precipitation conditions rather than a general increase in all precipitation amounts. The STVI results further show that the mean trend contribution varies markedly through time, while the variability component alternates between increasing and decreasing phases. Thus, the precipitation trend is driven by increases in specific value classes and temporally changing variability, rather than by a consistent increase in the mean or variability alone.
The temperature examples reveal even stronger distributional contrasts. For annual Tmax at Gazimağusa station, the significant negative Sen’s slope is mainly driven by decreases in the low and medium temperature classes. However, high Tmax values move in the opposite direction, indicating that the upper part of the distribution is warming despite the overall cooling tendency. STVI additionally shows that the negative mean trend weakens and reverses toward the end of the record, while the variability trend becomes increasingly positive. Consequently, the overall cooling trend hides a recent warming tendency and greater temperature variability. Moreover, for summer Tmin at Çamlıbel station, the significant warming trend is generated primarily by increases in low and medium values, whereas the highest values remain stable or decrease. This pattern suggests an upward compression of the lower and central parts of the Tmin distribution rather than a uniform shift in the full distribution. The predominantly negative variability trend during the earlier period further indicates that warming was initially accompanied by reduced dispersion, before variability subsequently stabilized near the end of the record.
Overall, these cases show that similar overall trends can result from different types of change. They may be driven by particular value classes, shifts in the mean, changes in variability, or reversals over time. The proposed framework therefore identifies which part of the distribution is changing, whether the change is mainly related to the mean or variability, and whether it remains stable over time.

4. Discussion

Hydroclimatic change in Northern Cyprus is not spatially uniform and varies notably among seasons and regions. Precipitation trends were generally fragmented, while Tmax and Tmin showed more consistent warming patterns. Similar spatial differences have also been reported in Cyprus and other Eastern Mediterranean regions, where hydroclimatic conditions are strongly affected by topography, coastal influence, and atmospheric circulation variability [34]. The strongest precipitation increases were mainly observed in the Kyrenia mountainous region and some western coastal stations, highlighting the importance of topography in shaping precipitation patterns. This result is consistent with the findings of Zaifoğlu et al. [17], where higher values of precipitation indices were reported at stations along the northern coastline of the island. Annual trends were also found to be mainly positive, although most were statistically nonsignificant. The same trend directions were obtained at several common stations, including Çamlıbel, Boğaz, Beyarmudu, Mehmetçik, Lefke, Salamis, and Yenierenköy. Some weak trends in the earlier records became statistically significant after the series were extended to 2022 in this study. However, the comparison should be based mainly on trend direction and spatial persistence. In addition, orographic uplift of moist Mediterranean air likely increases wet-season precipitation in mountainous northern areas. In contrast, inland Mesaoria stations generally showed weaker and less consistent precipitation trends, emphasizing the localized nature of precipitation changes in Northern Cyprus. Widespread Tmax and Tmin increases reflect the strong effect of regional warming, although local geographic factors still played an important role. Coastal stations often showed stronger Tmin warming, probably due to maritime heat retention and reduced nighttime cooling. Some coastal and transition stations also showed localized summer Tmax decreases, suggesting daytime cooling effects from the sea.
Strong seasonal asymmetry of hydroclimatic evolution similar to other Mediterranean climates play a key role. Autumn and winter generally exhibited stronger wetting tendencies, particularly for medium and high precipitation classes, whereas spring showed increasingly fragmented and drying-dominated behavior. Winter precipitation exhibited the clearest and most spatially coherent intensification signal across the island. Previous studies have shown that winter precipitation variability in the Eastern Mediterranean is strongly influenced by large-scale circulation patterns, particularly the North Atlantic Oscillation (NAO), which modulates Mediterranean cyclone trajectories, frontal activity, and regional moisture transport [34,35]. Zaifoglu and Brocca [16] similarly demonstrated significant relationships between winter precipitation extremes and NAO variability in Northern Cyprus. The dominance of increasing medium- and high-intensity winter precipitation classes identified in this study therefore suggests that winter wetting may be associated with intensified precipitation events rather than uniform increases across the full precipitation distribution. This result extends the widespread but mainly nonsignificant winter increases reported by Zaifoğlu et al. [17]. The present analysis further identifies which parts of the precipitation distribution contribute most to the observed wetting signal.
Similar seasonal asymmetry and instability have also been reported in recent ITA-based hydrological studies, where hydroclimatic systems exhibited substantially different responses across seasonal scales and transition periods [36,37]. In many locations, increasing trends in medium and high precipitation amounts occurred alongside decreasing or mixed trends in low precipitation amounts, suggesting that changes in precipitation were not uniform across the distribution. This pattern indicates increases in medium- and high-value precipitation totals, while low values showed weaker or contrasting responses. Such asymmetric behavior between precipitation classes has increasingly been recognized as an important indicator of hydroclimatic restructuring, seasonal instability, and nonuniform climate evolution within hydrological systems [38].
Temperature evolution followed a different pattern. While Tmax increased across most of the study area, Tmin showed a more complex response. The overall warming signal is consistent with Bey et al. [15]. Widespread increases in Tmax and Tmin were reported across Northern Cyprus, and stronger warming was identified for Tmin. Clear agreement was obtained at the common stations of Gazimağusa and Girne. Summer Tmax cooling and strong Tmin warming were identified at Gazimağusa in both studies. Consistent Tmax and Tmin warming was also obtained at Girne. Positive trends were generally maintained at Güzelyurt and Yenierenköy, although differences in trend magnitude were observed between the study periods. Unlike Bey et al. [15], a decreasing Tmin trend was identified at Lefkoşa. This difference indicates that the Tmin trend at this station is sensitive to the selected observation period. At the same station, Tmax showed an increasing trend. This contrast between daytime and nighttime temperatures suggests that local land–atmosphere interactions remain important. Reduced soil moisture, lower humidity, and enhanced nocturnal radiative cooling may partly offset regional warming during nighttime hours.
Previous regional assessments were mainly based on monotonic trend direction and magnitude [15,17]. The present study provides two additional levels of interpretation. First, ITA identifies whether the detected change is associated with low, medium, or high values. It therefore shows whether an overall trend is distributed uniformly across the data range. Second, STVI separates changes in the mean from changes in variability. Its overlapping form also shows whether these components strengthen, weaken, or reverse through time. For precipitation, the results indicate that similar monotonic trends may arise from different combinations of distributional, mean, and variability changes. For temperature, the changes were generally more strongly associated with the mean, although local variability changes and temporal reversals were also identified. Thus, the present framework extends the earlier regional studies by revealing the statistical structure and temporal stability behind the detected monotonic trends.

5. Conclusions

This study provided a multidimensional assessment of hydroclimatic changes in Northern Cyprus by integrating monotonic trend analysis, change-point detection, innovative trend analysis, and structural variability assessment. Unlike conventional approaches that primarily focus on average changes, the combined use of MMK, PT, ITA, and STVI enabled the simultaneous evaluation of trend direction, distributional behavior, abrupt shifts, and changes in variability structure. The results demonstrate that hydroclimatic change in Northern Cyprus is neither spatially uniform nor temporally consistent, but rather emerges through distinct seasonal, regional, and distribution-dependent patterns.
The precipitation analyses revealed substantial spatial heterogeneity across the island. Increasing precipitation tendencies were mainly concentrated within the Kyrenia mountainous region and parts of the western coast, whereas several eastern coastal stations exhibited drying tendencies, particularly during spring. Winter precipitation showed the most coherent wetting signal, while spring was characterized by more fragmented and drying-dominated behavior. The ITA results further demonstrated that precipitation changes were highly dependent on precipitation magnitude, with medium and high precipitation classes generally exhibiting increasing tendencies while low precipitation classes frequently displayed decreasing or mixed behavior. These findings indicate that precipitation regimes exhibited asymmetric restructuring rather than uniform changes across the distribution.
In contrast, temperature exhibited considerably stronger spatial coherence than precipitation. Tmax showed widespread warming across most inland, coastal, and mountainous regions, whereas Tmin displayed more complex spatial responses despite the dominance of nighttime warming at many stations. The contrasting Tmax and Tmin behavior observed at selected locations indicates that thermal evolution may also be modulated by local climatic conditions and land–atmosphere interactions. Change-point analyses further indicated that temperature series experienced more coherent temporal transitions than precipitation. Tmax breakpoints were concentrated mainly between 2000 and 2010, whereas Tmin exhibited an earlier cluster at hilly stations during the late 1990s and a later cluster at many coastal and inland stations during the mid-to-late 2000s. However, given the comparatively short temperature records of 21–30 years, these findings should be interpreted as tendencies specific to the available observation periods rather than as evidence of longer-term thermal variability.
The STVI analyses provided additional insight into the nature of hydroclimatic change. Precipitation evolution was characterized by alternating phases of increasing and decreasing mean and variability conditions, reflecting strong nonstationary behavior and substantial temporal restructuring. Conversely, both Tmax and Tmin changes were primarily governed by shifts in mean conditions, while variability changes remained comparatively limited. These findings suggest that temperature evolution across Northern Cyprus is largely mean-driven, whereas precipitation changes involve a more complex interplay between mean and variability components.
Overall, the results highlight that hydroclimatic change in Northern Cyprus cannot be adequately described using a single statistical perspective. The integration of monotonic, distributional, and structural analyses revealed important features that would remain hidden under conventional trend assessments alone. The proposed multidimensional framework provides a more comprehensive understanding of hydroclimatic evolution in semi-arid Mediterranean environments and offers valuable information for climate adaptation, water resources management, drought preparedness, and flood risk assessment.

6. Limitations and Future Work

Although this study provides a multidimensional assessment of hydroclimatic changes in Northern Cyprus, its findings should be interpreted within several methodological and data-related limitations. All analyses are based on the available meteorological stations, which provide valuable spatial coverage across coastal, inland, and hilly/mountainous areas but remain insufficient to fully resolve fine-scale climatic gradients. This is particularly relevant in this study area, where precipitation and temperature variability may be strongly shaped by orography, coastal exposure, and land–sea interactions. In addition, the temperature records are generally shorter than the precipitation records. Therefore, the trends in Tmax and Tmin should be interpreted as changes observed over the available record period rather than as evidence of longer-period thermal variability. Future studies would benefit from longer records, denser station observations, and the integration of high-resolution gridded or reanalysis datasets to better characterize local-scale hydroclimatic gradients.
The use of monthly aggregated precipitation and temperature data is appropriate for evaluating annual and seasonal hydroclimatic changes. However, it limits the ability to examine event-scale processes. Short-duration precipitation extremes, storm sequencing, heatwave persistence, dry-spell duration, and compound hot-dry events cannot be fully represented at monthly resolution. These processes are hydrologically important in semi-arid Mediterranean environments, where drought and flood risks may depend more strongly on event timing, intensity, and persistence than on seasonal totals alone. Therefore, extending the present framework to daily or sub-daily observations would provide a more detailed understanding of changes in hydroclimatic extremes and their potential impacts.
The statistical methods applied in this study reveal complementary dimensions of hydroclimatic change, but they do not directly establish physical causality. The observed patterns may be consistent with the influence of orographic enhancement, large-scale atmospheric circulation variability (e.g., NAO), maritime effects, and land–sea thermal contrasts. However, these mechanisms were not explicitly tested in this study. Accordingly, such interpretations should be regarded as physically plausible hypotheses rather than direct causal evidence. Future work should examine these mechanisms using atmospheric reanalysis products, circulation indices, moisture transport diagnostics, geopotential height fields, cyclone-track information, soil moisture, and evapotranspiration data.
Some methodological aspects also require cautious interpretation. The STVI results were used as structural diagnostic indicators rather than formal significance tests. For this reason, quadrant-based STVI interpretations should be considered complementary to MMK, Sen’s slope, Pettitt, and ITA results rather than independent evidence of statistically significant change. Similarly, the Pettitt test identifies only a single dominant change point and may oversimplify series affected by multiple shifts, gradual transitions, or alternating wet and dry phases. Future studies could further improve the robustness of change-point and structural variability interpretations by applying complementary change-point methods, such as the Buishand range test and sequential Mann–Kendall analysis, to identify additional or temporally evolving shifts, and by assessing the uncertainty of STVI-derived metrics.
Moreover, this study focuses on historical observations and does not directly assess future climate trajectories or hydrological impacts. Applying the integrated framework to bias-corrected regional or global climate model projections would help determine whether the historical signals identified in the results, including winter precipitation intensification, spring drying tendencies, class-dependent precipitation changes, and mean-driven temperature warming, are likely to persist or intensify under future climate scenarios. Coupling these projected changes with hydrological models, drought indices, groundwater recharge assessments, or flood-risk simulations would further strengthen the practical relevance for climate adaptation and sustainable water resources planning in Northern Cyprus and other semi-arid Mediterranean regions.

Funding

This research was funded by the Middle East Technical University, Northern Cyprus Campus, Scientific Research Project Fund, grant number FEN-26-D-1.

Data Availability Statement

The data presented in this study are available upon request from the corresponding author due to restrictions associated with the data-sharing agreement established with the Meteorological Office of Northern Cyprus.

Acknowledgments

The author gratefully acknowledges the Meteorological Office of Northern Cyprus for providing the meteorological data used in this study.

Conflicts of Interest

The author declares no conflicts of interest.

Abbreviations

The following abbreviations are used in this manuscript:
ITAInnovative Trend Analysis method
MMKModified Mann–Kendall method
PrMonthly total precipitation
PTPettitt test
STmStructural trend in the mean
STVIStructural Trend and Variability Identification method
SVmStructural trend in the variability
TmaxMaximum monthly temperature
TminMinimum monthly temperature

Appendix A

Table A1. The results of MMK, SS, and PT tests for annual and seasonal precipitation.
StationsAnnualSONDJFMAMJJA
MMK-ZSSPTBPMMK-ZSSPTBPMMK-ZSSPTBPMMK-ZSSPTBPMMK-ZSSPTBP
Akdeniz0.030.01942012−0.48−0.1211819850.770.38981997−5.33 *−0.6015320070.190.001052011
Alevkaya1.761.2712619793.45 *0.401182010−0.06−0.021011980−0.42−0.1613420104.58 *0.101861991
Beyarmudu4.72 *2.2921419993.11 *0.5714420043.14 *1.0819819991.230.2115420061.530.001561991
Boğaz2.70 *2.1423120082.33 *0.3813420103.16 *1.7720320081.470.3315420100.730.001261991
Çamlıbel4.16 *2.6221319962.70 *0.6218819853.02 *1.8821119972.63 *0.2911919954.84 *0.001782001
Çayırova−1.02−0.681412012−1.90−0.3610919940.160.08992000−0.52−0.081272017−1.790.001311983
Çayönü−1.09−2.311582011−1.88−0.49732011−0.56−0.831102011−1.31−0.459420150.430.00631990
Dipkarpaz−3.07 *−1.411162009−1.59−0.511261997−1.21−0.97942011−2.68 *−0.3610320030.580.001442001
Ercan2.09 *0.7714619990.920.078619822.31 *0.621321999−1.44−0.2611919874.21 *0.101431991
Esentepe3.64 *2.0615119984.06 *0.7012619851.090.721231997−0.56−0.0813520101.650.011691999
Gazimağusa0.780.168619993.79 *0.491051990−0.09−0.09861999−2.77 *−0.381292003−0.470.001551995
Geçitkale1.050.7113619992.20 *0.2610019820.380.1110019991.040.241621999−1.22−0.051311993
Girne−1.08−0.336819992.40 *0.4611619830.210.051111999−2.33 *−0.541401988−1.150.001132007
Güzelyurt0.090.087919900.340.077819852.02 *0.551161997−1.46−0.18981988−1.050.001191988
İskele2.48 *0.9514619992.26 *0.6313820101.370.4812619990.990.1813620101.230.001032014
Kantara−1.62−1.2816520120.630.12942003−2.15 *−1.521382009−1.11−0.221012015−1.280.00931984
Kozanköy−0.44−0.548119880.420.099020100.850.447620001.810.2711420103.21 *0.001402009
Lapta−0.07−0.098419994.85 *0.801502010−0.62−0.199019990.550.0810420101.490.00802000
Lefke2.10 *1.0316820004.52 *0.4116019992.62 *0.6213619991.130.228619920.200.00751988
Lefkoşa−0.25−0.17961999−1.53−0.201202006−0.18−0.111171980−0.17−0.031151987−0.040.001551991
Mehmetçik4.65 *2.3722619991.590.269620032.69 *1.3014820001.670.4618420104.21 *0.011741991
Salamis−4.41 *−1.591641993−1.64−0.261311997−3.08 *−0.711241993−2.90 *−0.371092003−1.200.001502006
Serdarlı−1.33−0.831502012−0.16−0.051222006−2.19 *−0.681261980−1.07−0.191241988−0.290.00932011
Tatlısu3.88 *3.6023119985.73 *1.3518719902.39 *1.2517019972.35 *0.3513020101.750.001332002
Vadili−0.16−0.04762011−0.89−0.169019820.120.029119990.830.057119992.23 *0.001392001
Yenierenköy−4.30 *−1.671471992−3.54 *−0.751601994−0.87−0.29902011−1.61−0.4217819881.900.001212001
Yeşilırmak1.952.0220820073.14 *0.8422220062.27 *1.3618620071.670.2813220061.070.00792011
Note: MMK-Z denotes the standardized test statistic of the modified Mann–Kendall test; SS denotes Sen’s slope estimate; PT denotes the Pettitt test statistic; and BP denotes the breakpoint year detected by the Pettitt test. An asterisk (*) indicates statistical significance at the 0.05 level for the corresponding test statistic.
Table A2. The results of MMK, SS, and PT tests for annual and seasonal maximum temperature (abbreviations and symbols are the same as those defined in Table A1).
StationsAnnualSONDJFMAMJJA
MMK-ZSSPTBPMMK-ZSSPTBPMMK-ZSSPTBPMMK-ZSSPTBPMMK-ZSSPTBP
Alevkaya12.29 *0.06177 *20066.51 *0.0512220097.58 *0.09178 *20077.55 *0.08152 *20076.88 *0.041242006
Boğaz−4.97 *−0.08155 *2008−3.73 *−0.06135 *2009−5.46 *−0.06119 *2010−2.34 *−0.06126 *2010−3.33 *−0.12167 *2009
Çamlıbel11.50 *0.08191 *200613.41 *0.09194 *20066.01 *0.09182 *200712.44 *0.07160 *20047.04 *0.041282006
Esentepe3.08 *0.04135 *20063.26 *0.0311620064.92 *0.07186 *20074.95 *0.05170 *2005−2.30 *−0.02882013
Gazimağusa−2.39 *−0.031242009−0.89−0.011082010−0.39−0.01402011−0.91−0.02882012−2.69 *−0.05160 *2009
Geçitkale5.11 *0.06184 *20016.14 *0.06144 *20026.70 *0.07147 *20086.14 *0.11182 *20021.610.05170 *2001
Girne4.03 *0.0210819974.21 *0.038119971.620.017620074.04 *0.04143 *20000.890.01981997
Güzelyurt9.97 *0.03151 *20065.72 *0.04144 *20064.05 *0.03102200710.20 *0.06148 *20040.000.00432013
İskele4.53 *0.0790 *20115.24 *0.116420129.67 *0.1088 *20124.76 *0.086820112.67 *0.04672014
Lapta−4.76 *−0.04214 *2007−3.31 *−0.034920192.49 *0.02592005−2.19 *−0.03224 *2008−4.31 *−0.11224 *2008
Lefkoşa8.79 *0.0311520045.53 *0.047320073.00 *0.025620007.64 *0.0510920155.50 *0.03137 *2006
Yenierenköy6.80 *0.06143 *20047.71 *0.05136 *20062.78 *0.038720007.18 *0.07131 *20056.56 *0.06191 *2005
Table A3. The results of MMK, SS, and PT tests for annual and seasonal minimum temperature (abbreviations and symbols are the same as those defined in Table A1).
StationsAnnualSONDJFMAMJJA
MMK-ZSSPTBPMMK-ZSSPTBPMMK-ZSSPTBPMMK-ZSSPTBPMMK-ZSSPTBP
Alevkaya3.41 *0.0612519963.47 *0.0510820145.15 *0.0712519984.21 *0.08150 *19980.500.011181997
Boğaz4.55 *0.038020077.20 *0.0611520093.28 *0.037020073.66 *0.04902006−1.97 *−0.01512013
Çamlıbel6.29 *0.0412519966.10 *0.06142 *19979.43 *0.0412620075.99 *0.05154 *19983.32 *0.04146 *1997
Esentepe0.830.02140 *19972.45 *0.05150 *19974.29 *0.0612219972.09 *0.05160 *1998−0.040.00140 *1997
Gazimağusa8.79 *0.09230 *20088.24 *0.12200 *20096.69 *0.08165 *20088.68 *0.11188 *20098.01 *0.08214 *2009
Geçitkale−1.18−0.029820181.090.01702002−0.91−0.016120180.220.01862018−0.49−0.01941997
Girne8.32 *0.06236 *200616.50 *0.09208 *20069.73 *0.06168 *20077.62 *0.07211 *20057.02 *0.07236 *2006
Güzelyurt1.570.0112019964.94 *0.0410820062.34 *0.028419971.300.029819972.77 *0.031222005
İskele4.18 *0.0484 *20117.40 *0.1178 *20124.96 *0.065720122.40 *0.022120120.990.01712013
Lapta7.48 *0.07197 *20068.74 *0.11177 *20078.59 *0.08158 *20055.89 *0.09130 *20053.85 *0.04192 *2004
Lefkoşa−4.43 *−0.05182 *2007−1.98 *−0.02149 *2005−5.67 *−0.06158 *2007−2.71 *−0.04157 *2008−3.93 *−0.041142007
Yenierenköy0.960.0213019972.88 *0.0510420010.400.0110020001.370.039819970.170.001201997

References

  1. Giorgi, F. Climate change hot-spots. Geophys. Res. Lett. 2006, 33, L08707. [Google Scholar] [CrossRef] [Scilit]
  2. Jacob, D.; Petersen, J.; Eggert, B.; Alias, A.; Christensen, O.B.; Bouwer, L.M.; Braun, A.; Colette, A.; Déqué, M.; Georgievski, G.; et al. EURO-CORDEX: New high-resolution climate change projections for European impact research. Reg. Environ. Change 2014, 14, 563–578. [Google Scholar] [CrossRef] [Scilit]
  3. Vicente-Serrano, S.M.; Lopez-Moreno, J.I.; Beguería, S.; Lorenzo-Lacruz, J.; Sanchez-Lorenzo, A.; García-Ruiz, J.M.; Azorin-Molina, C.; Morán-Tejeda, E.; Revuelto, J.; Trigo, R.; et al. Evidence of increasing drought severity caused by temperature rise in southern Europe. Environ. Res. Lett. 2014, 9, 044001. [Google Scholar] [CrossRef] [Scilit]
  4. Giorgi, F.; Lionello, P. Climate change projections for the Mediterranean region. Glob. Planet. Change 2008, 63, 90–104. [Google Scholar] [CrossRef] [Scilit]
  5. Lelieveld, J.; Hadjinicolaou, P.; Kostopoulou, E.; Chenoweth, J.; El Maayar, M.; Giannakopoulos, C.; Hannides, C.; Lange, M.A.; Tanarhte, M.; Tyrlis, E.; et al. Climate change and impacts in the Eastern Mediterranean and the Middle East. Clim. Change 2012, 114, 667–687. [Google Scholar] [CrossRef] [Scilit] [PubMed]
  6. Zittis, G.; Almazroui, M.; Alpert, P.; Ciais, P.; Cramer, W.; Dahdal, Y.; Fnais, M.; Francis, D.; Hadjinicolaou, P.; Howari, F.; et al. Climate change and weather extremes in the Eastern Mediterranean and Middle East. Rev. Geophys. 2022, 60, e2021RG000762. [Google Scholar] [CrossRef] [Scilit]
  7. IPCC. Climate Change 2023: Synthesis Report; IPCC: Geneva, Switzerland, 2023. [Google Scholar]
  8. Raisänen, J. Probabilistic forecasts of near-term climate change: Verification for temperature and precipitation changes from years 1971–2000 to 2011–2020. Clim. Dyn. 2022, 59, 1175–1188. [Google Scholar] [CrossRef] [Scilit]
  9. Koster, R.D.; Schubert, S.D.; Wang, H.; Mahanama, S.P.P.; DeAngelis, A.M. Hydroclimatic variability and predictability: A survey of recent research. Hydrol. Earth Syst. Sci. 2017, 21, 3777–3798. [Google Scholar] [CrossRef] [Scilit] [PubMed]
  10. Giannakopoulos, C.; Hadjinicolaou, P.; Kostopoulou, E.; Varotsos, K.V.; Zerefos, C. Precipitation and temperature regime over Cyprus as a result of global climate change. Adv. Geosci. 2010, 23, 17–24. [Google Scholar] [CrossRef] [Scilit]
  11. Hadjinicolaou, P.; Giannakopoulos, C.; Zerefos, C.; Lange, M.A.; Pashiardis, S.; Lelieveld, J. Mid-21st century climate and weather extremes in Cyprus as projected by six regional climate models. Reg. Environ. Change 2011, 11, 441–457. [Google Scholar] [CrossRef] [Scilit]
  12. Zittis, G.; Bruggeman, A.; Camera, C. 21st century projections of extreme precipitation indicators for Cyprus. Atmosphere 2020, 11, 343. [Google Scholar] [CrossRef] [Scilit]
  13. Mathbout, S.; Lopez-Bustins, J.A.; Martin-Vide, J.; Bech, J.; Rodrigo, F.S. Spatial and temporal analysis of drought variability at several time scales in Syria during 1961–2012. Atmos. Res. 2018, 200, 153–168. [Google Scholar] [CrossRef] [Scilit]
  14. Türkeş, M.; Sarış, F. Trends and changes of mean, maximum, minimum temperature and precipitation series in Northern Cyprus. J. Black Sea/Mediterr. Environ. 2007, 13, 281–305. [Google Scholar]
  15. Bey, E.; Türkeş, M.; Hamed, M.M. Long-term air temperature trends in North Cyprus. Theor. Appl. Climatol. 2024, 155, 1113–1122. [Google Scholar] [CrossRef] [Scilit]
  16. Zaifoglu, H.; Brocca, L. Extreme precipitation interactions with large-scale atmospheric circulations and greenhouse gases in Northern Cyprus. Int. J. Climatol. 2026, 46, e70189. [Google Scholar] [CrossRef] [Scilit]
  17. Zaifoğlu, H.; Akıntuğ, B.; Yanmaz, A.M. Quality control, homogeneity analysis, and trends of extreme precipitation indices in Northern Cyprus. J. Hydrol. Eng. 2017, 22, 05017024. [Google Scholar] [CrossRef] [Scilit]
  18. Mann, H.B. Nonparametric tests against trend. Econometrica 1945, 13, 245–259. [Google Scholar] [CrossRef] [Scilit]
  19. Kendall, M.G. Rank Correlation Methods, 4th ed.; Griffin: London, UK, 1975. [Google Scholar]
  20. Sen, P.K. Estimates of the regression coefficient based on Kendall’s tau. J. Am. Stat. Assoc. 1968, 63, 1379–1389. [Google Scholar] [CrossRef]
  21. Yue, S.; Pilon, P.; Cavadias, G. Power of the Mann–Kendall and Spearman’s rho tests for detecting monotonic trends in hydrological series. J. Hydrol. 2002, 259, 254–271. [Google Scholar] [CrossRef] [Scilit]
  22. Şen, Z. Innovative trend analysis methodology. J. Hydrol. Eng. 2012, 17, 1042–1046. [Google Scholar] [CrossRef] [Scilit]
  23. Şen, Z. Trend identification simulation and application. J. Hydrol. Eng. 2014, 19, 635–642. [Google Scholar] [CrossRef] [Scilit]
  24. Şen, Z. Innovative Trend Methodologies in Science and Engineering; Springer: Cham, Switzerland, 2017. [Google Scholar] [CrossRef] [Scilit]
  25. Alashan, S. Combination of modified Mann–Kendall method and Şen innovative trend analysis. Eng. Rep. 2020, 2, e12131. [Google Scholar] [CrossRef] [Scilit]
  26. Körük, A.E.; Kankal, M.; Yıldız, M.B.; Akçay, F.; Şan, M.; Nacar, S. Trend analysis of precipitation using innovative approaches in northwestern Turkey. Phys. Chem. Earth Parts A/B/C 2023, 131, 103416. [Google Scholar] [CrossRef] [Scilit]
  27. Akçay, F.; Şan, M.; Nacar, S.; Kankal, M. Annual trends of precipitation and temperature in the northwestern part of Turkey using innovative approaches: A holistic and partial study. Pure Appl. Geophys. 2023, 180, 3131–3156. [Google Scholar] [CrossRef] [Scilit]
  28. Ercan, C.; Abu Arra, A.; Şişman, E. Investigation of precipitation and temperature trends using classical and innovative approaches with corresponding frequencies in Antalya Basin, Türkiye. Phys. Chem. Earth Parts A/B/C 2025, 139, 103958. [Google Scholar] [CrossRef] [Scilit]
  29. Şen, Z. Structural Trend and Variability Identification (STVI) method. Water Resour. Manag. 2026, 40, 164. [Google Scholar] [CrossRef] [Scilit]
  30. Gödek Hayal, N.P.; Zaifoglu, H.; Yanmaz, A.M. Projecting precipitation extremes over Cyprus using CMIP6 climate scenarios. Nat. Hazards 2026, 122, 368. [Google Scholar] [CrossRef] [Scilit]
  31. Yue, S.; Pilon, P.; Phinney, B.; Cavadias, G. The influence of autocorrelation on the ability to detect trend in hydrological series. Hydrol. Processes 2002, 16, 1807–1829. [Google Scholar] [CrossRef] [Scilit]
  32. Pettitt, A.N. A non-parametric approach to the change-point problem. J. R. Stat. Soc. Ser. C Appl. Stat. 1979, 28, 126–135. [Google Scholar] [CrossRef] [Scilit] [PubMed]
  33. Modaresi, F.; Danandeh Mehr, A.; Sardarian Bajgiran, I.; Safari, M.J.S. Multi-level trend analysis of extreme climate indices by a novel hybrid method of fuzzy logic and innovative trend analysis. Sci. Rep. 2025, 15, 27432. [Google Scholar] [CrossRef] [Scilit] [PubMed]
  34. Krichak, S.O.; Alpert, P. Signatures of the NAO in the atmospheric circulation during wet winter months over the Mediterranean region. Theor. Appl. Climatol. 2005, 82, 27–39. [Google Scholar] [CrossRef] [Scilit]
  35. Reale, M.; Lionello, P. Synoptic climatology of winter intense precipitation events along the Mediterranean coasts. Nat. Hazards Earth Syst. Sci. 2013, 13, 1707–1722. [Google Scholar] [CrossRef] [Scilit]
  36. Dong, Z.; Jia, W.; Sarukkalige, R.; Fu, G.; Meng, Q.; Wang, Q. Innovative trend analysis of air temperature and precipitation in the Jinsha River Basin, China. Water 2020, 12, 3293. [Google Scholar] [CrossRef] [Scilit]
  37. Caloiero, T.; Coscarelli, R.; Pellicone, G. Trend analysis of rainfall using gridded data over a region of southern Italy. Water 2021, 13, 2271. [Google Scholar] [CrossRef] [Scilit]
  38. Bărbulescu, A.; Dumitriu, C.Ș. Shifts in precipitation variability near the Danube Delta Biosphere Reserve (1965–2019). Water 2025, 17, 2692. [Google Scholar] [CrossRef] [Scilit]
Figure 1. Location of the study area and meteorological station network. The inset map shows the location of the island of Cyprus within the Mediterranean Basin, and the main map presents the station network, elevation distribution, major physiographic features, and the boundary of the study area.
Water 18 02050 g001
Figure 2. Station-based spatial distribution of annual and seasonal Pr trends across Northern Cyprus: (a) annual, (b) autumn (SON), (c) winter (DJF), (d) spring (MAM), and (e) summer (JJA). Symbol sizes represent the magnitude of Sen’s slope, while statistical significance is indicated according to the MMK test.
Water 18 02050 g002
Figure 3. Station-based spatial distribution of annual and seasonal Tmax trends across Northern Cyprus: (a) annual, (b) autumn (SON), (c) winter (DJF), (d) spring (MAM), and (e) summer (JJA). Symbol sizes represent the magnitude of Sen’s slope, while statistical significance is indicated according to the MMK test.
Water 18 02050 g003
Figure 4. Station-based spatial distribution of annual and seasonal Tmin trends across Northern Cyprus: (a) annual, (b) autumn (SON), (c) winter (DJF), (d) spring (MAM), and (e) summer (JJA). Symbol sizes represent the magnitude of Sen’s slope, while statistical significance is indicated according to the MMK test.
Water 18 02050 g004
Figure 5. Pettitt breakpoint years for (a) Pr, (b) Tmax, and (c) Tmin. Marker color and shape indicate the temporal aggregation period. Significant breakpoints are larger, fully opaque, and outlined in black; nonsignificant breakpoints are smaller and semi-transparent.
Water 18 02050 g005
Figure 6. Heatmap illustrating the dominant behavior of low-, medium-, and high-value annual and seasonal Pr classes.
Water 18 02050 g006
Figure 7. Heatmap illustrating the dominant behavior of low-, medium-, and high-value annual and seasonal Tmax classes.
Water 18 02050 g007
Figure 8. Heatmap illustrating the dominant behavior of low-, medium-, and high-value annual and seasonal Tmin classes.
Water 18 02050 g008
Figure 12. Ten-year overlapping structural trend in mean precipitation (STm) for annual and seasonal precipitation series. Thin light-gray lines represent station-level STm series. The thick black line indicates the regional median STm for each geographical class and the whole study area, while the red line represents the overall linear tendency.
Water 18 02050 g012
Figure 13. Ten-year overlapping structural variability trend (SVm) for annual and seasonal precipitation series. Thin light-gray lines represent station-level SVm series. The thick black line indicates the regional median SVm for each geographical class and the whole study area, while the red line represents the overall linear tendency.
Water 18 02050 g013
Figure 14. Ten-year overlapping structural trend in (a) mean (STm) and (b) variability (SVm) for annual and seasonal Tmax series. Thin light-gray lines represent station-level STm and SVm series. The thick black line indicates the whole-study-area median STVI value, while the red line represents the overall linear tendency.
Water 18 02050 g014
Figure 15. Ten-year overlapping structural trend in (a) mean (STm) and (b) variability (SVm) for annual and seasonal Tmin series. Thin light-gray lines represent station-level STm and SVm series. The thick black line indicates the whole-study-area median STVI value, while the red line represents the overall linear tendency.
Water 18 02050 g015
Figure 16. Representative trend diagnostics for (ac) Alevkaya autumn precipitation, (df) Gazimağusa annual Tmax, and (gi) Çamlıbel summer Tmin. For each case, the observed time series with classical trend and change-point results, ITA, and STVI diagnostics are presented from left to right.
Water 18 02050 g016
Table 1. Properties of monthly precipitation and temperature series.
StationSubbasinGeographical ClassLatitude
(°N)
Longitude
(°E)
Elevation
(m)
Pr
Record Period
Tmax/Tmin Record Period
AkdenizKyrenia SubbasinCoastal35.1832.57801978–2022-
AlevkayaKyrenia SubbasinHilly/Mountainous35.1733.326081976–20221992–2022
BeyarmuduMesaoria SubbasinInland35.0233.42861976–2022-
BoğazKyrenia SubbasinHilly/Mountainous35.1633.162751976–20221995–2022
ÇamlıbelKyrenia SubbasinHilly/Mountainous35.1833.042751978–20221992–2022
ÇayırovaKarpas SubbasinCoastal35.2134.01351978–2022-
ÇayönüMesaoria SubbasinInland35.0533.47351987–2022-
DipkarpazKarpas SubbasinCoastal35.3534.221301978–2022-
ErcanMesaoria SubbasinInland35.0933.291151978–2022
EsentepeKyrenia SubbasinHilly/Mountainous35.2933.352171976–20221992–2022
GazimağusaMesaoria SubbasinCoastal35.0733.5621978–20221992–2022
GeçitkaleMesaoria SubbasinInland35.1533.43621978–20221992–2022
GirneKyrenia SubbasinCoastal35.1933.19141978–20221992–2022
GüzelyurtMorphou SubbasinCoastal35.1132.59481978–20221992–2022
İskeleMesaoria SubbasinCoastal35.1733.53251978–20222001–2022
KantaraKyrenia SubbasinHilly/Mountainous35.2333.534201978–2022-
KozanköyKyrenia SubbasinHilly/Mountainous35.1833.082601984–2022-
LaptaKyrenia SubbasinCoastal35.233.1621978–20221992–2022
LefkeMorphou SubbasinCoastal35.0632.5651978–2022-
LefkoşaMesaoria SubbasinInland35.1133.21311976–20221992–2022
MehmetçikKarpas SubbasinCoastal35.2534.04801978–2022-
SalamisMesaoria SubbasinCoastal35.1133.5451976–2022-
SerdarlıMesaoria SubbasinInland35.1433.36881977–2022-
TatlısuKyrenia SubbasinHilly/Mountainous35.2233.451701976–2022-
VadiliMesaoria SubbasinInland35.0733.39511978–2022-
YenierenköyKarpas SubbasinCoastal35.3234.111121978–20221992–2022
YeşilırmakMorphou SubbasinCoastal35.132.44301978–2022-
Disclaimer/Publisher’s Note: The statements, opinions and data contained in all publications are solely those of the individual author(s) and contributor(s) and not of MDPI and/or the editor(s). MDPI and/or the editor(s) disclaim responsibility for any injury to people or property resulting from any ideas, methods, instructions or products referred to in the content.