Article

Operating-Condition-Dependent Feedforward Control Strategy for Primary Frequency Regulation of Hydropower Units


1
School of Civil and Hydraulic Engineering, Huazhong University of Science and Technology, Wuhan 430074, China
2
Hubei Key Laboratory of Digital River Basin Science and Technology, Huazhong University of Science and Technology, Wuhan 430074, China
3
Institute of Water Resources and Hydropower, Huazhong University of Science and Technology, Wuhan 430074, China
*
Author to whom correspondence should be addressed.
Water 2026, 18(16), 2028; https://doi.org/10.3390/w18162028
Submission received: 14 July 2026 / Revised: 14 August 2026 / Accepted: 17 August 2026 / Published: 19 August 2026

Abstract

In the context of building a novel power system and with the increasing penetration of renewable energy, hydropower units are increasingly required to operate under wide-range operation (WRO) conditions. However, under the opening mode, the unit’s primary frequency regulation (PFR) performance is significantly affected by head and load fluctuations. This poses a risk of failing grid assessment requirements. To enhance the PFR performance, this study first establishes a nonlinear simulation model of the hydro-turbine regulation system (HTRS) for PFR and conducts a simulation analysis of PFR performance under varying head, load, and frequency deviation conditions. Subsequently, based on the simulation results, an operating-condition-dependent feedforward–feedback control strategy is proposed. This strategy utilizes a BP neural network (BPNN) to establish the head-power-opening (H-P-Y) mapping relationship, calculates the feedforward opening command in real time, and superimposes it with the PID feedback correction to form the total guide vane opening (GVO) setpoint. Performance comparisons through multi-condition simulations within the ranges of 70–100 m head, 10–90%Pr load, and 0.05–0.15 Hz frequency deviation demonstrate that the proposed strategy ensures that all selected assessment indices meet PFR compliance standards across all tested conditions. This study provides a feasible pathway for improving the PFR performance of hydropower units under WRO in the opening mode.

1. Introduction

As dual-carbon goals advance, renewable energy capacity continues to grow. Consequently, the power system exhibits low inertia and high randomness, posing severe challenges to grid frequency stability [1,2,3]. As a fundamental measure for maintaining active power balance and frequency stability, PFR performance is directly related to safe power grid operation [4,5]. Owing to their fast response, large regulation capacity, and wide adjustment range, hydropower units have become indispensable high-quality frequency regulation resources in the power system, undertaking the critical task of PFR [6,7].
Currently, hydro-turbine governors mainly operate in two control modes: power control mode (PCM) and opening control mode (OCM) [8]. Among them, the OCM is widely applied in engineering practice due to its simple and reliable control logic and rapid response. In OCM, the governor typically adopts a fixed-parameter PID control, and its control law is based on the linear assumption between frequency deviation and the variation of GVO [9]. However, the hydro-turbine itself possesses strong nonlinearity and time-varying characteristics, making it difficult for fixed PID parameters to adapt to the requirements of unit WRO [10,11,12]. Therefore, how to improve the PFR performance of hydropower units across the full range of operating conditions under OCM is a key issue with both theoretical value and engineering significance.
To address these issues, domestic and international scholars have conducted extensive research. Several studies have focused on intelligent PID parameter optimization. Liu et al. [13] adopted particle swarm optimization for fuzzy PID control. Weldcherkos et al. [14] designed an adaptive neuro-fuzzy inference system controller. Khamari et al. [15] proposed a fractional-order fuzzy PID strategy optimized by an improved moth-flame algorithm. These methods all effectively enhanced the controller’s adaptive capacity under multiple operating conditions. Chen et al. [16] combined an improved grey wolf optimizer with a backpropagation neural network to enable real-time PID parameter adjustment according to operating conditions. Dong et al. [17] introduced a twin-delayed deep deterministic policy gradient reinforcement learning algorithm, designing a segmented optimal PID controller to balance regulation performance and damping characteristics. In terms of adaptive and nonlinear control, Zou et al. [18] designed an intelligent nonlinear robust controller using a hybrid feedback linearization method based on state-dynamic-measurement. Gezer et al. [19] applied model reference adaptive control based on Lyapunov stability, enabling the governor to adapt to external disturbances in real time. Lu et al. [20] further analyzed the parameter stability domain under a wide load operating range and ensured that the unit successfully passed PFR assessments across different heads and GVOs via global parameter optimization. However, most of the above strategies rely on precise unit models or massive offline training data. This reliance leads to complex parameter adjustment, difficult control law design, and high implementation costs. Furthermore, regarding dynamic frequency regulation performance optimization, Jones et al. [21] proposed an early predictive feedforward control strategy based on grid frequency prediction. By utilizing prediction deviations to act in advance, it mitigated control lag and effectively improved the initial response speed to frequency disturbances. Li et al. [22] designed a composite control strategy combining PID and quasi-proportional resonance, significantly enhancing the damping characteristics and anti-disturbance capacity of frequency regulation in the ultra-low frequency band. Gu et al. [23] proposed an integral adaptive virtual droop control strategy, effectively eliminating the reverse regulation phenomenon and drastically shortening the regulation time. However, existing control strategies mostly focus on compensating for a single dynamic performance metric. In recent years, to break through the aforementioned limitations, a variety of advanced control theories have been introduced into the field of hydropower frequency regulation. Regarding model predictive control (MPC), researchers have applied MPC to turbine governing systems, leveraging its explicit constraint-handling and rolling optimization capabilities to significantly enhance tracking performance and robustness across multiple operating conditions [8,24]. In terms of data-driven and learning control, deep reinforcement learning (DRL) and adaptive dynamic programming (ADP) have been utilized for power system frequency regulation, achieving optimal control under complex operating conditions through model-free or lightweight-model interactive learning [25,26]. In the realm of intelligent modeling and simulation, digital twin (DT) technology achieves real-time state mapping and predictive analysis of hydropower systems by constructing high-fidelity virtual mirrors [27]; meanwhile, physics-informed neural networks (PINNs) embed physical laws into deep learning frameworks to enhance the interpretability and generalization ability of models [28]. Although the aforementioned studies have achieved significant progress in intelligent parameter optimization, adaptive control, and singular dynamic performance enhancement, research on improving the full-condition adaptability of PFR in hydropower units under the opening mode remains insufficient.
This paper proposes an operating-condition-dependent control strategy under the opening mode, where feedforward action takes the lead, and PID provides complementary corrections. This strategy employs a BPNN to establish a mapping relationship among turbine head, power, and opening. It calculates the feedforward opening command based on real-time head and target power and then superimposes it with PID feedback corrections to obtain the total GVO setpoint. This achieves synergistic control combining feedforward speed with feedback accuracy. The primary contributions of this paper are as follows:
(1)
A nonlinear simulation model for PFR of hydropower units under the opening mode is constructed.
(2)
An operating-condition-dependent feedforward control strategy featuring BPNN-dominated feedforward regulation and PID-assisted correction is proposed for the opening mode.
(3)
The effectiveness of the proposed control strategy in enhancing PFR performance across wide ranges of water head, load, and frequency deviation is verified through multiple assessment indices and multi-condition simulations.
The remainder of this paper is structured as follows: Section 2 establishes a nonlinear mathematical model for PFR of the hydropower unit under the opening mode. Section 3 introduces the PFR assessment indices and conducts simulation analyses on the performance deficiencies of the traditional opening mode under typical operating conditions. Section 4 details the principles and implementation of the operating-condition-dependent feedforward control strategy and verifies its effectiveness through WRO simulations. Section 5 discusses the advantages and limitations of this work. Section 6 draws the conclusions.

2. Modeling of the Hydropower Unit Under Opening Mode

2.1. Governor Model

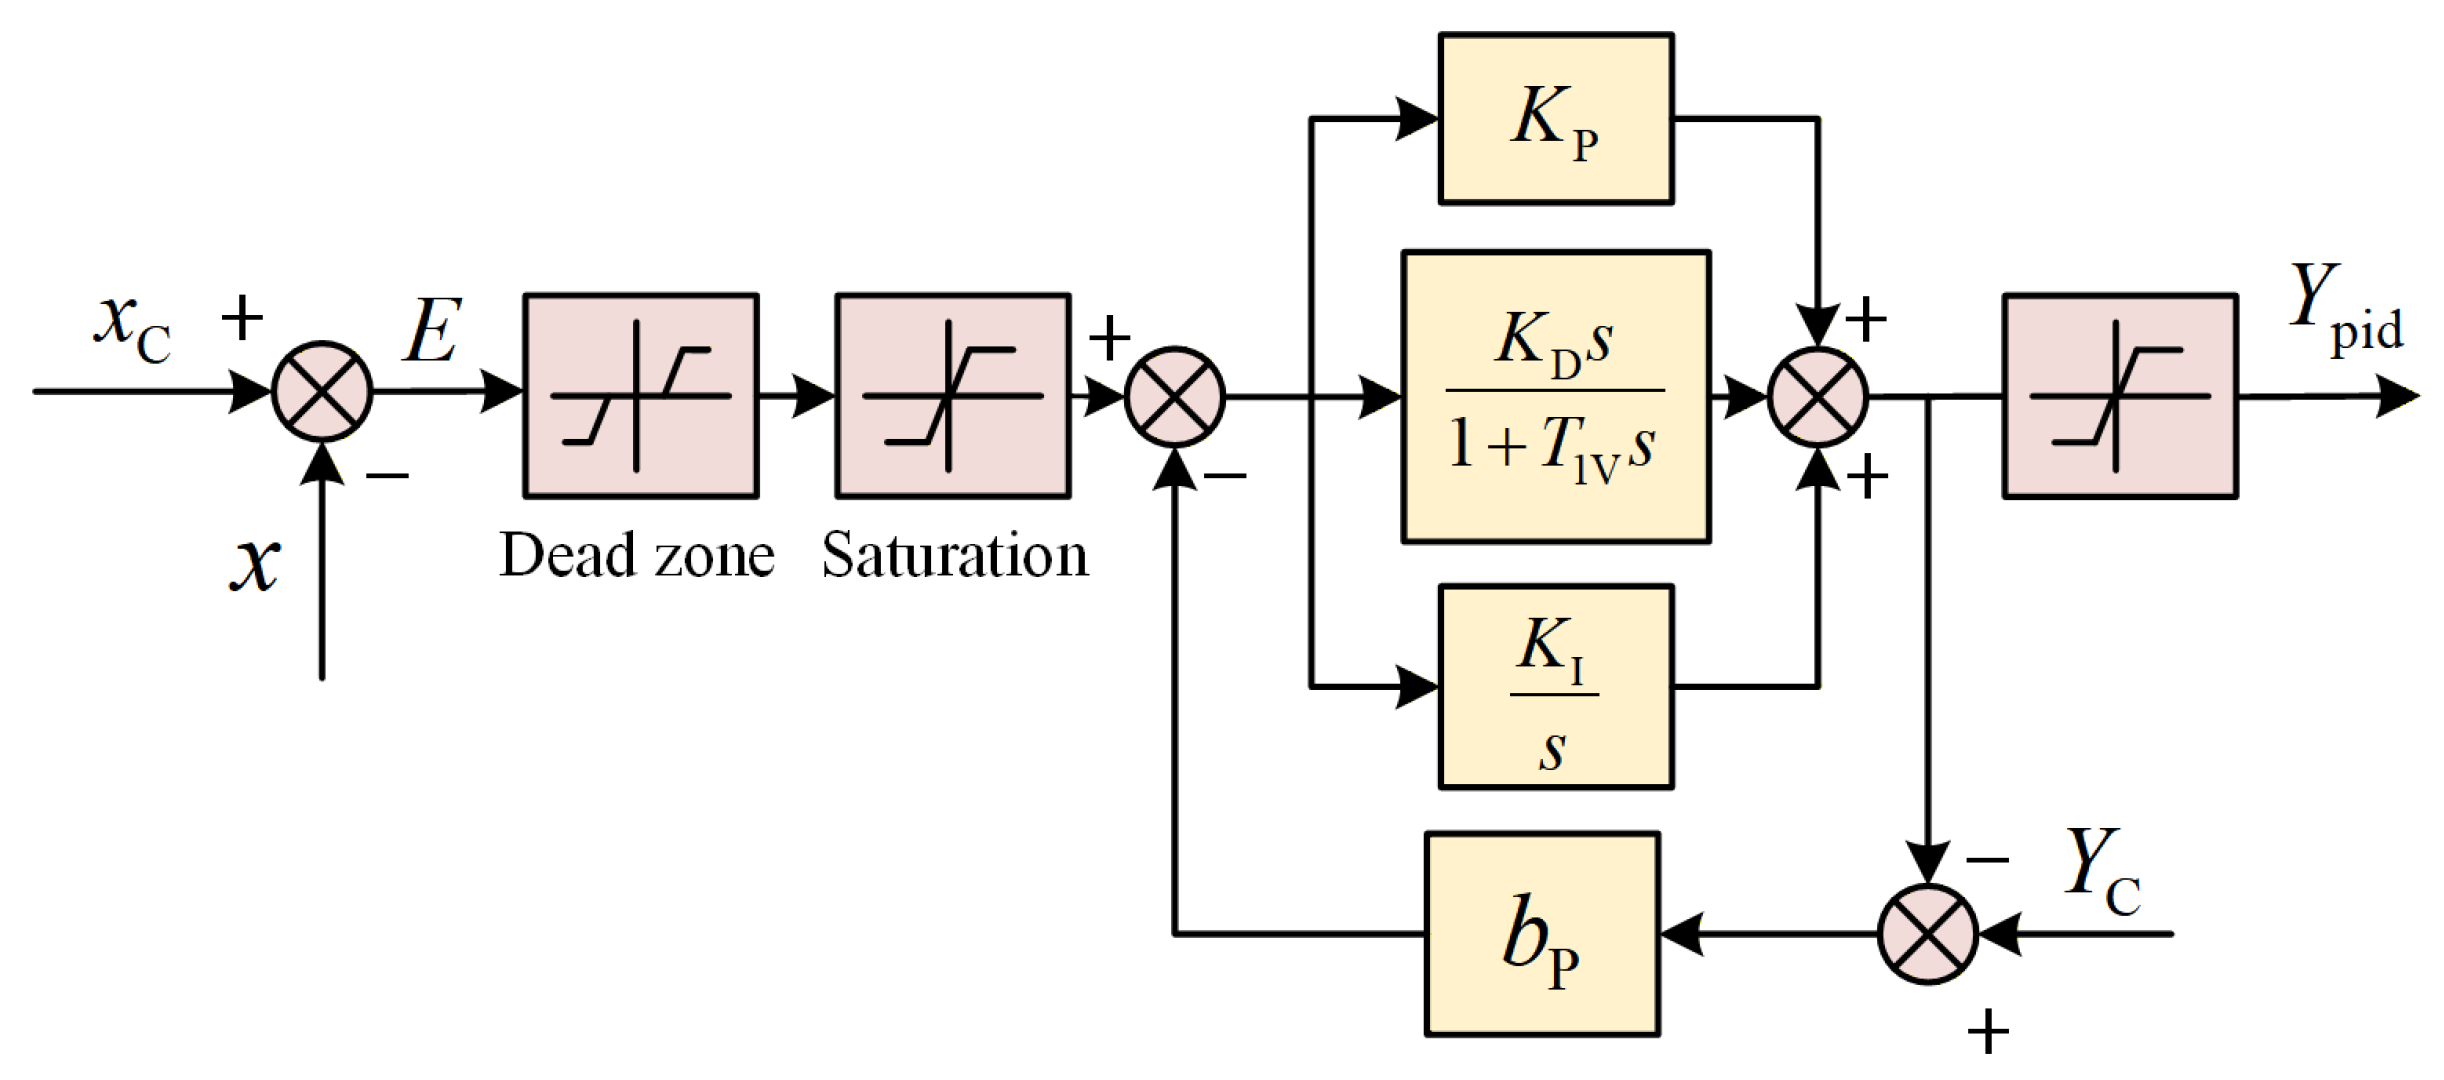
Under the conventional opening mode, the governor’s control principle is based on PID regulation with a permanent speed droop. The typical control block diagram adopted in this paper is shown in Figure 1 [29].
In the figure, x is the actual grid frequency signal, xC is the frequency setpoint, and E is the frequency deviation. KP is the proportional gain, KI is the integral gain, KD is the derivative gain, and T1V is the derivative time constant. YC is the reference GVO value, bp is the permanent speed droop coefficient, and Ypid is the governor output.
Its transfer function expression is as follows:
G PID ( s ) = K P + K I s + K D s 1 + T 1 V s Y pid ( s ) = G PID ( s ) 1 + b p G PID ( s ) ( E ( s ) b p Y c )

2.2. Servo-System Model

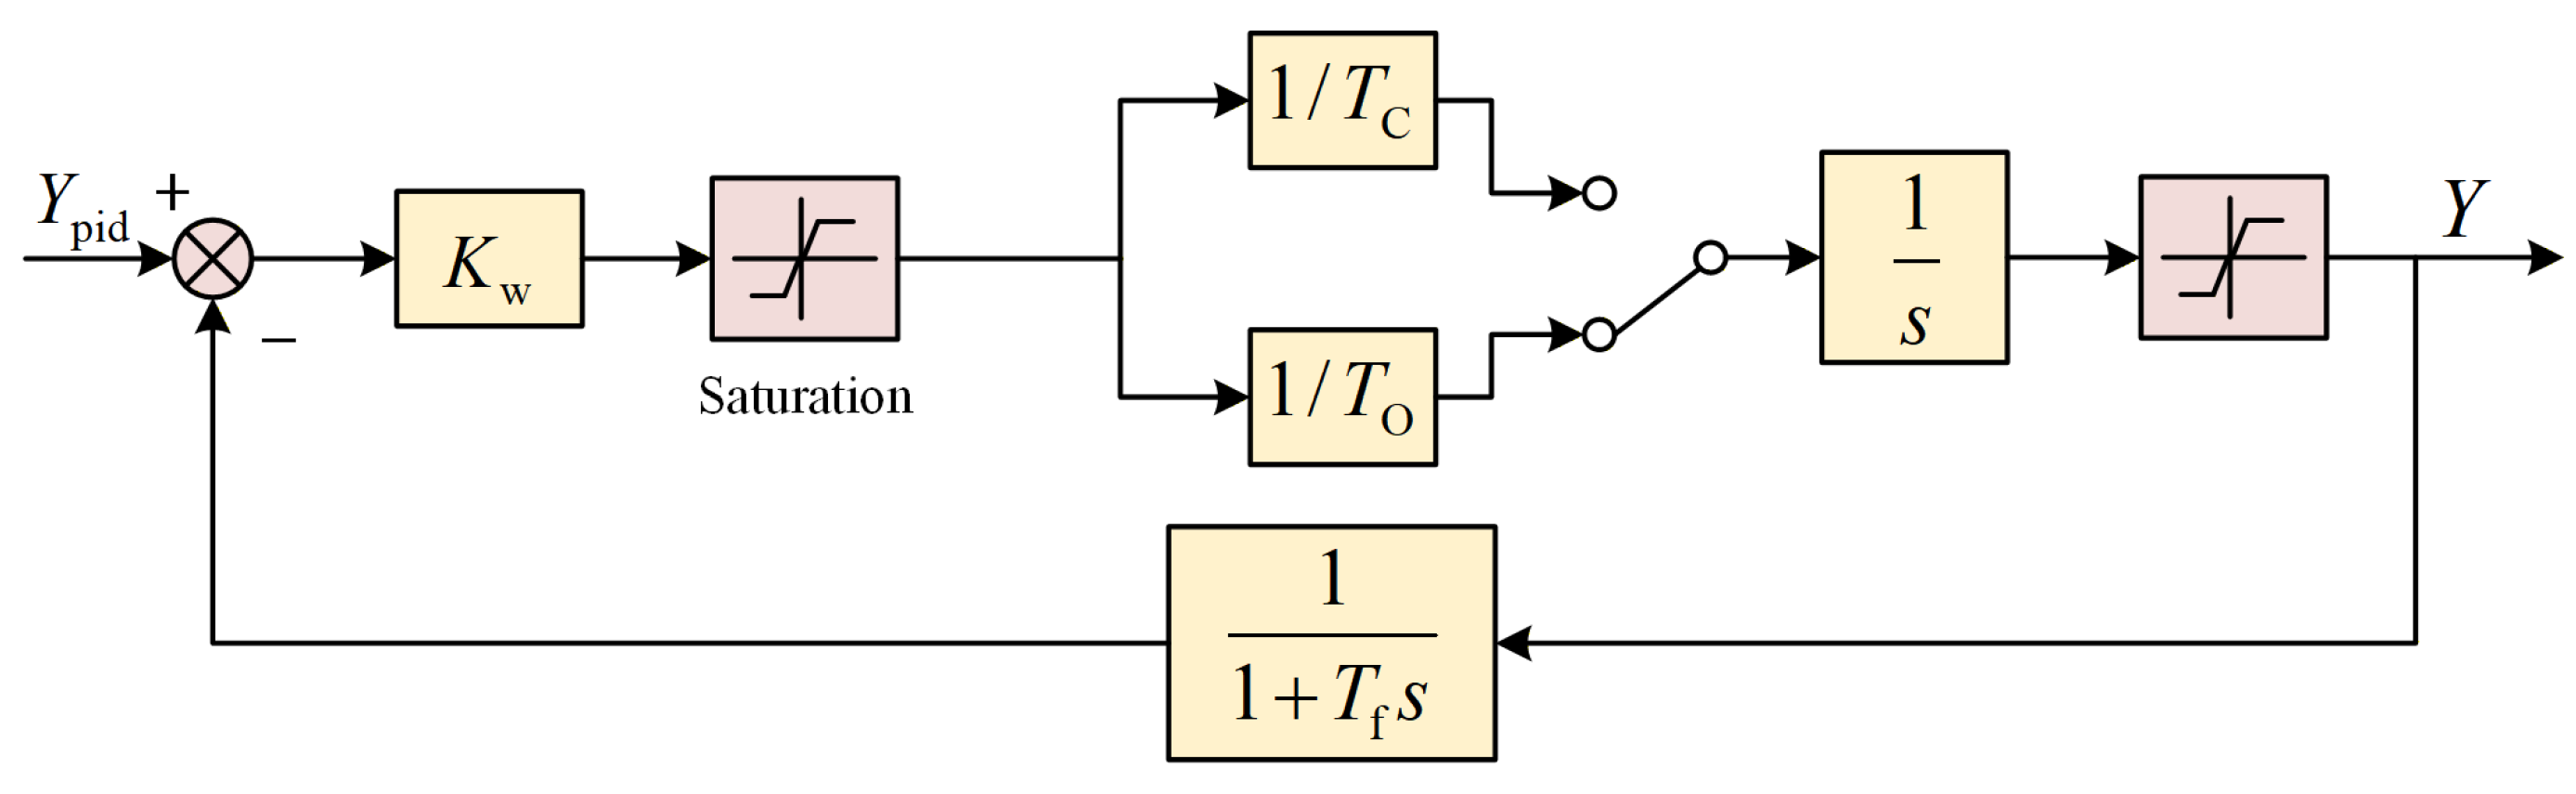
The command signal Ypid output by the governor needs to be amplified by the servo-system, converting the weak electrical signal into hydraulic power sufficient to drive the guide vane servomotor. The structure of the common electro-hydraulic servo-system adopted in this paper is shown in Figure 2 [30].
In the figure, Kw is the proportional gain of the electro-hydraulic conversion unit. Tk represents either the guide vane closing time constant TC or the opening time constant TO. Tf is the time constant of the feedback measurement unit. Y is the output GVO. Meanwhile, considering the rate limits for guide vane opening and closing, the parameters TC and TO provided by the manufacturer are set to 9.1 s and 14.7 s, respectively. Furthermore, an additional hard rate-limit constraint of ±0.05 pu/s is imposed on the GVO variation to simulate the physical response speed of the hydraulic servomotor. In addition, the GVO output range of the final saturation block is constrained between 0 and 1.

2.3. Hydro-Turbine Model

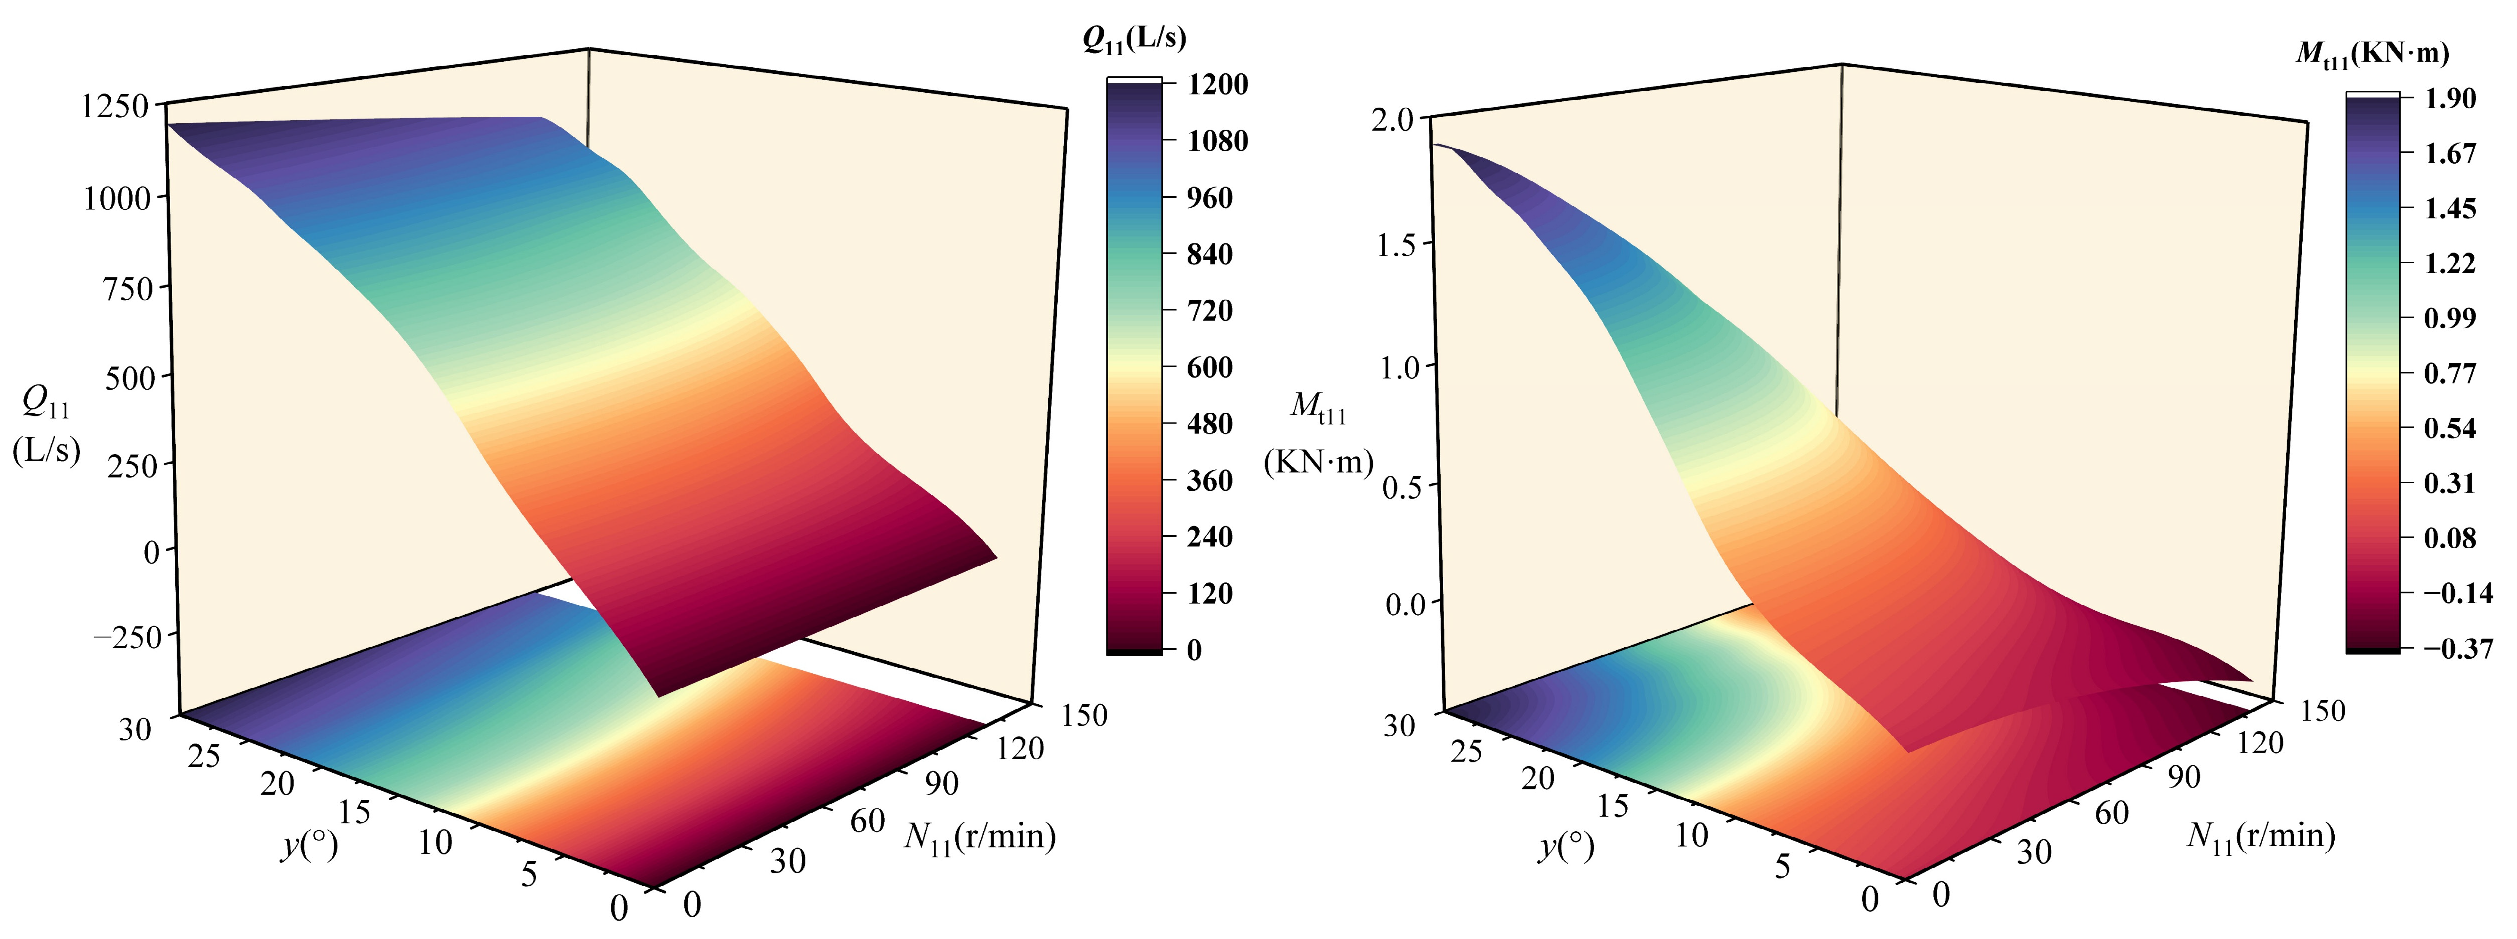
Establishing an accurate hydro-turbine model is crucial for PFR simulation and analyses of hydropower units. The dynamic characteristics of the hydro-turbine can be described by its comprehensive characteristic curves, which reflect the complex nonlinear relationships among multiple variables, including turbine torque, discharge, GVO, rotational speed, and head.
Currently, the prevalent practice is to express the state variables in the model using unit state variables, thereby obtaining the mapping relationships among unit torque Mt11, unit discharge Q11, unit speed N11, and guide vane opening y. In this way, the comprehensive characteristic curves are simplified into a two-dimensional interpolation model, as shown in Equation (2) [31].
M t 11 = M t 11 ( y , N 11 ) Q 11 = Q 11 ( y , N 11 )
The hydro-turbine interpolation model used in this section can be expressed based on the discharge characteristic surface and torque characteristic surface shown in Figure 3.

2.4. Penstock Model

According to the actual pipeline layout diagram of the power station, the model adopts a single-penstock single-unit configuration. During transient processes such as rapid GVO changes caused by governor actions, the water flow state within the pipeline changes drastically, inducing water hammer effects. To accurately simulate this complex hydraulic transient process, this paper employs the method of characteristics (MOC), which is the most widely applied and highest-precision method in engineering, to model the penstock.
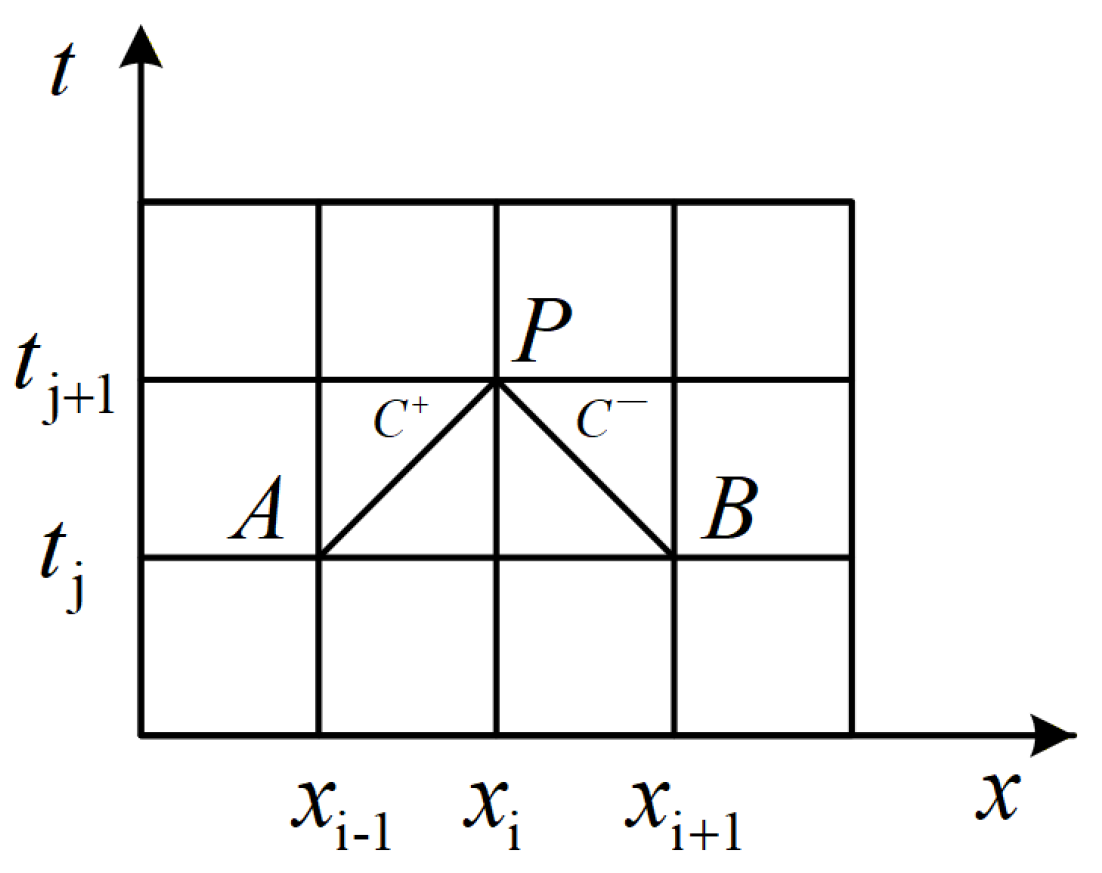
For numerical solving, each pipeline section is first discretized into multiple calculation reaches. By integrating a system of characteristic equations on the finite-difference grid in the x-t coordinate system, a system of linear equations for solving the head Hp and discharge Qp at any internal node P at time t can be obtained. The finite-difference grid is shown in Figure 4, and the linear equations are shown in Equations (3) and (4). The detailed derivation process is given in References [32,33].
( H P H A ) + a g A ( Q P Q A ) + f 2 g D A 2 A p Q   |   Q   |   d x = 0
( H P H B ) a g A ( Q P Q B ) f 2 g D A 2 B P Q   |   Q   |   d x = 0
By employing Equations (3) and (4), the states of any internal nodes along the pipeline, excluding the boundary nodes, can be solved at any given time. For the boundary nodes, distinct boundary conditions must be formulated according to their specific locations. The boundary nodes considered in this study include upstream and downstream reservoir nodes, the series junction nodes between the penstock and the spiral case, and the hydro-turbine node.

2.5. Generator Model

For studies on PFR, the focus is placed on the overall rotational dynamics of the unit. Therefore, the hydro-turbine and generator rotors are treated as a unified rigid rotating body, and their electromechanical characteristics can be described in Equation (5) [34]:
G g ( s ) = N ( s ) M t ( s ) M g ( s ) = 1 T a s + e n
where N is the system frequency deviation; Mt is the driving torque exerted by the hydro-turbine on the main shaft, namely the mechanical torque; Mg is the electromagnetic braking torque generated by the generator; Ta is the inertial time constant of the unit; en is the comprehensive self-regulation coefficient of the unit.

3. Primary Frequency Regulation Performance Analysis

3.1. Introduction to PFR Assessment Indices

To comprehensively evaluate PFR performance from four aspects—responsiveness, latency, stability, and energy contribution—this study adopts assessment indices primarily referencing the Technical Guide for Hydraulic Turbine Regulating System in Grid (DL/T 1245-2024) [35] and the implementation rules of relevant regional power grids.
The core assessment indices are selected as the rise time, delay time, stable time, and integrated electrical energy ratio. According to the assessment rules, the maximum rise time must not exceed 15 s; the maximum delay time must not exceed 2 s; the maximum stable time must not exceed 45 s. Specifically, regarding the integrated electrical energy ratio, when the frequency deviation satisfies | Δ f | 0.06   Hz , the ratio should be within the range of [0.6, 2.3]; when 0.06   Hz < | Δ f | < 0.08   Hz , it should be within [0.6, 1.8]; when | Δ f | 0.08   Hz , it should be within [0.6, 1.3].
For the convenience of comparative analyses, these four assessment indices are normalized in this section and are, respectively, defined as the response time ratio (RTR), delay time ratio (DTR), stable time ratio (STR), and integrated energy ratio (IER), with their calculation formulas given in Equation (6):
RTR = t up 15 ,   Compliance   interval : RTR 1 DTR = t d 2 ,   Compliance   interval : DTR 1 STR = t stable 45 ,   Compliance   interval : STR 1 IER = T start T end P ( t ) P 0 d t P target P 0 ( T end T start ) ,   Compliance   interval   =   0.6 IER 2.3 ,   If   Δ f 0.06 Hz 0.6 IER 1.8 ,   If   0.06 Hz < Δ f < 0.08 Hz 0.6 IER 1.3 ,   If   Δ f 0.08 Hz
where tup is the rise time, with a maximum value of 15 s, and RTR is the rise-time ratio; td is the delay time, with a maximum value of 2 s, and DTR is the delay time ratio; tstable is the settling time, with a maximum value of 45 s, and STR is the settling time ratio; P(t) is the actual response power, P0 is the initial power, and Ptarget is the target power; Tstart and Tend are the start time (taken as 60 s in this simulation) and end time for the PFR integrated power calculation, respectively, and IER is the integrated energy ratio.

3.2. Model Performance Analysis

To comprehensively evaluate the performance of the model under the opening mode, this section designs three sets of simulation experiments to independently analyze the impacts of head variations, load levels, and frequency deviation disturbance amplitudes on various performance indices of PFR.
The primary unit parameters are as follows: The rated power Pr is 175 MW, the head variation range is 68.5–103 m, the rated head is 84.4 m, and the frequency deadband is ±0.04 Hz. First, a baseline operating condition is selected by tuning the PID parameters (Kp = 5, Ki = 5, Kd = 0) to ensure that the response can reach 90% of the target power value at 7 s and satisfy the PFR assessment indices. The baseline condition is defined as the unit operating at 50% rated power under a rated head of 84.4 m, subjected to a frequency disturbance of ±0.1 Hz, followed by the frequency returning to its initial value.
All simulation experiments are carried out in the MATLAB/Simulink R2025a environment. The model adopts a fixed-step continuous solver for numerical calculations, and the unified simulation step size for the core control loop and hydro-mechanical coupling system is set to 0.02 s. The hardware platform for simulation tests is equipped with an Intel Core i7-13700H processor and 32 GB DDR5 memory. Tests show that the average BPNN feedforward inference time per simulation step is less than 0.5 ms, well within the real-time control requirements of industrial governors.
(1) Performance Analysis of Primary Frequency Regulation under Different Head Conditions
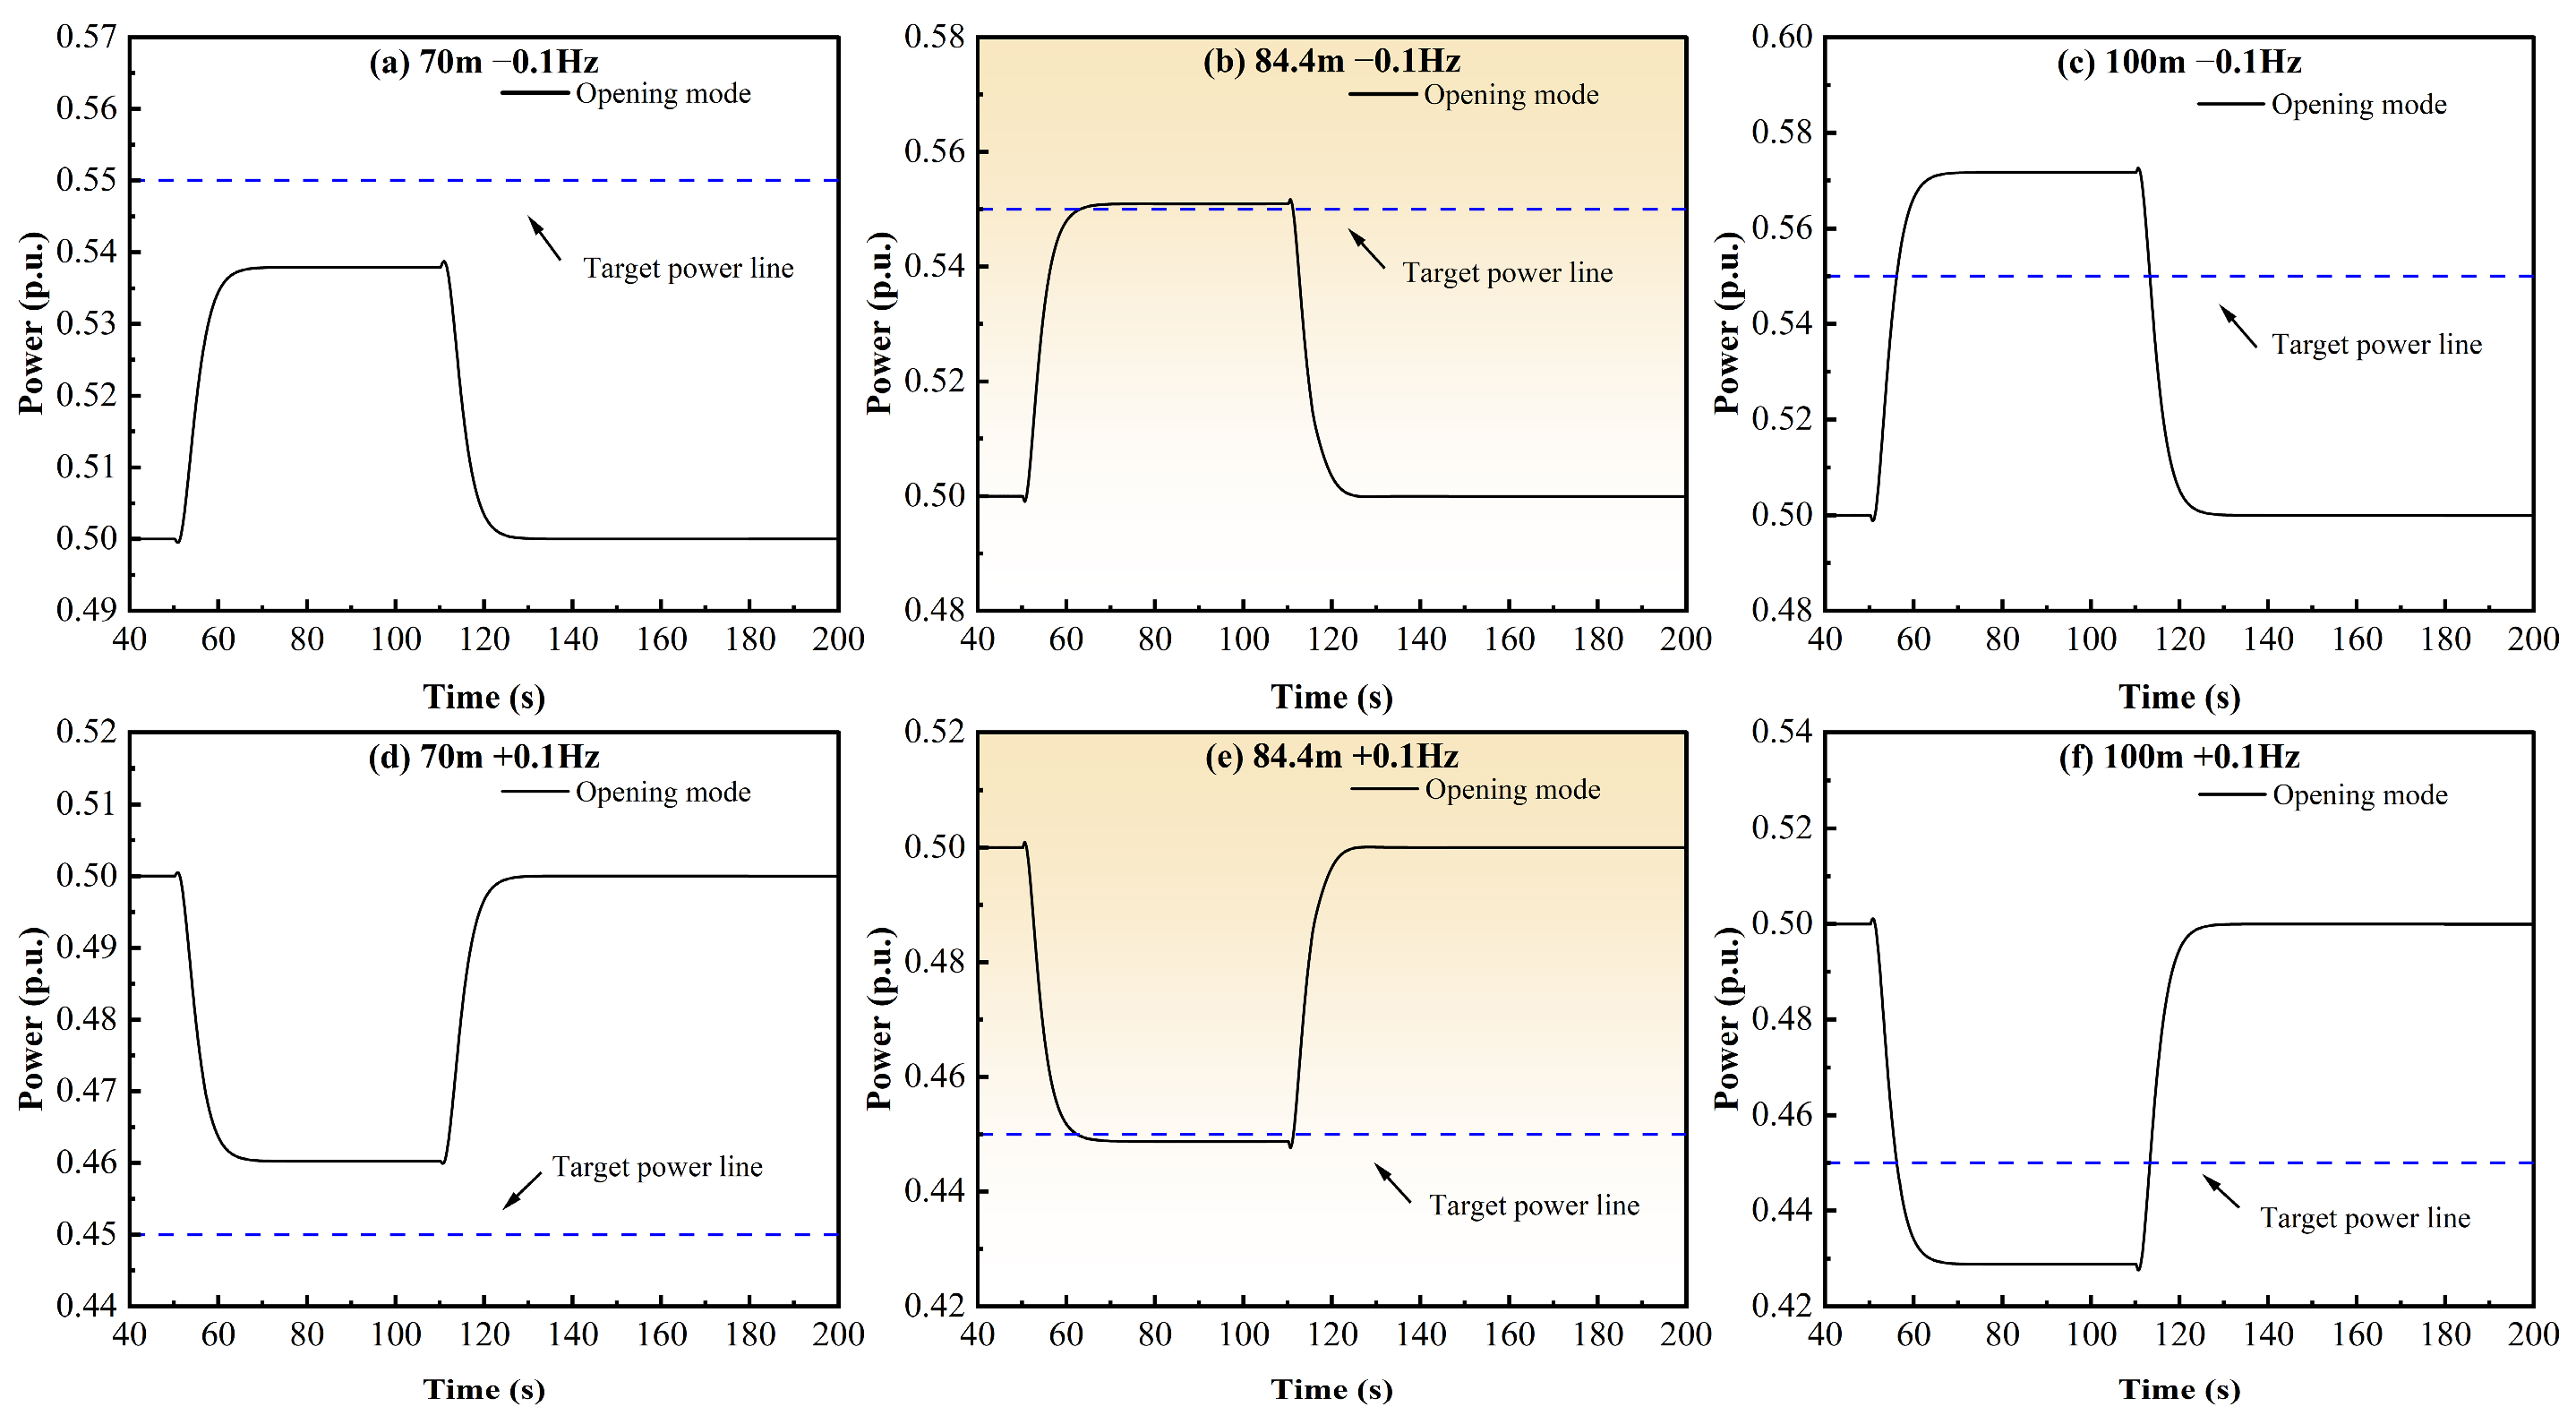
The unit is subjected to ±0.1 Hz frequency step disturbances under three distinct operating conditions: a low head of 70 m, a rated head of 84.4 m, and a high head of 100 m. The resulting power response curves are illustrated in Figure 5, where the shaded area represents the baseline operating condition.
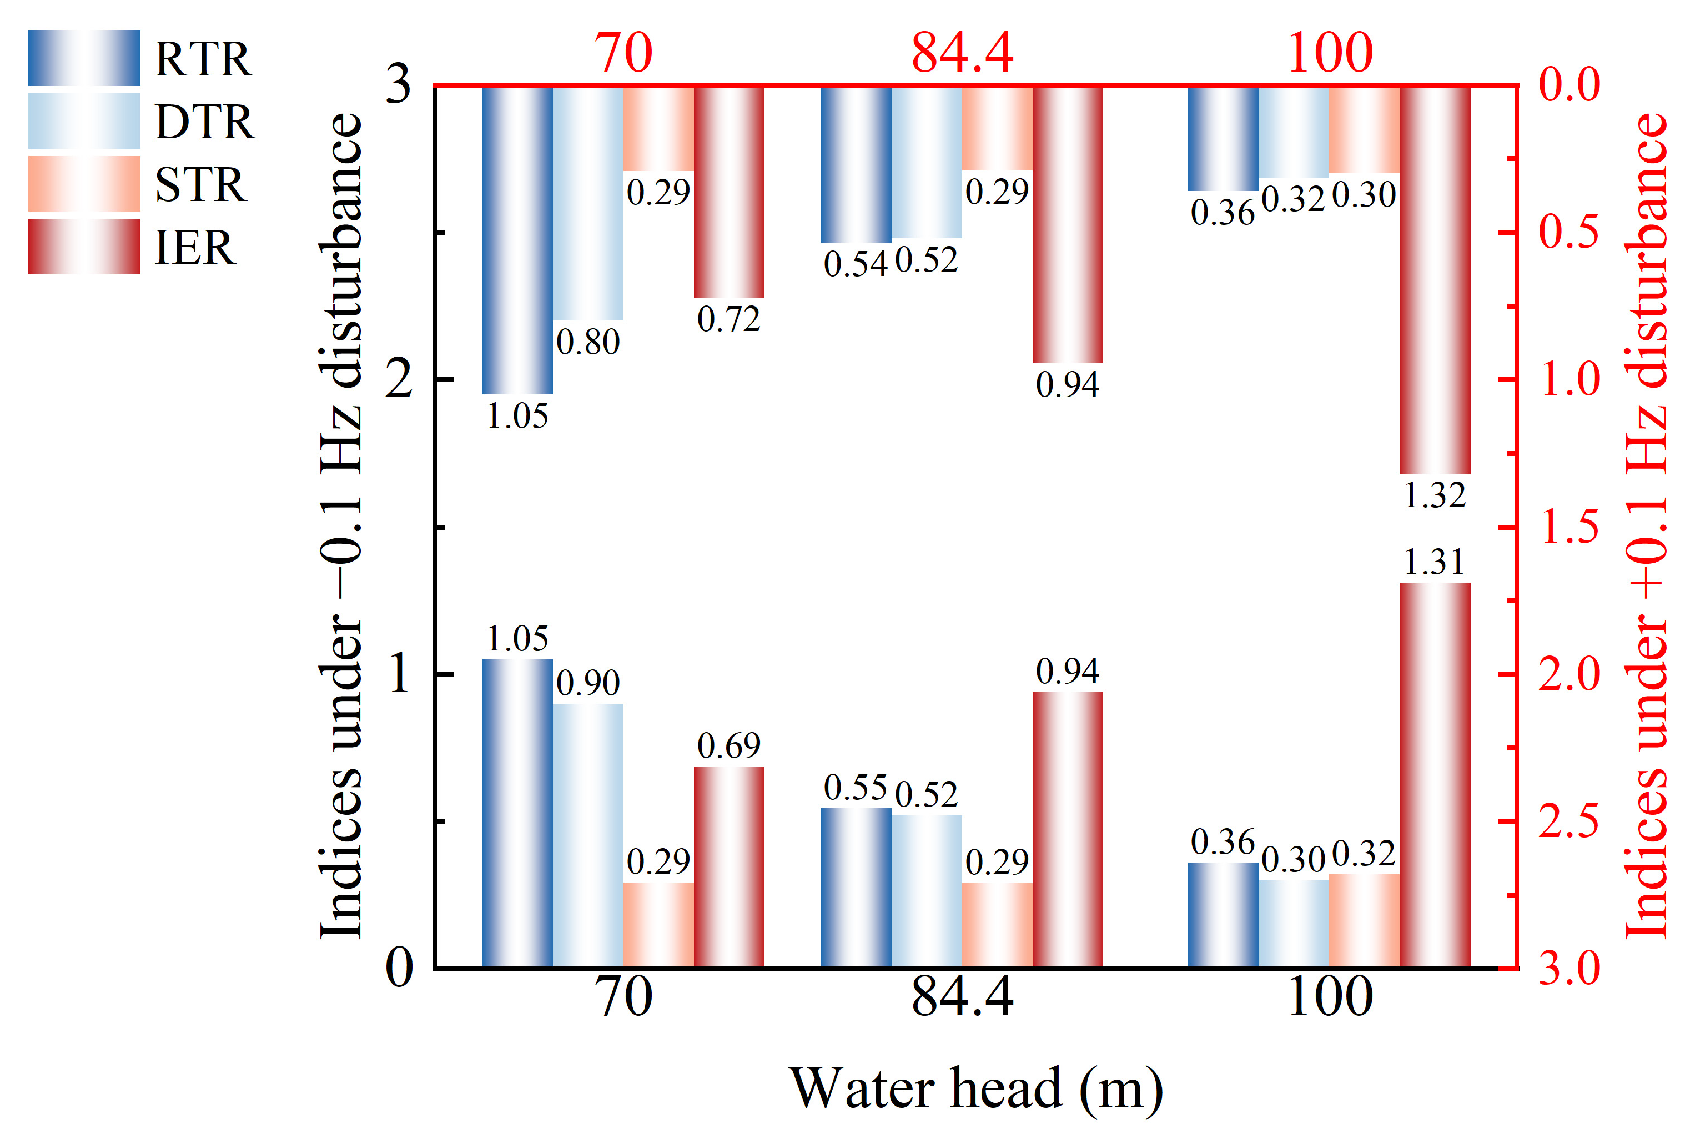
Based on Figure 5, the assessment index results calculated under different heads are shown in Figure 6.
As illustrated in Figure 5 and Figure 6, under the 70 m low-head condition, the frequency regulation performance of the unit exhibits distinct under-regulation, resulting in a rise-time ratio that fails to meet the assessment requirements. Conversely, under the high-head condition, although the response speed is extremely rapid, the unit exhibits severe over-regulation characteristics, causing the integrated energy ratio index to exceed the allowable upper compliance limit of 1.3. In summary, the unit fails to meet the PFR assessment requirements under both the 70 m low-head and 100 m high-head conditions.
(2) Performance Analysis of Primary Frequency Regulation under Different Initial Load Conditions
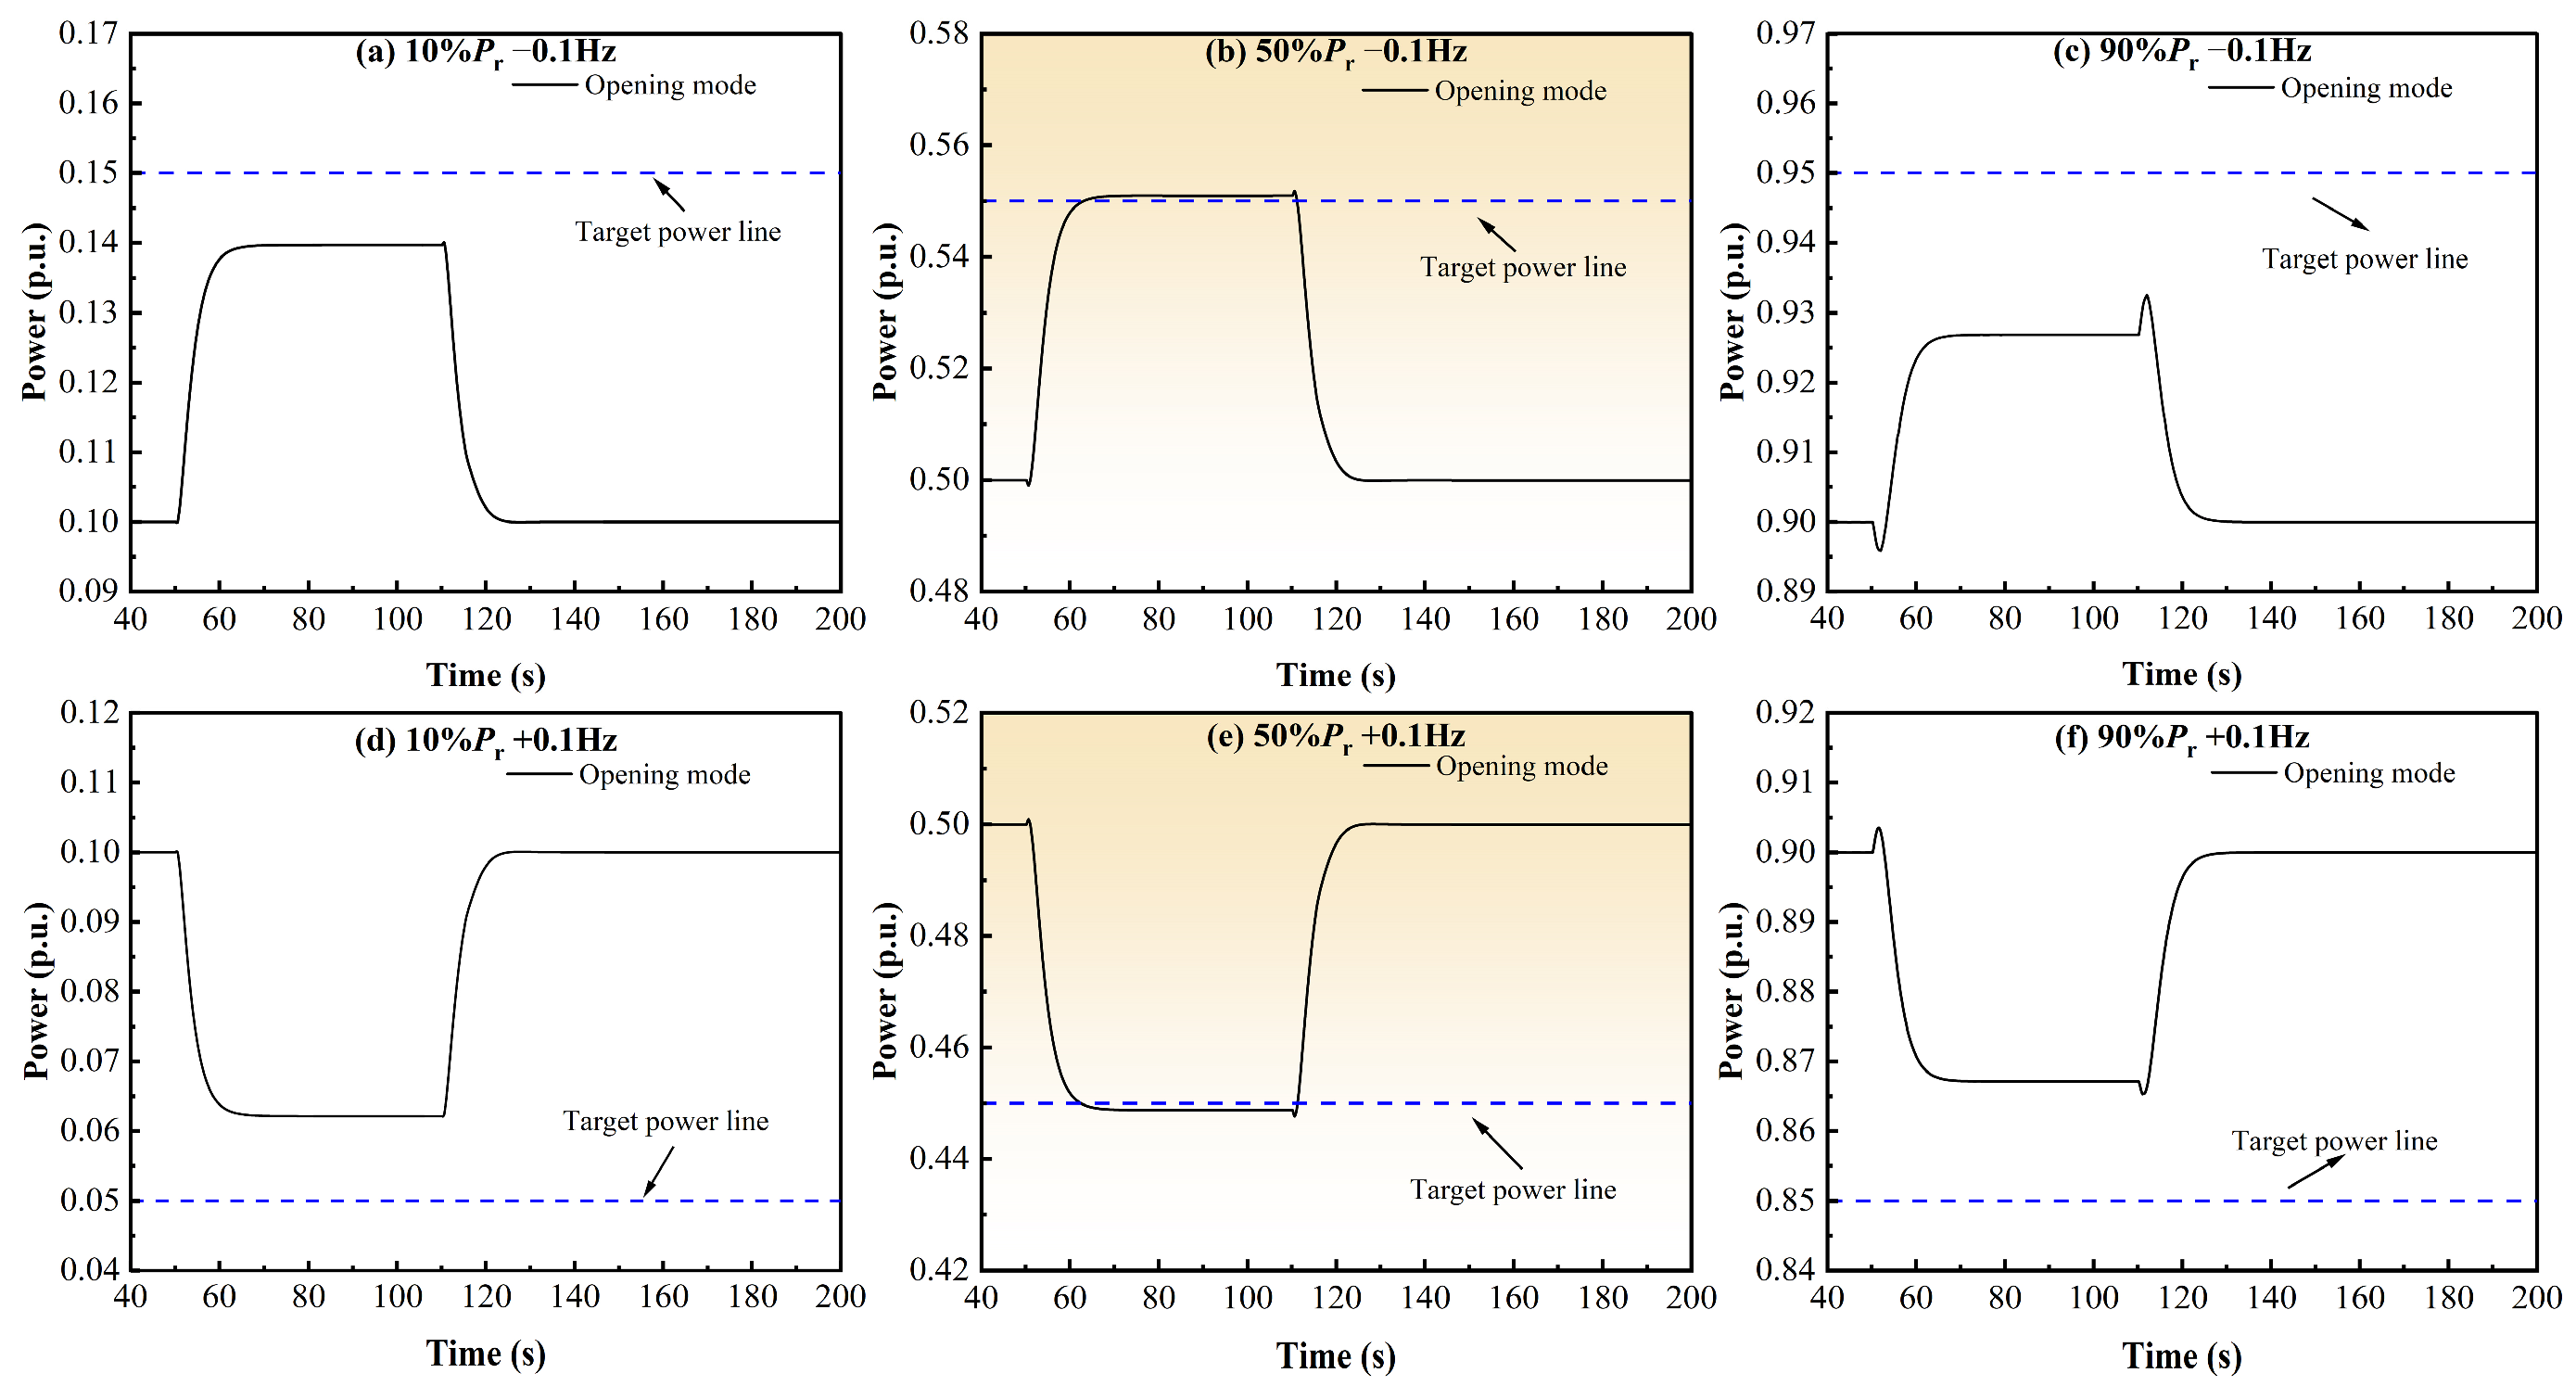
The unit is subjected to ±0.1 Hz frequency step disturbances under three distinct operating conditions with initial loads of 10%Pr, 50%Pr, and 90%Pr. The resulting power response curves are illustrated in Figure 7.
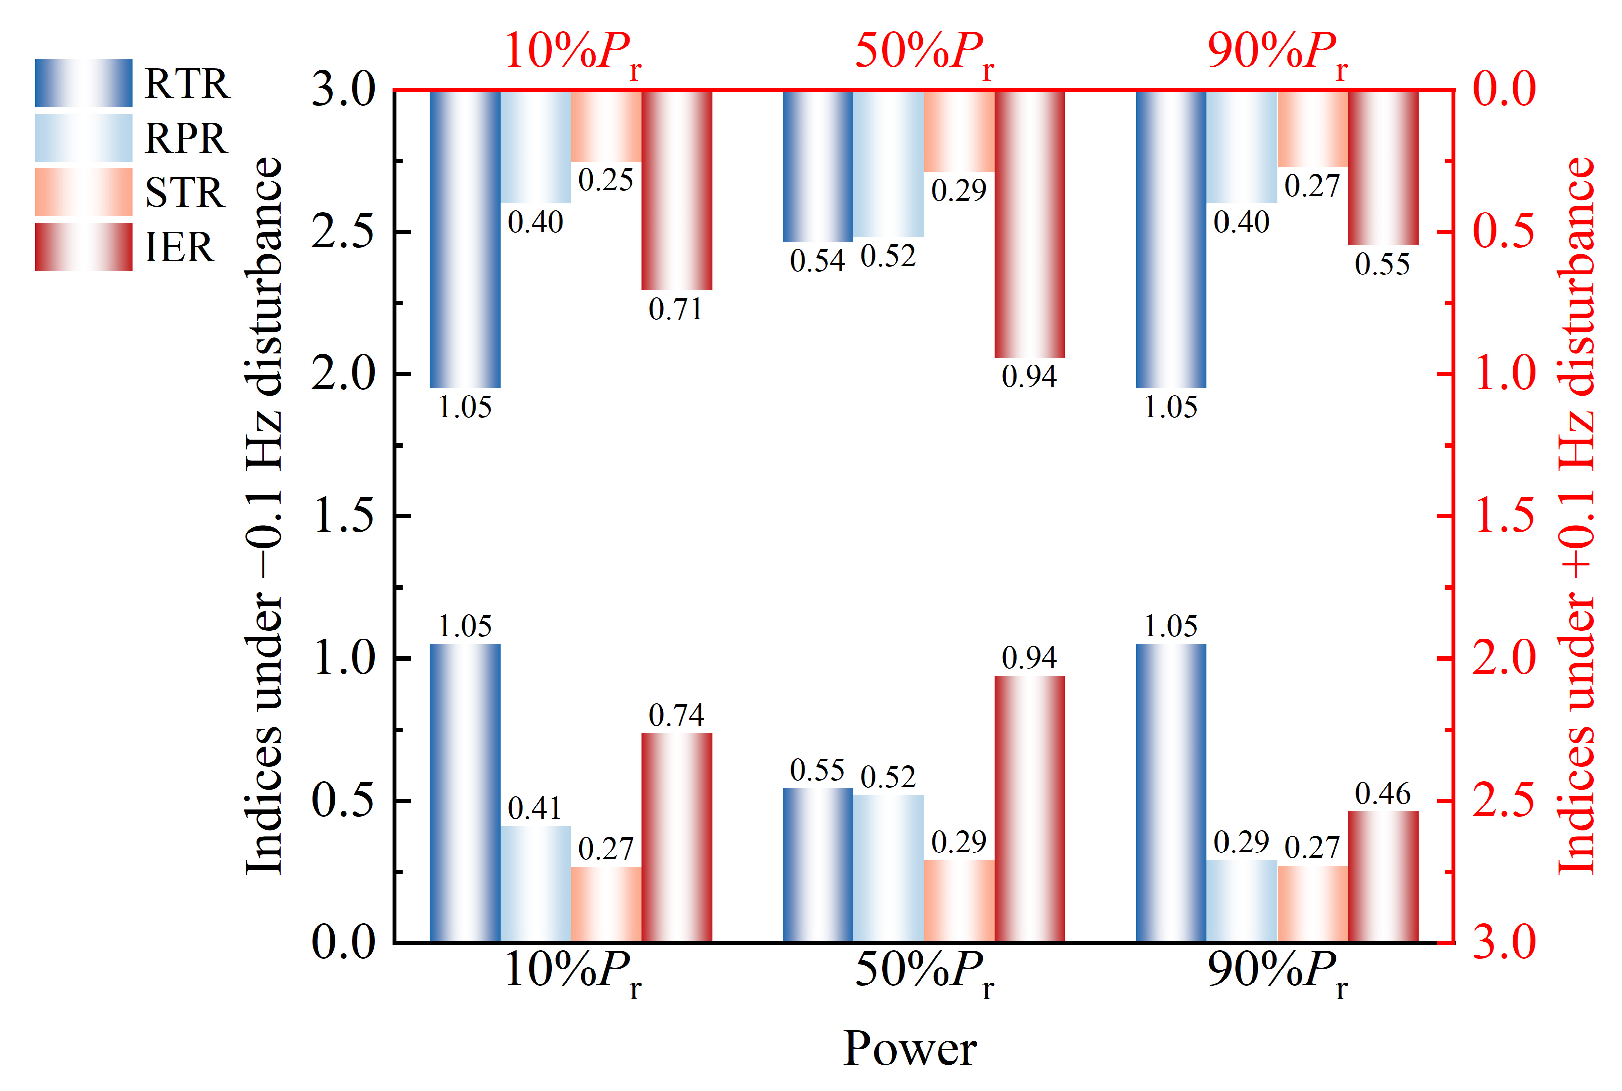
Based on Figure 7, the assessment index results calculated under different unit loads are shown in Figure 8.
As illustrated in Figure 7 and Figure 8, under the 90%Pr high-load and 10%Pr low-load conditions, the unit exhibits distinct under-regulation, causing the rise-time ratio index to fail to satisfy the assessment standards. Furthermore, the regulation magnitude of the unit is even smaller under the 90%Pr high-load condition, with the integrated energy ratios all falling below 0.6. In summary, the unit fails to meet the PFR assessment index requirements under both the 10%Pr low-load and 90%Pr high-load conditions.
(3) Performance Analysis of Primary Frequency Regulation under Different Frequency Deviation Conditions
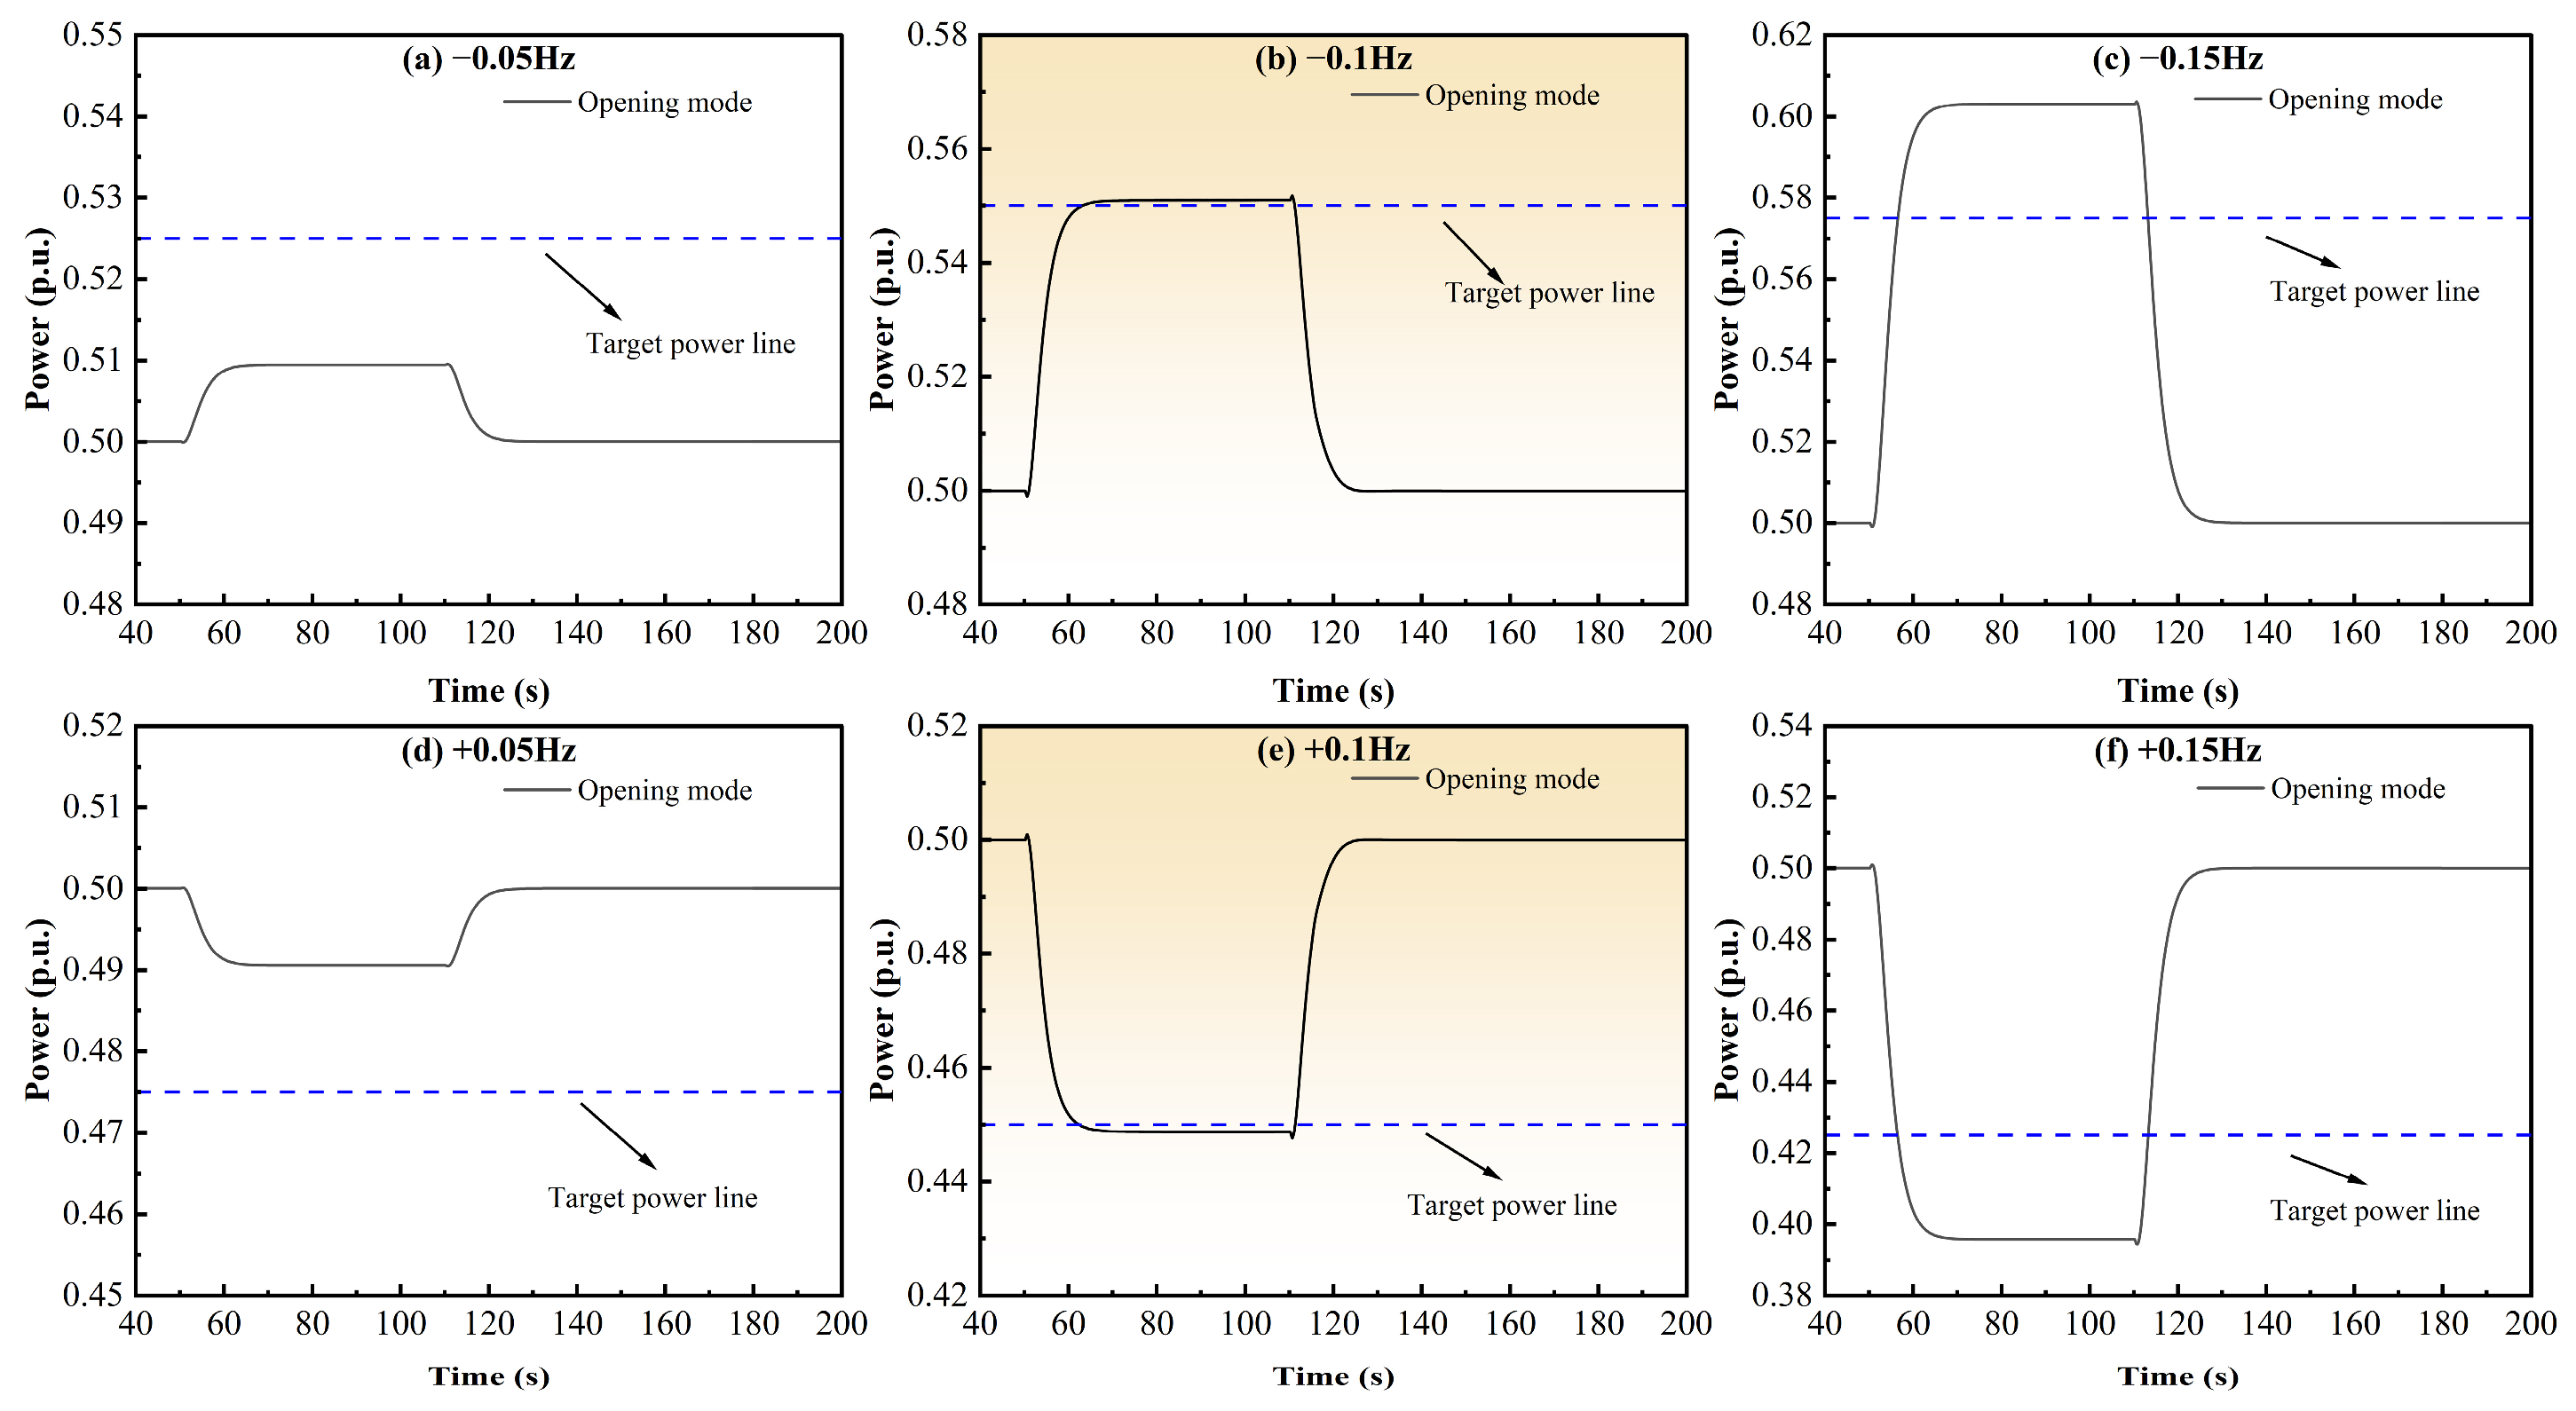
The unit is subjected to frequency step disturbances of ±0.05 Hz, ±0.1 Hz, and ±0.15 Hz, and the resulting power response curves are illustrated in Figure 9.
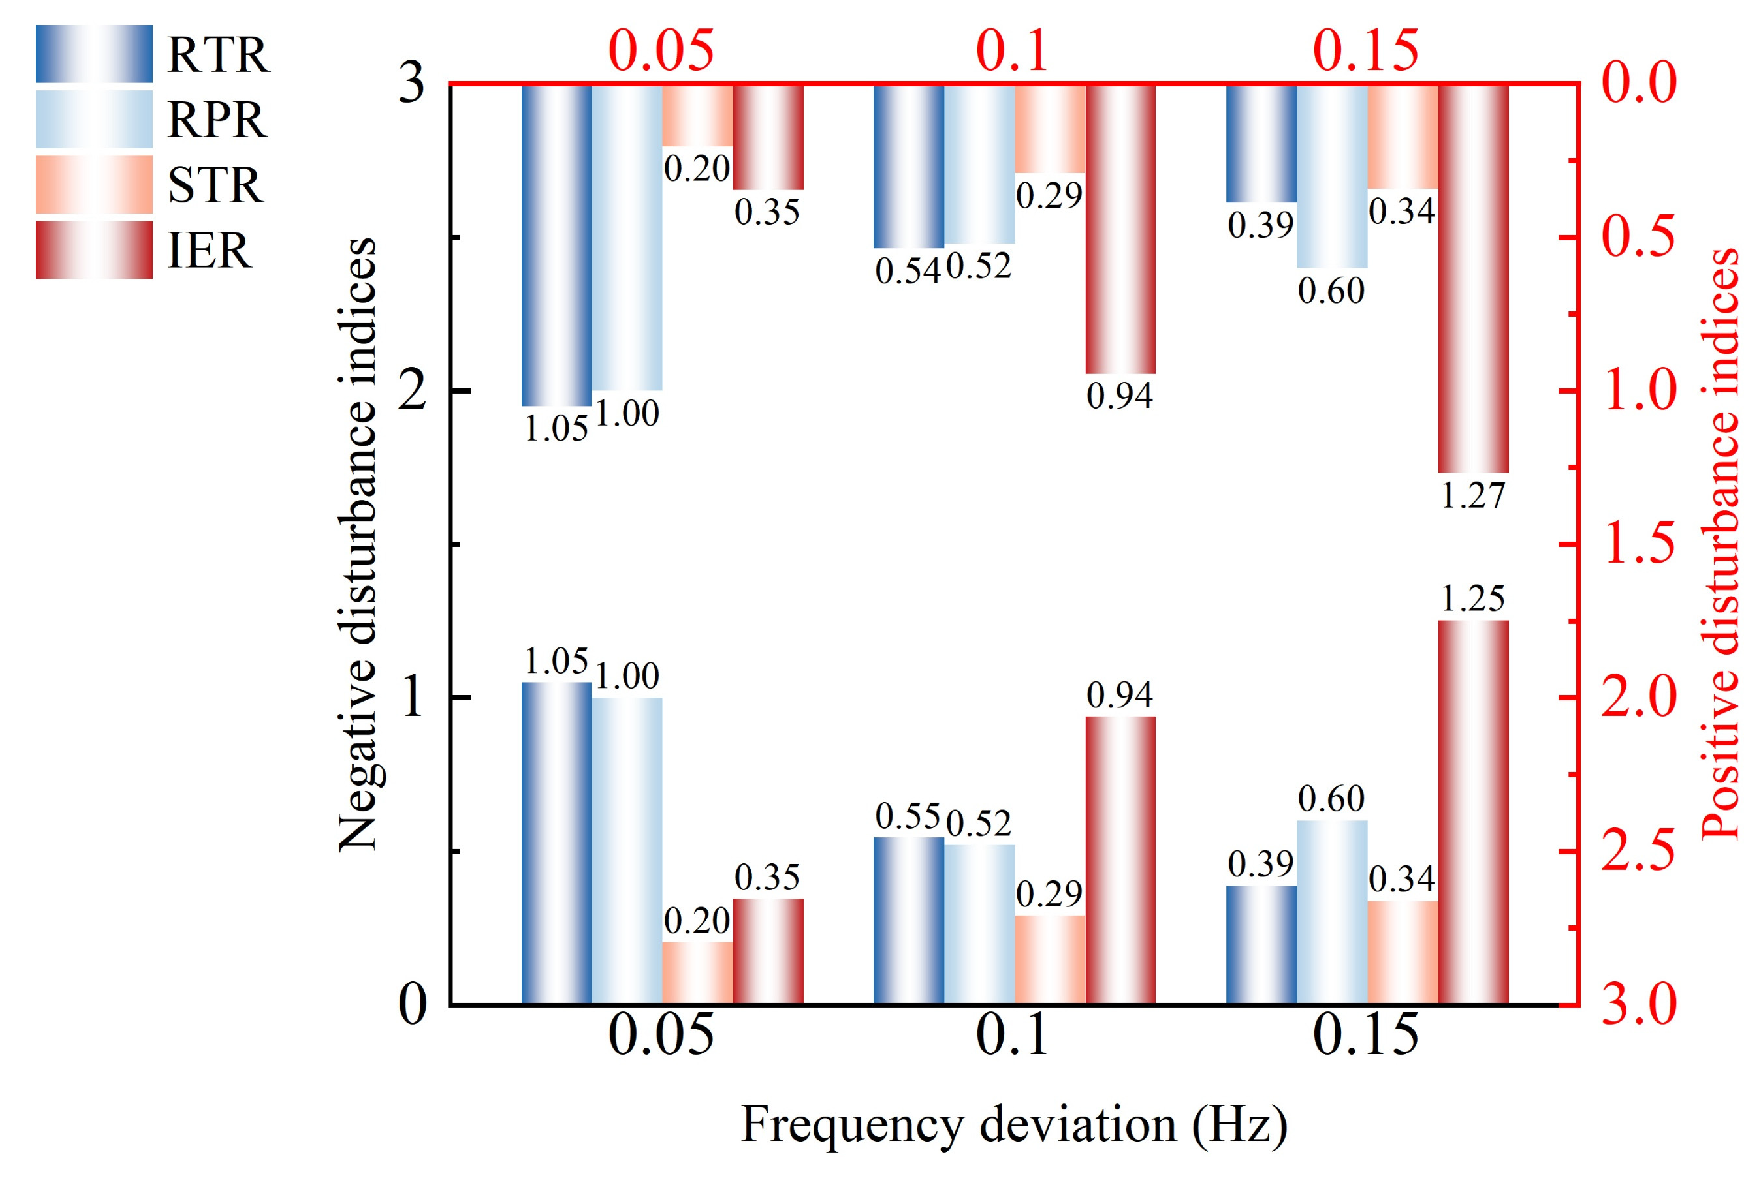
Based on Figure 9, the assessment index results calculated under different frequency disturbances are shown in Figure 10.
As illustrated in Figure 9 and Figure 10, under a small frequency deviation disturbance of 0.05 Hz, the unit exhibits severe under-response characteristics, causing both the rise-time ratio and the integrated energy ratio indices to fail the assessment requirements. Conversely, under a large frequency deviation disturbance of 0.15 Hz, the unit performs well, with all assessment indices satisfying compliance standards. In summary, the unit fails to meet the PFR assessment requirements under the 0.05 Hz frequency disturbance.

4. Operating-Condition-Dependent Feedforward Control Strategy

4.1. Feedforward Control Strategy Under Opening Mode

Based on the analysis in Section 3.1, conventional fixed-parameter PID controllers under the opening mode rely on a linear assumption between frequency deviation and guide vane opening. Their regulation performance degrades noticeably under wide-range operating conditions, and manual retuning of PID parameters is generally required for different water heads and loads to meet PFR compliance standards.
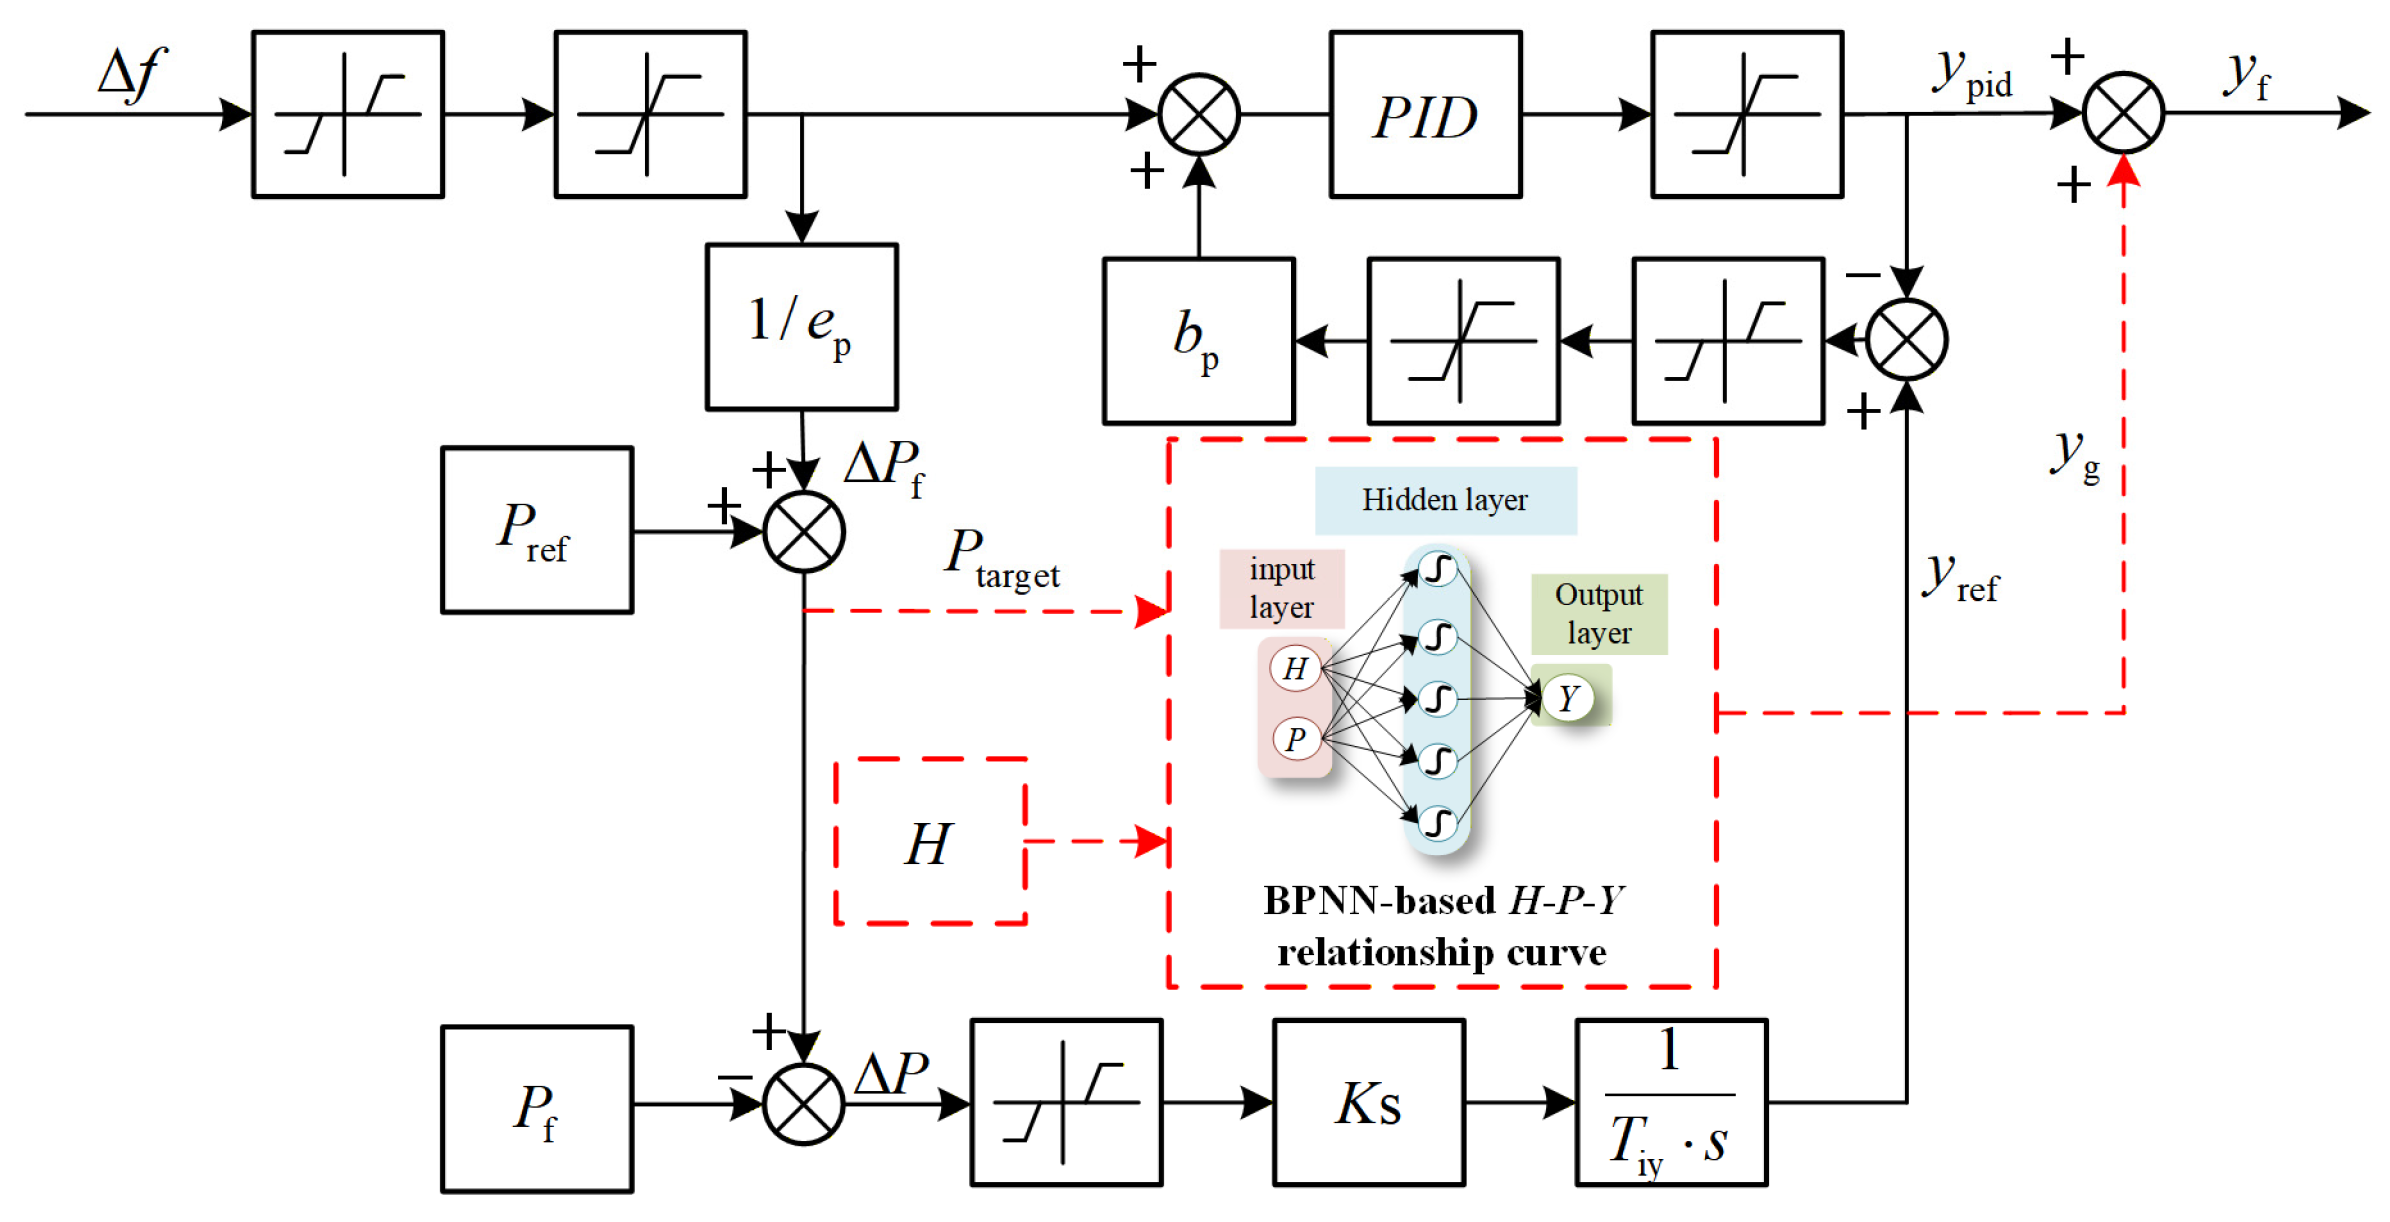
To address this limitation, this paper proposes a feedforward–feedback composite control framework. An offline-trained backpropagation neural network (BPNN) is constructed to characterize the nonlinear head–power–opening (H-P-Y) mapping. The feedforward channel outputs an opening command matched to the current operating condition according to real-time water head and target power, achieving operating-condition-dependent feedforward compensation. Combined with the feedback correction of the PID controller, this strategy effectively mitigates the performance degradation of traditional PID control under variable working conditions. The optimized control block diagram for PFR is illustrated in Figure 11.
As shown in Figure 11, the entire control loop consists of two parallel channels: a BPNN-based feedforward channel and a PID-based feedback correction channel. The mathematical definitions of the core variables in the control strategy are elaborated as follows.
Ptarget is derived from the grid’s frequency deviation through the droop characteristic, with full consideration of the frequency deadband. First, the frequency deviation is processed by a deadband module to eliminate the interference of minor frequency fluctuations, as shown in Equation (7):
Δ f dead = Δ f Δ f db , Δ f > Δ f db 0 , Δ f Δ f db Δ f + Δ f db , Δ f < Δ f db
where Δ f denotes the grid frequency deviation, and Δ f db is the frequency deadband threshold, which is set to ± 0.04 Hz in this study.
The target power variation is then calculated based on the permanent speed droop coefficient e p , as shown in Equation (8):
Δ P f = P r e p Δ f dead
where P r is the rated power of the unit, and e p is set to 0.04 in this work.
Ptarget is obtained by superimposing the initial operating power Pref, as shown in Equation (9):
P target = P ref + Δ P f
The final guide vane opening command is jointly generated by the feedforward channel and the feedback channel. The definition of each opening variable is given as follows.
The reference opening y ref is generated by integrating the power deviation between the target power and the actual output power, which provides the regulation baseline for the feedback loop, as shown in Equation (10):
y ref = K s T iy 0 t P target ( τ ) P ( τ ) d τ
where Tiy is the integral time constant, Ks is the integral gain of the power deviation channel, and P ( τ ) is the real-time output power of the unit.
The feedforward opening command yg is directly output by the offline-trained BPNN model, taking the real-time water head H and target power Ptarget as inputs, as shown in Equation (11):
y g = f BPNN H , P target
where f BPNN ( ) represents the well-trained nonlinear mapping function of the BPNN.
The calculation of ypid is given in Equation (1).
The total guide vane opening command yf applied to the electro-hydraulic servo system is obtained by superimposing the feedforward opening and the feedback correction opening, as shown in Equation (12):
y f = y g + y pid
This strategy operates on a “feedforward-dominated, PID-supplemented” control mode. The system calculates the dynamic power target Ptarget from the grid’s frequency deviation. It then combines this with the real-time head H. Using the turbine’s three-dimensional characteristic curves, it directly solves for the corresponding feedforward opening command yg. Concurrently, a reference opening yref is generated by integrating the power deviation, which passes through a PID controller to yield the feedback correction command ypid. Finally, the feedforward-dominated command yg and the feedback correction command ypid are superimposed to form the total guide vane opening setpoint yf, thereby achieving rapid and precise frequency regulation. Through the operating-condition-dependent variation of the feedforward component, this mechanism ensures that the unit maintains superior PFR performance across diverse operating conditions, effectively mitigating the reliance on fixed control parameters.
The core component of the feedforward prediction adopted in this section is the head–power–opening (H-P-Y) characteristic curve of the hydro-turbine, which is generally fitted via a backpropagation neural network (BPNN). The BPNN employed herein contains 5 neurons in the hidden layer, and the total dataset is divided into a training set (70%), a validation set (15%), and a test set (15%). The input layer consists of two nodes corresponding to real-time water head and target power, while the output layer has one node representing the guide vane opening. The dataset is mainly derived from the comprehensive model characteristic curves provided by the manufacturer, with a total of approximately 6534 samples. The sampling ranges are 70–100 m for the water head, 5–95% of the rated power for power output, and 0–30° for guide vane opening. The dataset is randomly split into training, validation, and test sets at a ratio of 7:1.5:1.5. For data preprocessing, the min–max normalization method is applied to map both input and output variables into the interval [−1, 1], with independent normalization parameters for each variable. The hidden layer of the network adopts the tansig activation function, and a linear activation function is used for the output layer. The Levenberg–Marquardt algorithm is selected as the training algorithm, with the mean squared error (MSE) as the loss function, an initial learning rate of 0.01, and a maximum of 1000 training epochs. The network weights and biases are initialized using the Nguyen–Widrow method. Meanwhile, an early stopping mechanism based on the validation set is introduced: Training is terminated when the validation loss does not decrease for six consecutive epochs so as to prevent overfitting. Ultimately, the coefficient of determination (R2) values of the training, validation, and test sets all exceed 0.99. In addition, the relative prediction errors of the network at the operating boundaries of water head and load are all below 1%, indicating that the network achieves extremely high fitting accuracy and favorable boundary generalization ability for the H-P-Y characteristic surface. Furthermore, the primary task of the BPNN in this study is to fit the high-precision H-P-Y characteristic surface. Preliminary tests show that when the number of hidden layer neurons is set to five, the network is already capable of capturing the nonlinear patterns of hydro-turbine characteristics with exceptionally high accuracy (R2 > 0.99). Blindly increasing the number of neurons will not yield noticeable performance improvement; instead, it will increase the computational burden. Therefore, taking into account both the online real-time computational efficiency and the generalization capability of the control system, the compact structure with five hidden neurons is determined as the optimal choice.

4.2. Comparison of Primary Frequency Regulation Performance Under WRO

In addition to comparing the performance of the feedforward control strategy with that of conventional primary frequency regulation under the opening mode across the operating conditions covered in Section 3.2, this section further expands the operating range from three dimensions—water head, load, and frequency deviation—to investigate the adaptability of the proposed strategy under wide-range operating conditions. The specific operating conditions are detailed in the respective subsections.

4.2.1. Analysis of Assessment Indices Under Different Heads

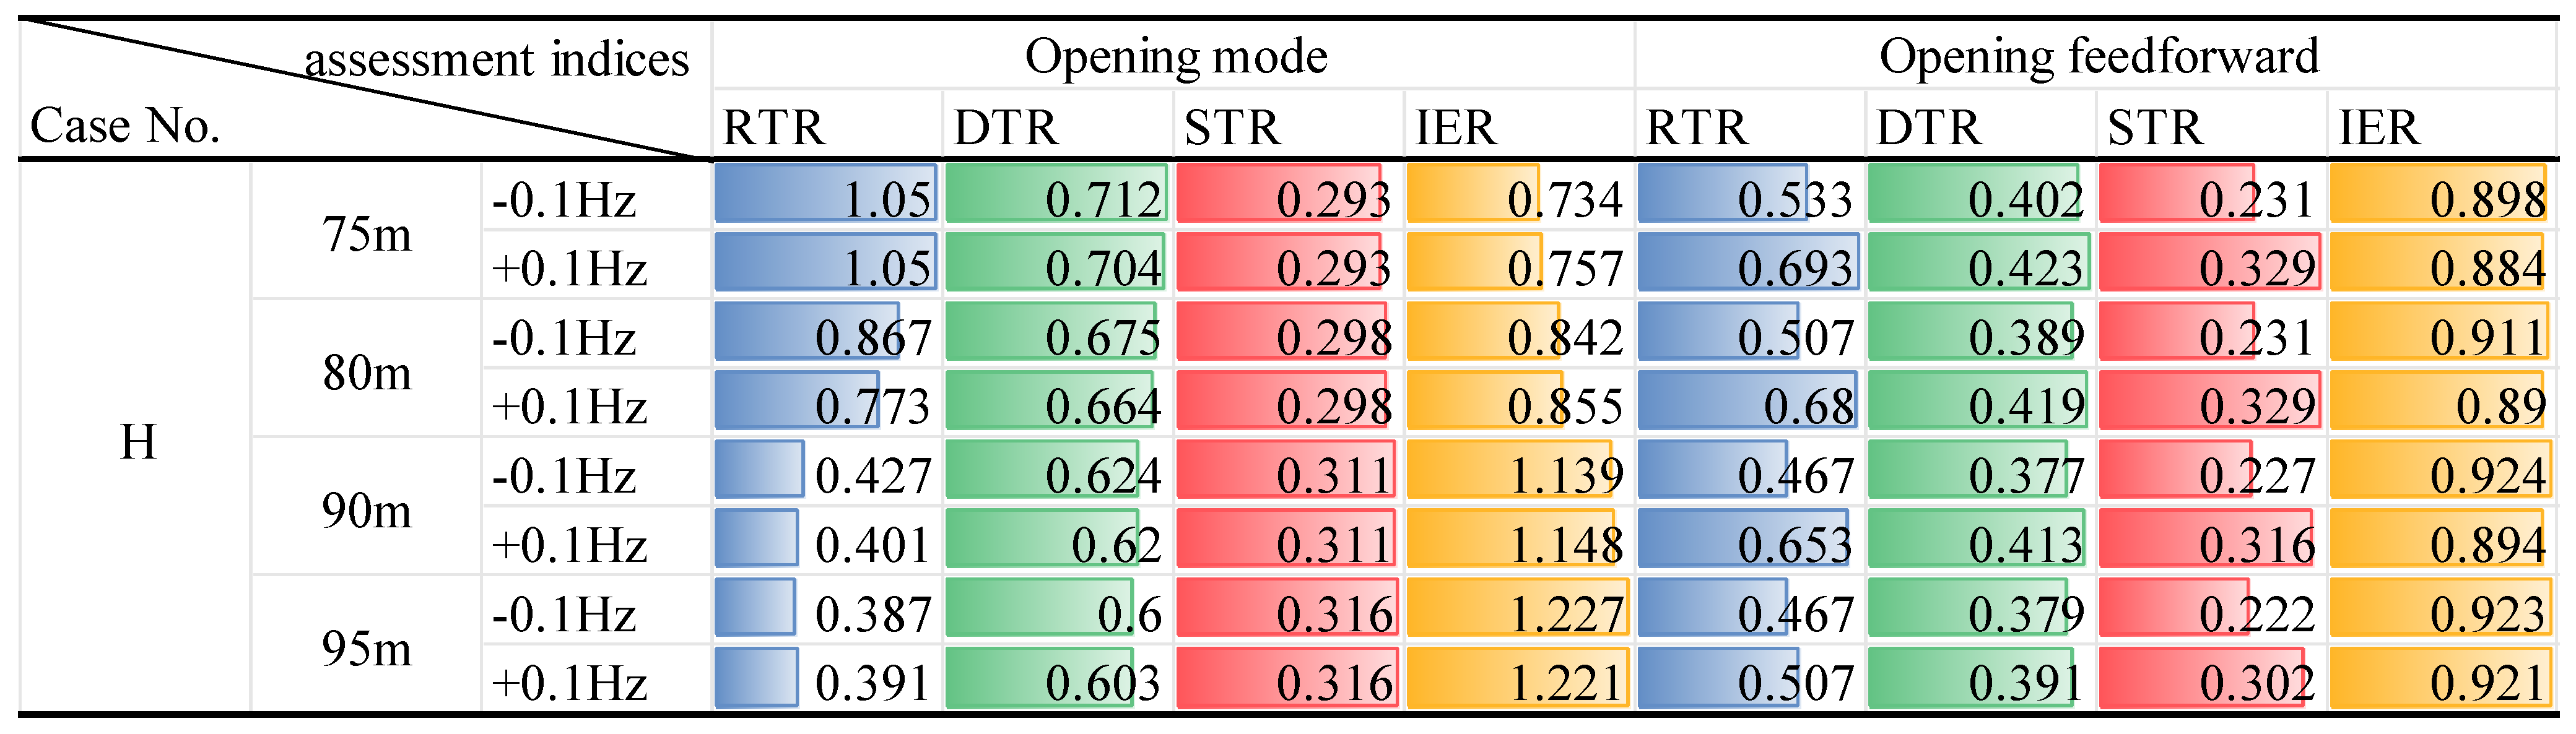
The simulation curves and assessment index comparisons presented in this section focus on typical examples of 70 m, 84.4 m, and 100 m; the simulation tests under different water head operating conditions are presented in Table 1. The comparison of the assessment index results under the remaining head conditions is provided in Figure 12.
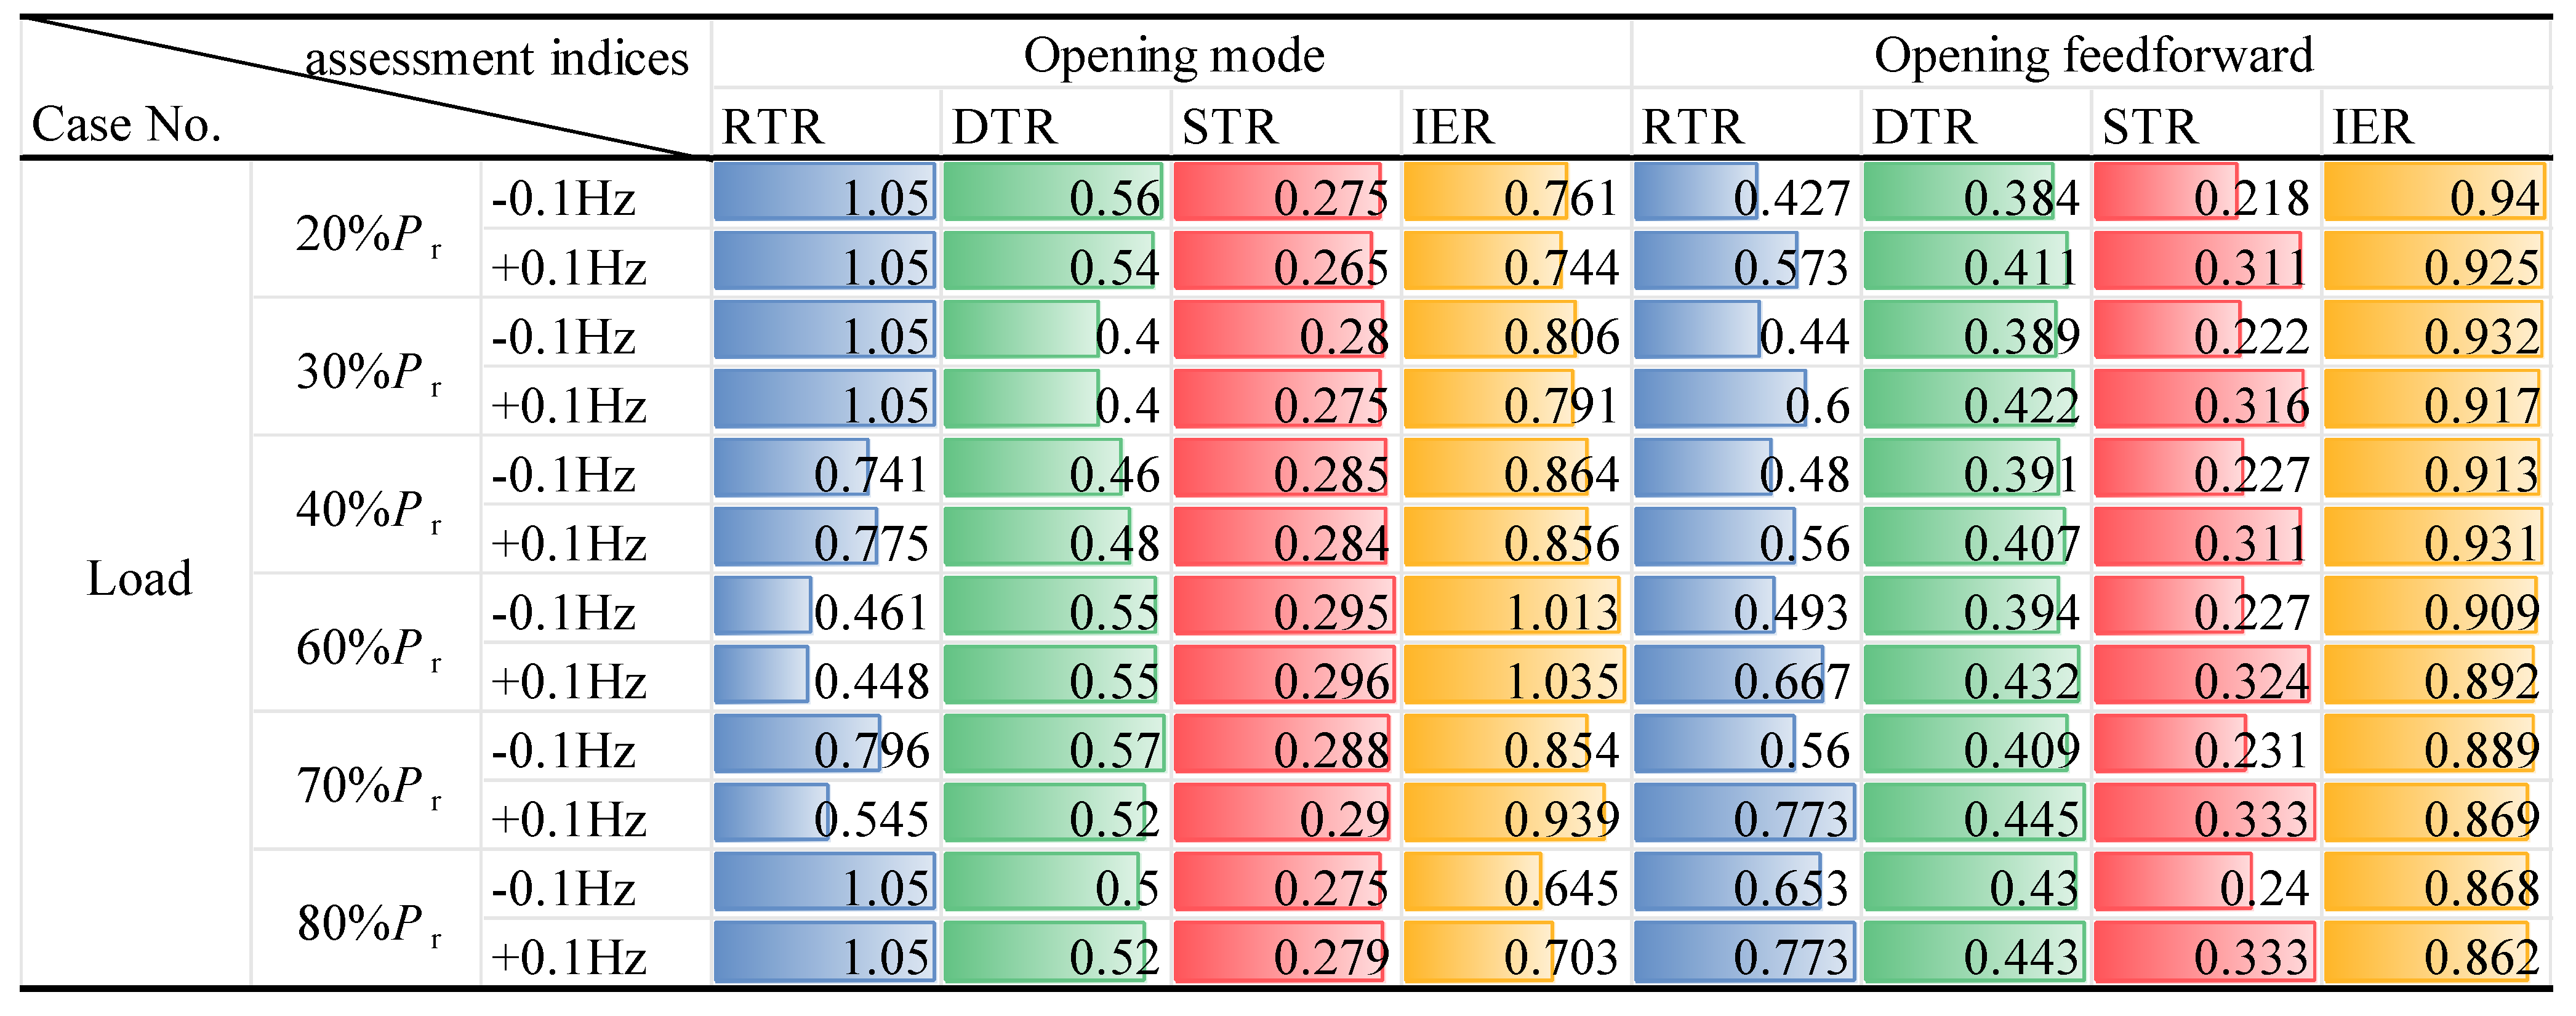
In Figure 12, the four colors represent the variation magnitudes of the RTR, DTR, STR, and RRR indicators, respectively; a larger indicator value corresponds to a longer coverage. The same applies to Figures 15 and 18.
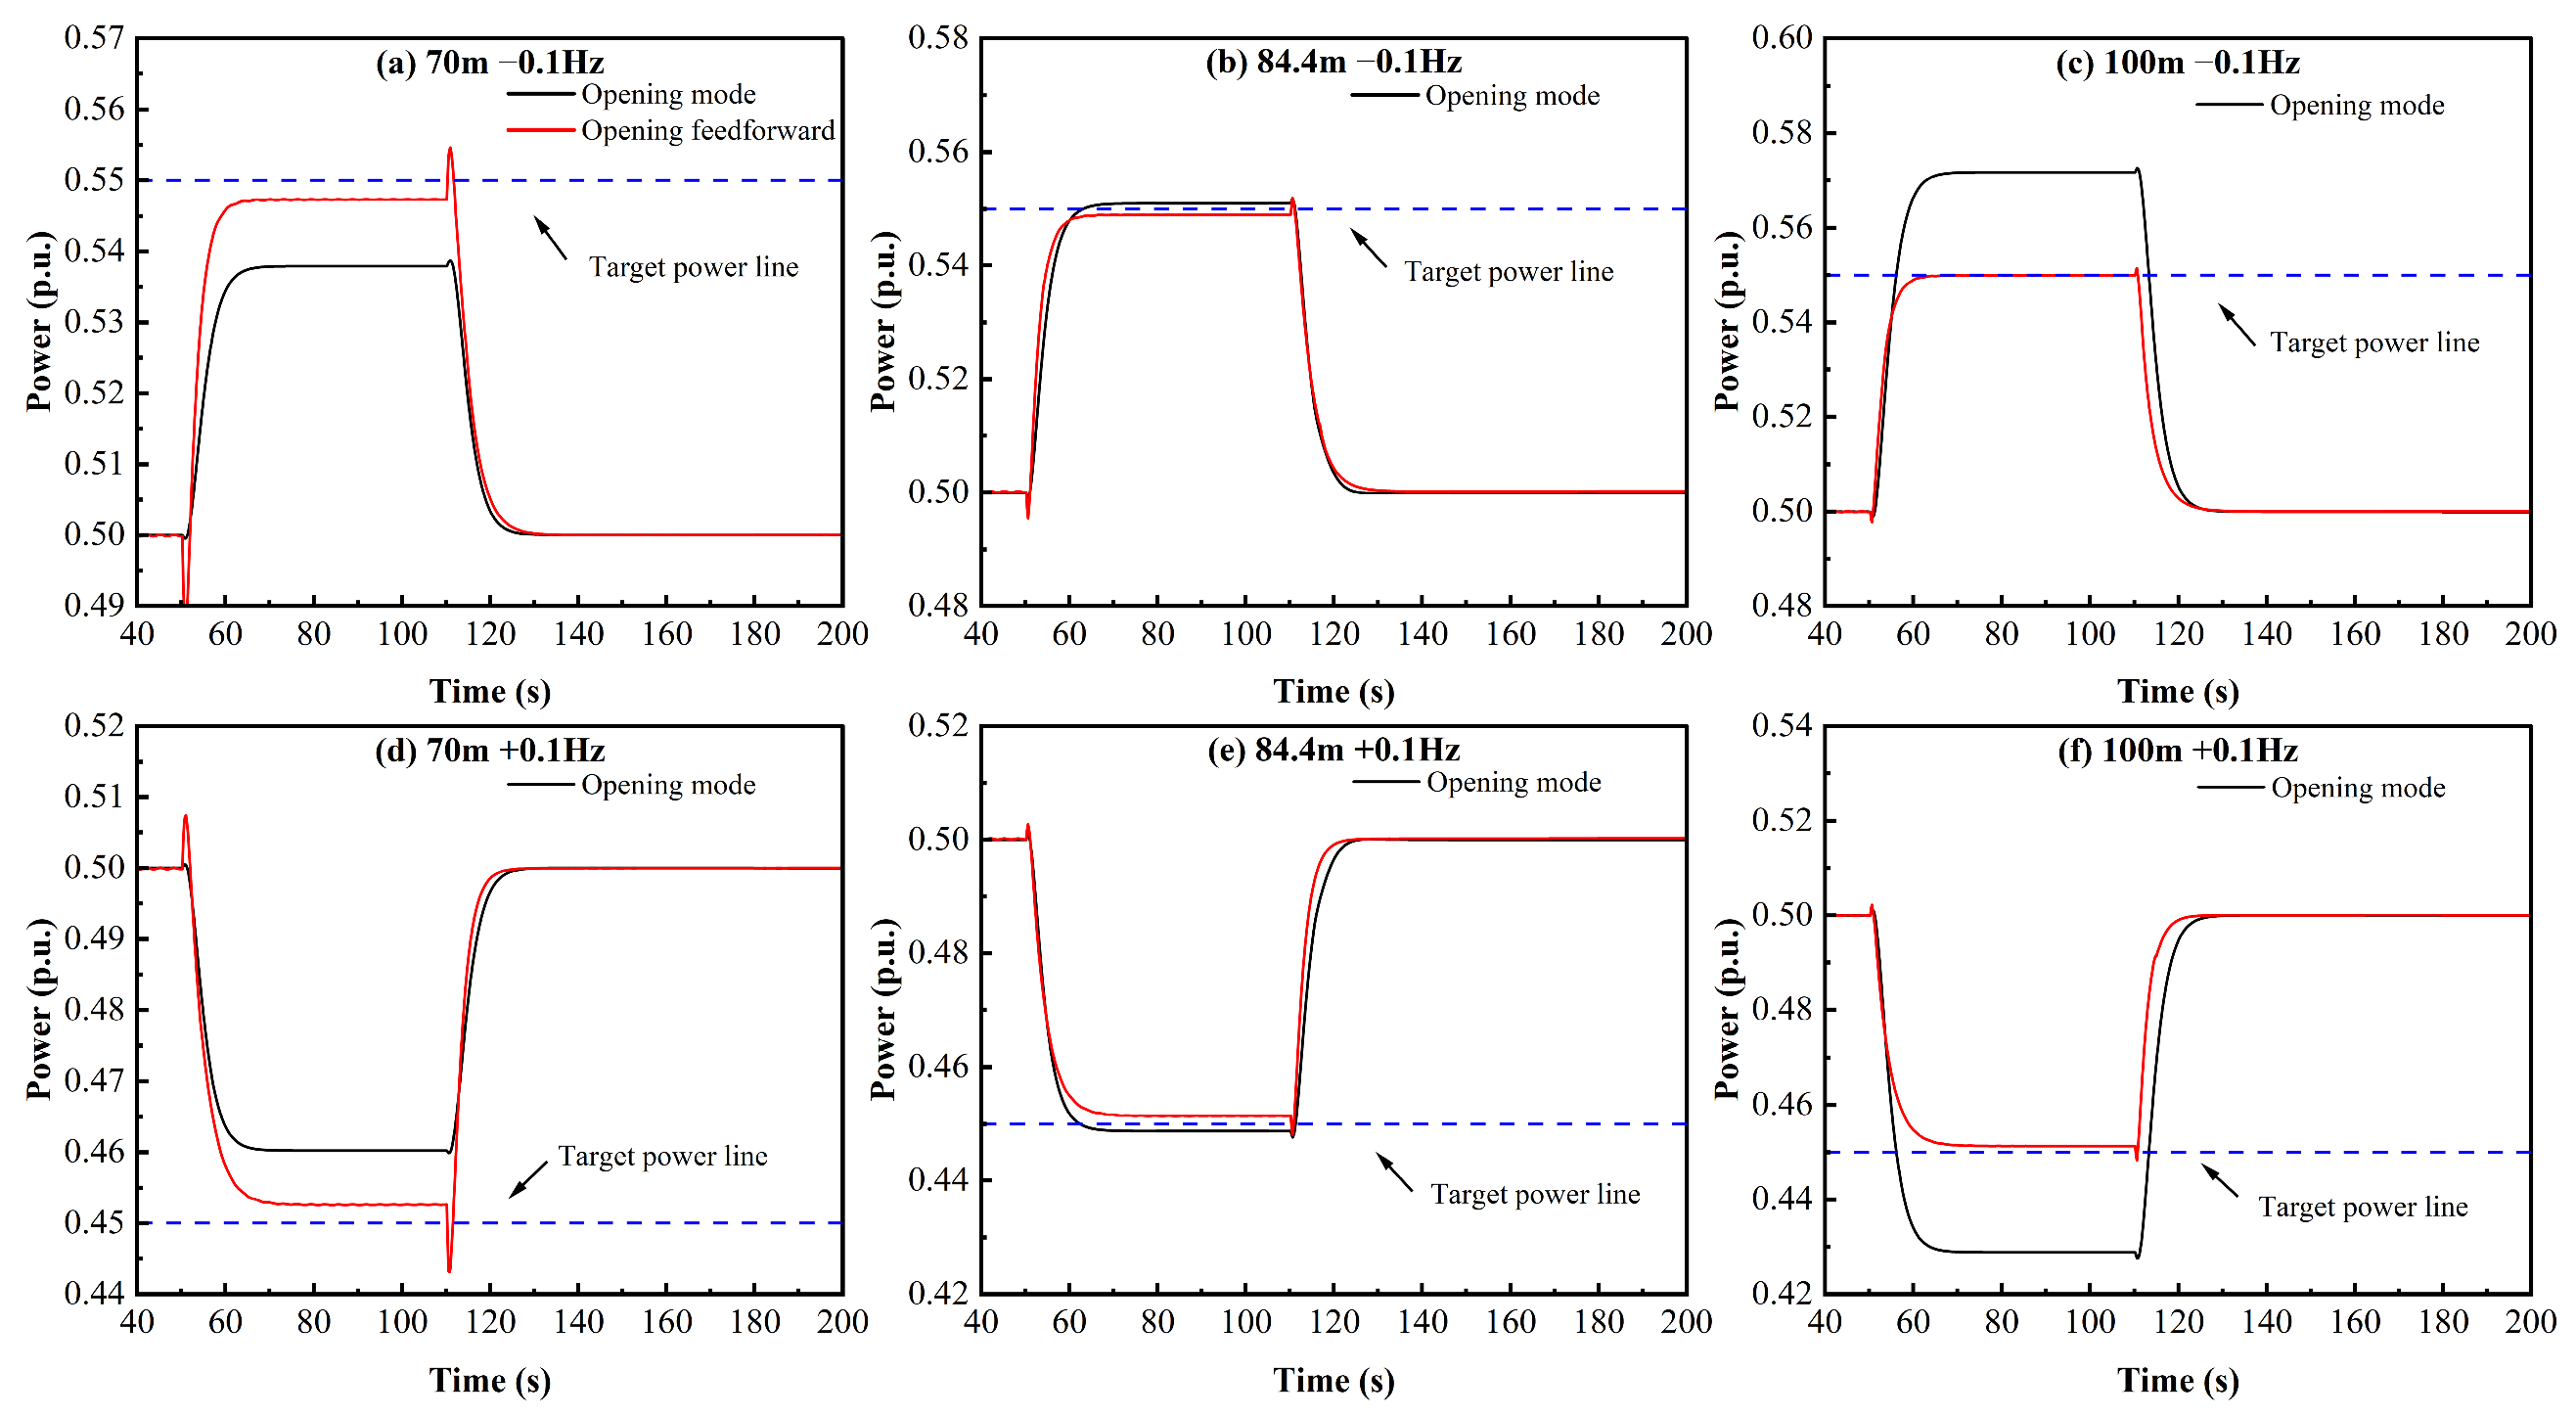
The PFR performance comparison curves between the traditional opening mode and the opening feedforward mode under different heads are illustrated in Figure 13.
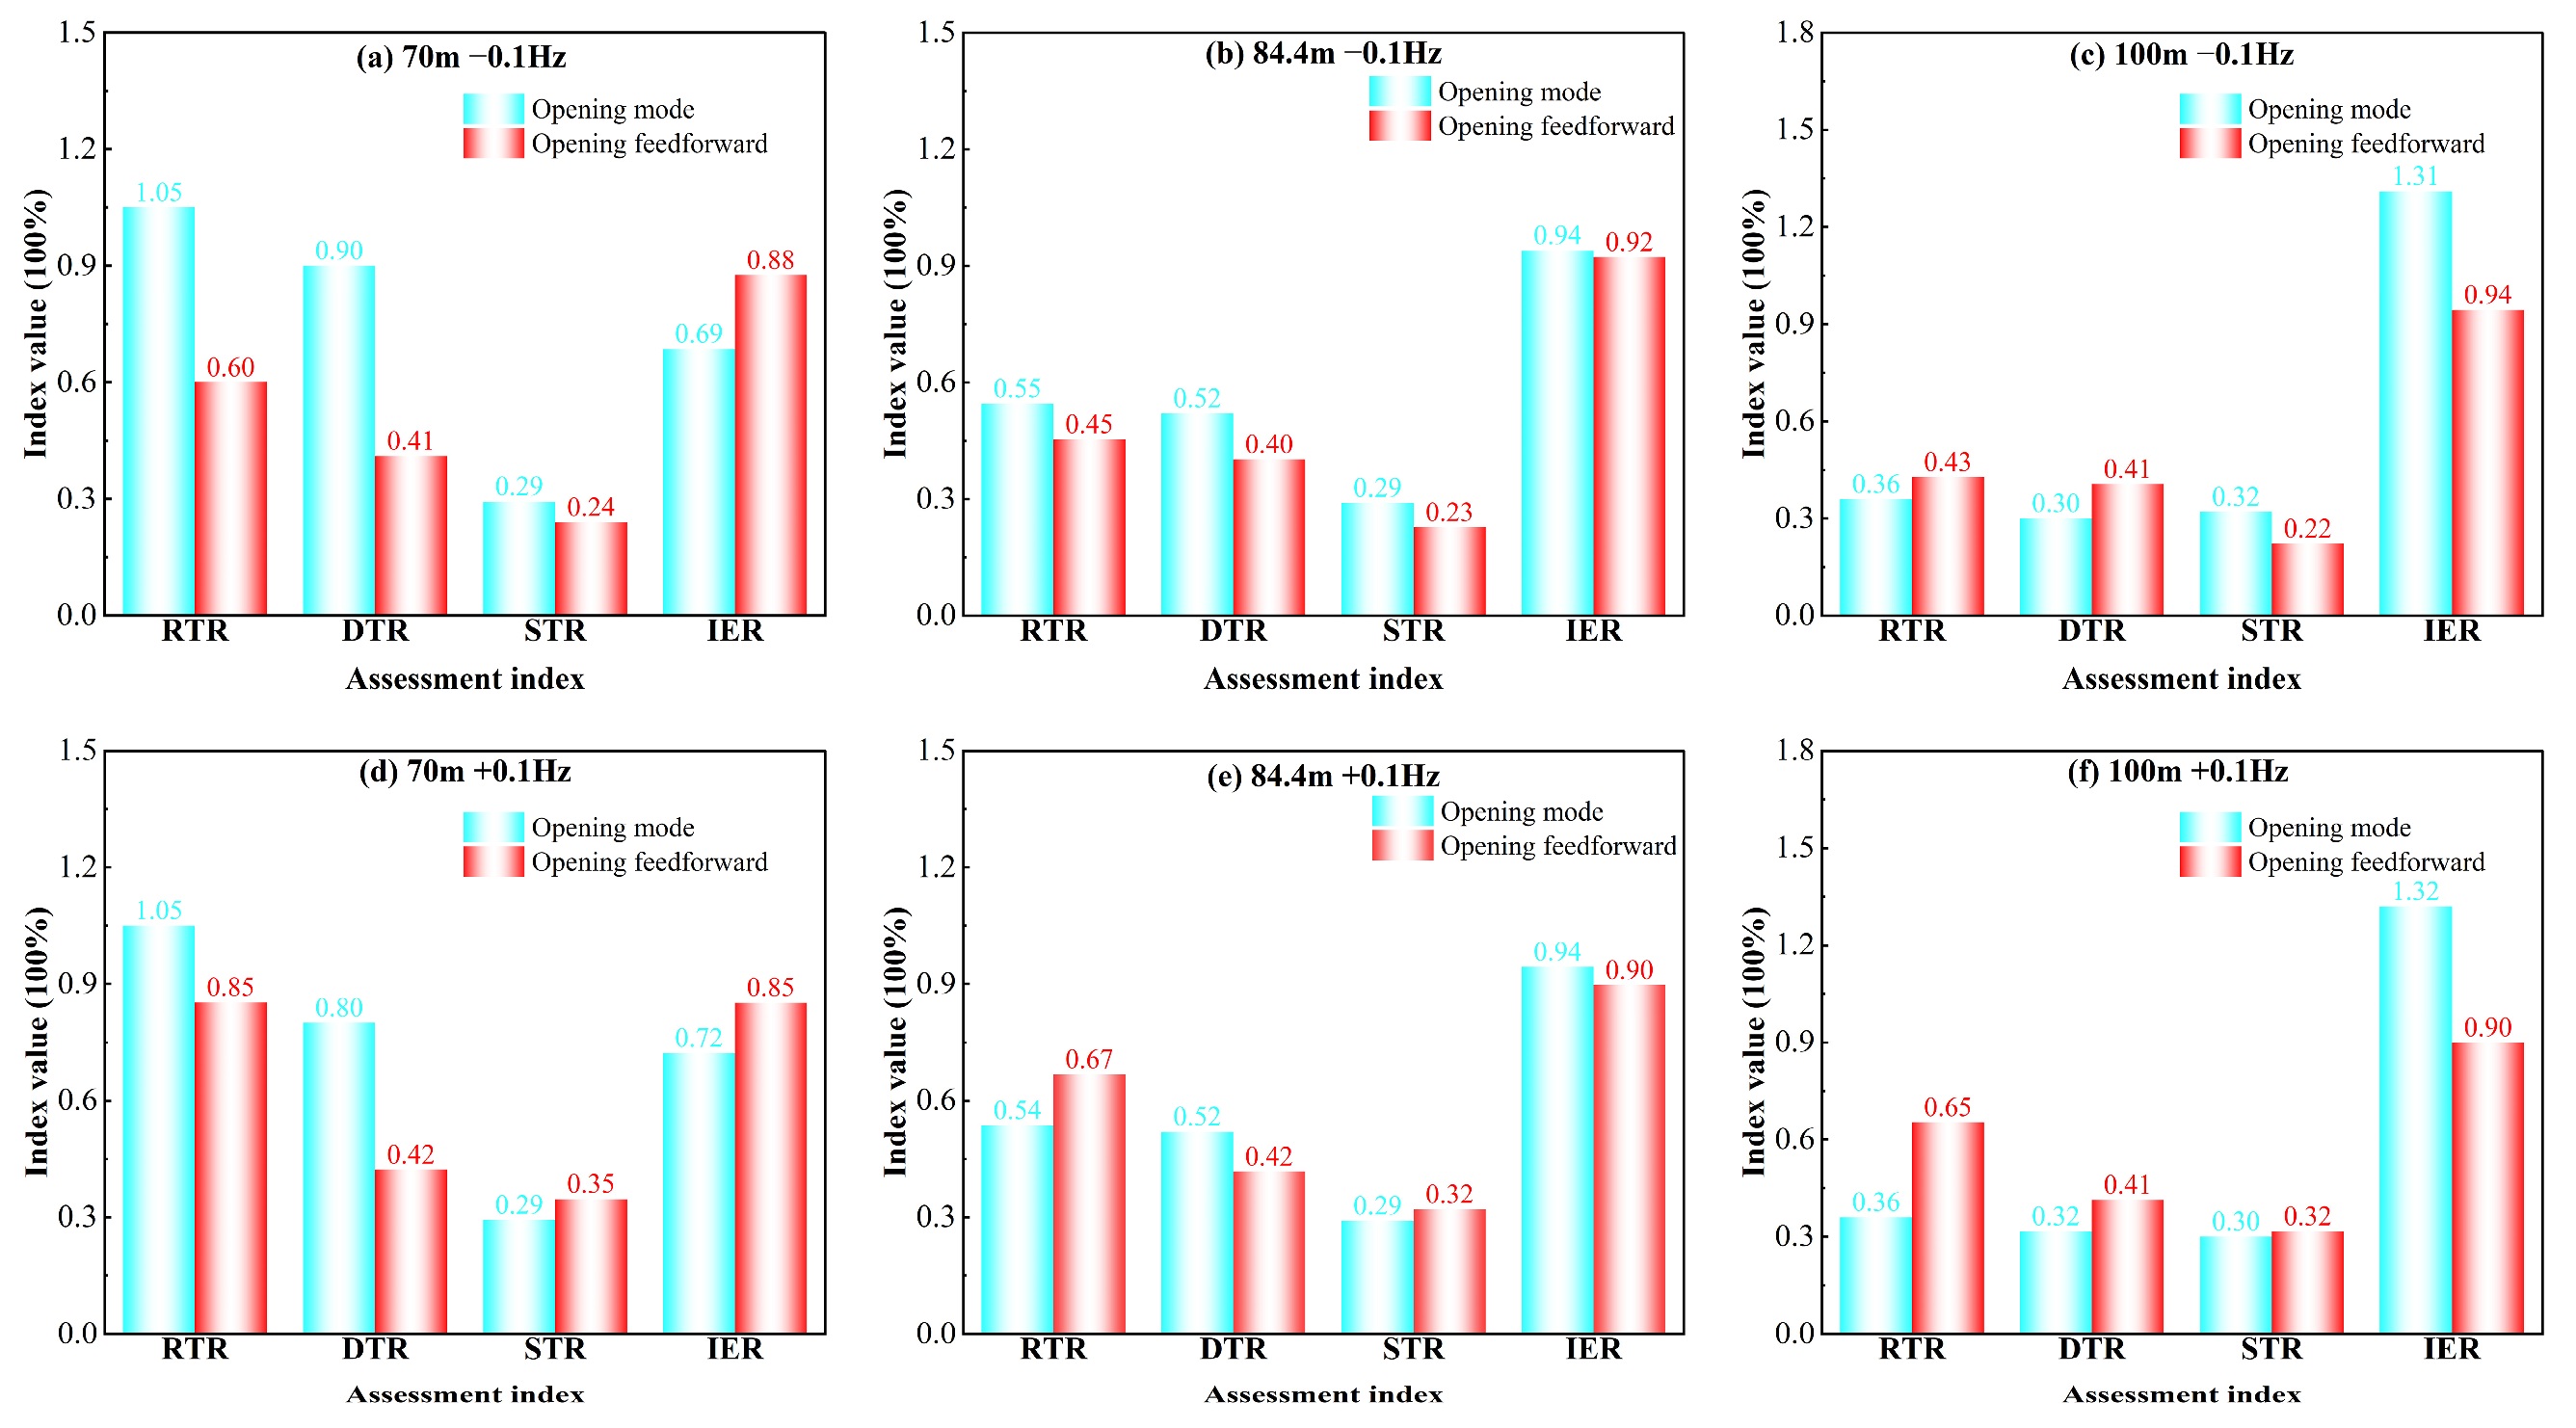
A comparison of the assessment indices calculated based on Figure 13 is illustrated in Figure 14.
As illustrated in Figure 13 and Figure 14, the traditional opening mode fails to meet the PFR assessment standards under both the 70 m low-head and 100 m high-head conditions. In contrast, the feedforward control method under the opening mode achieves real-time dynamic compensation for water head variations, effectively mitigating the impact of head fluctuations on the power response. On the premise that the frequency-regulation assessment indices are satisfied under various water-head operating conditions, the maximum reduction in RTR reaches 33.29%, the maximum reduction in DTR reaches 54.44%, and the maximum increase in IER reaches 27.54% under the low water-head condition of 70 m. This strategy maintains highly consistent rapidity, precision, and superior regulation quality across the entire operating head range.
A comparison of the frequency regulation performance index results under other head conditions is presented in Figure 12.

4.2.2. Analysis of Assessment Indices Under Different Initial Loads

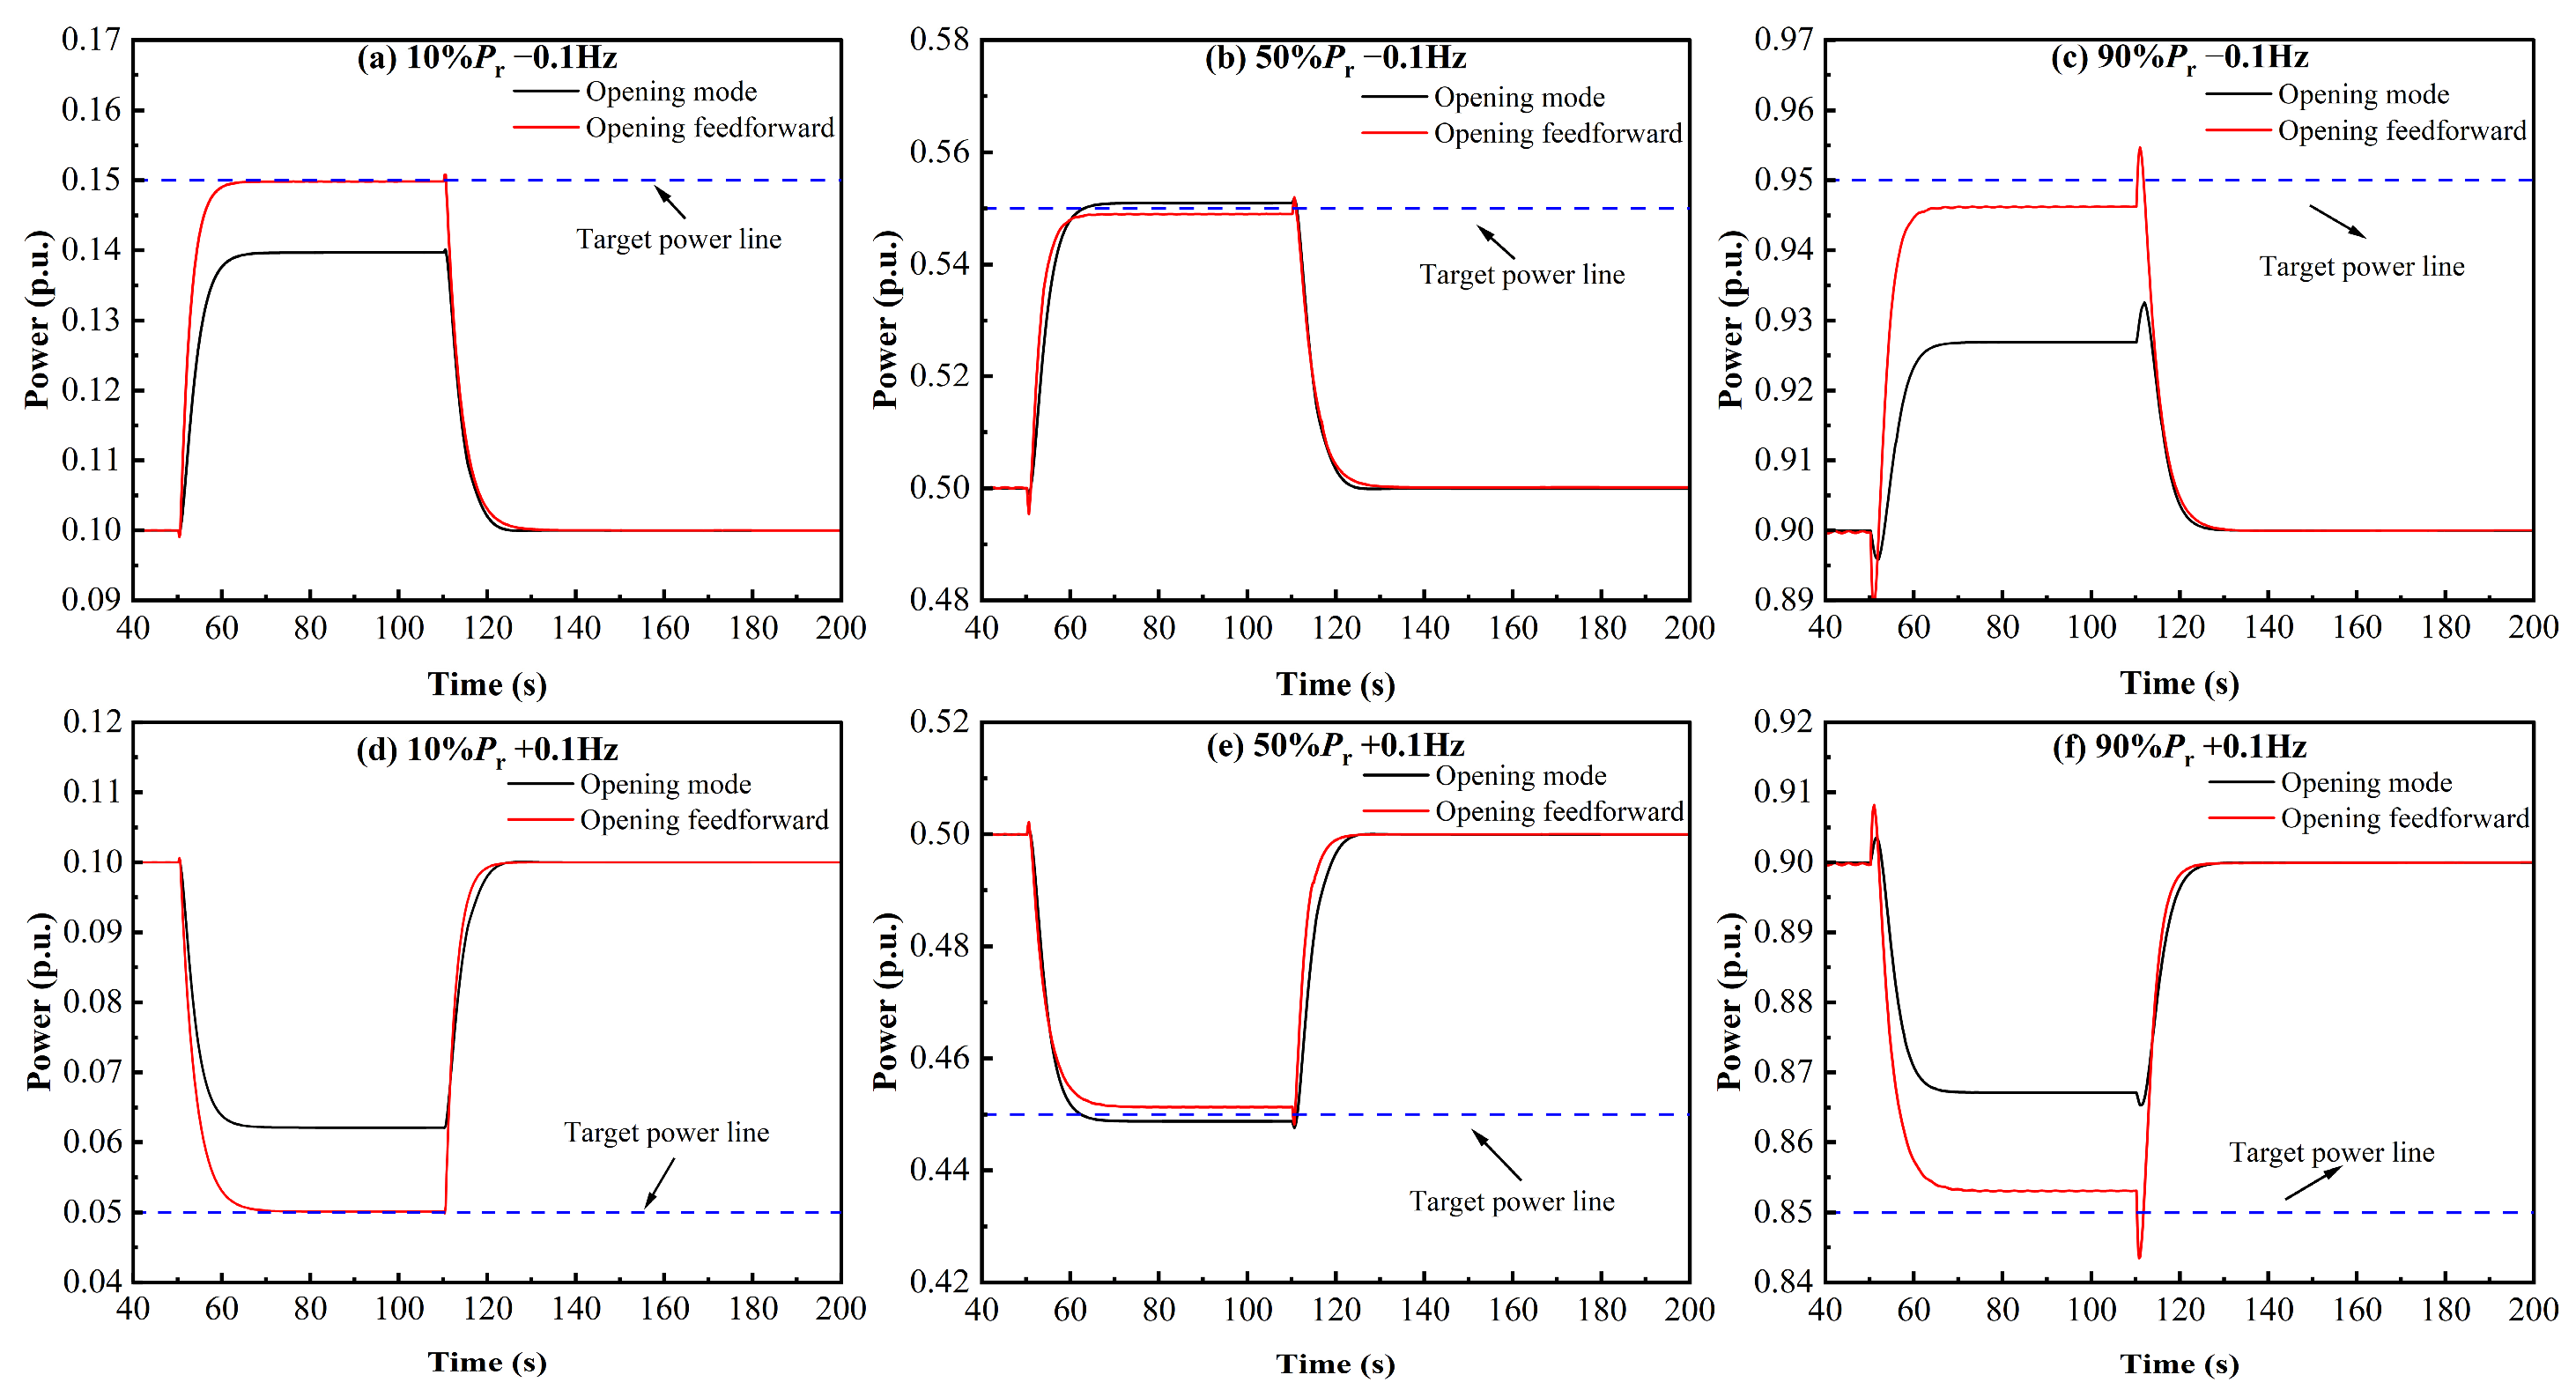
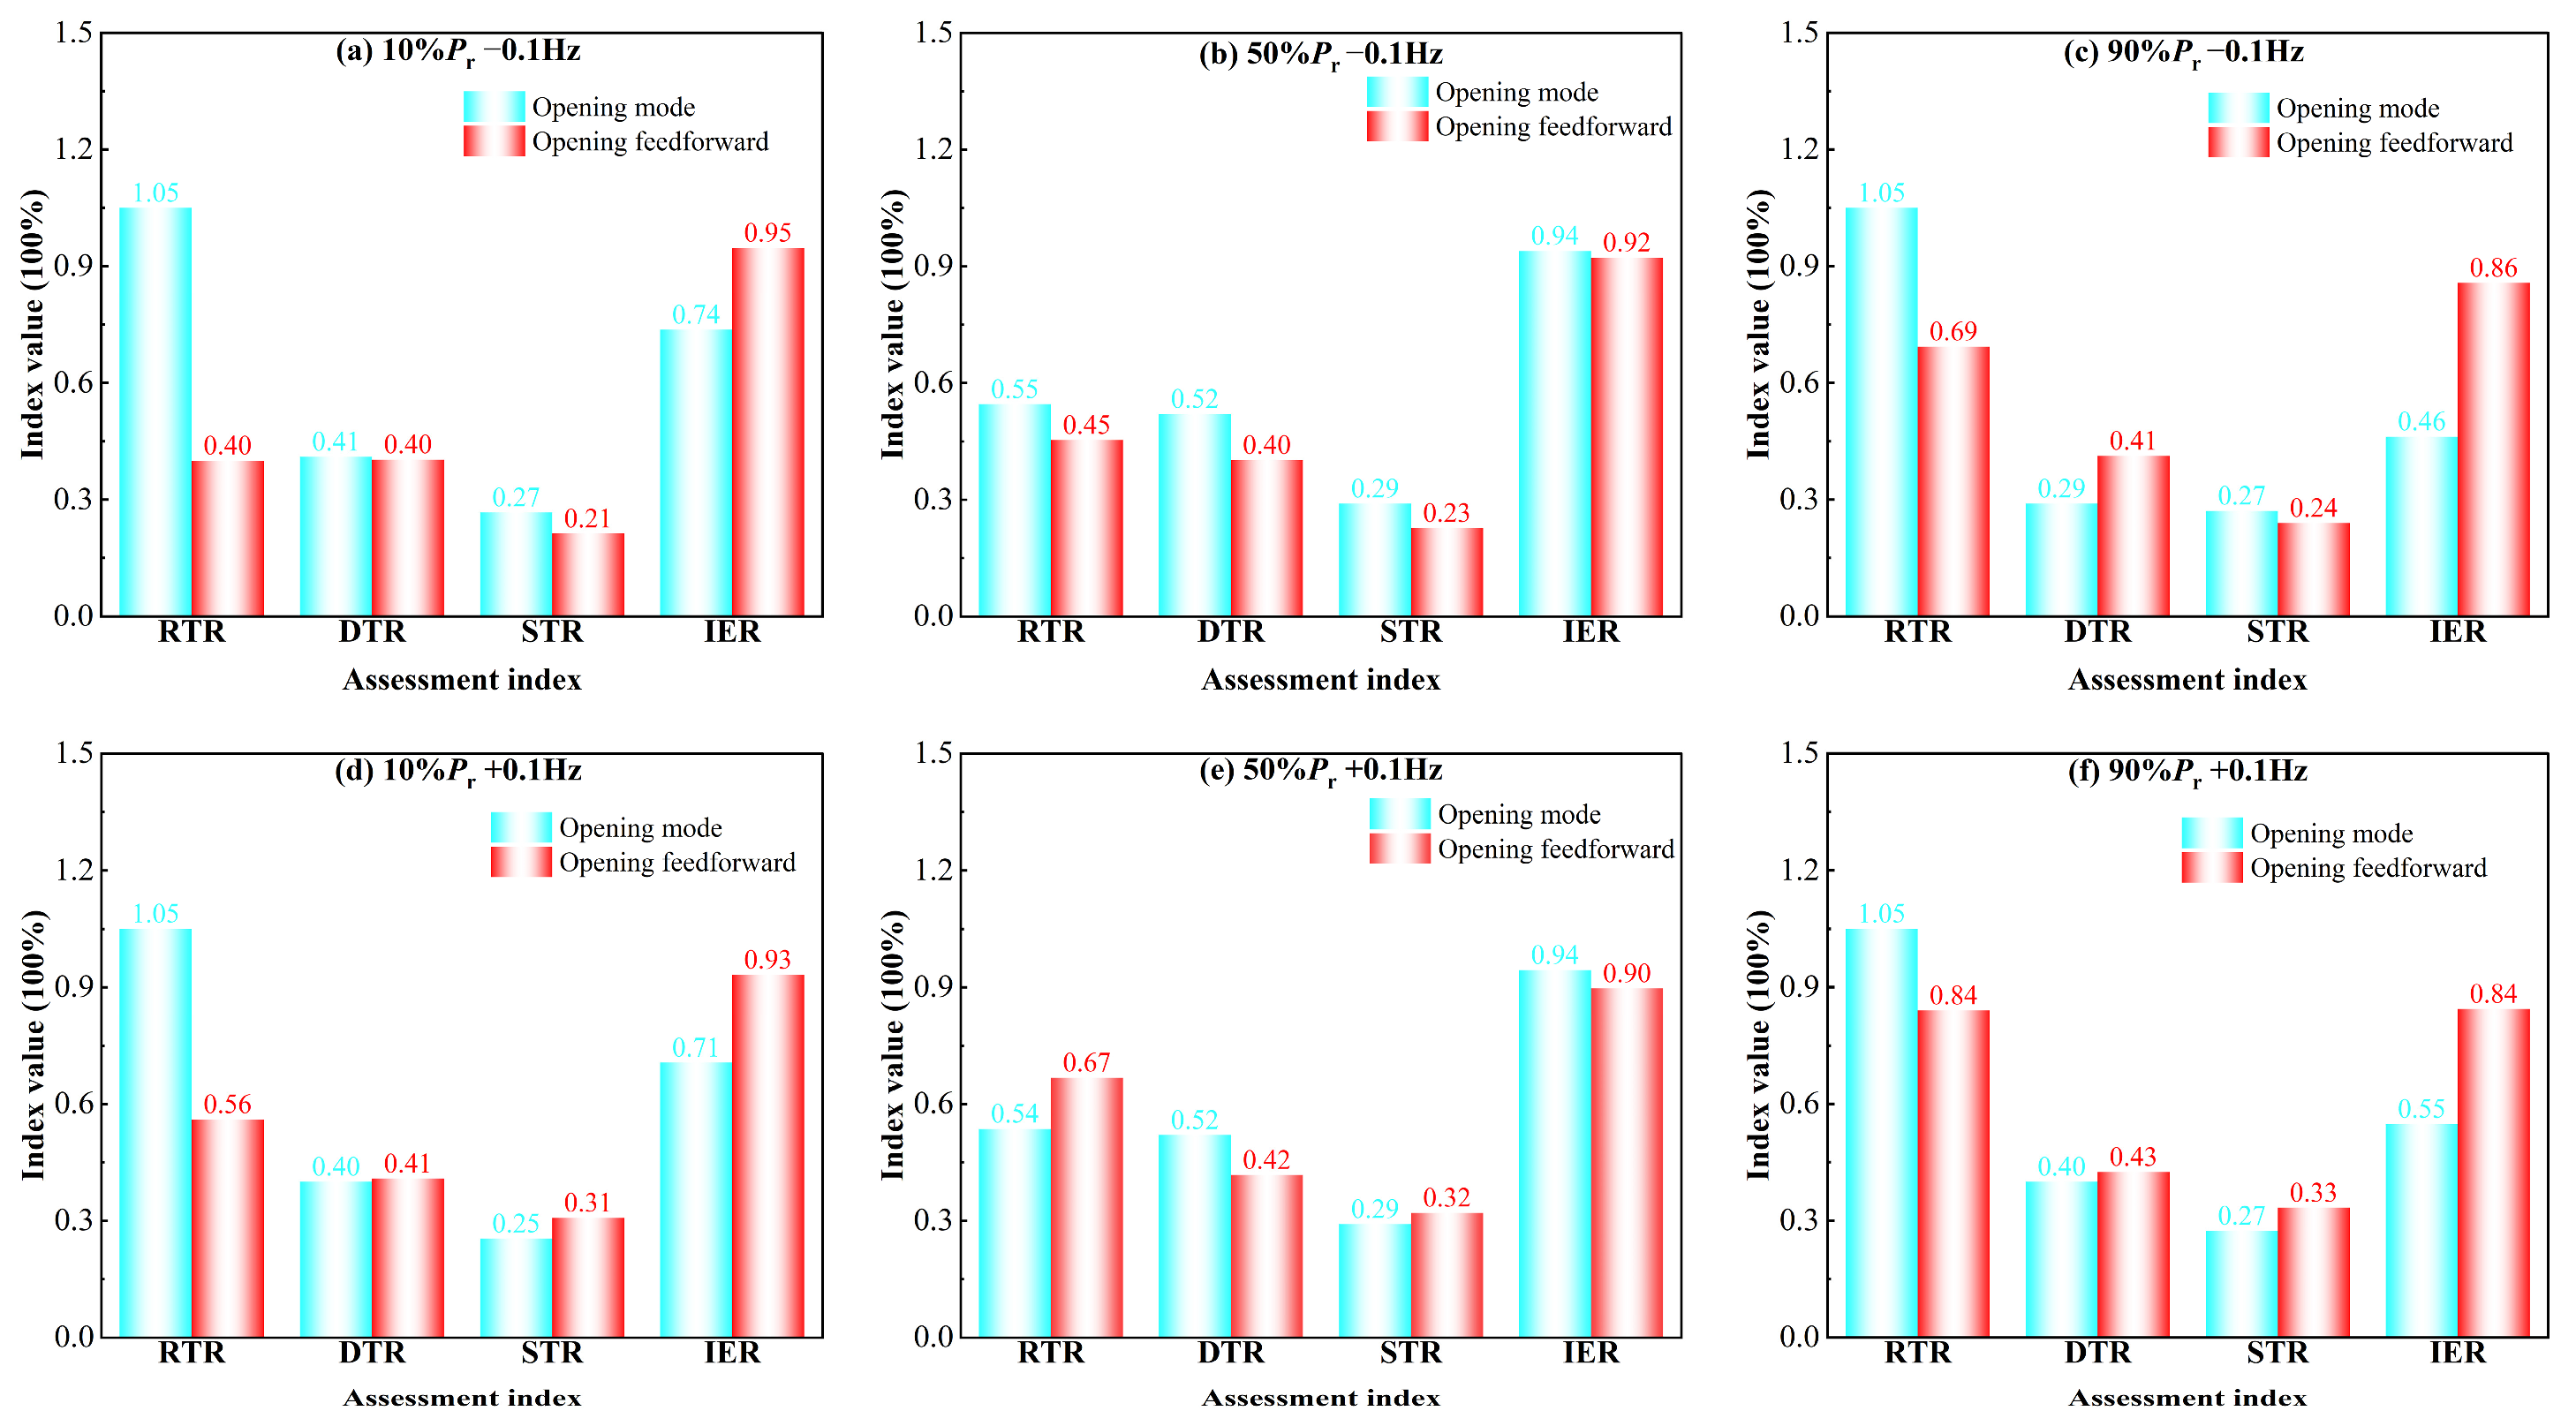
The simulation curves and assessment index comparisons presented in this section focus on typical examples of the unit operating at 10%Pr, 50%Pr, and 90%Pr; the simulation tests under different load operating conditions are presented in Table 2. The comparison of the assessment index results under the remaining load conditions is provided in Figure 15.
The PFR performance comparison curves between the traditional opening mode and the opening feedforward mode under different initial unit loads are illustrated in Figure 16.
A comparison of the assessment indices calculated based on Figure 16 is illustrated in Figure 17.
As illustrated in Figure 16 and Figure 17, the traditional opening mode fails to meet the PFR assessment standards under both the 10%Pr low-load and 90%Pr high-load regions. In contrast, the feedforward control method under the opening mode achieves real-time dynamic compensation for load variations, effectively mitigating the impact of load fluctuations on the power response. On the premise that frequency-regulation assessment criteria are satisfied under all load conditions, the maximum RTR reduction reaches 61.9%, and the maximum IER improvement reaches 30.99% under the low-load condition of 10%Pr; under the high-load condition of 90%Pr, the maximum RTR reduction is 34.29%, and the maximum IER improvement reaches 86.96%. This strategy maintains highly consistent rapidity, precision, and superior regulation quality across the entire operating load range.
A comparison of the frequency regulation performance index results under other load conditions is presented in Figure 15.

4.2.3. Analysis of Assessment Indices Under Different Frequency Deviations

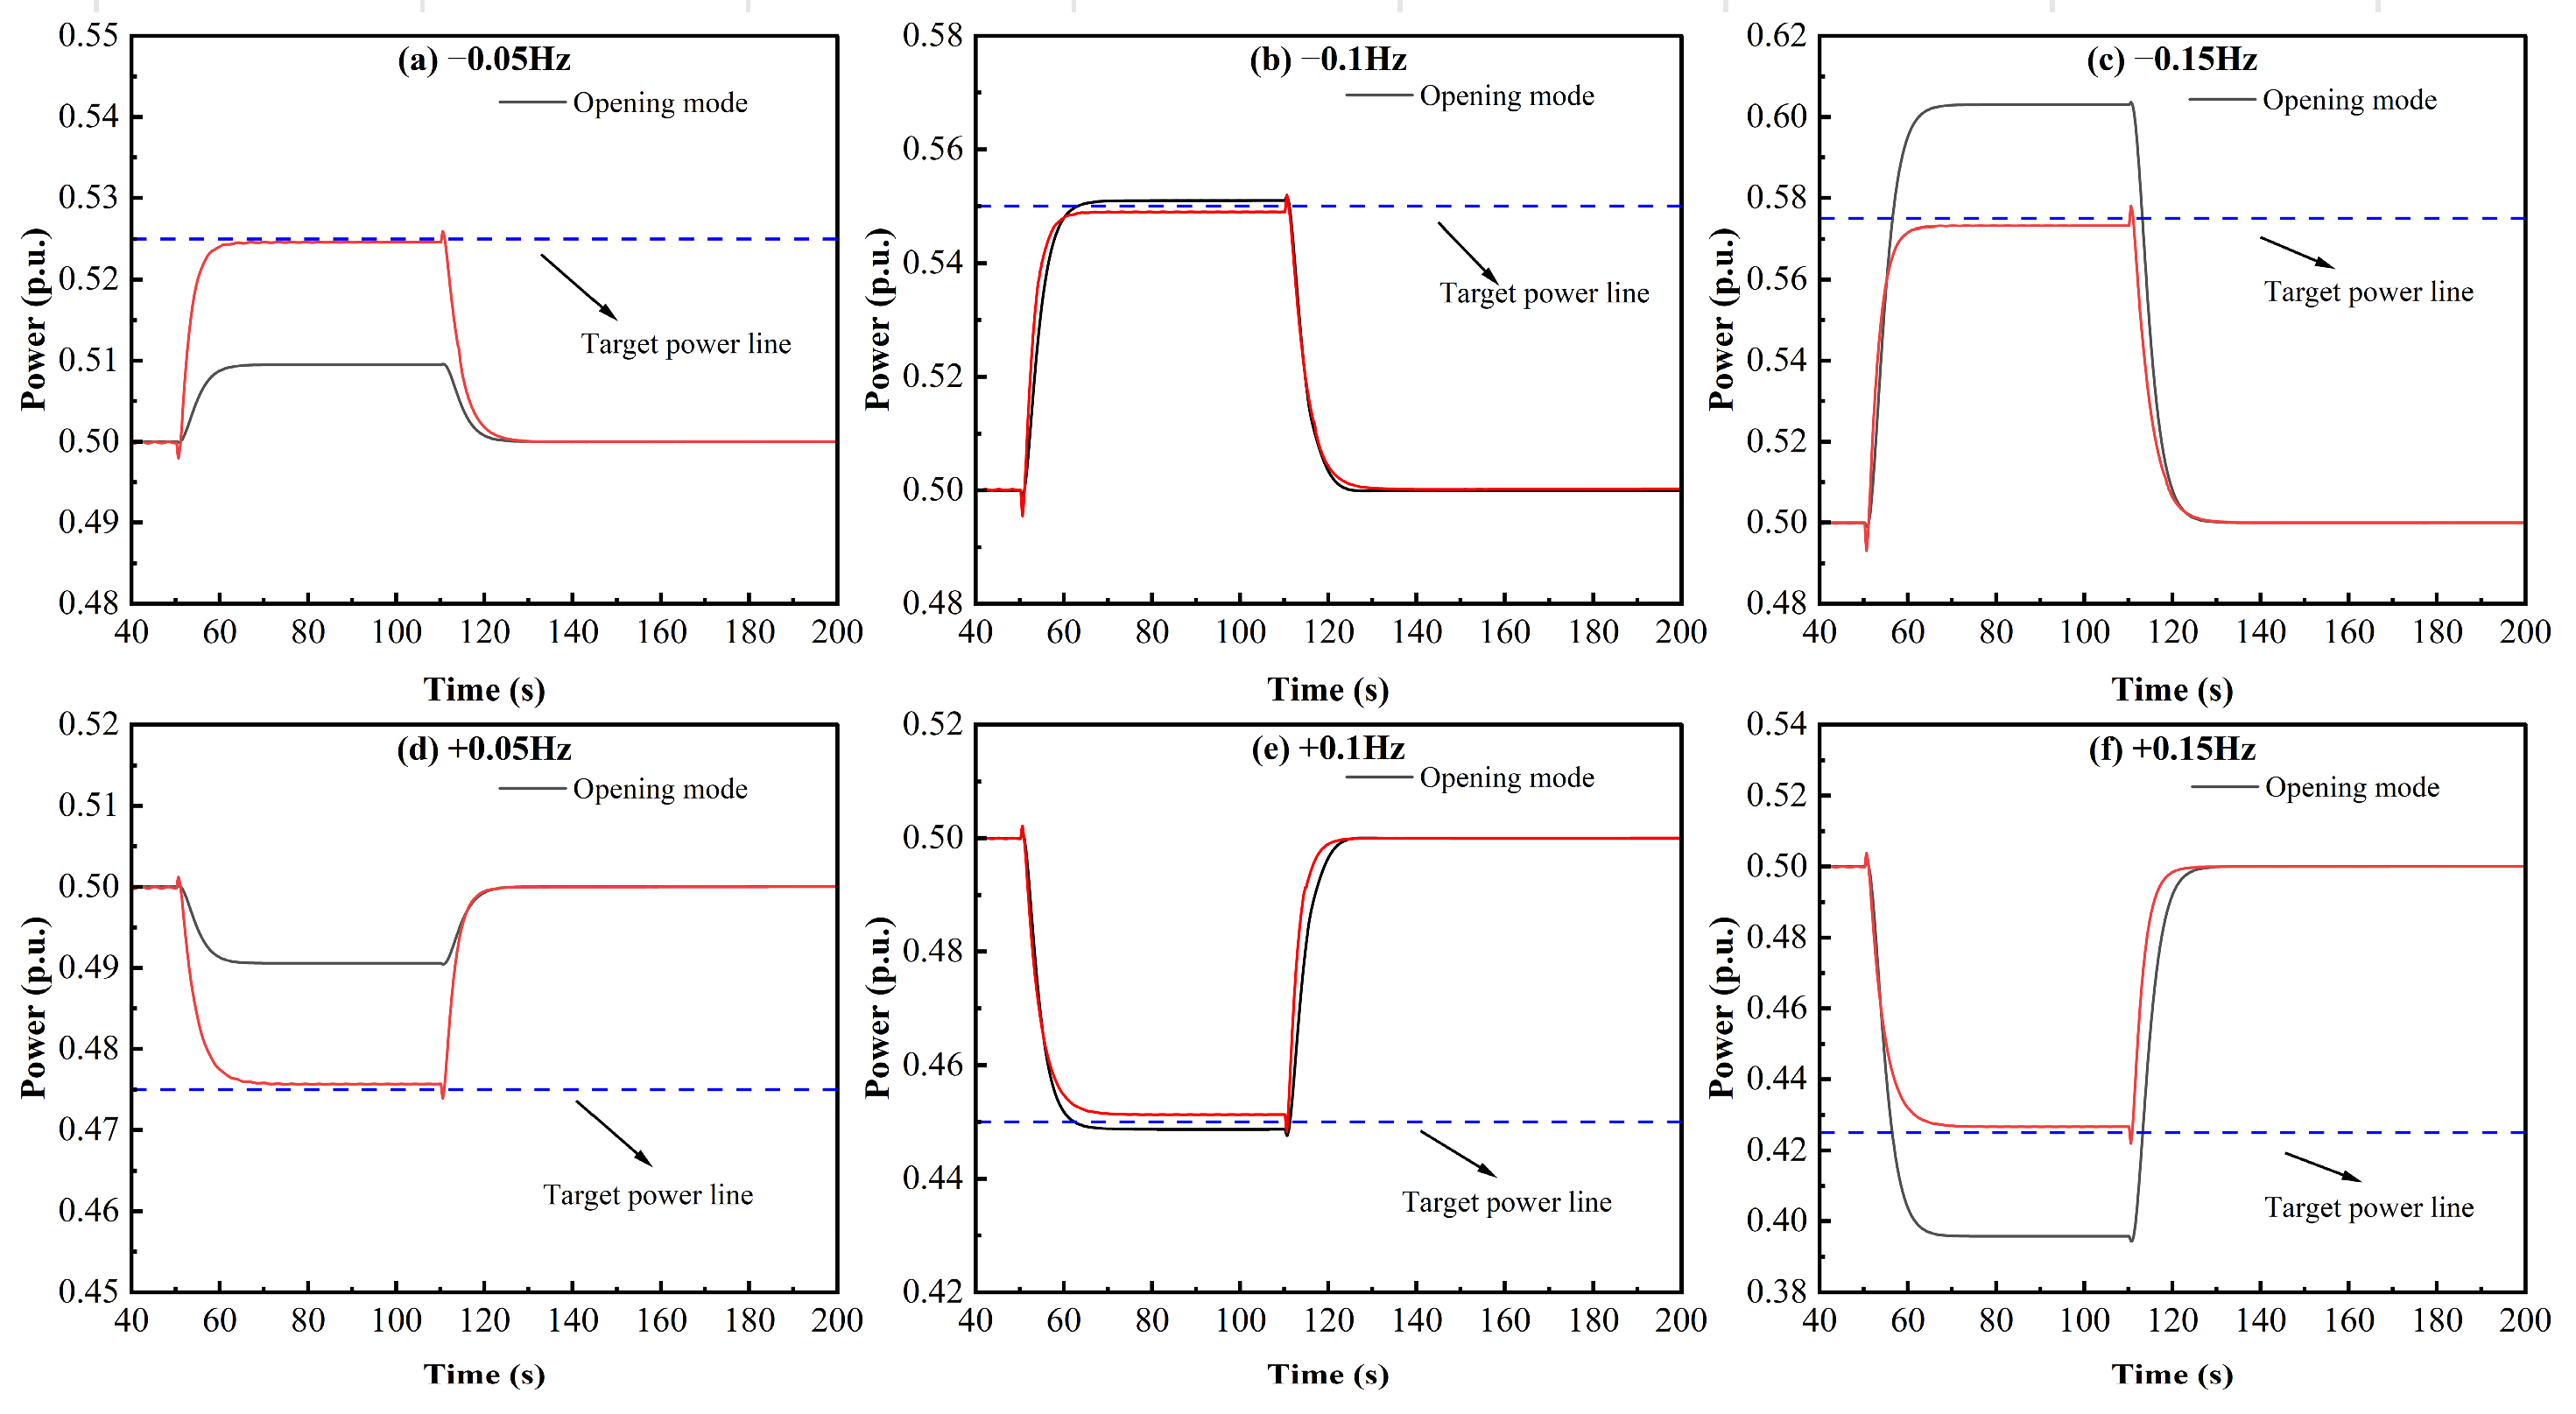
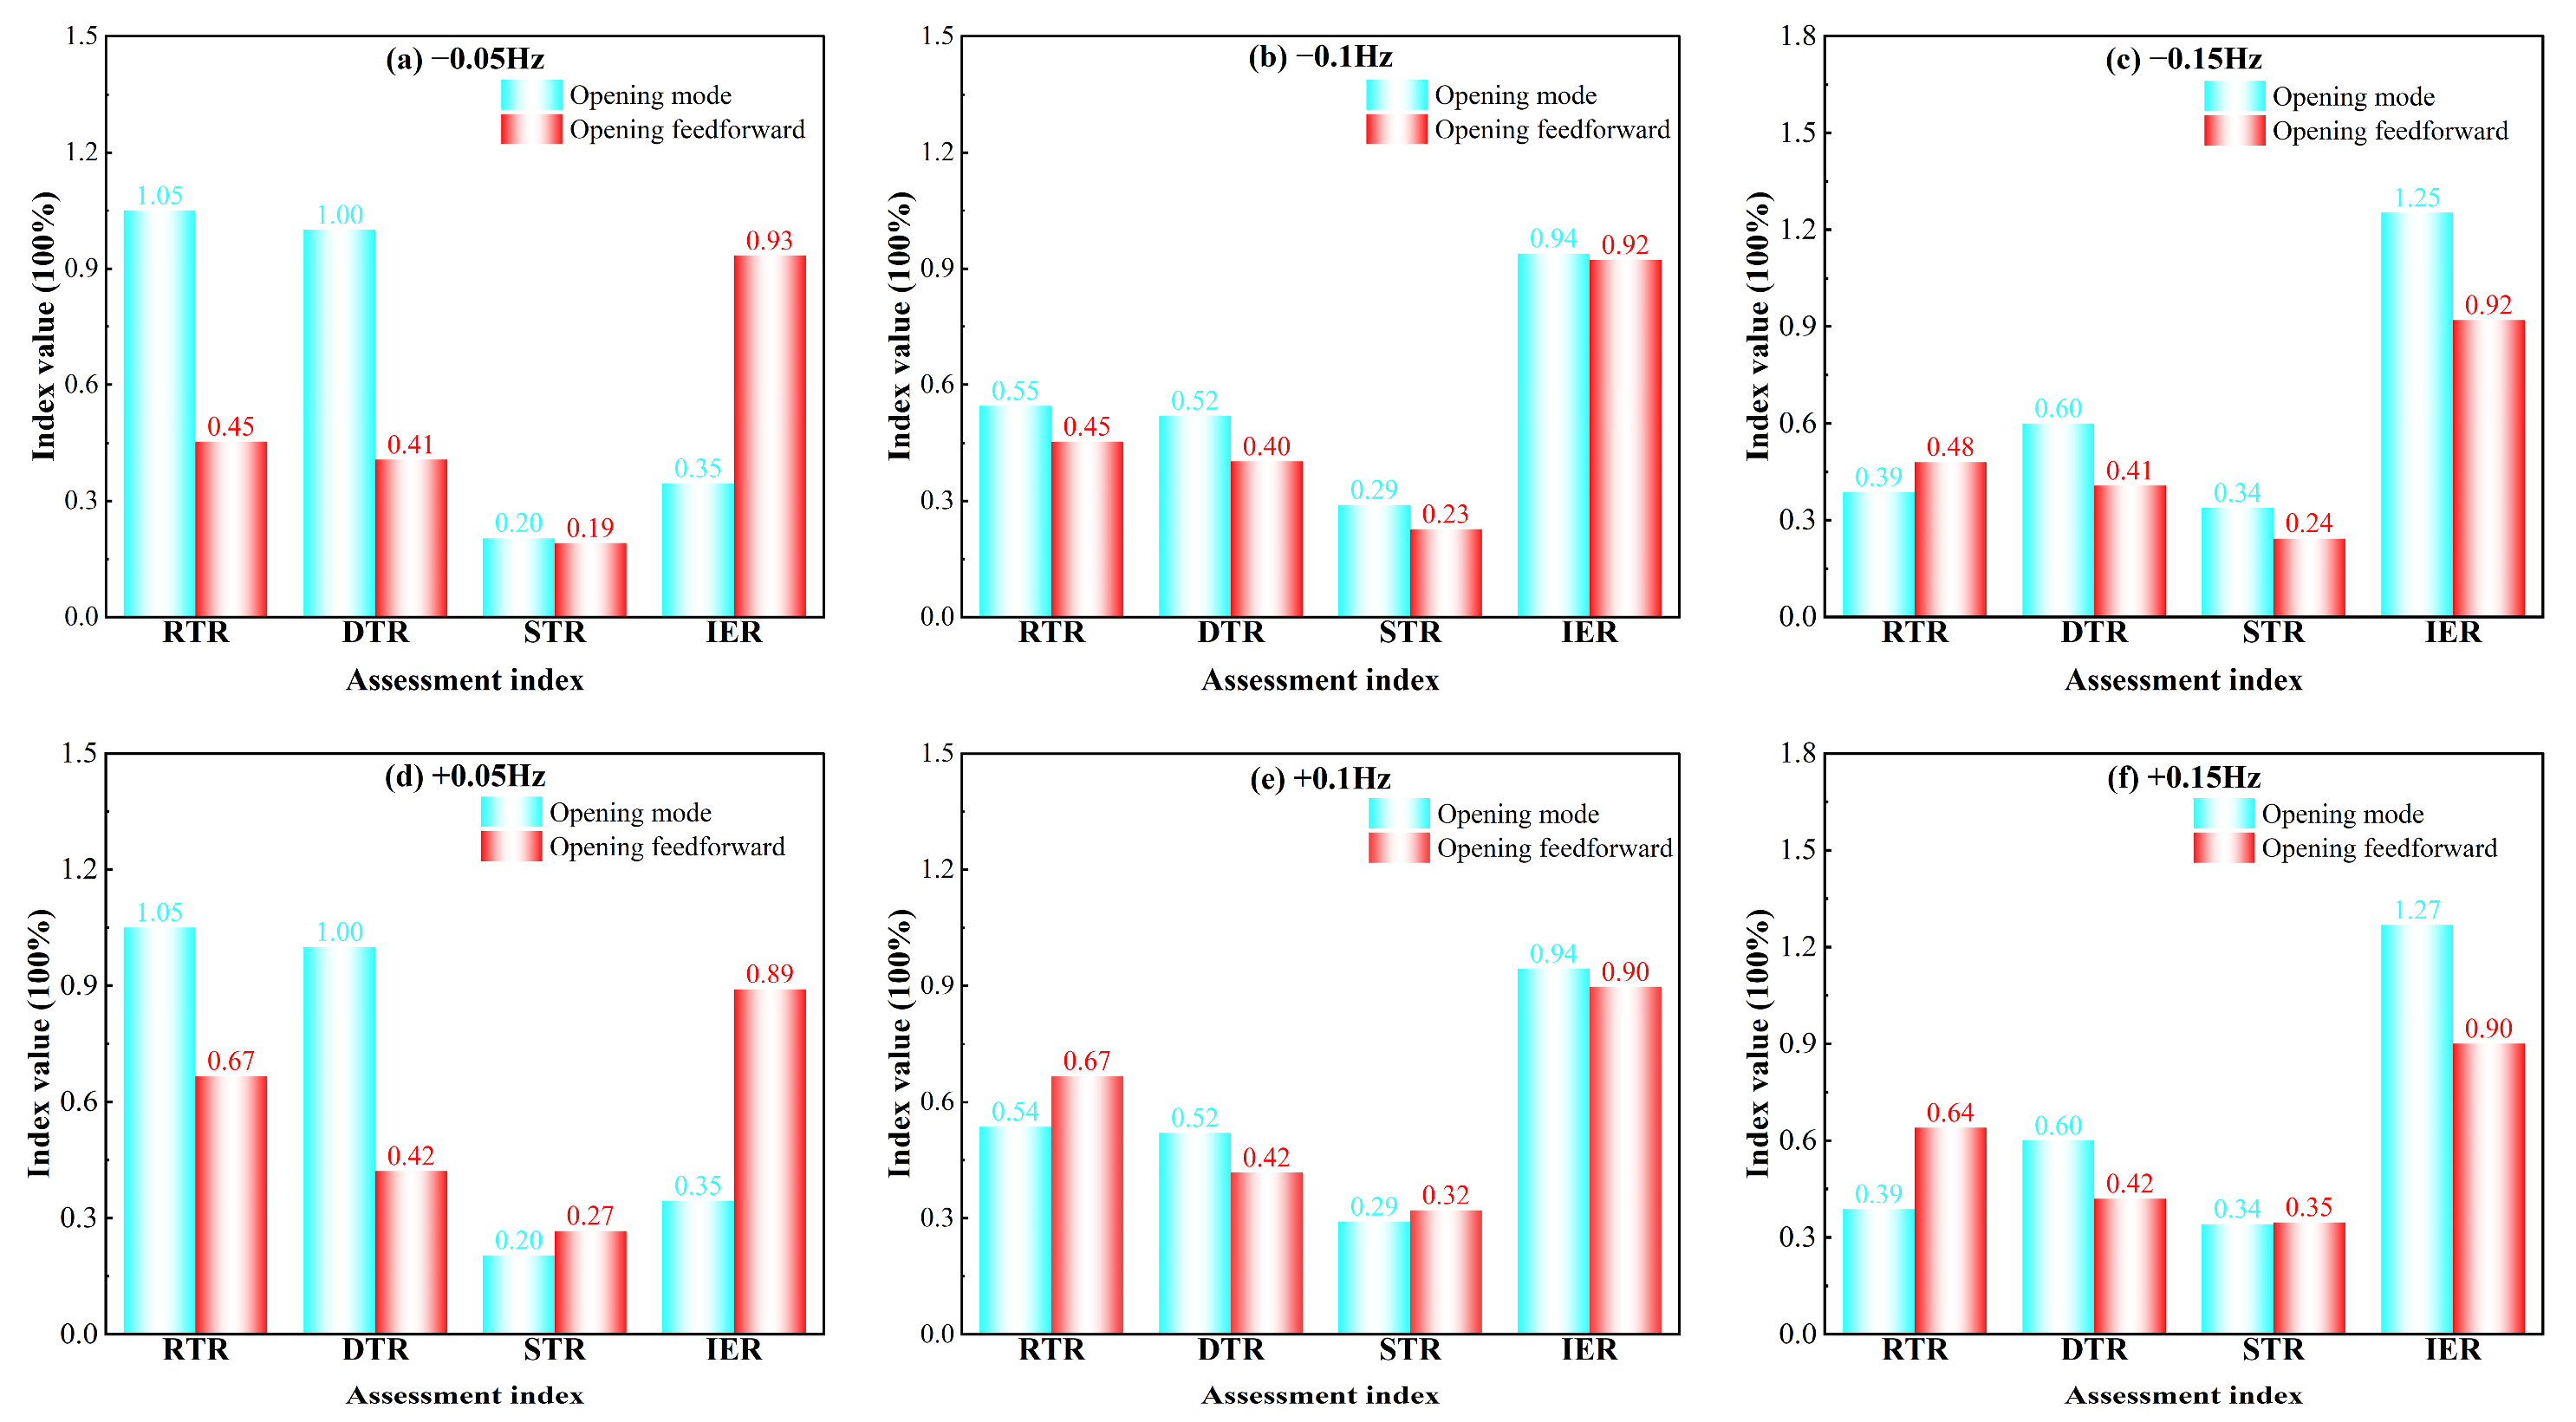
The simulation curves and assessment index comparisons presented in this section focus on typical examples of the unit subjected to ±0.05 Hz, ±0.1 Hz, and ±0.15 Hz frequency disturbances; the simulation tests under different frequency deviation operating conditions are presented in Table 3. A comparison of the assessment index results under the remaining frequency disturbance conditions is provided in Figure 18.
The PFR performance comparison curves between the traditional opening mode and the opening feedforward mode under different frequency disturbances are illustrated in Figure 19.
A comparison of the assessment indices calculated based on Figure 19 is illustrated in Figure 20.
As illustrated in Figure 19 and Figure 20, the traditional opening mode fails to meet the PFR assessment standards under small frequency deviation disturbances. In contrast, the feedforward control method under the opening mode achieves real-time dynamic compensation for frequency deviation variations, effectively mitigating the impact of frequency deviation fluctuations on the power response. On the premise that frequency-regulation assessment criteria are satisfied under all frequency deviation conditions, the maximum RTR reduction reaches 57.14%, the maximum DTR reduction reaches 59%, and the maximum IER improvement reaches 165.71% under the small frequency deviation condition of 0.05 Hz. This strategy maintains highly consistent rapidity, precision, and superior regulation quality across the entire frequency deviation range.
A comparison of the frequency regulation performance index results under other frequency deviation conditions is presented in Figure 18.
After completing the verification of the feedforward controller’s frequency regulation performance under all operating conditions, a corresponding robustness analysis of the controller is required, and the detailed experiments are provided in Appendix A.

5. Discussion

This paper investigates the PFR performance of hydropower units under wide-range operating conditions in the opening mode and analyzes the dynamic regulation characteristics of the unit through multiple operational case studies. The primary contributions of this work are summarized as follows:
(1)
A nonlinear PFR model for hydropower units is constructed, which integrates the governor, servomotor system, hydro-turbine nonlinear interpolation model, pipeline model based on the MOC, and generator rotor equations. This model accurately captures hydraulic–mechanical coupling dynamics, providing a reliable simulation foundation for performance analysis across wide operating conditions.
(2)
An operating-condition-dependent feedforward control strategy is proposed under the opening mode. This strategy prioritizes feedforward regulation while retaining PID for error correction. By employing a BPNN to establish the head–power–opening mapping relationship, nonlinear opening compensation of the unit under different head and load operating conditions is realized. This strategy can calculate the feedforward opening command in real time, significantly improving the frequency regulation adaptability of the traditional opening mode under relatively adverse operating conditions such as high/low water heads and large/small loads, thereby ensuring that the evaluation indices across all operating conditions meet compliance standards.
(3)
From the control-mechanism perspective, the proposed composite strategy has fundamental structural differences from existing primary frequency regulation schemes. Gain-scheduled PID and fuzzy PID improve closed-loop dynamic performance and suppress system oscillations by adjusting PID feedback gains. Nevertheless, all control actions are activated only after frequency deviation occurs. Lacking an independent feedforward channel, they cannot pre-compensate the inherent static H-P-Y nonlinearity of hydro-turbines. The response lag caused by hydraulic water-hammer effects can only be alleviated through feedback regulation, which creates an inherent upper limit for the dynamic response speed of primary frequency regulation. Unlike these pure-feedback schemes, the proposed method adopts a dedicated feedforward branch. It calculates guide-vane opening directly from real-time water head and target power to pre-compensate major static nonlinearity before obvious frequency deviation arises. The PID controller only compensates residuals originating from unmodeled hydraulic dynamics and external disturbances. Such task-decomposed architecture brings theoretical advantages in reducing response latency. Compared with lookup-table-interpolation-based feedforward for H-P-Y characteristics, the BPNN-driven feedforward offers inherent mechanism-level merits. Lookup-table interpolation may produce abrupt output jumps during condition transitions across discrete grid points. By contrast, BPNN achieves globally smooth fitting across the operating domain and yields better generalization near operating boundaries. In engineering practice, storing network weights and biases consumes much less memory than large-scale discrete datasets, facilitating embedded deployment on industrial governors.
Meanwhile, certain limitations remain in the current study, which warrant further exploration and refinement in future work:
(1)
The modeling in this paper primarily focuses on the coupling effects of the hydraulic–mechanical system. For simplicity, the interactive impacts of the generator excitation system and complex electrical dynamic factors on the grid side are not considered in detail. Future research could further integrate refined models of the electrical subsystems within the current simulation framework to conduct multi-physical field coupling studies.
(2)
The feedforward control strategy proposed in this paper relies on the accuracy of the three-dimensional head–power–opening characteristic curve. Derived from the processing of the turbine torque characteristic curve and the model comprehensive characteristic curve, dynamic variations in operating conditions such as water head and load in actual operation may lead to deviations between the preset curve and the real-time unit characteristics, thereby affecting the precision of feedforward control. Future work can investigate the online correction mechanism of feedforward commands to dynamically calibrate the target opening based on real-time operational data, further enhancing the adaptability of the control strategy under complex operating conditions. In addition, during practical hydropower plant deployment, the acquisition of real-time water head relies on sensor measurements of reservoir and tailwater levels. The main limitations include the electrical noise of the sensors themselves, the pure time delay in level measurement caused by the length of the pressure-sensing pipe, and local surge disturbances generated in the tailwater level during violent frequency regulation fluctuations of the unit. These factors can cause high-frequency glitches or instantaneous distortions in the water head signal input to the feedforward network. Therefore, for engineering implementation, appropriate digital filtering and limiting processing should be applied to the measurement point signals to ensure the smooth output of feedforward control.
(3)
Although the proposed strategy demonstrates superior frequency regulation performance, a rigorous stability analysis of the controller has not yet been performed; current stability validation relies predominantly on extensive simulation results. Future plans include performing small-signal linearization at various operating points (such as different heads and loads) based on high-precision hydro-turbine characteristic surfaces, thereby establishing a comprehensive transfer function model that incorporates the feedforward channel. On this basis, the characteristic equation following the introduction of feedforward control will be rigorously derived, and methods such as the Routh–Hurwitz criterion or eigenvalue analyses will be applied to quantitatively solve the stability domain boundaries under the influence of various hydraulic–mechanical parameters, providing theoretical support for the safe operation of the unit across a wide range of operating conditions.
(4)
Although this paper reveals the frequency regulation performance of the opening mode under high and low water heads, as well as large and small loads, through simulation tests, it does not reveal the degradation mechanism of its frequency regulation performance. To this end, the following hypotheses are proposed: In the extremely low-load region of 10 % P r , the slope of the turbine characteristic curve is relatively small, and dead zones and clearance nonlinearities (such as actuator dead zones and distributor valve leakage) account for a higher proportion. Consequently, the linear gain of the fixed PID fails to match the local characteristics of power variation, easily leading to insufficient power response. In the high-load region of 90 % P r , the system operates near full capacity, where the flow-power gain decreases, and it is on the verge of nonlinear saturation, leading to insufficient power response caused by fixed parameters. This mechanistic interpretation is derived from the inherent nonlinear characteristics of hydro-turbines. Its rigorous quantitative verification will be further carried out in our follow-up research through differential analysis of the comprehensive characteristic curves and field operational data.

6. Conclusions

To address the insufficient PFR adaptability of hydropower units under full-range operating conditions in the opening mode, this paper establishes a nonlinear simulation model of a hydropower unit PFR system encompassing a governor, servomotor system, hydro-turbine, pipeline, and generator.
On this basis, an operating-condition-dependent feedforward control strategy characterized by feedforward-dominated regulation and PID-assisted correction is proposed. The simulation results indicate that, across the entire head range of 70 m to 100 m, the full load range of 10%Pr to 90%Pr, and the full spectrum of frequency deviation disturbances from 0.05 Hz to 0.15 Hz, the proposed strategy ensures that the four core assessment indices—including the rise-time ratio and integrated energy ratio—fully satisfy the PFR compliance standards, thereby significantly enhancing the frequency regulation quality of the unit under wide-range operating conditions. Future work will further incorporate a refined model of the electrical subsystem, introduce an online correction mechanism for feedforward commands, and perform a rigorous theoretical stability analysis, thereby enhancing the robustness and engineering applicability of the strategy under complex, real-world operating conditions.

Author Contributions

R.L.: Methodology, software, and writing—original draft preparation. Y.M.: Writing—review and editing and supervision. J.D.: Software. J.L.: Investigation. X.T.: Supervision. C.L.: Supervision and funding acquisition. All authors have read and agreed to the published version of the manuscript.

Funding

The authors acknowledge financial support from the Smart Grid-National Science and Technology Major Project (2024ZD0801800), the National Natural Science Foundation of China (No. 52509120), the National Natural Science Foundation of China (No. 52279085), the Hubei Provincial Natural Science Foundation of China (2023AFD186), and the National Natural Science Foundation of China (No. U23B20143) for the research, authorship, and publication of this article.

Data Availability Statement

The data presented in this study are available upon request from the corresponding author.

Conflicts of Interest

The authors declare no conflicts of interest.

Appendix A. Feedforward Control Robustness Analysis

To quantitatively evaluate the sensitivity of the proposed feedforward control strategy to the mapping accuracy of the turbine H-P-Y mapping and water head measurement uncertainty, this section designs two uncertainty scenarios: (1) water head measurement deviation and (2) feedforward opening command yg gain deviation. All tests are conducted under the benchmark operating condition (84.4 m head, 50%Pr, ±0.1 Hz frequency disturbance), with RTR, DTR, STR, and IER remaining as the frequency regulation performance robustness evaluation indices.

Appendix A.1. Robustness Analysis Against Water Head Measurement Deviation

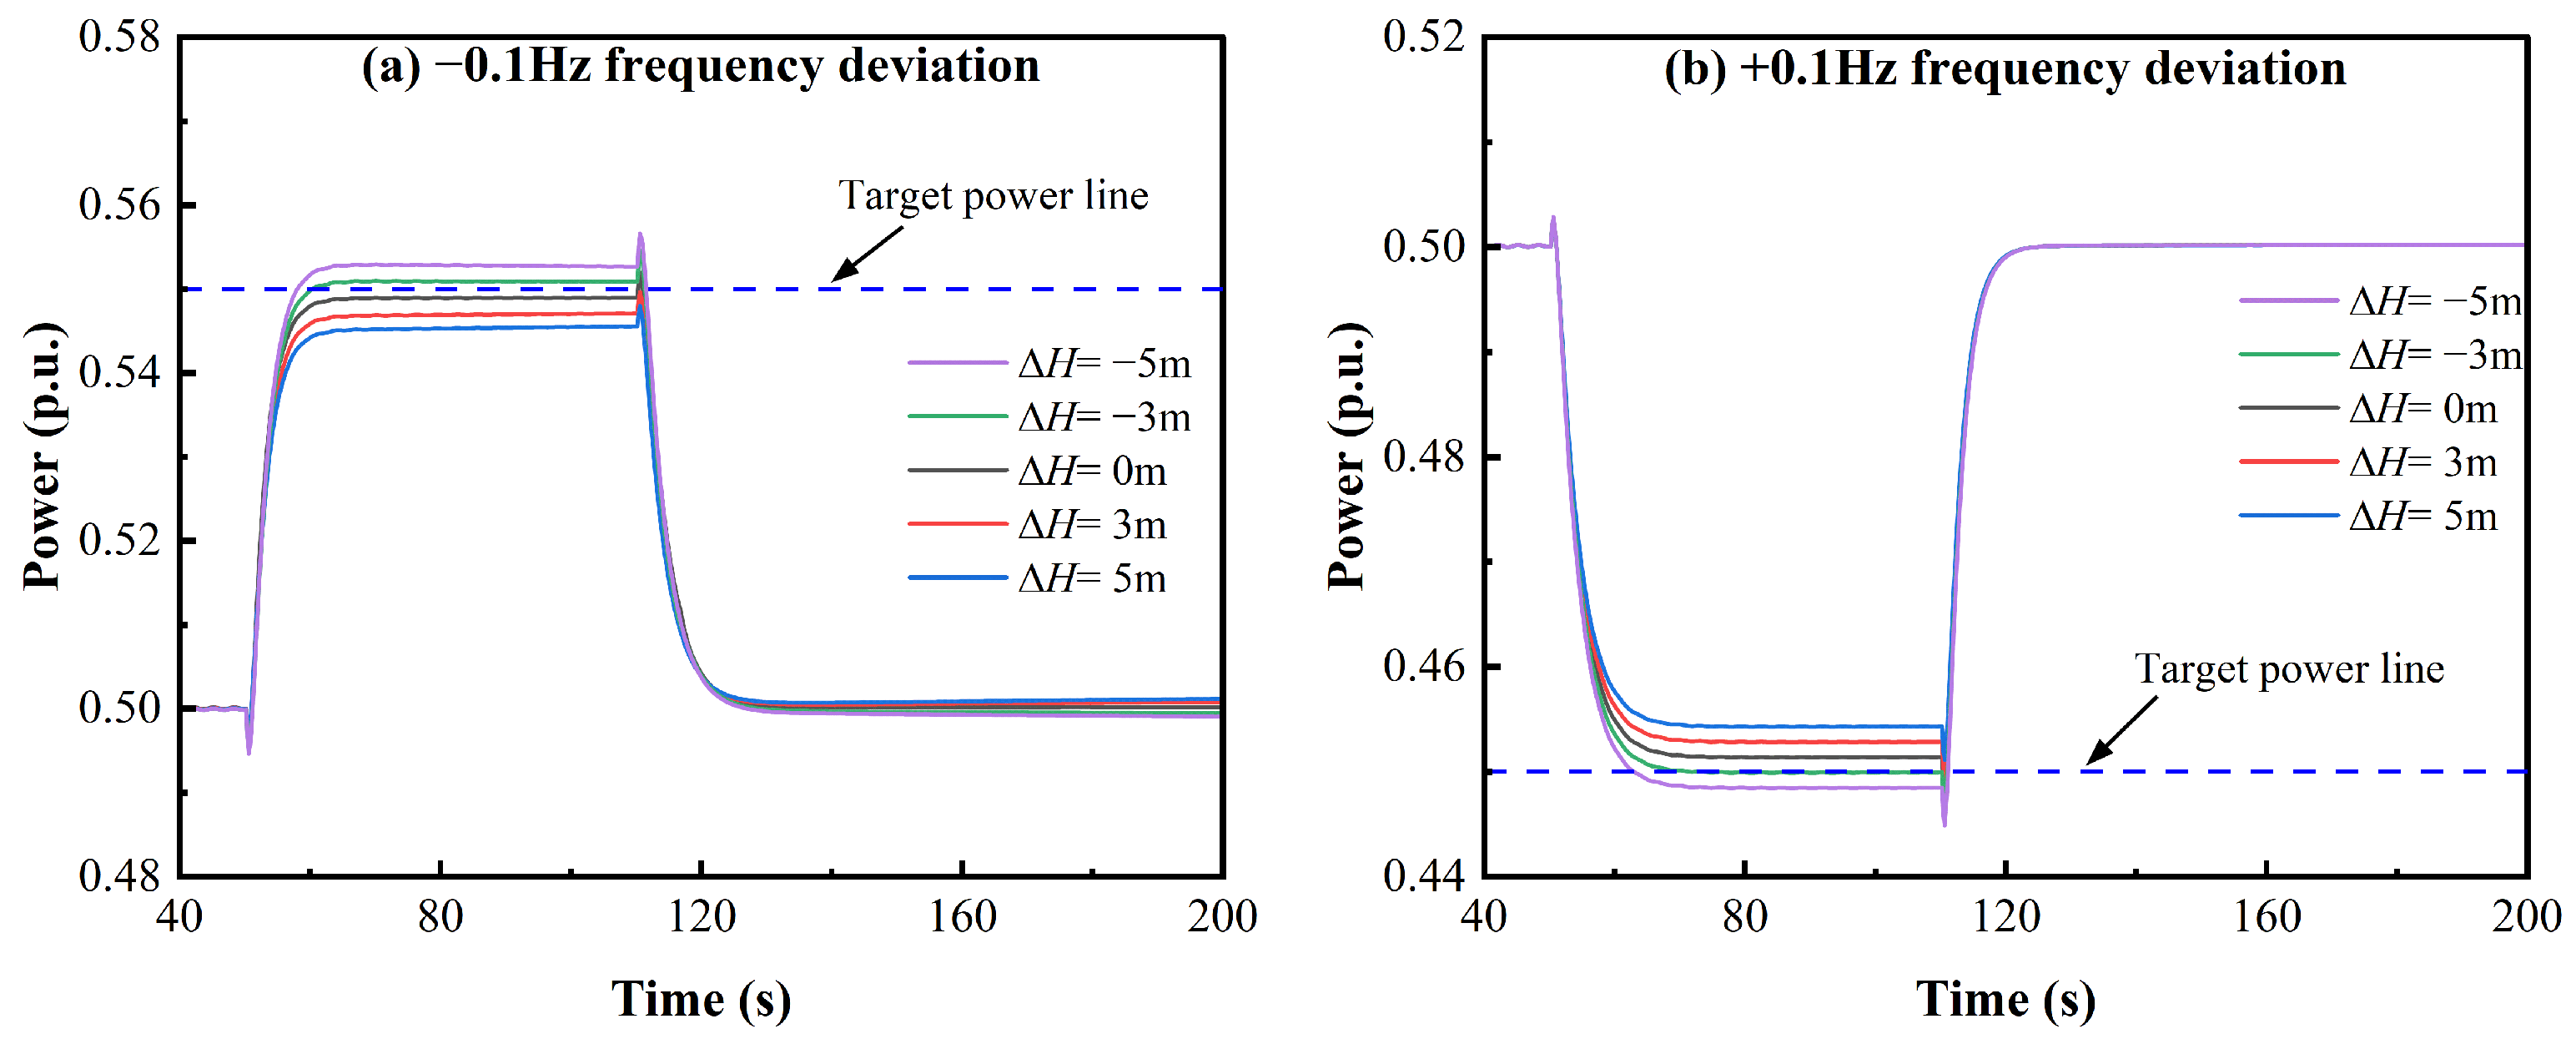
In actual power plants, water head measurement is subject to factors such as sensor accuracy, pressure pipe delay, and tailwater level fluctuation, resulting in certain measurement deviations. To simulate this situation, we consider more unfavorable measurement errors based on the benchmark head of 84.4 m, namely applying deviations of ±3 m and ±5 m, corresponding to four test heads of 79.4 m, 81.4 m, 87.4 m, and 89.4 m. The power response curves under different water head measurement deviations are as follows.
Figure A1. Power response curves under different water head deviations at 50%Pr with ±0.1 Hz disturbance.
Water 18 02028 g0a1
Based on Figure A1, the calculated evaluation indices are shown in Figure A2.
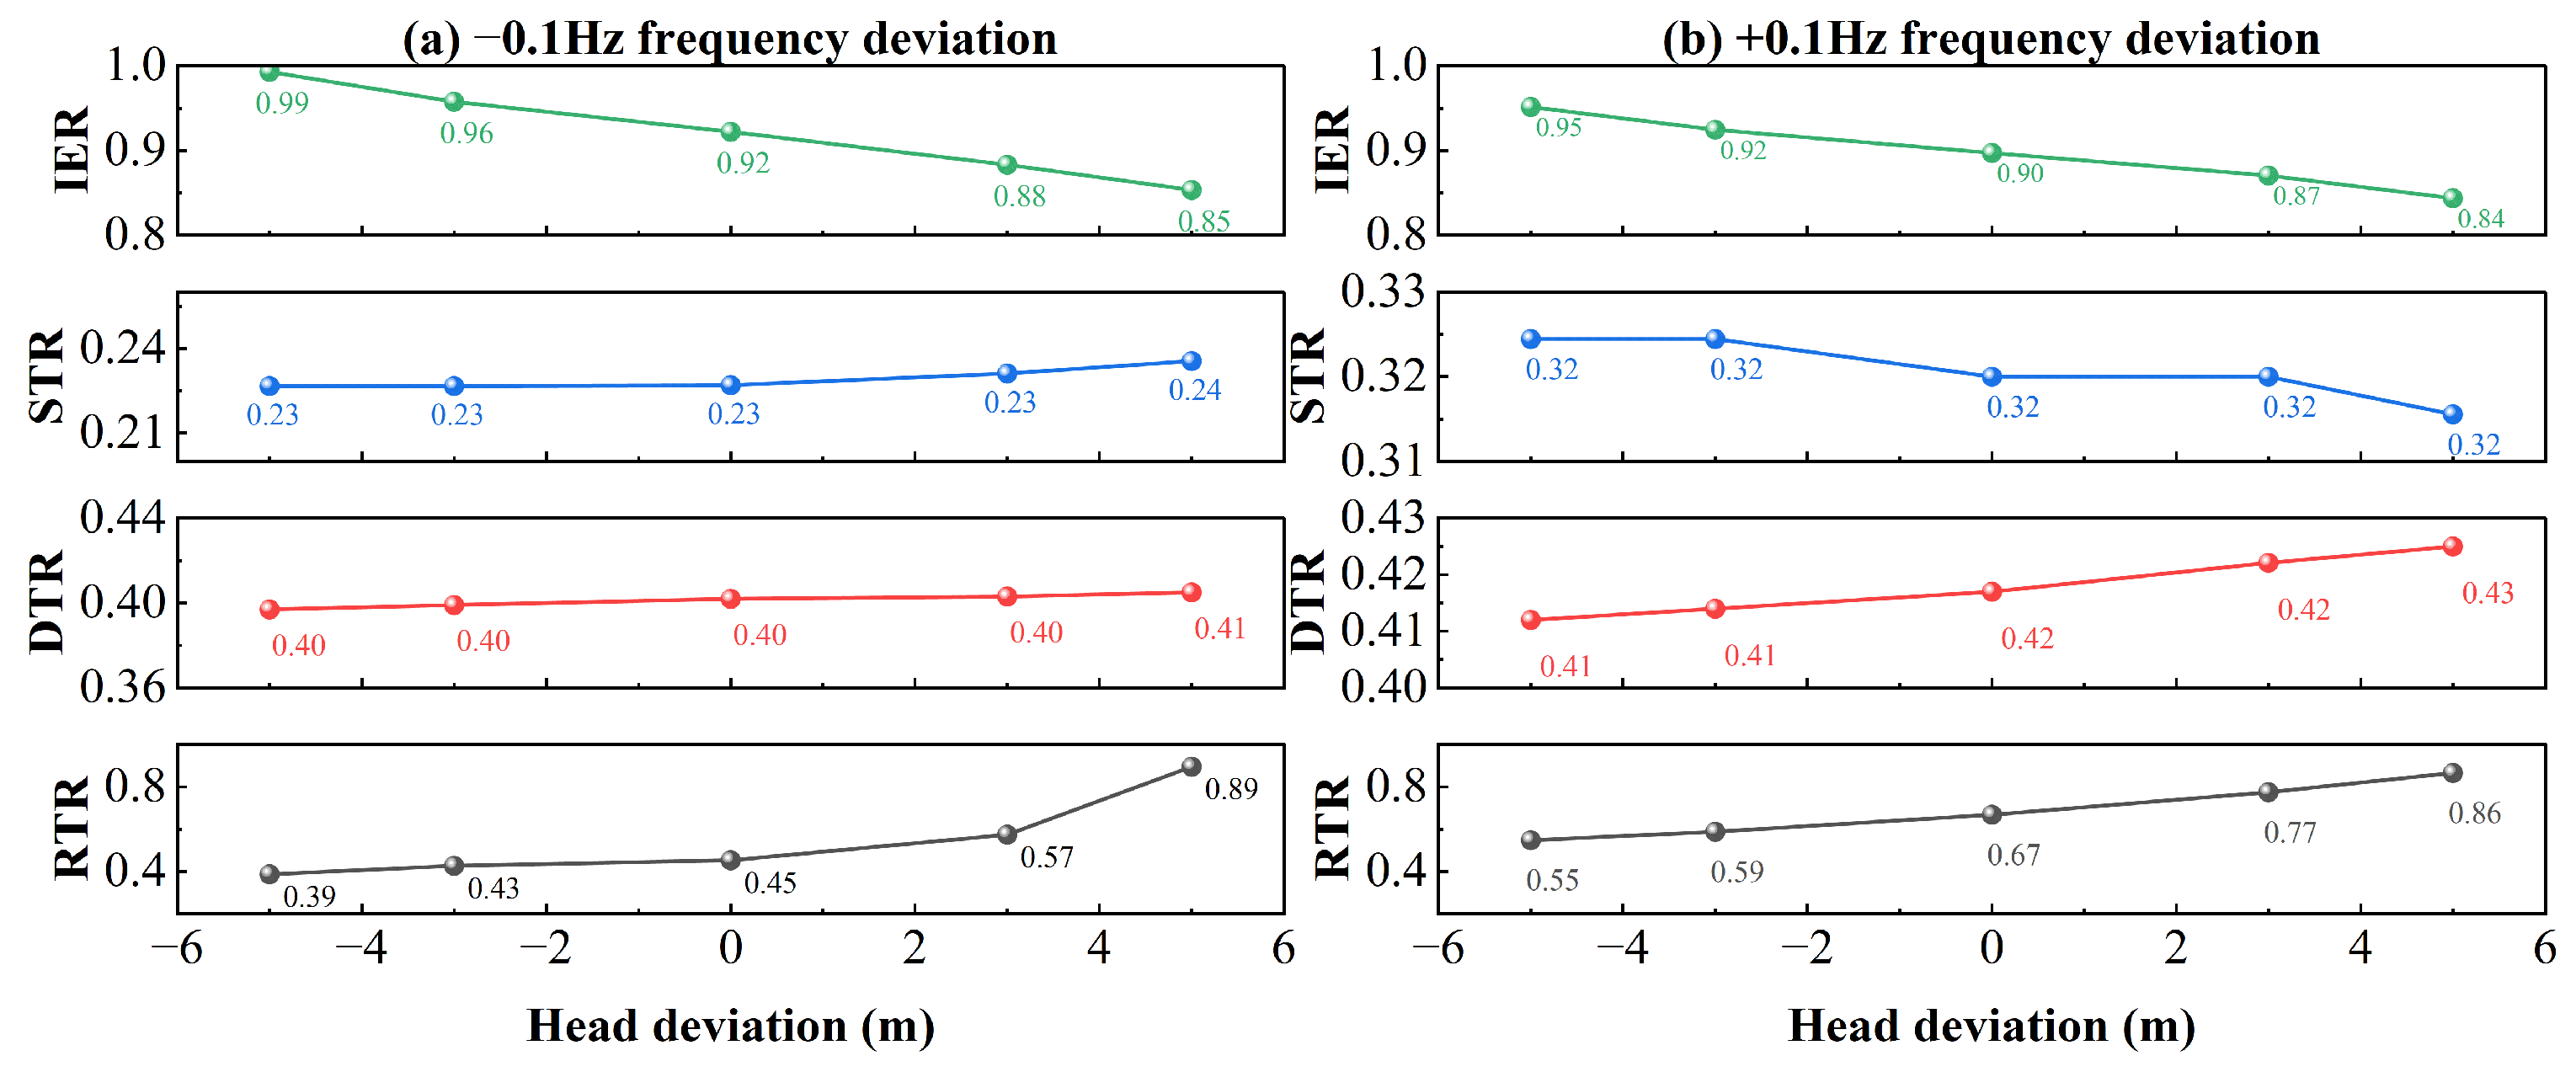
As can be seen in Figure A1 and Figure A2, within the water head deviation range of ±5 m, RTR and IER may experience varying degrees of degradation with changes in the water head deviation, but they both remain within the qualified range of the assessment indices. DTR and STR are basically unaffected by changes in the water head deviation. Specifically, under the −0.1 Hz disturbance, when the water head deviations are −5 m and 5 m, respectively, RTR decreases from the benchmark value of 0.45 to 0.39 and increases to 0.89, while IER increases from 0.92 to 0.99 and decreases to 0.85. Under the +0.1 Hz disturbance, the variation trend is similar, but it still satisfies the PFR assessment requirements ( RTR 1 , 0.6 IER 1.3 ). The above results indicate that the proposed control strategy exhibits sound robustness against relatively unfavorable water head measurement deviations within ±5 m.
Figure A2. Evaluation indices under different water head deviations at 50%Pr with ±0.1 Hz disturbance.
Water 18 02028 g0a2

Appendix A.2. Robustness Analysis Against Feedforward Opening Command Deviation

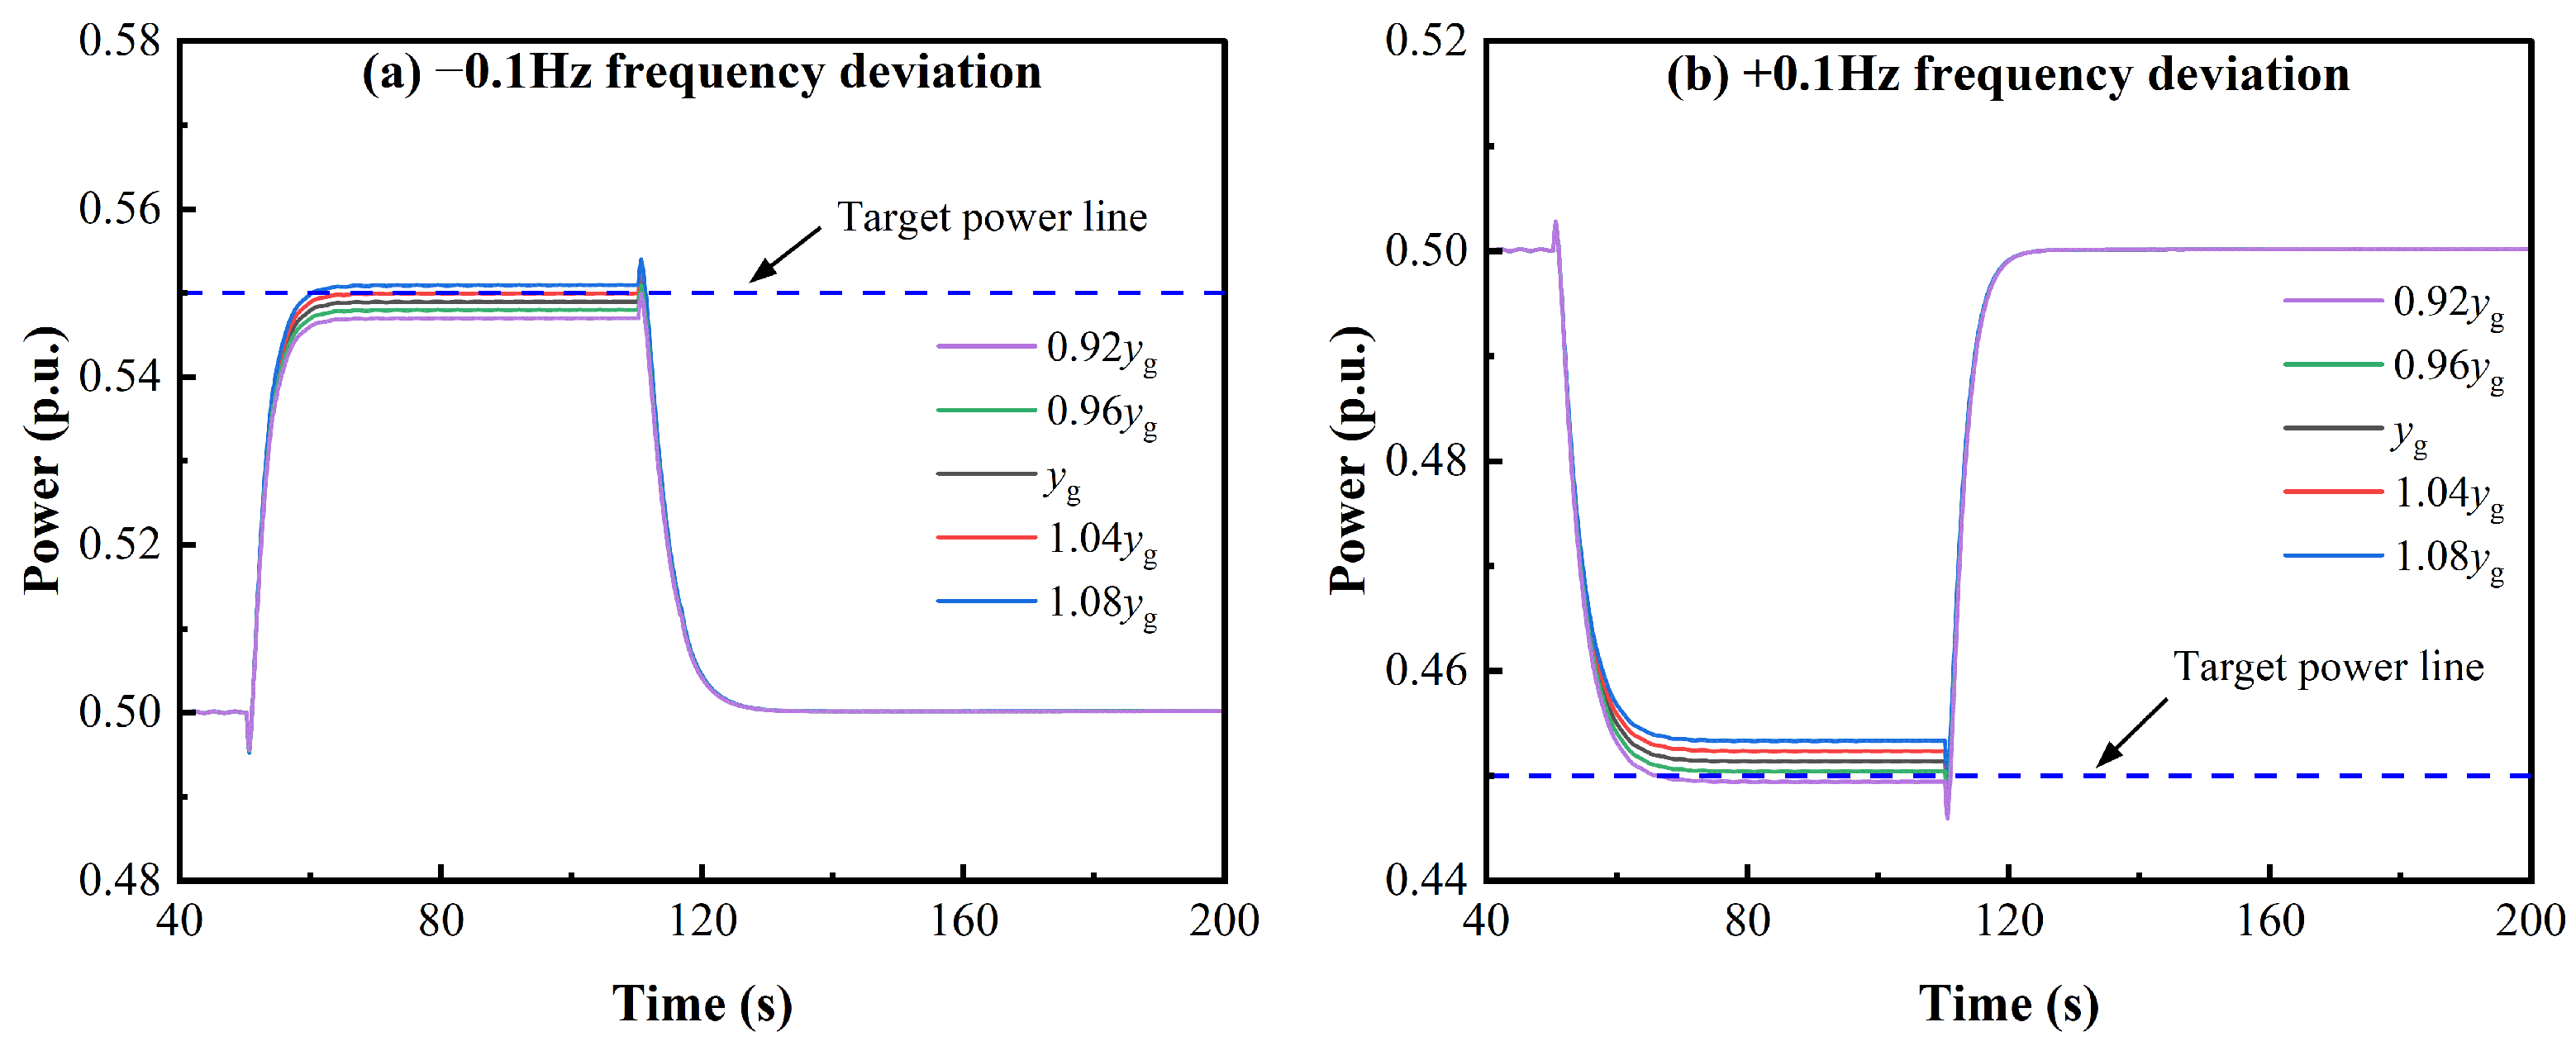
The opening command of feedforward control is calculated based on the H-P-Y mapping relationship fitted by the offline-trained BPNN. As the power plant operation time increases, its inherent characteristics may shift, and fitting errors may also lead to a certain deviation between the feedforward opening and the actual required opening. To simulate this situation, we apply gain deviations of ±0.04 and ±0.08 to the baseline feedforward opening command, namely taking 0.92 yg, 0.96 yg, 1.04 yg, and 1.08 yg as the feedforward outputs. The power response curves under different feedforward opening command deviation gains are as follows.
Figure A3. Power response curves under different feedforward output gains at 84.4 m, 50%Pr, and ±0.1 Hz disturbance.
Water 18 02028 g0a3
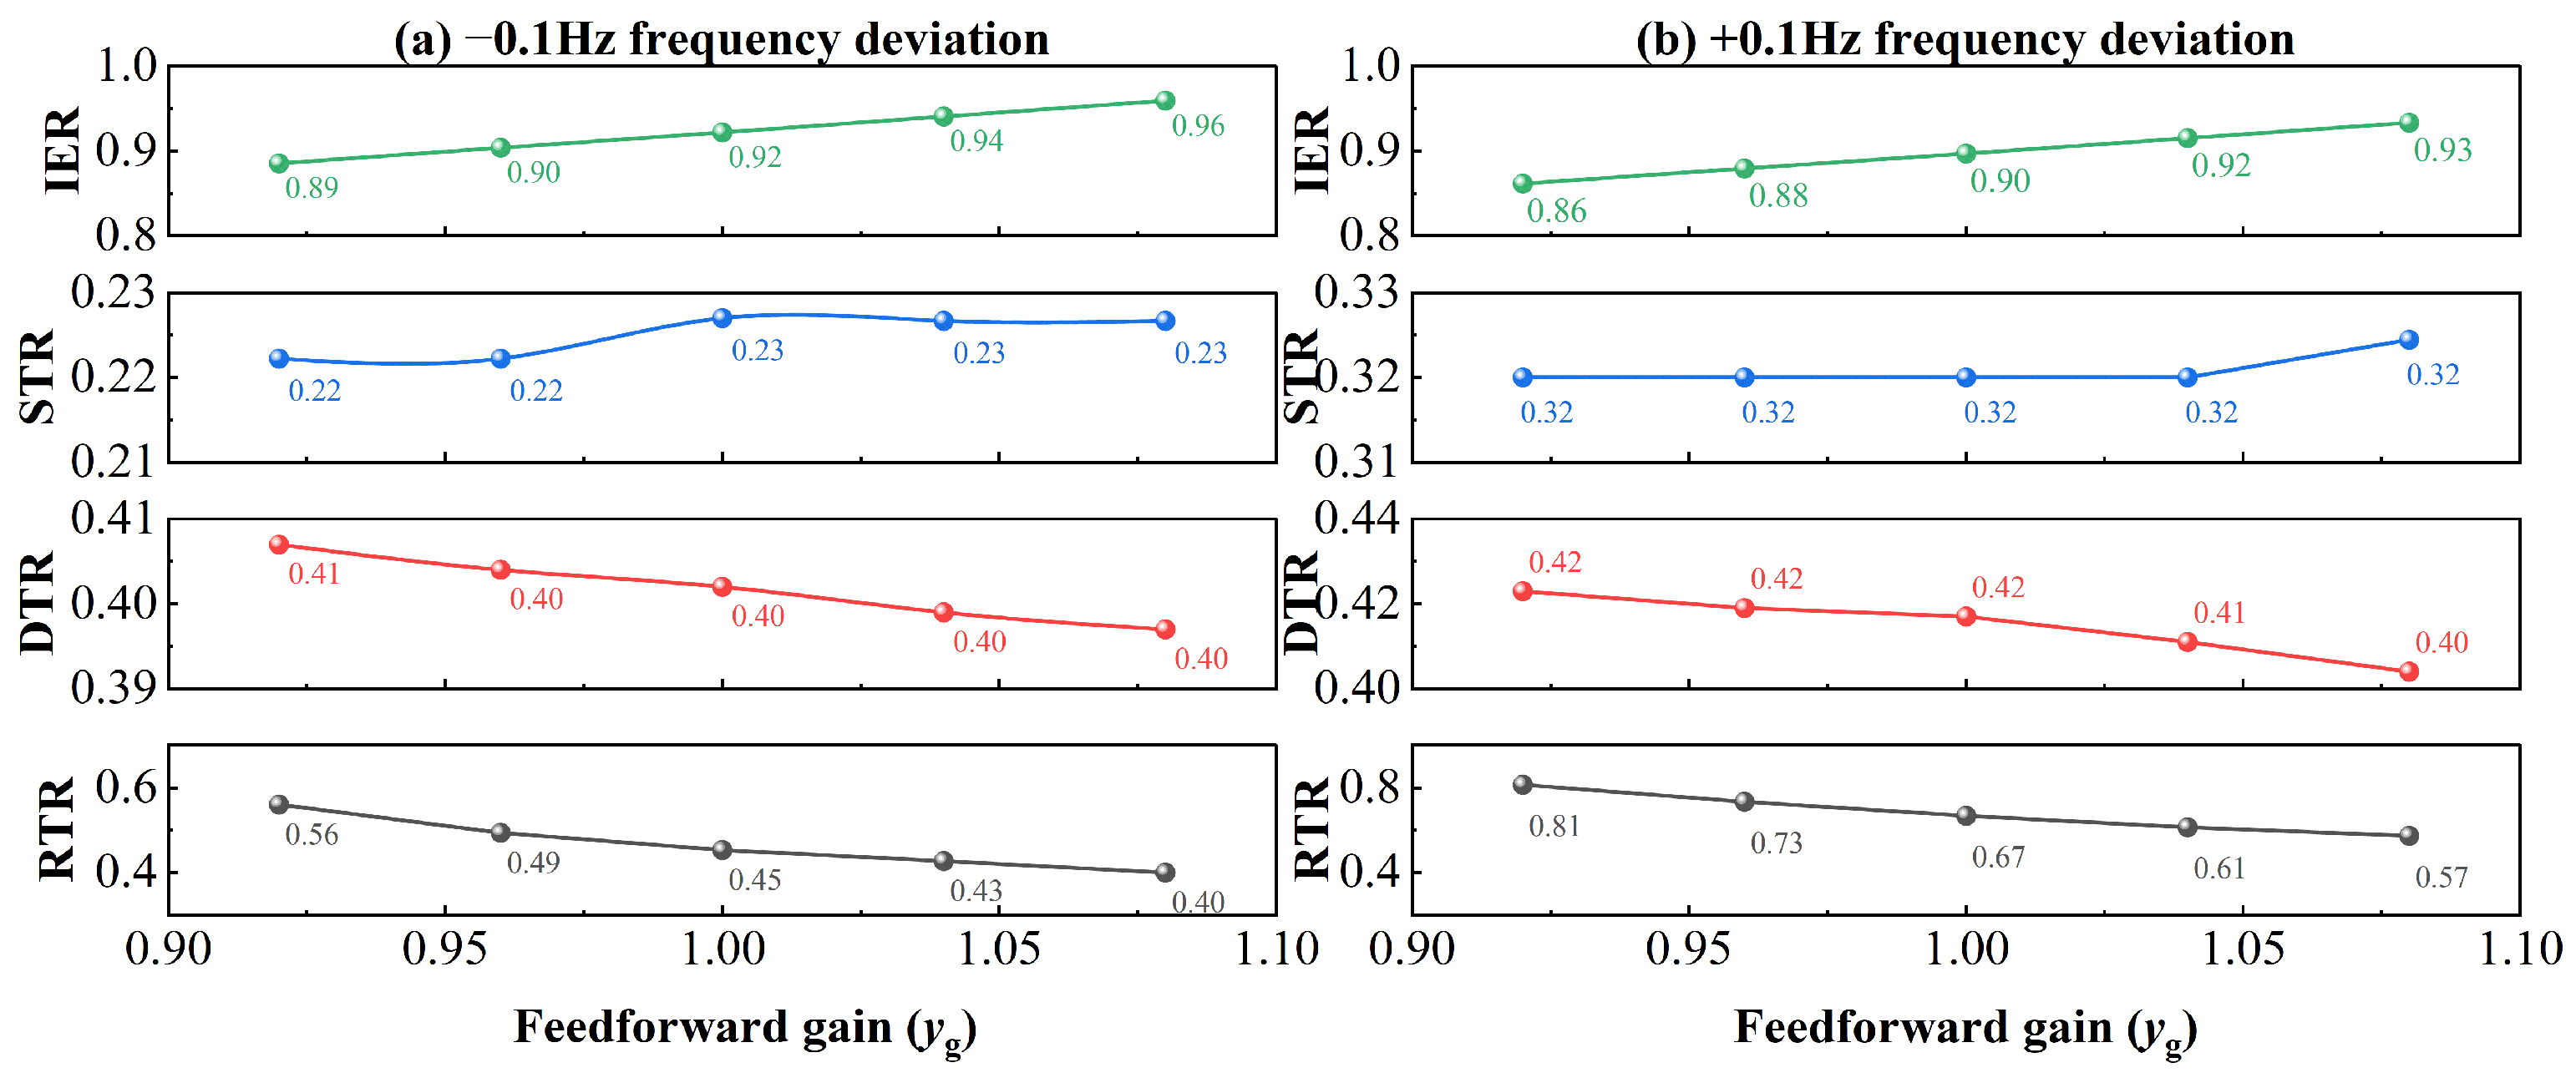
Based on Figure A3, the calculated evaluation indices are shown in Figure A4.
As can be seen in Figure A3 and Figure A4, within the feedforward output gain deviation range of ±0.08, RTR and IER may experience varying degrees of degradation with changes in the head deviation, but they both remain within the qualified range of the assessment indices. DTR and STR are basically unaffected by changes in the head deviation. Specifically, under the −0.1 Hz disturbance, when the feedforward gains are 0.92 yg and 1.08 yg, respectively, RTR increases from the benchmark value of 0.45 to 0.56 and decreases to 0.4, while IER decreases from 0.92 to 0.89 and increases to 0.96. Under the +0.1 Hz disturbance, the variation trend is similar, but it still satisfies the PFR assessment requirements ( RTR 1 , 0.6 IER 1.3 ). The above results indicate that the proposed control strategy exhibits sound robustness within the feedforward output gain deviation range of ±0.08.
Figure A4. Evaluation indices under different feedforward output gains at 84.4 m, 50%Pr, and ±0.1 Hz disturbance.
Water 18 02028 g0a4
Synthesizing the results of the above two sets of experiments, within the ranges of ±5 m water head measurement deviation and ±0.08 feedforward command gain deviation, the PFR evaluation indices of the proposed control strategy can all satisfy assessment standard requirements, indicating that the strategy possesses favorable engineering robustness. The aforementioned measurement ranges basically belong to relatively unfavorable conditions in actual engineering operations. When these deviations exceed the ranges tested in this section, the PFR assessment indices may fail to meet the requirements; therefore, regular calibration of the water head measurement channel and updating of the H-P-Y characteristic curves are recommended during actual power plant deployment.

References

  1. He, C.; Geng, H.; Rajashekara, K.; Chandra, A. Analysis and control of frequency stability in low-inertia power systems: A review. IEEE/CAA J. Autom. Sin. 2024, 11, 2363–2383. [Google Scholar] [CrossRef] [Scilit]
  2. Yan, K.; Li, G.; Zhang, R.; Xu, Y.; Jiang, T.; Li, X. Frequency control and optimal operation of low-inertia power systems with HVDC and renewable energy: A review. IEEE Trans. Power Syst. 2023, 39, 4279–4295. [Google Scholar] [CrossRef] [Scilit]
  3. El-Bahay, M.H.; Lotfy, M.E.; El-Hameed, M.A. Computational methods to mitigate the effect of high penetration of renewable energy sources on power system frequency regulation: A comprehensive review. Arch. Comput. Methods Eng. 2023, 30, 703–726. [Google Scholar] [CrossRef] [Scilit]
  4. Jia, Y.; Chen, N.; Zhang, L.; Qian, M.; Tang, B.; Liu, Y.; Zhou, C.; Peng, P. Optimization of Reserve Capacity for New Energy Participating in Primary Frequency Regulation of the Power System. Energies 2026, 19, 718. [Google Scholar] [CrossRef] [Scilit]
  5. Al Kez, D.; Foley, A.M.; Ahmed, F.; Morrow, D.J. Overview of frequency control techniques in power systems with high inverter-based resources: Challenges and mitigation measures. IET Smart Grid 2023, 6, 447–469. [Google Scholar] [CrossRef] [Scilit]
  6. Döhlen, V.; Lindsjö, H.; Bertilsson, K. A Review on Hydropower Hybridization for Frequency Containment, Objectives and Dimensions of Auxiliary Energy Storage. IET Renew. Power Gener. 2026, 20, e70206. [Google Scholar] [CrossRef] [Scilit]
  7. Li, Y.; Cheng, J.; Li, L.; Shi, Y.; Zhang, D.; Yang, Z.; Chen, N.; An, X. Research on Automatic Power Generation Control and Primary Frequency Regulation Parameter Characteristics of Hydropower Units. Water 2025, 17, 2944. [Google Scholar] [CrossRef] [Scilit]
  8. Beus, M.; Pandžić, H. Practical implementation of a hydro power unit active power regulation based on an mpc algorithm. IEEE Trans. Energy Convers. 2021, 37, 243–253. [Google Scholar] [CrossRef] [Scilit]
  9. Jiang, X.; Chen, X.; Wang, Z. Research on modeling and control strategy of hydraulic turbine governing system based on improved genetic algorithm. IOP Conf. Ser. Earth Environ. Sci. 2021, 774, 012136. [Google Scholar] [CrossRef] [Scilit]
  10. Zhou, Y.; Huang, S.; Xiong, L.; Li, Y.; Cao, Y. Robust predefined-time fractional-order sliding mode control for performance enhancement of hydro-turbine governing system. Renew. Energy 2025, 124320. [Google Scholar] [CrossRef] [Scilit]
  11. Li, J.; Wu, X.; Zhen, H. Research on parameter identification of high-head hydropower MMC-HVDC system based on Sobol sensitivity analysis and adaptive cuckoo search algorithm. Front. Energy Res. 2025, 13, 1628044. [Google Scholar] [CrossRef] [Scilit]
  12. Beus, M.; Pandžić, H.; Sirovina, R. Hydro power unit speed control based on an MPC algorithm. In Proceedings of the 2022 7th International Conference on Smart and Sustainable Technologies (SpliTech), Split/Bol, Croatia, 5–8 July 2022; IEEE: Piscataway, NJ, USA, 2022; pp. 1–6. [Google Scholar]
  13. Liu, D.; Zhao, S.; Zhang, J. Adaptive PID Control of Hydropower Units Based on Particle Swarm Optimization and Fuzzy Inference. Water 2025, 17, 1512. [Google Scholar] [CrossRef] [Scilit]
  14. Weldcherkos, T.; Salau, A.O.; Ashagrie, A. Modeling and design of an automatic generation control for hydropower plants using Neuro-Fuzzy controller. Energy Rep. 2021, 7, 6626–6637. [Google Scholar] [CrossRef] [Scilit]
  15. Khamari, D.; Sahu, R.K.; Panda, S.; Arya, Y. A mMSA-FOFPID controller for AGC of multi-area power system with multi-type generations. Sustain. Comput. Inform. Syst. 2024, 44, 101046. [Google Scholar] [CrossRef] [Scilit]
  16. Chen, J.; He, G.; Wang, Y.; Zheng, Y.; Xiao, Z. Adaptive PID control for hydraulic turbine regulation systems based on INGWO and BPNN. Prot. Control Mod. Power Syst. 2024, 9, 126–146. [Google Scholar] [CrossRef] [Scilit]
  17. Dong, W.; Cao, Z.; Zhao, P.; Yang, Z.; Yuan, Y.; Zhao, Z.; Chen, D.; Wu, Y.; Xu, B.; Venkateshkumar, M. A segmented optimal PID method to consider both regulation performance and damping characteristic of hydroelectric power system. Renew. Energy 2023, 207, 1–12. [Google Scholar] [CrossRef] [Scilit]
  18. Zou, Y.; Hu, W.; Xiao, Z.; Wang, Y.; Chen, J.; Zheng, Y.; Qian, J.; Zeng, Y. Design of intelligent nonlinear robust controller for hydro-turbine governing system based on state-dynamic-measurement hybrid feedback linearization method. Renew. Energy 2023, 204, 635–651. [Google Scholar] [CrossRef] [Scilit]
  19. Gezer, D.; Taşcıoğlu, Y.; Çelebioğlu, K. Frequency Containment Control of Hydropower Plants Using Different Adaptive Methods. Energies 2021, 14, 2082. [Google Scholar] [CrossRef] [Scilit]
  20. Lu, X.; Li, C.; Chang, H.; Wang, H.; Zhu, Z.; Liu, D.; Tan, X.; Xu, R. Primary frequency regulation performance in hydropower systems: Precise quantification and holistic enhancement under wide-range operation. Appl. Energy 2025, 389, 125711. [Google Scholar] [CrossRef] [Scilit]
  21. Jones, D.I.; Mansoor, S.P. Predictive feedforward control for a hydroelectric plant. IEEE Trans. Control Syst. Technol. 2004, 12, 956–965. [Google Scholar] [CrossRef] [Scilit]
  22. Li, J.; Fu, B.; Li, C.; Quan, Y.; Zhao, X. Mechanism analysis of ultra-low-frequency oscillations in high-penetration hydropower systems and suppression strategy based on PID-QPR control. Energy 2025, 335, 138333. [Google Scholar] [CrossRef] [Scilit]
  23. Gu, Y.; Zhang, F.; Li, Y.; Deng, Y.; Hua, X.; Guo, J.; Yang, T. Research on Primary Frequency Regulation Control Strategy of the Joint Hydropower and Battery Energy Storage System Based on Refined Model. Energies 2025, 18, 5249. [Google Scholar] [CrossRef] [Scilit]
  24. Reigstad, T.I.; Uhlen, K. Nonlinear model predictive control of variable speed hydropower for provision of fast frequency reserves. Electr. Power Syst. Res. 2021, 194, 107067. [Google Scholar] [CrossRef] [Scilit]
  25. Sun, X.; Peng, C.; Jia, X.; Zhang, Y. Brain-inspired deep reinforcement learning for load frequency control of power systems with composite interference. IEEE Trans. Ind. Inform. 2025, 21, 5182–5190. [Google Scholar] [CrossRef] [Scilit]
  26. Wang, H.; Yin, Z.; Jiang, Z.P. Adaptive PID gain scheduling control for hydropower turbine using neural CDE and stochastic distribution shaping. IEEE Access 2025, 13, 102032–102043. [Google Scholar] [CrossRef] [Scilit]
  27. Yin, Z.; Wang, H.; Jiang, Z.P.; Jia, W. Establishing models for digital twin of hydropower systems using probability density function shaping. In Proceedings of the 2025 IEEE 19th International Conference on Control & Automation (ICCA), Tallinn, Estonia, 30 June–3 July 2025; IEEE: Piscataway, NJ, USA, 2025; pp. 742–747. [Google Scholar]
  28. Raissi, M.; Perdikaris, P.; Karniadakis, G.E. Physics-informed neural networks: A deep learning framework for solving forward and inverse problems involving nonlinear partial differential equations. J. Comput. Phys. 2019, 378, 686–707. [Google Scholar] [CrossRef] [Scilit]
  29. Wang, H.; Tan, X.; Li, L.; Li, C.; Presas, A. Coordinated frequency regulation of fixed-variable speed pumped storage hybrid systems: An adaptive control framework integrating dynamic prediction and rolling optimization. Appl. Energy 2026, 408, 127375. [Google Scholar] [CrossRef] [Scilit]
  30. Hu, Z.; Cheng, Y.; Chen, H.; Liu, D.; Ji, B.; Wang, Z.; Zhang, P.; Xue, S. Predicting pump-turbine characteristic curves by theoretical models based on runner geometry parameters. Energy 2024, 301, 131561. [Google Scholar] [CrossRef] [Scilit]
  31. Laban, D.; Norrlund, P.; Lundin, U. Storage system design for improved primary frequency control from hydropower units. IEEE Trans. Energy Convers. 2023, 38, 1836–1844. [Google Scholar] [CrossRef] [Scilit]
  32. Lu, M.; Liu, X.; Xu, G.; Tian, Y. Optimal pump-valve coupling operation strategy of complex long-distance water-conveyance systems based on MOC. Ain Shams Eng. J. 2024, 15, 102318. [Google Scholar] [CrossRef] [Scilit]
  33. Yan, S.; Yin, X.; Zheng, Y. Nonlinear state-space modeling and optimal tracking control for pumped storage units. Appl. Energy 2024, 373, 123901. [Google Scholar] [CrossRef] [Scilit]
  34. Xu, B.; Luo, X.; Egusquiza, M.; Ye, W.; Liu, J.; Egusquiza, E.; Chen, D.; Guo, P. Nonlinear modal interaction analysis and vibration characteristics of a francis hydro-turbine generator unit. Renew. Energy 2021, 168, 854–864. [Google Scholar] [CrossRef] [Scilit]
  35. DL/T 1245-2024; Technical Guide for Hydraulic Turbine Governing System in Grid. China Electric Power Press: Beijing, China, 2024.
Figure 1. Conventional PID control block diagram.
Water 18 02028 g001
Figure 2. Electro-hydraulic servo system structure.
Water 18 02028 g002
Figure 3. Hydro-turbine full characteristic curves.
Water 18 02028 g003
Figure 4. Characteristic grid schematic.
Water 18 02028 g004
Figure 5. Power responses under opening mode under different heads at ±0.1 Hz disturbance and 50%Pr.
Water 18 02028 g005
Figure 6. Performance indices under opening mode under different heads at ±0.1 Hz disturbance and 50%Pr.
Water 18 02028 g006
Figure 7. Power responses under opening mode under different loads at ±0.1 Hz disturbance and 84.4 m.
Water 18 02028 g007
Figure 8. Performance indices under opening mode under different loads at ±0.1 Hz disturbance and 84.4 m.
Water 18 02028 g008
Figure 9. Power responses under opening mode under different frequency disturbances at 84.4 m head and 50%Pr.
Water 18 02028 g009
Figure 10. Performance indices under opening mode under different frequency deviations at 84.4 m head and 50%Pr.
Water 18 02028 g010
Figure 11. Feedforward control block diagram.
Water 18 02028 g011
Figure 12. Frequency regulation indices at different heads.
Water 18 02028 g012
Figure 13. Power response comparison between opening mode and feedforward strategy under different heads at ±0.1 Hz disturbance and 50%Pr.
Water 18 02028 g013
Figure 14. Assessment index comparison between opening mode and feedforward strategy under different heads at ±0.1 Hz disturbance and 50%Pr.
Water 18 02028 g014
Figure 15. Frequency regulation indices at different loads.
Water 18 02028 g015
Figure 16. Power response comparison between opening mode and feedforward strategy under different loads at ±0.1 Hz disturbance and 84.4 m.
Water 18 02028 g016
Figure 17. Assessment indices between opening mode and feedforward strategy under different loads at ±0.1 Hz disturbance and 84.4 m.
Water 18 02028 g017
Figure 18. Frequency regulation indices at different frequency deviations.
Water 18 02028 g018
Figure 19. Power response comparison between opening mode and feedforward strategy under different frequency disturbances at 84.4 m and 50%Pr.
Water 18 02028 g019
Figure 20. Assessment indices between opening mode and feedforward strategy under different frequency disturbances at 84.4 m and 50%Pr.
Water 18 02028 g020
Table 1. Simulation operating conditions at different heads.
Operating ConditionWater Head (m)Initial LoadFrequency Deviation (Hz)
Baseline condition84.450%Pr0.1
Compared conditions7050%Pr0.1
7550%Pr0.1
8050%Pr0.1
9050%Pr0.1
9550%Pr0.1
10050%Pr0.1
Table 2. Simulation operating conditions at different loads.
Operating ConditionWater Head (m)Initial LoadFrequency Deviation (Hz)
Baseline condition84.450%Pr0.1
Compared conditions84.410%Pr0.1
84.420%Pr0.1
84.430%Pr0.1
84.440%Pr0.1
84.460%Pr0.1
84.470%Pr0.1
84.480%Pr0.1
84.490%Pr0.1
Table 3. Simulation operating conditions at different frequency deviations.
Operating ConditionWater Head (m)Initial LoadFrequency Deviation (Hz)
Baseline condition84.450%Pr0.1
Compared conditions84.450%Pr0.05
84.450%Pr0.075
84.450%Pr0.125
84.450%Pr0.15
Disclaimer/Publisher’s Note: The statements, opinions and data contained in all publications are solely those of the individual author(s) and contributor(s) and not of MDPI and/or the editor(s). MDPI and/or the editor(s) disclaim responsibility for any injury to people or property resulting from any ideas, methods, instructions or products referred to in the content.